Embed Size (px)
Citation preview

Cardiovascular Pediatric Critical Illness and Injury

Derek S. Wheeler, Hector R. Wong, and Thomas P. Shanley (Eds.)
Cardiovascular Pediatric Critical Illness and Injury
12 3

EditorsDerek S. Wheeler, MD Hector R. Wong, MDAssistant Professor of Clinical Pediatrics Professor of PediatricsUniversity of Cincinnati College of Medicine University of Cincinnati College of MedicineDivision of Critical Care Medicine Director, Division of Critical Care MedicineCincinnati Children’s Hospital Medical Center Cincinnati Children’s Hospital Medical CenterCincinnati, OH, USA Cincinnati, OH, USA
Thomas P. Shanley, MDFerrantino Professor of Pediatrics and
Communicable DiseasesUniversity of Michigan Medical CenterDirector, Division of Critical Care MedicineC.S. Mott Children’s HospitalAnn Arbor, MI, USA
ISBN 978-1-84800-922-6 e-ISBN 978-1-84800-923-3DOI 10.1007/978-1-84800-923-3
British Library Cataloguing in Publication DataA catalogue record for this book is available from the British Library
Library of Congress Control Number: 2008940281
© Springer-Verlag London Limited 2009First published in 2007 as part of Pediatric Critical Care Medicine, edited by Derek S. Wheeler, Hector R. Wong, and Thomas P. Shanley, ISBN 978-1-84628-463-2Apart from any fair dealing for the purposes of research or private study, or criticism or review, as permit-ted under the Copyright, Designs and Patents Act 1988, this publication may only be reproduced, stored or transmitted, in any form or by any means, with the prior permission in writing of the publishers, or in the case of reprographic reproduction in accordance with the terms of licenses issued by the Copyright Licensing Agency. Enquiries concerning reproduction outside those terms should be sent to the publishers.The use of registered names, trademarks, etc., in this publication does not imply, even in the absence of a specifi c statement, that such names are exempt from the relevant laws and regulations and therefore free for general use.Product liability: The publisher can give no guarantee for information about drug dosage and application thereof contained in this book. In every individual case the respective user must check its accuracy by consulting other pharmaceutical literature.
Printed on acid-free paper
Springer Science+Business Mediaspringer.com
v
Preface
The development of pediatric cardiac surgical programs has had a profound effect on the spe-cialty of pediatric critical care medicine, and as a result, the fi eld of pediatric cardiac intensive care is rapidly emerging as a separate subspecialty of pediatric critical care medicine. The ability to provide care for the critically ill child with congenital heart disease clearly separates pediatric intensivists from our adult colleagues. A thorough understanding and knowledge of the unique physiology of the child with congenital heart disease are therefore absolutely crucial for anyone working in the pediatric intensive care unit. Once again, we would like to dedicate this textbook to our families and to the physicians and nurses who provide steadfast care every day in pedi-atric intensive care units across the globe.
Derek S. WheelerHector R. WongThomas P. Shanley
vii
Preface to Pediatric Critical Care Medicine: Basic Science and Clinical Evidence
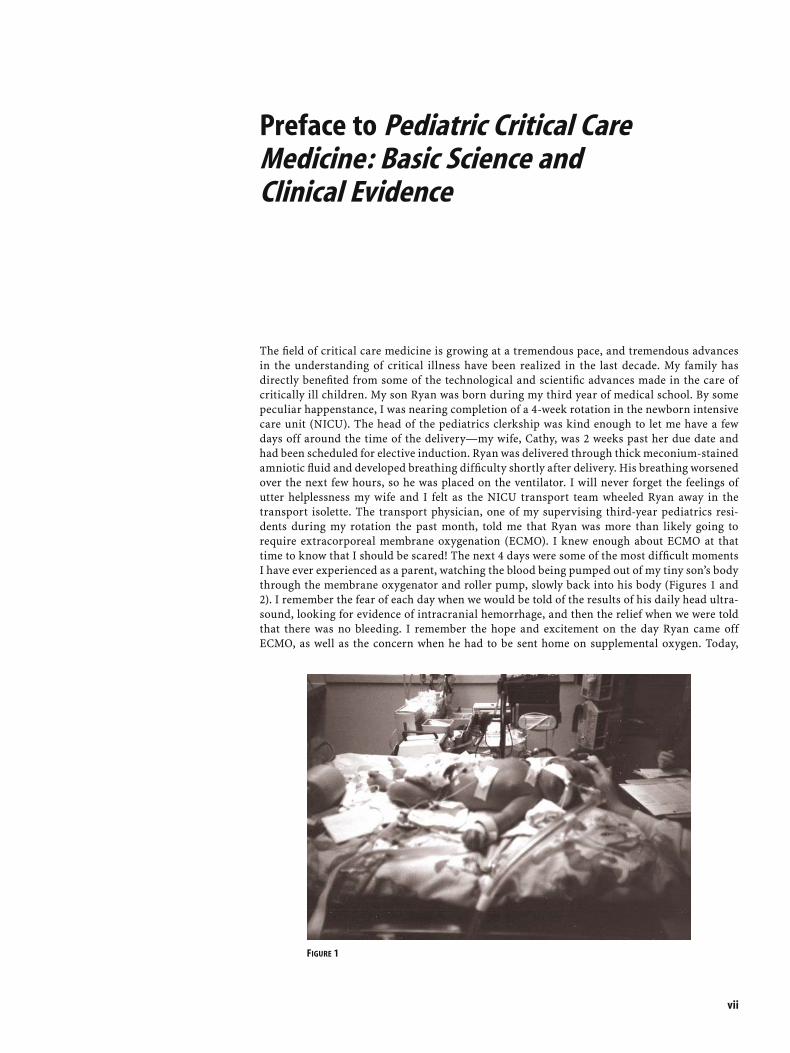
The fi eld of critical care medicine is growing at a tremendous pace, and tremendous advances in the understanding of critical illness have been realized in the last decade. My family has directly benefi ted from some of the technological and scientifi c advances made in the care of critically ill children. My son Ryan was born during my third year of medical school. By some peculiar happenstance, I was nearing completion of a 4-week rotation in the newborn intensive care unit (NICU). The head of the pediatrics clerkship was kind enough to let me have a few days off around the time of the delivery—my wife, Cathy, was 2 weeks past her due date and had been scheduled for elective induction. Ryan was delivered through thick meconium-stained amniotic fl uid and developed breathing diffi culty shortly after delivery. His breathing worsened over the next few hours, so he was placed on the ventilator. I will never forget the feelings of utter helplessness my wife and I felt as the NICU transport team wheeled Ryan away in the transport isolette. The transport physician, one of my supervising third-year pediatrics resi-dents during my rotation the past month, told me that Ryan was more than likely going to require extracorporeal membrane oxygenation (ECMO). I knew enough about ECMO at that time to know that I should be scared! The next 4 days were some of the most diffi cult moments I have ever experienced as a parent, watching the blood being pumped out of my tiny son’s body through the membrane oxygenator and roller pump, slowly back into his body (Figures 1 and 2). I remember the fear of each day when we would be told of the results of his daily head ultra-sound, looking for evidence of intracranial hemorrhage, and then the relief when we were told that there was no bleeding. I remember the hope and excitement on the day Ryan came off ECMO, as well as the concern when he had to be sent home on supplemental oxygen. Today,
FIGURE 1

Ryan is happy, healthy, and strong. We are thankful to all the doctors, nurses, respiratory therapists, and ECMO specialists who cared for Ryan and made him well. We still keep in touch with many of them. Without the technological advances and medical breakthroughs made in the fi elds of neonatal intensive care and pediatric critical care medicine, things very well could have been much different. I made a promise to myself long ago that I would dedicate the rest of my professional career to advancing the fi eld of pediatric critical care medicine as payment for the gifts with which we, my wife and I, have been truly blessed. It is my sincere hope that this textbook, which has truly been a labor of joy, will educate a whole new generation of critical care professionals and in so doing help make that fi rst step toward keeping my promise.
Derek S. Wheeler
viii Preface to Pediatric Critical Care Medicine: Basic Science and Clinical Evidence
FIGURE 2

ix
Contents
Preface . . . . . . . . . . . . . . . . . . . . . . . . . . . . . . . . . . . . . . . . . . . . . . . . . . . . . . . . . . . . . . . . . . . . . . . . . . . vPreface to Pediatric Critical Care Medicine: Basic Science and Clinical Evidence. . . . . . . . . viiContributors. . . . . . . . . . . . . . . . . . . . . . . . . . . . . . . . . . . . . . . . . . . . . . . . . . . . . . . . . . . . . . . . . . . . . . xi
1 Developmental Cardiac Physiology . . . . . . . . . . . . . . . . . . . . . . . . . . . . . . . . . . . . . . . . . . . . . 1 Keith C. Kocis, Ana Lia Graciano, and Jon N. Meliones
2 Hemodynamic Monitoring. . . . . . . . . . . . . . . . . . . . . . . . . . . . . . . . . . . . . . . . . . . . . . . . . . . . . 13 Shane M. Tibby
3 Cardiopulmonary Interactions . . . . . . . . . . . . . . . . . . . . . . . . . . . . . . . . . . . . . . . . . . . . . . . . . 33 Desmond J. Bohn
4 Echocardiography in the Pediatric Critical Care Setting . . . . . . . . . . . . . . . . . . . . . . . . . . 55 William L. Border, Erik C. Michelfelder, Kan Hor, and Dianna S. Meredith
5 Cardiac Catheterization in the Pediatric Critical Care Setting . . . . . . . . . . . . . . . . . . . . . 63 Russell Hirsch and Robert H. Beekman III
6 Introduction to Congenital Heart Disease: Nomenclature and Classifi cation . . . . . . . . 77 James D. St. Louis
7 Palliative Procedures. . . . . . . . . . . . . . . . . . . . . . . . . . . . . . . . . . . . . . . . . . . . . . . . . . . . . . . . . . 81 Mark A. Scheurer and Andrew M. Atz
8 Congenital Heart Disease: Left-to-Right Shunt Lesions. . . . . . . . . . . . . . . . . . . . . . . . . . . . 85 Derek S. Wheeler, James D. St. Louis, and Catherine L. Dent
9 Congenital Heart Disease: Cyanotic Lesions with Decreased Pulmonary Blood Flow . . . . . . . . . . . . . . . . . . . . . . . . . . . . . . . . . . . . . . . . . . . . . . 93 John M. Costello and Peter C. Laussen
10 Congenital Heart Disease: Left Ventricular Outfl ow Tract Obstruction . . . . . . . . . . . . . 107 John R. Charpie, Dennis C. Crowley, and Joseph N. Graziano
11 Congenital Heart Disease: Cyanotic Lesions with Increased Pulmonary Blood Flow . . . . . . . . . . . . . . . . . . . . . . . . . . . . . . . . . . . . . . . . . . . . . . . . . . . . . . . . 115 Peter B. Manning and James D. St. Louis
12 Single-Ventricle Lesions . . . . . . . . . . . . . . . . . . . . . . . . . . . . . . . . . . . . . . . . . . . . . . . . . . . . . . . 121 Steven M. Schwartz, David P. Nelson, Catherine L. Dent, Ndidi L. Musa, and Derek S. Wheeler
13 Vascular Rings and Associated Malformations . . . . . . . . . . . . . . . . . . . . . . . . . . . . . . . . . . . 131 Carl L. Backer, Constantine Mavroudis, and Lauren D. Holinger
14 Cardiopulmonary Bypass . . . . . . . . . . . . . . . . . . . . . . . . . . . . . . . . . . . . . . . . . . . . . . . . . . . . . . 143 Kelly M. McLean, John P. Lombardi, and Jeffrey M. Pearl
15 Pediatric Myocardial Protection . . . . . . . . . . . . . . . . . . . . . . . . . . . . . . . . . . . . . . . . . . . . . . . . 159 Jeffrey M. Pearl, Jodie Y. Duffy, and Kelly M. McLean
16 Postoperative Care of the Pediatric Cardiac Surgical Patient . . . . . . . . . . . . . . . . . . . . . . . 169 Catherine L. Dent and Steven M. Schwartz

17 Mechanical Support of the Cardiovascular System: Extracorporeal Life Support/Extracorporeal Membrane Oxygenation and Ventricular Assist Devices . . . . . . . . . . . . . . . . . . . . . . . . . . . . . . . . . . . . . . . . . . . . . . . . . 183 Heidi J. Dalton and Brian W. Duncan
18 Mechanical Support of the Cardiovascular System: Intraaortic Balloon Pumping in Children. . . . . . . . . . . . . . . . . . . . . . . . . . . . . . . . . . . . . . . . . . . . . . . . . . . . . . . . . . 195 L. LuAnn Minich and John A. Hawkins
19 Arrhythmias . . . . . . . . . . . . . . . . . . . . . . . . . . . . . . . . . . . . . . . . . . . . . . . . . . . . . . . . . . . . . . . . . 203 Timothy K. Knilans
20 Infl ammatory Diseases of the Heart and Pericardium: Infective Endocarditis and Kawasaki Disease . . . . . . . . . . . . . . . . . . . . . . . . . . . . . . . . . . . . . . . . . . . . . . . . . . . . . . . . . 217 Michael H. Gewitz and Gary M. Satou
21 Infl ammatory Diseases of the Heart and Pericardium: Dilated Cardiomyopathy and Myocarditis . . . . . . . . . . . . . . . . . . . . . . . . . . . . . . . . . . . . . . . . . . . . . . . . . . . . . . . . . . . . . . 227 Henry B. Wiles, Neil W. Kooy, and Derek S. Wheeler
22 Diseases of the Pericardium. . . . . . . . . . . . . . . . . . . . . . . . . . . . . . . . . . . . . . . . . . . . . . . . . . . . 241 Michael H. Gewitz, Gary M. Satou, and Derek S. Wheeler
23 Management of Hypertension in the Pediatric Intensive Care Unit . . . . . . . . . . . . . . . . . 249 Marianne N. Majdalani and Neil W. Kooy
24 Heart Transplantation. . . . . . . . . . . . . . . . . . . . . . . . . . . . . . . . . . . . . . . . . . . . . . . . . . . . . . . . . 263 Shamel Abd-Allah and Paul A. Checchia
Index . . . . . . . . . . . . . . . . . . . . . . . . . . . . . . . . . . . . . . . . . . . . . . . . . . . . . . . . . . . . . . . . . . . . . . . . . . . . 285
x Contents

xi
Contributors
Shamel Abd-Allah, MDAssociate Professor of PediatricsLoma Linda University School of MedicineDirector, Division of Critical Care MedicineLoma Linda University Children’s HospitalLoma Linda, CA, USA
Andrew M. Atz, MDAssociate Professor of PediatricsMedical University of South CarolinaDirector, Pediatric Cardiac Intensive CareMUSC Children’s HospitalCharleston, SC, USA
Carl L. Backer, MDProfessor of SurgeryNorthwestern University Feinberg School of
MedicineA.C. Buehler Professor of SurgeryChildren’s Memorial HospitalChicago, IL, USA
Robert H. Beekman III, MDProfessor of PediatricsUniversity of Cincinnati College of MedicineSamuel Kaplan Chair of Pediatric CardiologyCincinnati Children’s Hospital Medical
CenterCincinnati, OH, USA
Desmond J. Bohn, MB, BCh, MRCP, FRCPCProfessor of Anaesthesia and PaediatricsUniversity of Toronto School of MedicineChief, Department of Critical Care MedicineThe Hospital for Sick ChildrenToronto, Ontario, Canada
William L. Border, MBChBAssistant Professor of Clinical PediatricsUniversity of Cincinnati College of MedicineDivision of CardiologyCincinnati Children’s Hospital Medical CenterCincinnati, OH, USA
John R. Charpie, MD, PhDClinical Associate Professor of Pediatrics and
Communicable DiseasesUniversity of Michigan
Associate Director, Pediatric Cardiothoracic Intensive Care Unit
University of Michigan Congenital Heart Center
C.S. Mott Children’s HospitalAnn Arbor, MI, USA
Paul A. Checchia, MDAssistant Professor of Critical Care and
CardiologyWashington University School of MedicineDirector, Pediatric Cardiac Intensive Care
ProgramCo-Director, Pediatric Intensive Care UnitSt. Louis Children’s HospitalSt. Louis, MO, USA
John M. Costello, MDClinical Instructor in PediatricsHarvard Medical SchoolDepartment of CardiologyChildren’s Hospital BostonBoston, MA, USA
Dennis C. Crowley, MDClinical Professor of Pediatrics and
Communicable DiseasesUniversity of Michigan Medical CenterCo-Director, Pediatric Heart Transplant
ProgramMichigan Congenital Heart Disease CenterDivision of CardiologyC.S. Mott Children’s HospitalAnn Arbor, MI, USA
Heidi J. Dalton, MD, FCCMProfessor of PediatricsGeorge Washington UniversityDepartment of Critical Care Medicine and
AnesthesiologyDirector, PICU and Pediatric ECMOChildren’s National Medical CenterWashington, DC, USA
Catherine L. Dent, MDAssistant Professor of PediatricsUniversity of Cincinnati College of MedicineDirector, Cardiac Intensive Care Unit

Division of CardiologyCincinnati Children’s Hospital Medical
CenterCincinnati, OH, USA
Jodie Y. Duffy, PhDAssistant Professor of Pediatrics and SurgeryUniversity of Cincinnati College of MedicineCo-Director, Cardiothoracic Surgery
Research LaboratoryChildren’s Hospital Research FoundationCincinnati Children’s Hospital Medical
CenterCincinnati, OH, USA
Brian W. Duncan, MDSurgical DirectorPediatric Cardiac Failure and
Heart TransplantPediatric and Congenital Heart SurgeryThe Children’s HospitalThe Cleveland ClinicCleveland, OH, USA
Michael H. Gewitz, MDProfessor and Vice Chair of PediatricsNew York Medical CollegePhysician-in-Chief and Director,
Pediatric CardiologyMaria Fareri Children’s Hospital at
Westchester Medical CenterValhalla, NY, USA
Ana Lia Graciano, MDAssistant Professor of PediatricsUniversity of California, San FranciscoDivision of Critical Care MedicineChildren’s Hospital of Central CaliforniaFresno, CA, USA
Joseph N. Graziano, MDClinical Instructor of Pediatrics and
Communicable DiseasesUniversity of Michigan Medical CenterMichigan Congenital Heart Disease CenterDivision of CardiologyC.S. Mott Children’s HospitalAnn Arbor, MI, USA
John A. Hawkins, MDAssociate Professor of SurgeryUniversity of Utah Medical CenterDivision of Cardiothoracic SurgeryPrimary Children’s Medical CenterSalt Lake City, UT, USA
Russell Hirsch, MDAssistant Professor of PediatricsUniversity of Cincinnati College of MedicineDirector, Cardiac Catheterization LaboratoryDivision of CardiologyCincinnati Children’s Hospital Medical
CenterCincinnati, OH, USA
Lauren D. Holinger, MDPaul H. Holinger Professor of
Otolaryngology-Head and Neck Surgery
Northwestern University Feinberg School of Medicine
Head, Pediatric OtolaryngologyChildren’s Memorial HospitalChicago, IL, USA
Kan Hor, MDDivision of CardiologyCincinnati Children’s Hospital Medical
CenterCincinnati, OH, USA
Timothy K. Knilans, MDAssociate Professor of Clinical PediatricsUniversity of Cincinnati College of MedicineDirector, Clinical Cardiac Electrophysiology
and PacingCincinnati Children’s Hospital Medical
CenterCincinnati, OH, USA
Keith C. Kocis, MD, MSProfessor of PediatricsThe University of North Carolina at
Chapel HillChief, Pediatric Critical Care MedicineNorth Carolina Children’s HospitalChapel Hill, NC, USA
Neil W. Kooy, MDAssociate Professor of PediatricsUniversity of Cincinnati College of MedicineDirector, Fellowship Training ProgramDivision of Critical Care MedicineCincinnati Children’s Hospital Medical
CenterCincinnati, OH, USA
Peter C. Laussen, MBBSAssociate Professor of AnesthesiaHarvard Medical SchoolD.D. Hansen Professor of
Pediatric AnesthesiaDirector, Cardiac Intensive Care UnitDepartment of CardiologyChildren’s Hospital BostonBoston, MA, USA
John P. Lombardi, CCPPerfusionist, Division of Cardiothoracic
SurgeryCincinnati Children’s Hospital Medical
Center Cincinnati, OH, USA
Marianne N. Majdalani, MDAssistant Professor of PediatricsDivision of Critical Care MedicineAmerican University of BeirutBeirut, Lebanon
Peter B. Manning, MDProfessor of Surgery and PediatricsUniversity of Cincinnati College of MedicineCo-Director, The Heart CenterDirector, Division of Cardiothoracic SurgeryCincinnati Children’s Hospital Medical CenterCincinnati, OH, USA
xii Contributors

Constantine Mavroudis, MDProfessor of SurgeryNorthwestern University Feinberg School of
MedicineWillis J. Potts Professor of SurgerySurgeon-in-ChiefChildren’s Memorial HospitalChicago, IL, USA
Kelly M. McLean, MDResearch FellowDivision of Cardiothoracic SurgeryDepartment of SurgeryUniversity of Cincinnati College of
MedicineCincinnati, OH, USA
Jon N. Meliones, MD, MSProfessor of PediatricsDuke UniversityDurham, NC, USA
Dianna S. Meredith, RDCSThe Heart CenterCincinnati Children’s Hospital
Medical CenterCincinnati, OH, USA
Erik C. Michelfelder, MDAssociate Professor of PediatricsUniversity of Cincinnati College of
MedicineDirector, Fetal Cardiac CenterDivision of CardiologyCincinnati Children’s Hospital
Medical CenterCincinnati, OH, USA
L. LuAnn Minich, MDProfessor of PediatricsUniversity of Utah Medical CenterDivision of Pediatric CardiologyPrimary Children’s Medical CenterSalt Lake City, UT, USA
Ndidi L. Musa, MDAssistant Professor of PediatricsMedical College of Wisconsin Division of Critical Care MedicineChildren’s Hospital of WisconsinMilwaukee, WI, USA
David P. Nelson, MD, PhDAssociate Professor of PediatricsBaylor College of MedicineDirector, Cardiovascular
Intensive CareDivision of Pediatric CardiologyTexas Children’s HospitalHouston, TX, USA
Jeffrey M. Pearl, MDAssociate Professor of SurgeryUniversity of Cincinnati College of MedicineSurgical Director, Pediatric Heart Transplant
ProgramDivision of Cardiothoracic SurgeryCincinnati Children’s Hospital Medical
CenterCincinnati, OH, USA
Gary M. Satou, MDAssistant Professor of PediatricsNew York Medical CollegeSection of Pediatric CardiologyChildren’s Hospital of Westchester Medical
CenterValhalla, NY, USA
Mark A. Scheurer, MDDivision of Pediatric CardiologyMedical University of South CarolinaMUSC Children’s HospitalCharleston, SC, USA
Steven M. Schwartz, MDAssociate Professor of Anaesthesia and
PaediatricsUniversity of Toronto School of MedicineDirector, Cardiac Intensive Care UnitDepartment of Critical Care MedicineThe Hospital for Sick ChildrenToronto, Ontario, Canada
James D. St. Louis, MD, PhDAssistant Professor of SurgeryMedical College of GeorgiaDirector, Pediatric Cardiothoracic SurgeryMCG Children’s Medical CenterAugusta, GA, USA
Shane M. Tibby, MRCPPediatric Intensive Care UnitEvelina Children’s HospitalGuy’s and St. Thomas’ NHS Hospital TrustLondon, UK
Derek S. Wheeler, MDAssistant Professor of Clinical PediatricsUniversity of Cincinnati College of MedicineDivision of Critical Care MedicineCincinnati Children’s Hospital Medical
CenterCincinnati, OH, USA
Henry B. Wiles, MDProfessor of PediatricsMedical College of GeorgiaChief, Section of CardiologyMCG Children’s Medical CenterAugusta, GA, USA
Contributors xiii
1Developmental Cardiac PhysiologyKeith C. Kocis, Ana Lia Graciano, and Jon N. Meliones
these complex sequence of events results in the vast majority of congenital cardiac defects.
Cardiomyocytes
Cardiomyocytes differ signifi cantly from striated muscle types in several specifi c ways [3,4]. Cardiomyocytes are elongated special-ized striated muscle cells, 100–150 μm in length × 20–35 μm in width. These cells branch because of differing lengths of the indi-vidual myofi brils (see later), which are made up of the contractile proteins actin and myosin and the regulatory proteins (troponin and tropomyosin). Individual myofi brils are structurally bound within the cell by a network of desmin fi laments, which are linked to the inner wall of the cell membrane at the costamere. The ends of individual cells communicate with each other through the inter-calated disc, which is made up of three specialized areas: (1) fascia adherens, (2) desmosome, and (3) gap junction [5,6]. These struc-tures allow for electromechanical synchrony and complex cell sig-naling between the individual cells.
Cardiomyocytes are able to spontaneously depolarize and conduct electrical impulses from cell to cell over a long duration in order to coordinate contraction within and between the different chambers (i.e., left ventricle) of the heart in an effi cient manner. These cells begin to acquire spontaneous and coordinated contrac-tion at a very early stage in cardiac development. No neural inner-vation is required for the heart to contract (i.e., denervated organs after cardiac transplantation). Apart from the working myocardial cells, specialized cardiac conduction cells containing few contractile elements that stain for glycogen compose the cells of the sinoatrial node (pacemaker), atrioventricular node, and Pur-kinje cells [3,7,8].
Spontaneous depolarization (Figure 1.2) occurs during phase 4 (diastolic depolarization) as L-type (long-lasting) calcium chan-nels allow infl ux of this essential cation until reaching a threshold voltage, which results in phase 0 depolarization (or systole). Phase 1 occurs as the voltage within the cell becomes positive (overshoot) and is followed by phase 2 or the plateau phase, where voltage remains slightly less than 0. There is then progressive return to resting maximal negative potential during phase 3. During specifi c time periods within phase 3 are the absolute refractory (AF) and the relative refractory (RR) periods, whereby depolarization cannot (AF) and can occur only with supramaximal stimulation (RR).
A Primer on Cardiac Embryology . . . . . . . . . . . . . . . . . . . . . . . . . . . 1Cardiomyocytes . . . . . . . . . . . . . . . . . . . . . . . . . . . . . . . . . . . . . . . . . . . 1Autonomic Innervation of the Heart . . . . . . . . . . . . . . . . . . . . . . . . . 5Transition from Fetus to Neonate . . . . . . . . . . . . . . . . . . . . . . . . . . . 7Conclusion . . . . . . . . . . . . . . . . . . . . . . . . . . . . . . . . . . . . . . . . . . . . . . . . 9
A Primer on Cardiac Embryology
During the third week of gestation, the forming embryo divides into the three primary germ layers, of which the mesodermal cells will form the heart and blood vessels [1,2]. The angiogenic clusters form anterior to the neural plate in a horseshoe shape, while the primitive streak is forming and migrating posteriorly. As the brain quickly enlarges, it ventrally and caudally moves these cells that have now formed a tube. These structures fi nally merge in the midline, forming the primitive heart tube. The heart tube from caudal to cranial has fi ve parts, which will later form all aspects of the normal cardiac anatomy (Figure 1.1). These structures are the (1) sinus venosus; (2) atrium; (3) ventricle; (4) bulbus cordis divided into (a) proximal conus cordis and (b) distal truncus arteriosus and; and (5) aortic sac. The sinus venosus forms the superior and inferior vena cavae. The primitive atrium and ventricle divide into right and left portions, with distinct structural features attribut-able to each unique chamber. The two atrioventricular valves (tri-cuspid and mitral valves) form from the endocardial cushions, which also form the primum atrial septum and the inlet portion of the ventricles. The bulbus cordis gives rise to the right ventricular outfl ow track defi ned at its origin by the septal and parietal muscle bundles. The truncus arteriosus forms both semilunar valves and the proximal ascending aorta and pulmonary trunk. The aortic sac will form the bulk of the ascending aorta, while the third and fourth aortic arches form the carotid arteries and transverse aorta. Finally, the sixth arch forms the ductus arteriosus and junction of the pulmonary arteries.
The primitive heart tube is fi xed at either end, the aortic sac (cranial) and the sinus venosus (caudal) within the pericardial sac. As the other cardiac structures grow, the heart must rotate and bend in an important set of events, called cardiac looping. Normally the tube rotates to the right (dexter or D-loop), placing the struc-tural right ventricle anterior and to the right, while the structural left ventricle is rotated leftward and posterior. Abnormalities in
1D.S. Wheeler et al. (eds.), Cardiovascular Pediatric Critical Illness and Injury,DOI 10.1007/978-1-84800-923-3_1, © Springer-Verlag London Limited 2009

2 K.C. Kocis, A.L. Graciano, and J.N. Meliones
Finally, onset of phase 4 begins when there is a fairly stable maxi-mally negative potential within the cardiomyocyte. Pacemaker cells have more phase 4 depolarization occurring and thus are ready to reenter phase 1 again for the next cardiac contraction.
The basic unit of contraction is the sarcomere (Figure 1.3) [9–19]. It contains the contractile proteins actin and myosin with the regulatory proteins α-tropomyosin binding troponins T, I, and C [19–23]. The thin fi laments (F [fi lamentous] form) contain two strands of α-actin-cardiac composed of multiple monomers spi-raled in a helix with α-tropomyosin entwined between the two
strands. The double-stranded α-tropomyosin binds the troponin complex, made up three individual proteins, I, T, and C [22,24,25]. Tropomyosin also blocks actin myosin cross-bridging, which is necessary for ATPase activity to take place. Troponin I inhibits the interaction between the myosin head in the thick fi lament and actin. Troponin T is responsible for binding the tropomyosin chain to actin, adding to the structural integrity of the thin fi lament. Finally, troponin C contains four binding sites for calcium (although at basal state only one site is usually bound) [24,25], which results in movement of the troponin I protein so that it is no longer able to inhibit actin and myosin cross-bridges from forming. The thick fi lament is composed of the contractile protein myosin, which is made up of six protein chains, two heavy and four light [8–12,14–18,26,27]. Each myosin heavy chain is associated with two distinct myosin light chains, one essential (LC1) and one regulatory (LC2). The heavy chains form the rod and head of the myosin fi lament, while the four light chains are found in the head alone. The head of the myosin chain is the portion that after binding with the thin fi lament can enzymatically cleave adenosine triphosphate (ATP) into adenosine diphosphate (ADP) and phosphoinositide (Pi).
Spatially, each thick fi lament interacts with six thin fi laments, allowing for the cross bridges to occur and the power stroke to shorten the sarcomere [18]. The sarcomere extends from one z line to the next, with the thin fi laments attached at the z line [3]. The A (anisotropic) band spans the length of the thick fi lament, while the I (isotropic) band is composed of thin fi laments alone. Actin and myosin are overlapping in most of the region of the A band, although the central portion, referred to as the H zone, contains only thick fi laments. The M line is the middle of the thick fi lament. When contraction begins, there is movement of actin and myosin and more cross-bridges occur so that the I zone becomes smaller. The sarcomere cannot shorten to less than the length of the A band.
Developmentally, there are signifi cant changes in the contractile proteins in the heart that occur during the transition from fetal to neonatal to adult life stages [5,10,12,26–31]. α-Actin-cardiac exists throughout fetal and adult life in one fi lamentous form made of
Aortic roots
Pericardium
Pericardial cavityLeft
atrium
Bulboventricularsulcus
Bulbis cordis
Ventricle
Atrium
Sinus venosus
Sinusvenosus
B CA
FIGURE 1.1. Primitive heart tube is shown with the five embryologic structures that will form all future cardiac anatomy. From caudal to cranial these structures are the (1) sinus venosus; (2) atrium; (3) ventricle; (4) bulbus cordis divided into a proximal (a) conus cordis
Phase 1
Phase 2
Phase 3
ARP
RRP
Phase 0
Phase 4
0
–50
–100
Tran
smem
bran
e po
tent
ial (
mV)
Absolute refractory period (ARP)Relative refractory period (RRP)
FIGURE 1.2. Phases of cardiomyocyte action potential. Diastolic depolarization occurs during phase 4 until threshold is met, initiating phase 0 depolarization (systole). Phase 1 follows as an overshoot of the voltage within, followed by phase 2 or the plateau phase when voltage remains slightly less than 0. Phase 3 begins the return to resting maximal negative potential (−90 mV). During specific time periods within phase 3 are the absolute refractory period (AFP) and relative refractory period (RRP). Finally, onset of phase 4 begins, when there is maximally negative potential within the cardiomyocyte.
and distal (b) truncus arteriosus; and (5) aortic sac. The progression from panels A-C illus-trate the normal looping in which the heart tube rotates to the right to form the normal heart structures.

1. Developmental Cardiac Physiology 3
globular protein monomers. Tropomyosin exists in the human heart during fetal, neonatal, and adult life as the homodimer (α,α). Troponin has three different proteins expressed in a developmen-tally regulated manner [31–37]. In the human heart there are four isoforms of troponin T (TnT1 through TnT4). TnT1 and TnT2 are the two isoforms present in the fetal heart, whereas TnT3 is found in the adult heart. Troponin I has 2 isoforms, a slow skeletal tropo-nin I (ssTnI) found in the fetus, neonate, and infants (<1 year of life) and the adult cardiac form (cTnI) expressed after birth through adulthood. These isoforms have signifi cantly different functional responses to calcium and pH. Troponin C exists as a single protein throughout gestation and postnatal life. Mutations in thin fi lament proteins (tropomyosin, actin, troponins I and T) have been identi-fi ed and are associated with familial hypertrophic and restrictive cardiomyopathies [19,23,31,38–40]. There exist three isoforms of the myosin heavy chain protein, V1 to V3 [8–10,12,26,28,41,42]. V1 (the adult form), with the highest ATPase activity, is composed of two homodimer α strands of myosin heavy chain, whereas V3 (the fetal form) (∼50% less ATPase activity) is composed of two β-chains. V2, a heterodimer, is intermediate in function. The transi-tion from V3 to V1 occurs largely at birth with the large increase in thyroid hormone (T3) that occurs at that time [42–46]. Thyroid hormone plays a prominent role in transitioning several important cardiac proteins into their adult isoforms, which is discussed later. In the fetal ventricle, the myosin light chains undergo developmen-tal changes from a fetal form (ALC1 and ALC2) to the adult form (VLC1, VLC2) [15]. The presence of the atrial isoform (ALC) in the fetal ventricle is quite intriguing. As a side note, there can be a reversion back to the fetal isoforms in the diseased adult ventricle (e.g., aortic stenosis) [15].
Actin–Myosin Interactions During the Power Stroke
Having described the contractile proteins, it is next necessary to discuss their interaction through one contractile cycle (Figure 1.4) [19,24,25,47]. Cardiomyocyte membrane depolarization causes an
infl ux of calcium through the sarcolemma and t tubules, which are intimately related to the ryanodine (RyR) receptor in the junctional sarcoplasmic reticulum (SR) [48–55]. This calcium-initiated calcium release (CICR) results in a rapid release of calcium into the cytosol. This cytosolic calcium binds to troponin C, which results in conformational changes in troponin I, releasing it from actin binding sites while also moving tropomyosin, thereby promoting cross-bridge formation to occur between actin and myosin. Energy previously stored in myosin from ATP hydrolysis now powers the movement of the myosin head at the hinge point, allowing for shortening of the sarcomere (movement of the z lines toward one another). Adenosine diphosphate and Pi are now released, and a new molecule of ATP is bound to myosin head before the actin–myosin cross-bridges are broken and then hydrolyzed. The energy from this reaction is stored in conformational changes in the myosin head for later use in the power stroke. Calcium is removed from troponin C back into the longitudinal SR. This moves tropo-myosin and troponin I back into blocking positions, and actin and myosin now become disengaged. The cycle then repeats itself.
Developmental Changes in the Structure of the Heart
Developmentally, in the fetal heart there is a decrease in ratio of contractile elements to collagen, extracellular matrix, and vascular elements. In the fetal cardiomyocyte only 30% of the volume is composed of myofi brils, whereas this increases to 60% in the adult [56,57]. In addition, the structural organization of the mitochon-dria to the myofi brils is quite different [58]. In the adult, these structures are compacted and intimately related to the sarcomere. These anatomic variations place the fetal and neonatal heart at a distinct disadvantage to generating force per cell. This also relates to the noncompliance of the immature heart, which is not alterable with current therapies [59–61]. This is different from the abnor-malities in diastolic relaxation present in the fetus, neonate, and a variety of diseased cardiac states, which is related to the SR and ATP-dependent calcium reuptake (see later) [59–62].
Sarcomere-basic unit of contraction
(a)
(c)
(e)
(d)
(b)
(f)
A M
Troponin
Actin
Tropomyosin
Thick filamentsMyosin 2 heavy chains (rod & head) 4 light chains (head)
Thin filaments actin double strandeda Tropomyosin troponin (T, I, C)
Head
I band
Z disc Z disc
Sarcolemma
Triad
Mitochondria
Tubules of sarcoplasmicreticulum
T tubule
Terminal cisternaof the sarcoplasmicreticulum
Myofibrils
H zone
Mline
A band I band
Rod
MHC MLC
I Z
Myosin
FIGURE 1.3. Anatomy of the sarcomere, the basic unit of contraction (see text for full explanation).

4 K.C. Kocis, A.L. Graciano, and J.N. Meliones
Calcium Regulation in the Cardiomyocyte
Critical to excitation and contraction is the entry of calcium into the cardiomyocyte from across the sarcolemma, and its deep invag-inations called the transverse (t) tubules and then cytosolic release from the SR (see Figure 1.3) [48–55]. The sarcolemma has several types of calcium channels connecting extracellular calcium to the intracellular environment, although this predominantly occurs through the L (long-lasting) channels [48–55]. These voltage-gated L channels are also referred to as the dihydropyridine (DHP) chan-nels because of their binding of these calcium blocking agents. These receptors are the same in both neonates and adults. The t tubule system is an extension of the cell membrane deep into the cell and, along with the terminal cisternae of the junctional SR, forms the triad. The t tubules are nearly absent in the fetus but develop invaginations into the cell at the level of the z lines in the fi rst week of postnatal life [48].
The SR is an intracellular organelle that appears as a network of channels that surround the myofi brils and is responsible for the release and reuptake of calcium necessary for contraction and relaxation [3]. There are two regions of the SR, the junctional SR and the longitudinal SR, which have distinctly different roles in calcium handling. The junctional SR located near the z lines con-tains the protein calsequestrin in terminal cisternae for calcium storage and rapid release during systole. Release is triggered by infl ux of calcium through the L-type calcium channels located on the sarcolemma and t tubules after membrane depolarization. This then triggers a calcium-induced calcium release (CICR) through the ryanodine receptor (RyR) located in the junctional SR. Ana-tomically, theses channels and the junctional SR are closely linked, and rapid calcium fl ow between these two receptors has been referred to as calcium sparks [49]. Another mechanism for this
rapid release of calcium after depolarization involves reverse trans-port through the sarcolemma sodium/calcium exchanger [51,52]. The longitudinal SR located around the M line is critical for calcium reuptake during diastole. This diastolic relaxation is an active process requiring ATP [60,61]. Abnormalities in this SR Ca2+/ATPase pump enzyme occurs in many diseased states (e.g., ven-tricular hypertrophy), resulting in abnormal relaxation during diastole that typically precedes abnormal diastolic function caused by decreased compliance (e.g., fi brosis) [60,61]. Phospholamban is another important regulatory protein that inhibits the Ca2+/ATPase pump and thus delays reuptake of calcium into longitudinal SR. Phosphorylation of phospholamban inhibits its function and thus increases calcium reuptake and diastolic relaxation [63].
Neonatal cardiomyocytes are much more dependent on extracel-lular calcium infl ux for contraction because of the immaturity of the SR [48]. In the fetus, there are fewer cisternae in the junctional SR, and the t tubules are absent, resulting in decreased contraction during systole. There is decreased Ca2+/ATPase in the longitudinal SR resulting in decreased relaxation during diastole.
Energy Metabolism in the Cardiomyocyte
Energy in the form of ATP derived from aerobic metabolism is necessary for the contraction and relaxation of the heart. This energy is derived from several sources (Figure 1.5), which are sig-nifi cantly different in the fetus, neonate, and adult [64–66]. The fetus uses carbohydrates in the form of lactate (60%), glucose (35%), and pyruvate (5%), whereas the adult heart consumes free fatty acids (90%) with little from carbohydrate and amino acids. At birth, a glucagon surge occurs that switches the utilization of energy substrates from carbohydrates to fatty acids. This occurs by
Inhibits intrinsicATPase activity
Binds calcium
Troponin T
Troponin C
Troponin I α-Tropomyosin
Thin filament
Thick filament
Myosinlight chain
Cardiac β-myosinheavy chain
Actin
Head
Rod
Binds to tropomyosin
Calcium bound to Tcallows actin/myosinxbridges
FIGURE 1.4. Magnified view of the actin myosin cross-bridges and proteins necessary for the power stroke (cardiac cycle).
1. Developmental Cardiac Physiology 5
for the sympathetic nerves, which synapse with longer postgangli-onic fi bers in the superior cervical, middle cervical, and inferior (stellate) ganglions before passing to the posterior part of the heart into the cardiac plexus innervating the SA node, AV node, and myocardium. The vagus nerve has a very long preganglionic fi ber with a short postganglionic fi ber. Visceral afferents run in both the sympathetic and parasympathetic nerves.
Adrenergic Receptor Physiology
There are numerous age-dependent changes in the autonomic responsiveness of ventricular myocardial or conducting tissue. Although some of these involve a simple quantitative difference in the magnitude or sensitivity of the response, in other cases a more complex qualitative alteration is observed. Receptors include a group of proteins responsible for the transduction of a signal from a circulating hormone, or neurotransmitter. Myocardial receptors include adrenergic and muscarinic cholinergic receptors.
All of the adrenergic receptors mediate their actions through interaction with a group of intracellular proteins called G proteins (Figure 1.6). G proteins are a large family of regulatory proteins whose activities are determined by their interaction with guanine nucleotides. G proteins cycle between an inactive guanosine diphosphate (GDP) bound form and an active guanosine triphos-phate (GTP) bound form. G proteins can be divided into two groups: (1) a heterotrimeric form consisting of three subunits, α, β, and γ, which are membrane bound and linked to G-protein–coupled receptors (GPCR); and (2) monomeric cytoplasmic G proteins, which are involved in the regulation of various intracellular pro-cesses. G-protein–coupled receptor structure consists of seven transmembrane domains linked by extracellular and intracellular loops, with an extracellular amino (N) terminus and an intracel-lular carboxy (C) terminus. The extracellular domains contribute
Promotes
Metabolism in cytosol Metabolism within mitochondria
Pyruvate + CoA-SH + NAD•
NADH2 + CO2 + acetyl-CoA Acetyl-CoAKetones
Krebscycle
FFA
CarmitineGlucose
2 Pyruvate
2 Lactate
Glycolysis
R-COOH + Acetyl CoA
R-CH2-C-S-CoA β-Oxidation
O
2-NAD2-NADH22-ADP2-ATP
2-NAD2-NADH2
NADNADH2
NADNADH2
NADNADH2
NADNADH2
FADFADH2
FADFADH2
Oxidative phosphorylation
Blocks
Glucagon
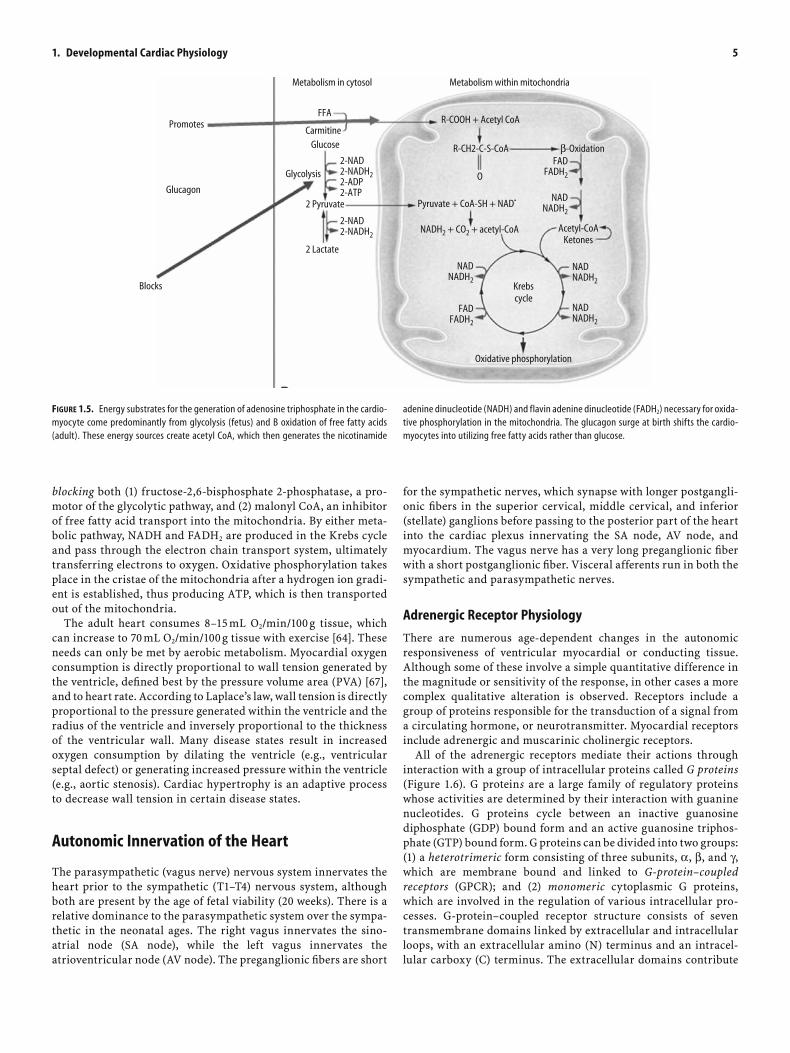
FIGURE 1.5. Energy substrates for the generation of adenosine triphosphate in the cardio-myocyte come predominantly from glycolysis (fetus) and B oxidation of free fatty acids (adult). These energy sources create acetyl CoA, which then generates the nicotinamide
adenine dinucleotide (NADH) and flavin adenine dinucleotide (FADH2) necessary for oxida-tive phosphorylation in the mitochondria. The glucagon surge at birth shifts the cardio-myocytes into utilizing free fatty acids rather than glucose.
blocking both (1) fructose-2,6-bisphosphate 2-phosphatase, a pro-motor of the glycolytic pathway, and (2) malonyl CoA, an inhibitor of free fatty acid transport into the mitochondria. By either meta-bolic pathway, NADH and FADH2 are produced in the Krebs cycle and pass through the electron chain transport system, ultimately transferring electrons to oxygen. Oxidative phosphorylation takes place in the cristae of the mitochondria after a hydrogen ion gradi-ent is established, thus producing ATP, which is then transported out of the mitochondria.
The adult heart consumes 8–15 mL O2/min/100 g tissue, which can increase to 70 mL O2/min/100 g tissue with exercise [64]. These needs can only be met by aerobic metabolism. Myocardial oxygen consumption is directly proportional to wall tension generated by the ventricle, defi ned best by the pressure volume area (PVA) [67], and to heart rate. According to Laplace’s law, wall tension is directly proportional to the pressure generated within the ventricle and the radius of the ventricle and inversely proportional to the thickness of the ventricular wall. Many disease states result in increased oxygen consumption by dilating the ventricle (e.g., ventricular septal defect) or generating increased pressure within the ventricle (e.g., aortic stenosis). Cardiac hypertrophy is an adaptive process to decrease wall tension in certain disease states.
Autonomic Innervation of the Heart
The parasympathetic (vagus nerve) nervous system innervates the heart prior to the sympathetic (T1–T4) nervous system, although both are present by the age of fetal viability (20 weeks). There is a relative dominance to the parasympathetic system over the sympa-thetic in the neonatal ages. The right vagus innervates the sino-atrial node (SA node), while the left vagus innervates the atrioventricular node (AV node). The preganglionic fi bers are short

6 K.C. Kocis, A.L. Graciano, and J.N. Meliones
to ligand recognition and binding, and secondary messenger cou-pling is determined mainly by interactions with intracellular domains [68].
G proteins can be divided into three main classes: Gs (stimula-tory), Gi (inhibitory), and Gq. Gs and Gi are coupled to the adenyl cyclase pathway, and Gq is coupled to phospholipase C. Gs stimu-lates adenyl cyclase to hydrolyze ATP to cyclic adenosine mono-phosphate (cAMP), the secondary messenger. The specifi c cellular response that follows the change in the concentration of cAMP depends on the specialized function of the target cell. Typically, an increase in concentration of cAMP leads to cAM- dependent protein kinase activation, which phosphorylates and activates other key regulatory proteins in cardiac myocytes. Gi proteins inhibit adenyl cyclase and secondary phosphorylation [68].
β1- and β2-receptors are associated with stimulatory (Gs) pro-teins, and α2 and cholinergic receptors are coupled with inhibitory (Gi) proteins. α1-Receptors are coupled to Gq proteins. Binding of the ligand to the α1-receptor activates phospholipase C, which con-verts phosphoinositol diphosphate into diacylglycerol (DAG) and inositol triphosphate (IP3). Diacylglycerol activates the enzyme protein kinase C, which phosphorylates cellular enzymes, leading to an increase in intracellular calcium by opening ion channels. The increase in calcium activates excitation contraction coupling and stimulates muscle contraction. α1-Agonists and β-agonists increase contractility via different pathways [69–71].
Persistent exposure of receptors to an agonist results in the loss of receptor-activated function or desensitization. Desensitization is cell specifi c and dependent on both the expression and the subcellular localization of specifi c components that function in desensitization processes. Homologous desensitization refers to the loss of stimulatory activity in the pathway that is involved with the specifi c receptor that is being stimulated. Heterologous desensitization refers to the decreased activity in all the pathways involved in the receptor stimulation. Three general mechanisms are associated with desensitization of GPCRs: (1) phosphorylation, (2) internalization or sequestration, and (3) downregulation. Receptor phosphorylation occurs in an agonist-dependent manner that is correlated (with respect to both time and dose) with a decreased
affi nity of receptors for the agonist, as well as attenuated receptor function. Agonist-induced receptor phosphorylation by GPCR kinases increases the affi nity of receptor binding to an arrestin molecule, resulting in uncoupling of the G protein from the recep-tor. Arrestin receptor binding prevents further signal transduction between receptor and G proteins [72,73]. Another process associ-ated with agonist-induced receptor desensitization is sequestration of cell-surface receptors into an intracellular membrane compart-ment. Receptor sequestration may involve different membrane traf-fi cking pathways. Sequestered receptors can either recycle to the cell surface or enter the endolysosomal pathway and eventually be degraded. Both receptor phosphorylation and sequestration are associated primarily with more rapid receptor desensitization, which occurs over a period of only a few minutes [74].
With more persistent exposure to agonist, a slower phase (typi-cally hours) of receptor downregulation occurs in which the steady-state level of receptor protein is decreased. Mechanisms responsible for the agonist-induced reduction in the cellular density of recep-tors (homologous receptor downregulation) remain largely unclear but involve appropriate changes in either receptor synthesis (i.e., reduction in the steady-state level of receptor mRNA) and/or recep-tor degradation. Receptor downregulation is also cell specifi c and involves the complex interaction between multiple cellular events to infl uence receptor expression. The decreased response to inotro-pic agents in the failing heart has been related to β-receptor downregulation [75,76].
β-Adrenergic receptors on the neonatal myocardium are phar-macologically identical to their adult form and are approximately 80% β1 and 20% β 2. β-Adrenergic receptors and the adenyl cyclase system are well developed by late fetal life; receptor density peaks at birth and decreases with advancing post conceptional age. β-Adrenergic receptor responsiveness is markedly decreased with aging; this occurs by multiple mechanisms, including downregula-tion and decreased agonist binding of β1-receptors, uncoupling of β2-receptors, and abnormal G-protein–mediated signal transduc-tion [77]. These changes in the β-adrenergic receptors are primarily modulated by increases in both thyroid hormone and adrenocorti-costeroids that occur with birth. At birth, these differences in β-receptor function along with higher circulating catecholamine levels result in a lower responsiveness to exogenously administered catecholamines. α1-Adrenergic receptors appear early in gestation and in many species reach their highest density in the newborn period.
Vagal tone infl uences contractility via cholinergic receptors, operating through Gi proteins. In humans, acetylcholine inhibits sinoatrial pacemaker activity in hearts as young as 3–7 weeks ges-tation, and parasympathetic cholinergic nerves are found in the atria very early in gestation. Sensitivity to acetylcholine increases up to week 9 and then remains stable until the eighteenth week. Vagal myelination progresses throughout fetal development in humans and reaches adult levels by about 50 weeks postconceptual age. Expression of cholinergic receptors, which appear to be similar to adult receptors, is maximal at birth, remains high for several weeks, and then declines to adult levels, at least in the rat.
Although the innervation of the mammalian heart has been study extensively in animals, much less is known about the inner-vation of these tissues in humans. The initial sympathetic domi-nance in the neural supply to the human heart in infancy and its gradual transition into a sympathetic and parasympathetic codom-inance in adulthood correlate with the changes in heart rate observed during postnatal development.
FIGURE 1.6. Structure of G proteins. GDP, guanosine diphosphate; GTP, guanosine triphos-phate. (A) 3-D structure. (B) Senematic depicting the various subunits.
BA
a-signal transducer(cell surface)
bg-subunits(cytoplasmic)
Activated by release of GDP and binding of GTP → release of bg-subunitsDeactivated by hydrolysis of GTP → reassociation of a to bg subunits
GDPα
β
γ
1. Developmental Cardiac Physiology 7
Transition from Fetus to Neonate
Separation of the fetus from the mother is a complex physiologic process that has multiple effects on cardiac function, cardiopulmo-nary interactions, and the processes that bring about the ontogenic changes in cardiac structure described earlier [46,48,56,78–82].
Fetal Oxygen Saturation
After blood circulates through the placenta, the highest oxygen saturation (SaO2 = 80%; PaO2 = 35 mm Hg) in the fetal circulation is found in the single umbilical vein, which continues into the fetus as the ductus venosus (Figure 1.7). This highly oxygenated blood enters the right atrium where it is preferentially shunted across the foramen ovale into the left atrium. There is subsequent admixture of desaturated blood from the inferior vena cava and (SaO2 = 70%), superior vena cava SVC (SaO2 = 40%), hepatic veins, coronary sinus, leading to a left ventricle (LV) SaO2 = 65%. This LV blood is prefer-entially fl ows via the ascending aorta into the developing brain and coronary system. The desaturated blood preferentially enters the right ventricle (RV) with a saturation of 55%, which ejects into the uninfl ated lungs, and ductus arteriosus, which leads to the descend-ing aorta. There is a step up in oxygen saturations in the descending aorta (60%) because of a small amount of blood crossing the isthmus of the aorta from the ascending aorta. This blood then fl ows to the right and left internal iliac arteries, which then give
rise to the two umbilical arteries that will bring this desaturated blood to the placenta for oxygenation [56,79–81].
Fetal Blood Flow
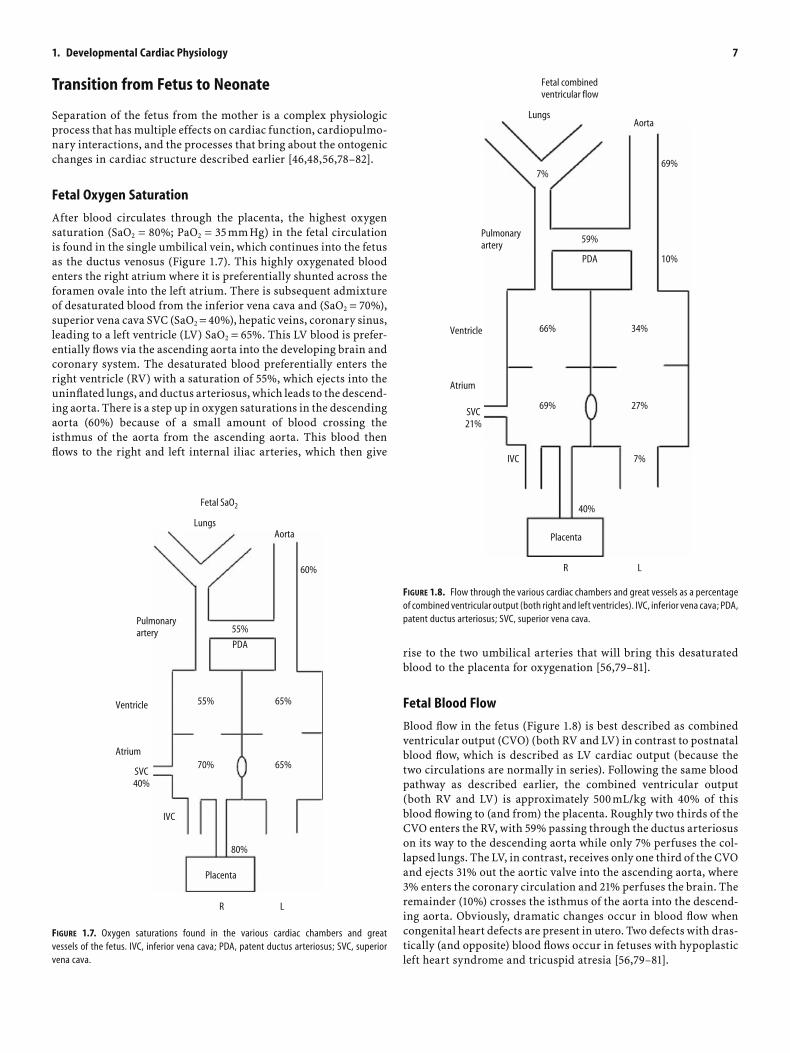
Blood fl ow in the fetus (Figure 1.8) is best described as combined ventricular output (CVO) (both RV and LV) in contrast to postnatal blood fl ow, which is described as LV cardiac output (because the two circulations are normally in series). Following the same blood pathway as described earlier, the combined ventricular output (both RV and LV) is approximately 500 mL/kg with 40% of this blood fl owing to (and from) the placenta. Roughly two thirds of the CVO enters the RV, with 59% passing through the ductus arteriosus on its way to the descending aorta while only 7% perfuses the col-lapsed lungs. The LV, in contrast, receives only one third of the CVO and ejects 31% out the aortic valve into the ascending aorta, where 3% enters the coronary circulation and 21% perfuses the brain. The remainder (10%) crosses the isthmus of the aorta into the descend-ing aorta. Obviously, dramatic changes occur in blood fl ow when congenital heart defects are present in utero. Two defects with dras-tically (and opposite) blood fl ows occur in fetuses with hypoplastic left heart syndrome and tricuspid atresia [56,79–81].
Lungs
Fetal combinedventricular flow
Aorta
69%
10%
59%
7%
66%
69%
IVC
Pulmonaryartery
PDA
Ventricle
Atrium
SVC21%
40%
7%
34%
27%
Placenta
R L
FIGURE 1.8. Flow through the various cardiac chambers and great vessels as a percentage of combined ventricular output (both right and left ventricles). IVC, inferior vena cava; PDA, patent ductus arteriosus; SVC, superior vena cava.
FIGURE 1.7. Oxygen saturations found in the various cardiac chambers and great vessels of the fetus. IVC, inferior vena cava; PDA, patent ductus arteriosus; SVC, superior vena cava.
Lungs
Fetal SaO2
Aorta
60%
55%
55%
70%
IVC
Pulmonaryartery
PDA
Ventricle
Atrium
SVC40%
80%
65%
65%
Placenta
R L

8 K.C. Kocis, A.L. Graciano, and J.N. Meliones
Fetal Hemoglobin
It is important to understand the characteristics of the fetal hemo-globin (HbF) oxygen disassociation curve (Figure 1.9). First, the P50 (or partial pressure of oxygen where hemoglobin is 50% saturated) is lower (21 mm Hg) than adult hemoglobin (HbA) (27 mm Hg). Thus, the HbF disassociation curve is shifted leftward of the HbA curve. Acidic pH, PCO2, and 2,3-DPG all shift the curves to the right. Importantly, HbA production begins at 34 weeks’ gestation, with a half life of 6 weeks, such that at birth 60% of the neonate’s blood is HbF. These characteristics of HbF allow for transfer of oxygen from the placenta to the fetal circulation and unloading of relatively desaturated blood in the tissue beds of the fetus. In addition, HbF has a lower viscosity than HbA at the same level of hematocrit.
Pulmonary Vascular Resistance
Because in utero the fetal lungs are not infl ated with gas, but dis-tended by pulmonary fl uid [83], and only 7% of CVO perfuses them, the pulmonary vascular resistance (PVR) is very high (Figure 1.10) [56,79–81,84–86]. Even in this state, the pulmonary bed has been shown to be reactive to relative hypoxemia (PaO2 < 18 mm Hg) and acidosis, which increases PVR, and relative hyperoxia and alkalo-sis, which decreases PVR [84–86]. With normal vaginal delivery and baby’s fi rst breath there is a tremendous decrease in PVR pre-dominantly because of lung infl ation with air. Again, hypoxemia, acidosis, hypothermia, and polycythemia serve to increase PVR, whereas hyperoxia, alkalosis, hyperthermia, prostaglandin (E2 and I2), and nitric oxide (among many other things) decrease PVR [85,86].
The central nervous system infl uences PVR in several ways, mostly, although not entirely, mediated through the sympathetic nervous system. First, stimulation of baroreceptors located in the carotid bodies and in the pulmonary arteries themselves result in pulmonary vasoconstriction. Chemoreceptors located in the carotid and aortic bodies sense both oxygen and carbon dioxide tensions (while the sensors in the respiratory center of the brain stem only detect carbon dioxide). These sensors affect PVR in the fashions described earlier [86].
The Ductus Arteriosus
The ductus arteriosus (DA) [87–93] connects the main pulmonary artery to the descending aorta at the level just beyond the isthmus and takeoff of the subclavian artery. Embryologic origin is from the sixth aortic arch. During fetal life, the DA allows blood to bypass the fl uid-fi lled lungs and perfuse the lower body via the right ventricle. This ultimately returns deoxygenated blood back to the placenta for renewal of oxygen and metabolic substrates from the mother. The main anatomic differences between the DA and pulmonary artery (PA) reside in spiraling layers of smooth muscle in the media (DA) rather than circumferentially oriented ones (PA), which then migrate into the subintimal areas during late gestation. The media is also fi lled with hyaluronic acid (DA). The intima is also noticeably thicker (DA) than in the PA.
Postnatal closure of the ductus involves two phases. The fi rst phase occurs within the fi rst 12 hr after birth. The mechanism responsible for this is contraction of the smooth muscle fi bers in the media, resulting in a narrowing of the ductal lumen and shortening of the ductus. This leads to increased ductal wall thickness with protrusion of intimal cushions into the lumen. The second phase is normally completed in the fi rst few weeks of life. The mechanisms involved in this phase include endothelial infolding with disruption and fragmentation of the subintimal layers with fi brous prolifera-tion resulting in formation of the ligamentum arteriosum.
Ductal vasoreactivity is affected predominantly by oxygen, pros-taglandins, and other substances. During fetal life, the ductus is exposed to relatively hypoxemic blood coming from the RV. As ges-tation advances, increases in PaO2 cause vasoconstriction. The more advanced the gestational age, the lower the level of oxygen necessary to cause vasoconstriction. Bradykinin, acetylcholine catecholamines and endothelin are all potent DA vasoconstrictors. The best-studied mediators of ductal patency are the prostaglandins (PGs) derived
Oxygen disassociation curves
100
75
50
25
0
HbF: P50 = 21 torr
HbA: P50 = 27 torr
A
B
C
10 20 30 40 50 60
FIGURE 1.9. Oxygen disassociation curve of fetal hemoglobin (HbF) (curve A) compared with adult hemoglobin (HbA) (curve B) as well as a rightward shift of the HbA curve (curve C) associated with several physiologic processes, including 2,3-diphosphoglycerate.
35 40 45% Max Post conception in weeks
Pulmonary vascular resistance (PVR)
Parturition
Pulm
onar
y va
scul
ar re
sista
nce
100
50
0
FIGURE 1.10. The changes in pulmonary artery pressure, pulmonary blood flow, and pulmo-nary vascular resistance (PVR) that occur during fetal development, parturition, and neonatal life. Note that the most dramatic decrease in PVR occurs with the infant’s first breath.

1. Developmental Cardiac Physiology 9
from the cyclooxygenase-mediated products of arachidonic acid metabolism. These are produced by the DA itself and also by the pla-centa. Endogenously produced PGE2 and PGI2 (prostacyclin) and exogenous PGE1 dilate the DA. Circulating levels of PGI2 from the placenta are much higher (10 times) than PGE2, although PGE2 is a much more potent vasodilator than PGI2. Inhibitors of prostaglan-din synthesis, such as indomethacin and other nonsteroidal agents, produce constriction of the DA that can be reversed by PGE1 infu-sion. Prostaglandins are metabolized in the lung, which for the fetus means signifi cantly higher circulating levels compared with the neo-natal counterpart with perfusion of the lungs.
Fetal and Neonatal Regulation of Thyroid Hormone
The ontogenic changes in the thyroid hormones thyroid-releasing hormone (TRH), thyroid-stimulating hormone (TSH), T4 (thyrox-ine), reverse triiodothyronine (rT3), and triiodothyronine (T3) are demonstrated in Figure 1.11. During fetal life there is a progressive
increase in hypothalamic release of TRH, but TSH levels fall slightly during late gestation because of negative feedback from rising T3 levels. The placenta is instrumental in converting T4 into rT3 during fetal life (inner ring deiodinase) rather than T3 (outer ring deiodinase found in the fetal liver) in order to minimize thermo-genesis and thus oxygen consumption while also minimizing respi-ratory drive. In late gestation, an increase in glucocorticoid synthesis within the fetus upregulates outer ring deiodinase found in fetal liver, leading to the rising T3 levels. At birth, with the removal of the placenta and stress response from delivery, there is a logarithmic increase in TSH, T4, and T3 levels, while rT3 levels fall. This is the basis for all neonatal thyroid screening tests. The increase in T3 drives many metabolic processes, including the con-version of myosin heavy chain transformation into the V1 adult form and increasing β-receptors, as described earlier [42–46].
Conclusion
This chapter reviewed the current state of knowledge regarding the important changes that occur in cardiovascular physiology during fetal life through the complex birthing process into neonatal life and beyond into childhood and adulthood. This information is important to the practicing pediatric cardiac intensivist who must make critical decisions about stabilizing premature infants and neonates in the pediatric intensive care unit. These strategies are different from those utilized for the older child and adult. Once patients are stable, timing of surgical procedures must be made with knowledge of these developmental transitions in cardiac func-tion. Finally, future research will be aimed at developing new strat-egies to either transition the neonatal myocardium to a more advantageous state or employ novel therapies to maximize fetal/neonatal physiology.
References
1. Moore KL. The Developing Human: Clinically Oriented Embryology, 6th ed. Philadelphia: WB Saunders; 1998.
2. Sadler TW. Langman’s Medical Embryology, 9th ed. Chapel Hill, NC: Lippincott Williams & Wilkins; 2003.
3. Katz AM. Physiology of the Heart, 3rd ed. Philadelphia: Lippincott Williams & Wilkins; 2001.
4. Severs NJ. The cardiac muscle cell. Bioessays 2000;22(2):188–199. 5. Angst BD, Khan LU, Severs NJ, et al. Dissociated spatial patterning of
gap junctions and cell adhesion junctions during postnatal differentia-tion of ventricular myocardium. Circ Res 1997;80(1):88–94.
6. Yeager M. Structure of cardiac gap junction intercellular channels. J Struct Biol 1998;121(2):231–245.
7. Gillette P, Garson A. Pediatric Arrhythmias: Electrophysiology and Pacing. Philadelphia: WB Saunders; 1990.
8. Barton PJ, Robert B, Fiszman MY, Leader DP, Buckingham ME. The same myosin alkali light chain gene is expressed in adult cardiac atria and in fetal skeletal muscle. J Muscle Res Cell Motil 1985;6(4):461–475.
9. Hirzel H, Tuchschmid C, Schneider J, Krayenbuehl H, Schaub M. Rela-tionship between myosin isoenzyme composition, hemodynamics, and myocardial structure in various forms of human cardiac hypertrophy. Circ Res 1985;57(5):729–740.
10. Miyata S, Minobe W, Bristow MR, Leinwand LA. Myosin heavy chain isoform expression in the failing and nonfailing human heart. Circ Res 2000;86(4):386–390.
11. Morano M, Zacharzowski U, Maier M, et al. Regulation of human heart contractility by essential myosin light chain isoforms. J Clin Invest 1996;98(2):467–473.
0
10
20
0
10
20
30
40
50
60
70
80
Birth
TSH
T4
rT3
T3
Seru
m T
SH(μ
u/m
l)Se
rum
T4
(μg/
dl)
0
100
38 42
300
200
Seru
m T
3/rT
3(n
g/dl
)
Post conception age (weeks)
FIGURE 1.11. The ontogenic changes in the thyroid hormones: thyroid-releasing hormone (TRH), thyroid-stimulating hormone (TSH), T4 (thyroxine), reverse triiodothyronine (rT3), and triiodothyronine (T3). Note the logarithmic increase in TSH, T4, and T3 levels, while rT3 levels fall.

10 K.C. Kocis, A.L. Graciano, and J.N. Meliones
12. Reiser PJ, Portman MA, Ning XH, Schomisch Moravec C. Human cardiac myosin heavy chain isoforms in fetal and failing adult atria and ventricles. Am J Physiol Heart Circ Physiol 2001;280(4):H1814–H1820.
13. Schaub MC, Hefti MA, Zuellig RA, Morano I. Modulation of contractil-ity in human cardiac hypertrophy by myosin essential light chain isoforms. Cardiovasc Res 1998;37(2):381–404.
14. Sutsch G, Brunner UT, von Schulthess C, et al. Hemodynamic perfor-mance and myosin light chain-1 expression of the hypertrophied left ventricle in aortic valve disease before and after valve replacement. Circ Res 1992;70(5):1035–1043.
15. Yamashita H. Myosin light chain isoforms modify force generating ability of cardiac myosin by changing the kinetics of actin-myosin interaction. Cardiovasc Res 2003.
16. Molloy J. Movement and force produced by a single myosin head. Nature 1995.
17. Rayment I. Three dimensional structure of myosin subfragment-1: a molecular motor. Science 1993.
18. Uyeda T. The neck region of the myosin motor domain acts as a lever arm to generate movement. Proc Natl Acad Sci USA 1996.
19. Hernandez O. Plasticity in skeletal cardiac and smooth muscle: invited review: pathophysiology of cardiac muscle contraction and relaxation as a result of alterations in thin fi lament regulation. J Appl Physiol 2001.
20. Al-Hillawi E. The effects of phosphorylation of cardiac troponin-I on its interactions with actin and cardiac troponin C. Eur J Biochem 1995.
21. Farah C. The troponin complex and regulation of muscle contraction. FASEB J 1995.
22. Parmacek M. Biology of the troponin complex in cardiac myocytes. Prog Cardiovasc Dis 2004.
23. Michele D. Physiological consequences of tropomyosin mutations associated with cardiac and skeletal myopathies. J Mol Med 2000.
24. Solaro RJ, Rarick HM. Troponin and tropomyosin: proteins that switch on and tune in the activity of cardiac myofi laments. Circ Res 1998;83(5):471–480.
25. Gordon A. Skeletal and cardiac muscle contractile activation: tropo-myosin “rocks and rolls”. New Physiol Sci 2001.
26. Cummins P, Lambert SJ. Myosin transitions in the bovine and human heart. A developmental and anatomical study of heavy and light chain subunits in the atrium and ventricle. Circ Res 1986;58(6):846–858.
27. Price KM, Littler WA, Cummins P. Human atrial and ventricular myosin light-chains subunits in the adult and during development. Biochem J 1980;191(2):571–580.
28. VanBuren P, Harris DE, Alpert NR, Warshaw DM. Cardiac V1 and V3 myosins differ in their hydrolytic and mechanical activities in vitro. Circ Res 1995;77(2):439–444.
29. Sanbe A, Gulick J, Hayes E, et al. Myosin light chain replacement in the heart. Am J Physiol Heart Circ Physiol 2000;279(3):H1355–H1364.
30. Humphreys JE, Cummins P. Regulatory proteins of the myocardium. Atrial and ventricular tropomyosin and troponin-I in the developing and adult bovine and human heart. J Mol Cell Cardiol 1984;16(7):643–657.
31. Venkatraman G, Gomes AV, Kerrick WG, Potter JD. Characterization of troponin T dilated cardiomyopathy mutations in the fetal troponin isoform. J Biol Chem 2005;280(18):17584–17592.
32. Anderson PA, Malouf NN, Oakeley AE, Pagani ED, Allen PD. Troponin T isoform expression in humans. A comparison among normal and failing adult heart, fetal heart, and adult and fetal skeletal muscle. Circ Res 1991;69(5):1226–1233.
33. Anderson PA, Greig A, Mark TM, et al. Molecular basis of human cardiac troponin T isoforms expressed in the developing, adult, and failing heart. Circ Res 1995;76(4):681–686.
34. Hastings KE, Koppe RI, Marmor E, Bader D, Shimada Y, Toyota N. Structure and developmental expression of troponin I isoforms. cDNA clone analysis of avian cardiac troponin I mRNA. J Biol Chem 1991;266(29):19659–19665.
35. Bodor GS, Oakeley AE, Allen PD, Crimmins DL, Ladenson JH, Anderson PA. Troponin I phosphorylation in the normal and failing adult human heart. Circulation 1997;96(5):1495–1500.
36. Hunkeler NM, Kullman J, Murphy AM. Troponin I isoform expression in human heart. Circ Res 1991;69(5):1409–1414.
37. Bhavsar PK, Dhoot GK, Cumming DV, Butler-Browne GS, Yacoub MH, Barton PJ. Developmental expression of troponin I isoforms in fetal human heart. FEBS Lett 1991;292(1–2):5–8.
38. Corrado D, Basso C, Thiene G, et al. Spectrum of clinicopathologic manifestations of arrhythmogenic right ventricular cardiomyopathy/dysplasia: a multicenter study. J Am Coll Cardiol 1997;30(6):1512–1520.
39. Swan H, Piippo K, Viitasalo M, et al. Arrhythmic disorder mapped to chromosome 1q42-q43 causes malignant polymorphic ventricular tachycardia in structurally normal hearts. J Am Coll Cardiol 1999;34(7):2035–2042.
40. Yamashita H, Tyska MJ, Warshaw DM, Lowey S, Trybus KM. Func-tional consequences of mutations in the smooth muscle myosin heavy chain at sites implicated in familial hypertrophic cardiomyopathy. J Biol Chem 2000;275(36):28045–28052.
41. Hoh J, McGrath P, Hale P. Electrophoretic analysis of multiple forms of rat cardiac myosin: effects of hypophysectomy and thyroxine replacement. J Mol Cell Cardiol 1978;10(11):1053–1076.
42. Bottinelli R, Canepari M, Cappelli V, Reggiani C. Maximum speed of shortening and ATPase activity in atrial and ventricular myocardia of hyperthyroid rats. Am J Physiol 1995;269(3 Pt 1):C785–C790.
43. Gluckman P. The transition from fetus to neonate-an endocrine per-spective. Acta Paediatr 1999.
44. Hoh J. Electrophoretic analysis of multiple forms of rat cardiac myosin: effects of hypophysectomy and thyroxine replacement. J Mol Cell Cardiol 1978.
45. Izumo S. Myosin heavy chain messenger RNA and protein isoform transitions during cardiac hypertrophy. Interaction between hemody-namic and thyroid hormone induced signals. J Clin Invest 1987.
46. Fisher D. Ontogenesis of hypothalamic-pituitary-thyroid function and metabolism in man, sheep, and rat. Recent Prog Hormone Res 1976.
47. Stern MD. Theory of excitation-contraction coupling in cardiac muscle. Biophys J 1992;63(2):497–517.
48. Tibbits GF, Xu L, Sedarat F. Ontogeny of excitation-contraction cou-pling in the mammalian heart. Comp Biochem Physiol A Mol Integr Physiol 2002;132(4):691–698.
49. Cheng H, Lederer WJ, Cannell MB. Calcium sparks: elementary events underlying excitation-contraction coupling in heart muscle. Science 1993;262(5134):740–744.
50. Fabiato A. Calcium-induced release of calcium from the cardiac sarco-plasmic reticulum. Am J Physiol 1983;245(1):C1–C14.
51. Frank JS, Mottino G, Reid D, Molday RS, Philipson KD. Distribution of the Na(+)-Ca2+ exchange protein in mammalian cardiac myocytes: an immunofl uorescence and immunocolloidal gold-labeling study. J Cell Biol 1992;117(2):337–345.
52. Haddock PS, Coetzee WA, Artman M. Na+/Ca2+ exchange current and contractions measured under Cl(-)-free conditions in developing rabbit hearts. Am J Physiol 1997;273(2 Pt 2):H837–H846.
53. Kaufman TM, Horton JW, White DJ, Mahony L. Age-related changes in myocardial relaxation and sarcoplasmic reticulum function. Am J Physiol 1990;259(2 Pt 2):H309–H316.
54. Sauer H, Theben T, Hescheler J, Lindner M, Brandt MC, Wartenberg M. Characteristics of calcium sparks in cardiomyocytes derived from embryonic stem cells. Am J Physiol Heart Circ Physiol 2001;281(1):H411–H421.
55. Sham JS, Cleemann L, Morad M. Functional coupling of Ca2+ channels and ryanodine receptors in cardiac myocytes. Proc Natl Acad Sci USA 1995;92(1):121–125.
56. Friedman WF. The intrinsic physiologic properties of the developing heart. Prog Cardiovasc Dis 1972;15(1):87–111.
57. Covell JW. Factors infl uencing diastolic function. Possible role of the extracellular matrix. Circulation 1990;81(2 Suppl):III155–III158.

1. Developmental Cardiac Physiology 11
58. Nassar R, Reedy MC, Anderson PA. Developmental changes in the ultrastructure and sarcomere shortening of the isolated rabbit ven-tricular myocyte. Circ Res 1987;61(3):465–483.
59. Cullen S, Shore D, Redington A. Characterization of right ventricular diastolic performance after complete repair of tetralogy of Fallot. Restrictive physiology predicts slow postoperative recovery. Circula-tion 1995;91(6):1782–1789.
60. McMahon C, Nagueh S, Pignatelli R, et al. Characterization of left ventricular diastolic function by tissue Doppler imaging and clinical status in children with hypertrophic cardiomyopathy. Circulation 2004;109(14):1756–1762.
61. Oh J, Appleton C, Hatle L, Nishimura R, Seward J, Tajik A. The non-invasive assessment of left ventricular diastolic function with two-dimensional and Doppler echocardiography. J Am Soc Echocardiogr 1997;10(3):246–270.
62. Stokes DL, Wagenknecht T. Calcium transport across the sarcoplasmic reticulum: structure and function of Ca2+-ATPase and the ryanodine receptor. Eur J Biochem 2000;267(17):5274–5279.
63. Mattiazzi A, Mundina-Weilenmann C, Guoxiang C, Vittone L, Kranias E. Role of phospholamban phosphorylation on Thr17 in cardiac physiologi-cal and pathological conditions. Cardiovasc Res 2005;68(3):366–375.
64. Giordano FJ. Oxygen, oxidative stress, hypoxia, and heart failure. J Clin Invest 2005;115(3):500–508.
65. Jafri MS, Dudycha SJ, O’Rourke B. Cardiac energy metabolism: models of cellular respiration. Annu Rev Biomed Eng 2001;3:57–81.
66. Lopaschuk GD, Spafford MA, Marsh DR. Glycolysis is predominant source of myocardial ATP production immediately after birth. Am J Physiol 1991;261(6 Pt 2):H1698–H1705.
67. Teitel DF, Klautz R, Steendijk P, van der Velde ET, van Bel F, Baan J. The end-systolic pressure–volume relationship in the newborn lamb: effects of loading and inotropic interventions. Pediatr Res 1991;29(5):473–482.
68. Coughlin SR. Expanding horizons for receptors coupled to G proteins: diversity and disease. Curr Opin Cell Biol 1994;6(2):191–197.
69. Birnbaumer L, Abramowitz J, Brown AM. Receptor-effector coupling by G proteins. Biochim Biophys Acta 1990;1031(2):163–224.
70. Cotecchia S, Kobilka BK, Daniel KW, et al. Multiple second messenger pathways of alpha-adrenergic receptor subtypes expressed in eukary-otic cells. J Biol Chem 1990;265(1):63–69.
71. Stiles GL, Caron MG, Lefkowitz RJ. Beta-adrenergic receptors: bio-chemical mechanisms of physiological regulation. Physiol Rev 1984;64(2):661–743.
72. Kobilka B. Adrenergic receptors as models for G protein-coupled receptors. Annu Rev Neurosci 1992;15:87–114.
73. Oakley RH, Laporte SA, Holt JA, Barak LS, Caron MG. Molecular deter-minants underlying the formation of stable intracellular G protein-coupled receptor-beta-arrestin complexes after receptor endocytosis. J Biol Chem 2001;276(22):19452–19460.
74. Lefkowitz RJ, Hausdorff WP, Caron MG. Role of phosphorylation in desensitization of the beta-adrenoceptor. Trends Pharmacol Sci 1990;11(5):190–194.
75. Benovic JL. Purifi cation and characterization of beta-adrenergic recep-tor kinase. Methods Enzymol 1991;200:351–362.
76. Bristow MR, Ginsburg R, Minobe W, et al. Decreased catecholamine sensitivity and beta-adrenergic-receptor density in failing human hearts. N Engl J Med 1982;307(4):205–211.
77. White M, Roden R, Minobe W, et al. Age-related changes in beta-adren-ergic neuroeffector systems in the human heart. Circulation 1994;90(3):1225–1238.
78. Shaul PW, Farrar MA, Zellers TM. Oxygen modulates endothelium-derived relaxing factor production in fetal pulmonary arteries. Am J Physiol 1992;262(2 Pt 2):H355–H364.
79. Friedman AH, Fahey JT. The transition from fetal to neonatal circula-tion: normal responses and implications for infants with heart disease. Semin Perinatol 1993;17(2):106–121.
80. Rudolph AM. Congenital Diseases of the Heart. Chicago: Year Book Medical Publishers; 1974.
81. Heymann MA. Regulation of the pulmonary circulation in the perina-tal period and in children. Intensive Care Med 1989;15(Suppl 1):S9–S12.
82. Agata Y, Hiraishi S, Misawa H, et al. Regional blood fl ow distribution and left ventricular output during early neonatal life: a quantitative ultrasonographic assessment. Pediatr Res 1994;36(6):805–810.
83. Adams FH, Latta H, el-Salawy A, Nozaki M. The expanded lung of the term fetus. J Pediatr 1969;75(1):59–66.
84. Heymann MA, Rudolph AM, Nies AS, Melmon KL. Bradykinin produc-tion associated with oxygenation of the fetal lamb. Circ Res 1969;25(5):521–534.
85. Rudolph AM. Fetal and neonatal pulmonary circulation. Am Rev Respir Dis 1977;115(6 Pt 2):11–18.
86. Long W. Fetal and Neonatal Cardiology. Philadelphia: WB Saunders; 1990.
87. Coceani F, Kelsey L. Endothelin-1 release from lamb ductus arteriosus: relevance to postnatal closure of the vessel. Can J Physiol Pharmacol 1991;69(2):218–221.
88. Quinn D, Cooper B, Clyman RI. Factors associated with permanent closure of the ductus arteriosus: a role for prolonged indomethacin therapy. Pediatrics 2002;110(1 Pt 1):e10.
89. Reller MD, Colasurdo MA, Rice MJ, McDonald RW. The timing of spontaneous closure of the ductus arteriosus in infants with respira-tory distress syndrome. Am J Cardiol 1990;66(1):75–78.
90. Shaffer CL, Gal P, Ransom JL, et al. Effect of age and birth weight on indomethacin pharmacodynamics in neonates treated for patent ductus arteriosus. Crit Care Med 2002;30(2):343–348.
91. Silver MM, Freedom RM, Silver MD, Olley PM. The morphology of the human newborn ductus arteriosus: a reappraisal of its structure and closure with special reference to prostaglandin E1 therapy. Hum Pathol 1981;12(12):1123–1136.
92. Seidner SR, Chen YQ, Oprysko PR, et al. Combined prostaglandin and nitric oxide inhibition produces anatomic remodeling and closure of the ductus arteriosus in the premature newborn baboon. Pediatr Res 2001;50(3):365–373.
93. Patent ductus arteriosus. In: Moss, Adams, eds. Heart Disease in Infants, Children, and Adolescents Including the Fetus and Young Adult, 6th ed. Baltimore: Lippincott Williams & Wilkins; 2000.

2Hemodynamic MonitoringShane M. Tibby
and heart rate; such a signal can be represented by Fourier analysis [5]. The transient response refers to the how the system attempts to re-achieve a steady state when the input is rapidly altered in terms of both frequency (heart rate) and amplitude (blood pressure). Two interacting components affect the transient response, the natural frequency of the system and the damping constant [6]. For each natural frequency there is a range of optimal dampening. If the system is overdamped, systolic pressure will be underestimated and diastolic pressure overestimated (however, mean pressures will be relatively accurate); conversely, an underdamped system will overestimate systolic pressure and give a distorted waveform overall [6]. Dampening can be estimated crudely at the bedside by observation of the waveform and a fast-fl ush test in which 1–2 mL of saline is fl ushed rapidly through the system at a pressure in excess of the systolic pressure and the ensuing signal observed. In an overdamped system, the pressure trace will be slow to return to the pulsatile waveform after the fl ush, and there will be no oscilla-tion as it reequilibrates with the blood pressure signal. The pres-sure trace in an underdamped system will return rapidly toward the blood pressure wave but will show a series of rapid oscillations around the blood pressure as it reequilibrates [6,7]. The transient response can be optimized by utilizing tubing that is noncompliant and not of excessive length, monitoring for kinks in the tubing and the intravascular catheter, and avoiding small air bubbles and clots within the system [8,9].
The arterial pressure pulse waveform is a function of a number of factors, including stroke volume, arterial compliance, arterial impedance, peripheral resistance, inertia, and wave refl ection (see Arterial Pulse Contour Analysis, later) [10,11]. As these properties change along the arterial tree, so does the pulse pressure waveform; these changes are more marked in children than in adults [12]. This means that a centrally measured pressure will have a lower systolic and higher diastolic pressure but an approximately equal mean arterial blood pressure to that from a peripherally measured site.
Cardiac Output
Cardiac output is the volume of blood ejected by the heart per minute. It is usually expressed relative to body surface area, which means that the normal range of 3.5–5.5 L/min/m2 is applicable throughout the entire pediatric age range. Cardiac output is the net result of interrelating factors affecting both myocardial systolic
Introduction . . . . . . . . . . . . . . . . . . . . . . . . . . . . . . . . . . . . . . . . . . . . . 13Vascular Pressure Measurement. . . . . . . . . . . . . . . . . . . . . . . . . . . . 13Cardiac Output . . . . . . . . . . . . . . . . . . . . . . . . . . . . . . . . . . . . . . . . . . . 13Measuring the Adequacy of Flow . . . . . . . . . . . . . . . . . . . . . . . . . . . 21Regional Perfusion . . . . . . . . . . . . . . . . . . . . . . . . . . . . . . . . . . . . . . . 23Assessing the Components of Cardiac Output . . . . . . . . . . . . . . . 24
Introduction
Hemodynamic monitoring encompasses all pressure and fl ow mea-surements in relation to the cardiovascular system. The science of hemodynamics has its origins in the 17th and 18th centuries, from the pioneering work of William Harvey and the Reverend Stephen Hales. Hemodynamics incorporates monitoring within the wider consideration of the theoretical aspects of the forces responsible for the development and propagation of the pressure and fl ow pulses. Appreciation of hemodynamic monitoring requires an understand-ing of the structure of the heart and blood vessels, cardiovascular physiology, and fl uid mechanics [1].
Vascular Pressure Measurement
Maintaining an adequate perfusion pressure is a vital adjunct to ensuring adequate oxygen delivery [2]. The two common invasive pressure measurements undertaken in the pediatric intensive care unit (PICU) are arterial and central venous pressures. Pressure measurement typically involves an indwelling catheter; fl uid-fi lled, noncompliant tubing; and a pressure chamber containing a dia-phragm, which is connected to a pressure transducer. Pulsatile pressure transmitted from the blood vessel displaces the dia-phragm; this movement is sensed by a transducer, which relays an electric signal to a visual monitor via a preamplifi er. Blood sam-pling and zeroing to atmosphere are possible via a three-way tap within the tubing, and the system is kept patent via a continuous infusion of saline [1,3].
The relationship between signal input and output is known as the transfer function; in a system measuring vascular pressures the transfer function has two components—one relating to the steady-state response and the other to the transient response [4]. Here the steady-state response relates to the regular, periodic signals pro-duced by an unchanging or minimally changing blood pressure
13D.S. Wheeler et al. (eds.), Cardiovascular Pediatric Critical Illness and Injury,DOI 10.1007/978-1-84800-923-3_2, © Springer-Verlag London Limited 2009

14 S.M. Tibby
(heart rate, preload, contractility, and afterload) and diastolic function [13]. Measurement of cardiac output is uncommon in pediatrics because of a variety of factors, including perceived worth and technical diffi culty [2]. However, the relevance of cardiac output monitoring for selected patients is underlined by the facts that (1) the heart is one of the most common organs to fail during critical illness [14]; (2) other failing organs and supportive thera-pies aimed at these organs can impact on cardiac function (e.g., mechanical ventilation) [15]; (3) it cannot be estimated clinically [16]; and (4) low-fl ow states carry a higher mortality in certain dis-eases [17]. Traditionally, cardiac output has been diffi cult to measure in small children. However, a variety of less invasive methods are now available. Nonetheless, the decision to measure cardiac output represents a balance between the risks involved with the technique and the potential benefi ts gained from the additional hemodynamic information. The latter point requires a thorough understanding of both the modality used and the basic principles of cardiovascular physiology. If both of these criteria are not ful-fi lled, there is potential for iatrogenic harm to the patient. Cardiac output monitoring is unnecessary in all PICU patients but may be indicated for patients in the following categories: shock states, mul-tiple organ failure, cardiopulmonary interactions during mechani-cal ventilation, congenital and acquired heart disease, assessment of selected new therapies, and during clinical research that leads to a greater understanding of a disease process [18].
Measurement of Cardiac Output: Indicator Dilution Techniques
Techniques for measurement of cardiac output can be categorized as utilizing indicator dilution, the Fick principle, Doppler ultra-sound, impedance, and pulse contour analysis. In addition, these can also be categorized as intermittent versus continuous, invasive versus noninvasive (or minimally invasive), and so forth. When considering which modality to use for a particular patient, it is
worth considering the eight desirable monitoring characteristics defi ned by Shephard: accuracy, reproducibility, rapid response time, operator independence, ease of application, no morbidity, continuous use, and cost effectiveness [19].
Stewart published the fi rst indicator dilution method for mea-surement of blood volume fl ow in 1897, based upon Hering’s earlier work on blood velocity measurement [20]. Between 1928 and 1932, Hamilton applied this principle to the measurement of cardiac output [21]. A number of dilution techniques are now available; however, all follow the same principle regardless of the indicator used (temperature, dye, charge) [22]. Blood fl ow can be calculated following a central venous injection of an indicator by measuring the change in indicator concentration over time at a point down-stream of the injection. This can be expressed mathematically as
cardiac outputamount of indicator injected
conc indicator =
tt dt0
( )∞
∫The denominator refers to the integral of the indicator concentra-tion with time, in other words, the area under the curve for indica-tor concentration versus time measured between time of injection and infi nity. High-fl ow situations produce small, peaked curves, whereas low-fl ow situations produce curves that are larger, less peaked, and with a longer tail (Figure 2.1).
One problem inherent in dilution methods is that of recircula-tion. Recirculation refers to the phenomenon whereby the indicator within the initial portion of the concentration-time curve traverses the body and arrives back at the measurement site before the ter-minal portion of the concentration-time curve has passed the mea-surement site, the net effect being a secondary (and sometimes tertiary) curve superimposed on the primary curve (Figure 2.2). This may occur in states of low cardiac output. Calculation of cardiac output thus requires the separation of the primary curve from the composite. Several methods are available for this. The most widely used is that offered by Stewart and Hamilton, which
Indicator bolus
Superior vena cavaor right atrium
Measurement site
Pulmonary arteryPeripheral artery
1
2
Indi
cato
r con
cent
ratio
n
Cardiac output = amount of indicator injected
conc indicator (t) dt��0
Mean transit time = conc indicator (t) dt��
0
time × conc indicator (t) dt��0
Time
FIGURE 2.1. Generalized schema for an indicator dilution method. Curve 1 shows a typical curve with a high cardiac output; curve 2, occurring with a low cardiac output, is larger with an accentuated tail secondary to recirculation.

2. Hemodynamic Monitoring 15
assumes a monoexponential decay of the primary curve after a given time point [23]. Other methods include deconvolution [24] and fi tting the declining part of the primary curve with log normal, gamma, and local density random walk probability distributions [25]. A possible source of extreme recirculation pertinent to pedi-atric practice is that which occurs in the presence of an anatomic shunt, both left to right and right to left, depending on where the indicator is measured. In the presence of a large shunt, it may be impossible to identify the primary curve. Conversely, other authors have suggested methods for quantifying the shunt in relation to the appearance of the second peak [26–32]. Indicator dilution is accu-rate provided a series of conditions are met. These include rapid and even indicator injection, complete mixing of the indicator and
blood, no loss of indicator between injection and measurement, no anatomic shunt, minimal valve regurgitation, and steady-state fl ow [33]. Another useful property of indicator dilution curves is that they also allow for calculation of vascular volumes via the mean transit and exponential down slope times (see Figure 2.1) [34]. Various vascular volumes have been used as measures of preload (see Transpulmonary Thermodilution, later). Indeed, other calcu-lations relating to tissue volumes and liver function are also possi-ble, depending on the indicator used.
The hemodynamic calculations discussed in this chapter are summarized in Table 2.1.
Pulmonary Thermodilution
Pulmonary thermodilution utilizes temperature as the indicator and involves injection of a cooled solution into the right atrium (typically normal saline or 5% dextrose), with temperature change sensed by thermistors at the injection site and in the pulmonary artery. This technique was fi rst used in dogs by Fegler in 1954 [35] and subsequently in humans by Branthwaite and Bradley in 1968 [36]; it was introduced clinically with the development of the Swan-Ganz, or pulmonary artery, catheter in 1970 [37]. Over the next 30 years this became the most widely used method for measurement of cardiac output in adults, although use in children remained limited, mainly because of technical constraints [18,38–41]. Over the past 10 years the use of the pulmonary artery catheter has declined, possibly as a consequence of other, less-invasive methods becoming available, lack of benefi t (and perhaps even harm) from several large studies, and also several authors questioning the value of cardiac output measurement, particularly via this technique [42–48]. This last point is supported by two large, trans-Atlantic surveys that showed that many intensive care unit clinicians lack the rudimentary skills to perform safe pulmonary artery catheter insertion and interpretation of readings [49,50].
The Swan-Ganz catheter is typically inserted percutaneously through a sheath introducer (of a size larger than the catheter itself, e.g., 8.5 French introducer for a 7 French catheter) using the Seld-inger technique. The left subclavian or right internal jugular route is the preferred access point to encourage proper placement,
Indi
cato
r con
cent
ratio
n
Composite curve
Time
FIGURE 2.2. Early recirculation, as in the case of an intracardiac shunt, may produce a composite curve with several peaks and a prolonged delay phase. Here the composite curve results from superposition of the primary, secondary, and tertiary curves. Note the double peak, which may be seen with an anatomic shunt.
TABLE 2.1. Summary of hemodynamic variables.
Parameter Formula Normal range Units
Cardiac index CI = CO/body surface area 3.5–5.5 L/min/m2
Stroke index SI = CI/heart rate 30–60 mL/m2
Arterial oxygen content CaO2 = (1.34 × Hg × SaO2) + (PaO2 × 0.003) mL/LOxygen delivery DO2 = CI × CaO2 570–670 mL/min/m2
Fick principle CI = VO2/(CaO2 − CvO2) 160–180 (infant VO2) mL/min/m2
100–130 (child VO2) mL/min/m2
Mixed venous oxygen saturation 65%–75%Oxygen extraction ratio* OER = (SaO2 − SvO2)/SaO2 0.24–0.28Oxygen excess factor* Ω = SaO2/(SaO2 − SvO2) 3.6–4.2Systemic vascular resistance index SVRI = 79.9 × (MAP − CVP)/CI 800–1,600 dyn-sec/cm5/m2
Pulmonary vascular resistance index PVRI = 79.9 × (MPAP − LAP)/CI 80–240 dyn-sec/cm5/m2
Left ventricular stroke work index LVSWI = SI × MAP × 0.0136 50–62 (adult) g-m/m2
Note: CO, cardiac output; CI, cardiac index; CVP, central venous pressure (mm Hg); CaO2, arterial oxygen content; CvO2, mixed venous oxygen content; DO2, oxygen delivery; Hgb, hemo-globin concentration (g/L); LVSWI, left ventricular stroke work index; MAP, mean systemic arterial pressure (mm Hg); MPAP, mean pulmonary arterial pressure; LAP, left atrial pressure; OER, oxygen extraction ratio; PaO2, partial pressure of dissolved oxygen; SaO2, arterial oxygen saturation; SvO2, mixed venous oxygen saturation; SI, stroke index; SVRI, systemic vascular resistance index; PVRI, pulmonary vascular resistance index; VO2, oxygen consumption; Ω, oxygen excess factor.*The equations given for OER and Ω are only valid if the contribution from dissolved oxygen is minimal. If this is not the case, oxygen content (CaO2, CvO2) must be substituted for satura-tion (SaO2, SvO2).Source: Compiled from data in Perloff [264] and Shann [265].

16 S.M. Tibby
although any of the major upper limb veins are appropriate. The catheter is advanced until the tip lies within a branch pulmonary artery in a position suitable for measuring pulmonary artery occlu-sion pressure (PAOP) or pulmonary wedge pressure (PWP) (see later). A variety of sizes are available, including 7 French (suitable for use in older children), 5 French (suitable for use in children 10–18 kg), and 3 French (suitable for use in children less than 10 kg) [51]. The larger catheters are typically four or fi ve channel, includ-ing (1) a proximal lumen that sits in the right atrium for measure-ment of right atrial pressure and injection of the indicator, (2) a thermistor channel for measuring temperature of the injectate and blood within the pulmonary artery following injection, (3) an infl atable balloon to allow acquisition of occlusion pressure, (4) a distal lumen for measurement of pulmonary artery and occlusion pressures and mixed venous blood sampling, and (5) a fi beroptic line for continuous measurement of mixed venous oxygen satura-tion (SvO2). Smaller catheters may contain fewer channels and are typically inserted under direct vision during cardiac surgery. Per-cutaneous insertion and placement is diffi cult in small children and carries the risk of several potential complications, including pneumothorax, hemothorax, catheter malposition, catheter knot-ting, ventricular arrhythmias, balloon rupture, embolization, pul-monary artery occlusion, pulmonary infarction, and sepsis [53–55]. Interestingly, several studies have suggested that the subclavian route may be associated with a lower complication rate [55,56].
Because of its long history of clinical use, pulmonary thermodi-lution is often regarded as the benchmark against which newer modalities are tested. However, it must be stressed that pulmonary thermodilution is not a gold standard and has many potential sources of inaccuracy [33,57–59]. These include technical errors, variation in blood temperature within the pulmonary artery that is unrelated to indicator injection, and fl uctuations in cardiac output. Perhaps the most common source of fl uctuation in cardiac output pertinent to the PICU is that seen with mechanical ventila-tion. Positive pressure ventilation causes a transient drop in venous return and hence preload to the right ventricle, which produces a transient fall in right heart stroke volume. Because the time between injection and temperature sensing in the pulmonary artery is very short, the apparent cardiac output may vary, depending on when the measurement is taken in relation to the ventilatory cycle. To account for this, three to four measurements should be taken at systematic intervals throughout the ventilatory cycle and then averaged; this will produce an estimate within ±10% of the true cardiac output in adults (provided all other sources of accuracy are dealt with) [60]. Stetz et al. have concluded that there must be a minimal change of 12%–15% between serial averaged thermodilu-tion measurements to represent a true change in cardiac output [61]. It is possible that this fi gure may be higher in children, however, as thermodilution is thought to be less accurate and more variable [62]. Over the last decade, intermittent bolus thermodilution has been incorporated into a semicontinuous mode using a thermal fi lament [63]. Although commercially available devices perform comparatively in adults [64] with reasonable accuracy at high- and low-fl ow states [65], they have yet to be evaluated in children.
In addition to measuring cardiac output, the pulmonary artery catheter can provide a measure of right ventricular function (ejec-tion fraction), PAOP, pulmonary and right atrial pressures, and SvO2 (via either direct intermittent measurement or continuous oximetry). Right ventricular ejection fraction requires a thermistor with a rapid response time [66]. This reveals a characteristic series of temperature plateaus in the pulmonary artery after indicator
injection into the right ventricle during diastole (Figure 2.3). These plateaus refl ect intraventricular temperature during the previous heartbeat and can be used to calculate ejection fraction via an algorithm and, hence, end diastolic volume (because stroke volume is known from the thermodilution measurement and end diastolic volume = stroke volume/ejection fraction).
Pulmonary Artery Occlusion Pressure
When the balloon near the tip of the pulmonary artery catheter is infl ated so as to occlude upstream fl ow, a continuous column of nonfl owing blood is then present between the catheter tip and the point of pulmonary venous convergence just behind the left atrium (referred to as the J-1 point) [37,67]. This is known as the occlusion pressure or wedge pressure and is thought to approximate left atrial pressure. Occlusion pressure is sometimes erroneously referred to as pulmonary capillary pressure; however, the latter entity, as the name suggests, refers to pressure within the pulmonary capillaries, which will be greater than the venous pressure by an amount infl u-enced by both fl ow and pulmonary venous resistance (pulmonary vascular resistance has both an arterial and a venous component, which can be differentiated by a logarithmic plot of the pulmonary artery pressure decay after balloon occlusion) [68,69]. Occlusion pressure is traditionally measured at end expiration. This is impor-tant because occlusion pressure will vary throughout the respira-tory cycle because of the infl uence of alveolar pressure. In situations where alveolar pressure greatly exceeds occlusion pressure, pulmo-nary vasculature distal to the catheter tip may collapse, and the pressure reading will refl ect alveolar pressure rather than left atrial pressure. This may occur in West zones 1 and 2 of the lung or in situations where high positive end-expiratory pressure (PEEP) is used during mechanical ventilation [67]. This situation should be readily discernible from inspection of the pressure trace during occlusion, as large pressure swings will be seen in synchrony with the mechanical ventilator. Occlusion pressure can be used in the calculation of pulmonary vascular resistance and has been
Tem
pera
ture
chan
ge
Time
FIGURE 2.3. Temperature plateaus (arrows) seen with a rapid response thermistor in the pulmonary artery. Plateaus reflect intraventricular temperature during the previous heart-beat. From these, right ventricular end diastolic volume and ejection fraction can be calculated.

2. Hemodynamic Monitoring 17
suggested as a measure of both left ventricular preload and perfor-mance. Unfortunately, this is often not the case in clinical practice for a variety of factors, including technical problems, lack of user understanding, and diffi culties in extrapolating a volume from a pressure reading [70,71].
Transpulmonary Thermodilution
The principle of transpulmonary thermodilution is similar to that of pulmonary thermodilution; however, here the temperature change is measured in a large artery, typically the femoral artery. Thus the journey from injection to measurement traverses the right atrium, right ventricle, pulmonary vascular bed, left atrium, left ventricle, and aorta [72]. At fi rst glance this appears to violate one of the fundamental requirements of indicator measurement—no loss of indicator between injection and measurement. In fact, it has been shown that, provided the injectate is cooled suffi ciently (to less than 10°C), the loss of heat is small and relatively constant and does not affect the accuracy of cardiac output measurement [73–76]. In addition, the loss of heat has been utilized to calculate extravascular lung water, which may be a marker of disease severity in certain states (e.g., acute respiratory distress syndrome) [77,78]. Transpulmonary thermodilution via a commercial system utilizes the theory of Newman to calculate a series of vascular volumes via the mean transit and exponential downslope times of the primary thermodilution curve [79]. These include intrathoracic blood volume and global end diastolic volume, which may be markers of preload, and cardiac function index (stroke volume divided by the global end diastolic volume in the heart), which may provide a measure of contractility. To date little work has been performed in pediatrics validating the usefulness of these parameters, although preliminary adult and animal work is encouraging [71,80–82].
Transpulmonary thermodilution offers two main advantages over pulmonary thermodilution: (1) the need to access the pulmo-nary artery is obviated (all that is required is a central venous and arterial catheters) and (2) a commercially available device (PiCCOTM, Pulsion Medical Systems, Munich, Germany) combines this modal-ity with pulse contour analysis (calibration occurs via thermodilu-tion), thereby representing an application of this technique to the provision of continuous cardiac output.
Dye Dilution
Several dyes have been utilized as the indicator; however, indocya-nine green is the most common. Injection is via a central vein, with measurement from a systemic artery traditionally utilizing a pho-tometric technique. Two main limitations with this method have restricted its clinical application at the bedside. First, the concen-tration-time curve is measured using a densitometer, which requires calibration with samples of the patient’s blood containing known concentrations of the dye—this can be time consuming. Second, measurement typically occurs extracorporeally, meaning that further blood must be withdrawn with each measurement. These two limitations have largely been overcome through the use of fi beroptic sensors utilizing the technique of pulse dye densitome-try, a principle similar to pulse oximetry. Unfortunately, the accu-racy of this technique is questionable at low cardiac output and also within certain patients [83,84]. Finally, because indocyanine green is removed by the liver, recirculation is guaranteed, which restricts the time between successive measurements; obviously, this is exac-erbated in the face of signifi cant hepatic impairment. For these reasons, use of dye dilution has been restricted chiefl y to bench-marking newer modalities of cardiac output measurement.
Lithium Dilution
Use of lithium dilution is a relatively recent innovation with ionic concentration as the indicator [85,86]. The ion used is lithium (injected as lithium chloride). Measurement occurs via a blood pump attached to the patient’s arterial line, which transports the blood through a fl ow-through cell containing a lithium-selective electrode. The electrode contains a membrane that is selectively permeable to lithium ions, with change in voltage across the mem-brane being related to change in lithium ion concentration via the Nernst equation. Limitations are similar to those with dye dilution in that blood sampling is required with every measurement and rapid repeated measurements are not possible (however, the time between injections is much less than that for the dye method). It is also thought that several drugs may interfere with readings, on the basis of their charge. Although this has proven accurate in pediat-ric patients [87], it is not currently licensed for patients weighing less than 40 kg.
The Fick Principle
Originally described in 1870, the Fick principle calculates fl ow by measuring the amount of indicator added (or removed) from a system divided by the change in indicator concentration upstream and downstream of where the indicator is added (or removed) (Figure 2.4) [88]. Calculation of systemic cardiac output may utilize one of two indicators: either O2 (systemic oxygen consumption) or CO2 (systemic carbon dioxide production), with upstream and downstream representing the systemic arterial and mixed venous sites, respectively. When these variables are measured directly, this is known as the direct Fick technique. Although accurate, the Fick principle has several sources of error and limitations, which are elaborated later. The following discussion refers primarily to the Fick calculation utilizing oxygen consumption rather than carbon dioxide production.
Oxygen Consumption Measurement
Oxygen consumption measurement relies on the assumption that oxygen consumption by the body is in equilibrium with oxygen uptake in the lung [89]. Traditionally, the Douglas bag or spirome-
Concentrationof indicator
IN
O2 contentAorta
O2 contentMixed
venous
Concentrationof indicator
OUTFlow
Amount of indicator added
Oxygen consumption
Cardiac output
FIGURE 2.4. Generalized representation of the Fick principle. It is assumed that the system is in steady state. Flow = amount of indicator added/change in indicator concentration; in the case of cardiac output, this equation becomes Cardiac output = oxygen consumption/change in oxygen content between aorta and mixed venous blood.

18 S.M. Tibby
try has been used to measure oxygen uptake; however, both are impractical in the PICU environment. Now, portable metabolic monitors exist that utilize a gas dilution principle to measure fl ow, a fast-response paramagnetic differential O2 sensor to measure change in oxygen concentration, and an infrared CO2 sensor [90,91]. If fl ow and differential concentrations are known, content can be calculated via the Haldane transformation. Newer metabolic moni-tors are accurate within the pediatric range of oxygen consump-tion, CO2 production, and gas fl ow, provided four conditions are met [91–94]:
1. There must be no loss of expired gas. This means that the technique is invalid in the face of a pneumothorax with a chest drain or if air leak occurs around the tracheal tube [95]. Several authors have suggested that the error may be acceptable in the absence of an audible leak [96], although this is controversial [97]. Others have claimed that the error may be acceptable if the mea-sured leak is less than 5% of expiratory tidal volume. However, signifi cant air leak is common [98] and may be diffi cult to quantify in an infant, given the inaccuracy of tidal volume measurement in most mechanical ventilators [99]. Thus, a cuffed tracheal tube is recommended.
2. The partial pressure of water vapor within the system must be carefully controlled. Newer metabolic monitors use specialized tubing (e.g., Nafi on) that equalizes the water vapor concentration of gas inside and outside the machine.
3. Conversion of gas volumes to standard conditions. Again, this occurs in all modern monitors.
4. Limitation of the fraction of inspired oxygen. When the FiO2 is very high, for example, in the face of signifi cant lung disease, the difference between the fraction of inspired and expired oxygen may be very small. This creates an error in the denominator of the Haldane algorithm. Ideally the FiO2 should be less than 0.60; at levels greater than 0.85, the error is likely to be large [100,101].
A fi nal source of error relates to oxygen consumption by the lung itself, which may occur with signifi cant lung pathology. The numerator in the Fick equation is systemic oxygen consumption; however, the metabolic monitor measures total oxygen consump-tion, that is, consumption by both the body and the lungs. In health, the majority of the pulmonary oxygen consumption occurs via the bronchial vessels, which can be regarded as being of systemic origin. However, in disease states, signifi cant pulmonary oxygen consumption can occur within the lung from the blood supplied by the pulmonary (right-sided) circulation as well. This means that oxygen consumption as measured by the metabolic monitor will overestimate systemic oxygen consumption and hence cardiac output. An animal model using pneumococcal pneumonia has esti-mated this error to be of the order of 13%–15% [102]. A similar fi nding has been demonstrated in ventilated premature neonates at risk for chronic lung disease [103]; however, this is not seen in adults with pneumonia [104].
Arterial and Mixed Venous Oxygen Content
Oxygen content is a function of hemoglobin and dissolved oxygen and is calculated via the formula:
O2 content [1.34 × Hg (g/L) × %saturation/100] (mL O2 per L blood) = + [PaO2 (mmHg) × 0.003]
Normally, the contribution from dissolved O2 is minimal and can be ignored without producing signifi cant error. However, this is not
the case when the PaO2 is very high (e.g., a patient without signifi -cant lung disease who is receiving an FiO2 >0.30). Mixed venous sampling requires accessing the pulmonary artery, as blood taken from within the right atrium may inadvertently sample desaturated coronary sinus blood. Finally, oxygen saturation must be measured via a co-oximeter and not calculated from the blood gas PO2 value.
Presence of Anatomic Shunt
The Fick equation can potentially allow for cardiac output estima-tion in the setting of an anatomic shunt [105]. This may be unreal-istic at the bedside, however, for two reasons: shunting is often bi-directional, and calculation may require blood sampling pre- and post-shunt. To understand these concepts, it is necessary to apply the Fick equation to both the systemic (Qs) and pulmonary (Qp) blood fl ows. The formulas are the following:
QVO
C CQ
VOC C
S2
aorta mixed venousP
2
pulm vein pulm artery
=−
=−
where C refers to the oxygen content in the respective sites. Thus, in the absence of anatomic shunt, Qs = Qp. This means that the for-mulas are essentially interchangeable, as mixed venous blood is sampled from the pulmonary artery, and oxygen content in the pulmonary veins and systemic arteries are the same (ignoring the small right-to-left shunt that occurs from bronchial venous and thebesian drainage). However, in the setting of left-to-right shunt (e.g., with a large ventricular septal defect), blood in the pul-monary artery is highly saturated; thus, mixed venous sampling must occur proximal to the site of mixing. Options include right atrial sampling or a weighted average of superior and inferior vena caval blood (weighting to refl ect the assumed proportion of total venous return from each caval vessel, which is age dependent) [106]. In reality, both methods may be inaccurate. Conversely in the setting of a right-to-left shunt, systemic arterial blood is less saturated than pulmonary venous, and so Qp can only be cal-culated if pulmonary venous blood is sampled. Finally, these two formulas can be combined to provide a ratio of pulmonary to sys-temic blood fl ow:
Q : QC C
C CP S
aorta mixed venous
pulm vein pulm artery
= −−
Indirect Fick Principle
If the Fick principle is applied to CO2 production, it may be possible to estimate the Fick parameters indirectly from the inspired and expired gases using a CO2 rebreathing technique, whereby the patient rebreathes exhaled CO2 for a short period of time while mechanically ventilated [107,108]. Here the Fick equation relates to pulmonary capillary blood fl ow (in essence, effective or nonshunt blood fl ow) rather than total pulmonary blow. By measuring change in the parameters before and at the end of the CO2 rebreathing period, pulmonary capillary blood fl ow is calculated from the fol-lowing formula:
QVCO
C Cpcbf
mixed venous pulmonary end capillary
= ΔΔ − Δ
2
In this equation, (1) ΔVCO2 is measured; (2) it is assumed that a brief rebreathing period does not change mixed venous CO2, hence

2. Hemodynamic Monitoring 19
ΔVCO2 is zero; and (3) ΔCpulmonary end capillary is estimated from alveolar CO2 content, which is in turn estimated from end-tidal PCO2 via a correction factor. Intrapulmonary shunt fl ow is calculated from Nunn’s iso-shunt diagrams [109] and added to pulmonary capillary blood fl ow, giving total pulmonary blood fl ow. As can be seen, this technique relies on a series of assumptions, which may limit its validity in the PICU setting [110–112].
Doppler Ultrasound
In 1961, Franklin applied the Doppler principle to measurement of blood fl ow [113]. The principle states that the frequency shift of refl ected ultrasound will be proportional to the velocity of the refl ecting blood cells, and is related by the following formula:
Blood velocityfreuqency c
ft
= Δ ×× ×2 cos θ
where Δfrequency is the frequency shift between transmitted and refl ected signal, c is the sound velocity in blood, ft is the transmit-ting frequency, and q is the angle of insonation (i.e., between the beam and blood fl ow). Doppler ultrasound signals may be continu-ous or pulsed. Continuous signals react to all fl ow within their path so that the point at which blood velocity is measured is unknown; this is known as range ambiguity. Pulsed signals allow for adjust-ment of the sampling depth and volume but may be prone to errors in calculation of velocity because of the relationship between the frequency (and hence wavelength) of the transmitted signal and the velocity being measured (this phenomenon is called aliasing). In essence, the chosen frequency represents a trade-off between veloc-ity measurement and image resolution [114].
Doppler ultrasound can be applied to any pulsatile blood vessel, although measurement of cardiac output is typically performed in the aorta via either the transthoracic or the transesophageal approach (the latter allowing for continuous measurement) [115]. Spectral representation of the velocity-time signal characteristi-cally shows a triangular shape from which a variety of fl ow-related variables can be derived (Figure 2.5) [116,117]. The integral of velocity-time (area under the triangle) represents stroke distance, the distance that a column of blood will travel along the aorta in one cardiac cycle. Stroke distance is not stroke volume; conversion of the former to the latter requires multiplication by left heart outfl ow area. This can be achieved in two ways—either echocar-diography [118] or a nomogram [117,119,120]. Both methods carry advantages and disadvantages.
Echocardiography, either two dimensional or M mode, can be used to calculate outfl ow tract area at a variety of sites, including aortic valve annulus, aortic root, and ascending aorta. Of these, measurement at the valve annulus in systole via two-dimensional mode appears the most accurate, producing a variation coeffi cient of approximately 6% [121,122]. Echocardiography in children can often be performed transthoracically, which is obviously less inva-sive than via the transesophageal route. In addition to providing a means of acquiring cardiac output, echocardiography, in the hands of a skilled operator, also supplies a vast amount of functional and morphologic information, including indices of diastolic dysfunc-tion, regional wall abnormalities, valve regurgitation, pericardial effusion, chamber dilatation, and cardiac chamber interdepen-dence. The main disadvantage of echocardiography is the require-ment for signifi cant user expertise.
Conversely, Doppler ultrasound requires little in the way of user training and thus can be performed by any trained intensive care
unit practitioner [123]. Here, left heart outfl ow area is estimated via a nomogram. Not surprisingly, the assumptions inherent in the nomogram produce an error in cardiac output unique to each patient, although changes in cardiac output are tracked accurately [119,124]. Of the two modes, transesophageal Doppler has greater intra- and interuser agreement [125] because the aorta lies approximately parallel to the esophagus, allowing the angle of insonation to be fi xed at 45° and adjusted for. Unfortunately, probe fi xation is a signifi cant problem in pediatrics; both probe rotation and vertical movement can occur, resulting in signal alteration. For this reason, this modality cannot be considered as truly continu-ous. Transthoracic Doppler allows both the aortic and pulmonary outfl ows to be estimated via separate nomograms; however, the angle of insonation is unknown, and the coeffi cient of variation is generally higher than that for transoesophageal Doppler [125]. More recently, a Doppler-based technique known as surface inte-gration of velocity vectors, has been reported in animals with encouraging results [126]. This technique utilizes multiplanar Doppler sampling, which is reconstructed to a three-dimensional fl ow fi eld [127]. Measurements take between 2 and 8 minutes to perform.
Impedance/Conductance Methods
Impedance is the opposition to the fl ow of an alternating current and can be defi ned using Ohm’s law in the same manner as resis-tance for direct current:
Impedance Zpotential difference Valternating current
( ) =( )II
Resistnace Rpotential difference V
direct current
( )
( ) =( )
II( )
Velo
city peak velocity
FTc
stroke distance
Time
Hemodynamic state
contractility
afterload
hypovolemia
FTc +/–
FTc ++
FTc ++
peak velocity ++
peak velocity +
peak velocity +/–
Effect on doppler parameter
FIGURE 2.5. Spectral representation of a Doppler velocity-time signal, showing effects of differing hemodynamic states. The area under the triangular waveform is stroke distance, which represents the distance a column of blood will travel down the descending aorta in one cardiac cycle. Peak velocity is affected predominantly by changes in contractility and to a lesser extent by changes in preload and afterload. Corrected flow time (FTc) represents the systolic time corrected to a heart rate of 60 beats per minute. This parameter may be reduced in the face of diminished preload (e.g., hypovolemia) or an increased afterload. Both states can also decrease the peak velocity; they may be differentiated, however, on the basis of response to a fluid challenge.

20 S.M. Tibby
Admittance is the reciprocal of impedance; conductance is the reciprocal of resistance. Although described in relation to the cardiac cycle in 1953 [128]. In 1966, Kubicek et al. were the fi rst to apply this principle to the measurement of cardiac output [129]. Here, the chest is regarded as a conductor whose impedance is altered by the changes in blood volume and velocity that occur with each heartbeat; from this, stroke volume is calculated. Impedance is measured via a series of voltage-sensing and current-transmit-ting electrodes. Alternating rather than direct current is used to achieve charge balancing and thus avoid any residual polarization at the interface between electrode and tissue, which would result in an increase in measured impedance [130]. The site of electrode placement defi nes the type of impedance measurement, from the noninvasive (thoracic bioimpedance, where electrodes are placed on the chest) to the highly invasive (intracardiac requiring elec-trode placement within the left ventricle).
Thoracic Impedance
A series of electrodes are placed at fi xed intervals around the chest wall, and stroke volume is calculated with the following formula:
stroke volumeL VET dZ dt
Zmax
0
= × ××
3
4 25.
where L is thoracic segment length, VET is ventricular ejection time, dZ/dtmax is maximum rate of impedance change, and Zo is transthoracic baseline impedance. It is now known that the volume change sensed by thoracic bioimpedance is almost exclusively extracardiac, as the myocardium tends to shield the electrodes from the impedance changes occurring within the ventricle. Thus, the change in impedance signal, and hence stroke volume estima-tion, comes predominantly from blood volume alterations within the systemic and pulmonary vessels inside the chest [131,132]. Tho-racic bioimpedance is not widely used in the clinical setting; indeed, several authors have expressed concern at the accuracy of this method in the intensive care unit environment, particularly at states of low cardiac output, hypotension, and chest wall edema [133–136].
Intracardiac Impedance
Stroke volume is measured from catheters placed directly into the left ventricle. Accuracy is increased by utilizing multipolar cathe-ters, which partition the ventricle into a series of cylindrical seg-ments [137]. Several studies have reported a small but consistent underestimation of stroke volume, perhaps because of simultane-ous conductance into surrounding tissues (atria, myocardium); this may be improved via a correction factor [138–140]. The inva-siveness of this technique means that use in the intensive care unit is effectively impossible, apart from when catheters are placed during cardiac surgery. Nonetheless, this technique can also provide valuable information concerning myocardial systolic func-tion via either end systolic elastance calculation or preload recruit-able stroke work [141–144]. The latter technique involves plotting the pressure–volume curves after manipulation of preload (typi-cally reducing preload via progressive caval snaring). The area within the pressure–volume loop represents stroke work; when this is plotted against end diastolic volume, the slope of this relation-ship is termed preload recruitable stroke work and is a load-inde-pendent measure of contractility [143]. These techniques have provided insight into previously unsuspected degrees of cardiac
dysfunction after relatively short periods on cardiopulmonary bypass [145]. Recently, a less invasive modifi cation of this tech-nique, known as transcardiac conductance, has been described [146]. Here, the current transmitting electrodes are placed in the superior vena cava just above the right atrium and in an epithoracic position just lateral to the xyphisternal joint. Voltage sensing elec-trodes are placed epithoracically, in the position of standard elec-trocardiographic electrodes. A correction factor is applied to account for parallel conductance outside the heart. Several meth-odologic problems exist, such as interindividual and cardiac phase variabilities, along with the need to calibrate absolute stroke volume with another invasive method; however, this may be a promising new technique. To date this method has not been evalu-ated in children.
Arterial Pulse Contour Analysis
A century ago, Erlanger and Hooker suggested a relationship between stroke volume and arterial pulse contour [147]. The advent of fast computer microprocessors has meant that a variety of pulse contour systems are now commercially available that estimate beat-to-beat changes in stroke volume. Interestingly, all utilize dif-ferent techniques for pulse contour analysis; this is in part because of differing theories concerning both the relationship between fl ow and pressure within the arterial system and the mechanism of pulse wave transmission along the arterial tree [1,148–150]. In addi-tion, the majority of commercial systems estimate only beat-to-beat change in cardiac output, thus requiring initial calibration via an alternative method of cardiac output measurement.
An appreciation of several basic concepts and terminology is a prerequisite for understanding pulse contour analysis—in essence, how a volume change supplied from the left ventricle translates into a pressure change within the arterial system [1]. Both fl ow and pressure are primarily pulsatile events in the proximal arterial system and do not achieve nonpulsatile or mean values until the level of the arterioles. Resistance to fl ow occurs in both the large and small arteries; in the vessels receiving pulsatile fl ow, this is called impedance; for those receiving nonpulsatile fl ow, this is des-ignated as resistance (also known as systemic peripheral resistance). The largest pressure drop occurs across the arterioles. In addition, arteries contain variable amounts of elastic tissue; in the largest vessels, such as the aorta, this means that they can expand to store volume (compliance) and contract in relation to the downstream load (elastic recoil). The relationship between stress (force applied to the arterial wall) and strain (reaction of the arterial wall to the stress applied) has traditionally been represented using a propor-tionality constant known as Young’s modulus of elasticity. This in turn affects wave velocity via the following formula:
wave velocityE h= ×× ×2 ρ r
where E is Young’s modulus, h is vessel wall thickness, ρ is fl uid density, and r is radius. The phenomena of compliance and elastic recoil within the aorta partially explain the continuation of blood fl ow within small arteries after systole has terminated. In the aorta, compliance is nonlinear (as is impedance), meaning that the pres-sure change for a given volume ejected by the heart will vary according to both the diastolic arterial pressure (and hence periph-eral resistance) and stroke volume. This relationship, as well as the pressure wave refl ected from the periphery back to the aorta,