Embed Size (px)
Citation preview


Cardiology TODAY
VOLUME XXII No. 6NOVEMBER-DECEMBER 2018
PAGES 189-228
Rs. 1700/- ISSN 0971-9172 RNI No. 66903/97
www.cimsasia .com
MANAGING DIRECTOR & PUBLISHERDr. Monica Bhatia
EDITOR IN CHIEFOP Yadava
SECTION EDITORSSR Mittal (ECG, CPC), David Colquhou n (Reader’s Choice)
NATIONAL EDITORIAL ADVISORY BOARDArun K Purohit, Arun Malhotra, Ashok Seth, Ashwin B Mehta, CN Manjunath, DS Gambhir, GS Sainani, Harshad R Gandhi, I Sathyamurthy, Jagdish Hiremath, JPS Sawhney, KK Talwar, K Srinath Reddy, KP Misra, ML Bhatia, Mohan Bhargava, MR Girinath, Mukul Misra, Nakul Sinha, PC Manoria, Peeyush Jain, Praveen Jain, Ramesh Arora, Ravi R Kasliwal, S Jalal, S Padmavati, Satyavan Sharma, SS Ramesh, Sunil Kumar Modi, Yatin Mehta, Yogesh Varma, R Aggarwala.
INTERNATIONAL EDITORIAL ADVISORY BOARDAndrew M Tonkin, Bhagwan Koirala, Carlos A Mestres, Chuen N Lee, David M Colquhoun, Davendra Mehta, Enas A Enas, Gerald M Pohost, Glen Van Arsdell, Indranill Basu Ray, James B Peter, James F Benenati, Kanu Chatterjee, Noe A Babilonia, Pascal R Vouhe,Paul A Levine, Paul Simon, P K Shah, Prakash Deedwania, Salim Yusuf, Samin K Sharma, Sanjeev Saxena, Sanjiv Kaul, Yutaka Imoto.
DESK EDITORGandhali
DESIGNER A run Kharkwal
OFFICES CIMS Medica India Pvt Ltd(Previously known as UBM Medica India Pvt Ltd.)Registered OfficeMargosa Building, No. 2, 3rd Floor, 13th Cross, Margosa Road, Malleshwaram, Bengaluru -560 003 Karnataka, IndiaTel: +91-80-4346 4500Fax: +91-80-4346 4530
Corporate OfficeBoomerang (Kanakia Spaces), Wing-B1, 403,4th Floor, Chandiwali Farm Road, ChadiwaliPowai, Mumbai - 400 072Tel.: +91-22-6612 2600 Fax : +91-22-6612 2626
Regional Off ice709, 7th Floor, Devika Tower, Nehru Place, New Delhi-110 019, India. Tel: +91-11-4285 4300Fax: +91-11-4285 4310
EDITORIALAll That Glitters is Not Gold 191OP YADAVA
REVIEW ARTICLEHypertension Case Study 193PEEYUSH JAIN, ASHOK SETH
REVIEW ARTICLEEchocardiographic Evaluation of Prosthetic Heart Valve; special reference to TEE and 3D echo 197ASHOK K OMAR, RAHUL KUMAR
REVIEW ARTICLEMechanism of Hypertension 213ALPANA RAIZADA, SHRIDHAR DWIVEDI
Cardiology Today VOL.XXII NO. 6 NOVEMBER-DECEMBER 2018 189

FOR MARKETING QUERIESAparna Mayekar: +91-9930937020+91-22-6612 [email protected]
FOR EDITORIAL QUERIESDr Gandhali : +91-22-6612 [email protected]
©2018 CIMS Medica India Pvt Ltd (Previously known as UBM Medica India Pvt Ltd) Copyright in the material contained in this journal (save for advtg. and save as otherwise indicated) is held by CIMS Medica India Pvt Ltd Margosa Building, No. 2, 3rd Floor, 13th Cross, Margosa Road, Malleshwaram, Bengal uru-560 003, Karnataka, India. All rights reserved. No part of this publication may be reproduced, stored in a retrieval system or transmitted in any form or by any means, electronic, photocopying or otherwise, without prior permission of the publisher and copyright owner.
The products and services advertised are those of individual advertisers and are not necessarilty endorsed by or connected with the publisher or with Cardiology Today or CIMS Medica India Pvt Ltd. Cardiology Today does not guarantee, directly or indirectly, the quality or efficacy of any product or services described in the advertisements in this issue, which are purely commercial in nature.
The editorial opinions expressed in this publication are those of individual authors and not necessarily those of the publisher. Whilst every effort has been made to ensure the accuracy of the information in this publication, the publisher accepts no responsibility for errors or omissions.
For reprints (minimum order: 500) contact the production Department. Further copies of Cardiology Today are available from CIMS Medica India Pvt Ltd, 709, Devika Tower, Nehru Place, New Delhi-110 019, India.
Cardiology Today is Published and Printed by CIMS Medica India Pvt Ltd, Margosa Building, No. 2, 3rd Floor, 13th Cross, Margosa Road, Malleshwaram, Bengaluru - 560 003, IndiaTel: +91-80-4346 4500 (Board); Fax: +91-80-4346 4530
Printed at Modest Print Pack (P) Ltd., C-52, DDA Sheds Okhla Industrial Area, Phase-I, New Delhi-110 020.
ECG OF THE MONTH'U' wave 218SR MITTAL
PICTORIAL CMEPoland Syndrome with Dextrocardia and Partial Agenesis of Ribs in Left Hemithorax 225MONIKA MAHESHWARI
VOLUME INDEXAUTHORS INDEX 226
190 Cardiology Today VOL.XXII NO. 6 NOVEMBER-DECEMBER 2018
EDITORIAL

Cardiology Today VOL.XXII NO. 6 NOVEMBER-DECEMBER 2018 191
All That Glitters is Not Gold
EDITORIAL
Lately accreditation labels have become unique selling propositions (USPs) for corporate and private sector hospitals. The certification is flaunted with gay abandon to attract patients and claim superiority over contemporaries. In fact encashing on the embedded Indian psyche and mentality favouring anything foreign, corporate hospitals have gone beyond their means to seek the accreditation of the Joint Commission International (JCI) of United States of America (USA). The moot question however is whether the accreditation process helps improve outcomes and deliver better care for the patients?
If a recent study from Brigham and Women’s Hospital and the Harvard TH Chan School of Public Health, Boston is to be believed, then the answer is a clear ‘No’.1 When Lam et al. compared patient outcomes in form of mortality, 30 day readmission or improved patient experience, they found no difference between hospitals accredited by Joint Commission as opposed to those reviewed by a state accreditation body.1 In fact surprisingly patient experience scores were numerically better at hospitals accredited by state agencies (3.4 versus 3.2; P - 0.06). This assumes significance when seen in the light of the fact that these accreditation processes are both time and labour intensive, besides being prohibitively costly. It is estimated that the commission fees for an inspection was US dollar 18,000 in 2015 on top of an annual fee of up to US dollar 37,000.
A lot of times additional manpower mandated by these inspections, as also the infrastructural changes, are not practically relevant and add to wasteful and frivolous expenditure for a hospital, which no doubt is ultimately passed on to the patient in one form or the other. This becomes all the more relevant for a developing and poor country like India where patients have to spend upwards of 85% of medical expenses out of their own pockets. The western benchmarks are not relevant to India but unfortunately Indian accreditation agencies like NABH and NABL have adopted a lot of those parameters without sparing a thought on their relevance to Indian scenario. Even the infrastructural requirements mandated by commissions like Joint Commission Internationa of USA are impossible to meet in Indian scenario.
Thus just as when we talk of cost containment, the accreditation mania leads to escalation of costs, sans any meaningful advantage in hard endpoints of patient outcomes. To meet the complex requirements of these accrediting bodies and to understand and decipher the various jargons used by them, most hospitals employ
DR. OP YADAVACEO and Chief Cardiac Surgeon
National Heart Institute,New Delhi

192 Cardiology Today VOL.XXII NO. 6 NOVEMBER-DECEMBER 2018
a professional agency to help them sail through this rather arduous journey, thereby surreptitiously contributing to a multi-million dollar bustling and thriving industry.
It’s therefore time that we have a good relook at the need and the content of the accreditation process and lay down the minimum criteria, keeping the ground realities in mind. The extra fiscal resources allocated to accreditation can only be justified if these translate into improved patient outcomes which are measurable, verifiable and reproducible.
REFERENCE1. Lam MB, Figueroa JF, Feyman Y et al. Association between patient outcomes and
accreditation in US hospitals: observational study. Br Med J 2018;363:k4011.
Cardiology Today VOL. XXII NO. 6 NOVEMBER-DECEMBER 2018 193
Hypertension Case Study
REVIEW ARTICLE
PEEYUSH JAIN, ASHOK SETHKeywords z hypertension z cardiovascular risk z home blood pressure monitoring
Dr. Peeyush Jain is Head, Dept. of Preventive Cardiology, Fortis Escorts Heart Institute, New Delhi, India; and Dr. Ashok Seth is Chairman Cardiology, Fortis Escorts Heart Institute, New Delhi, India
AbstractHypertension is a common problem in the elderly population. In this case report, the 76-year-old patient is having uncontrolled hypertension, diabetes, and renal dysfunction. Previously patient was treated with atenolol, amlodipine, and indapamide sustained release for the past three years. But blood pressure (BP) is varying between 156-168/76-88 mmHg. For such patients home blood pressure monitoring is advisable and desirable control on BP is required to minimize the cardiovascular complications. Overall, controlling the BP is art and science which need right medication, doses, timing, and lifestyle modifications.
CASEA 76 years old patient with diabetes mellitus and hypertension receiving atenolol, amlodipine, and indapamide sustained release for last 3 years has been referred for further BP management. In GP’s clinic, BP is found to vary between 156-168/76-88 mmHg. In hospital OPD, BP is 174/96 mmHg, checked twice. Hb 10.5 g/dl, BU 52 mg/dl, Serum Creatinine 1.6 mg/dl, Serum Na+ 138 mmol/L, K+ 3.4 mmol/L. Patient is advised home blood pressure monitoring (HBPM). Two weeks later self-monitored BP 140-146/72-84 mmHg (morning) and 154-172/68-96 mmHg (evening).
DISCUSSION This patient is at very high-risk of future
cardiovascular events because of age, uncontrolled hypertension, diabetes mellitus, and renal dysfunction (Table 1, ESH/ESC 2018 Guidelines for Hypertension Management).1 Therefore his blood pressure needs to be controlled meticulously.
The first step in effective blood pressure management is accurate measurement of blood pressure. While this a diagnosed case of hypertension, misdiagnosis of hypertension is very frequent and due to several biological and patient, environment, equipment, and method-related factors (Table 2).
Methodological issues apart, a recent confounding factor of major importance is varying definitions of hypertension suggested by different

194 Cardiology Today VOL. XXII NO. 6 NOVEMBER-DECEMBER 2018
hypertension organizations and even by same organization within a short span of time (Table 3). This is an issue that can be discussed at length without consensus but there are some arguments against lowering of diagnostic threshold of hypertension to 130/80 mmHg (Table 4).
Let us say for the purposes of this discussion that a more suitable diagnostic threshold for hypertension is 140/90 mmHg. So what are his BP targets? European guidelines suggest a BP target for such a patient as 130-139/70-79 mmHg (Table 5).
An important consideration at this point is the choice of antihypertensive drug therapy. It is prudent to optimize antihypertensive medication and try to achieve office BP target by the end of next one month or so. Both atenolol and amlodipine do not seem to be the best choice in this patient. Limitations of atenolol are its low efficacy, poor excretion in presence of low GFR and propensity to aggravate glucose intolerance. A better choice is an ACE-I/ARB and if there is a compelling indication for beta blocker, carvedilol due to its vasodilating property. Amlodipine is limited by theoretical possibility to raise intra-glomerular pressure due to selective dilatation of afferent arterioles and may be substituted by benidipine or cilnidipine both of which dilate afferent as well as efferent arterioles. Mild hypokalemia due to indapamide in this patient may be counteracted by addition of ACE-I/ARB, potassium rich diet, or MRA if this patient proves to be resistant in future. Substituting chlorthalidone or other thiazide diuretic does for indapamide does not seem to be desirable as these may be cause even more intensive hypokalemia
(Table 6). Let us assume that office blood
pressure has been reasonably controlled by above changes in medication. This may take at least a month or may be more. But there are other issues related to blood pressure that need further attention. One
of the foremost is whether controlling office blood pressure is enough. Several studies have shown that blood pressure control improves with HBPM. Secondly, 4 out of 5 studies that compared HBPM with office BP concluded that HPB is a better predictor of cardiovascular
REVIEW ARTICLE
Table 1: Cardiovascular Risk Assessment in Hypertension Blood Pressure (mmHg)
High Normal (130-139/85-89) Grade 1 (140-59/90-99) Grade 2 (160-179/100-109) Grade 3 (>180/110) No other renal failure Low Risk Moderate Risk High Risk1-2 renal failure Low Risk Moderate Risk Moderate-High Risk High Risk >3 renal failure Low-Moderate Risk Moderate-High Risk High Risk High Risk OD, CKD Stage 3 or
Diabetes
Moderate to High Risk High Risk High Risk High-Very High Risk
Symptomatic CVD, CKD
Stage >4 or DM with
OD /renal failures
Very High Risk Very High Risk Very High Risk Very High Risk
Table 2: Pitfalls in measurement and interpretation of blood pressureExample (s)
Biological phenomenon-related Regression to the mean Patient-related Sleep deprived Environment-related Cold ambient temperature Equipment related Non-calibrated
Air leaksMethod-related Fast bleed rate
Missing auscultatory gap
DBP Phase IV or V?
Single readingPersonnel-related Terminal digital preference
Interpretation-related Definition of hypertension
Table 3: Definition of Hypertension: European or American GuidelinesESH/ESC 20181 AHA/ACC 20172
SBP (mmHg) DBP (mmHg) SBP (mmHg) DBP (mmHg)
Office BP >140 and/or >90 >130 and/or >80
ABPM 24h Average >130 and/or >80 >125 and/or >75Day Average >135 and/or >85 >130 and/or >80
Night Average >120 and/or >70 >110 and/or >65
HBPM >135 and/or >85 >130 and /or >80
Table 4: Some arguments against lowering of diagnostic threshold for hypertension to 130/80 mmHg
• It has huge public health implications.
• A considerable number of low-risk people shall be treated pharmacologically without
benefit.
• At times it is not possible to reduce blood pressure to such low levels without
unacceptable side effects.
• In some cases, systolic blood pressure cannot be reduced below 140 mmHg without
marked fall in diastolic blood pressure. This is particularly true of elderly with isolated
systolic hypertension.
Abbreviations: ABPM; Ambulatory blood pressure monitoring, HBPM; Home blood pressure monitoring.
Cardiology Today VOL. XXII NO. 6 NOVEMBER-DECEMBER 2018 195
outcomes. HBPM is also helpful in making a diagnosis of white coat hypertension and masked hypertension that is not so relevant in this case. HBPM is particularly useful in elderly and pregnant or CKD patients (Table 7).
For making clinical decisions on the basis of HBPM, the patient should be advised to take ≥ 2 morning readings before medication and 2 evening readings at bedtime every day for 1 week prior to next hospital visit. Discarding the readings of the first day gives a total of 12 readings on which to make clinical decisions. For self-monitoring, patients should take at least two, preferably three readings, and record them all. The interval between can be as little as a minute. Patients need to be educated about the variability of readings. It is important to remember that home blood pressure readings are generally lower than office BP readings and that changes the definition of hypertension and treatment targets also.
For HBPM, fully automated monitors that use the brachial artery for measurements are the most reliable. Documentation can be improved if patients use monitors capable of printing and storing readings. Patient’s monitor should be checked against mercury sphygmomanometer. Oscillometric devices may not work well with patients who have atrial fibrillation or other arrhythmias. An up-to-date list of validated monitors can be found at: www.bhsoc.org/blood_presssure_list.stm (British Hypertension Society)3 or www.dableducational.org.sphygmomanometers_2_sbpm.htm#armtable (Dabl Education Trust).4 One major limitation of HBPM is that it is unable to take into account night-time blood pressure changes (Table 8). Therefore it is unable to estimate true overall 24 hour BP and its circadian variation. Ambulatory blood pressure (ABPM) circumvents these problems and complements the information provided by HBPM (Table 9). It is also able to define effective duration of action of antihypertensive drug(s) objectively.
Ambulatory BP monitoring has revealed that blood pressure changes during sleep differ from person to person.
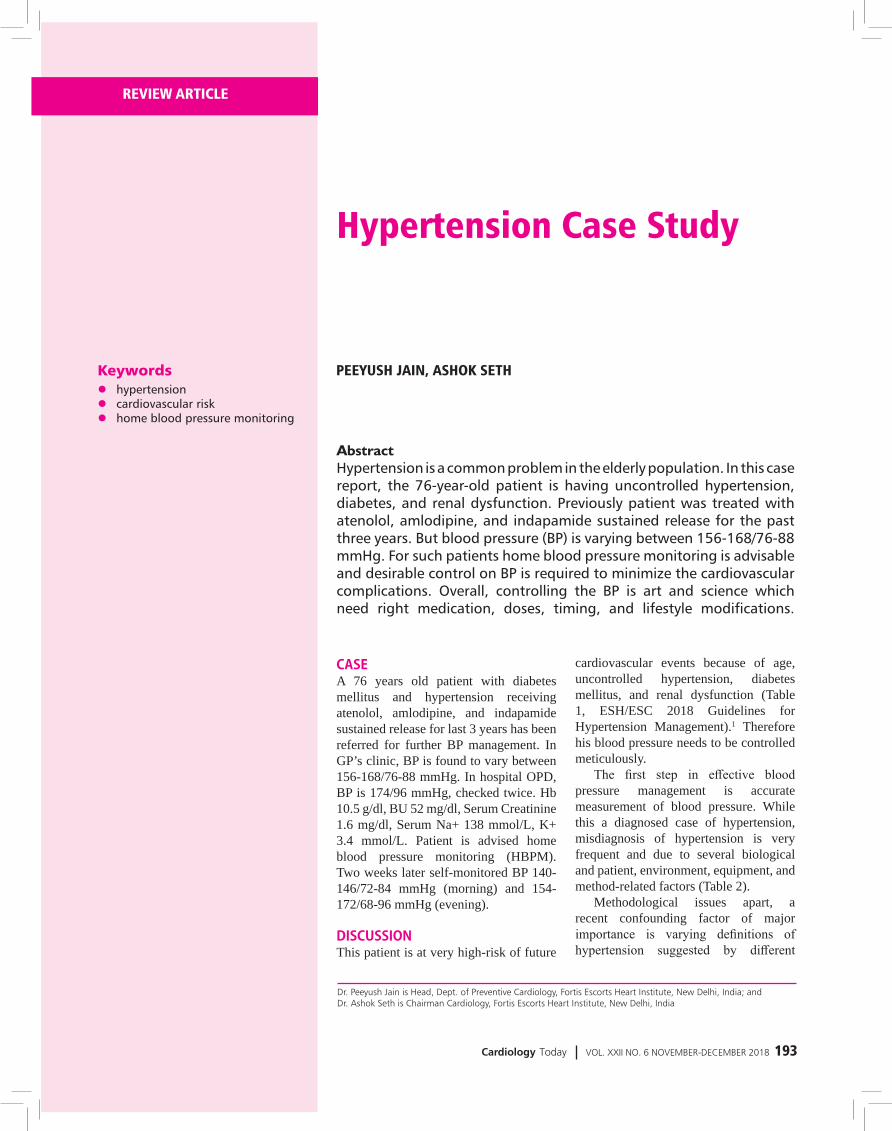
Table 5: Office BP TargetsESH/ESC 20181 AHA/ACC
20172
SBP DBP SBP DBP Age year HTN +DM +Stroke +CAD +CKD 18-65 120-130 if tolerated
130-139
70-79 <130 ?65-79 130-139 if tolerated 70-79 <130 ?>80 130-139 if tolerated 70-79 <130 ?
Table 6: Choosing Antihypertensive Agents in Elderly Diabetes with CKDCurrent Treatment Limitations Alternative Atenolol Low Efficacy
Poor Excretion due to low eGFR
Propensity to aggravate glucose intolerance
ACE-I/ARB or
Carvedilol
Amlodipine Intra-glomerular hypertension
Proteinuria and renal dysfunction
Benidipine
Cilnidipine
Indapamide Mild hypokalemia None
K+ rich diet
+ACE-I/ARB
+MRA if resistant
Table 7: Populations in Whom Home BP Measurement is Specially Useful
Population
Elderly BP variability tends to be high, and white coat hypertension is
common.
Chronic Kidney
Disease
BP may fluctuate a lot and home monitors help with management.
Pregnancy Early detection of pre-eclampsia might be facilitated.
Table 8 Comparison of 3 Main Methods of BP MeasurementFeature OPB ABPM HBPMNo. of Readings Low High Medium White Coat Effect Yes No NoOperator Dependency Yes No NoNight-time BP No Yes NoEarly Morning BP No Yes Yes24 h Variability No Yes YesLong-term BP Variability No No YesWCH and MH Diagnosis No Yes YesReproducibility Low High HighPrognostic Value + +++ ++Hypertension Control Improvement + ++ +++
Table 9: Indications of Ambulatory BP Monitoring
To make a diagnosis of hypertension (major indication)
To rule out borderline hypertension with end-organ damage
To investigate labile/paroxysmal hypertension
To evaluate symptoms possibly related to BP fluctuations, especially orthostasis
To evaluate orthostatic hypotension, autonomic neuropathy, and carotid sinus syncope
To assess adequacy of antihypertensive therapy
Abbreviations: ABPM; Ambulatory blood pressure monitoring, HBPM; Home blood pressure monitoring.
Abbreviations: WCH; white coat hypertension, MH; Masked hypertension

196 Cardiology Today VOL. XXII NO. 6 NOVEMBER-DECEMBER 2018
who exhibit extreme fall in nocturnal blood pressure. (Table 10). Addressing these issues at therapeutic level require changes in the choice, doses, and timings of antihypertensive agents but this is largely an art based on a sound knowledge of the pharmacokinetics of
Normally there should be 10%-20% decrease from daytime BP during sleep. Both non-dipper and reverse dippers carry excessive blood pressure burden. Measures should be taken to reverse these trends to improve clinical outcomes. At the other end of the spectrum are those
antihypertensive drugs. Some practical considerations related to ABPM are summarized in Table 11-13.
SUMMARYThis is a high-risk patient in whom a good control of BP is highly desirable to reduce cardiovascular and renal risk. Two minimum requirements in this patient are (i) right-choice of antihypertensive medication combination and (ii) achievement of office BP targets. Control of office BP alone is not adequate. Minimizing BP burden will require (i) HBPM and its interpretation (ii) adjusting medication choice, dose and timing for night-time and early morning variations in BP. Here, ABPM should help. ABPM may precede HBPM or vice versa. While HBPM may be performed as many times as necessary, ABPM is limited due to cost and convenience. Treatment of high blood pressure is both a science as well as an art. It requires setting reasonable targets, choosing the right medication, doses, and schedules, and monitoring beyond office BP measurement.
REFERENCES1. Williams B, Mancia G, Desormais I, et al. 2018 ESC/ESH
guidelines for the management of arterial hypertension. Presented at: 28th ESH Meeting on Hypertension and Cardiovascular Protection. June 9, 2018. Barcelona, Spain.
2. Whelton PK, Carey RM, Aronow WS, et al. 2017 ACC/AHA/AAPA/ABC/ACPM/AGS/APhA/ASH/ASPC/NMA/PCNA guideline for the prevention, detection, evaluation, and management of high blood pressure in adults. Hypertension. 2017;Epub ahead of print.
3. www.bhsoc.org/blood_presssure_list.stm 4. www.dableducational.org.sphygmomanometers_2_
sbpm.htm#armtable
REVIEW ARTICLE
Table 10: Dipping Status Daytime vs. Nighttime
Average
Significance
Dipper 10-20% dipping Normal
Non-dipper <10% dipping Increased BP burden
Reverse dipper Rise in BP at night Increased BP burden
Extreme dipper >20% dipping Cognitive impairment
Anterior ischaemic optic atrophy
Table 13: Office vs. HBP and ABPClinic HBPM Daytime ABPM Nighttime ABPM 24-hour ABPM
120/80 120/80 120/80 100/65 115/75130/80 130/80 130/80 110/65 125/75140/90 135/85 135/85 120/70 130/80160/100 145/90 145/90 140/85 145/90
Table 11 Contraindications/Barriers to ABPMNot cooperative/Unwilling
Severe office hypertension (≈220/120)
Arm too big (above 48-50 cm)
Severe peripheral vascular disease or thrombocytopenia
Table 12 Practical Considerations in ABPMUse a proper sized cuff.
Use the non-dominant arm unless the dominant arm has 10 mmHg or greater BP.
Test an initial reading to be sure it’s working.
Have the patient keep a diary.
Adjust the settings to correspond to bedtime and time awake.
Ask them to stop and stand still when a reading is being taken if possible.
Go about their daily routine but ask them not to exercise.
REVIEW ARTICLE

Cardiology Today VOL. XXII NO. 6 NOVEMBER-DECEMBER 2018 197
Echocardiographic Evaluation of Prosthetic Heart Valve; special reference to TEE and 3D echo
REVIEW ARTICLE
ASHOK K OMAR, RAHUL KUMAR
Keywords z prosthetic heart valve z transthoracic echocardiogram z transesophageal echocardiogram z homograft z regurgitation
Dr. Ashok K Omar is Director Non Invasive Cardiology, Dr. Rahul Kumar is DNB Cardiology Student at Fortis Escorts Heart Institute New Delhi
AbstractIn the last five decades multiple different models of prosthetic valves have been developed. The purpose of this article is to provide a comprehensive source of information for the types and the echocardiographic evaluation of the prosthetic heart valves.
INTRODUCTIONFirst successful artificial heart valve was implanted in year 1960. The evaluation of prosthetic heart valves remained a challenge since their utilization for five decades. This is partly due to different variety of prosthetic heart valves (PHV) and their unique features. Worsened condition of PHV patients is not always due to dysfunction of PHVs, instead it may be due to progressive left or right ventricular failure, arrhythmias pulmonary hypertension etc. These conditions and acoustic shadows and artefacts during echocardiography made heart valves evaluation one of the difficult subject for echocardiography. Science is evolving from the beginning, we are having newer and advanced techniques for PHVs evaluation.
Among PHVs, almost all are obstructive in nature due to their own structure and it is difficult to differentiate it from pathological obstruction. Trivial or mild regurgitation through the valves is usually present which is normal but the pattern differs among the different types of valves. Although PHV dysfunction is rare but it may be potentially life threatening. Thus, it is very essential to establish the exact cause of PHV dysfunction so as to plan the appropriate management of the patient. To detect the cause and extent of PHV dysfunction, a comprehensive approach which integrates different parameters of morphology and function assessed by 2D TTE (Transthoracic Echocardiogram), TEE (Transesophageal echocardiogram) and 3D echocardiography is mandatory. Other

198 Cardiology Today VOL. XXII NO. 6 NOVEMBER-DECEMBER 2018
tools for diagnosing PHV dysfunction are cinefluoroscopy, multidetector CT, cardiac magnetic resonance imaging (CMR) and nuclear imaging.
Although the first-line imaging of PHV evaluation is 2 D TTE. However due to shadowing and reverberation artifacts, a complete assessment cannot be done without adding TEE, which allows more detailed assessment about cusps calcification, vegetations, thrombus, pannus and leaflet mobility. Absence of interference with lungs and ribs make TEE a good choice for PHV evaluation. A very detailed image can be obtained of the atrial side of mitral PHV and of the posterior part of the aortic PHV. Anterior part of the aortic prosthesis is often obscured by acoustic shadowing from the prosthetic material and is often better seen by TTE.
Earlier techniques to reconstruct 3D images enabled improved visualization of valvular anatomy but acquisition of images was tedious, time consuming and more post-process requiring. The image quality was also poor and frequently affected by artifacts which limited its use for research purpose. Whereas the recent advances in real-time 3D (RT3D) TEE have launched this technique into clinical practice. Matrix array (more than 3000 elements) has enabled TEE probe real time acquisition and on line display of 3 D TEE images. RT3D TEE has allowed improved visualization and assessment of prosthetic valves.
TYPES OF PROSTHETIC HEART VALVESPHVs are either biological or mechanical. Most frequently implanted biological PHVs are stented xenografts which are made of bovine pericardium or from pig aortic valve. Stentless prosthetic valves were introduced to improve hemodynamic durability and reducing complications. Stentless bioprosthetic valves usually consist of preparation of porcine aorta, may be little long or may be made to fit under coronary arteries. Some are made from bovine pericardium. Table 1, Figure 1.
Homografts (Allografts) are stentless and consist of human aortic or
sometimes pulmonary valve which are cryopreserved. They have good durability if harvested early after death and do not need anticoagulation. For this reason they may be used as an alternative to mechanical PHV in young individuals. Homografts resist infection and can be used in patients of infective endocarditis. Ross procedure is substituting the patient’s diseased aortic valve by his own pulmonary valve. Along with, a homograft is implanted in pulmonary position. It has a good durability and it may grow in children and less prone to infection than xenograft. Sutureless
valves were developed for implantation and reducing the bypass time. Recent development is transcatheter valves for the patients having high or intermediate risk for conventional valve replacement. The most commonly implanted are Edward Sapien-a balloon expandable valve or Medtronic Core valve. Newer generation of these valves are introduced to reduce the complication related to implantation of these valves. Some new designs like Jena valve can be utilized in native aortic regurgitation. Transcatheter valves are increasingly used inside failed stented aortic and mitral replacement
Figure 1: Types of prosthetic heart valves
REVIEW ARTICLE

Cardiology Today VOL. XXII NO. 6 NOVEMBER-DECEMBER 2018 199
valves.Most frequently implanted
mechanical valve is bileaflet PHV but tilting disc valves are still used. Though Ball in cage PHVs are not available now but still require echocardiography. Various designs of mechanical valves differ in the composition of pyrolitic carbon shape and opening angle of leaflet design, pivots, size and shape of housing and design of sewing ring.
PHVs also differ by their implantation position relative to the valve annulus mainly in aortic position i.e., intra-annular position, partially supra-annular and wholly supra-annular. Supra-annular position of PHV is used to maximize the orifice area of PHV.
Ideal PHV should have: z Optimal hemodynamics z Non obstructive in systole z Competent in diastole z Non thrombogenecity z Durability z Ease of insertion z Resistance to infection z Low noise level
None of the PHV available today, fulfil all the above criteria.
GUIDELINES FOR ECHOCARDIOGRAPHY FOR PHV
z Immediately between 3-12 weeks after valve replacement surgery, to confirm normal function and to establish a hemodynamic marker. Routine echo after this is not indicated for mechanical valves because their risk of primary failure is almost nil.
z If age of the patient is < 50 years, then for biological valves routine echocardiographic evaluation to detect any structural degeneration or any dysfunction should be performed at five years,4 but when the age of the patient is more than 50 years the same should be performed at ten years. The biological valve failure rate is 20% in aortic position and 40% in mitral position is 10 years.
z If there is presence of new murmur or any symptom of valvular dysfunction, echocardiographic evaluation PHVs should be performed.
z Presence of clinical evidence of infective endocarditis.
z If any major noncardiac surgery is planned.
z Before conceiving and during pregnancy in each trimester.
z When a patient presents with abnormal signs and symptoms and he is a PHV recipient, we should also exclude the ventricular dysfunction (LV or RV). Other valvular dysfunction and cardiac tamponade, besides evaluation of the PHV dysfunction.
COMPREHENSIVE EVALUATION OF THE PATIENT WITH PROSTHETIC HEART VALVESTo evaluate a patient with PHV, stepwise approach is advisable. Take clinical information about date of valve replacement, type and size of PHV, height weight, body surface area, BMI of the patient, blood pressure and heart
rate, symptoms and signs of the clinical condition.
Imaging of the valves to assess the motion of cusps, leaflets or occluder, presence of calcification or other abnormal structures like pannus or thrombus in relation to prosthesis, valve sewing ring integrity and rocking motion. Doppler assessment of the valve to assess peak velocity and maximum pressure gradient, mean PG, velocity time integral/Doppler velocity index, pressure half time in mitral and tricuspid valve, effective orifice area (EOA), presence, location and severity of regurgitation. After these, we assemble data regarding LV and RV size, function and hypertrophy, LA and RA size, coexistent valvular disease, pulmonary artery pressure. Echocardiography data is compared to immediate post-operative studies if available.
First-line imaging for PHV evaluation is 2 D TTE, should be added for complete evaluation of PHV. The complete echocardiographic imaging of the PHV includes multiple views like parasternal long axis, parasternal short axis, apical 4 chamber view and some off axis views (Figure 2).
Multiple angulation of the probe is required for full TTE evaluation. Rarely, intermittent obstruction is suspected, in that case prolonged Doppler examination is utilized. Often TTE is not adequate and TEE is needed for PHV evaluation.
QUALITATIVE PARAMETERSDuring assessment of PHV stenosis, first we evaluate valve leaflet/occluder, its morphology and mobility. Because PHV stenosis is associated with abnormal morphology and mobility, assessment of leaflet or occluder movement can be difficult. Through careful interrogation, rapid movement of leading edge of disk or ball generally can be recorded. Their motion is usually brisk and occurs with each beat; M mode imaging is useful to record this sharp closing and opening movement. Generally the leaflets of bio prosthetic valves are thin with no evidence of prolapse and unrestricted motion. The thickening of leaflets is earliest sign of degeneration. Stentless, homograft or autograft valves may be indistinguishable
Table 1: Types of prosthetic heart valvesMechanical Biologic Percutaneous
Stented Stentless
Bileaflet
St Jude
On-X
ATS
Carbomedics
Porcine xenograft
Medtronic Mosaic
Hancock
Porcine xenograft
Medtronic Freestyle
Edwards Prima Plus
Expanded over a
balloon
Edwards Sapiens
Jena Valve
Lotus
Single tilting disc
Medtronic Hall
Sri Chitra
Pericardial xenograft
Carpentier Edwards
Magna
CE perimount
Pericardial xenograft Self-expandable
- Medtronic Core
Valve
Caged-ball
Starr-Edwards
Homograft
(allograft)

200 Cardiology Today VOL. XXII NO. 6 NOVEMBER-DECEMBER 2018
from the native valves. Bright echos on the cusps are indicative of calcification. In case of PHV thrombosis, there is immobility or reduced mobility of leaflets and presence of thrombus on either side of prosthesis. Pannus formation also leads to progressive obstruction which is usually more echo-dense than thrombus. There may be presence of endocarditis vegetations. TEE and 3D echo helps in more detailed evaluation of PHV.
During echocardiographic assessment of PHV some abnormal spontaneous echos may be found. These are1. Spontaneous echo contrast (SEC)
which is smoke like echos, caused by increased RBC aggregation. This occurs in slow flow states, left atrial dilation, AF or pathological mitral valve obstruction.
2. Microbubbles, are discontinuous stream of rounded, strongly
echogenic and fast moving echos. These are formed at inflow zone of the valve when flow velocity and pressure suddenly fall at the time of closing of prosthetic valve.
3. Strands are thin, mildly echogenic, filamentous structures of several millimeters length, moving independently from the PHV. Their cause and management are not known. These are more commonly found during TEE for finding source of embolism. Their embolic potential is not clear.
4. Sutures are seen at the periphery of sewing ring in PHV as linear, thick, bright, multiple and evenly spaced, immobile echos.
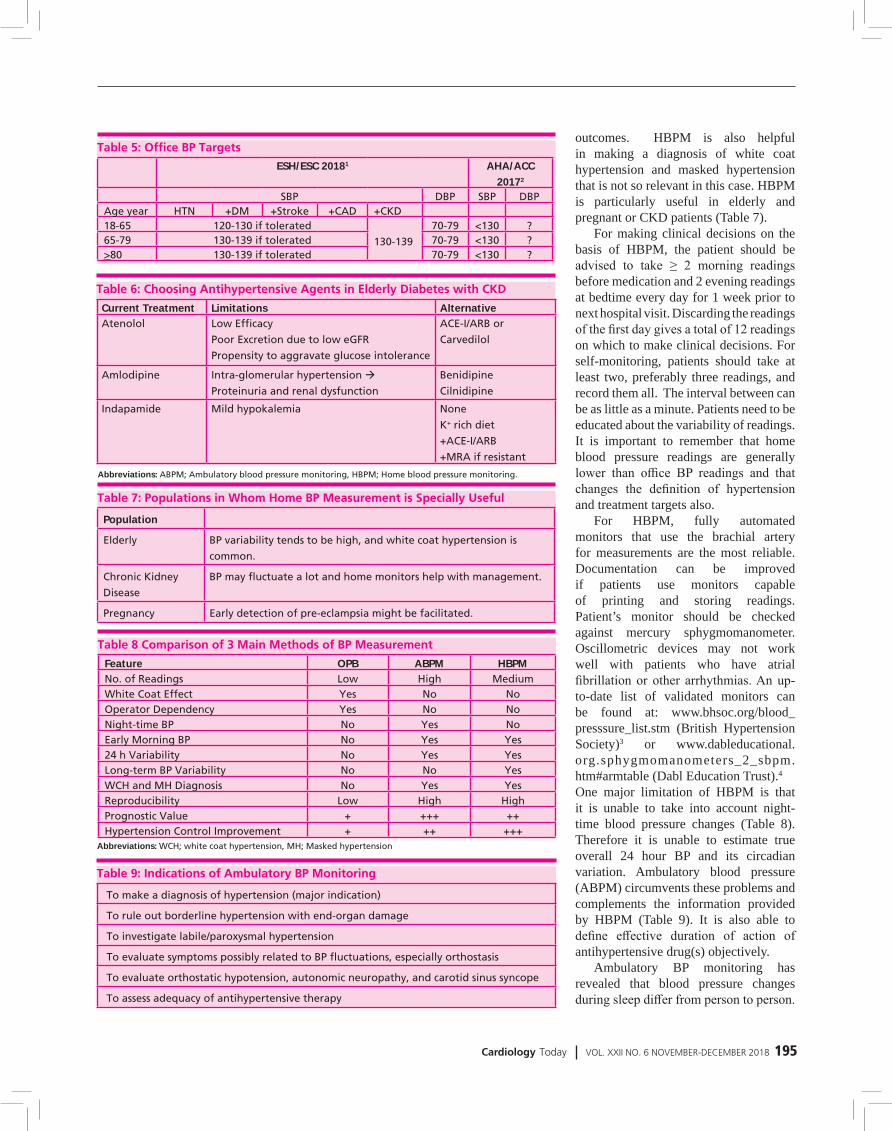
5. Prosthetic valve dehiscence is characterized by a rocking motion of the entire prosthesis (Figure 5).
6. An annular abscess, on echo may
be recognized as an echo-lucent, irregular shaped area adjacent to sewing ring.
FLOW CHARACTERISTICS OF PHVMechanical prosthetic valves, which are functioning normally, can produce some obstruction to blood flow -closure backflow, leakage backflow. Design of PHV influences the extent of obstruction and leakage. For example Ball in cage valve produce more obstruction and little leakage.
In case of bio-prosthetic valve, these normally show little or no leakage.
Homografts Autografts No obstructionUnstented bio- present prosthetic valve
Stented bio- Mild obstructionprosthetic valve present
QUANTITATIVE PARAMETERSPurpose of Doppler assessment across the prosthetic valve is to look for the pattern of flow which is unique for each PHV. Quantitative assessment of velocity and gradients and detection of abnormal regurgitation. Basic principles of Doppler assessment is same as for native valves.
Following parameters are measured for the prosthetic valve assessment
Trans-prosthetic velocity and pressure gradient.
Trans-prosthetic jet contour and acceleration time.
Doppler velocity index (DVI)Effective orifice area (EOA)Pressure half time (PHT)Prosthetic-patient mismatch (PPM)
Trans Prosthetic Velocity and GradientTo calculate flow velocity through the prosthetic valve, pulsed wave (PW), continuous wave (CW) and color Doppler are utilized in a similar way as for the native valves. Data recorded in multiple windows is taken in order to minimize angulation between the Doppler beam and flow direction and to obtain the highest velocity. The flow is eccentric for
Figure 2: Prosthetic valves echocardiagraphic images
REVIEW ARTICLE
Cardiology Today VOL. XXII NO. 6 NOVEMBER-DECEMBER 2018 201
monoleaflet valve while there are three separate jets in bileaflet PHV. Sometimes we overestimate the jet velocity gradients because of the finding of an abnormally high jet velocity by CW Doppler through the smaller central orifice of bileaflet mechanical in aortic or mitral position.
Because of various reasons, flow velocities are higher in normal functioning prosthetic valves and make them inherently stenotic. These are:- Smaller sewing ring.- Growing age of the patient.- EOA is significantly smaller than
area of sewing ring.- Occluder mechanism occupies
central space.- Preservation process for leaflets in
bio-prosthesis make them stiffer.
Normal velocity of particular valve is determined by both valve size and type of prosthesis.
With the help of Bernoulli equation,
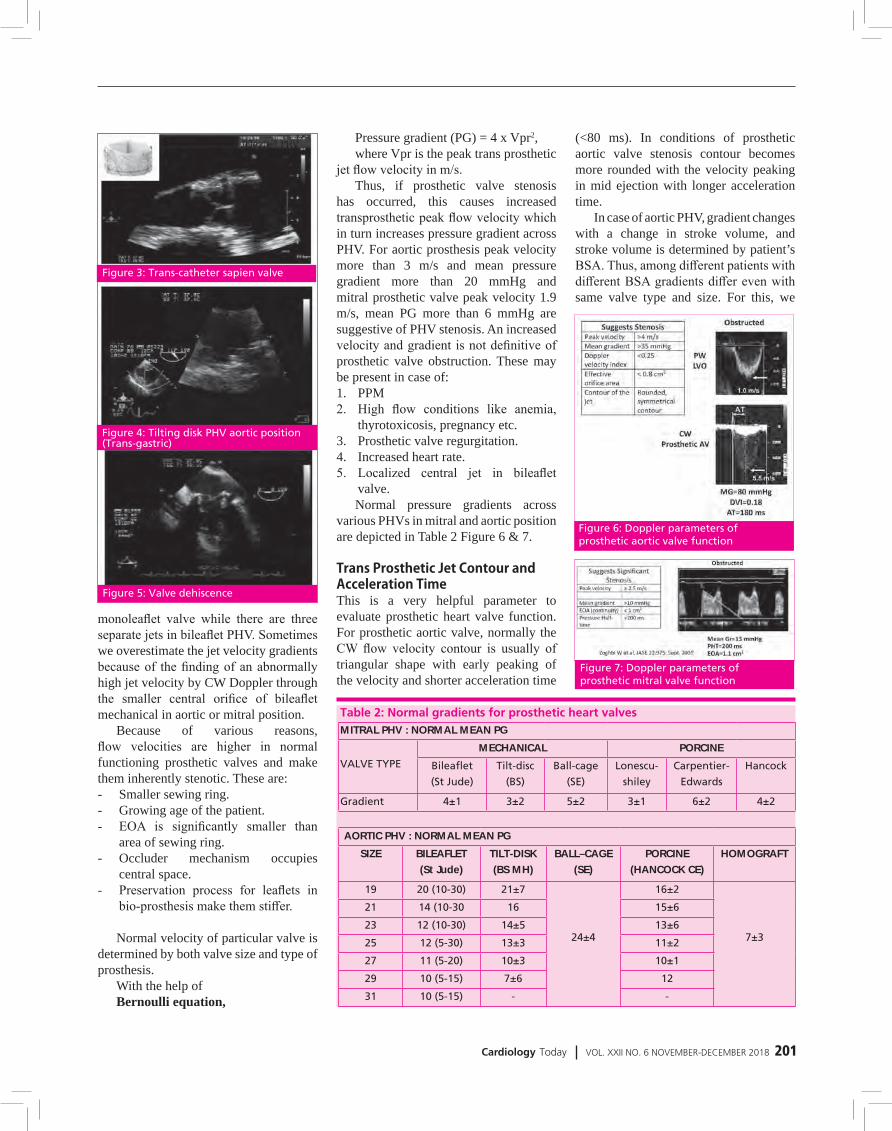
Pressure gradient (PG) = 4 x Vpr2, where Vpr is the peak trans prosthetic
jet flow velocity in m/s. Thus, if prosthetic valve stenosis
has occurred, this causes increased transprosthetic peak flow velocity which in turn increases pressure gradient across PHV. For aortic prosthesis peak velocity more than 3 m/s and mean pressure gradient more than 20 mmHg and mitral prosthetic valve peak velocity 1.9 m/s, mean PG more than 6 mmHg are suggestive of PHV stenosis. An increased velocity and gradient is not definitive of prosthetic valve obstruction. These may be present in case of:1. PPM2. High flow conditions like anemia,
thyrotoxicosis, pregnancy etc.3. Prosthetic valve regurgitation.4. Increased heart rate.5. Localized central jet in bileaflet
valve.Normal pressure gradients across
various PHVs in mitral and aortic position are depicted in Table 2 Figure 6 & 7.
Trans Prosthetic Jet Contour and Acceleration TimeThis is a very helpful parameter to evaluate prosthetic heart valve function. For prosthetic aortic valve, normally the CW flow velocity contour is usually of triangular shape with early peaking of the velocity and shorter acceleration time
(<80 ms). In conditions of prosthetic aortic valve stenosis contour becomes more rounded with the velocity peaking in mid ejection with longer acceleration time.
In case of aortic PHV, gradient changes with a change in stroke volume, and stroke volume is determined by patient’s BSA. Thus, among different patients with different BSA gradients differ even with same valve type and size. For this, we
Table 2: Normal gradients for prosthetic heart valvesMITRAL PHV : NORMAL MEAN PG
VALVE TYPE
MECHANICAL PORCINE
Bileaflet
(St Jude)
Tilt-disc
(BS)
Ball-cage
(SE)
Lonescu-
shiley
Carpentier-
Edwards
Hancock
Gradient 4±1 3±2 5±2 3±1 6±2 4±2
AORTIC PHV : NORMAL MEAN PG
SIZE BILEAFLET
(St Jude)
TILT-DISK
(BS MH)
BALL–CAGE
(SE)
PORCINE
(HANCOCK CE)
HOMOGRAFT
19 20 (10-30) 21±7
24±4
16±2
7±3
21 14 (10-30 16 15±6
23 12 (10-30) 14±5 13±6
25 12 (5-30) 13±3 11±2
27 11 (5-20) 10±3 10±1
29 10 (5-15) 7±6 12
31 10 (5-15) - -
Figure 5: Valve dehiscence
Figure 4: Tilting disk PHV aortic position (Trans-gastric)
Figure 3: Trans-catheter sapien valve
Figure 6: Doppler parameters of prosthetic aortic valve function
Figure 7: Doppler parameters of prosthetic mitral valve function
202 Cardiology Today VOL. XXII NO. 6 NOVEMBER-DECEMBER 2018
perform a baseline echocardiogram after 1-2 months of PHV implantation and on repeat echocardiogram, if increase in mean gradient is more than 20 mmHg, it signifies pathologic obstruction.
In case of mitral prosthesis, we should interpret pressure gradient across PHV, taking into account the heart rate. Because, increase in heart rate causes decrease in duration of diastole, which may have a profound influence on pressure gradient. At the same time, we should consider about pressure half time (PHT). A low PHT with high gradient is not a sign of pathologic obstruction, it rather indicates high flow rate across PHV.
For PHV in mitral position, the condition is reversed. For this, initially the contour is parabolic with longer acceleration time and late peaking of velocity in mid ejection. As severity of obstruction increases, contour becomes triangular with early peaking of velocity and shorter acceleration time.
DOPPLER VELOCITY INDEX (DVI)When reliable measure of the LVOT diameter cannot be obtained to calculate the EOA with help of continuity equation method, DVI helps to screen the PHV stenosis in that situation. For PHV in aortic position, DVI can be calculated as the ratio of velocity time integral (VTI) of left ventricular outflow tract (LVOT) and velocity time integral (VTI) of the trans-prosthetic flow.
DVIprAV = VTILVOT/VTI prAVFor PHV in mitral position, DVI can
be calculated as the ratio of VTI of trans-prosthetic flow and VTI of LVOT
DVIprMV = VTIPrMV/VTILVOTIn place of VTI absolute peak
velocities can also be used. For normally functioning prosthetic valve in aortic position, DVI should be more than 0.3, while for mitral valve prosthesis it should be less than 2.2.
Effective Orifice Area (EOA)EOA is a reflection of the minimal
cross sectional area (CSA) of the trans-prosthetic flow jet. For both aortic and mitral prosthetic heart valves, EOA is calculated by continuity equation as:
EOAprAV = stroke volume/VTIprAVEOAprAV = CSALVOT x VTILVOT/
VTIprAV
Where CSA is cross sectional area of LVOT which is derived by diameter measurement just beneath the prosthetic aortic valve in PLAX view. VTI LVOT is calculated by PW Doppler in apical five chamber view. It is important to locate the PW Doppler sample volume adjacent to the prosthesis.
VTIprAV is calculated from the same signal that are used to measure trans-prosthetic peak velocity and gradient using CW Doppler.
Calculation of EOA for prosthetic mitral valve can be done as
EOA prMV = stroke volume/VTIprMV
EOAprMV = CSALVOT x VTILVOT/VTIprMV
where VTIprMV is calculated from
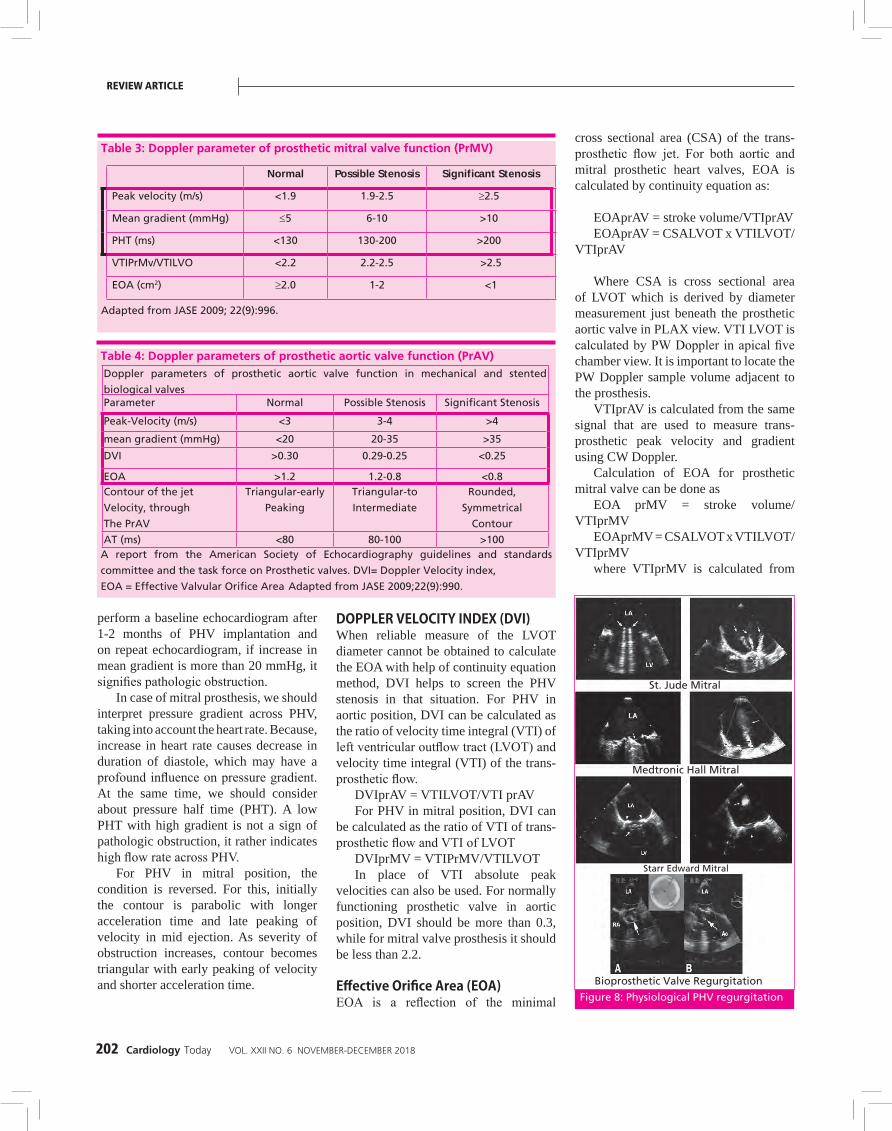
Table 3: Doppler parameter of prosthetic mitral valve function (PrMV)
Normal Possible Stenosis Significant Stenosis
Peak velocity (m/s) <1.9 1.9-2.5 ≥2.5
Mean gradient (mmHg) ≤5 6-10 >10
PHT (ms) <130 130-200 >200
VTIPrMv/VTILVO <2.2 2.2-2.5 >2.5
EOA (cm2) ≥2.0 1-2 <1
Adapted from JASE 2009; 22(9):996.
Table 4: Doppler parameters of prosthetic aortic valve function (PrAV)Doppler parameters of prosthetic aortic valve function in mechanical and stented
biological valvesParameter Normal Possible Stenosis Significant Stenosis
Peak-Velocity (m/s) <3 3-4 >4
mean gradient (mmHg) <20 20-35 >35
DVI >0.30 0.29-0.25 <0.25
EOA >1.2 1.2-0.8 <0.8Contour of the jet
Velocity, through
The PrAV
Triangular-early
Peaking
Triangular-to
Intermediate
Rounded,
Symmetrical
Contour
AT (ms) <80 80-100 >100A report from the American Society of Echocardiography guidelines and standards
committee and the task force on Prosthetic valves. DVI= Doppler Velocity index,
EOA = Effective Valvular Orifice Area Adapted from JASE 2009;22(9):990.
Figure 8: Physiological PHV regurgitation
Bioprosthetic Valve Regurgitation
St. Jude Mitral
Starr Edward Mitral
Medtronic Hall Mitral
REVIEW ARTICLE

Cardiology Today VOL. XXII NO. 6 NOVEMBER-DECEMBER 2018 203
the same signal used for measuring trans-prosthetic peak velocity and gradient using CW Doppler.
Table 3 & 4 show various parameters for prosthetic valve obstruction in aortic and mitral position Figure 6.
Patient Prosthesis Mismatch (PPM)Abnormally high post-operative gradient across the prosthetic valve occurs when EOA of the prosthetic valve is too small in relation to the body size of the patient, even if the valve is functioning normally. This condition is referred as patient prosthesis mismatch (PPM). This condition may result in an abnormally high postoperative gradients i.e., mean gradient may be as high as more than 20 mmHg. This high gradient is not due to intrinsic prosthetic valve dysfunction. To differentiate true prosthetic valve dysfunction from PPM we have to calculate projected indexed EOA (Table 5 & 6).
Effects of PPMIf there is post-operative PPM, it may adversely effect the patient’s health outcome. It may cause:- Worse hemodynamics- Slower or incomplete regression of
LVH or - LV dysfunction- Worse NYHA class, exercise capacity
and quality of life.- More cardiac events- Decreased short and long term
survival associated with LV dysfunction.PPM can be avoided largely by the
calculation of projected indexed EOA of the PHV to be implanted. If PPM is anticipated we should choose for alternative prosthesis or consider root enlargement surgery.
We can suspect PPM if trans-prosthetic flow velocity and pressure gradient are increased despite normal morphology and movement of valve leaflets. Presence of lower measured indexed EOA and presence of high flow velocity and pressure gradient from the time early after surgery to anytime on subsequent echocardiography also points towards PPM.
Prevention of PPM
STEP 1:
Calculate BSA= 1.64
BSA=([Weightkg]0.425 X [heightcm]0.725 ) X 0.007184
STEP 2: STEP 3:
Determine minimal projected EOA Choose prosthesis using
BSA X 0.85 Reference value of EOA
164 X 0.85=1.394
EFFECTS:
z Reduced short and longtime
survival specially if with LV
dysfunction.
z Less regression of LVH.
z Increased cardiac events.
z Less improvement of
functional class.
MITRAL PHV
EOA should be more than 1.2 – 1.3 cm2/m2
z Perisistantpath
z ↓ Long times urvival
AORTIC PHV
PPM EOA
INSIGNIFICANT >0.85 cm2/m2
MODERATE >0.65-0.85 cm2/m2
SEVERE >0.65 cm2/m2
Table 5: Patient prosthetic mismatch
Table 6: Normal reference value of EOA indexed for the aortic prosthesisProsthetic Valve Size, mm
19 21 23 25 27 29
Aortic stented bioprosthesis
Mosaic 1.1±0.2 1.2±0.3 1.4±0.3 1.7±0.4 1.8±0.4 2.0±0.4
Hancock II … 1.2±0.1 1.3±0.2 1.5±0.2 1.6±0.2 1.6±0.2
Carpentier- Edwards
Perimount 1.1±0.3 1.3±0.4 1.50±0.4 1.80±0.4 2.1±0.4 2.2±0.4Carpentier- Edwards
Magna* 1.3±0.3 1.7±0.3 2.1±0.4 2.3±0.5 … …Biocor
(Epic)*
… 1.3±0.3 1.6±0.3 1.8±0.4 … …
Metrofow* 1.1±0.1 1.3±0.1 1.5±0.2 1.8±0.2 … …
Aortic stent less bioprosthesis
Medtronic
Freestyle
1.2±0.2 1.4±0.2 1.5±0.3 2.0±0.4 2.3±0.5 …
St.Jude Medical
Toronto SPV … 1.3±0.3 1.5±0.5 1.7±0.8 2.1±0.7 2.7±1.0
Aortic mechanical prosthesis
Medtronic-Hall 1.2±0.2 1.3±0.2 … … … …Medtronic
Advantage*
… 1.7±0.2 2.2±0.3 2.8±0.6 3.3±0.7 3.9±0.7
St.Jude Medical
Standard 1.0±0.2 1.4±0.2 1.5±0.5 2.1±0.4 2.7±0.6 3.2±0.3St.Jude Medical
Regent 1.6±0.4 2.0±0.7 2.2±0.9 2.5±0.9 3.6±1.3 4.4±0.6
MCRI On-X 1.5±0.2 1.7±0.4 2.0±0.6 2.4±0.8 3.2±0.6 3.2±0.6
Carbomedics
Standard
1.0±0.4 1.5±0.3 1.7±0.3 2.0±0.4 2.5±0.4 2.6±0.4
EOA is expressed as mean values available in the literature.
*These results are based on a limited number of patients and this should be interpreted with caution.

204 Cardiology Today VOL. XXII NO. 6 NOVEMBER-DECEMBER 2018
Conditions, where we have to be careful during assessment of PPM:1. Over estimation of severity of PPM
can occur if we take EOA indexed for body surface area in obese (BMI >/ 30). So we should take lower cut off points for indexed EOA for obese Object.
2. PPM may be associated with normal or low gradients, in conditions of low flow, while it is normally associated with high gradients.
3. PPM and PHV stenosis may be present concomitantly. Stenosis can be ruled out with the absence of significantly low indexed EOA and presence of normal morphology and movement of leaflets.For prosthetic aortic valves, indexed
EOA between 0.85-1.2 cm2/m2, body surface area (BSA) indicate possible stenosis while valves 0.60-0.85 cm2/m2 BSA and more than 0.60 cm2/m2 BSA indicate moderate to severe stenosis (PPM) respectively.
For prosthetic mitral valve indexed EOA between 1.2-2.0 cm2/m2 BSA indicate possible stenosis, while 0.9-1.2 cm2/m2 and more than 0.9cm2/m2 indicate moderate and severe stenosis (PPM) respectively.
ASSESSMENT OF PATHOLOGIC LEAKAGE OF PROSTHETIC VALVESMechanical prosthesis normally have closure and leakage backflow pattern which are dependent of prosthesis design. Doppler appearance of the jets help in distinguishing pathologic regurgitation from normal backflow. Normal closure and leakage backflow jets are low velocity, non aliasing jets of a homogenous color. In contrast, pathologic jets are more turbulent and extensive and eccentric (Figure 8).
Pathologic regurgitation in mechanical valves is caused by valve dehiscence or interference in disc closure by thrombus or vegetation, while in bio-prosthetic valves it can be caused by prosthesis dehiscence or leaflet degeneration.
DOPPLER ASSESSMENT OF SEVERITY OF REGURGITATION OF PHV AT MITRAL POSITIONEnlarged LV size and any structural
abnormality of prosthetic valve during TTE, can be the earliest indication of prosthetic valve dysfunction. Assessment of severity of MR in prosthetic mitral valve is a complex and difficult task because of absence of a single quantitative parameter that can be applied to all patients. Prosthetic MR evaluation is difficult by TTE, while prosthetic AR evaluation is difficult by TEE.
PARAMETERS FOR SEVERITY ASSESSMENTFlow convergence: Minimal and large flow convergence are defined as convergence radius less than 0.4 and more than 0.9 cm for central jet respectively. For eccentric jet it may be higher. During systole, if flow convergence is large in LV side of prosthetic mitral valve, it denotes severe regurgitation while no or minimal flow convergence indicates mild prosthetic MR.
Jet density and jet contour: By using CW Doppler, we can evaluate jet density and jet contour of regurgitant jet which helps in assessing severity of regurgitation.
Retrograde systolic flow in pulmonary veins: Prosthetic MR can also be assessed by retrograde systolic flow in pulmonary veins. Severe MR is associated with swirling motion of jet within the LA and retrograde systolic flow in pulmonary veins,that can be assessed by TEE accurately.
Proximal iso-velocity area (PISA): Prosthetic MR is usually eccentric or consists of multiple jets thus, the PISA can’t be used, instead volumetric method for quantification of prosthetic MR is preferred.
Jet area: We measure jet and calculate the percentage with respect to LA area. If
jet area is less than 4 cm2 or less than 20% of LA, it indicates mild regurgitation but if jet area is more than 8 cm2 or more than 40% of LA, it is indicative of severe regurgitation.
Vena contracta (VC): It is narrowest central flow region of a jet or just downstream to the orifice of regurgitant valve. It is smaller than the anatomic regurgitant orifice. Width of the VC is less than 3, 3-6 and more than 6 mm indicates respectively mild, moderate and severe regurgitation.
QUANTITATIVE PARAMETERS FOR ASSESSMENT OF PROSTHETIC MRREGURGITANT VOLUME AND REGURGITANT FRACTION (RV AND RF)
The amount of blood leaking back into LA during systole through MV is regurgitant volume (RV). For mild, moderate and severe regurgitation it is less than 30, 30-59 ad more than 60 ml/beat respectively. The percentage of blood that regurgitates back through MV, due to MR is regurgitant fraction (RF) for mild, moderate and severe it is less than 30, 30-49 and more than 50% respectively. These are helpful in multiple and eccentric jets. They give information about lesion severity and volume overload status.
RV=stroke volume MV – stroke volume Non regurgitant valve
EFFECTIVE REGURGITATION ORIFICE AREA (EROA)It is the ratio of regurgitant volume (RV)/Regurgitant jet velocity time integral. It is less than 0.20, 0.20-0.49 and more than 0.50 cm2 respectively for mild, moderate and severe regurgitation (Table 7).
PROSTHETIC AORTIC VALVE REGURGITATION Assessment of severity of PHV regurgitation at aortic position is done in a similar way as for native valves.
COLOR DOPPLER EVALUATIONA ratio of regurgitant jet diameter and Left ventricular outflow tract (LVOT) diameter from PLAX view, less than 25%, 25-65% and more than 65% indicate mild, moderate and severe
Figure 9: Paravalvular MR
REVIEW ARTICLE

Cardiology Today VOL. XXII NO. 6 NOVEMBER-DECEMBER 2018 205
regurgitation respectively. A ratio of jet area and LVOT area in PSAX view also helps in assessing severity. But, we can overestimate severity in case of eccentric or crescent shaped jets and under estimate in case of jets impinging on LVOT wall and anterior mitral leaflets, by using this method.
For semi-quantitative evaluation of paravalvular AR, careful imaging of the neck of the jet in PSAX view at the level of sewing ring or stent is required for defining circumferential extent (Figure 9).
A jet occupying less than 10%, 10-20% and more than 20% of the sewing ring circumference indicate mild, moderate and severe regurgitation respectively. If more than 40% of the circumference i.e., rocking movement of prosthesis it suggests dehiscence. TEE is helpful in case of multiple jets. Qualitative assessment based on proximal isovelocity surface area (PISA) is difficult to apply for mechanical aortic prosthetic valve. When assessable, usually in bioprosthesis with central regurgitant jet, imaging of the flow convergence zone is done mainly in apical 3 or 5 chamber or PLAX views. Regurgitant volume, regurgitant fraction and EROA are obtained from standard formulas. RV more than 60 ml, RF more than 50% and EROA more than 30 mm2 indicate severe prosthetic AR.
SPECTRAL DOPPLER PARAMETERSThese parameters are less affected by position shadowing and artifacts of prosthesis. Thus, these are very useful in case of PHV regurgitation. Right parasternal window is used for eccentric jets. The pressure halftime (PHT) of
CW Doppler of regurgitant jet is useful when PHT is less than 200 ms, indicating severe AR or more than 500 ms indicating mild AR. But, values of 200-500 ms are less specific because these are influenced by other variable like heart rate, LV compliance and LV pressures and acuteness of AR. In acute AR, PHT is shorter.
Diastolic flow reversal in descending aortaSample volume is placed just distal to the origin of left subclavian artery, for imaging diastolic flow reversal in descending aorta. PW Doppler is aligned along the major axis of aorta, Doppler filter is decreased to lowest setting and velocity scale is set to 60-80 cm/s. In mild AR, reversal of flow is limited to early diastole and is brief. As the severity of AR increases, duration and velocity of flow reversal also increases. The presence of holo-diastolic flow reversal indicates atleast moderate AR, but when this is associated with end-diastolic velocity of flow reversal of more than 20 m/s, it indicates severe AR (Table 8).
TRANSCUTANEOUS AORTIC VALVE REPLACEMENT (TAVR)This is a minimally invasive procedure and it replaces the valve without removing older damaged valve. Edwards the Sapien valve and Core valve system are two devices used for TAVR (Figure 3).
In Edwards Sapien valve, three pericardial leaflets are mounted within a balloon expandable stent, while in Core valve revolving system, three pericardial leaflets are mounted in a self expanding nitinol frame. Transfemoral or transapical
approach for TAVR, are commonly used. Most common drawback of TAVR is AR, which may be trans-valvular or paravalvular or both occurring together. Recently, supraskirtal AR, a third form of AR associated with TAVR has also been described (Figure 10).
PROSTHETIC PULMONARY VALVECongenital heart disease, is the main
indication where prosthetic pulmonary valve or homograft is generally implanted. These valves may also undergo stenosis or insufficiency.
Clues indicative of PHV stenosis in pulmonary position on echocardiography are:- Marked thickening of the cusps.- Immobility of the cusps.- Trans-valvular peak velocity across
prosthetic valve more than 3 m/s or across homograft more than 2 m/s.
- Depressed right ventricular function and right ventricular pressure overload.Clues indicative of severe insufficiency
of PHV in pulmonary position are :- Right ventricular volume overload- Diastolic flattening and paradoxical
movement of the interventricular septum.
Prosthetic Tricuspid ValveTricuspid prosthetic valves are
assessed by parasternal, low parasternal, apical and subcostal views. Clues indicative of stenosis of PHV in tricuspid position are:- Thickening or abnormal morphology
of cusps.- Reduced mobility or immobility of
cusps- Peak velocity across valve more than
1.7 m/s- Mean gradient more than 6 mmHg
and - Pressure half time more than
230 ms. Tricuspid prosthetic velocity varies
with cycle length and respiration thus, we take a minimum of 5 cardiac cycles and get average of these, Clues for tricuspid prosthetic regurgitation.- Peak velocity across valve more than
1.7 m/s.
Figure 10: Paravalvular AR (TAVR)
206 Cardiology Today VOL. XXII NO. 6 NOVEMBER-DECEMBER 2018
- Mean gradient more than 6 mmHg.- CW Doppler shows a dense spectral
recording with a triangular shape and velocity peaking early.
- Elevated peak and mean diastolic pressure gradients.
OTHER MODALITIES FOR PHV EVALUATIONCinefluoroscopy Has limited value in bioprosthetic valves but it can be easily applied for mechanical valves. The valvular leaflet mobility and valvular ring motion is evaluated with the help of cine fluoroscopy.
For fluoroscopy study, patient has to lie down in supine position. Three projections are used for viewing PHVs.- In situ projections : Radiographic
beam is projected postero-anterior (O degree) and lateral (90 degree) to evaluate orientation of the valves.
- In profile projection – Radiographic beam is projected parallel to both the valve ring plane and the tilting axis of disc. It helps in calculation of
opening and closing angles.- En-face projection – Radiographic
beam is projected parallel to the valve outflow tract. It is used only for mitral valve prosthesis.For aortic position disc motion is
better evaluated by cinefluoroscopy than echocardiography, but it does not allow hemodynamic assessment and does not give information about the etiology of reduced disc movement.
For cinefluoroscopy examination a short i.e., 10 beats of each projection is taken and from these, some frames are selected for evaluation and measurement of disc motion. In fully open and closed positions, opening and closing angles are calculated as the distance between the two leaflets in respective positions.
Cardiac CTThere is no definitive indication for CT in evaluation of PHVs dysfunction, thus not used routinely. But there are some conditions where CT may be very helpful. These are
- In distinguishing thrombus from pannus.
- In quantifying severity of stenosis in a bioprosthesis by planimetry.
- In identifying paravalvular regurgitation and malcoaptation.
- Ventricular or atrial dilation or stasis identification, which are morphological consequences of obstruction or regurgitant lesions of PHVs.
- Calcification on CT, aids in early detection of failure of biologic PHV.
Cardiac MRI When TEE is undesirable or non-diagnostic it can be used as a complementary method for assessing the function of PHVs. It is an excellent technique for assessment of cardiac chamber volumes and flow patterns. PHV anatomy can be assessed by short axis, to 2, 3 and 4 chamber long axis views with oblique long axis view in the line of cooptation. For obtaining blood flow patterns and velocity, phase contrast
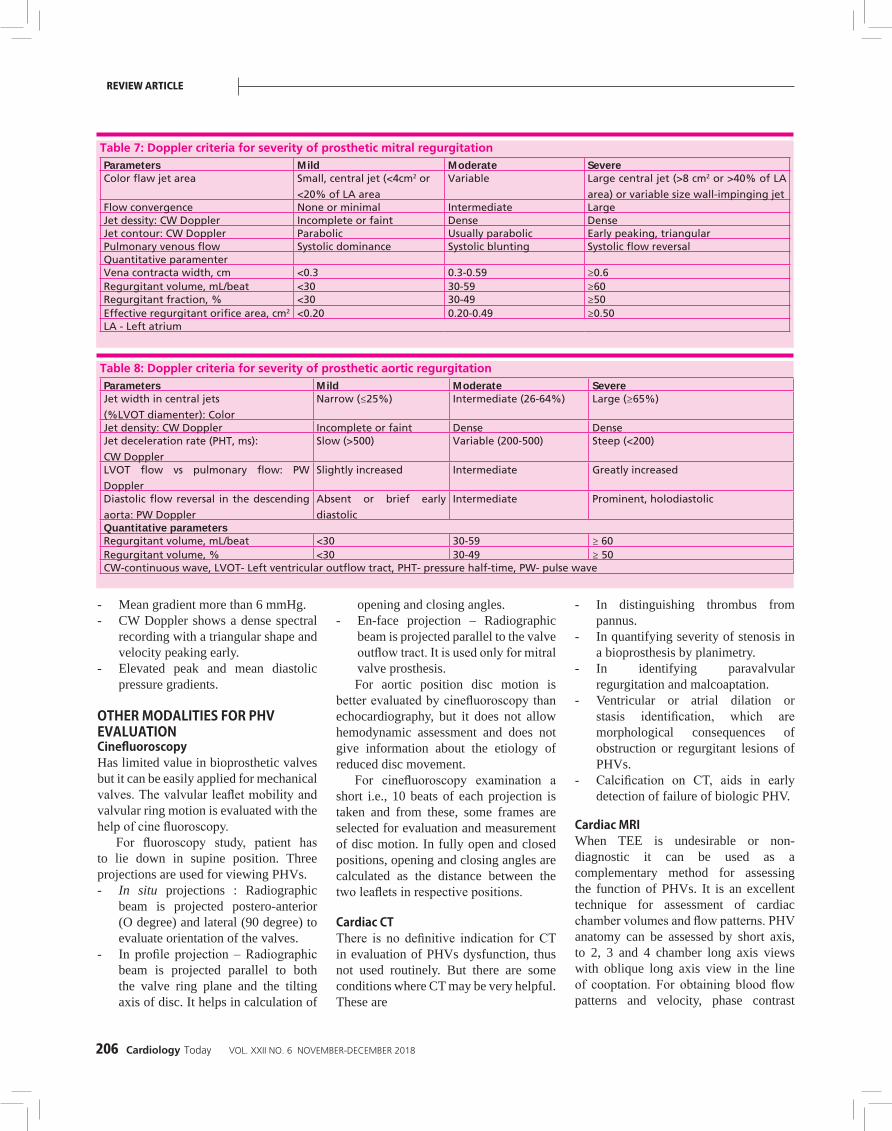
Table 7: Doppler criteria for severity of prosthetic mitral regurgitationParameters Mild Moderate SevereColor flaw jet area Small, central jet (<4cm2 or
<20% of LA area
Variable Large central jet (>8 cm2 or >40% of LA
area) or variable size wall-impinging jetFlow convergence None or minimal Intermediate LargeJet dessity: CW Doppler Incomplete or faint Dense DenseJet contour: CW Doppler Parabolic Usually parabolic Early peaking, triangularPulmonary venous flow Systolic dominance Systolic blunting Systolic flow reversalQuantitative paramenterVena contracta width, cm <0.3 0.3-0.59 ≥0.6Regurgitant volume, mL/beat <30 30-59 ≥60Regurgitant fraction, % <30 30-49 ≥50Effective regurgitant orifice area, cm2 <0.20 0.20-0.49 ≥0.50LA - Left atrium
Table 8: Doppler criteria for severity of prosthetic aortic regurgitationParameters Mild Moderate SevereJet width in central jets
(%LVOT diamenter): Color
Narrow (≤25%) Intermediate (26-64%) Large (≥65%)
Jet density: CW Doppler Incomplete or faint Dense DenseJet deceleration rate (PHT, ms):
CW Doppler
Slow (>500) Variable (200-500) Steep (<200)
LVOT flow vs pulmonary flow: PW
Doppler
Slightly increased Intermediate Greatly increased
Diastolic flow reversal in the descending
aorta: PW Doppler
Absent or brief early
diastolic
Intermediate Prominent, holodiastolic
Quantitative parametersRegurgitant volume, mL/beat <30 30-59 ≥ 60Regurgitant volume, % <30 30-49 ≥ 50CW-continuous wave, LVOT- Left ventricular outflow tract, PHT- pressure half-time, PW- pulse wave
REVIEW ARTICLE

Cardiology Today VOL. XXII NO. 6 NOVEMBER-DECEMBER 2018 207
velocity mapping by CMR is done. Thus it may be very helpful in assessing regurgitation of PHV.
Cardiac Catheterization It helps in measuring flow velocity and pressure gradients across the PHV and assessing flow patterns. These parameters help in calculation of EOA by Gorlin formula. It is mainly useful in bioprosthetic valve because it may cause complications like regurgitation in case of mechanical valves when catheter is passed across PHV.
When invasive mitral prosthetic gradient is required, we measure directly the LA pressure by transseptal approach because measurement of wedge pressure can overestimate pressure gradients and underestimate EOA.
COMPLICATION OF PHVS Early Complications1. Valvular dysfunction- due to technical
challenges during surgery or early infection
2. Paravalvular leak3. Early prosthetic thromboembolim
and 4. Acute endocarditis
Late Complications1. Late valvular dysfuntion2. Thrombus and thromboembolism3. Pannus formation4. Valve degeneration5. Annular abscess6. Endocarditis7. Hemolysis8. Dehiscence9. PPM10. Primary failure
ENDOCARDITISIn a stable patient with PHV and fever, first we should exclude other causes of fever. If we are unable to get a definitive cause, we perform echocardiography for endocarditis. On the other hand, if the patient is severely ill or there is medium or high clinical suspicion for endocarditis, we perform echocardiography (Figure 11).
Initially vegetations are formed in a ring area, from where it spread
to involve components of PHVs and impair opening and closing of leaflets, vegetations are identified as an irregular, freely mobile mass of low echogenicity on echocardiography.
Complications of Endocarditis1. Abscess formation, which may lead
to- Conduction defect if it involves IVS- Shunt between two chambers2. Suture dehiscence and paravalvular
regurgitation in all PHVs3. Valve destruction
If we are unable to find a significant lesion of endocarditis in TEE, but the clinical suspicion is high, we should use TEE. Because TEE is superior in detecting vegetations and perivalvular abscess in posterior aortic root than TTE. Anterior structures are better seen by TTE and posterior structures by TEE. Despite combined approach, a small percentage
of cases can be missed. A repeat study after 7-10 days should be recommended in such circumstances.
PROSTHETIC VALVE THROMBUS AND PANNUS AND THEIR DIFFERENTIATIONVALVE THROMBOSISMechanical valves are more prone for thrombus formation than bioprosthetic valves (Figure 12).
Usually, thrombus is associated with obstruction, regurgitation and embolism, but sometimes it may be silent. Thrombus formation leads to significant obstruction, which may be catastrophic. It is treated by redo operation and fibrinolysis. Fibrinolysis is treatment of choice for tricuspid valve thrombosis. TEE and Doppler are used to assess serially for success of thrombolytic therapy and improved hemodynamics. If on TEE, thrombus area is more than 0.85 cm2, it confers a higher risk of embolism
Figure 11: PHV Endocarditis

208 Cardiology Today VOL. XXII NO. 6 NOVEMBER-DECEMBER 2018
and death associated with thrombolysis (Table 11).
PANNUS After prosthetic valve implantation,
a membrane of granulation tissue as a response to healing, forms which may cause obstruction. This granulation tissue is called pannus.
Per year the incidence of PHV obstruction is 4%. Among these:
Pure thrombus (75%)Pure pannus (10%)Combination of both (12%)Table 9 Figure 13.
TEE FOR EVALUATION OF PHVMultiplane TEE is considered the diagnostic technique of choice for evaluation of type of prosthesis, assessment of its function and diagnosing dysfunction. With the combination of
Doppler and color doppler imaging, the ability of TEE to integrate the structural information and hemodynamic function is unparalleled. The increased resolution with TEE is advantageous in defining the
Table 9: Comparision of prosthetic heart valve massessThrombus Pannus Vegetation
Echo predictor Soft echo density with irregular
shape, homogeneous, similar to
myocardium
(Semi) circular, bright, and
hard echo dense structures,
sometimes containing focal
calcific deposits
Pedunculated mass initially similar to
thrombus, echodensity increases with
increasing vegetation age
Localization Mainly hinges valve occluder, and/or
valve struts
Mitral: atrial and/or
ventricular sides
Aortic: Aorti an d/or left
ventricular outflow tract side
Typically attached on the low pressure
side of the prosthesis
Mobility Fixed or mobile Immobile Osillating or nonoscillating (Mobility
usually increases with increasing
vegetation size)
3-D echo predictors Linear, purple-or violet-colored echo
density on a bright cream color base
of the endotholialized seweing ring
surrounding the the prosthetic valve
suture line or medial to it
(Semi) circular mass
narrowing circuferentially
the inflow and outflow
aspect of the prosthesis by
extending into both sides of
the prosthesis
Provides the entire morphology
of the vegetation and determine
its maximum size more accurately,
leading to a better prediction of risk
of embolism in IE patients compared
to 2-D echoVideointensity ratio ≤0.4 ≥0.7 Unavailable data
MDCT Low attenuation levels (Hunsfield
units <90)
Favors thrombus
High attenuation levels
(Hounsfield units <145
Favors pannus formation
Combined with FDG PET results in
high-resolutaion anatomical and
metabolic imaging of the prosthesis
and its surroundings anatomyAssociated abnormalities Pannus, LA and LAA thrombi, strands Thrombus Abscess, pseudoaneurysm,
perforation, fistula, paravalvular leak,
dehiscence2-D/3-D-dimensional; [DG-PET-18-fluroine-fluorodesoxyglucose positron emission tomography; IE - infective endocarditis; LA - Left atrium; LAA-Left atrial appendage; MDCT- multide-tector-
row computed tomography
Figure12: Stuck Mitral PHV
After successful Thrombolysis
Figure 13. a) Pannus mitral PHV, b) Pannus aortic PHV
REVIEW ARTICLE

Cardiology Today VOL. XXII NO. 6 NOVEMBER-DECEMBER 2018 209
cause of PHV dysfunction (Table 10).Clinical role of TEE include
evaluation of native valve, intraoperative evaluation and guidance apart from diagnosing valve dysfunction post operatively. TEE can distinguish the normal/abnormal movement of leaflet (s)/occluder, abnormal movement of valve or dehiscence of PHV annulus, vegetation, calcification, thrombus and pannus.
Technical ConsiderationDue to metallic or polymeric components of PHV it is difficult to image the structure posterior to PHV. However technical modifications are helpful.1. Decreasing the transmit gain2. Multiplane imaging 3. Mid esophageal TEE will not show
aortic valve PHV leaflets, however trans-gastric position can show the leaflet movement (Figure 4).Ventricular side of MV prosthesis is
better seen from trans-gastric position.A systematic TEE examination of
PHV includes - The recognition of type of PHV. - Proper seating of PHV within the
native annulus.- Normal blood flow pattern through
the valve.- Absence or presence of paravalvular
leak and its significance.
Doppler echocardiography is used to estimate the trans-valvular gradient across PHVs which have central jet. While caged ball prosthesis, occluder changes the direction of blood flow through this direction and Bernoulli’s equation does not estimate a correct mean PG. For gradient measurement it is important to align the ultrasound beam to transprosthetic flow. It is easily determined in mid esophageal TEE 60 degree, 90, degree or 120 degree in angles in patients with mitral valve PHV. While in aortic PHV, it is better measured in transgastric views at 90 degree or 120 degree.
Most commonly utilized bileaflet mechanical valve due to its durability record, and wider effective orifice area, movement of both leaflets in opening closing is confirmed. Two linear
shadows are well recognized in open position in short axis within circular annulus. Multiplane rotation through the valve generates a cross sectional plane perpendicular to two leaflets which permits to show movement of both leaflets simultaneously. Next any abnormal movement of sewing ring is seen. Valve dehiscence is normally associated with paravalvular regurgitation originating outside annulus/sewing ring. Valve dehiscence is usually caused due to incomplete fixation of valve in severely calcified valve during surgery. Other important reason is complication of endocarditis. Valve dehiscence and endocarditis is better observed by multiplane TEE.
Small amount of regurgitation is normal for bileaflet PHV. These small jets regurgitant are usually referred as cleansing jets. Usually this jet is at hinge points but small regurgitant jet may be present at closing site of leaflets along the annulus.
Intraoperative pathological valvular regurgitation is due to malfunction of valve due to retained tissue that prevents valve closure, or misplaced suture interfering with the leaflet movement.
Paravalvular Regurgitation is Always PathologicCage ball valve produce large acoustic shadowing and its motion is best seen in long axis view, color Doppler shows blood flow in between the wired stents.
Tilting disc PHV consists of a disc which is supported by stents. Single disc opens 60-80 degree to form two orifices of different size and shape. These valves also have low profile and provide larger ejection orifice area. Proper tilting angle
is confirmed through multiplane TEE examination. Color Doppler shows a small leakage backflow jet at hinge point or along in the site of contact of disc and annulus strut fracture and is a serious complication and can lead to disc embolization.
Biological valves are reserved for younger patients or patients who do not tolerate anticoagulation. Stented porcine valve has slightly lesser EOA compared to bileaflet PHVs and they have favorable acoustic profile.
Pericardial bio-prosthesis are indistinguishable from the stented porcine valve.
Stentless bio-prostheses are useful in patients with native valve annulus less than 20 mm in diameter. Their profile is better than stented PHVs however, intraoperatively the matching of annulus size and alignment of annular plane and ruling out dilatation of ascending aorta is important. Sino-tubular junction should be within 10% of annulus of stentless PHV. However, the thickness of vessel is increased due to overlap. Trace or mild paravalvular leak is present in 25% of these valves. These regurgitant jets are clinically insignificant.
Allografts are also to be matched to annular size to avoid para-valvular leak or valve incompetence. Allografts are also indistinguishable from native aortic root or valve.
Prosthetic valve complications are better recognized by TEE. Bio-prosthetic valve regurgitation is commonly associated with degenerative changes, leaflet calcification, tears, prolapse and leaflets obstruction due to endocarditis.
In mechanical PHV the pathological regurgitation is result of pannus
Table 10: Use of TEE for prosthetic heart valveTEE before valve replacement
TEE after valve replacement
TEE for PHV dysfunction
Verify disease of native valve Movements of Type of PHV
Extent of annular calcification
leaflets/occluder Valve degeneration or
Annular diameter of nativevalve
Valvular /paravalvularregurgitation
Calcification Thrombus/pannus/vegetation
Feasibility of valve repair No air in cardiac chambersNo LVOT obstruction bystents or subvalvularapparatus
Quantification ofvalvular/paravalvular leakQuantification of PHV stenosis

210 Cardiology Today VOL. XXII NO. 6 NOVEMBER-DECEMBER 2018
formation, thrombus, vegetation or valves component obstructing the complete closure of occluder. Clinical severity can be checked by measuring vena contracta and calculating regurgitant volume or effective regurgitant orifice.
Paravalvular leak is due to incomplete fixation of sewing ring to native annulus. Rocking movement is produced by valve dehiscence which is a visible separation of prosthetic valve and native anular separation.
PHV stenosis is produced by thrombus, pannus or vegetation. Thrombus is usually a result of inadequate anticoagulation. It interferes with closing and opening movement of leaflets, size and extent of thrombosis can be better seen with TEE. Thrombus size less than 0.85cm2 confers lower risk of embolism and death related to thrombolysis. Size of thrombus can be determined by TEE. Pannus can be differentiated from thrombus with the help of TEE examination.
TEE is a better technique to detect vegetation, annular abscess etc. It is important to use mid-esophageal and trans-gastric view to see both sides of PHV. Left ventricular obstruction is rare complication specially due to chordae sparing or it can happen in stented porcine
Table 11: PHV ThrombosisPatient with a clot in relation to PHV
Minimal clot Large clot
Large clot III NYHA IV
Warf/Heparin
Success INR 3-4.5
Failure
Thrombolysis
SuccessINR 3-4.5
Failure
PHV
Replacement
?
valve due to stent projecting in LVOT. Trans-gastric view provides means to image LVOT after MV replacement to estimate LVOT pressure gradient.
3D ECHO SPECIALLY 3D TEECurrent 3D probes are superior to earlier TEE probes to reconstruct the image. Earlier 3D techniques were time consuming, tedious and extensive post-processing was required. Recent advances in real-time 3D imaging have propelled 3D TEE into clinical practice from the research realm. It is possible to have real-time acquisition through matrix array, TEE transducer and online display of 3DTEE images. There is no need of offline reconstruction. R3DTEE has allowed improved visualization and assessment of prosthetic valves.
To acquire 3D images 2D examination is first used to locate best plane for imaging PHV.
Gain setting is optimized using narrow angled acquisition mode. Subsequently zoom mode with biplane imaging is used to focus PHV. Then colorful volume acquisition is recorded. ECG gating is required and acquisition is done in 4-7 heart beats. Then cropping techniques
are utilized to see various component of PHV. Rings leaflets, stents can be clearly visualized from both left atrial and left ventricular perspective.
In aortic, mechanical, biological or PHV, leaflet movement is poorly visualized. Similarly TV PHV leaflets are also poorly visualized. This is due to distance from transducers to aortic or TV, PHV. However, R3DTEE allows evaluation of valve components, ring, annulus, struts. Thrombus in relation to the prosthetic heart valve is recognized and differentiated from pannus. Size and location of thrombus helps in proper management (Table 11).
Acquisition of RT 3DTEE only require approximately 10 additional minutes.RT3DTEE has shown to provide additional information to evaluate PHV endocarditis. Due to acquisition of wide angled, full volume data and ability to crop the images, deep anatomical structures can be clearly seen and displayed. PHV evaluation is possible in the angles which was not possible in 2D planar views. Enface view of PHV is useful in assessment of PHV endocarditis. It allows to see additional vegetation not seen in 2D planner view.
PARAVALVULAR REGURGITATION (PVL)Paravalvular leaks are better recognized by RT3DTEE. It plays important role in 1. Evaluation of paravalvular
regurgitation (size and location).2. Guidance during intervention3. Post intervention assessment
3D zoom mode provides enface views of both mitral and aortic PHVs. Mitral valve imaging from LA perspective is conventionally rotated so that aorta is at 12 O’clock and LAA appendage at 9 O’clock position. Dehiscence site is localized, shape and size and site of paravalvular leaking confirmed with use of 3 dimensional color flow. RT 3 D TEE provides a more accurate site and size of paravalvular leakage (PVL). It is important to decide the suitability of percutaneous closure of PVL vs surgical closure. RT 3D TEE also guides surgeon for size and site and adequacy of repair after coming
REVIEW ARTICLE

Cardiology Today VOL. XXII NO. 6 NOVEMBER-DECEMBER 2018 211
off bypass. Procedure of PVL closure is guided for route of approach to PVL. This approach can be antegrade or retrograde. Small PVL are occluded by amplatzer. PDA device while larger defects are closed by amplatzer ventricular septal device. Continuous guidance is provided during the percutaneous closure of PVL- selection of site of atrial septal puncture and guidance of catheter and device into PVL site.
LIMITATIONS1. Poor visualization of anterior
structures like aortic and tricuspid valve.
2. Suboptimal images during arrhythmia due to poor ECG triggering. This issue has been resolved by single beat acquisition mode.
3. Newer machines have increased frame rate, spatial and temporal resolution and moving structures like vegetations are better seenTissue drop outs can be interpreted
as anatomic defect while increasing gain may result in blurry images. However experience as well as combining imaging to color and Doppler information helps to differentiate true and false defects.
CONCLUSION Physicians taking care of prosthetic valve patients should be familiar with the characteristics of normal prosthetic valves. Various varieties of PHVs have specific echo-cardiographic patterns and Doppler and color Doppler parameters. Deviations from normal pattern specially valve thrombosis, pannus and vegetation are easily recognized by trans-esophageal echo. and more specifically 3D real-time TEE. Paravalvular leak size and shape of regurgitant orifice is also recognized. 3D real-time TEE should be routinely applied along with other Doppler parameters for prosthetic valve evaluation.
REFERENCES1. Yuriy Ivaniv.Echocardiographic evaluation of heart valve
prosthetic dysfunction Heart vessels and Transplantation 2018;2:doi:10.24969/hvt.2017.46
2. John B Chambers ,The echocardiography of replacement heart valves, ID:16-2032;Sept 2016DOI :10.1530/ERP-16-0032
3. Patrizio Lancellotti,Philippe Pibarot etal,Recommendations for the imaging assessment of prosthetic heart valve,European Heart Journal – Cardiovascular Imaging,doi:10.1093/ehjci/jew025
4. Chiara Sordelli,Sergio Soverino, etal, Echocardiographic assessment of Heart Valve prosthesis. J Cardiovasc Echography 2014,24:103-13
5. Renee B.A.Wan Den Brink, MD ,Evaluation of prosthetic Heart Valves by Transesophageal echocardiography: problems, pitfalls and timing of echocardiography Seminars in Cardiothoracic and Vascular Anaesthesia, Vol 10,0 1(March),2006:pp89-100
6. ChiaraSordelli, SergioSeverino, et al Echocardiographic assessment of Heart Valve prosthesis,,J Cardiovasc Echogr. 2014 Oct –Dec;24(4):103-113.
7. Vahanian A, Baumgartner H, et al. Task Force on the Management of Valvular Heart Disease of the European Society of Cardiology. ESC Committee for Practice Guidelines. Guidelines on the management of valvular heart disease: The task force on the management of valvular heart disease of the European society of cardiology. Eur Heart J.2007:28:230-68 [PubMed: 17259184]
8. Zoghbi WA, Chambers JB, Dumesnil JG et al. American Society of Echocardiography’s Guidelines and Standards Committee; Task Force of Prosthetic Valves;J Am Soc Echocardiogr.2009;22:975-1014.[PubMed:19733789].
9. Coppolino P, Coppolino F, et al. L’ecocardiographianella valutazione delle protesi cardiache.Giornale italiano di Cardiologia pratica.2012
10. Pibarot P, Dumesnil JG. Hemodynamic and clinical impact of prosthesis-patient mismatch in the aortic valve position and its prevention. J Am Coll Crdiol.2000;36:1131-41.[PubMed : 11028462]
11. Dumesnil JG, Honos GN, et al. Validation and application of mitral prosthetic valvular areas calculated by Doppler echocardiography, Am J Cardiol 1990;65:1443-8.
12. Pibarot P, Weissman NJ, et al Incidence and sequelae of prosthesis –patient mismatch in transcatheter versus surgical valve replacement in high risk patients with severe aortic stenosis – APARTNER trial cohort A analysis. J Am Coll Cardio 2014;64:1323-34
13. Vesey JM,Otto CM, et al.Complication of prosthetic heart valves.Curr Cardiol Rep.2004;6:106-11.[PubMed:14759353]
14. Kappetein AP, Head SJ et al. Updated standardized endpoint definitions for transcatheter aortic valve implantation the Valve Academic Research Consortium-2 consensus document. Eur J Cardiothorac Surg 2012;42:545-60.
15. Zoghbi WA, Chambers JB, Dumesnil JG et al. American Society of Echocardiography’s Guidelines and Standards Committee; Task Force of Prosthetic Valves;J Am Soc Echocardiogr.2009;22:975-1014.[PubMed:19733789].
16. Fernandes V, Olmos L, Et al. Peak early diastolic velocity rather than pressure half -time is the best index of mechanical prosthetic mitral valve function. Am J Cardiol.2002;89:704-10 [PubMed :11897213]
17. Zoghbi WA, Enriquez-Sarano M, et al. American Society of Echocardiography. Recommendations for evaluation of the severity of native valvular regurgitation with two-dimensional and Doppler echocardiography. J Am Soc Echocardiogr.2003;16:777-802.[PubMed:12835667
18. Patrizio Lancellotti, Philippe Pibarot et al. Recommendations for the imaging assessment of Prosthetic heart valves: European Heart Journal-Cardiovascular imaging doi:10.1093/ehjci/jew025
19. Vitarelli A, Conde Y, et al. Assessment of severity of mechanical prosthetic mitral regurgitation by transesophageal echocardiography. Heart .2004;90:539-44.[PMCID:PMC1768237] [PubMed:15084553]
20. Pouleur AC, de Waroux JB, et al. Accuracy of the flow convergence method for quantification of aortic regurgitation in patients with central versus eccentric
jets. Am J Cardiol 2008;102:475-80.21. Samstad SO, Hegrenaes L, et al. Half time of the diastolic
aortoventricular pressure difference by continuous wave Doppler ultrasound a measure of AR ?Br Heart J 1989;61:336-43.
22. Tribouilloy C, Avinee P, et al. End diastolic flow velocity just beneath the aortic isthmus assessed by pulsed Doppler echocardiography:a new predictor of the aortic regurgitant fraction. Br Heart J 1991;65:37-40.
23. Gotzmann M, Korten M, et al. Long term outcome of patients with moderate and severe prosthetic aortic valve regurgitation after transcatheter aortic valve implantation.Am J Cardiol.2012;110:1500-6.[PubMed:22863177]
24. Anwar AM, Nosr YF, et al. Real time three dimensional transthoracic echocardiography in daily practice:Initial experience. Cardiovasc Ultrasound.2012;10:14.[PMCID:PMC3350441][PubMed:22448671]
25. Silversides CK, Veldtman GR, et al. Pressures Halftime predicts hemodynamically significant pulmonary regurgitation in adult patients with repaired tetralogy of Fallot. J Am Soc.Echocardiogr 2003;16:1057-62.
26. Muratori M,Montorsi P et al. Dysfunction of bileaflet aortic prosthesis accuracy of echocardiographyversus fluoroscopy. JACC Cardiovasc Imaging 2013;6:196-205
27. Han Y, Peters DC et al. Cardiovascular magnetic resonancecharacterization of mitral valve prolapse.JACC Cardiovasc Imaging 2008;1:294-303
28. Pennekamp W,Geyhan N, et al. Determination of flow profiles of different mechanical aortic valve prosthesis using phase –contrast MRI. J Cardiovasc.Surg 2011;52:277-84.
29. Clavel MA, Pibarot P et al. Assessment of low –flow, low gradient aortic stenosis:multiple modality imaging is the key to success. EuroIntervention 2014;10(Suppl.U):U52-60.
30. Dweck MR, Jones C, et al. Assessment of valvular calcification and inflammation by positron emission tomography in patients with aortic stenosis. Circulation 2012;125:76-86.
31. Palicov RE, Walsh WF. Retrograde crossing of aortic Bjork-Shiley prosthetic Am J Cardiol 1979;43:1062-4.
32. Dunn M. Is transseptal catheterization necessary ? J Am Coll Cardiol 1985;5:1393-4
33. Bayer AS.Infective endocarditis. Clin Infect Dis 1993;17:313-20
34. Gueret P, Vignon P, et al. Transesophageal echocardiography for the diagnosis and management of nonobstructive thrombosis of mechanical mitral valve prosthesis. Circulation 1995;91:103-10
35. Barbetseas J, Nagueh SF, et al. Differentiating thrombus from pannus formation in obstructed mechanical prosthetic valve:an evaluation of clinical , transthoracic and transesophageal echocardiographic parameters. J Am Coll Cardiol 1998;32:1410-7.
36. Wendy Tsang, Lynn Weinert,Itzhak Kronzon, Roberto M Lang Three dimensional Echocardiography in the assessment of Prosthetic Valves. Rev Esp Cardiol:2011;64(1):1-7
37. Kort S. Real time 3 Dimensional echocardiography for prosthetic valve endocarditis:initial experience. J Am Soc Echocardiogr.2006;19:130-9
38. Kronzon I, Sugeng I,Perk G etal. Real time 3 dimensional transesophageal echocardiography in the evaluation of post operative mitral annuloplasty ring and prosthetic valve dehiscence. J Am Coll Cardiol, 2009;53:1543-7
39. Perk G,Lang RM, et al .Use of real time three dimensional transesophageal echocardiography in intracardiac catheter based interventions. J Am Soc Echocardiogr;2009;22:865-82
40. Takahiro Shiota ,Role of modern 3D echocardiography in valvular heart disease. Korean J Intern Med 2014;29:685-702

212 Cardiology Today VOL. XXII NO. 6 NOVEMBER-DECEMBER 2018
REVIEW ARTICLE
41. Sordi M,Brochet E, Messika-Zeitoun D.Mitral paravalvular leak detected by three dimensional transesophageal echocardiography.Arch Cardiovasc Dis 2013;106:627-628
42. Ozkan M, Gursoy OM et al.Real time three dimensional transesophageal echocardiography in the assessment of mechanical prosthetic mitral valve ring thrombosis.Am J Cardiol 2013;112:977-983
43. Kort A, Kronzon I:Microbubble formation : In vitro and in vivo observation. J Clin ultrasound 10:117-120,1982
44. Rozich JD, Edwards WD et al. Mechanical prosthetic
valve associated strands:Pathologic correlates to transesophageal echocardiography. J Am Soc Echocardiogr 16:97-100,2003
45. Barbetseas J, Nagueh SF et al. Differentiating thrombus from pannus formation in obstructed mechanical prosthetic valves: An evaluation of clinical, transthoracic and transesophageal echocardiographic parameters. J Am Coll Cardiol 32:1410-1417,1998
46. Takahiro Shiota. Role of echocardiography for catheter based management of valvular heart disease. Journal of Cardiology 69(2017) 66-73.
47. Otto Catherine M, Pibarot P, Dumesnil JG,
editors. Textbook of Clinical echocardiography
2013;I(Chapter25):470-493.
48. Vahanian A, Baumgartner H, et al. Task Force on the
management of Valvular Heart Disease of the European
Society of Cardiology Eur Heart J.2007;28:230-68
[PubMed].
49. Rajani R, Kakad M. et al. Paravalvular regurgitation
one year after Transcatheter aortic valve implantation.
Catheter Cardiovasc Interv. 2010;75:868-72[PubMed]
REVIEW ARTICLE

Cardiology Today VOL. XXII NO. 6 NOVEMBER-DECEMBER 2018 213
Mechanism of Hypertension
REVIEW ARTICLE
ALPANA RAIZADA, SHRIDHAR DWIVEDI
Keywords z hypertension mechanism z genetic factors z RAAS z sympathetic tone z obesity z dietary salt
Dr. Alpana Raizada is Associate Professor of Medicine, UCMS-GTB Hospital, New Delhi; Dr. Shridhar Dwivedi is Senior Consultant Cardiologist, National Heart Institute, New Delhi
AbstractHypertension is expected to affect more than half of the adult population of the world and its consequences contribute significant morbidity and mortality across the globe. Despite widespread prevalence and aggressive research into its etiopathogenesis only about 5% of patients with hypertension have an identifiable cause. The complex multifactorial mechanisms leading to hypertension have resulted in an increased number of people with suboptimally controlled blood pressure in spite of the advances in antihypertensive drug therapy. Hypertension results from dynamic interactions between multiple genetic, physiological, psychological, and environmental factors. An improved understanding of these dynamic interactions may pave the path for more targeted interventions in the long run.
INTRODUCTIONHypertension is a major modifiable risk factor for cardiovascular disease (CVD). The estimated global prevalence of hypertension is high.About 26% of the world's adult population (972 million) had hypertension in the year 20001 which increased to 31% (1.39 billion) in 2010.2 Rates were higher in low- and middle-income (31.5%) than in high-income (28.5%) countries. Long-term projections suggest that, by 2025, 29 percent of adults worldwide would have hypertension (1.56 billion people globally).1 Despite extensive research over the past several decades, the etiology of most cases of adult hypertension is still unknown, and control of blood pressure is suboptimal in the general population especially in lower-income countries.3,4 In 2010, hypertension control was estimated to be 28% in high-income and 8% in middle- and low-income countries.2 Suboptimal control
has been observed not just in general population but also in units dedicated to control of hypertension.5 Prevention and treatment of hypertension is an important public health challenge due to associated high morbidity, mortality and cost to the society.
PRIMARY HYPERTENSION Primary, essential or idiopathic hypertension is defined as high blood pressure (BP) in which secondary causes such as renovascular disease, renal failure, pheochromocytoma, aldosteronism, monogenic hypertension or other causes of secondary hypertension are not present. Primary hypertension accounts for about 95% of all cases of hypertension. Primary hypertension is a heterogeneous disorder, with different patients having different causal factors that lead to high BP. The pathogenesis of primary hypertension is multifactorial and highly complex.

214 Cardiology Today VOL. XXII NO. 6 NOVEMBER-DECEMBER 2018
Factors that play an important role in the pathogenesis of hypertension include:
z Genetics z Autonomic nervous system z Renin-angiotensin-aldosterone
system (RAAS) z Obesity z Dietary salt intake
A number of other factors have also been incriminated in causing hypertension namely, insulin resistance,
high alcohol intake, aging, sedentary lifestyle, stress, low potassium intake, and low calcium intake (Figure 1).
GENETIC FACTORS IN THE PATHOGENESIS OF HYPERTENSIONBlood pressure is a classic quantitative genetic trait with family and twin studies estimating the heritability of blood pressure to about 30 to 50 percent.7-9 Thus genomics has the potential to contribute
to the poorly understood pathogenesis of primary hypertension. The importance of genes in hypertension is underlined by the fact that hypertension is 2.4 times more common in subjects who have two hypertensive parents.10 The genetic contribution to blood pressure regulation is of two different types:1. Monogenic hypertension and rare
genetic variants – Rare mutations segregating in families can cause secondary hypertension, even in the absence of other risk factors ("monogenic" hypertension, such as Liddle's syndrome). Once a monogenic form of hypertension is identified, these cases should be labelled as secondary rather than primary hypertension.
2. Primary hypertension and common genetic variants – There are possibly hundreds to thousands of common genetic hypertension risk variants that are modulated by environmental factors such as age, body mass index (BMI), sex, salt consumption etc. Therefore, primary hypertension cannot be due to one or only a few genetic variants, and there is no entity as the primary hypertension gene.
Genome-wide association studies (GWAS) have facilitated the understand-ing of the genetic basis of primary hy-pertension by easing out genotyping of hundreds of thousands of variants. This method searches the genome for small variations, called single nucleotide poly-morphisms (SNPs) that occur more fre-quently in people with a particular dis-ease than in people without that disease. Many studies have shown associations of gene polymorphisms and BP, but the ge-netic variants that contribute to essential hypertension remain unknown. Despite these inconsistent findings, it is believed that genetic factors may account for up to 30-50% of BP variance.11 Genetic fac-tors also influence behavioural patterns, which might leadto BP elevation. For ex-ample, a tendency toward obesity or alco-holism is influenced by both genetic and environmental factors. Thus, the propor-tion of BP variance caused by inheritance is difficult to determine and may vary in-different populations.
Can we do something to modify some of these factors ?
Stress / Sympathetic activation Yoga / Meditation
Sodium retention Diuretic / Low sodium diet
Obesity Diet control / Exercise
Alcohol
Environmental Pollutant
Abstinence
Plant more green plants, less noise pollution,
less green house effect
Figure 1. Pathophysiologic mechanisms of hypertension - [Adapted from Calhoun DA, 2000]6
REVIEW ARTICLE

Cardiology Today VOL. XXII NO. 6 NOVEMBER-DECEMBER 2018 215
AUTONOMIC NERVOUS SYSTEMOne of the most widely accredited and tested hypotheses in cardiovascular research is that derangement of sympathetic and parasympathetic cardiovascular regulation leads to hypertension. Adrenergic reflexes modulate blood pressure over the short term and adrenergic function in association with hormonal and volume related factors contributes to the long-term regulation of arterial pressure (Figure 2).
Autonomic imbalance (increased sympathetic tone accompanied by reduced parasympathetic tone) contributes to the development and maintenance of hypertension through stimulation of the heart, peripheral vasculature, and kidneys, causing increased cardiac output, increased vascular resistance, and fluid retention. Evidence supporting role of autonomic imbalance is elucidated by results that sustained increases in heart rate are due mainly to decreased parasympathetic tone and that diastolic blood pressure relates more closely to vascular resistance (modulated by sympathetic tone) than to cardiac function.
The mechanisms of increased sympathetic nervous system activity in hypertension are complex and involve alterations in baroreflex and chemoreflex pathways at both peripheral and central levels. Also, chronic sympathetic stimulation induces vascular remodelling and left ventricular hypertrophy,
presumably by direct and indirect actions of norepinephrine on its own receptors, as well as on release of various trophic factors, including transforming growth factor-b, insulin-like growth factor 1, and fibroblast growth factors.11 Circulating norepinephrine levels exhibit positive correlation with left ventricular mass, and reduced radial artery compliance (an index of vascular hypertrophy).12 Renal sympathetic stimulation is also increased in hypertensive patients compared with normotensive controls. Thus, sympathetic mechanisms contribute to the development of target organ damage, as well as to the pathogenesis of hypertension.
RENIN-ANGIOTENSIN- ALDOSTERONE SYSTEM (RAAS)The RAAS plays a dominant role in salt and water homeostasis and hence BP control. It is also an important therapeutic target. Granular cells in the juxtaglomerular apparatus synthesize and release renin.
Renin release is mediated by: z decreased afferent arteriolar (i.e. renal
perfusion) pressure of any cause. z Sympathetic nervous system
activation (granular cell B -1 receptors).
z Decreased Na + delivery to the distal tubule (sensed by the macula densa).
z Prostacyclin, ACTH. Renin converts inactive
angiotensinogen into angiotensin I, which, in turn, is converted by angiotensin converting enzyme
(ACE) in the lungs to active angiotensin II (A2). A2 binds to two receptors AT-1 and AT-2.
ANGIOTENSINAngiotensin II increases blood
pressure by various mechanisms like: z Arteriolar vasoconstriction (and
venular constriction to a lesser extent).
z Efferent renal arteriolar vasoconstriction.
z Aldosterone secretion. z Adrenaline (epinephrine) release. z Smooth muscle hypertrophy. z Increased reabsorption of sodium in
PCT. z Inhibition of renin release (negative
feedback loop). z Renal mesangial cell growth and
matrix expansion. z Myocardial growth and matrix
expansion. z Stimulation of thirst and ADH
release.Most effects are mediated by the
angiotensin type 1 (AT-1) receptor. Circulating angiotensin II binds vascular receptors, but locally released A2 works at tissue level in a paracrine fashion. Tissue concentrations do not correlate with systemic levels but may correlate better with disease pathogenesis.
The activity of local renin–angiotensin systems and alternative pathways of angiotensin II formation may make an important contribution to remodelling of resistance vessels and the development of target organ damage (including left ventricular hypertrophy, congestive heart failure, atherosclerosis, stroke, end-stage renal disease, myocardial infarction, and arterial aneurysm) in hypertensive persons.
ALDOSTERONEAldosterone synthesis occurs mainly in the zona glomerulosa of the adrenal cortex and is tightly regulated by the renin - angiotensin system (RAS) and electrolyte homeostasis (increased K+ or decreased Na+ intake increases aldosterone synthesis). Aldosterone acts at the collecting duct to promote Na + retention and K + excretion.
Figure 2: Role of ANS in the pathogenesis of cardiovascular diseases. (Adapted from Brook RD, Julius S)

216 Cardiology Today VOL. XXII NO. 6 NOVEMBER-DECEMBER 2018
ANGIOTENSIN II AND OXIDATIVE STRESSAngiotensin II also increases cardiovascular risk by stimulating oxidant production. This forms the basis of clinically important vasoprotective effects beyond lowering of blood pressure as exhibited by ACE inhibitors and ARBs which limit oxidative reactions in the vasculature by blocking the activation of NAD(P)H oxidase (Figure 3).
OBESITY AND INSULIN RESISTANCEObesity is an important cardiovascular health problem, the incidence and prevalence of which is reaching epidemic proportions in developed and developing countries. Apart from being hypertensinogenic obesity is also the cause of insulin resistance, adult-onset diabetes mellitus, left ventricular hypertrophy, hyperlipidemia, and atherosclerotic disease. It is estimated that at least 75% of the incidence of hypertension is related directly to obesity. Each 10% weight gain has been seen to be associated with a 6.5 mmHg increase in systolic BP. The relationship between BP and body fat is not just continuous throughout the entire range of body weight but is also evident from early childhood to old age.
The mechanism by which obesity
raises BP is still incompletely understood. Several factors have been implicated in the pathogenesis of obesity related hypertension (Table 1).14 Increased BMI is associated with an increase in plasma volume and cardiac output; which can be decreased by weight loss in both normotensive and hypertensive subjects, even when sodium intake is kept relatively constant. However, BP in obese adolescents is sodium sensitive, and significant drop in mean BP can be achieved after shifting to a low-sodium diet.Loss of weight by dieting in these
individuals decreased BP as well as salt sensitivity. The variables that best predicted sodium sensitivity were fasting plasma insulin, plasma aldosterone, and plasma norepinephrine, supporting the hypothesis that BP is sensitive to dietary sodium and that this sensitivity may be due to the combined effect of hyperinsulinemia, hyperaldosteronism, and increased activity of the sympathetic nervous system. It was also observed that exercise even without weight loss lowered BP especially in those who initially had high fasting insulin and whose insulin levels fell in response to exercise. Thus, exercise decreases plasma insulin by a different mechanism than loss of body weight and that decreasing insulin resistance by losing weight or exercising reduces BP.
DIETARY SALT INTAKE AND HYPERTENSIONThe level of BP in an individual is a cumulative effect of several influences like genetics, environmental, physiologic and clinical genetic factors. Of these the most readily modifiable factor is dietary sodium intake which has a very important role in the pathogenesis of hypertension. More than 100 trials examining the relationship between sodium intake and BP have shown evidence that reduction in sodium intake is coupled with reduction in BP. This reduction is evident across all age groups in both hypertensive as Figure 3: DA Mechanism of angiotensin II (ANG II)- dependent, oxidant-mediated vascular
damage. (Adapted from Oparil, Zaman & Calhoun, 2003)
Table 1: Pathogenesis of Obesity-Related Hypertension14
Central (abdominal) obesity
Insulin resistance (hyperinsulinemia)
↑ Leptin levels
Sympathetic nervous system (SNS) activity
Insulin
Leptin
↑ Renin-angiotensin-aldosterone system activity
SNS stimulation of renin release
↑ Angiotensinogen from intra-abdominal adipocytes
↑ Aldosterone production (in excess of angiotensin stimulation)
Salt sensitivity (↑renal sodium reabsorption)
SNS
Insulin
Angiotensin (all)
Aldosterone
Intra-renal blood flow redistribution
REVIEW ARTICLE

Cardiology Today VOL. XXII NO. 6 NOVEMBER-DECEMBER 2018 217
well and normotensive individuals.15 A reduced sodium intake has the potential to delay the onset of hypertension as well as blunt the age-related rise in BP and thus contribute to the overall reduction in cardiovascular disease risk.
"Salt sensitivity" is the term applied to the heterogeneous BP response to an increased sodium intake which may be influenced by age, gender, genetics and presence of certain clinical conditions like hypertension, diabetes, and chronic kidney disease. It has been shown that greater BP response to change in sodium intake has been seen in blacks as compared to whites, hypertensives as compared to nonhypertensives, and older persons as compared to younger adults.16,17
There is positive correlation of total exchangeable sodium with arterial pressure. This increase in BP is not by increase in blood volume but by increase in peripheral resistance. High sodium and low potassium inhibit the sodium pump, increase intracellular sodium, and drive calcium into cells, which ultimately induces vascular smooth muscles contraction and increases peripheral vascular resistance.18 The hypothesis that in most cases of essential hypertension excessive salt intake leads to gene expression for hypertension is supported by the Framingham Offspring cohort wherein heterozygote carriers of rare gene variants (Bartter and Gitelman syndromes), identified in 1.2% of the study cohort, had a systolic blood pressure 6 to 9 mmHg greater than that of noncarriers.19
A low-salt diet is an integral component of non-pharmacologic therapy of primary hypertension. Some of the prevailing recommendations are:
z World Health Organization (WHO) recommends that adults consume <2000 mg/day of sodium.
z The United States Dietary Guidelines, prepared by the United States Departments of Agriculture and of Health and Human Services, recommends ≤2300 mg/day of sodium consumption by adults.
z The American Heart Association recommends <1500 mg/day of sodium as intake for all Americans.
z The Kidney Disease: Improving Global Outcomes (KDIGO) guidelines recommends a sodium intake of <2.0 g (90 mmol)/day for patients with chronic kidney disease not on dialysis.
The prevalence of hypertension is increasing by leaps and bounds. As most of the times an etiological diagnosis of hypertension remains elusive, therefore a better understanding of the mechanisms of hypertension may lead to more targeted therapies and can ultimately translate into greater reduction in hypertension-related cardiovascular disease morbidity and mortality.
REFERENCES1. Kearney PM, Whelton M, Reynolds K, Muntner P, Whelton
PK, He J. Global burden of hypertension: analysis of worldwide data. Lancet 2005; 365:217-23.
2. Mills KT, Bundy JD, Kelly TN, Reed JE, Kearney PM, Reynolds K , et al. Global Disparities of Hypertension Prevalence and Control: A Systematic Analysis of Population-Based Studies From 90 Countries. Circulation 2016; 134:441-50.
3. Wang YR, Alexander GC, Stafford RS. Outpatient hypertension treatment, treatment intensification, and control in Western Europe and the United States. Arch Intern Med 2007; 167:141-47.
4. Chow CK, Teo KK, Rangarajan S, Islam S, Gupta R, Avezum A, et al. Prevalence, awareness, treatment, and control of hypertension in rural and urban communities in high-, middle-, and low-income countries. JAMA 2013; 310:959-68.
5. Banegas JR, Segura J, Ruilope LM,Luque M, Gracia-Robles, Campo C, et al. Blood pressure control and physician management of hypertension in hospital hypertension units in Spain. Hypertension 2004; 43:1338-44.
6. Calhoun DA, Bakir SE, Oparil S. Etiology and pathogenesis of essential hypertension. In: Crawford MH, DiMarco JP,
eds. Cardiology. London: Mosby International; 2000:3.1-3.10.
7. Levy D, Larson MG, Benjamin EJ, Newton-Cheh C, Wang TJ, Hwanq SJ, et al. Framingham Heart Study 100K Project: genome-wide associations for blood pressure and arterial stiffness. BMC Med Genet 2007; 8 Suppl1:S3.
8. Snieder H, Hayward CS, Perks U, Kelly RP, Kelly PJ, Spector TD. Heritability of central systolic pressure augmentation: a twin study. Hypertension 2000; 35:574-79.
9. Kupper N, Willemsen G, Riese H, Posthuma D, Boomsma DI, de Geus EJ. Heritability of daytime ambulatory blood pressure in an extended twin design. Hypertension. 2005; 45:80–85.
10. Wang NY, Young JH, Meoni LA, Ford DE, Erlinger TP, Klag MJ. et al. Blood pressure change and risk of hypertension associated with parental hypertension: The Johns Hopkins Precursors Study. Arch Intern Med 2008; 168:643-48.
11. Brook RD, Julius S. Autonomic imbalance, hypertension, and cardiovascular risk. Am J Hypertens. 2000; 13:112S-122S.
12. Marcus R, Krause L, Weder AB, Dominguez-Meja A, Schork NJ, Julius S. Sex-specific determinants of increased left ventricular mass in the Tecumseh Blood Pressure Study. Circulation. 1994; 90:928-36.
13. Oparil S, Zaman MA, Calhoun DA. Pathogenesis of hypertension. Ann Intern Med. 2003; 139:761-76.
14. Landsberg L, Aronne LJ, Beilin LJ, Burke V, Igel LI, Lloyd-Jones D et al. Obesity-related hypertension: Pathogenesis, cardiovascular risk, and treatment: a position paper of the Obesity society and the American Society of Hypertension. 2013 Jan; 15:14-33.
15. Graudal NA, Hubeck-Graudal T, Jurgens G. Effects of low sodium diet versus high sodium diet on blood pressure, renin, aldosterone, catecholamines, cholesterol, and triglyceride. Cochrane Database Syst Rev. 2011;CD004022.
16. Bray GA, Vollmer WM, Sacks FM, Obarzanek E, Svetkey LP, Appel LJ, et al. DASH Collaborative Research Group. A further subgroup analysis of the effects of the DASH diet and three dietary sodium levels on blood pressure: results of the DASH-Sodium Trial. Am J Cardiol. 2004; 94:222-7.
17. Aburto NJ, Ziolkovska A, Hooper L, Elliott P, Cappuccio FP, Meerpohl JJ. Effect of lower sodium intake on health: systematic review and meta-analyses. BMJ. 2013; 346:f1326.
18. Adrogue HJ, Madias NE. Sodium and potassium in the pathogenesis of hypertension. N Engl J Med. 2007; 356:1966-78.
19. Ji W, Foo JN, O’Roak BJ, Zhao H, Larson MG, Simon DB, et al. Rare independent mutations in renal salt handling genes contribute to blood pressure variation. Nat Genet. 2008; 40:592-599.

218 Cardiology Today VOL. XXII NO. 6 NOVEMBER-DECEMBER 2018
“U” wave
ECG OF THE MONTH
SR MITTAL
AbstractU-wave is the wave between T wave and P wave. It is usually seen with slow heart rate and is most apparent in leads V2 to V4. Its polarity is same as that of T wave. Its amplitude is normally less than one third of the amplitude of T wave. Genesis of this wave is uncertain. A positive, low amplitude U wave is most often physiological. Prominent U wave is common in bradycardia and hypokalemia. Negative U wave is usually ischemic in origin.
Keywords z bradycardia z coronary artery disease. z hypokalemia z left ventricular hypertrophy z ischemic heart disease z QT interval z U wave
(A) INTRODUCTIONU wave is the wave between T wave and P wave. Its genesis is not clear. Several hy-potheses have been proposed but there is no consensus of opinion.
(B) PHYSIOLOGICAL U WAVEU wave is a small wave after the end of T wave. It can be identified in all leads but is usually most apparent in leads V2 to V4
2 (Figure 1). It is better visible at slower heart rate (<65 beats/ minute)2 and in elderly.3 Amplitude is normally less than 0.2mv. Amplitude varies directly with the amplitude of T wave.2 Normally it is less than 25% of the amplitude of T wave. Amplitude is also dependent on heart rate. There is inverse relationship between heart rate and U wave amplitude. i.e. U wave amplitude increases with decrease in heart rate.1 Normally the polarity of U wave is same as that of T wave.3 There-fore U wave is normally negative in lead aVR and at times in lead V1
2 (Figure 2).
Dr. SR Mittal is Head, Department of Cardiology at Mittal Hospital and Research Centre, Ajmer, Rajasthan
Figure 1. Electrocardiogram showing normal U wave.
Figure 2. Electrocardiogram showing normally inverted U wave in leads aVR and V1.

Cardiology Today VOL. XXII NO. 6 NOVEMBER-DECEMBER 2018 219
Clear U wave is not recognized in pres-ence of atrial fibrillation due to wavy base line2 (Figure 3). However it can be visible in patients with straight line fibrillation with controlled ventricular rate (Figure 4). Sometimes in patients of atrial fibril-lation, fibrillary waves may be confused with normal U wave and P wave (Figure 5A). Recording long lead helps in identi-fying the irregularity of rhythm and true nature of fibrillary waves (Figure 5B).
At times T wave may encroach on U wave making a T-U complex. In such a situation, it may be difficult to differentiate U wave from second peak of a notched T wave. Apices of a notched T wave are usually less than 0.15 second apart (Figure 6) where as the interval between the apices of T wave and U wave is usually more than 0.15 sec.2 Secondly, normal U wave is less than one third of the amplitude of T wave. Therefore, in a T-U complex, the second peak is much smaller than the first peak (Figure 7). On the contrary, second peak more than 50% of first peak strongly suggests a bifid T wave.
U wave is similar to P wave in appearance.1 In patients of atrial fibrillation with fast ventricular rate, it may be misinterpreted as a P wave if a QRS complex follows it (Figure 8). Irregularly irregular rhythm and absence of such pseudo P wave in most of the beats helps correct identification of atrial fibrillation. In patients with sinus bradycardia, U wave may be misinterpreted as additional P wave resulting in wrong diagnosis of 2:1. A-V block1 (Figure 9). Time
interval between preceding P wave and U wave is however, different from the interval between U wave and following P wave (Figure 9). This gives a clue to identification of U wave.
(C) PROMINENT U WAVEU wave is prominent in following conditions (1) Hypokalemia- It is the commonest
cause of prominent U wave (Figure
8,9). It is associated with depression of ST segment and decreased ampli-tude of T wave. ECG changes may appear even when serum potassium concentration is within normal lim-its.4
(2) Hypocalcemia(3) Hypomagnesemia(4) Antiarrhythmic drugs e.g. Amiodar-
one, dofetilide QT interval is prolonged with fusion
of T and U waves forming a prominent and broad T-U fusion wave (Figure 12)
(5) Hypothyroidism Sinus bradycardia, low voltage QRS
and relative flattening of T wave are other findings (Figure 13)
(6) Hypothermia(7) Inherited long QT syndrome type 3
Figure 3. Electrocardiogram from a case of coarse atrial fibrillation showing difficulty in identification of U wave.
Figure 4. Electrocardiogram from a case of straight line atrial fibrillation with identification of U wave.
Figure 5 A. Electrocardiogram showing pseudo U wave and P wave. B. Continuous recording of lead II showing atrial fibrillary waves (F).
Figure 6. Electrocardiogram showing bifid(notched) T wave.
Figure 7. Electrocardiogram showing fusion of T and U waves.

220 Cardiology Today VOL. XXII NO. 6 NOVEMBER-DECEMBER 2018
ECG OF THE MONTH
Figure 9. Diagrammatic representation comparing electrocardiographic findings (a) in a case of sinus bradycardia with prominent U wave (b) from a case of 2:1 A-V block.
Figure 10. Electrocardiogram from a patient of hypokalemia showing prominent U wave.
Figure 11. Electrocardiogram from a patient of hypokalemia showing prominent U wave.
Figure 12. Electrocardiogram showing fusion of T and U wave with prolongation of QT interval.
Figure 13. Electrocardiogram from a case of hypothyroidism showing sinus bradycardia, low voltage QRS, decreased amplitude of T wave and prominent U wave.
Figure 8. Electrocardiogram showing U wave giving a false impression of a P wave during fast rate in a case of atrial fibrillation.
Figure 14. Diagrammatic representation of (A)normal electrocardiogram and (B) electrocardiographic findings in type 3 inherited long QT syndrome showing pro-longed QT interval, late onset of T wave and prominent U wave.
Figure 15. Diagrammatic representation of inverted U wave on posterior surface of heart (leads V8,V9) producing reciprocal prominent U wave in anterior precordial leads (V2, V3).
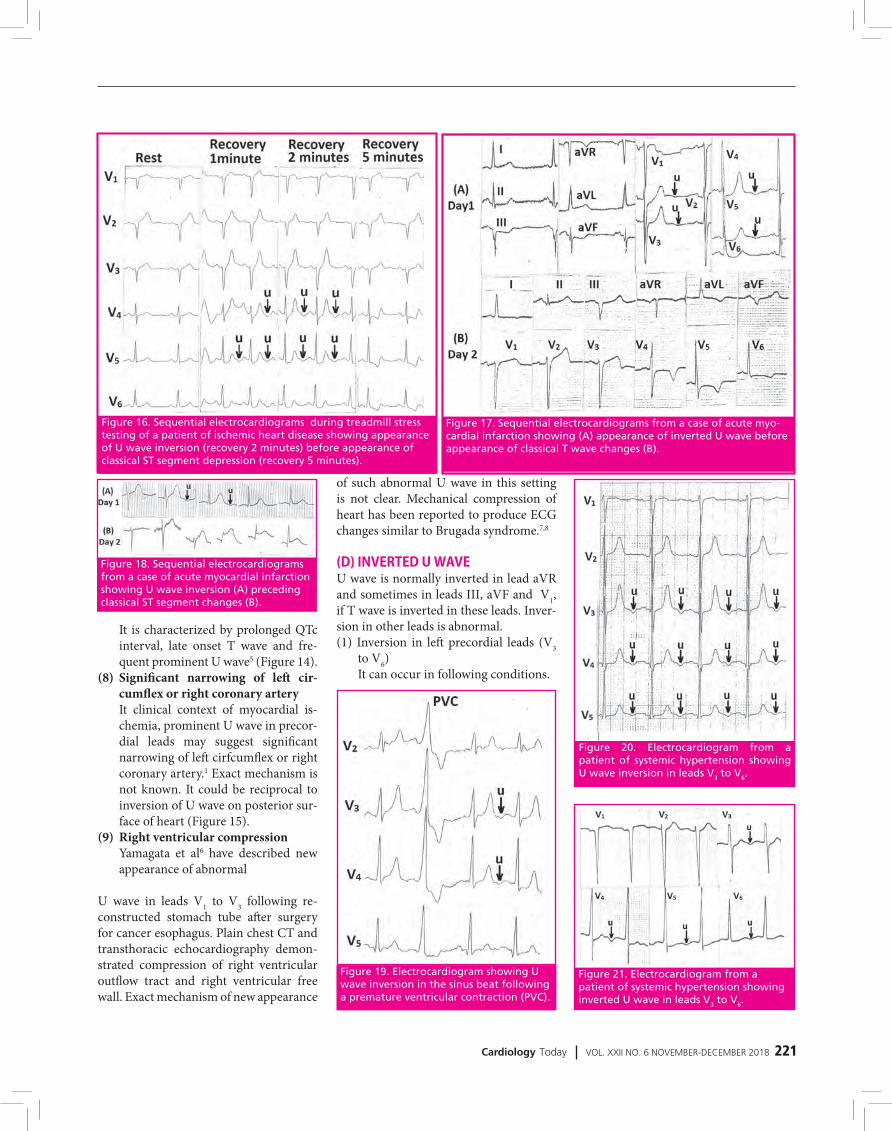
Cardiology Today VOL. XXII NO. 6 NOVEMBER-DECEMBER 2018 221
Figure 19. Electrocardiogram showing U wave inversion in the sinus beat following a premature ventricular contraction (PVC).
Figure 20. Electrocardiogram from a patient of systemic hypertension showing U wave inversion in leads V3 to V6.
Figure 21. Electrocardiogram from a patient of systemic hypertension showing inverted U wave in leads V3 to V6.
of such abnormal U wave in this setting is not clear. Mechanical compression of heart has been reported to produce ECG changes similar to Brugada syndrome.7,8
(D) INVERTED U WAVEU wave is normally inverted in lead aVR and sometimes in leads III, aVF and V1, if T wave is inverted in these leads. Inver-sion in other leads is abnormal. (1) Inversion in left precordial leads (V3
to V6) It can occur in following conditions.
It is characterized by prolonged QTc interval, late onset T wave and fre-quent prominent U wave5 (Figure 14).
(8) Significant narrowing of left cir-cumflex or right coronary artery
It clinical context of myocardial is-chemia, prominent U wave in precor-dial leads may suggest significant narrowing of left cirfcumflex or right coronary artery.1 Exact mechanism is not known. It could be reciprocal to inversion of U wave on posterior sur-face of heart (Figure 15).
(9) Right ventricular compression Yamagata et al6 have described new
appearance of abnormal
U wave in leads V1 to V3 following re-constructed stomach tube after surgery for cancer esophagus. Plain chest CT and transthoracic echocardiography demon-strated compression of right ventricular outflow tract and right ventricular free wall. Exact mechanism of new appearance
Figure 16. Sequential electrocardiograms during treadmill stress testing of a patient of ischemic heart disease showing appearance of U wave inversion (recovery 2 minutes) before appearance of classical ST segment depression (recovery 5 minutes).
Figure 17. Sequential electrocardiograms from a case of acute myo-cardial infarction showing (A) appearance of inverted U wave before appearance of classical T wave changes (B).
Figure 18. Sequential electrocardiograms from a case of acute myocardial infarction showing U wave inversion (A) preceding classical ST segment changes (B).

222 Cardiology Today VOL. XXII NO. 6 NOVEMBER-DECEMBER 2018
ECG OF THE MONTH
Figure 22. (A) Electrocardiogram from a patient of systemic hypertension with hypoka-lemia showing prominent U wave in leads V2 to V6 (B) Electrocardiogram recorded after correction of hypokalemia showing normalization of U wave.
Figure 23. Electrocardiogram showing U wave inversion in leads I and aVL with prominent U wave in leads V2 to V4.
Figure 24. Electrocardiogram showing prominent negative T-U complex with pro-longed QT interval in leads I, II, III, aVF and V2 to V7 with positive T-U complex in leads aVR, V5R to V1.
zmetal’s angina/variant angina)13
(iii) During exercise testing U wave inversion may precede ST seg-ment depression(Figure 16)
(iv) Acute anterior myocardial infarc-
tion. U wave inversion may pre-cede other electrocardiographic changes (Figure 17, 18).
(v) Post extrasystolic (pause depend-ent)U wave inversion also sug-gest underlying coronary artery disease13 (Figure 19).
(b) Left ventricular hypertrophy (i) Systemic hypertension (Figure
20,21)(ii) Aortic stenosis(iii) Hypertrophic cardiomyopathy Presence of prominent U wave in
presence of electrocardiographic findings of left ventricular hyper-trophy should lead to suspicion of underlying hypokalemia (Fig-ure 22).
(c) Hyperthyroidism11
(2) Inversion in lead I and aVL It suggests lateral ischemia. Concomi-
tant prominent U wave in leads V2 to V4 (Figure 23) suggests the possibility of additional posterior ischemia.
(3) Inversion in right precordial leads (V1, V2)
Right ventricular hypertrophy11
(4) Inversion in inferior leads (II, III, aVF)
Inferior ischemia(5) Broad negative TU complex Negative TU complex with prolonged
QT interval can be seen in setting of myocardial infarction (Figure 24,25) or raised intracranial pressure (Figure 26). As a reciprocal change TU fusion
(a) Acute myocardial ischemia9
It is a marker of significant stenosis of left anterior descending coronary ar-tery or left main coronary artery.10,11,12
(i) During attack of angina(ii) During coronary spasm (Prin-

Cardiology Today VOL. XXII NO. 6 NOVEMBER-DECEMBER 2018 223
Figure 25. Electrocardiogram showing anterior myocardial infarction with negative T-U complex in leads V3 and V4
and inverted U wave in leads V5 and V6.
Figure 26. Electrocardiogram showing negative T-U complex with prolonga-tion of QT interval.
wave is positive in lead aVR, right sided chest leads (V3R to V5R) and posterior chest leads (V7 to V9)
REFERENCES1. www.cardiocases.com/en/ecg/traces/normal-and -patho-
logical-ecg-uwave/u-wave2. U wave – an over view/ Science Direct Topics https://www.sciencedirect.com/topics/medicine-and-
dentistry/u-wave3. de Luna AB, Goldwasser D, Fiol M, Bayes Genis A. Surface
electrocardiography. In Fuster V, Walsh RA, Harrington RA (eds) Hurst’s The Heart. Mc Graw Hill; New York; 2017: 252-317.
4. Wagner GS. Wang TY. Miscellaneous conditions. In Wag-ner GS(ed). Marriott’s Practical Electrocardiography. Wolters Kluwer, New Delhi; 2001: 209-237.
5. Perez- Riera AR, Barbosa Barros R, Daminello Raimundo R, da Costa de Rezende Barbosa MP, Esposito sorpreso IC, de Abreu LC. The congenital long QT syndrome type 3. An update Indian Pacing Electrophysiol J 2018; 18 : 25-35.
6. Yamagata K, Uno K, Mori K, Seto Y. Unusual U wave induced by reconstructed retrosternal esophagus. Clin Case Rep 2015; 3 : 949-951.
7. Tarin N, Farre J, Rubio JM, Tunon J, Castro Dorticos J. Bru-gada like electrocardiographic pattern in a patient with mediastinal tumor. Pacing Clin Electrophysiol 1999; 22: 1264-66.
8. Shimizu W. Acquired forms of Brugada syndrome. J Elec-trocardiol 2005; 38: 22-5.
9. Sovari AA, Farokhi, F Kocheril AG. Inverted U wave, a spe-cific electrocardiographic sign of cardiac ischemia. Am J Emerg Med 2007; 25 : 235-7.
10. Gerson MC, Mc Henry PL. Resting U wave inversion as a marker of stenosis of the left anterior descending coro-nary artery. Am J Med 1980; 69: 545-50.
11. Burns E. U wave. https!//litfl.com/u-wave-ecg-li-brary/2018
12. Mirvis DM, Goldberger AL. Electrocardiography. In Zipes DP, Libby P, Bonow RO, Mann DL, Tomaselli GF(eds) Braunwald’s Heart Disease. Elsevier, Canada; 2019; 117-153.
13. Nice seeing “U” again. Heeps:/ ecg.utah.edu/lesson /12

224 Cardiology Today VOL. XXII NO. 6 NOVEMBER-DECEMBER 2018
Q1. U wave is usually most clearly visible in leads
(A) V3R to V6R(B) V2V3,V4 (C) V7,V8 V9(D) II, III, aVF
Q2. U wave is usually best seen at heart rate
(A) <65/min(B) 80 to 100/min(C) 100 to 120/min(D) >120/min
Q3. U wave is frequently seen in (A) Children (B) Adults(C) Middle aged(D) Elderly
Q4. Amplitude of normal U wave is (A) <2mm (B) 2 to 4mm (C) 4 to 6mm(D) >6mm
Q5. Amplitude of normal U wave is (A) <25 % of T wave(B) 30 to 40% of T wave(C) 40 to 50% of T wave(D) >50% of T wave
Q6. Amplitude of U wave(A) Increases with decreasing heart
rate(B) Increases with increasing heart
rate (C) Decreases with decreasing heart
rate (D) Is not affected by heart rate
Q7. In bifid T wave(A) Two apices are less than 0.16 sec-
ond apart (B) Two apices are more than 0.20
second apart(C) Second peak is less than one third
of the amplitude of first peak (D) Amplitude of second peak is more
than 50% of the amplitude of first peak
Q8. In fusion of T wave and U wave
MCQs(A) Left anterior descending coronary
artery (B) Ramus artery (C) Left circumflex artery (D) Right coronary artery
Q16. U wave is normally inverted in lead
(A) III(B) aVR(C) V9 (D) V4R
Q17. U wave inversion in leads V3 to V6 suggests
(A) Myocardial ischemia (B) Left ventricular hypertrophy (C) Hypothyroidism (D) Hypermagnesemia
Q18. U wave inversion in leads V3 to V5 suggests significant stenosis of
(A) Left main coronary artery (B) Left anterior descending coronary
artery (C) Left circumflex coronary artery (D) Posterior descending coronary ar-
tery
Q19. U wave inversion in leads II, III, aVF suggests significant stenosis of
(A) Left anterior descending coronary artery
(B) Posterior descending coronary ar-tery
(C) Right ventricular branch of right coronary artery
(D) First diagonal artery
Q20. U wave inversion in leads V1 and V2 can be seen in
(A) Dilated cardiomyopathy (B) Myocarditis (C) Right ventricular ischemia (D) Right ventricular compression
Q21. U wave inversion can be seen in (A) Systemic hypertension (B) Aortic stenosis (C) Hypertrophic cardiomyopathy (D) Hypothyroidism
(A) Two apices are less than 0.16 sec-ond apart
(B) Two apices are more than 0.16 second apart
(C) Second peak is less than one third of the amplitude of first peak
(D) Amplitude of second peak is more than 50% of the amplitude of first peak
Q9. Prominent U waves suggest (A) Hyperkalemia (B) Hyponatremia (C) Hypercalcemia (D) hypomagnesemia
Q10. Hypokalemia produces (A) Tachycardia (B) ST depression (C) Tall T wave (D) Tall U wave
Q11. Prominent U waves are seen in (A) Hypokalemia(B) Hypomagnesemia (C) Hyperthyroidism (D) Hyperthermia
Q12. Amiodarone produces (A) Prominent U wave (B) Broad T-U fusion wave (C) Torsades de pointes (D) All
Q13. Broad T-U fusion waves are pro-duced by
(A) Amiodarone (B) Dofetilide (C) Increased intracranial pressure (D) Thyrotoxicosis
Q14. Inherited long QT syndrome type 3 is characterized by
(A) Prolonged QT interval (B) Early onset T wave (C) Prominent U wave (D) Inverted U wave
Q15. In context of myocardial is-chemia prominent U wave in precordial leads (V2-V4) may suggest significant narrowing of
‘U’ Wave
Answers : (1) B, (2) A, (3) D, (4) A, (5) A, (6) A, (7) A,D, (8)B,C, (9)D, (10) B,D, (11)A,B, (12)A,B, (13) A,B,C, (14) A,C, (15) C,D, (16) B, (17) A,B, (18) A,B, (19)B, (20) C, (21)A,B,C.
PICTORIAL CMEECG OF THE MONTH

Cardiology Today VOL. XXII NO. 6 NOVEMBER-DECEMBER 2018 225
PICTORIAL CME
MONIKA MAHESHWARI
Dr. Monika Maheshwari is Professor, Jawahar Lal Nehru Medical College, Ajmer, Rajasthan
Poland Syndrome with Dextrocardia and Partial Agenesis of Ribs in Left Hemithorax
Poland syndrome is a rare congenital disorder, with incidence of 1:20,000 to 1:30,000 live births. It is characterized by ipsilateral absence of pectoralis major muscle. This syndrome is associated with various anomalies such as aplasia or hy-poplasia of breast, ipsilateral syndactyly and brachidactyly, dextrocardia, hernia-tion of lung etc. We report here, a rare case of Poland syndrome presented to us with dextrocardia with partial agenesis of ribs anteriorly beyond second rib in left hemithorax. These findings (dextrocardia associated with Poland syndrome without situs inversus nor complex intracardiac anomalies) confirm the hypothesis, that dextrocardia derives from a mechanical intrauterine displacement of a healthy heart toward the right side because of a lack of protection by the thoracic cage against external pressures.
Figure 1: Chest skiagram showing dextrocardia with partial agenesis of ribs anteriorly in left hemithorax, beyond second rib.

226 Cardiology Today VOL. XXII NO. 6 NOVEMBER-DECEMBER 2018
Volume IndexTable of ContentsVolume XXII, 2018
EDITORIALIs Concept of Hospitals out of Time ? OP Yadava Jan-Feb 3
Walk India Walk: Get your butts off ..... OP Yadava Mar-Apr 39
Workaholic Doctor - A Bane or Boon? OP Yadava May-June 75
'WIRED' Medicine or 'MIRED' Medicine OP Yadava Jul-Aug 107
Healthy Diet - Watch Press ! OP Yadava Sep-Oct 149
All that Glitters is Not Gold OP Yadava Nov-Dec 191
REVIEW ARTICLESAcute Rheumatic Fever and Newer Jone's Criteria IB Vijayalakshmi Jan-Feb 5
The New Brave World of Drugs for Dyslipidemia: Ready to Target ASCVD Beyond Statins PC Manoria Jan-Feb 11
Recent Developments in ICCU Care for Acute Cardiac Disorders Suraj Kumar, Vivek Gupta, Rohin Vinayak, Gurpreet S Wander Jan-Feb 21
Can We Use Information Technology (IT) for Blood Pressure Control in India? Kavita Singh, Devraj Jindal, Vamadevan S Ajay, Dorairaj Prabhakaran Mar-Apr 41
Improving CV Outcomes in Diabetes with New Antidiabetic Medications: A New Era has Begun PC Manoria, Nidhi Mishra, Pankaj Manoria Mar-Apr 46
Challenges in Heart Failure Management Mohit Bhagwati, Vidushi Rathi Ish, Pranav Ish, Rajeev Rathi Mar-Apr 53
Liraglutide and Cardiovascular Outcomes Jugal Kishor Sharma, Amit Gupta May-June 77
Anticoagulants in Atrial Fibrillation Geetha Subramanian, Aviraj Choudhary, Vikas Agrawal, Kamaldeep May-June 82
Newer Antidiabetic Agents & Cardio-Renal Benefits Vinod Mittal May-June 88
Aging Slowly, Living Longer and Future Projections for Exponential Survival and Longevity Vinod Nikhra Jul-Aug 109
Current Management of Acute Heart failure Mohan Bhargava, Mohit M Bhagwati, Prachal Bhargava Jul-Aug 120
Non Cardiac Surgery - How to 'Clear' a Patient ? PC Manoria, Pankaj Manoria, Nidhi Mishra Jul-Aug 129
PCSK9 Inhibitors Nitin Aggarwal, Harsh Wardhan Sep-Oct 151
Cardiovascular Disease, Obesity, MetS, T2DM and Aging, and Benefits of Calorie Restriction and Calorie Restriction Mimetics Vinod Nikhra Sep-Oct 158
Prosthetic Heart Valve Thrombosis: How to Manage? YK Arora Sep-Oct 169
Nutraceuticals: The New Age Therapeutics and Its Effect on Heart Health Shikha Sharma, Reena Rawat, Aastha Jessica Sep-Oct 174
Hypertension Case Study Peeyush Jain, Ashok Seth Nov-Dec 193
Echocardiographic Evaluation of Prosthetic Heart Valve; special reference to TEE and 3D echo Ashok K Omar, Rahul Kumar Nov-Dec 197
Mechanism of Hypertension Alpana Raizada, Shridhar Dwivedi Nov-Dec 213
CLINICAL OPINIONHypoglycemia & Cardiovascular Risk Vinod k Gujral Mar-Apr 61
Functional Assessment of Coronary Artery Disease Beyond Coronary Angiography Neeraj Bhalla, Amit Goel May-June 93
IMAGEIsolated Right Ventricular Hypertrophic Cardiomyopathy SR Mittal Jan-feb 26
Atrial Septal Aneurysm SR Mittal Mar-Apr 68
ECG OF THE MONTHT Wave SR Mittal Jan-Feb 30
Flat T wave SR Mittal Mar-Apr 71
Prominent (Tall) T waves SR Mittal May-June 98
T Wave Inversion SR Mittal Jul-Aug 135
QT Interval SR Mittal Sep-Oct 179
'U' wave SR Mittal Nov-Dec 218
MANUSCRIPT Manuscripts must be neatly typed in double space typing throughout on one side of the sheet of good quality bond pa-per of the size 28 x 22cm with 3cm margins on both sides. Words should not be hyphenated at the end of a line.Authors are requested to send the article on e-mail ([email protected]) or CD with one orginal copy of the type script should be submitted alongwith to the Publisher, CIMS Medica India Pvt Ltd, 709, Devika Tower, Nehru Place, New Delhi-1100 19.Material received for publication will be acknowledged and the decision regarding publication will be communicated to the “Author for correspondence”. The manuscript of case reports/studies and original articles should be arranged in the following sequence : Title page, Abstract, Key Words, Introduction, Material and Methods, Results, Discussion, Acknowledgments, References, Tables and legends to figures.Article title: Title should be concise, easier to read and should include all information in the title that will make electronic re-trieval of the article both sensitive and specific.Authors’ names and institutional affiliations: The name of the department(s) and institution(s) to which the work should be attributed.Disclaimers, if any, Source(s) of support in the form of grants, equipment, drugs, or all of these. Declaration of Conflict of Interest Contact information for corresponding authors: The name, mailing address, telephone and fax numbers, and e-mail ad-dress of the author responsible for correspondence about the manuscript (“corresponding author-may or may not be the “guarantor” for the integrity of the study). The name and ad-dress of the author to whom requests for reprints should be addressed or a statement that reprints are not available from the authors.Abstract: Structured abstracts are preferred for all original research, systematic reviews articles and case studies. The abstract should provide the background for the study or the article. In case of original research article abstract should state the study’s purpose, basic procedures, main findings, principal conclusions, and funding sources. Introduction: Provide a context or background for the study (that is, the nature of the problem and its significance). State the specific purpose or research objective of, or hypothesis tested by, the study or observation; the research objective is often more sharply focused when stated as a question. Both the main and secondary objectives should be clear, and any prespecified subgroup analyses should be described. Provide only directly pertinent references, and do not include data or conclusions from the work being reported.Methods: The Methods section should include only informa-tion that was available at the time the plan or protocol for the study was being written; all information obtained during the study belongs in the Results section.Selection and Description of Participants: Describe your selection of the observational or experimental participants (patients or laboratory animals, including controls) clearly, including eligibility and exclusion criteria and a description of the source population. Because the relevance of such vari-ables as age and sex to the object of research is not always clear, authors should explain their use when they are included in a study report—for example, authors should explain why only participants of certain ages were included or why women were excluded. The guiding principle should be clarity about how and why a study was done in a particular way. When authors use such variables as race or ethnicity, they should define how they measured these variables and justify their relevance.Technical Information: Identify the methods, apparatus (give the manufacturer’s name and address in parentheses), and procedures in sufficient detail to allow others to reproduce the results. Give references to established methods, including statistical methods (see below); provide references and brief descriptions for methods that have been published but are not well-known; describe new or substantially modified methods, give the reasons for using them, and evaluate their limita-
CARDIOLOGY TODAYINSTRUCTIONS TO AUTHORS
tions. Identify precisely all drugs and chemicals used, includ-ing generic name(s), dose(s), and route(s) of administration.Authors submitting review manuscripts should include a sec-tion describing the methods used for locating, selecting, ex-tracting, and synthesizing data. These methods should also be summarised in the abstract.Statistics: Describe statistical methods with enough detail to enable a knowledgeable reader with access to the original data to verify the reported results. When possible, quan-tify findings and present them with appropriate indicators of measurement error or uncertainty (such as confidence intervals). Avoid relying solely on statistical hypothesis test-ing, such as P values, which fail to convey important informa-tion about effect size. References for the design of the study and statistical methods should be to standard works when possible (with pages stated). Define statistical terms, abbre-viations, and most symbols. Specify the computer software used.Results: Present your results in logical sequence in the text, tables, and illustrations, giving the main or most important findings first. Do not repeat all the data in the tables or il-lustrations in the text; emphasise or summarise only the most important observations. Extra or supplementary materials and technical detail can be placed in an appendix where they will be accessible but will not interrupt the flow of the text, or they can be published solely in the electronic version of the journal.When data are summarised in the Results section, give nu-meric results not only as derivatives (for example, percent-ages) but also as the absolute numbers from which the de-rivatives were calculated, and specify the statistical methods used to analyse them. Restrict tables and figures to those needed to explain the argument of the paper and to assess supporting data. Use graphs as an alternative to tables with many entries; do not duplicate data in graphs and tables. Avoid nontechnical uses of technical terms in statistics, such as “random” (which implies a randomising device), “normal,” “significant,” “correlations,” and “sample.”Where scientifically appropriate, analyses of the data by such variables as age and sex should be included.Discussion: Emphasise the new and important aspects of the study and the conclusions that follow from them in the context of the totality of the best available evidence. Do not repeat in detail data or other information given in the Introduction or the Results section. For experimental studies, it is useful to begin the discussion by briefly summarising the main find-ings, then explore possible mechanisms or explanations for these findings, compare and contrast the results with other relevant studies, state the limitations of the study, and ex-plore the implications of the findings for future research and for clinical practice.Link the conclusions with the goals of the study but avoid unqualified statements and conclusions not adequately sup-ported by the data. In particular, avoid making statements on economic benefits and costs unless the manuscript includes the appropriate economic data and analyses. Avoid claiming priority or alluding to work that has not been completed. State new hypotheses when warranted, but label them clearly as such.Examples:1. Malik V, Roy D. Management of locally advanced breast
cancer. Cardiology Today 1997;2(5):45-51.(for Journal)2. Sambasivan M. References to central nervous system in
the ancient texts: In: S. Venkatraman (ed). Progress in Clinical Neurosciences, 11th Ed, Mediworld Publications 1996:116-118. (for Chapter in a Book)
For full details, please refer to International Committee of Medical journals Edition. Uniform requirement for manu-script submitted to biomedical journals. N Engl J Med 1991; 324:424-8. BMJ 1991;302:338-341.Tables: Tables should capture information concisely and dis-play it efficiently. Number tables consecutively in the order of their first citation in the text and supply a brief title for each. Give each column a short or an abbreviated heading. Authors should place explanatory matter in footnotes, not in the head-ing. Explain all nonstandard abbreviations in footnotes. Iden-
tify statistical measures of variations, such as standard devia-tion and standard error of the mean. Be sure that each table is cited in the text. If you use data from another published or unpublished source, obtain permission and acknowledge that source fully.Illustrations (Figures): Figures should be either professionally drawn and photographed, or submitted as photographic-qual-ity digital prints. In addition figures can also be in the format of electronic files (for example, JPEG or GIF). Letters, numbers, and symbols on figures should therefore be clear and consist-ent throughout, and large enough to remain legible when the figure is reduced for publication. Figures should be made as self-explanatory as possible, since many will be used directly in slide presentations. Titles and detailed explanations belong in the legends—not on the illustrations themselves.Photomicrographs should have internal scale markers. Sym-bols, arrows, or letters used in photomicrographs should con-trast with the background.Photographs of potentially identifiable people must be ac-companied by written permission to use the photograph.Figures should be numbered consecutively according to the order in which they have been cited in the text. If a figure has been published previously, acknowledge the original source and submit written permission from the copyright holder to reproduce the figure. Permission is required irrespective of authorship or publisher except for documents in the public domain.For illustrations in color, ascertain whether the journal re-quires color negatives, positive transparencies, or color prints. Accompanying drawings marked to indicate the region to be reproduced might be useful to the editor. Some journals publish illustrations in color only if the author pays the ad-ditional cost.Authors should consult the journal about requirements for figures submitted in electronic formats.Legends for Illustrations (Figures): Type or print out legends for illustrations using double spacing, starting on a separate page, with Arabic numerals corresponding to the illustrations. When symbols, arrows, numbers, or letters are used to iden-tify parts of the illustrations, identify and explain each one clearly in the legend. Explain the internal scale and identify the method of staining in photomicrographs.UNITS OF MEASUREMENTMeasurements of length, height, weight, and volume should be reported in metric units (meter, kilogram, or liter) or their decimal multiples.Temperatures should be in degrees Celsius/ Fahrenheit. Blood pressures should be in millimeters of mercury, unless other units are specifically required by the journal.Journals vary in the units they use for reporting hematologic, clinical chemistry, and other measurements. Authors must consult the Information for Authors of the particular journal and should report laboratory information in both local and International System of Units (SI). Editors may request that authors add alternative or non-SI units, since SI units are not universally used. Drug concentrations may be reported in ei-ther SI or mass units, but the alternative should be provided in parentheses where appropriate.ABBREVIATIONS AND SYMBOLSUse only standard abbreviations; use of nonstandard ab-breviations can be confusing to readers. Avoid abbreviations in the title of the manuscript. The spelled-out abbreviation followed by the abbreviation in parenthesis should be used on first mention unless the abbreviation is a standard unit of measurement.
Address submissions to:The Publisher
CARDIOLOGY TODAYCIMS Medica India Pvt Ltd,
709, 7th Floor, Devika Tower, Nehru Place, New Delhi-110 019.
Tel: 011-4285 4300, Fax: 011-4285 4310E-mail: [email protected]
VOLUME INDEX

Cardiology Today VOL. XXII NO. 6 NOVEMBER-DECEMBER 2018 227
MANUSCRIPT Manuscripts must be neatly typed in double space typing throughout on one side of the sheet of good quality bond pa-per of the size 28 x 22cm with 3cm margins on both sides. Words should not be hyphenated at the end of a line.Authors are requested to send the article on e-mail ([email protected]) or CD with one orginal copy of the type script should be submitted alongwith to the Publisher, CIMS Medica India Pvt Ltd, 709, Devika Tower, Nehru Place, New Delhi-1100 19.Material received for publication will be acknowledged and the decision regarding publication will be communicated to the “Author for correspondence”. The manuscript of case reports/studies and original articles should be arranged in the following sequence : Title page, Abstract, Key Words, Introduction, Material and Methods, Results, Discussion, Acknowledgments, References, Tables and legends to figures.Article title: Title should be concise, easier to read and should include all information in the title that will make electronic re-trieval of the article both sensitive and specific.Authors’ names and institutional affiliations: The name of the department(s) and institution(s) to which the work should be attributed.Disclaimers, if any, Source(s) of support in the form of grants, equipment, drugs, or all of these. Declaration of Conflict of Interest Contact information for corresponding authors: The name, mailing address, telephone and fax numbers, and e-mail ad-dress of the author responsible for correspondence about the manuscript (“corresponding author-may or may not be the “guarantor” for the integrity of the study). The name and ad-dress of the author to whom requests for reprints should be addressed or a statement that reprints are not available from the authors.Abstract: Structured abstracts are preferred for all original research, systematic reviews articles and case studies. The abstract should provide the background for the study or the article. In case of original research article abstract should state the study’s purpose, basic procedures, main findings, principal conclusions, and funding sources. Introduction: Provide a context or background for the study (that is, the nature of the problem and its significance). State the specific purpose or research objective of, or hypothesis tested by, the study or observation; the research objective is often more sharply focused when stated as a question. Both the main and secondary objectives should be clear, and any prespecified subgroup analyses should be described. Provide only directly pertinent references, and do not include data or conclusions from the work being reported.Methods: The Methods section should include only informa-tion that was available at the time the plan or protocol for the study was being written; all information obtained during the study belongs in the Results section.Selection and Description of Participants: Describe your selection of the observational or experimental participants (patients or laboratory animals, including controls) clearly, including eligibility and exclusion criteria and a description of the source population. Because the relevance of such vari-ables as age and sex to the object of research is not always clear, authors should explain their use when they are included in a study report—for example, authors should explain why only participants of certain ages were included or why women were excluded. The guiding principle should be clarity about how and why a study was done in a particular way. When authors use such variables as race or ethnicity, they should define how they measured these variables and justify their relevance.Technical Information: Identify the methods, apparatus (give the manufacturer’s name and address in parentheses), and procedures in sufficient detail to allow others to reproduce the results. Give references to established methods, including statistical methods (see below); provide references and brief descriptions for methods that have been published but are not well-known; describe new or substantially modified methods, give the reasons for using them, and evaluate their limita-
CARDIOLOGY TODAYINSTRUCTIONS TO AUTHORS
tions. Identify precisely all drugs and chemicals used, includ-ing generic name(s), dose(s), and route(s) of administration.Authors submitting review manuscripts should include a sec-tion describing the methods used for locating, selecting, ex-tracting, and synthesizing data. These methods should also be summarised in the abstract.Statistics: Describe statistical methods with enough detail to enable a knowledgeable reader with access to the original data to verify the reported results. When possible, quan-tify findings and present them with appropriate indicators of measurement error or uncertainty (such as confidence intervals). Avoid relying solely on statistical hypothesis test-ing, such as P values, which fail to convey important informa-tion about effect size. References for the design of the study and statistical methods should be to standard works when possible (with pages stated). Define statistical terms, abbre-viations, and most symbols. Specify the computer software used.Results: Present your results in logical sequence in the text, tables, and illustrations, giving the main or most important findings first. Do not repeat all the data in the tables or il-lustrations in the text; emphasise or summarise only the most important observations. Extra or supplementary materials and technical detail can be placed in an appendix where they will be accessible but will not interrupt the flow of the text, or they can be published solely in the electronic version of the journal.When data are summarised in the Results section, give nu-meric results not only as derivatives (for example, percent-ages) but also as the absolute numbers from which the de-rivatives were calculated, and specify the statistical methods used to analyse them. Restrict tables and figures to those needed to explain the argument of the paper and to assess supporting data. Use graphs as an alternative to tables with many entries; do not duplicate data in graphs and tables. Avoid nontechnical uses of technical terms in statistics, such as “random” (which implies a randomising device), “normal,” “significant,” “correlations,” and “sample.”Where scientifically appropriate, analyses of the data by such variables as age and sex should be included.Discussion: Emphasise the new and important aspects of the study and the conclusions that follow from them in the context of the totality of the best available evidence. Do not repeat in detail data or other information given in the Introduction or the Results section. For experimental studies, it is useful to begin the discussion by briefly summarising the main find-ings, then explore possible mechanisms or explanations for these findings, compare and contrast the results with other relevant studies, state the limitations of the study, and ex-plore the implications of the findings for future research and for clinical practice.Link the conclusions with the goals of the study but avoid unqualified statements and conclusions not adequately sup-ported by the data. In particular, avoid making statements on economic benefits and costs unless the manuscript includes the appropriate economic data and analyses. Avoid claiming priority or alluding to work that has not been completed. State new hypotheses when warranted, but label them clearly as such.Examples:1. Malik V, Roy D. Management of locally advanced breast
cancer. Cardiology Today 1997;2(5):45-51.(for Journal)2. Sambasivan M. References to central nervous system in
the ancient texts: In: S. Venkatraman (ed). Progress in Clinical Neurosciences, 11th Ed, Mediworld Publications 1996:116-118. (for Chapter in a Book)
For full details, please refer to International Committee of Medical journals Edition. Uniform requirement for manu-script submitted to biomedical journals. N Engl J Med 1991; 324:424-8. BMJ 1991;302:338-341.Tables: Tables should capture information concisely and dis-play it efficiently. Number tables consecutively in the order of their first citation in the text and supply a brief title for each. Give each column a short or an abbreviated heading. Authors should place explanatory matter in footnotes, not in the head-ing. Explain all nonstandard abbreviations in footnotes. Iden-
tify statistical measures of variations, such as standard devia-tion and standard error of the mean. Be sure that each table is cited in the text. If you use data from another published or unpublished source, obtain permission and acknowledge that source fully.Illustrations (Figures): Figures should be either professionally drawn and photographed, or submitted as photographic-qual-ity digital prints. In addition figures can also be in the format of electronic files (for example, JPEG or GIF). Letters, numbers, and symbols on figures should therefore be clear and consist-ent throughout, and large enough to remain legible when the figure is reduced for publication. Figures should be made as self-explanatory as possible, since many will be used directly in slide presentations. Titles and detailed explanations belong in the legends—not on the illustrations themselves.Photomicrographs should have internal scale markers. Sym-bols, arrows, or letters used in photomicrographs should con-trast with the background.Photographs of potentially identifiable people must be ac-companied by written permission to use the photograph.Figures should be numbered consecutively according to the order in which they have been cited in the text. If a figure has been published previously, acknowledge the original source and submit written permission from the copyright holder to reproduce the figure. Permission is required irrespective of authorship or publisher except for documents in the public domain.For illustrations in color, ascertain whether the journal re-quires color negatives, positive transparencies, or color prints. Accompanying drawings marked to indicate the region to be reproduced might be useful to the editor. Some journals publish illustrations in color only if the author pays the ad-ditional cost.Authors should consult the journal about requirements for figures submitted in electronic formats.Legends for Illustrations (Figures): Type or print out legends for illustrations using double spacing, starting on a separate page, with Arabic numerals corresponding to the illustrations. When symbols, arrows, numbers, or letters are used to iden-tify parts of the illustrations, identify and explain each one clearly in the legend. Explain the internal scale and identify the method of staining in photomicrographs.UNITS OF MEASUREMENTMeasurements of length, height, weight, and volume should be reported in metric units (meter, kilogram, or liter) or their decimal multiples.Temperatures should be in degrees Celsius/ Fahrenheit. Blood pressures should be in millimeters of mercury, unless other units are specifically required by the journal.Journals vary in the units they use for reporting hematologic, clinical chemistry, and other measurements. Authors must consult the Information for Authors of the particular journal and should report laboratory information in both local and International System of Units (SI). Editors may request that authors add alternative or non-SI units, since SI units are not universally used. Drug concentrations may be reported in ei-ther SI or mass units, but the alternative should be provided in parentheses where appropriate.ABBREVIATIONS AND SYMBOLSUse only standard abbreviations; use of nonstandard ab-breviations can be confusing to readers. Avoid abbreviations in the title of the manuscript. The spelled-out abbreviation followed by the abbreviation in parenthesis should be used on first mention unless the abbreviation is a standard unit of measurement.
Address submissions to:The Publisher
CARDIOLOGY TODAYCIMS Medica India Pvt Ltd,
709, 7th Floor, Devika Tower, Nehru Place, New Delhi-110 019.
Tel: 011-4285 4300, Fax: 011-4285 4310E-mail: [email protected]

228 Cardiology Today VOL. XXII NO. 6 NOVEMBER-DECEMBER 2018