Embed Size (px)
Citation preview

Michael [email protected]
10-05-2011
Cardiogram: Visual Analytics for Automotive Engineers Sedlmair, Isenberg, Baur, Mauerer, Pigorsch, Butz

2
Design Studies

3
Design Studies
McLachlan et al., CHI 2008
Koch et al., VAST 2009
Meyer et al., InfoVis 2010

4
Today’s Design Study
Application Area: Automotive Engineering
Study Environment: With BMW Group

5
Problem and Requirement Analysis
Design of Cardiogram
Evaluation of Cardiogram
Outline

6
Problem&
Requirements
7
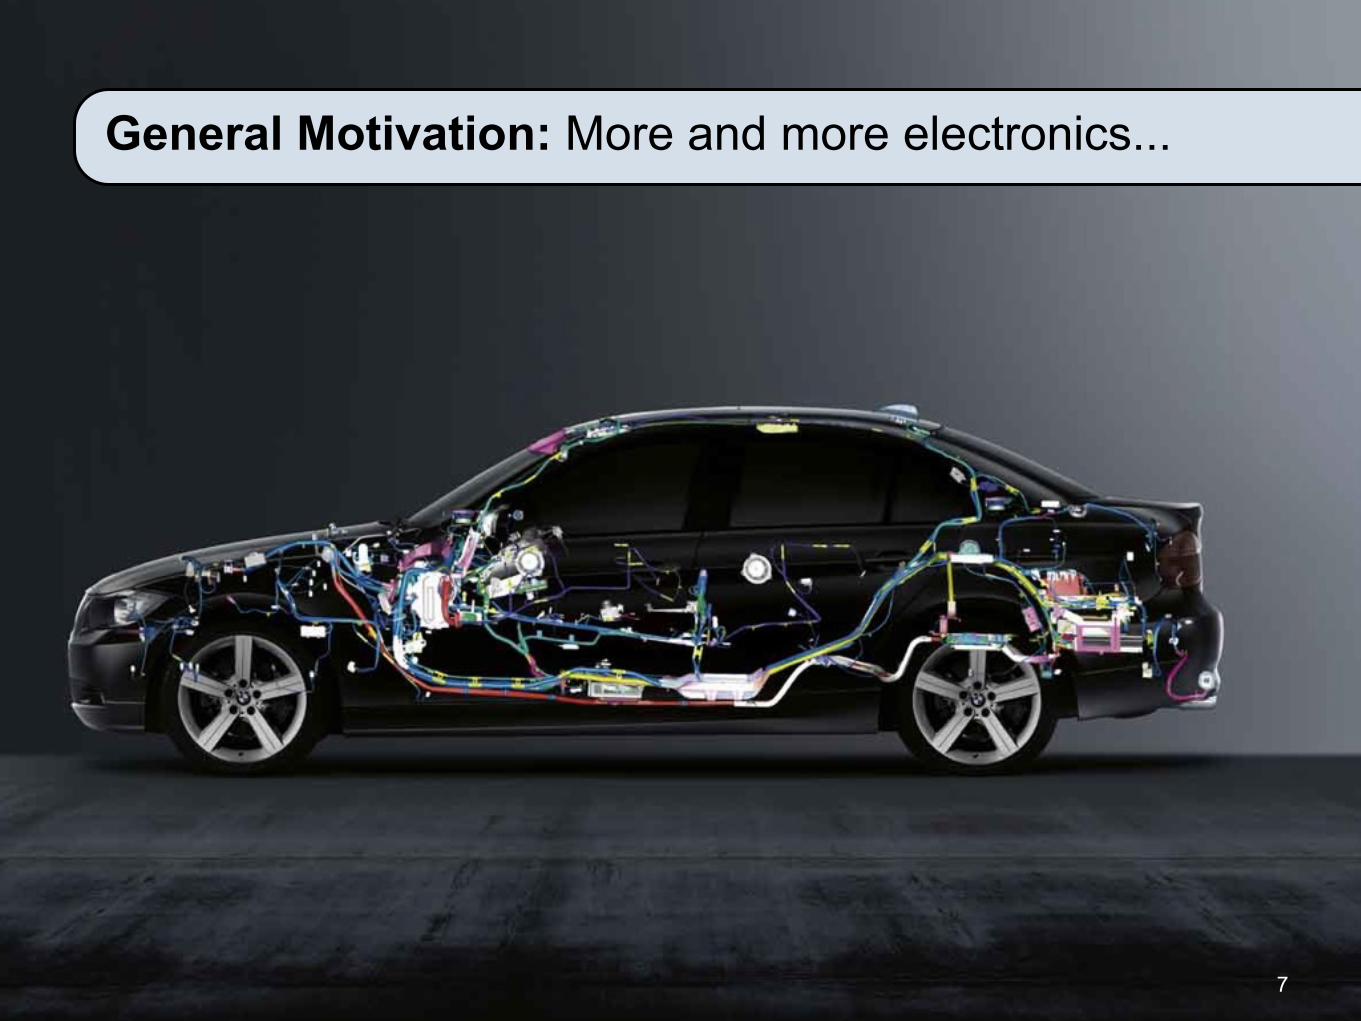
General Motivation: More and more electronics...

8
... Enabled by In-car Communication Networks
Gateway
Controllers

9
General Problem: It got complex...
General Challenge: Understand Network Data
15.000 messages / sec
~100 Controllers

10
Studies with and without tools
~150 Engineers / 3.5 years
2007 20092008 2010
Tools for In-Car Network Analysis
Cardiogram
AutobahnVis 2.0
VisTra
MostVis
AutobahnVis
WiKeVis
RelEx
ProgSpy2010
Car-x-ray
Tools for Other Use Cases
Methodology
Grounded Theory

11
Target Users: In-car Network Analysts
Task: Find errors in in-car communication networks
Our Focus Today
Procedure: Test drives and data analysis

12
Data: Recorded Traces (List of network messages)
~100 traces / error case
A usual trace (15 minutes): ~10 million msg.

13
Current Practices
Lists of traces
Simple signal plots

14
Distributed errors?
(Some) Problems
Car Behaviour vs. Trace?

15
An Example Problem
Overpressure Sensor Problem
Took Engineers ~4 Month
Reason: All 4 doors slammed simultaneously

16
Deriving Requirements
Handling the masses of data Data abstraction and automated filtering
Support for automated error detection
Avoid repetitive work and unnecessary iterations
New Perspectives on Complex Errors Beyond raw data and signal plots
Visual Overview Techniques
Multiple, modular and coordinated solutions
Engineer-centered solutions Fast access to raw data
Familiarity
Support collaboration

17
Requirements: Today’s Focus
Handling the masses of data Data abstraction and automated filtering Support for automated error detection Avoid repetitive work and unnecessary iterations
New Perspectives on Complex Errors Beyond raw data and signal plots
Visual Overview Techniques
Multiple, modular and coordinated solutions
Engineer-centered solutions Fast access to raw data
Familiarity
Support collaboration

18
Our Solution:Cardiogram

Handling the masses of data Data abstraction and automated filtering Support for automated error detection Avoid repetitive work and unnecessary iterations
New Perspectives on Complex Errors Beyond raw data and signal plots
Visual Overview Techniques
Multiple, modular and coordinated solutions
Engineer-centered solutions Fast access to raw data
Familiarity
19
Our idea: Using State Machines
Trace
Abstract
Detect Errors
Data Reduction
State Machine Engine

20
Abstraction: SMs to Interpret Vehicle Behavior (simplified)
Door open Door closed

21
Abstraction: SMs to Interpret Vehicle Behavior (simplified)
Door open Door closed
openDoor closed
A1 C3 45 AC
12 34 45 67
45 A1 A2 C4
A1 C3 45 AC
12 34 45 67
45 A1 A2 C4
A1 C3 45 AC
12 34 45 67
45 A1 A2 C4
A1 C3 45 AC
12 34 45 67
45 A1 A2 C4
A1 C3 45 AC
12 34 45 67
45 A1 A2 C4
A1 C3 45 AC
12 34 45 67
45 A1 A2 C4
A1 C3 45 AC
12 34 45 67
45 A1 A2 C4
A1 C3 45 AC
12 34 45 67
45 A1 A2 C4
A1 C3 45 AC
12 34 45 67
45 A1 A2 C4
12 34 45 67
12 34 45 67
A1 C3 45 AC
12 34 45 67
45 A1 A2 C4
A1 C3 45 AC
12 34 45 67
45 A1 A2 C4
A1 C3 45 AC
12 34 45 67
45 A1 A2 C4
A1 C3 45 AC
12 34 45 67
45 A1 A2 C4
A1 C3 45 AC
12 34 45 67
45 A1 A2 C4
A1 C3 45 AC
12 34 45 67
45 A1 A2 C4
A1 C3 45 AC
12 34 45 67
45 A1 A2 C4
A1 C3 45 AC
12 34 45 67
45 A1 A2 C4
A1 C3 45 AC
12 34 45 67
45 A1 A2 C4
A1 C3 45 AC
12 34 45 67
45 A1 A2 C4
A1 C3 45 AC
12 34 45 67
45 A1 A2 C4
A1 C3 45 AC
12 34 45 67
45 A1 A2 C4
A1 C3 45 AC
12 34 45 67
45 A1 A2 C4
A1 C3 45 AC
12 34 45 67
45 A1 A2 C4
A1 C3 45 AC
12 34 45 67
45 A1 A2 C4
A1 C3 45 AC
12 34 45 67
45 A1 A2 C4
12 34 45 67
12 34 45 67
A1 C3 45 AC
12 34 45 67
45 A1 A2 C4
A1 C3 45 AC
12 34 45 67
45 A1 A2 C4
A1 C3 45 AC
12 34 45 67
45 A1 A2 C4
A1 C3 45 AC
12 34 45 67
45 A1 A2 C4
A1 C3 45 AC
12 34 45 67
45 A1 A2 C4
A1 C3 45 AC
12 34 45 67
45 A1 A2 C4
A1 C3 45 AC
12 34 45 67
45 A1 A2 C4
Interpret Trace
time

22
Aut. Error Detection: SMs to Interpret Errors (simplified)
Correct Error

23
Data Reduction
1 Verification Tag per SM
10M messages --> 10K transitions
Trace
Verification Tag
Transition List- State Machine 1- State Machine 2- State Machine 3... (dozens)
errorwarningok
time: state x state y...
SM

24
Vis
Visualization
... only when necessary
Trace
Verification Tag
Transition List- State Machine 1- State Machine 2- State Machine 3... (dozens)
errorwarningok
time: state x state y...
SM

25
Visualization

26
a: State Machine Lista
a

27
b
b: State Machine Transition View
x-axis: time
y-axis: states
a b

28a b
c
c: Overview Timeline
c

29
Evaluation

2009 2010
30
Field study (2 engrs. / 8 weeks)
Think aloud study (6 engrs. / 1 hour each)
Cardiogram Project
Field study (15 engrs. / ~1 year)SM
Vis
Field Studies during and after deployment

Externalization of Expert Knowledge
Additional Benefit: Supports Collaboration
Database31
(Some) Results: State Machine Approach

32
Complete Coverage vs. Sparse Samples
Thousands vs. Tens of Traces / Day
(Some) Results: State Machine Approach

33
Understand Behavioral Cross-Correlations
(Some) Results: Visualization
Overpressure errorok
Example: Overpressure Sensor Problem

34
Understand Behavioral Cross-Correlations
Example: Overpressure Sensor Problem
(Some) Results: Visualization
openDoor 1 closed
openDoor 2 closed
Overpressure errorok
openDoor 3 closed
openDoor 4 closed

Understand Behavioral Cross-Correlations
Example: Overpressure Sensor Problem
openDoor 1 closed
openDoor 2 closed
Overpressure errorok
openDoor 3 closed
openDoor 4 closed
(Some) Results: Visualization
Create State Machine from Insights
35
State Machine Creation and Verification

36
Summary

37
Cardiogram / Contributions
Cardiogram adopted by engineers
Based on in-depth domain analysis
A: State Machine Approach
B: Visualization Component

Michael [email protected]
10-05-2011
Cardiogram: Visual Analytics for Automotive EngineersSedlmair, Isenberg, Baur, Mauerer, Pigorsch, Butz
Slides: www.cs.ubc.ca/~msedl/talks/sedlmair2011chi.pdf
Questions?
Thank you!

39
Back Up

40
Editor.

Editor
Core Components
State machine database State Machine
EngineCardiogramVisualization
Trace
41
Cardiogram: 4 Steps

42
System Requirements
Car Manufacturer
SupplierSoftware Development
System Development
Software Architecture Unit Test
AcceptanceTest
Software Architecture
Software Implementation
Physical System
Architecture
SystemTest
ECUTest
Functional Network
Physical Network Linked ECUTest
FunctionalSystem
Architecture

43