Embed Size (px)
Citation preview

Carborundum Universal Limited
CMP: Rs.210 Recommenda<on: Buy Target Price: Rs. 257
Date: 19th September 2014 Growing Stronger
Research Partner Page 1 of 13
Stock vs NIFTY
DetailsNSE Code CARBORUNIVBSE Code 513375Bloomberg/ Reuters Code CU.IN/CRBR.NSMkt. Cap (Rs. Mn) 39,552
Details (Rs Mn) FY14 FY15E FY16ERevenues 21,253 28,922 34,194EBITDA 2,515 3,837 5,022EBITDA Margin (%) 11.8 14.0 15.5PAT 951 1,817 2,565PAT Margin(%) 15.1 6.6 7.9EPS 2.0 9.7 13.6P/E 43.0 21.7 15.4RoE 8.0% 15.0% 18.0%
Shareholding Pattern (%) Jun'14 Mar'14 Dec'13Promoter 42 42 42FII 23 23 23DII 12 11 11Others 24 24 24
Carborundum Universal is a part of the Murugappa Group, which is a
conglomorate with interests in sugar, fertilizer, industrial gears, abrasives,
electrominerals, ceramics. The company was incorporated in 1954 as a
joint venture between Carborundum USA, Universal Grinding Wheel
Company UK and Murugappa. The company has 30 manufacturing plants
spread across 7 countriesm and caters to clients present in over 50
countries.
The company is into the business of abrasives, ceramics and electro-
minerals. The abrasives and electro-minerals segment contribute about
80% to the total revenues of the firm. The firm has a strong global
presence enables the firm to earn about 50% of revenues from abroad. The
firm has strong market position in India, and for select abrasives it is the
market leader in India. The firm is second largest producer of silicon
carbide in the world. The firm is also the market leader for super
refractory.
The company suffered over the past year or so due to global slowdown
which caused weak demand for its products, with a capacity utilization of
only 70% in FY14. However, we expect the global economy to continue its
recovery, and an increase in the industrial production, which will result in
CUMI's revenues and profitability improving going forward.
The company currently trades at a P/E of 42.8x (ttm) and a one year
forward P/E of 25x in FY15E, with a FY16E forward P/E of 20x. We
expect that the firm will have significant upside potential as the global
economy strengthens, which subsequently generates positive signs to the
end user industries. We suggest a BUY with a target price of Rs 257 for the
firm.
Investment Posi;ves
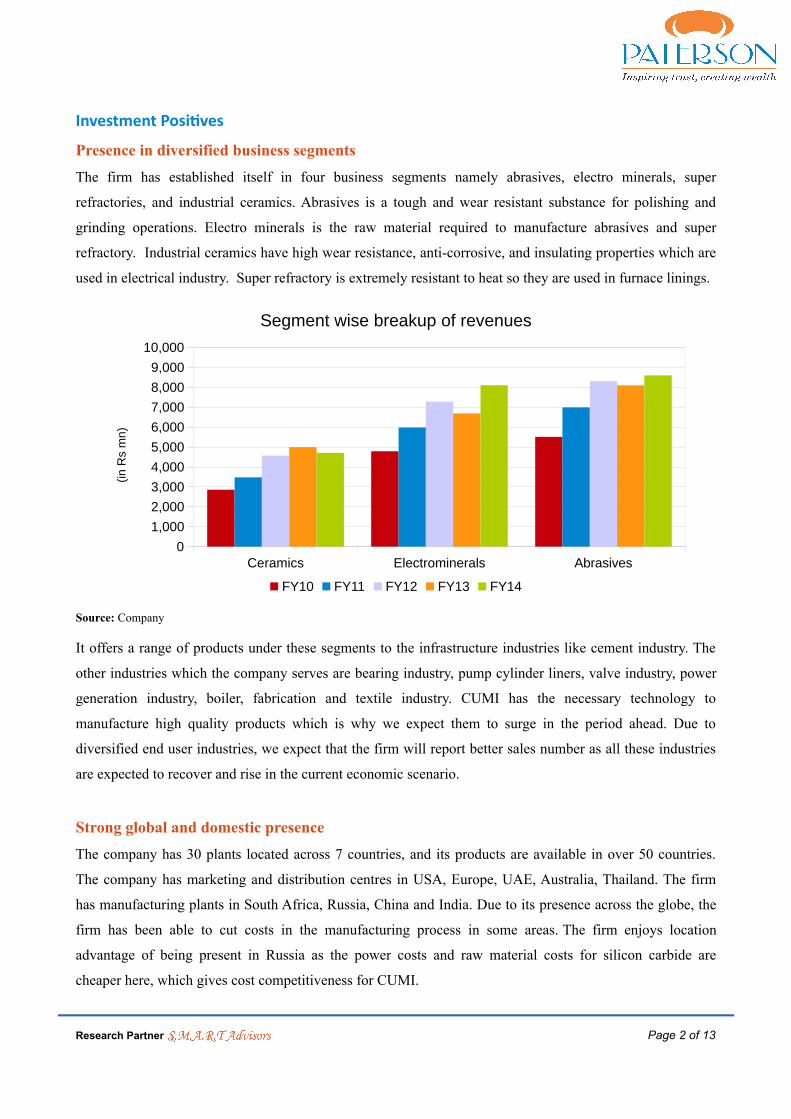
Presence in diversified business segmentsThe firm has established itself in four business segments namely abrasives, electro minerals, super
refractories, and industrial ceramics. Abrasives is a tough and wear resistant substance for polishing and
grinding operations. Electro minerals is the raw material required to manufacture abrasives and super
refractory. Industrial ceramics have high wear resistance, anti-corrosive, and insulating properties which are
used in electrical industry. Super refractory is extremely resistant to heat so they are used in furnace linings.
Source: Company
It offers a range of products under these segments to the infrastructure industries like cement industry. The
other industries which the company serves are bearing industry, pump cylinder liners, valve industry, power
generation industry, boiler, fabrication and textile industry. CUMI has the necessary technology to
manufacture high quality products which is why we expect them to surge in the period ahead. Due to
diversified end user industries, we expect that the firm will report better sales number as all these industries
are expected to recover and rise in the current economic scenario.
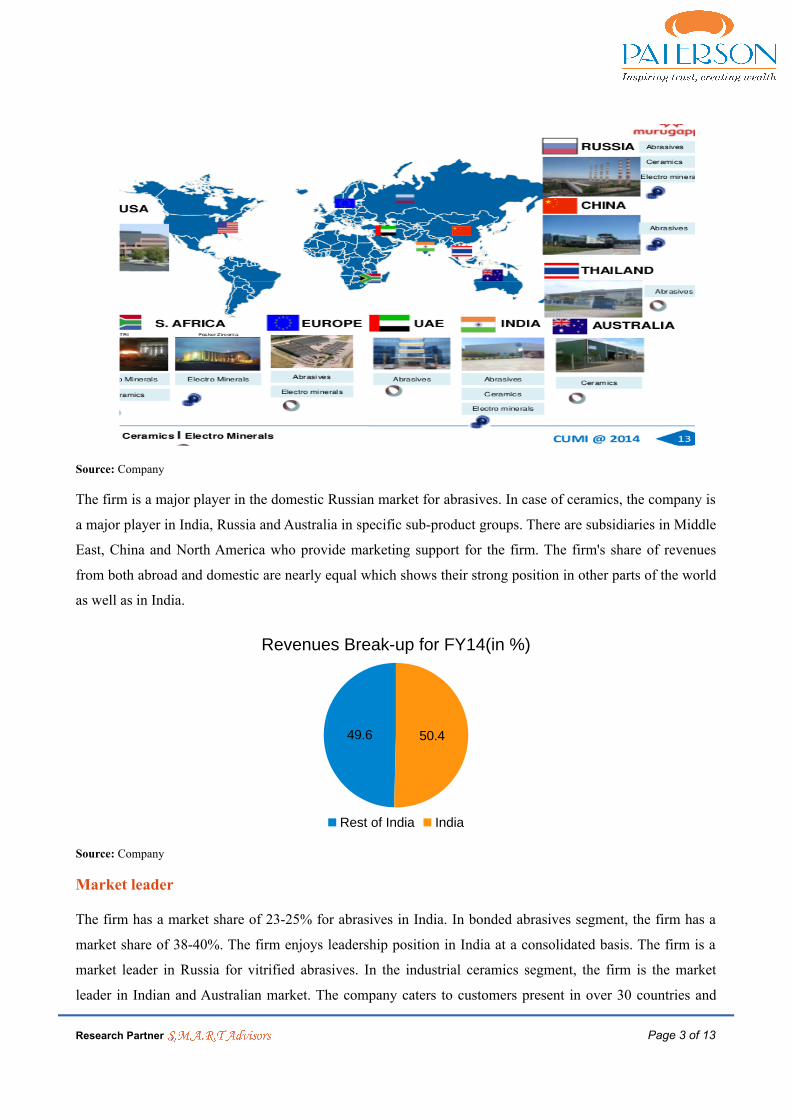
Strong global and domestic presenceThe company has 30 plants located across 7 countries, and its products are available in over 50 countries.
The company has marketing and distribution centres in USA, Europe, UAE, Australia, Thailand. The firm
has manufacturing plants in South Africa, Russia, China and India. Due to its presence across the globe, the
firm has been able to cut costs in the manufacturing process in some areas. The firm enjoys location
advantage of being present in Russia as the power costs and raw material costs for silicon carbide are
cheaper here, which gives cost competitiveness for CUMI.
Research Partner Page 2 of 13
Ceramics Electrominerals Abrasives0
1,0002,0003,0004,0005,0006,0007,0008,0009,000
10,000
Segment wise breakup of revenues
FY10 FY11 FY12 FY13 FY14
(in R
s m
n)
Source: Company
The firm is a major player in the domestic Russian market for abrasives. In case of ceramics, the company is
a major player in India, Russia and Australia in specific sub-product groups. There are subsidiaries in Middle
East, China and North America who provide marketing support for the firm. The firm's share of revenues
from both abroad and domestic are nearly equal which shows their strong position in other parts of the world
as well as in India.
Source: Company
Market leader
The firm has a market share of 23-25% for abrasives in India. In bonded abrasives segment, the firm has a
market share of 38-40%. The firm enjoys leadership position in India at a consolidated basis. The firm is a
market leader in Russia for vitrified abrasives. In the industrial ceramics segment, the firm is the market
leader in Indian and Australian market. The company caters to customers present in over 30 countries and
Research Partner Page 3 of 13
49.6 50.4
Revenues Break-up for FY14(in %)
Rest of India India
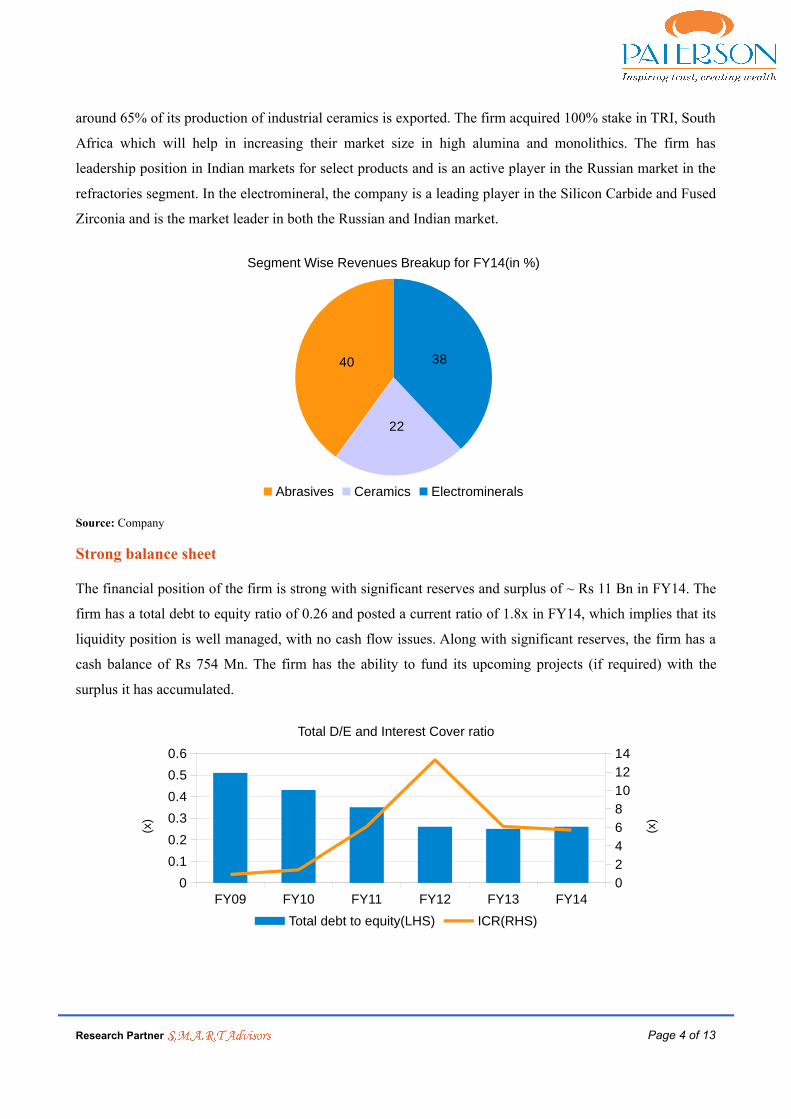
around 65% of its production of industrial ceramics is exported. The firm acquired 100% stake in TRI, South
Africa which will help in increasing their market size in high alumina and monolithics. The firm has
leadership position in Indian markets for select products and is an active player in the Russian market in the
refractories segment. In the electromineral, the company is a leading player in the Silicon Carbide and Fused
Zirconia and is the market leader in both the Russian and Indian market.
Source: Company
Strong balance sheet
The financial position of the firm is strong with significant reserves and surplus of ~ Rs 11 Bn in FY14. The
firm has a total debt to equity ratio of 0.26 and posted a current ratio of 1.8x in FY14, which implies that its
liquidity position is well managed, with no cash flow issues. Along with significant reserves, the firm has a
cash balance of Rs 754 Mn. The firm has the ability to fund its upcoming projects (if required) with the
surplus it has accumulated.
Research Partner Page 4 of 13
40
22
38
Segment Wise Revenues Breakup for FY14(in %)
Abrasives Ceramics Electrominerals
FY09 FY10 FY11 FY12 FY13 FY140
0.1
0.2
0.3
0.4
0.5
0.6
02468101214
Total D/E and Interest Cover ratio
Total debt to equity(LHS) ICR(RHS)
(x)
(x)
Key Risks
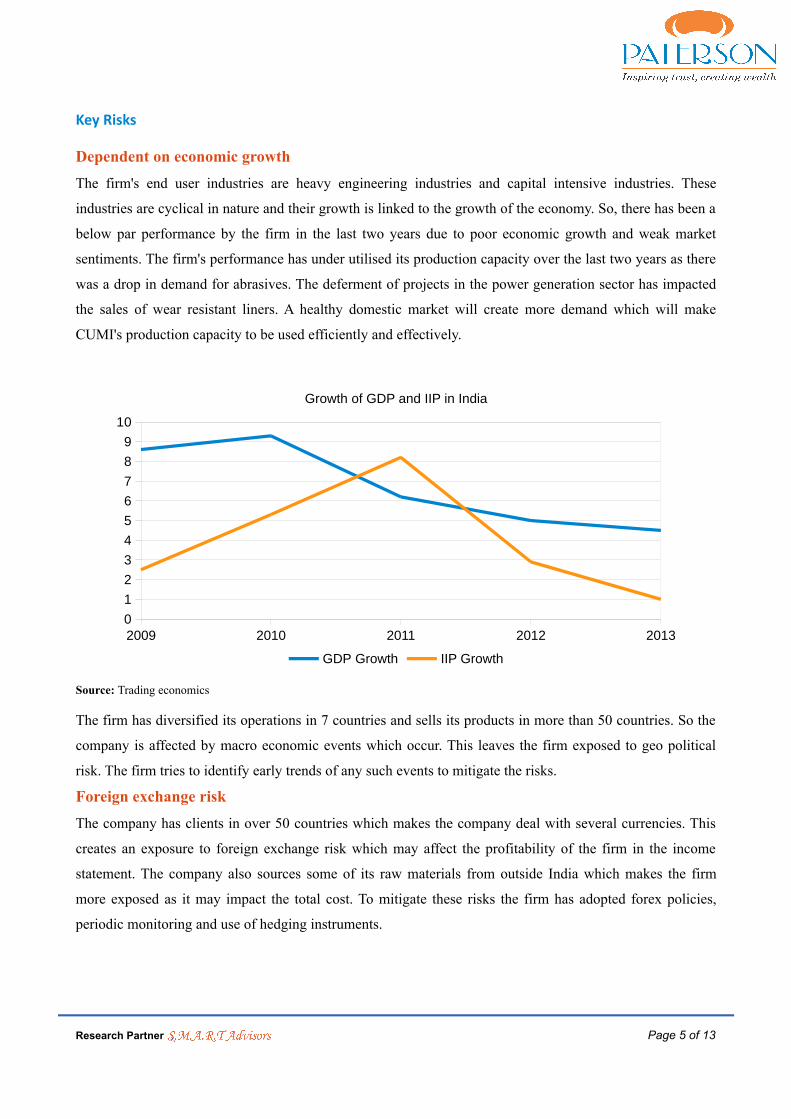
Dependent on economic growthThe firm's end user industries are heavy engineering industries and capital intensive industries. These
industries are cyclical in nature and their growth is linked to the growth of the economy. So, there has been a
below par performance by the firm in the last two years due to poor economic growth and weak market
sentiments. The firm's performance has under utilised its production capacity over the last two years as there
was a drop in demand for abrasives. The deferment of projects in the power generation sector has impacted
the sales of wear resistant liners. A healthy domestic market will create more demand which will make
CUMI's production capacity to be used efficiently and effectively.
Source: Trading economics
The firm has diversified its operations in 7 countries and sells its products in more than 50 countries. So the
company is affected by macro economic events which occur. This leaves the firm exposed to geo political
risk. The firm tries to identify early trends of any such events to mitigate the risks.
Foreign exchange riskThe company has clients in over 50 countries which makes the company deal with several currencies. This
creates an exposure to foreign exchange risk which may affect the profitability of the firm in the income
statement. The company also sources some of its raw materials from outside India which makes the firm
more exposed as it may impact the total cost. To mitigate these risks the firm has adopted forex policies,
periodic monitoring and use of hedging instruments.
Research Partner Page 5 of 13
2009 2010 2011 2012 20130123456789
10
Growth of GDP and IIP in India
GDP Growth IIP Growth

Rise in input costs
For any capital intensive production facility, power and fuel is one of the key important factors. Any shortage
in these would bring barrier to the production process and hence affect the financial position of the firm.
Power cost is one of the key challenges for CUMI. As they are located in diverse geographic places, the
power cost and policies vary from one place to another. Any sudden price rise in the power rates would affect
the profitability due to increase in operating expense.
The firm also faces power constraints in some locations and this makes the firm to choose expensive
methods to generate power. Another important operating expense is fuel. The rise in fuel cost will affect the
profitability of the firm. Fuel is used either as directly raw material or for firing purpose. So any shocks in
the middle east regions would impact the price of fuel which would subsequently affect the firm's earnings.
Peer Comparison
The company's presence across the globe gives them competition from both global and domestic players.
The company faces global competition from:
• 3M
• Saint Gobain
• Sia Abrasives
• Tyrolit
• Winterthur
The company faces domestic competition from
• ACE Refractories
• BHEL
• Grindwell NortonLtd
• John Oakey & Mohan
• Jyothi Ceramics
• Maithan Ceramics
• Orient Abrasives
• SAK Abrasives
Industry Analysis
Global economic growth has picked up in the second half of 2013 to 3.5%, an uptick from the 2.66% in the
previous six months. This growth is because of the development in the advanced economies, whereas
emerging economies grew only moderately during the period.
Research Partner Page 6 of 13
CUMIGrindwell
Orient AbrasivesBHEL
05
10152025
Operating profit margin comparison for FY14
(%)
Source: Company, S.M.A.R.T Advisors

Abrasives
The worldwide demand for abrasive products is expected to expand nearly by 6% per year to USD 40Bn by
2017. Growth from emerging nations like China will boost the demand for abrasives, and among developed
regions of the world like US, Japan and Western Europe recovery is expected which will encourage the
demand for abrasives. The size of global abrasives market is USD 12.9Bn in FY14, whereas the Indian
market with a size of USD 0.49 Bn is just 3.5% of the global market.
Source: Company, S.M.A.R.T Advisors
Industrial Ceramics
The global market for advanced ceramics is more than
USD13 billion, of which alumina based ceramics is
around USD 5 billion. As one of the world's most
populated countries, the Indian ceramic market has a
large domestic demand, which will further drive the
rapid development of the industry. The ceramics
industry is highly segmented into sub-markets such as
wear resistant liner, lined equipment, engineered
ceramics, ceramic insulation, sanitary pottery refractory
tiles, technical tiles etc. The ceramics manufacturing
process needs efficient energy. High energy costs for
manufacturing is changing markets, hindering the
competitiveness of ceramics producers without access to cheap fuels.
Research Partner Page 7 of 13
36%
28%
36%
Region Wise
Coated Super abrasivesBonded
33%
29%
20%
18%
Product Wise
Europe Rest of the worldUSA China
5%20%
70%
2%4%
Alumina based ceramics market
Energy and Aerospace Wear ResistantBio Ceramics DefenseCutting tools
Source: Company, S.M.A.R.T Advisors

Refractories
The refractory market is a USD 30 Bn at a global level and the largest demand for refractory material comes
from China which is around 44% of the global demand. The refractory market in India is estimated to be
around USD 750 Mn. The major products which dominate this market in India are basic refractories, high
alumina and monolithics all three forming about 75% of the market share.
Product wise market size in India Percentage distribution of refractory
(in Rs Mn) demand globally
Company Background
The company was incorporated as a joint venture between Carborundum Company, USA, Universal
Grinding Wheel Company UK and the Murugappa India in 1954. On a consolidated basis, the company has
30 plants spread across 7 countries. The company products are sold in over 50 countries. The company has a
well established marketing and distribution base in USA, Thailand, UAE, Australia.
The firm's business is spread into four areas:
• Abrasives
The major product groups under this are bonded abrasives, coated abrasives, super abrasives, metal
working fluids, and power tools. The end user industries of this are engineering, automobile,
construction, infrastructure and home maintenance. The manufacturing facilities for abrasives are
located in India, Russia, China and Thailand. This division contributes around 41% to the
consolidated revenues.
• Electro minerals
The product ranges include brown fused alumina, white fused alumina, silicon carbide, zirconia,
Research Partner Page 8 of 13
60% 19%
7%14%
Iron and steel Non metalic mineralsOther metals Other markets
12,000
4,000
11,0002,000
5,000
11,000
Basic Dolomite High AluminaSilica Flow control Monolithics
Source: Company, S.M.A.R.T Advisors

specialty minerals. The firm has clients for these products in over 40 countries. The firm is a
established leader in Russia and India in this segment of business. This segment along with
refractories contributes around 39% to the consolidated revenues.
• Ceramics
This segment is divided into three product groups: wear protection, engineered ceramics and
metallized ceramics. Currently, they are in the business of alumina based ceramics. There are twelve
manufacturing facilities around the globe in India, Australia, South Africa and Russia. This division
contributes around 22% to the consolidated revenues.
• Super refractories
The firm is into high alumina, silicon carbide, zirconia based refractories which are capable to
withstand very high temperature. They operate only in fired alumina and monolithics business. The
firm can manufacture complex shapes and it holds the leadership in these select products in the
Indian markets and is an active player in Russia.
Products and end user industries
Products ApplicationAbrasives Bonded abrasives Bearing industry, valve industry, gear
grindingThin wheels General engineering, foundry, fabrication,
rolling millsCoated abrasives Auto OEM, flooring, wood
Industrial Ceramics Wear resistant Power generation, cement industryLined equipment Pulverized fuel bends, cement industryEngineered ceramics Boiler industry, texti le industry,
electronics, pump cylinder linersMetz cylinders and devices Electrical transmission and distribution,
defense, medical electronicsElectro minerals Brown fused alumina Bonded abrasive, coated abrasive
White fused alumina Refractory, metallurgicalSilicon carbide Silicon water slicing, investment castingZirconia Particulate filter
Super refractories Fired refractories Ceramic industries, chemical processindustries, glass, power generationMonolithics
Source: Company
Research Partner Page 9 of 13

Joint Venture and Subsidiaries
• Wendt (India) Limited - Manufactures abrasives for stone/construction industry and special purpose
machines. CUMI acquired 40% of Wendt in 1991.
• Murugappa Morgan Thermal Ceramics Ltd – Manufactures ceramic fibre, which is a refractory
material. In 1983, CUMI entered into JV with MMTCL.
• Ciria India Limited – Design and installation of refractory liners for the petrochemical and fertilizer
industries.
Subsidiaries
Company LocationCUMI America Inc USA
CUMI Australia Pty Limited Australia
Sterling Abrasives Limited India
Southern Energy Development Corporation Limited India
Net Access India Pvt Ltd India
CUMI Middle East FZE UAE
CUMI International Ltd Cyprus
CUMI Canada Inc Canada
OAO Volzky Abrasives Work Russia
Financial Highlights
The company has suffered from the global
slowdown for the past two years as it has reported
low profit levels during this period. It generated a
revenue of Rs 21,253Mn in FY14 which is an
increase 7.8% YoY, however, the profitability of the
company dropped during this period on the back of
higher fuel and power costs and a hike in raw
material prices. The EBITDA margins have
dropped since 2012 due to rise in these input costs.
The EBITDA margin have dropped to 11.8% in
FY14 from 19.5% in FY12.
The company's ROE has dropped by nearly one-third in FY13 and FY14 due to the lower margins.. The
Research Partner Page 10 of 13
FY09FY10
FY11FY12
FY13FY14
FY15EFY16E
0
5,000
10,000
15,000
20,000
25,000
30,000
35,000
0
5
10
15
20
25
Net Sales and EBITDA Margin
Net Sales(LHS) EBITDA Margin(RHS)
In R
s M
n
%

company recorded 9% ROE and 20% ROCE in FY14. However, we expect that the signs of global recovery
will enable the company to grow, especially since its end user industries are picking up and the industrial
activity across the globe is improving.
The company's liquidity position is strong, and it has maintained a current ratio of 1.8x over the last two
years. The total debt to equity has been consistently reducing from 0.51 in FY09 to 0.26 in FY14. This bodes
well for the company in bad times, as it is able to ride out tough economic conditions better, and in good
economic scenarios, the company will be able to grow faster than its peers as it does not have a debt
overhang.
Final Thoughts
The EBITDA margins of the firm have shown positive signs recording 14.7% margin for the Q1FY15, as
compared to 12% in FY14. The company currently trades at a P/E of 42.8x (ttm) and a one year forward P/E
of 25x in FY15E, with a FY16E forward P/E of 20x. We expect that the firm will have significant upside
potential as the global economy strengthens, which subsequently generates positive signs to the end user
industries. We suggest a BUY with a target price of Rs 257 for the firm.
Research Partner Page 11 of 13
FY09FY10
FY11FY12
FY13FY14
FY15EFY16E
0
0.5
1
1.5
2
2.5
00.10.20.30.40.50.6
Stability Ratios
Current Ratio(LHS) Total debt to equity(RHS)
(x)
(x)
FY09FY10
FY11FY12
FY13FY14
FY15EFY16E
05
10152025303540
010203040506070
Performance Ratios
ROCE(LHS) ROE(RHS)
% %

Profit and Loss
Balance Sheet
Ra;os
Margins
Research Partner Page 12 of 13
P&L (Rs. Mn) FY09 FY10 FY11 FY12 FY13 FY14 FY15E FY16ESales 10,783 11,825 15,532 19,950 19,714 21,253 27,404 32,399Purchase of Raw Materials 3,432 3,823 5,302 6,329 6,069 6,777 8,769 10,044Purchase of stock in trade (227) 79 (366) 122 1,058 673 548 486Employee Costs 1,280 1,714 2,401 2,344 2,627 2,900 3,699 4,536Other Expense 4,883 4,357 6,023 7,261 7,588 8,388 10,550 12,312EBITDA 1,416 1,853 2,171 3,895 2,372 2,515 3,837 5,022Interest 1,231 1,047 271 250 272 282 275 274Depreciation 352 414 505 570 712 911 1,000 1,100Other Income 1,475 1,316 950 127 130 220 150 180PBT 1,307 1,708 2,344 3,202 1,518 1,543 2,712 3,828Tax 551 560 742 908 619 592 895 1,263Adjusted Net Profit 3,082 3,795 5,151 2,192 897 915 1,817 2,565
Balance Sheet (Rs. Mn) FY09 FY10 FY11 FY12 FY13 FY14 FY15E FY16EShareholders Funds 5,039 5,929 7,455 9,470 10,592 11,060 12,877 15,441Non-Current Liabilities 3,883 3,154 2,678 2,569 2,556 2,516 2,500 2,610Current Liabilities 3,753 3,601 4,158 4,837 5,224 5,672 5,123 5,709Minority Interest 486 490 594 775 738 699 - -Total Liabilities 13,161 13,173 14,886 17,651 19,109 19,947 20,499 23,760
Non Current Assets 6,820 6,943 7,106 7,824 9,601 9,784 10,250 10,555Current Assets 6,341 6,230 7,780 9,826 9,508 10,163 10,249 13,206Misc. Expenditure - - - - - - - -Total Assets 13,161 13,173 14,885 17,650 19,109 19,947 20,499 23,760
Important Ratios FY09 FY10 FY11 FY12 FY13 FY14 FY15E FY16EROA (%) 4 5 % 5 5 % 7 2 % 2 8 % 9 % 9 % 1 8 % 2 4 %ROE (%) 6 5 % 6 9 % 7 7 % 2 6 % 9 % 8 % 1 5 % 1 8 %ROCE (%) 3 6 % 3 5 % 3 2 % 3 6 % 2 0 % 2 0 % 1 9 % 2 1 %Current Ra<o 1 . 6 9 1 . 7 3 1 . 8 7 2 . 0 3 1 . 8 2 1 . 7 9 2 . 0 0 2 . 3 1Debt-‐Equity Ra<o 0 . 5 1 0 . 4 3 0 . 3 5 0 . 2 6 0 . 2 5 0 . 2 6 0 . 2 4 0 . 2 2
Margins (%) FY09 FY10 FY11 FY12 FY13 FY14 FY15E FY16EEBITDA Margin 13% 16% 14% 20% 12% 12% 14% 16%EBT Margin 12% 14% 15% 16% 8% 7% 10% 12%PAT Margin 29% 32% 33% 11% 5% 4% 7% 8%

Analyst Cer;fica;on:
The Research Analyst(s) who prepared the research report hereby cer<fy that the views expressed in this research report accurately reflectthe analyst(s) personal views about the subject companies and their securi<es. The Research Analyst(s) also cer<fy that the Analyst(s) havenot been, are not, and will not be receiving direct or indirect compensa<on for expressing the specific recommenda<on(s) or view(s) in thisreport.
Disclaimer:
This document is provided for assistance only and is not intended to be and must not alone be taken as the basis for an investment decision.Nothing in this document should be construed as investment or financial advice, and nothing in this document should be construed as anadvice to buy or sell or solicita<on to buy or sell the securi<es of companies referred to in this document. Each recipient of this documentshould make such inves<ga<ons as it deems necessary to arrive at an independent evalua<on of an investment in the securi<es of companiesreferred to in this document (including the merits and risks involved), and should consult its own advisors to determine the merits and risks ofsuch an investment. This document is being supplied to you solely for your informa<on and may not be reproduced, redistributed or passedon, directly or indirectly, to any other person or published, copied, in whole or in part, for any purpose.
This document does not cons<tute or form part of any offer for sale or subscrip<on or incita<on of any offer to buy or subscribe to anysecuri<es. Paterson Securi<es makes no representa<on or warranty, express or implied, as to the accuracy, completeness or fairness of theinforma<on and opinions contained in this document. Paterson Securi<es, its affiliates, and the employees of Paterson Securi<es and itsaffiliates may, from <me to <me, effect or have effected an own account transac<on in, or deal as principal or agent in or for the securi<esmen<oned in this document. This report has been prepared on the basis of informa<on, which is already available in publicly accessiblemedia or developed through the independent analysis of Paterson Securi<es.
Copyright in this document vests with Paterson Securi;es
Research Partner Page 13 of 13


![[TTM] Incoterms [Trabajo]](https://img.dokumen.tips/doc/110x75/5571fe0e49795991699a8941/ttm-incoterms-trabajo.jpg)
