Embed Size (px)
Citation preview
29th Annual Workshop & Symposium IEA Collaborative Project on Enhanced Oil Recovery
1
Carbonated Water Injection (CWI) Studies
Mehran Sohrabi, Masoud Riazi, Mahmoud Jamiolahmady, Shaun Ireland and
Christopher Brown
[email protected], [email protected], [email protected]
[email protected], [email protected]
Institute of Petroleum Engineering, Heriot-Watt University,
Riccarton, Edinburgh, UK
Abstract
CO2 injection is a well-established method for increasing recovery from oil reservoirs.
However, poor sweep efficiency has been reported in many CO2 injection projects.
Various injection strategies including gravity stable, WAG and SWAG have been
suggested and, to some extent, applied in the field to alleviate this problem. An alternative
injection strategy could be carbonated water injection (CWI).
This paper describes an investigation of the process of CWI by performing high-pressure
flow experiments. The experiments reveal the underlying physics and the pore-scale
mechanisms of fluid-fluid and fluid-solid interactions during CWI. The results show that
CWI, compared to unadulterated water injection, improves oil recovery as both secondary
(before water flooding) and tertiary (after water flooding) recovery methods. The
improvement is, however, higher when carbonated water is injected in secondary recovery
mode. The main mechanisms of oil recovery by CWI are improved sweep efficiency due to
a favourable increased in water viscosity and decrease in oil viscosity and also swelling
and coalescence of the isolated oil ganglia and the resultant fluid redistribution. A larger
part of the porous medium is contacted by carbonated water compared to direct CO2
injection.
1 Introduction
Many of the existing giant oil fields discovered to date are approaching the end of their
water flooding lives and are in tail end production. EOR (enhanced oil recovery) processes
are therefore needed to maximise oil recovery from these reservoirs to meet the rising
global energy demand. CO2 injection is increasingly considered as having potential

29th Annual Workshop & Symposium IEA Collaborative Project on Enhanced Oil Recovery
2
applications as a possible EOR process for these reservoirs. The pore space available in
these reservoirs can also store significant quantities of CO2 as part of a CCS (carbon
capture and storage) programme for a long period of time.
CO2 injection for EOR is a well-established technology. CO2 increases oil recovery by
primarily altering the physical properties of the oil phase i.e. swelling of the oil, reduction
of oil viscosity and possible vaporization and extraction of intermediate components. It has
been reported that poor sweep efficiency (due to a high CO2 mobility) has been a problem
in CO2-floods of many oil reservoirs1. Therefore, direct injection of CO2 (both continuous
flooding and WAG) might not result in economically significant amount of additional oil
recovery. In terms of CO2 storage potential, poor sweep efficiency also implies lower
storage capacity. An alternative injection strategy could be carbonated water
(CO2-enriched water) injection.
Carbonated water has advantages over direct CO2 injection as it has a better sweep
efficiency. In water flooded reservoirs, CWI can alleviate the adverse effect of high water
saturation and the water shielding effects as a result of mixing with the resident water. This
in turn facilitates CO2 dissolution and the subsequent oil swelling. In direct CO2 injection, it
has been shown that, due to low sweep efficiency and gravity segregation, the time scale for
CO2 diffusion in oil can be several years2. In terms of CO2 storage, since in CWI CO2 is
dissolved in water (and later oil) rather than as a free phase, CWI would provide a safe
method of storage.
In this study, to investigate the process of carbonated water injection and to identify the
dominant mechanisms in this process, a series of fluid flow experiments were performed
using high-pressure transparent porous media (micromodel). Carbonated water injection as
both secondary and tertiary oil recovery methods was investigated. Both light and viscous
oil were tested to investigate the impact of oil type on the performance of CWI.
2. Experimental Work
2.1 Experimental Facilities
A high-pressure micromodel rig is being used for performing carbonated water injection
tests. The rig can operate at pressures as high as 6000 Psia and at a temperature of 100 °F.
High-pressure micromodel rigs have been extensively used in our research group and the
details of the rig have been reported in our previous publications3, 4, 5 and 6
.
2.2 Test Fluids
The fluid system used in the experiments consisted of distilled water, carbon dioxide and
n-Decane or a viscous mineral oil. The viscosity of the mineral oil at atmospheric pressure
and the temperature of the experiments (38 ºC) is 16.5 mPa.s (cP) whereas the viscosity of
n-Decane is 0.83 mPa.s7 (cP) at 2000 psia and 38°C. Carbonated water was prepared by

29th Annual Workshop & Symposium IEA Collaborative Project on Enhanced Oil Recovery
3
mixing blue degassed distilled water with pure CO2 in a rocking cell at 38 °C and 2000
psia.
To distinguish between oil and the aqueous phase, the colour of the water was changed to
blue using a water-soluble dye. The dyed fluids were filtered using fine filter papers to
remove any un-dissolved dye particles.
3. Results and Discussion
In all the tests reported here, the micromodel orientation was horizontal to minimise the
gravity effect. Figure 1 shows the whole micromodel saturated with 100% blue water.
Figure 2 shows a part of the micromodel in higher magnification. The tests began by
saturating the micromodel with water. Then, to simulate primary drainage of water, initial
migration of oil into the water bearing porous media, the oil phase was injected from one
end of the horizontal micromodel.
Figure 1: The whole micromodel including two triangle sections fully saturated with
degassed blue dyed water.
Figure 2: A magnified section of micromodel fully saturated with degassed blue dyed water.
29th Annual Workshop & Symposium IEA Collaborative Project on Enhanced Oil Recovery
4
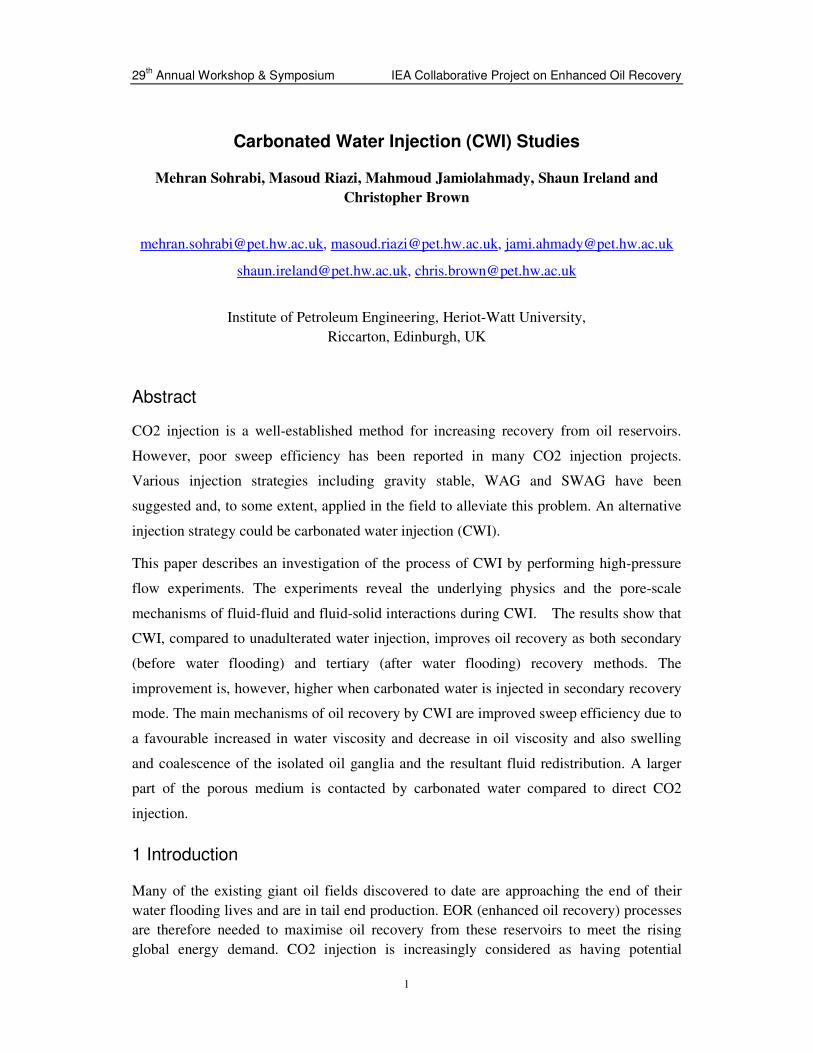
Figure 3, shows a smaller section of micromodel than Figure 2 at the end of the oil
injection period in which the initial oil and connate water saturation has been established.
This image shows the relative position of the wetting phase, blue water, and non-wetting
phase, oil, in the micromodel. The shape of the water-oil interfaces and the fact that some
of the smaller and dead-end pores are filled with water are good indications of the
water-wet conditions of the micromodel.
Figure 3: Initial oil saturation (n-Decane) in just a selected frame in higher magnification.
After this initial oil injection stage (establishment of ‘irreducible’ water), two experiments
with n-Decane were carried out to study carbonated water injection process as both
secondary and tertiary oil recovery mechanisms.
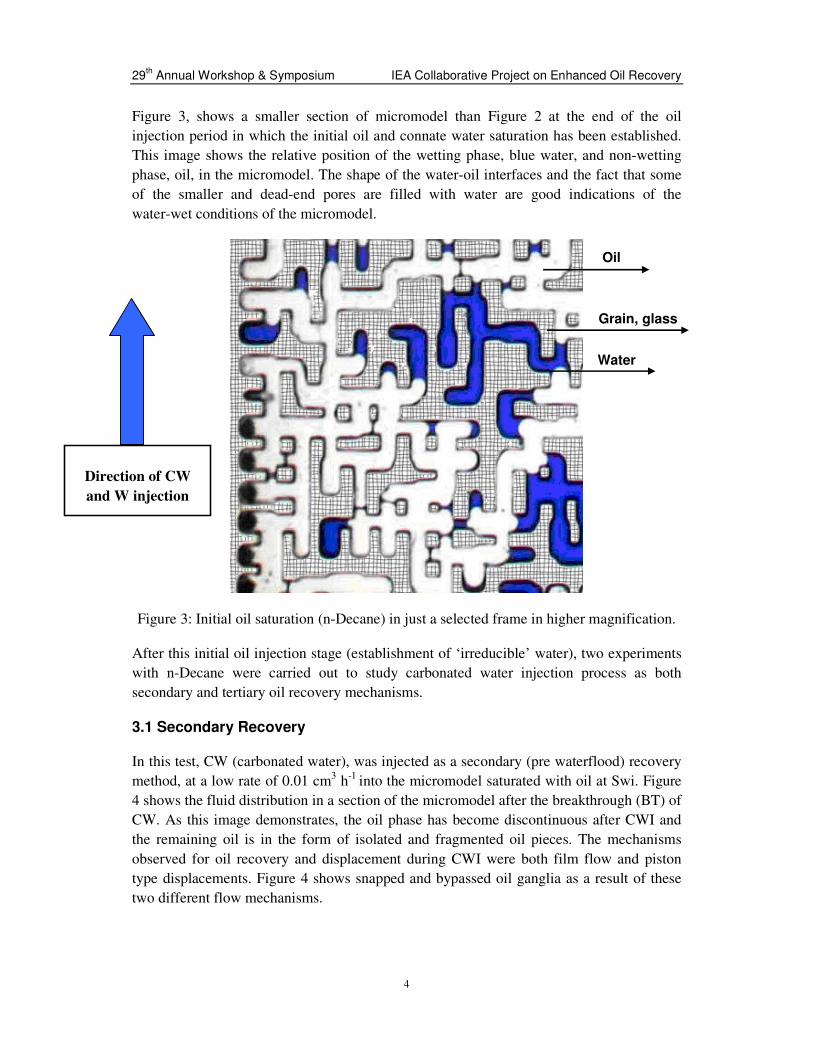
3.1 Secondary Recovery
In this test, CW (carbonated water), was injected as a secondary (pre waterflood) recovery
method, at a low rate of 0.01 cm3 h
-1 into the micromodel saturated with oil at Swi. Figure
4 shows the fluid distribution in a section of the micromodel after the breakthrough (BT) of
CW. As this image demonstrates, the oil phase has become discontinuous after CWI and
the remaining oil is in the form of isolated and fragmented oil pieces. The mechanisms
observed for oil recovery and displacement during CWI were both film flow and piston
type displacements. Figure 4 shows snapped and bypassed oil ganglia as a result of these
two different flow mechanisms.
Water
Grain, glass
Oil
Direction of CW
and W injection

29th Annual Workshop & Symposium IEA Collaborative Project on Enhanced Oil Recovery
5
Figure 4: Oil production by snapping off and bypassing mechanisms in the early time of
CWI, after 0.68 hrs, in the same selected frame shown in the Figure 3
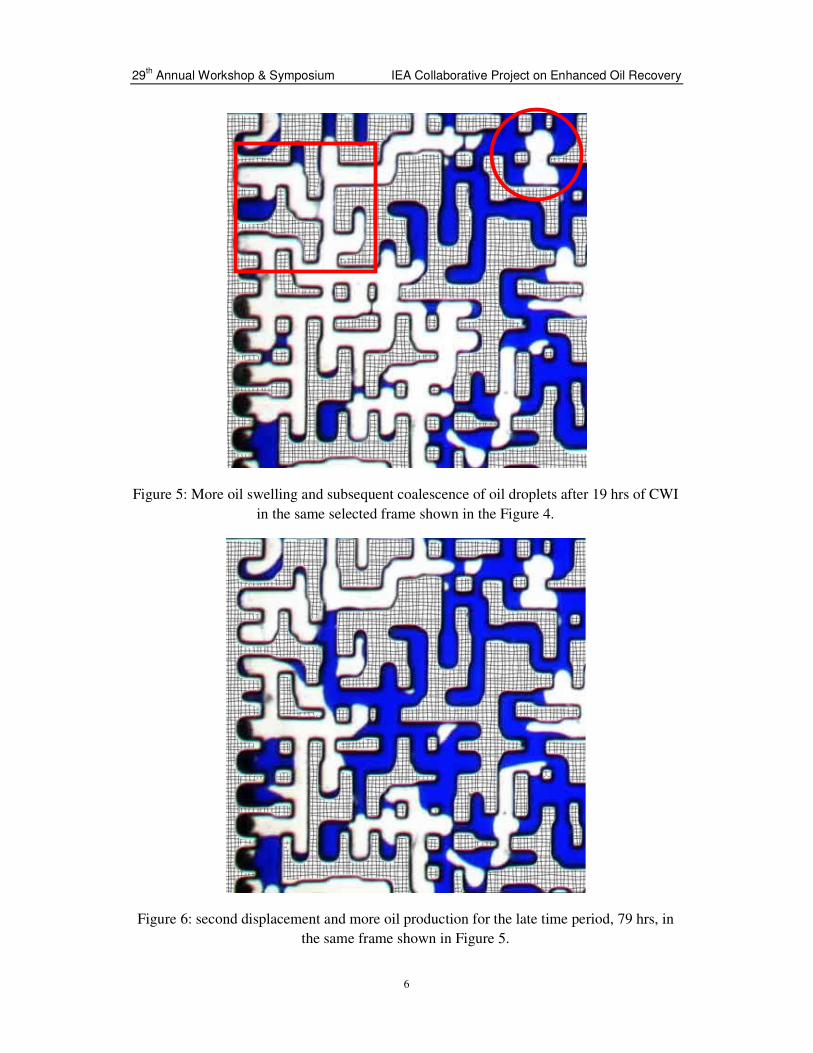
Figure 5 shows fluid distribution within the selected section of the micromodel (as Figure
4) after 19 hrs of CWI. Comparison of this image with Figure 4 reveals that both swelling
and reconnection of some of the isolated oil ganglia happened due to the partitioning of
CO2 from the injected CW and its dissolution in the oil. This swelling and reconnection
improves sweep efficiency. In Figure 5, the red rectangle and circle demonstrate an
example of oil swelling and the reconnection of the oil due to swelling. Figure 6 shows the
same section of the micromodel during CWI after 79 hours. Comparison of Figure 6 and
Figure 5 shows that some of the oil has been recovered during this CWI stage.
During CWI, significant quantities of CO2 dissolve in the oil and water. An additional oil
recovery process could be the in situ release of CO2 subsequent to carbonated water
injection by pressure blow-down of the reservoir. If the pressure of the reservoir is allowed
to drop below the saturation pressure of CO2 in the oil and water a free gas (CO2) phase is
expected to form in the reservoir. This blow-down phase following carbonated water
injection can cause additional oil recovery as well as a significant redistribution of the
fluids within the reservoir. A subsequent waterflooding might also further reduce the
amount of residual oil. After the CWI period, the micromodel went through a
depressurising period in which the pressure was reduced slowly.
Snapped Oil ganglion
Bypassed oil droplet
29th Annual Workshop & Symposium IEA Collaborative Project on Enhanced Oil Recovery
6
Figure 5: More oil swelling and subsequent coalescence of oil droplets after 19 hrs of CWI
in the same selected frame shown in the Figure 4.
Figure 6: second displacement and more oil production for the late time period, 79 hrs, in
the same frame shown in Figure 5.

29th Annual Workshop & Symposium IEA Collaborative Project on Enhanced Oil Recovery
7
This depressurisation period was carried out to both identify the dead-oil volume of the
remaining oil and also to observe the potential of a depressurising process subsequent to
CWI. The distribution of the fluids after this slow depressurisation period is shown in
Figure 7. Comparison of the remaining oil volume in Figure 7 with the oil volume at the
beginning of CWI period (Figure 5) shows that significant amount of oil was recovered
during CWI period. The yellow colour in Figure 7 shows the free gas phase that has
formed during the pressure blow down period, in this figure gas has been digitally coloured
in yellow. Comparison of Figures 6 and 7 shows a significant fluid redistribution has taken
place. Some additional oil recovery was achieved and significant amount of CO2 gas was
recovered as well.
Figure 7: Fluid distribution after blow down mode, depressurization period, when pressure
reached to 180 psia.
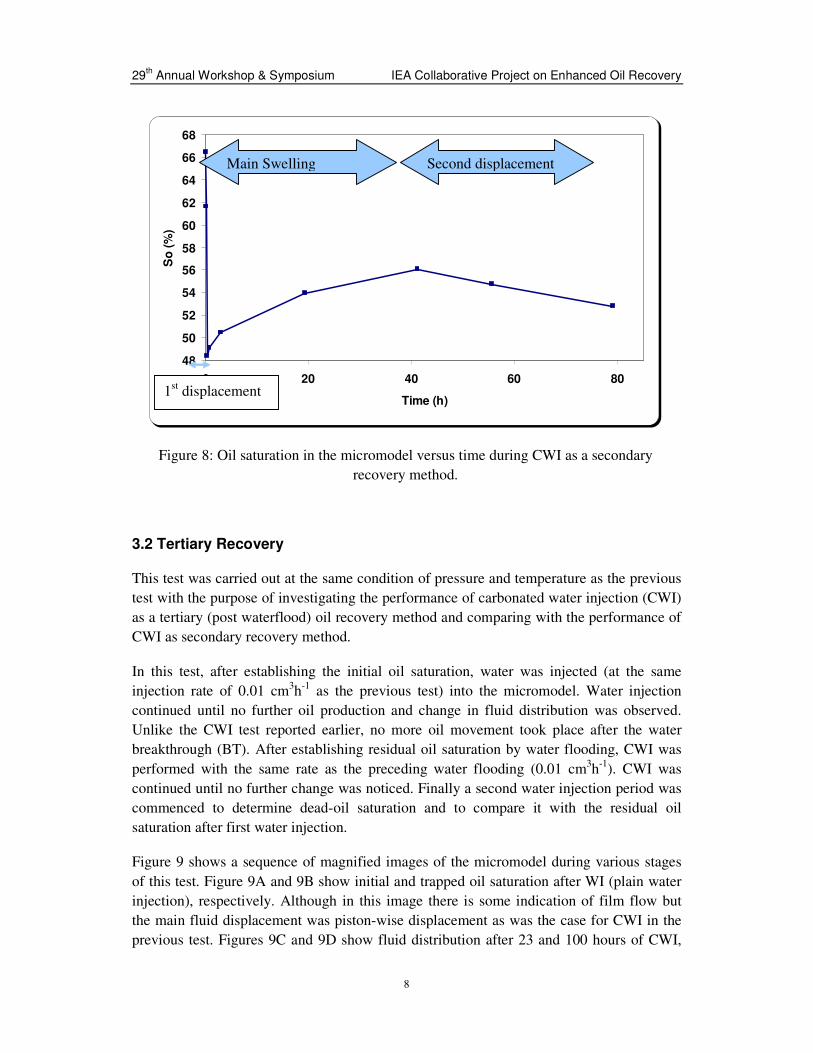
Figure 8 show oil saturation in the whole micromodel (at the test pressure) versus time
during CWI. The data plotted in this Figure can be divided into three parts: 1) main oil
displacement up to the BT of CWI, 2) oil swelling after trapping of the oil phase during the
main displacement, 3) coalescence of the isolated oil ganglia as a result of swelling and the
resultant more oil production. It should be noted that the micromodel is a two dimensional
(2D) porous medium and one would expect more oil connectivity and more oil
displacement in a more realistic 3-D realistic porous medium.
29th Annual Workshop & Symposium IEA Collaborative Project on Enhanced Oil Recovery
8
48
50
52
54
56
58
60
62
64
66
68
0 20 40 60 80
Time (h)
So
(%
)
Figure 8: Oil saturation in the micromodel versus time during CWI as a secondary
recovery method.
3.2 Tertiary Recovery
This test was carried out at the same condition of pressure and temperature as the previous
test with the purpose of investigating the performance of carbonated water injection (CWI)
as a tertiary (post waterflood) oil recovery method and comparing with the performance of
CWI as secondary recovery method.
In this test, after establishing the initial oil saturation, water was injected (at the same
injection rate of 0.01 cm3h
-1 as the previous test) into the micromodel. Water injection
continued until no further oil production and change in fluid distribution was observed.
Unlike the CWI test reported earlier, no more oil movement took place after the water
breakthrough (BT). After establishing residual oil saturation by water flooding, CWI was
performed with the same rate as the preceding water flooding (0.01 cm3h
-1). CWI was
continued until no further change was noticed. Finally a second water injection period was
commenced to determine dead-oil saturation and to compare it with the residual oil
saturation after first water injection.
Figure 9 shows a sequence of magnified images of the micromodel during various stages
of this test. Figure 9A and 9B show initial and trapped oil saturation after WI (plain water
injection), respectively. Although in this image there is some indication of film flow but
the main fluid displacement was piston-wise displacement as was the case for CWI in the
previous test. Figures 9C and 9D show fluid distribution after 23 and 100 hours of CWI,
Main Swelling Second displacement
1st displacement

29th Annual Workshop & Symposium IEA Collaborative Project on Enhanced Oil Recovery
9
respectively. Swelling and re-connection of isolated oil droplets in Figure 9C and
subsequent oil displacement can be seen in Figure 9D. Although Figure 9D, compare to
Figure 9C reveals oil displacement and production but to make a more accurate
comparison we conduct a second water injection to strip the dissolved CO2 out of the oil
and to obtain the dead oil saturation. Figure 9E, which shows the same selected frame of
the micromodel after the second WI, shows that oil shrank due to the stripping of the oil
from its dissolved CO2. Comparison of fluid saturation after first WI (Figure 9B) and
second WI (Figure 9E) confirms the additional oil recovery during CWI after WI.
Comparison of other parts of micromodel indicates fluid re-distribution as a result of cyclic
injection of water and carbonated water flooding. It seems that fluid re-distribution during
cyclic injection of water and carbonated water injection has potential to increased oil
recovery. Further investigation of this issue is currently under study.
Comparison of this test (tertiary) with the previous test (secondary) reveals that although
CWI recovered additional oil after BT both in the secondary and tertiary recovery tests, the
additional oil was recovered faster (40 hrs of CWI) and in larger quantity in the secondary
rather than tertiary (100 hrs of CWI) injection mode. CWI was continued in both these
tests till no further notable fluid distribution change was observed in the micromodel. The
main mechanisms of oil recovery by CWI, base on the results of these tests, are improved
sweep efficiency due to swelling and coalescence of the isolated oil ganglia and the
resultant fluid redistribution. It is also expected that a favourable increase in water
viscosity and decrease in oil viscosity would improve the CWI performance.
A

29th Annual Workshop & Symposium IEA Collaborative Project on Enhanced Oil Recovery
10
Figure 9: Fluid distribution in a selected frame of the micromodel showing oil recovery
process during CWI as a tertiary recovery method: A) initial oil saturation condition B)
Residual oil saturation after first WI, C and D) fluid distribution after 23 and 100 hrs of
CWI, respectively E) Dead oil saturation condition after second WI.
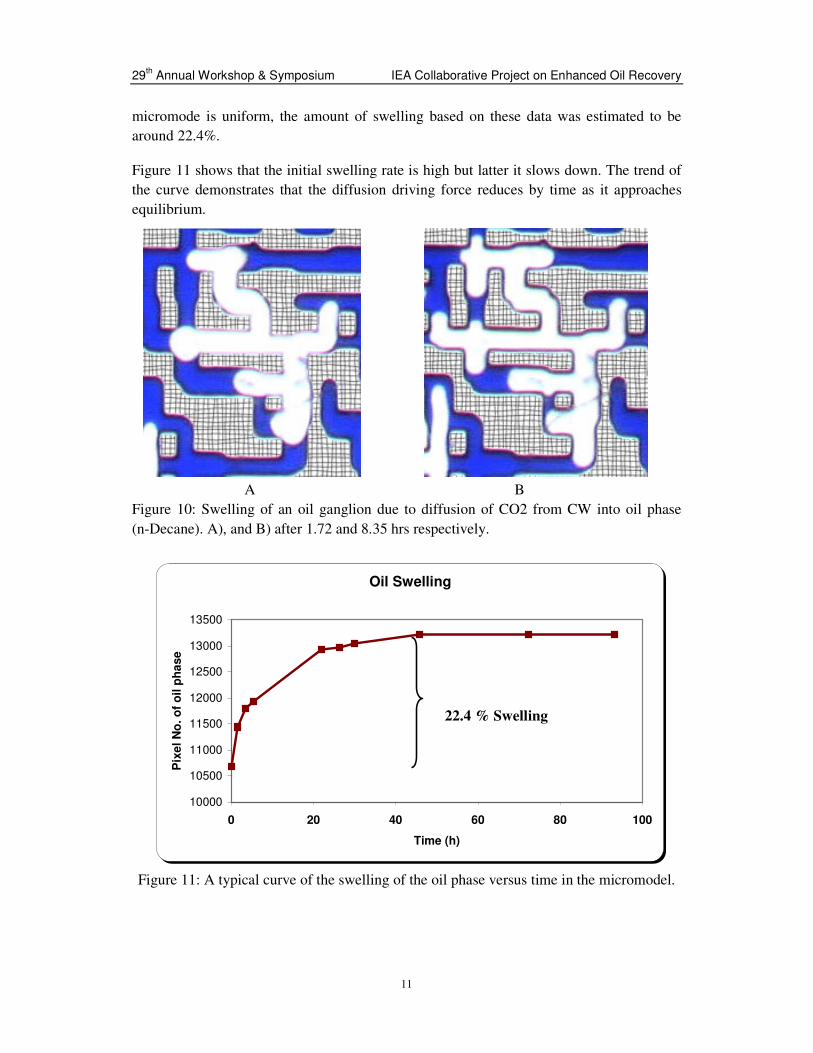
3.3 Diffusion Rate and Swelling Factor
The swelling of the oil during CWI was estimated by monitoring the size of oil ganglia
within the micromodel in the course of CWI. Figure 10 shows an isolated trapped in lower
part of the micromodel. Several highly magnified images of this oil were taken during
CWI (as tertiary recovery method). Figure 10 shows this oil drop at two different time
steps, t=1.72 and 8.35 hrs, respectively. Comparison of these images demonstrates swelling
of the oil during CWI. The numbers of pixels contained in the area covered by this oil
versus time is plotted in Figure 11. Assuming that the depth of this section of the
B C
D E
29th Annual Workshop & Symposium IEA Collaborative Project on Enhanced Oil Recovery
11
micromode is uniform, the amount of swelling based on these data was estimated to be
around 22.4%.
Figure 11 shows that the initial swelling rate is high but latter it slows down. The trend of
the curve demonstrates that the diffusion driving force reduces by time as it approaches
equilibrium.
A B
Figure 10: Swelling of an oil ganglion due to diffusion of CO2 from CW into oil phase
(n-Decane). A), and B) after 1.72 and 8.35 hrs respectively.
Oil Swelling
10000
10500
11000
11500
12000
12500
13000
13500
0 20 40 60 80 100
Time (h)
Pix
el N
o. o
f o
il p
ha
se
Figure 11: A typical curve of the swelling of the oil phase versus time in the micromodel.
22.4 % Swelling
29th Annual Workshop & Symposium IEA Collaborative Project on Enhanced Oil Recovery
12
3.4 Light Oil Versus Viscous Oil
Two main mechanisms of oil recovery during carbonated water injection are; the swelling
and subsequent coalescence of trapped oil ganglia and the reduction of oil viscosity as a
result of partitioning of CO2 from carbonated water and its dissolution into oil. The former
is a dominant mechanism in light oil due to higher CO2 solubility in this type of oil and the
latter is more relevant to more viscous oil due to significant reduction in viscosity of these
oils as a result of CO2 dissolution. To investigate the performance of CWI in viscous oil
and to compare the result with CWI into light oil (n-decane), a CWI test was carried out in
a viscous oil with an initial viscosity of 16.5 cP at the conditions of the experiments.
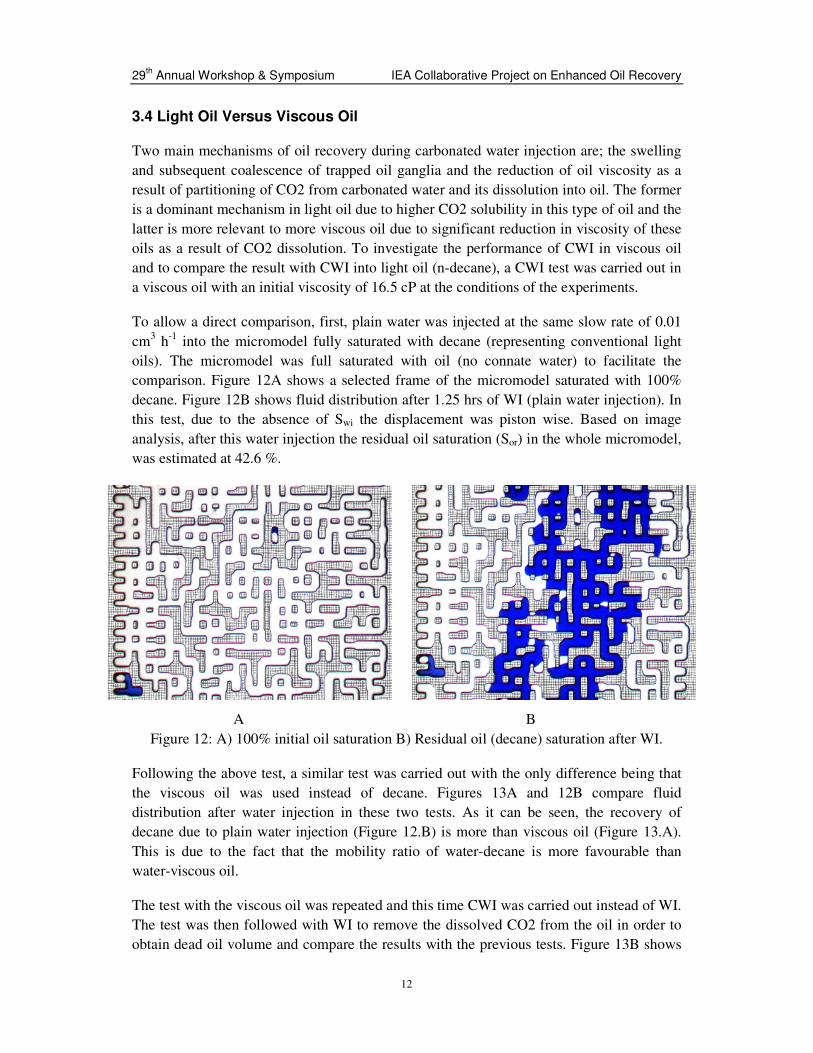
To allow a direct comparison, first, plain water was injected at the same slow rate of 0.01
cm3 h
-1 into the micromodel fully saturated with decane (representing conventional light
oils). The micromodel was full saturated with oil (no connate water) to facilitate the
comparison. Figure 12A shows a selected frame of the micromodel saturated with 100%
decane. Figure 12B shows fluid distribution after 1.25 hrs of WI (plain water injection). In
this test, due to the absence of Swi the displacement was piston wise. Based on image
analysis, after this water injection the residual oil saturation (Sor) in the whole micromodel,
was estimated at 42.6 %.
A B
Figure 12: A) 100% initial oil saturation B) Residual oil (decane) saturation after WI.
Following the above test, a similar test was carried out with the only difference being that
the viscous oil was used instead of decane. Figures 13A and 12B compare fluid
distribution after water injection in these two tests. As it can be seen, the recovery of
decane due to plain water injection (Figure 12.B) is more than viscous oil (Figure 13.A).
This is due to the fact that the mobility ratio of water-decane is more favourable than
water-viscous oil.
The test with the viscous oil was repeated and this time CWI was carried out instead of WI.
The test was then followed with WI to remove the dissolved CO2 from the oil in order to
obtain dead oil volume and compare the results with the previous tests. Figure 13B shows

29th Annual Workshop & Symposium IEA Collaborative Project on Enhanced Oil Recovery
13
the same section of the micromodel after CWI and WI. A comparison of Figure 13A and
13B shows that more oil has been recovered by CWI. The results show that CWI can be an
attractive oil recovery mechanism for viscous oils in which water flood efficiency is
generally poor.
A B
Figure 13: A). Residual viscous oil saturation after WI B) Residual dead viscous oil
saturation after CWI.
4. Conclusions
Based on the experimental work and results presented, the following conclusion can be
drawn:
1. CW increases oil recovery both as a secondary and tertiary recovery method.
However this increase is higher and takes place faster in the secondary flood
scenario.
2. Although more swelling was seen in decane than in heavier oil but CWI was more
effective in production of viscous oil. This was due to a significant reduction in
viscosity as a result of diffusion of CO2 into viscous oil.
3. The main mechanisms of oil recovery by CWI are improved sweep efficiency due
to swelling and coalescence of the isolated oil ganglia and the resultant fluid
redistribution. A favourable increase in water viscosity and decrease in oil viscosity
should also favour higher oil recovery.
4. The amount of oil swelling for decane as a result of diffusion of CO2 from CW at
2000 psia and 38 °C was estimated around 23%. The swelling rate is initially high
but later diminishes as it approaches the equilibrium conditions.

29th Annual Workshop & Symposium IEA Collaborative Project on Enhanced Oil Recovery
14
5. Blow down of the micromodel subsequent to a period of carbonated water injection
showed that residual oil saturation can be further reduced and more oil can be
recovered during this process.
5. Acknowledgements
The Carbonated Water Injection (CWI) project in the Institute of Petroleum Engineering at
Heriot-Watt University is supported equally by: the UK BERR (former DTI), Total
Exploration and Production UK, StatoilHydro, Dong Energy and Petrobras which is
gratefully acknowledged.
References
[1] Patel, P.D., Christman, R.G., and Gardner, J. W.: “An Investigation of Unexpectedly
Low Field-Observed Fluid Mobilities during Some CO2 Tertiary Floods”, SPERE
(November 1987) 507.
[2] Semere Solomon: ’’The Bellona Foundation- Fact sheet: CO2 Storage’’ Bellona
Report may 2007. http://www.bellona.org/factsheets/1191921304.33
[3] Sohrabi, M., Henderson, G.D., Tehrani, D.H. and Danesh, A.: ’’ Visualisation of Oil
Recovery by Water Alternating Gas (WAG) Injection Using High Pressure Micromodels -
Water-Wet System’’ SPE Annual Technical Conference and Exhibition held in Dallas,
Texas, 1–4 October 2000, SPE paper 63000.
[4] Sohrabi, M, Danesh, A., Tehrani, D. H and Jamiolahmady, M.’’ Microscopic
Mechanisms of Oil Recovery By Near-Miscible Gas Injection’’ Transp Porous Med. 2007.
[5] Sohrabi M., Danesh A., and Jamiolahmady M.,” Visualisation of Residual Oil
Recovery by Near-Miscible Gas and SWAG Injection Using High-Pressure Micromodels”,
Transport in Porous Media, January 2008.
[6] Sohrabi M., Riazi M., Jamiolahmady M., Ireland S. and Brown C.,’’Carbonated Water
Injection for Oil Recovery and CO2 Storage’’, Sustainable Energy UK: Meeting the
science and engineering challenge conference, 13-14 May 2008, Oxford
[7] National Institute of Standard and Technology Website. ’’http://www.nist.gov/srd/’’


![Rudi Cilibrasi CWI CWI and University of Amsterdam · 2008-02-01 · arXiv:cs/0312044v2 [cs.CV] 9 Apr 2004 Clustering by Compression Rudi Cilibrasi∗ CWI Paul Vitanyi† CWI and](https://img.dokumen.tips/doc/110x75/5e70e6e6eee2db04ee355a74/rudi-cilibrasi-cwi-cwi-and-university-of-amsterdam-2008-02-01-arxivcs0312044v2.jpg)