Embed Size (px)
Citation preview

Accepted Manuscript
Carbonate system biogeochemistry in a subterranean estuary-Waquoit Bay,USA
Qian Liu, Matthew A. Charette, Crystaline F. Breier, Paul B. Henderson, DanielC. McCorkle, William Martin, Minhan Dai
PII: S0016-7037(17)30055-8DOI: http://dx.doi.org/10.1016/j.gca.2017.01.041Reference: GCA 10135
To appear in: Geochimica et Cosmochimica Acta
Received Date: 24 March 2016Revised Date: 20 January 2017Accepted Date: 23 January 2017
Please cite this article as: Liu, Q., Charette, M.A., Breier, C.F., Henderson, P.B., McCorkle, D.C., Martin, W., Dai,M., Carbonate system biogeochemistry in a subterranean estuary-Waquoit Bay, USA, Geochimica et CosmochimicaActa (2017), doi: http://dx.doi.org/10.1016/j.gca.2017.01.041
This is a PDF file of an unedited manuscript that has been accepted for publication. As a service to our customerswe are providing this early version of the manuscript. The manuscript will undergo copyediting, typesetting, andreview of the resulting proof before it is published in its final form. Please note that during the production processerrors may be discovered which could affect the content, and all legal disclaimers that apply to the journal pertain.

Carbonate system biogeochemistry in a subterranean estuary-Waquoit Bay, 1
USA 2
3
4
Qian Liua,b
, Matthew A. Charetteb*, Crystaline F. Breier
b, Paul B. Henderson
b, Daniel C. 5
McCorklec, William Martin
b, Minhan Dai
a 6
7
a State Key Lab of Marine Environmental Science, Xiamen University, Xiamen, Fujian, China 8
9 b Department of Marine Chemistry and Geochemistry, Woods Hole Oceanographic Institution, 10
Woods Hole, Massachusetts, USA 11
12 c Department of Geology and Geophysics, Woods Hole Oceanographic Institution, Woods Hole, 13
Massachusetts, USA 14
15
16
17
*Corresponding author: [email protected] 18
Office: (508) 289-3205 19
Fax: (508) 457-2193 20
21
22
23
24
25
26
Abbreviations: SGD, Submarine groundwater discharge; STE, Subterranean estuary;DIC, dis-27
solved inorganic carbon; TAlk, total alkalinity; WB, Waquoit Bay 28
29
30
31
32
33
34
35
36
37
38
39
40
41
42

Abstract 43
Quantifying carbon fluxes associated with submarine groundwater discharge (SGD) remains 44
challenging due to the complex biogeochemistry of the carbonate system in the subterranean estu-45
ary (STE). Here we conducted time series measurements of total alkalinity (TAlk) and dissolved 46
inorganic carbon (DIC) in a well-studied coastal aquifer (Waquoit Bay, Massachusetts, USA). 47
Groundwater samples were collected monthly from May 2009 to June 2010 across the freshwater-48
saltwater mixing zone of the Waquoit Bay (WB) STE. The concentrations of both TAlk and DIC in 49
zero-salinity groundwater were variable, but were lower than those in the bay water (S ~28). DIC 50
underwent slightly non-conservative mixing between low and intermediate salinities while there 51
was an apparent additional DIC source at high salinity (> 20) in all seasons. TAlk concentrations 52
exhibited even stronger variations, with evidence of both production and consumption in high sa-53
linity zones, and consistent TAlk consumption at intermediate salinity in summer and fall (June-54
December, 2009). The increases in DIC and TAlk at high salinity were attributed to aerobic respi-55
ration and denitrification in WB sediments during bay water recharge of the STE. We infer that the 56
loss of TAlk at intermediate salinity reflects H+ production as reduced compounds (e.g. Fe2+) are 57
oxidized within the STE. In terms of impacts on surface water inorganic carbon budgets, the SGD-58
derived DIC flux was mainly controlled by seasonal changes in SGD while a combination of TAlk 59
concentration variability and SGD drove the TAlk flux. SGD-derived DIC, aqueous CO2, and H+ 60
fluxes to the bay were ~40-50% higher in summer vs. in winter, a result of enhanced marine 61
groundwater flux and significant TAlk removal (proton addition) during periods of high seawater 62
intrusion. Furthermore, the SGD-derived DIC flux was consistently greater than TAlk flux regard-63
less of season, indicating that SGD serves to reduce the CO2 buffering capacity of surface water. 64
Our results highlight the importance of seasonality and subsurface biogeochemical processes on 65
the subterranean estuary carbonate system and the resulting impact on SGD-derived TAlk, DIC, 66
aqueous CO2, and H+
fluxes to the coastal ocean. 67
68
69
70
71

1. Introduction 72
Submarine groundwater discharge (SGD) has been increasingly recognized as a significant 73
carbon source to the coastal ocean (Lee and Kim, 2015a; Liu et al., 2012; 2014; Moore, 2010; 74
2011; Reckhardt et al., 2015; Santos et al., 2011; Wang et al., 2015; Yang et al., 2015) thereby 75
playing a role in the marine carbonate system. In some coral reef lagoons, wetlands and mangrove 76
systems, the SGD flux has been shown to dominate estuarine CO2 dynamics (Cyronak et al., 2014; 77
Maher et al., 2013; Santos et al., 2012). SGD has also been reported as a main source of acidity 78
contributing to coastal acidification in both coral reef and wetland ecosystems (de Weys et al., 79
2011; Santos et al., 2011; Wang et al., 2014). In the coastal margin of a volcanic island, however, 80
seawater pH actually increased due to enhanced biological productivity supported by SGD-derived 81
nutrients (Lee and Kim, 2015a). Together, these studies illustrate the complexity and significance 82
of SGD to coastal ocean carbon dynamics. 83
Similar to river-estuary systems, terrestrial groundwater undergoes significant modifications in 84
its chemical composition before discharging into the coastal ocean due to mixing with seawater 85
and both biotic and abiotic reactions with aquifer sediments. This reaction zone has been termed 86
the ‘subterranean estuary’ (STE; Moore, 1999). In contrast with surface estuaries, however, STEs 87
generally have longer water residence times, enhanced sediment-water interactions, wider redox 88
gradients, and higher microbial activities (Moore, 1999). The CO2 system in the STE has been 89
shown to be significantly modified by diagenetic reactions such as carbonate dissolution and or-90
ganic matter remineralization (Cai et al., 2003; Dorsett et al., 2011; Lee and Kim, 2015b; Liu et al., 91
2012). 92
Given the STE’s dynamic hydrology and biogeochemistry, groundwater CO2 system meas-93
urements must be collected on fine spatial and temporal scales to better evaluate the relevant bio-94
geochemical reactions and their impacts on the coastal ocean inorganic carbon cycle. Waquoit Bay, 95
Massachusetts (WB) has a well defined salinity transition zone occurring over a narrow region (ca. 96
20 m wide, 1-2 m thick, Charette et al., 2005; Gonneea et al., 2014) that hosts a suite of biogeo-97
chemical processes (Charette and Sholkovitz, 2006; Spiteri et al., 2008). Seasonal movement of 98
the salinity transition zone in this STE responds to oscillations in the aquifer hydraulic gradient 99
and sea level (Michael et al., 2005; Gonneea et al., 2013a,b). Through year-long monthly car-100
bonate chemistry observations in the WB STE, we sought to quantify CO2 system dynamics in the 101

context of seasonal hydrogeologic changes and to determine factors that drive CO2 biogeochemis-102
try within three main aquifer zones: terrestrial, intermediate salinity, and high salinity groundwater. 103
Finally we estimated the seasonal variability in SGD-derived total alkalinity (TAlk) and dissolved 104
inorganic carbon (DIC) fluxes to the bay. 105
2. Materials and methods 106
2.1. Study site 107
Waquoit Bay is a shallow semi-enclosed estuary (average water depth 1 m) in Cape Cod (MA, 108
USA, Fig.1); it experiences diurnal tides with an average tidal range of 1.1 m (Charette et al., 109
2001). The freshwater contributed to the bay includes rainfall (11%), groundwater discharge 110
(34%), and rivers (55%) (Cambareri and Eichner, 1998). Importantly, the rivers are largely 111
groundwater fed: approximately 90% of the river flow is supplied by groundwater recharge. 112
Therefore, groundwater is the major freshwater source to the bay. 113
The upper unconfined aquifer (10 m) is mainly composed of coarse and fine sand as well as 114
gravel (Charette et al., 2005). Precipitation (114 cm yr-1
) has relatively low seasonal variation 115
(Walter and Whealan, 2005), however, the groundwater table is lower in summer compared with 116
winter and spring due to evapotranspiration (Michael et al., 2005). Inland, the maximum annual 117
water table variability can reach as high as 1 m. Multiple measurement techniques indicate that the 118
most intensive direct SGD source lies along the northern shoreline of the bay (Charette et al., 2001; 119
Mulligan and Charette, 2006). Hereafter, the salinity transition zone will be referred to as the 120
“mixing zone”. The mixing zone oscillates with changes in hydraulic gradient between the aquifer 121
and sea level, which is mainly driven by the latter in this STE (Gonneea et al., 2013a). A higher 122
hydraulic gradient will lead to seaward movement of the mixing zone while a lower hydraulic gra-123
dient will result in landward movement. Our sampling period (May 2009 to June 2010) generally 124
had higher sea level compared with previous years based on monthly mean sea level (MSL) anom-125
aly data from the nearby Woods Hole tidal gauge (Fig. 2). The average MSL in summer is ~4 cm 126
higher in 2009 vs. 2005 to 2007. This pattern was likely due to the combined effects of El Niño 127
and a negative mode of the North Atlantic Oscillation (Gonneea et al., 2013a). 128
2.2. Field sampling 129
We conducted a time series sampling program for groundwater and bay water at the head of 130
the bay (Fig. 1). Monthly groundwater profiles were collected from May 2009 to June 2010 at PZ3, 131

which is a series of nested fixed-depth well points that span the mixing zone of subterranean estu-132
ary. In total there are ten well points ranging in depth from 0.5 to 5.5 m below the beach surface, 133
with intervals of between 0.15 and 1 m. Samples were collected during the same tidal cycle and 134
phase (four hours past high tide, ~3 days before the monthly spring tide) to reduce potential varia-135
bility associated with tidal fluctuations. We simultaneously collected surface waters at four sta-136
tions equally spaced along the head of the bay, ~100 m offshore, with a water depth of ~0.8 m. 137
During November 2009 and June 2010, we collected two additional piezometer profiles at PZ10 138
(13.5 m inland of PZ3) and PZ5 (3 m seaward of PZ3). Piezometer profile PZ10 included nine 139
depths from 0.9 to 5.5 m while PZ5 included sixteen depths ranging from 0.3 to 6.1 m. 140
The groundwater samples were obtained with a stainless steel drive point piezometer system 141
as described in Charette and Allen (2006). Groundwater was extracted using peristaltic pumps at 142
10-50 mL min-1
. Groundwater sampling commenced after purging the wells of ~1 L or 6-13 well 143
volumes. Ancillary water chemistry data including salinity, temperature, dissolved oxygen (DO), 144
pH, and oxidation-reduction potential (ORP, mV) were measured with a YSI 600XLM sonde in a 145
flow-through cell. ORP is a qualitative measure of the tendency of solutes to acquire electrons and 146
thereby be reduced in aquatic environments. Separate 125 mL samples were collected for salinity 147
analysis. Discrete samples for TAlk and DIC were collected in 150 mL borosilicate glass vials as 148
follows: after overflowing 1.5 times, water was removed to create a ~3 mL headspace, then poi-149
soned with 50 µL of a saturated HgCl2 solution. Laboratory tape was wrapped around the cap to 150
maintain an air tight seal. Trace metal samples were filtered into acid cleaned LDPE bottles using 151
a 0.2 µm capsule filter (Pall Acropak). Samples were acidified to pH 1-2 with 20 µL of Optima 152
ultrapure trace metal grade nitric acid (8 M). Nutrient samples were similarly filtered into acid 153
washed 20 mL polyethylene sample bottles, and stored on ice until their return to the laboratory. A 154
second nutrient vial was filled and acidified to ~pH 2 with 8 M sulfurous acid to eliminate scav-155
enging of phosphate by precipitation of dissolved iron prior to analysis. 156
2.3. Sample analysis 157
Salinity was analyzed by a Guideline AutoSal instrument. DIC and TAlk were measured 158
within two weeks of collection. DIC was determined by acidification of 0.5 mL of a water sample 159
and the subsequent quantification of CO2 with a non-dispersive IR detector (Li-Cor 6252). The 160
analytical precision is ±3 µmol kg-1. TAlk was determined using Gran titration (Metrohm 808 161

Titrando with 1 mL burette) with a precision of ±4 µmol kg-1
. Both DIC and TAlk were calibrated 162
by certified reference materials from A.G. Dickson of the Scripps Institution of Oceanography. 163
From the measured T and S, and DIC and TAlk concentrations, we used the CO2SYS.XLS 164
v.14 software (Lewis and Wallace 1998) to derive the concentrations of the DIC components 165
(aqueous CO2, bicarbonate, and carbonate), pCO2, and pH (total scale). Dissociation constants for 166
carbonic acid were those of Millero et al (2006). The CO2 solubility coefficient was taken from 167
Weiss (1974) and the sulfate dissociation constant was derived from Dickson (1990); both are the 168
default values in the CO2SYS.XLS v.14 program. The calculated calcite or aragonite saturation 169
indexes (Ω) were based on Ω= [Ca2+][CO32-]/Ksp, whereby Ω<1 indicates undersaturation for 170
CaCO3, Ω=1 represents the equilibrium CaCO3 phase, and Ω>1 is CaCO3 supersaturation (Ksp is 171
the CaCO3 solubility product; Mucci 1983). For surface water, Ca2+
was derived from an empirical 172
equation involving measured salinity (Ca2+
(mmol kg-1
) =10.28×S/35; Millero 2005). For ground-173
water samples, we estimated Ca2+
concentrations based on Waquoit Bay STE Ca measurements 174
from the summer of 2004 (Ca (mmol kg-1
) =0.28×S+0.11; Appendix Fig. S1). 175
Nutrient analyses (nitrate, phosphate, ammonium) were performed at the Woods Hole Ocean-176
ographic Institution Nutrient Analytical Facility using standard methods on a Lachat QuickChem 177
8000 Flow Injection Analyzer. Mn and Fe were analyzed on a Finnigan Element 2 high-resolution 178
inductively coupled plasma mass spectrometer at the Woods Hole Oceanographic Institution ICP-179
MS Facility. Briefly, samples were diluted 20-fold with 5% Optima nitric acid spiked with Indium 180
(In) as an internal standard to correct for instrument drift and matrix interferences of the solution. 181
Standards were prepared in the same manner as samples (In-spiked) and six-point standard curves 182
were used to calculate sample metal concentrations (Charette and Sholkovitz, 2006). 183
3. Results 184
3.1. Salinity distribution in the subterranean estuary 185
A decreasing hydraulic gradient will cause the landward movement of the mixing zone 186
(Gonneea et al., 2013a), leading to generally higher salinities within our fixed depth piezometers. 187
Conversely, lower salinities are observed with an increasing hydraulic gradient. Although the hy-188
draulic gradient from May 2009 to June 2010 was relatively invariant compared with previous ob-189
servations, we still observed a shallowing of the mixing zone (salinity 5-10) in summer and fall 190
(June to December 2009, Fig. 3) relative to winter and spring (January to May 2010, Fig. 3). Salin-191

ity anomalies in the freshwater portion of the aquifer were observed in June-July 2009 and May-192
June 2010 (Fig. 3) and were likely associated with the mixing between tide and wave induced 193
overtopping of bay water and terrestrial groundwater (Rogers, 2010; Gonneea et al., 2013b). 194
3.2. Redox processes in the subterranean estuary 195
Dissolved oxygen saturation ranged from 3 to 90% (median: 9%), indicative of persistent 196
low-oxygen conditions in the STE (Fig. 4a), while surface bay water had nearly saturated and su-197
persaturated DO ranging 70-154% (Appendix Table S1). In the STE, DO saturation was generally 198
lowest below the mixing zone. The high DO (33-90%) layer at 2.5 m was especially pronounced 199
from June to December, 2009. 200
Dissolved Mn from the monthly time series (Fig. 4b) was elevated below 4 m, ranging from 201
9.1-31.9 µmol kg-1
, but depleted at shallow depths, ranging from 0-3.6 µmol kg-1
. By comparison, 202
the bay water had low dissolved Mn (average = 0.4 µmol kg
-1; Appendix Table S1). Dissolved Fe 203
ranged from 0-542 µmol kg-1
, with the highest values observed in the shallow layer (<2.5 m) in 204
association with the freshwater plume (Fig. 4c). Like Mn, surface water Fe was generally low (av-205
erage = 0.5 µmol kg-1
; Appendix Table S1). During the STE cross-section sampling in November 206
2009 and June 2010, the highest Mn and Fe concentrations were associated with high salinity 207
groundwater at the seaward PZ5 well (Appendix Table S1). This is the most reducing region with-208
in the STE (Charette and Sholkovitz, 2006), and these elevated dissolved Mn and Fe values are the 209
result of Mn and Fe (oxy)hydroxide reduction associated with organic matter oxidation, with the 210
organic matter being supplied by seawater intrusion (Charette et al., 2005; Spiteri et al., 2008). 211
These microbial reaction pathways are favored upon depletion of oxygen and nitrate as the prima-212
ry electron acceptors. 213
Ammonium (Fig. 4e) and phosphate (Fig. 4f) follow a similar pattern to Mn, though there 214
were elevated concentrations of both at some shallow depths (less than 2.5 m) and in some seasons, 215
e.g. NH4+ was as high as 43 µmol L
-1 at 1.5 m in September 2009. In contrast with ammonia, ni-216
trate plus nitrite (N+N) was almost nil or below detection in the deeper groundwater (>3.5 m, Fig. 217
4d). Elevated N+N (163-245 µmol L-1
), centered at a depth of 2.5 m, corresponded with the high 218
DO layer. 219

3.3. Temporal variability of the carbonate system1 in the subterranean estuary 220
TAlk and DIC followed a consistent pattern in the STE (Fig. 5a and b): terrestrial groundwa-221
ter (salinity <1) had lower TAlk (40-873 µmol kg-1, median: 97 µmol kg-1) and DIC (512-1039 222
µmol kg-1, median: 695 µmol kg-1) as compared with marine groundwater (1<salinity ≤25.6), 223
which had a TAlk range of 84-1985 µmol kg1 (median: 1311 µmol kg
-1) and DIC range of 598-224
2046 µmol kg-1
(median: 1609 µmol kg-1
). 225
Groundwater carbonate ion concentrations were low across all salinities, less than 1% of the 226
DIC. In terrestrial groundwater, DIC was dominated by aqueous CO2, accounting for 16-93% 227
(median: 85%) of the DIC while in the marine groundwater DIC was dominated by bicarbonate 228
(11-95%, median: 83%). Both TAlk and DIC in terrestrial groundwater were lower than in bay 229
water (TAlk: 1364-2063 µmol kg-1
; DIC: 1320-1936 µmol kg-1
, appendix Table S1). The 230
TAlk/DIC ratio in all groundwater samples was below 1, which is in contrast with the bay water 231
samples, which had a TAlk/DIC of greater than 1. Seasonal variations of TAlk and DIC at fixed 232
depths were consistent with the observed salinity variations, i.e. TAlk and DIC concentrations in 233
summer and fall were greater than those in winter and spring at fixed depths, suggesting that TAlk 234
and DIC within the STE was influenced by physical mixing between terrestrial and marine 235
groundwater. 236
The entire STE had between one and two orders of magnitude higher pCO2 (~1044-22,670 237
µatm, median: 6243 µatm, Fig. 5c) relative to atmospheric CO2 (~400 ppm) and bay water pCO2 238
(138-1113 µatm, appendix Table S1). Marine groundwater had lower pCO2 than terrestrial 239
groundwater. The calculated pH values at in situ temperature were low in terrestrial groundwater, 240
ranging from 5.23-7.12; pH increased across the mixing zone reaching maximum values of 7.39 at 241
high salinity. The pH was lowest at 2.5 m in association with low TAlk (Fig. 5d). Bay water pH 242
was greater than 7.47 with a maximum of 8.36 (Appendix Table S1). The STE calcite saturation 243
index increased from 0 at the surface to 0.61 at 5.5 m (Fig. 5e and appendix Table S1), while arag-244
onite saturation ranged from 0 to 0.38 (Appendix Table S1), suggesting the system was 245
1 Four typical parameters represent carbonate system, pH, partial pressure CO2 (pCO2), total alkalinity (TAlk, [HCO3
-
]+2[CO32-
]+[B(OH)4-]+[OH
-]+[HPO4
2-]+2[PO4
3-]+[SiO(OH)3
-]+[NH3]+[HS
-]+…-[H
+]F-[HSO4
-]-[HF]-[H3PO4]-…
Dickson, 1981), and dissolved inorganic carbon (DIC, [CO2*]+[HCO3
-]+[CO3
2-]), [CO2
*] represents the concentration
of all unionized carbon dioxide including [CO2] and [H2CO3], i.e. aqueous CO2.* is the sum of [CO2] and [H2CO3].

undersaturated with respect to calcium carbonate across the entire STE during all seasons. 246
4. Discussion 247
4.1. Physical and biogeochemical control on the carbonate chemistry in the subterranean estuary 248
Terrestrial groundwater (salinity<1) displayed a wide range of TAlk and DIC concentrations 249
(Figs. 6a, 7a and 7b); elevated values were generally associated with a terrestrial groundwater 250
plume that also carried elevated concentrations of ammonia, phosphate, and iron in PZ10 (Fig. 6c 251
and d). Isotopic data such as δ56
Fe (Rouxel et al., 2008) and δ15
N-NH4+ (Kroeger and Charette, 252
2008) suggest that this plume originates from aquifer recharge through a freshwater pond to the 253
north of the study location. In addition, organic matter degradation produces DIC, ammonia, and 254
phosphate (Table 2). The observed elevated TAlk and a negative correlation between TAlk and 255
ORP suggest that TAlk and DIC are produced by organic carbon decomposition processes in the 256
terrestrial groundwater (Fig. 6a, b, and appendix Fig. S2). The positive correlation of both TAlk 257
and DIC with ammonia is also consistent with this idea (Fig. 6b, d, and appendix Fig. S2). It is un-258
likely that carbonate minerals are exerting a significant control on STE TAlk and DIC concentra-259
tions as aquifer sediments in this region are primarily composed of coarse grained sands with 260
quartz (Rouxel et al., 2008). In addition, terrestrial groundwater was observed in the shallow layer 261
(≤2.5 m) of the monthly time-series piezometer (PZ3) samples. At 2.5 m, we observed elevated 262
DO and nitrate but depleted ammonia, particularly from June to September 2009 (Fig.4), which 263
may be an indication of nitrification. 264
In order to better understand and quantify the processes that are operating on the inorganic 265
carbon cycle in the STE during mixing of terrestrial and marine groundwater, we must first define 266
the low and high salinity endmembers to be used in our analysis. On the freshwater side, ground-267
water flow is generally laminar such that much of the mixing takes place along the STE salinity 268
gradient. As such, the plume containing high DIC and TAlk that coincides with a persistent terres-269
trial groundwater nutrient and trace metal plume (2-4 m at site PZ10, Fig. 6; see also Kroeger and 270
Charette (2008) and Spiteri et al. (2008)) does not interact or mix with deep STE groundwater. 271
This plume is characterized by relatively low ORP (Fig. 6a), hence, we define our terrestrial 272
groundwater endmember as samples with an ORP>150 mV, which includes those samples that lie 273
just above the mixing zone but below the terrestrial nutrient plume (phosphate and ammonium). 274
On the high salinity side, we use average bay water concentrations since this is the water that is 275

being recharged into the STE during seawater circulation through the aquifer. In this way, any in-276
creases or decreases in DIC or TAlk across the mixing zone are assumed to be exclusively a result 277
of biogeochemical processes that occurred in the subsurface. A summary of the endmembers for 278
terrestrial groundwater and bay water are shown in Table 1. 279
We used the endmember definitions in Table 1 to construct two-endmember mixing diagrams 280
for both the time series PZ3 profiles (Appendix Fig. S3) and the high resolution profiles collected 281
in November 2009 and June 2010 (Fig. 7). We also introduce ∆ΤAlk and ∆DIC, where ∆ is the dif-282
ference between the calculated conservative two-endmember mixing and the measured value (Fig. 283
8); positive values are non-conservative addition while negative values are removal. DIC in the 284
STE displayed addition at high salinity (>20) for all seasons, while it exhibited approximately con-285
servative mixing through intermediate salinities (1-20). TAlk appeared to be added at high salinity 286
in some seasons, but this TAlk excess is smaller and less consistent than the DIC excess. At inter-287
mediate salinity, TAlk displayed a large seasonal variation from nearly conservative mixing (De-288
cember 28, 2009, January, February, April, and June 2010) to non-conservative removal (June to 289
August 2009, November, December 1, 2009, and May 2010) and slightly non-conservative addi-290
tion in March 2010 (Fig. 8 and appendix Fig. S3). These DIC and TAlk patterns are evidence for 291
the existence of temporally-variable physical and biogeochemical controls on their concentration 292
during transport through the STE. To examine in more detail the potential driving forces on DIC 293
and TAlk behavior in the STE, we will separately discuss the transformations occurring at mid sa-294
linity (1-20) and high salinity (>20) with a focus on the more detailed Nov. 2009 and Jun. 2010 295
datasets. 296
4.1.1. Processes driving DIC and TAlk concentrations at mid salinity 297
DIC displayed only slight curvature (consumption) in the mid salinity zone (1-20) from No-298
vember 2009 and June 2010 (Fig. 7b and d). This indicates that DIC was predominately controlled 299
by physical mixing between terrestrial groundwater and bay water in these two seasons. However, 300
while TAlk was approximately conservative in the same zone during June 2010, it was significant-301
ly depleted in November 2009 (Fig. 7a and c). The TAlk removal was located primarily between 302
0.3 to 0.9 m in PZ5 (Fig. 9b). Previous studies have observed oxidation of reduced Mn and Fe in 303
terrestrial groundwater upon transiting the STE, and Fe/Mn oxide coated subsurface sands have 304
been observed in the mixing zone down to the depth of at least 6 m around PZ3 and PZ5, the so-305

called “iron curtain” (Charette and Sholkovitz, 2002; Charette et al., 2005; Gonneea et al., 2008). 306
There is also a Fe and Mn redox front along the high salinity boundary of STE, which accounts for 307
the large vertical extent of the “iron curtain” (Charette and Sholkovitz, 2002; Charette et al., 2005; 308
Charette and Sholkovitz, 2006). 309
Since Fe2+
and Mn2+
oxidation reactions produce H+ but no DIC, these processes would serve 310
to reduce TAlk and pH yet have no effect on DIC. Spiteri et al (2006) reported that the pH gradient 311
between PZ3 and PZ5, driven by seawater intrusion with a relatively high pH, caused a 7-fold in-312
crease in the rate of Fe2+
oxidation relative to fresh groundwater. We observed shallowing of the 313
salinity mixing zone in summer and fall (June to December 2009, Fig. 3) relative to winter and 314
spring (January to May 2010, Fig. 3), suggesting enhanced seawater intrusion occurred in summer 315
and fall concurrent with our observation of TAlk removal during June through early December 316
2009 (Appendix Fig. S3 and Fig. 8). The pH-salinity relationship for November 2009, which 317
showed a reduction of up to 1 pH unit across the mixing zone, also supports our observation (Fig. 318
10). Conversely, pH was largely conservative through the mid salinity mixing zone in June 2010, 319
consistent with the observed conservative distributions of both TAlk and DIC.
320
Of the entire time-series dataset (PZ3 and PZ5; Figs. 8 and 9), the maximum observed TAlk 321
depletion was 780 µmol kg-1 at 0.5 m in PZ3 (salinity 12.0, Fig. 8a, May-2010) and 723 µmol kg-1 322
at 0.9 m in PZ5 (salinity 20.4, Fig. 9b, November-2009), which would require a corresponding 323
proton addition of 780 and 723 µmol kg-1
, with the actual H+ increase determined by the carbonate 324
chemistry and hence buffering capacity. Based on the reaction formulas (Burdige 2006): 325
Fe2+ + 0.25O2 + 2.5H2O → Fe(OH)3+ 2H+ (1) 326
Mn2+ + 0.5O2 + H2O → MnO2+ 2H+ (2) 327
where Fe2+
:H+ and Mn
2+:H
+ equal 1:2, the total amount of reduced Fe and Mn should be ~390 and 328
361 µmol kg-1
assuming that these redox processes are the sole source of acidity driving the TAlk 329
decrease. Manganese concentrations reached a maximum of only ~4 µmol kg-1
in the terrestrial 330
groundwater, while peak dissolved iron concentrations were well in excess of 400 µmol kg-1
. Ele-331
vated ferrous iron in terrestrial groundwater was also observed in prior studies (Charette and 332
Sholkovitz, 2006), therefore, a sufficient level of reduced Fe exists to support the proton produc-333
tion needed to balance the TAlk consumption in this shallow zone. Further, this level of Fe2+
oxi-334

dation would have consumed 97 and 90 µmol kg-1
of DO, well within the amount available within 335
the TAlk depletion zone (up to 225 µmol L-1). 336
While Fe-associated redox reactions can largely explain the observed changes in TAlk, other 337
contributing reactions cannot be entirely ruled out. For example, a slight addition of dissolved Ca 338
in the mixing zone hints that calcium carbonate dissolution may play a small role (Appendix Fig. 339
S1). Also, nitrification could serve to reduce TAlk with no effect on DIC. For the large TAlk deple-340
tion at PZ5 (0.9 m), low nitrate (0.6 µmol L-1
) and elevated ammonia (19.5 µmol L-1
) preclude a 341
significant contribution from nitrification. However, this process may have contributed slightly to 342
the TAlk removal in PZ3 at 2.5m (Fig. 4), though this is well above the zone of significant TAlk 343
removal (3.5 m, Fig. 8). The “iron curtain” is within this depth range (Gonneea et al., 2008), sug-344
gesting that Fe2+
oxidation is likely the major controlling factor even at 3.5 m. We note, however, 345
that these estimates of STE TAlk removal depend on the choice in TAlk endmembers. If slightly 346
shallower terrestrial groundwater with higher TAlk were used, then these calculated values would 347
represent lower limit estimates. 348
4.1.2. Processes driving DIC and TAlk concentrations at high salinity 349
In June 2010, non-conservative addition of DIC and TAlk was observed in the high salinity 350
groundwater that was characterized by elevated ammonia, phosphate, and dissolved Mn (Fig. 11). 351
Because changes in DIC relative to TAlk would be differentially modified by various organic car-352
bon decomposition reactions (Table 2), changes in their ratio can be combined with changes in the 353
products of organic matter decomposition (e.g. NH4, Mn, and Fe) to quantify the relative im-354
portance of the geochemical processes occurring within this zone of the STE (Froelich et al., 1979; 355
Bender and Heggie, 1984; Cai et al., 2003). During our study, we did not measure SO42-, H2S or 356
CH4 though previous studies indicated that SO42- is conservative and H2S has never been detected 357
(Gonneea and Charette, 2014). We therefore only considered aerobic respiration, denitrification, 358
manganese reduction, and iron reduction as potential driving mechanisms for the observed TAlk 359
and DIC distributions in the high salinity zone (Table 2). Further, Ca2+
data measured in 2004 for 360
these same piezometer locations (Appendix Fig. S1) indicate conservative mixing through the high 361
salinity region. Hence, we also assume that no calcium carbonate precipitation/dissolution oc-362
curred in this zone. The details of this approach are presented in Appendix. 363
In June 2010, both excess TAlk and DIC were observed in the high salinity region (Figs. 12b, 364

c, and 13); these excesses at 2.4-6.1 m of PZ5 and deep in PZ3 (4.0-5.5 m, Fig. 12) are within the 365
range of reactions from aerobic respiration to iron reduction, but are closest to aerobic respiration 366
and denitrification (Fig. 13). Our calculations suggest that aerobic respiration was responsible for 367
24-100% (average 55±19%; Fig. 12d) of the organic carbon remineralization, while denitrification 368
was in the range of 0-79% (average 42±18%; Fig. 12e). Both Mn and Fe reduction were much 369
smaller (Mn reduction; 0-11%, average 3±3%; Fe reduction; 0-1%, average 0.1±0%; Fig. 12f). If 370
we assume that bay water in the STE recharge zone had an initial O2 concentration of 240-448 371
µmol L-1
(the range in our surface water measurements) and the STE O2 in the high salinity zone 372
was in the range of 52-136 µmol L-1, then the oxygen utilization should be 188-312 µmol L-1, 373
which is within the range of our modeled DO consumption (40-457 µmol L-1). Therefore, aerobic 374
respiration and denitrification are the dominant reactions behind organic matter oxidation at high 375
salinity in June. In addition, aside from denitrification, elevated NH4+ might result from ammonifi-376
cation within the organic carbon rich sediments of the outer bay (Gonneea and Charette, 2014) 377
where saline groundwater recharge originates (Michael et al., 2005). However, previous work sug-378
gests that denitrification does occur within this high salinity zone (Korner and Zumft, 1989). 379
The ∆TAlk and ∆DIC distributions for November 2009 at high salinity are more complex. 380
While TAlk and DIC additions were observed at the base of PZ3 (4.3 to 5.5 m) and PZ5 (4.9 to 6.1 381
m), above these depths there was DIC addition in the presence of TAlk depletion (Fig. 9b and c). 382
Restricting our model calculations to these greater depths, we obtained an aerobic respiration frac-383
tion of 27-93% (average 67±26%), a denitrification fraction of 1 to 70% (average 31±26%), Mn 384
reduction from 0 to 4% (average 1±2%), and Fe reduction of 0 to 5% (average 1±2%). Similar to 385
June 2010, the modeled DO consumption (181-441 µmol L-1) is within the range of the observed 386
DO loss (48-430 µmol L-1). In general, the high salinity zone in PZ5 is predominately controlled 387
by aerobic oxidation both in Nov. 2009 and Jun. 2010 (Figs. 9 and 12). 388
Since our approach is based on net changes in water chemistry, it should be noted that anaer-389
obic decomposition processes and subsequent re-oxidation of the reduced compounds could be 390
interpreted in our model as being due to aerobic decomposition. Potential evidence for this is the 391
negative ∆TAlk/∆DIC ratios (-3.1 to -29.3) observed for November 2009 at PZ3 from 3.4 to 3.6 m 392
and PZ5 from 1.5 to 4.2 m (Fig. 9a). These ratios are beyond those predicted for various OM de-393

composition processes (-0.2 to 8, for aerobic respiration to iron reduction, Fig. 13). These could 394
include oxidation of Fe2+ and Mn2+ (Fig. 13), which are believed to be responsible for the large 395
TAlk sink in the mid salinity zone. Other possibilities include Mn2+ mediated-oxidation of ammo-396
nia as suggested by Kroeger and Charette (2008) for this same STE. 397
4.2. Seasonal variability of SGD-derived TAlk and DIC fluxes to surface water 398
To assess seasonal variability of SGD-associated TAlk and DIC fluxes into the bay, we com-399
bined a previously published hydrological flow model for the Waquoit Bay STE (Gonneea et al., 400
2013a, b) with our time-series TAlk and DIC concentrations. The model simulated SGD flux was 401
derived from a two-dimensional cross sectional groundwater flow and salt transport model 402
(SEAWAT) (Mulligan et al., 2011). The model was bounded by an upland margin (CCC1 in Fig.1) 403
and extended 125 m seaward of CCC1. Since the groundwater head at CCC1 was not measured 404
during our sampling period, we used the average SGD water flux for summer and winter (2005-405
2007) from Gonneea and Charette (2014). As with Gonneea et al. (2013a, b), we divided SGD into 406
five salinity groups: 0-5, 5-10, 10-15, 15-20, and >20. Groundwater-derived TAlk and DIC fluxes 407
were then calculated by multiplying the average groundwater TAlk and DIC concentrations by the 408
water flux for the same salinity grouping (Table 3). The same approach was utilized to estimate 409
fluxes of aqueous CO2 and H+ discharged into the bay from groundwater (Table 3). Since the 410
simulated groundwater flux was from 2005 to 2007, while our carbonate system parameters were 411
sampled during 2009-2010, we limit our discussion to assessing the dominant controlling factors 412
for seasonal variability in SGD-derived carbonate system fluxes from a typical unconfined coastal 413
aquifer. 414
Gonneea et al. (2013a) found that the fresh groundwater flux (salinity from 0 to 5) was rela-415
tively constant between summer and winter (2.2±0.6 vs. 3.2±0.4 m3 m-1 day-1; Table 3). They also 416
showed that landward movement of the mixing zone in summer was due to the relatively low hy-417
draulic gradient compared with winter (Fig. 3). As such, the saline groundwater flux was ca. 5 418
times greater in summer than winter (3.9±1.3 vs. 0.8±0.2 m3 m
-1 day
-1). This contrast is largely 419
responsible for the ~50% higher estimated SGD-derived net DIC and aqueous CO2 fluxes to the 420
bay in summer (3.8±2.5 vs. 2.7±0.4 mol m-1
day-1
for DIC flux, 2.5±0.6 vs. 1.7±0.2 mol m-1
day-1
421
for aqueous CO2 flux, Table 3). The estimated SGD-associated H+ flux followed the same trend 422
(9.4±2.5 vs. 6.7±1.1 mmol m-1 day-1, Table 3). Hence, SGD could be an important contributor to 423

coastal ocean acidification in addition to other factors that are driving ocean pH lower. 424
Despite the 5x higher marine SGD flux in summer, the net bay water SGD-TAlk flux was 425
comparable between the two seasons (0.9±2.3 vs. 0.9±0.3 mol m-1 day-1, Table 3), a result of low 426
summertime STE TAlk concentrations. Here the multi-salinity zone model we employed was cru-427
cial: because of the strong mixing zone gradient in TAlk, an approach that divided SGD water 428
fluxes into just two components (fresh and marine groundwater), would have resulted in a signifi-429
cant overestimate in the SGD-TAlk flux (nearly 5x for the summer period). 430
Regardless of season, the SGD-derived DIC flux is always greater than TAlk flux, indicating 431
that SGD would serve to increase the surface water DIC/TAlk ratio. In general, our bay water DIC 432
concentrations were lower than TAlk (Appendix Table S1). Since the CO2 buffering capacity of 433
seawater is weakened as the DIC/TAlk ratio approaches 1 (Egleston et al., 2010), our results for 434
this system indicate that SGD serves to reduce the CO2 buffering capacity of surface water, which 435
is consistent with other recent studies suggesting that this may be a common effect of SGD on the 436
global carbon cycle (Liu et al., 2014; Sadat-Noori et al., 2016; Wang et al., 2015). 437
4.3. Potential SGD effects on the surface water CO2 system on annual time scales 438
To examine the net annual effect of SGD on the coastal ocean carbon cycle, we compared the 439
yearly inputs and outputs of DIC and TAlk to the Waquoit Bay STE. The input terms include ter-440
restrial groundwater and the bay water that enters the STE as marine groundwater recharge, while 441
the output is the groundwater discharged into the bay. Using the model average water flux for 442
2005, the DIC output was greater than the combined inputs which translated into a net STE DIC 443
production rate of 420 mol m-1
yr-1
, which is ~19 % of the DIC flux to the bay via groundwater 444
discharge (Table 4). This is consistent with the DIC excess that was observed in groundwater dur-445
ing almost all seasons. In contrast, the TAlk input was roughly equivalent to the output (5% differ-446
ence, Table 4), suggesting that TAlk removal in the mid salinity zone was offset by TAlk produc-447
tion at high salinity on an annual basis. We would reach the same conclusions if we used the mod-448
eled mean water fluxes for 2006. 449
In Waquoit Bay, mixing zone dynamics appear to be largely controlled by seasonal variations 450
in mean sea level. Gonneea et al. (2013a) noted that the period of our study was characterized by a 451
positive sea level anomaly driven by regional climate oscillations. Their model results indicate that 452
such an anomaly would result in enhanced STE mixing and marine groundwater re-453

charge/discharge in summer. Such an enhancement would serve to increase the DIC flux via en-454
hanced groundwater flux and organic matter oxidation. Further, since nutrients are regenerated in 455
this process, they might serve to reduce the net effect of the SGD-delivered DIC flux through bio-456
logical uptake in surface waters. However, these two processes may not perfectly offset each other 457
as some nitrogen is removed in the high salinity zone of the STE (Kroeger and Charette, 2008), 458
and phosphate may be retained in the subsurface through sorption to Fe oxides (Charette and 459
Sholkovitz, 2002, 2006; Kroeger and Charette, 2008). Therefore, seasonal oscillations in MSL 460
may still result in a net DIC flux to surface water by SGD. 461
We estimated that TAlk removal was offset by TAlk excess in the STE on an annual basis in a 462
“normal” year (2005-2007). However, our data suggest that net STE TAlk removal could occur in 463
association with positive sea level anomaly as was observed from 2009-2010. In this scenario, the 464
SGD-derived DIC flux would be even greater than the SGD-TAlk flux, resulting in (1) enhanced 465
surface water aqueous CO2 inputs thereby enhancing air-sea exchange and reducing the seawater 466
buffering capacity and (2) enhanced proton fluxes that would exacerbate coastal ocean acidifica-467
tion. Our results highlight the need for in-depth studies on estuarine acidification in systems like 468
Waquoit Bay, where organisms including many commercially valuable shellfish may already be 469
experiencing carbonate chemistry conditions at least as severe as those predicted for the open 470
ocean by the end of the 21th century (Doney et al., 2009). 471
472
5. Conclusions 473
This study demonstrates the complexity of the inorganic carbon cycle in subterranean estuar-474
ies due to time-varying hydrologic and biogeochemical processes. Our main conclusions are as 475
follows: 476
(1) The major component of DIC in the terrestrial groundwater was aqueous CO2 (83% of 477
DIC); the entire STE had one to two orders of magnitude higher pCO2 levels relative to 478
atmospheric CO2. The STE had lower pH relative to surface water and it was 479
undersaturated with respect to calcite and aragonite during all seasons. 480
(2) DIC concentrations in brackish groundwater (salinity 0-20) were lower than in surface wa-481
ter. DIC was slightly consumed at low and mid salinities while there was an apparent DIC 482
source at high salinity (> 20) in all seasons. In November 2009 (fall) and June 2010 483

(summer), TAlk and DIC addition occurred in high salinity groundwater. Stoichiometric 484
calculations suggest that these additions were mainly driven by aerobic oxidation and 485
denitrification. 486
(3) Within brackish groundwater during summer and fall, TAlk generally decreased due to 487
proton production from Fe2+
oxidation reactions, in part due to nitrification; TAlk largely 488
displayed conservative mixing in other seasons. Hence, oscillations in the location of the 489
mixing zone, which is also a redox/pH boundary, are driving Fe-based oxidation-reduction 490
cycles that in turn are driving the STE TAlk distribution. 491
(4) The net SGD-derived DIC flux to the bay exceeded the TAlk flux by a factor of ~3-5; the 492
former was ~50% higher in the summer vs. winter while the latter was constant year-round. 493
The lower TAlk flux was due to lower TAlk vs. DIC concentrations in the STE. The mag-494
nitude of the groundwater flux controlled SGD-DIC flux, while, depending on the season, 495
groundwater flux and TAlk concentration were co-drivers of the SGD-TAlk flux. 496
(5) On an annual cycle, the subterranean estuary was a net producer of DIC while the TAlk 497
cycle was in balance, i.e. consumption and production of TAlk was offset in the mid and 498
high salinity zones, respectively. 499
Future studies aimed at quantifying SGD-carbonate chemistry fluxes should take into ac-500
count potential non-conservative processes in the STE as well as seasonal variability. In particular, 501
our finding of significant TAlk removal (H+ addition) during high seawater intrusion periods im-502
plies that SGD’s role in the carbon cycle for receiving water bodies may increase during seasonal 503
periods of high sea level. In Waquoit Bay and the greater northeastern U.S., Gonneea et al. (2013) 504
postulated that sea level is a major controlling factor for SGD; recent studies support this idea for 505
other areas of the world’s coastline (Lee et al., 2013; Wood and Harrington, 2015). Enhanced sea-506
sonal or annual variability in sea level due to climate oscillations like the El Nino-Southern Oscil-507
lation (ENSO) and North Atlantic Oscillation (NAO) could disrupt the year to year balance in net 508
inorganic C fluxes from the STE, which may lead to further enhancements in the DIC and aqueous 509
CO2 discharge from groundwater and the associated impacts on seawater’s CO2 buffering capacity. 510
511
512
513

514
515
Acknowledgements 516
The research was financially supported by the National Science Foundation Chemical Oceanogra-517
phy program (OCE- 0425061 and OCE-0751525 to M.C.) and a China Scholarship Council to Q.L. 518
We thank Dr. Weijun Cai and Dr. Christophe Rabouille for their thoughtful comments on early ver-519
sions of the manuscript. We are also grateful to Dr. Meagan Eagle Gonneea for helpful suggestions 520
related to the groundwater flux model and to Dr. Caroline Slomp for the calcium measurements. 521
We would also like to acknowledge three anonymous reviewers for their critical and constructive 522
comments, which resulted in substantial improvements to the manuscript. 523
524
References 525
Bender M.L. and Heggie D.T. (1984) Fate of organic carbon reaching the deep sea floor: a status 526
report. Geochim. Cosmochim. Acta 48, 977-986. 527
528
Burdige, D.J. (2006) Geochemistry of Marine Sediments. Princeton University Press, Princeton, 529
NJ. 530
531
Cai W.-J., Wang Y., Krest J. and Moore W.S. (2003) The geochemistry of dissolved inorganic 532
carbon in a surficial groundwater aquifer in North Inlet, South Carolina, and the carbon fluxes to 533
the coastal ocean. Geochim. Cosmochim. Acta 67, 631-639. 534
535
Cambareri T.C. and Eichner E.M. (1998) Watershed Delineation and Ground Water Discharge to a 536
Coastal Embayment. Ground Water 36, 626-634. 537
538
Charette M. A., and Allen M. C. (2006) Precision groundwater sampling in coastal aquifers using 539
a direct push shielded screen well-point system. Ground Water Monit. Remed. 26, 87-93. 540
541
Charette M.A. and Sholkovitz E.R. (2002) Oxidative precipitation of groundwater-derived ferrous 542
iron in the subterranean estuary of a coastal bay. Geophys. Res. Lett. 29, 543
doi:10.1029/2001GL014512. 544
545
Charette M.A. and Sholkovitz E.R. (2006) Trace element cycling in a subterranean estuary: Part 2. 546
Geochemistry of the pore water. Geochim. Cosmochim. Acta 70, 811-826. 547
548
Charette M.A., Buesseler K.O. and Andrews J.E. (2001) Utility of radium isotopes for evaluating 549
the input and transport of groundwater-derived nitrogen to a Cape Cod estuary. Limnol. Oceanogr. 550
46, 465-470. 551

552
Charette M.A., Sholkovitz E.R. and Hansel C.M. (2005) Trace element cycling in a subterranean 553
estuary: Part 1. Geochemistry of the permeable sediments. Geochim. Cosmochim. Acta 69, 2095-554
2109. 555
556
Cyronak T., Santos I.R., Erler D.V., Maher D.T. and Eyre B.D. (2014) Drivers of pCO2 variability 557
in two contrasting coral reef lagoons: The influence of submarine groundwater discharge. Global 558
Biogeochem. Cy. 28, 398-414. 559
560
de Weys J., Santos I.R. and Eyre B.D. (2011) Linking groundwater discharge to severe estuarine 561
acidification during a flood in a modified wetland. Environ. Sci. Technol. 45, 3310-3316. 562
563
Dickson, A.G. (1981) An exact definition of total alkalinity and a procedure for the estima-564
tion of alkalinity and total inorganic carbon from titration data. Deep-Sea Res. 28A: 609-623. 565
Dickson A. G. (1990) Standard potential of the reaction AgCl(S)+1/2H2(G)5Ag(S)+HCl(Aq), and 566
the standard acidity constant of the ion HSO4- in synthetic sea water from 273.15K to 318.15K. J. 567
Chem. Thermodyn. 22, 113-127. 568
569
Doney S.C., Fabry V.J., Feely R.A. and Kleypas J.A. (2009) Ocean acidification: the other CO2 570
problem. Annu. Rev. Mar. Sci. 1, 169-192. 571
572
Dorsett A., Cherrier J., Martin J.B. and Cable J.E. (2011) Assessing hydrologic and biogeochemi-573
cal controls on pore-water dissolved inorganic carbon cycling in a subterranean estuary: A 14C and 574 13C mass balance approach. Mar. Chem. 127, 76-89. 575
576
Egleston E.S., Sabine C.L. and Morel F.M.M. (2010) Revelle revisited: Buffer factors that quanti-577
fy the response of ocean chemistry to changes in DIC and alkalinity. Global Biogeochem. Cy. 24, 578
GB1002, doi:1010.1029/2008GB003407. 579
580
Froelich P.N., Klinkhammer G.P., Bender M.L., Luedtke N.A., Heath G.R., Cullen D., Dauphin 581
P., Hammond D., Hartman B. and Maynard V. (1979) Early oxidationof organic matter in pelagic 582
sediments of the eastern equatorial Atlantic:suboxic diagenesis. Geochim. Cosmochim. Acta 43, 583
1075-1090. 584
585
Gonneea M.E. and Charette M.A. (2014) Hydrologic controls on nutrient cycling in an unconfined 586
coastal aquifer. Environ. Sci. Technol. 48, 14178-14185. 587
588
Gonneea M.E. Morris P.J. Dulaiova H. and Charette M.A. (2008) New perspectives on radium be-589
havior within a subterranean estuary. Mar. Chem. 109, 250-267. 590
591
Gonneea M.E., Mulligan A.E. and Charette M.A. (2013a) Climate-driven sea level anomalies 592
modulate coastal groundwater dynamics and discharge. Geophys. Res. Lett. 40, 2701-2706. 593
594

Gonneea M.E., Mulligan A.E. and Charette M.A. (2013b) Seasonal cycles in radium and barium 595
within a subterranean estuary: Implication for groundwater derived chemical fluxes to surface wa-596
ters. Geophys. Res. Lett. 119, 164-177. 597
598
Korner H. and Zumft W.G. (1989) Expression of denitrification enzymes in response to the dis-599
solved oxygen level and respiratory substrate in continuous culture of Pseudomonas stutzeri. Appl. 600
Environ. Microbiol. 55, 1670-1676. 601
602
Kroeger K.D. and Charette M.A. (2008) Nitrogen biogeochemistry of submarine groundwater dis-603
charge. Limnol. Oceanogr. 53, 1025-1039. 604
605
Lee, E., Hyun, Y. and Lee, K.-K. (2013) Sea level periodic change and its impact on submarine 606
groundwater discharge rate in coastal aquifer. Estuar. Coast. Shelf Sci. 121-122, 51-60. 607
608
Lee J. and Kim G. (2015a) Dependence of coastal water pH increases on submarine groundwater 609
discharge off a volcanic island. Estuar. Coast. Shelf Sci. 163, Part B, 15-21. 610
611
Lee J. and Kim G. (2015b) Dependence of pH in coastal waters on the adsorption of protons onto 612
sediment minerals. Limnol. Oceanogr. 60, 831-839. 613
614
Lewis E. and Wallace D. W. R. (1998) Program developed for CO2 system calculations. 615
ORNL/CDLAC-105. Carbon Dioxide Information Analysis Center, Oak Ridge National Laborato-616
ry, TN. 617
618
Liu Q., Charette M.A., Henderson P.B., McCorkle D.C., Martin W. and Dai M. (2014) Effect of 619
submarine groundwater discharge on the coastal ocean inorganic carbon cycle. Limnol. Oceanogr. 620
59, 1529-1554. 621
622
Liu Q., Dai M., Chen W., Huh C.A., Wang G., Li Q. and Charette M.A. (2012) How significant is 623
submarine groundwater discharge and its associated dissolved inorganic carbon in a river-624
dominated shelf system? Biogeosciences 9, 1777-1795. 625
626
Maher D.T., Santos I.R., Golsby-Smith L., Gleeson J. and Eyre B.D. (2013) Groundwater-derived 627
dissolved inorganic and organic carbon exports from a mangrove tidal creek: The missing man-628
grove carbon sink? Limnol. Oceanogr. 58, 475-488. 629
630
Michael H.A., Mulligan A.E. and Harvey C.F. (2005) Seasonal oscillations in water exchange be-631
tween aquifers and the coastal ocean. Nature 436, 1145-1148. 632
633
Millero F. J. (2005) Chemical oceanography. CRC Press. 634
635
Millero F.J., Graham T.B., Huang F., Bustos-Serrano H. and Pierrot D. (2006) Dissociation con-636
stants of carbonic acid in seawater as a function of salinity and temperature. Mar. Chem. 100, 80-637
94. 638

639
Moore W.S. (1999) The subterranean estuary-A reaction zone of ground water and seawater. Mar. 640
Chem. 65, 111-125. 641
642
Moore W.S. (2010) The effect of submarine groundwater discharge on the Ocean. Annu. Rev. Mar. 643
Sci. 2, 59-88. 644
645
Moore W.S., Beck M., Riedel T., Rutgers van der Loeff M., Dellwig O., Shaw T.J., Schnetger B. 646
and Brumsack H.J. (2011) Radium-based pore water fluxes of silica, alkalinity, manganese, DOC, 647
and uranium: A decade of studies in the German Wadden Sea. Geochim. Cosmochim. Acta 75, 648
6535-6555. 649
650
Mucci A. (1983) The solubility of calcite and aragonite in seawater at various salinities, tempera-651
tures, and one atmosphere total pressure. Am. J. Sci. 283, 780-799. 652
653
Mulligan A.E. and Charette M.A. (2006) Intercomparison of submarine groundwater discharge 654
estimates from a sandy unconfined aquifer. J. Hydrol. 327, 411-425. 655
656
Mulligan A.E., Langevin C. and Post V.E.A. (2011) Tidal Boundary Conditions in SEAWAT. 657
Ground Water 49, 866-879. 658
659
Reckhardt A., Beck M., Seidel M., Riedel T., Wehrmann A., Bartholomä A., Schnetger B., 660
Dittmar T. and Brumsack H.-J. (2015) Carbon, nutrient and trace metal cycling in sandy sedi-661
ments: A comparison of high-energy beaches and backbarrier tidal flats. Estuar. Coast. Shelf Sci. 662
159, 1-14. 663
664
Rogers D.R. (2010) Geomicrobiology of nitrogen in a coastal aquifer: isotopic and molecular 665
methods to examine nitrification and denitrification in groundwater. Ph. D. thesis. Massachusetts 666
Institute of Technology and Woods Hole Oceanographic Institution. 667
668
Rouxel O., Sholkovitz E., Charette M. and Edwards K.J. (2008) Iron isotope fractionation in sub-669
terranean estuaries. Geochim. Cosmochim. Acta 72, 3413-3430. 670
671
Sadat-Noori M., Maher D. T. and Santos I. R. (2015) Groundwater Discharge as a Source of Dis-672
solved Carbon and Greenhouse Gases in a Subtropical Estuary. Estuaries Coasts 69, 639-656, 673
doi:10.1007/s12237-015-0042-4. 674
675
Santos I.R., Glud R.N., Maher D., Erler D. and Eyre B.D. (2011) Diel coral reef acidification driv-676
en by porewater advection in permeable carbonate sands, Heron Island, Great Barrier Reef. 677
Geophys. Res. Lett. 38, L03604, doi:10.1029/2010GL046053. 678
679
Santos I.R., Maher D.T. and Eyre B.D. (2012) Coupling Automated Radon and Carbon Dioxide 680
Measurements in Coastal Waters. Environ. Sci. Technol. 46, 7685-7691. 681
682

Spiteri C., Regnier P., Slomp C.P. and Charette M.A. (2006) pH-Dependent iron oxide precipita-683
tion in a subterranean estuary. J. Geochem. Explor. 88, 399-403. 684
685
Spiteri C., Slomp C.P., Charette M.A., Tuncay K. and Meile C. (2008) Flow and nutrient dynam-686
ics in a subterranean estuary (Waquoit Bay, MA, USA): Field data and reactive transport model-687
ing. Geochim. Cosmochim. Acta 72, 3398-3412. 688
Walter D.A. and Whealan A.T. (2005) Simulated water sources and effect of pumping on surface 689
and ground-water, Sagamore and Monomoy flow lenses, Cape Cod, Massachusetts. US Geological 690
Survey Scientific Investigations Report 2004-5181. US Geological Survey, Marlborough, MA, 691
USA. 692
Wang G., Jing W., Wang S., Xu Y., Wang Z., Zhang Z., Li Q. and Dai M. (2014) Coastal acidifi-693
cation induced by tidal-driven submarine groundwater discharge in a coastal coral reef system. 694
Environ. Sci. Technol. 48, 13069-13075. 695
696
Wang G., Wang Z., Zhai W., Moore W.S., Li Q., Yan X., Qi D. and Jiang Y. (2015) Net subterra-697
nean estuarine export fluxes of dissolved inorganic C, N, P, Si, and total alkalinity into the Jiulong 698
River estuary, China. Geochim. Cosmochim. Acta 149, 103-114. 699
700
Weiss R. F. (1974) Carbon dioxide in water and seawater: The solubility of a non-ideal gas. Mar. 701
Chem. 2, 203-215. 702
703
Wood, C. and Harrington, G.A. (2015) Influence of seasonal variations in sea level on the salinity 704
regime of a coastal groundwater-Fed Wetland. Groundwater 53, 90-98. 705
706
Yang L., Chen C.-T. A., Hong H., Chang Y.-C., Lui H.-K. (2015) Mixing behavior and bioavaila-707
bility of dissolved organic matter in two contrasting subterranean estuaries as revealed by fluores-708
cence spectroscopy and parallel factor analysis. Estuar. Coast. Shelf Sci. 166, 161-169. 709
710
711
712
713
714
715
716
717
718
719
720
721
722
723
724
725

Figure Captions 726
Fig. 1. Map of Waquoit Bay off Cap Cod in Massachusetts with a schematic figure showing the 727
sampling stations in the surface bay water and subterranean estuary. The STZ is the salinity transi-728
tion zone where mixing between terrestrial groundwater and marine groundwater occurs. Monthly 729
sampling was conducted from May 2009 to June 2010 both in the surface water and groundwater 730
at PZ3, which is a series of nested, fixed-depth wells installed at 10 depths ranging from 0.5-5.5 m 731
centered on the STZ of subterranean estuary. In addition, we sampled two more piezometer wells 732
at PZ10 (inland, 13.5 m away from PZ3 at depths ranging from 0.9 to 5.5 m) and PZ5 (seaward, 3 733
m away from PZ3, at depths ranging from 0.3 to 6.1 m) in November 2009 and June 2010. 734
735
Fig. 2. Monthly mean sea level (MSL) anomaly from Woods Hole tidal gauge (NOAA, 736
#8447930). The shaded region indicates our sampling period from May 2009 to June 2010. 737
738
Fig. 3. Time-series measurements of pore water salinity at PZ3 from May 2009 to June 2010. The 739
x-axis indicates time and the y-axis indicates depth below the beach surface (m). 740
741
Fig. 4. Time-series contours of pore water chemistry for (a) dissolved oxygen (DO), (b) total dis-742
solved Mn, (c) total dissolved Fe, (d) nitrate and nitrite (NO3-+NO2
-), (e) ammonium (NH4
+), and 743
(f) phosphate (PO43-
) at PZ3 from May 2009 to June 2010. The dashed line represents salinity con-744
tour line of 1.The x-axis indicates time and the y-axis indicates depth below the surface. 745
746
Fig. 5. Time-series contours of pore water chemistry for (a) TAlk, (b) DIC, (c) pCO2 (in situ tem-747
perature), (d) pH (total scale, in situ temperature ), and (e) calcite saturation index at PZ3 from 748
May 2009 to June 2010. The dashed line represents salinity contour line of 1. The x-axis indicates 749
time and the y-axis indicates depth below the surface. 750
751
Fig. 6. Depth profiles showing (a) salinity, oxidation reduction potential (ORP), pH, (b) TAlk, 752
DIC, (c) dissolved Mn, Fe, (d) nitrate, ammonium, and phosphate for the inland well (PZ10) sam-753
pled in November 2009. The general overlap in the distribution of elevated TAlk, DIC, Fe, Mn, 754
and ammonia at 2-4 m with low ORP and high pH is indicated by the gray shading. 755

756
Fig. 7. Plots showing TAlk versus salinity (a, c), and DIC versus salinity (b, d) in the Waquoit Bay 757
subterranean estuary during November 2009 and June 2010 in piezometer wells PZ10, PZ3, and 758
PZ5. TAlk and DIC for terrestrial groundwater in Nov are also shown as inset graphs with an ex-759
panded salinity scale (0-0.5). The solid lines represent the conservative mixing lines for TAlk and 760
DIC in deep STE, which was used to quantify the variations of the carbonate system in high salini-761
ty zone. 762
763
Fig. 8. Time-series contours of pore water chemistry for (a) ∆TAlk and (b) ∆DIC (∆ means the 764
difference between the calculated conservative mixing and the measured value) at PZ3 from May 765
2009 to June 2010. Dashed lines are the salinity contour lines of 1, 5 and 20. The x-axis indicates 766
time and the y-axis indicates depth below the surface. 767
768
Fig. 9. Distributions of (a) salinity, (b) ∆TAlk, (c) ∆DIC, fraction of (d) aerobic oxidation, (e) 769
denitrification, and (f) Mn & Fe reduction in the piezometer wells sampled in November 2009. 770
Triangle shows the site of terrestrial groundwater endmember. In panel (a), triangles show the sites 771
of terrestrial groundwater endmember, rectangles denote areas of high salinity (>20) but with neg-772
ative ∆TAlk/∆DIC ratios, which are beyond those predicted for various OM degradation reactions. 773
The box in panel (b) represents area with maximum negative ∆TAlk. 774
775
Fig. 10. The pH versus salinity within subterranean estuary samples collected in November 2009 776
and June 2010 from piezometer wells PZ10, PZ3, and PZ5. The conservative mixing lines for pH 777
were calculated as follows: conservative mixing concentrations for TAlk and DIC were estimated 778
as a function of salinity using the terrestrial groundwater and bay water endmembers from Table 1. 779
These data were entered in CO2SYS, which was used to obtain the corresponding mixing-derived 780
pH. The observed pH in Nov. 2009 from intermediate and high salinity are much lower than the 781
predicted values based on conservative mixing. In Jun. 2010, the observed pH is nearly consistent 782
with the theoretical mixing line at mid salinity (1-20), but is slightly smaller than the calculated 783
conservative pH value at high salinity (>20). 784
785

Fig. 11. Relationship between (a) ammonia, (b) phosphate, (c) dissolved Mn, (d) dissolved Fe and 786
salinity for PZ10, PZ3, and PZ5 wells sampled in November 2009 and June 2010. 787
788
Fig. 12. Distributions of (a) salinity, (b) ∆TAlk, (c) ∆DIC, fraction of (d) aerobic oxidation, (e) 789
denitrification, and (f) Mn & Fe reduction in the piezometer wells sampled in June 2010. The tri-790
angles mark the locations used in generating the terrestrial groundwater endmember. 791
792
Fig. 13. The ∆TAlk versus ∆DIC within subterranean estuary in mid salinity (1-20) and high salin-793
ity (>20) zone samples collected in November 2009 and June 2010 from piezometer wells PZ3 and 794
PZ5. The arrows indicate how ∆TAlk and ∆DIC will change in response to different biogeochemi-795
cal processes including aerobic respiration, denitrification, manganese reduction, iron reduction, 796
Fe2+
or Mn2+
oxidation, and CaCO3 production/dissolution. Numbers inside parentheses represent 797
stoichiometric ratios of changes in TAlk and DIC per mole organic matter degradation. The de-798
tailed biogeochemical reactions are presented in Table 2. 799
800
801
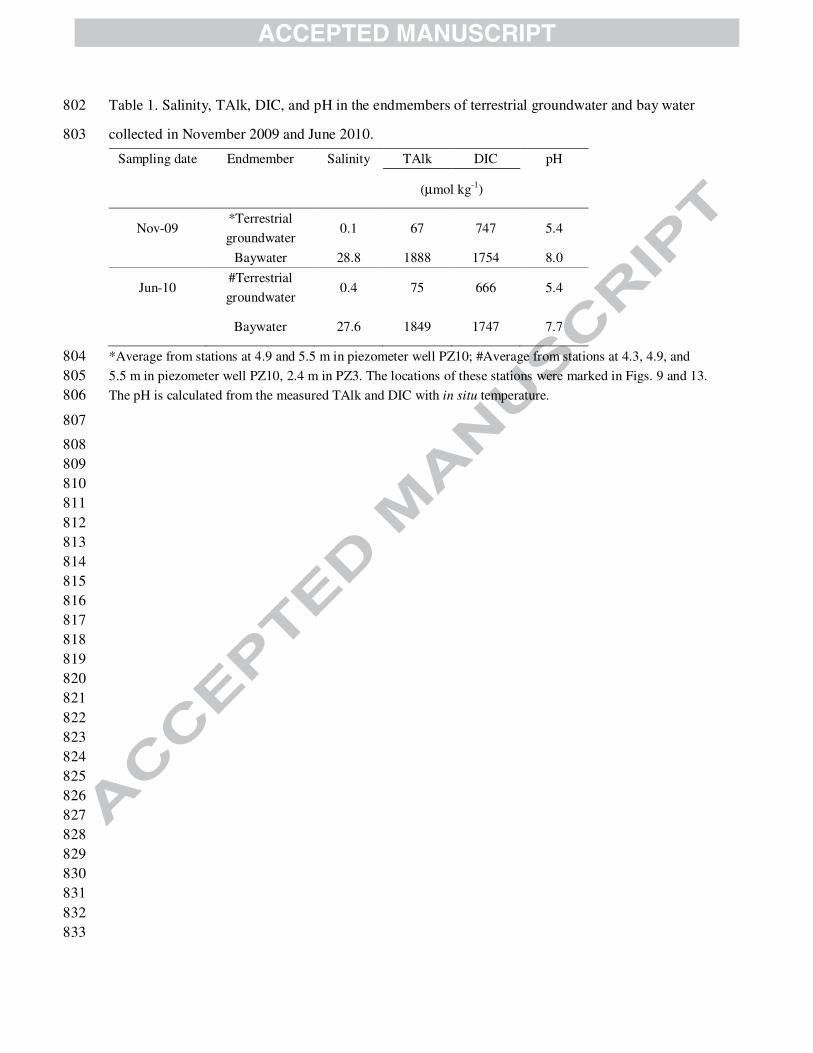
Table 1. Salinity, TAlk, DIC, and pH in the endmembers of terrestrial groundwater and bay water 802
collected in November 2009 and June 2010. 803
Sampling date Endmember Salinity TAlk DIC pH
(µmol kg-1
)
Nov-09 *Terrestrial
groundwater 0.1 67 747 5.4
Baywater 28.8 1888 1754 8.0
Jun-10 #Terrestrial
groundwater 0.4 75 666 5.4
Baywater 27.6 1849 1747 7.7
*Average from stations at 4.9 and 5.5 m in piezometer well PZ10; #Average from stations at 4.3, 4.9, and 804
5.5 m in piezometer well PZ10, 2.4 m in PZ3. The locations of these stations were marked in Figs. 9 and 13. 805
The pH is calculated from the measured TAlk and DIC with in situ temperature. 806
807
808
809
810
811
812
813
814
815
816
817
818
819
820
821
822
823
824
825
826
827
828
829
830
831
832
833

Table 2. Organic matter degradation reactions (Froelichetal., 1979; Bender and Heggie, 1984; Cai 834
et al., 2003) 835
836
Process Geochemical reactions
Aerobic respiration OM+138O2 → 106CO2+16HNO3+H3PO4+122H2O (1)
Denitrification OM+0.8×10⁶NO3
-+0.8×10⁶H
+ →
106CO2+0.4×10⁶N2+16NH3+H3PO4+1.4×10⁶H2O
(2)
Manganese reduction OM+2×10⁶MnO2+4×10⁶H
+ →
106CO2+2×10⁶Mn2+
+16NH3+H3PO4+318H2O
(3)
Iron reduction OM+4×10⁶FeOOH+8×10⁶H
+ →
106CO2+4×10⁶Fe2++16NH3+H3PO4+583H2O
(4)
The stoichiometric ratios of changes in TAlk and DIC per mole organic matter degradation
(1)dδTA/δDIC = (-16-12)/(106)=-0.160
(2)dδTA/δDIC = (0.8×10⁶+16-12)/(106)=0.932
(3)dδTA/δDIC = (4×10⁶+16-12)/(106)=4.132
(4)dδTA/δDIC = (8×10⁶+16-12)/(106)=8.132
OM=(CH2O)106(NH3)16(H3PO4) 837
δ represents the change in TAlk and DIC associated with individual organic matter degradation as it pro-838
ceeds from left to right. 839
840
841
842
843
844
845

Table 3. A comparison of carbonate chemistry and SGD-related TAlk and DIC fluxes in summer and winter in the Waquoit Bay sub-846
terranean estuary 847
Season Salinity Zone SGR Net flux
0-5 5-10 10-15 15-20 >20
Summer (July (July1 and July 22) and August, 2009)
Water Flux*
(m3 m
-1 day
-1)
2.2±0.6 0.7±0.7 0.3±0.3 0.5±0.4 2.4±1.0 -2.4±0.8
TAlk (mmol m
-3)
170±141 230±55 411±72 732±272 1648±62 -1748±135
DIC (mmol m
-3)
724±63 1019±68 1187±56 1255±202 1826±26 -1670±55
Aqueous CO2 (mmol m
-3)
551±77 552 475 524±143 205±34 -17±3
H+
(mmol m-3
) 3.47±0.52 1.03 0.59 0.77±0.36 0.15±0.03 -0.01±0.004
TAlk flux
(mol m-1
day-1
) 0.4±0.3 0.2±0.1 0.1±0.1 0.4±0.3 4.0±1.6 -4.2±1.5 0.9±2.3
DIC flux
(mol m-1
day-1
) 1.6±0.4 0.8±0.7 0.3±0.4 0.7±0.5 4.4±1.8 -4.0±1.4 3.8±2.5
Aqueous CO2 flux (mol m
-1 day
-1)
1.2±0.4 0.4±0.4 0.1±0.1 0.3±0.2 0.5±0.2 -0.04±0.02 2.5±0.6
H+ flux
(mmol m-1
day-1
) 7.8±2.3 0.8±0.7 0.2±0.2 0.4±0.4 0.4±0.2 -0.03±0.01 9.4±2.5
Winter (December(December 1 and December 28), 2009; January and February, 2010)
Water Flux*
(m3 m
-1 day
-1)
3.2±0.4 0.4±0.1 0.2±0.1 0.1±0.1 0.1±0.0 -0.4±0.06

TAlk (mmol m
-3)
284±43 512±141 701±197 1116±183 1719±74 -1843±256
DIC (mmol m
-3)
750±23 875±77 1062±167 1424±100 1863±43 -1753±214
Aqueous CO2
(mmol m-3
) 465±38 344±156 335±141 313±92 167±63 -22±6
H+
(mmol m-3
) 2.08±0.25 0.4±0.19 0.31±0.1 0.26±0.14 0.1±0.05 -0.01±0.003
TAlk flux (mol m
-1 day
-1)
0.9±0.2 0.2±0.1 0.2±0.1 0.2±0.1 0.1±0.02 -0.7±0.2 0.9±0.3
DIC flux (mol m
-1 day
-1)
2.4±0.3 0.4±0.1 0.2±0.1 0.2±0.1 0.1±0.02 -0.7±0.1 2.7±0.4
Aqueous CO2 flux
(mol m-1
day-1
) 1.5±0.2 0.1±0.1 0.08±0.04 0.04±0.02 0.01±0.005 (-9±3)×10
-3 1.7±0.2
H+ flux
(mmol m-1
day-1
) 6.6±1.1 0.2±0.1 0.07±0.03 0.04±0.02 0.01±0.004 (-4±1)×10
-3 6.7±1.1
Error bar is standard deviation, representing monthly variation in one season within one year or three years; all fluxes are normalized to per meter 848 of shoreline. 849 * Water flux was modeled from 2005 to 2007 (Gonneea and Charette, 2014). 850 Negative values denote water and material transport from bay water to the subterranean estuary; 851 SGR means submarine groundwater recharge, here we used the average surface samples as the endmember of SGR. 852 853
854

30
Table 4. Annual mass Balance of water, total alkalinity (TAlk) and dissolved inorganic carbon 855
(DIC) in the Waquoit Bay subterranean estuary 856
857
Water Flux# TAlk Flux DIC Flux
m3 m
-1 year
-1 mol m
-1 year
-1 mol m
-1 year
-1
STE Inputs
Terrestrial groundwater* 1200 276 509
Submarine groundwater re-
charge (from Waquoit Bay) 730 1305 1216
STE Output
Submarine groundwater dis-
charge (into Waquoit Bay) 1930 1468 2177
Net STE Production - 68 (5%) 419 (19%) # Water flux was modeled from Jan. 2005 to Dec.2005, and normalized to per meter of shoreline; 858 * Terrestrial groundwater TAlk is 0.19 mol m
-3 and DIC is 0.72 mol m
-3. 859
860
861

Figure 1 1
2
3
4
5
6
7
8
9
10
11
12
13
14
15
16
17
18
19
20
21
22
23
24
25
26
27
A
A’
11
A
Vineyard Sound
Waquoit Bay
A’
12 14 13
Berm
Bay CCC1 PZ10
32.9 m 13.5m
Terrestrial groundwater
Marine groundwater
time series
fixed-depth
well
PZ5 3m
Piezometer
Profiles
PZ3
STZ
5.5
m
6 m
5.5
m
A

Figure 2 28
29
30
31
32
33
34
35
36
37
38
39
40
41
42
43
44
45
46
47
48
49
50
51
52
53
54
55
56
57
58
59
60
61
62
63
64
65
66
67
2005/1/1 2006/1/1 2007/1/1 2008/1/1 2009/1/1 2010/1/1 2011/1/1
MS
L a
nom
aly
(m
)
-0.15
-0.10
-0.05
0.00
0.05
0.10
0.15
0.20

Figure 3 68
69
70
71
72
73
74
75
76
77
78
79
80
81
82
83
84
85
86
87
88
89
90
91
92
93
94
95
96
97
98
99
100
101
102
103
104
105
106
107
108
109
110
0.0
2.5
5.0
7.5
10.0
12.5
15.0
17.5
20.0
22.5
25.0
4/2010 5/2010 6/2010
Dep
th (
m)
5/2009 6/2009 7/2009 8/2009 9/2009 11/2009 12a/2009 12b/2009 1/2010 2/2010 3/2010
-5.5
-4.5
-3.5
-2.5
-1.5
-0.5
Salinity

0
5
10
15
20
25
30
35
-5.5
-4.5
-3.5
-2.5
-1.5
-0.5
Dep
th (
m)
5/20104/2010 6/20105/2009 6/2009 7/2009 8/2009 9/2009 11/2009 12a/2009 12b/2009 1/2010 2/2010 3/2010
0
10
20
30
40
50
60
70
80
-5.5
-4.5
-3.5
-2.5
-1.5
-0.5
4/2010
Dep
th (
m)
5/2010 6/20105/2009 6/2009 7/2009 8/2009 9/2009 11/2009 12a/2009 12b/2009 1/2010 2/2010 3/2010
-5.5
-4.5
-3.5
-2.5
-1.5
-0.5
0
50
100
150
200
250
300
350
400
450
Dep
th (
m)
5/2009 6/2009 7/2009 8/2009 9/2009 11/2009 12a/2009 4/2010 5/2010 6/201012b/2009 1/2010 2/2010 3/2010
111
112
113
114
115
116
117
118
119
120
121
122
123
124
125
126
127
128
129
130
131
132
133
134
135
136
137
138
139
140
141
142
143
144
145
146
-5.5
-4.5
-3.5
-2.5
-1.5
-0.5
0
50
100
150
200
4/2010
Dep
th (
m)
5/2010 6/20105/2009 6/2009 7/2009 8/2009 9/2009 11/2009 12a/2009 12b/2009 1/2010 2/2010 3/2010
-5.5
-4.5
-3.5
-2.5
-1.5
-0.5
4/2010
Dep
th (
m)
5/2010 6/20105/2009 6/2009 7/2009 8/2009 9/2009 11/2009 12a/2009 12b/2009 1/2010 2/2010 3/2010
0
5
10
15
20
25
30
35
40
45
50
55
60
65
(a) DO (%)
(e) NH4
+
(μmol L-1
)
(d) N+N
(μmol L-1
)
(b) Mn
(μmol kg-1
)
Figure 4
(c) Fe
(μmol kg-1
)

147
148
149
150
151
152
153
154
155
156
157
158
159
160
161
162
163
164
165
166
167
168
169
170
171
172
173
174
175
176
177
178
-5.5
-4.5
-3.5
-2.5
-1.5
-0.5
0
1
2
3
4
5
6
7
8
9
10
11
Dep
th (
m)
5/20104/2010 6/20105/2009 6/2009 7/2009 8/2009 9/2009 11/2009 12a/2009 12b/2009 1/2010 2/2010 3/2010
(f) PO4 (μmol L-1
)

pCO2 (utam)
1000
2500
4000
5500
7000
8500
10000
11500
13000
14500
16000
17500
19000
20500
22000
4/2010 5/2010 6/2010
Dep
th (
m)
5/2009 6/2009 7/2009 8/2009 9/2009 11/2009 12a/2009 12b/2009 1/2010 2/2010 3/2010
-5.5
-4.5
-3.5
-2.5
-1.5
-0.5
-5.5
-4.5
-3.5
-2.5
-1.5
-0.5
0
150
300
450
600
750
900
1050
1200
1350
1500
1650
1800
1950
Dep
th (
m)
4/2010 5/2010 6/20105/2009 6/2009 7/2009 8/2009 9/2009 11/2009 12a/2009 12b/2009 1/2010 2/2010 3/2010
Figure 5 179
180
181
182
183
184
185
186
187
188
189
190
191
192
193
194
195
196
197
198
199
200
201
202
203
204
205
206
207
208
500
650
800
950
1100
1250
1400
1550
1700
1850
2000
4/2010 5/2010 6/2010
Dep
th (
m)
5/2009 6/2009 7/2009 8/2009 9/2009 11/2009 12a/2009 12b/2009 1/2010 2/2010 3/2010
-5.5
-4.5
-3.5
-2.5
-1.5
-0.5
-5.5
-4.5
-3.5
-2.5
-1.5
-0.5
4/2010 5/2010 6/2010
Dep
th (
m)
5/2009 6/2009 7/2009 8/2009 9/2009 11/2009 12a/2009 12b/2009 1/2010 2/2010 3/2010
5.2
5.4
5.6
5.8
6.0
6.2
6.4
6.6
6.8
7.0
7.2
7.4
(a) TAlk (μmol kg-1
)
(c) pCO2
(μatm)
(d) pH-Cal
(b) DIC (μmol kg-1
)

209
210
211
212
213
214
215
216
217
218
219
220
221
222
223
224
225
226
227
228
229
230
231
232
233
234
235
236
237
238
239
240
241
0.00
0.08
0.16
0.24
0.32
0.40
0.48
0.56
0.64
4/2010 5/2010 6/2010
Dep
th (
m)
5/2009 6/2009 7/2009 8/2009 9/2009 11/2009 12a/2009 12b/2009 1/2010 2/2010 3/2010
-5.5
-4.5
-3.5
-2.5
-1.5
-0.5
(e) Omega Ca

Figure 6 242
243
244
245
246
247
248
249
250
251
TAlk ( mol kg-1
)
0 400 800 1200
DIC ( mol kg-1
)
400 800 1200 1600
TAlk
DIC
Mn ( mol kg-1
)
0 1 2 3 4
Fe ( mol kg-1
)
0 100 200 300 400 500
Fe
Mn
PO4
3- ( mol L
-1)
0.0 0.2 0.4 0.6 0.8 1.0
N+N ( mol L-1
)
0 5 10 15 20 25
NH4
+ ( mol L
-1)
0 50 100 150 200 250
PO43-
NH4+
N+N
Salinity
0.0 0.2 0.4 0.6 0.8 1.0
Dep
th (
m)
1
2
3
4
5
6
ORP (mv)
0 100 200 300
pH
5.2 5.6 6.0 6.4 6.8
Salinity
ORP
pH
(a) (b) (c) (d)

Figure 7 252
253
254
255
256
257
258
259
260
261
0 10 20 30
DIC
(m
ol
kg
-1)
0
500
1000
1500
2000
2500
3000
Salinity
0 10 20 30
DIC
(m
ol
kg
-1)
0
500
1000
1500
2000
2500
Salinity
0 10 20 30
TA
lk (
mol
kg
-1)
0
500
1000
1500
2000
2500
STE-PZ10
STE-PZ3
STE-PZ5
Baywater
0 10 20 30
TA
lk (
mol
kg
-1)
0
500
1000
1500
2000
2500
3000
STE-PZ5
STE-PZ10
STE-PZ3
Baywater
0.0 .1 .2 .3 .4 .5
0
200
400
600
800
1000 (a) (b)
(c) (d)
0.0 .1 .2 .3 .4 .5
600
800
1000
1200
1400
1600
Nov. 2009 Nov. 2009
Jun. 2010 Jun. 2010
TA
lk (
mol
kg
-1)
DIC
(
mol
kg
-1)
DIC
(
mol
kg
-1)
TA
lk (
mol
kg
-1)

4/2010 5/2010 6/2010
Dep
th (
m)
5/2009 6/2009 7/2009 8/2009 9/2009 11/2009 12a/2009 12b/2009 1/2010 2/2010 3/2010
-5.5
-4.5
-3.5
-2.5
-1.5
-0.5
-800
-700
-600
-500
-400
-300
-200
-100
0
100
200
300
400
500
600
700
800
4/2010 5/2010 6/2010
Dep
th (
m)
5/2009 6/2009 7/2009 8/2009 9/2009 11/2009 12a/2009 12b/2009 1/2010 2/2010 3/2010
-5.5
-4.5
-3.5
-2.5
-1.5
-0.5
-800
-700
-600
-500
-400
-300
-200
-100
0
100
200
300
400
500
600
700
800
Figure 8 262
263
264
265
266
267
268
269
270
271
272
273
274
275
276
277
278
279
280
281
282
283
284
285
286
bDIC (μmol kg-1
)
aTAlk (μmol kg-1
)

Figure 9 287
288
289
290
291
292
293
294
295
296
297
298
299
300
301
302
303
304
305
306
307
308
309
310
311
312
313
314
315
316
(c) DIC (mol kg-1
)
(a) Salinity (b) TAlk (mol kg-1
)
(d) Fraction of aerobic
respiration (%)
(e) Fraction of
denitrification (%) (f) Fraction of Mn and
Fe reduction (%)

Figure 10 317
318
319
320
321
322
323
324
325
326
327
328
329
330
331
332
333
334
335
336
337
338
339
340
5.0
5.5
6.0
6.5
7.0
7.5
8.0
0 10 20 30
pH
Salinity
observation-Nov.09
observation-Jun.10
conservative
mixing-Nov.09
conservative
mixing-Jun.10

Figure 11 341
342
343
344
345
346
347
348
349
350
351
Salinity
0 5 10 15 20 25 30 35
Fe (
mo
l k
g-1
)
0
50
100
150
Salinity
0 5 10 15 20 25 30 35
Mn
(m
ol
kg
-1)
0
20
40
60
80
100
0 5 10 15 20 25 30 35
NH
4
+ (
mo
l k
g-1
)
0
20
40
60
80
100
STE-Nov. 2009
Baywater-Nov. 2009
STE-Jun.2010
Baywater-Jun.2010
0 5 10 15 20 25 30 35P
O4
3- (
mo
l k
g-1
)
0
2
4
6
8
10
12
14(a) (b)
(c) (d)
243
439...
Mn
(
mol
kg
-1)
Fe
(m
ol
kg
-1)
NH
4+ (
mo
l k
g-1
)
PO
43- (
mol
kg
-1)

Figure 12 352
353
354
355
356
357
358
359
360
361
362
363
364
365
366
367
368
369
370
371
372
373
374
375
376
377
378
379
380
381
(a) Salinity
(c) DIC (mol kg-1
)
(e) Fraction of
denitrification (%)
(f) Fraction of Mn and
Fe reduction (%)
(d) Fraction of aerobic
respiration (%)
(b) TAlk (mol kg-1
)

Figure 13 382
-400 -200 0 200 400 600 800
-800
-600
-400
-200
0
200
400
600
Mid salinity-Jun.10
High salinity-Jun.10
Mid salinity-Nov.09
High salinity-Nov.09
TA
lk (
μm
ol
kg
-1)
DIC (μmol kg-1
)
Aerobic respiration (-0.2)
Denitrification (0.9)
Manganese reduction (4)
Iron reduction (8)
Fe/Mn oxidation
CaC
O 3 d
isso
lution
(2)
CaC
O 3 p
rodu
ctio
n (-
2)
(-∞)
DIC (mol kg-1
)
T
Alk
(
mo
l k
g-1
)