Embed Size (px)
Citation preview

EVIDENCE FOR POLICY
CARBON TAXES, POVERTY AND COMPENSATION OPTIONSSEAMUS O'MALLEY, BARRA ROANTREE AND JOHN CURTIS
ESRI SURVEY AND STATISTICAL REPORT SERIES NUMBER 98 October 2020

CARBON TAXES, POVERTY AND COMPENSATION OPTIONS
Seamus O’Malley
Barra Roantree
John Curtis
October 2020
ESRI SURVEY AND STATISTICAL REPORT SERIES
NUMBER 98
Available to download from www.esri.ie
The Economic and Social Research Institute Whitaker Square, Sir John Rogerson’s Quay, Dublin 2
ISBN 978-0-7070-0545-4
https://doi.org/10.26504/sustat98
This Open Access work is licensed under a Creative Commons Attribution 4.0 International License (https://creativecommons.org/licenses/by/4.0/), which permits unrestricted use, distribution, and reproduction in any medium, provided the original work is properly credited.

ABOUT THE ESRI
The mission of the Economic and Social Research Institute is to advance evidence-based policymaking that supports economic sustainability and social progress in Ireland. ESRI researchers apply the highest standards of academic excellence to challenges facing policymakers, focusing on 12 areas of critical importance to 21st Century Ireland.
The Institute was founded in 1960 by a group of senior civil servants led by Dr T. K. Whitaker, who identified the need for independent and in-depth research analysis to provide a robust evidence base for policymaking in Ireland.
Since then, the Institute has remained committed to independent research and its work is free of any expressed ideology or political position. The Institute publishes all research reaching the appropriate academic standard, irrespective of its findings or who funds the research.
The quality of its research output is guaranteed by a rigorous peer review process. ESRI researchers are experts in their fields and are committed to producing work that meets the highest academic standards and practices.
The work of the Institute is disseminated widely in books, journal articles and reports. ESRI publications are available to download, free of charge, from its website. Additionally, ESRI staff communicate research findings at regular conferences and seminars.
The ESRI is a company limited by guarantee, answerable to its members and governed by a Council, comprising 14 members who represent a cross-section of ESRI members from academia, civil services, state agencies, businesses and civil society. The Institute receives an annual grant-in-aid from the Department of Public Expenditure and Reform to support the scientific and public interest elements of the Institute’s activities; the grant accounted for an average of 30 per cent of the Institute’s income over the lifetime of the last Research Strategy. The remaining funding comes from research programmes supported by government departments and agencies, public bodies and competitive research programmes.
Further information is available at www.esri.ie

THE AUTHORS
Seamus O’Malley is a Research Assistant at the Economic and Social Research Institute. Barra Roantree is a Research Officer at the Economic and Social Research Institute and an Adjunct Assistant Professor at Trinity College Dublin. John Curtis is a Research Professor at the Economic and Social Research Institute and an Adjunct Professor at Trinity College Dublin.
ACKNOWLEDGEMENTS
We are grateful to the Central Statistics Office (CSO) for facilitating access to the Survey of Income and Living Conditions (SILC) Research Microdata File used to construct the database for the SWITCH tax-benefit model, and to the Irish Social Science Data Archive for facilitating access to the Household Budget Survey (HBS). Results are based on SWITCH version 1.3.
This work was carried out with funding from the Department of Communications, Climate Action and Environment and the ESRI’s Tax, Welfare and Pensions Research Programme (supported by the Department of Public Expenditure and Reform, the Department of Employment Affairs and Social Protection, the Department of Health, the Department of Children and Youth Affairs and the Department of Finance), which is gratefully acknowledged. The analysis builds on previous work carried out under the research programme. We are grateful to colleagues at the ESRI, officials from the Department of Communications, Climate Action and Environment and the Department of Finance for their helpful suggestions, as well as to two anonymous referees for their comments on an earlier draft of this paper. All views, error and omissions remain the sole responsibility of the authors.
This report has been accepted for publication by the Institute, which does not itself take institutional policy positions. The report has been peer reviewed prior to publication. The authors are solely responsible for the content and the views expressed.


Table of contents | iii
TABLE OF CONTENTS
EXECUTIVE SUMMARY .......................................................................................................................... VII
CHAPTER 1 INTRODUCTION ................................................................................................................. 1
CHAPTER 2 METHODOLOGY ................................................................................................................. 3
2.1 Procedure for imputing fuel spending into SILC .............................................................. 3
2.2 Reforms ............................................................................................................................ 6
CHAPTER 3 RESULTS ............................................................................................................................. 9
3.1 Poverty ............................................................................................................................. 9
3.2 Distributional impact ..................................................................................................... 11
3.3 Impact on other groups ................................................................................................. 13
CHAPTER 4 RETROFITTING ................................................................................................................. 17
4.1 Home retrofits: scope and depth................................................................................... 17
4.2 Home energy retrofit costs ............................................................................................ 18
4.3 Changes in home energy efficiency, energy use and emissions .................................... 19
CHAPTER 5 CONCLUSION ................................................................................................................... 23
REFERENCES .......................................................................................................................................... 25
APPENDIX .............................................................................................................................................. 31

iv | Carbon taxes, poverty and compensation options
LIST OF TABLES Table 3.1 Simulated impact of €7.50 increase in carbon tax on poverty measures ................... 11
Table 3.2 Net gain/loss as a percentage of disposable income .................................................. 14
Table 4.1 Mean retrofit costs, Better Energy Homes (selected measures) ................................ 19
Table 4.2 Energy savings (kWh/m2/year) by archetype and energy efficiency retrofit combination ................................................................................................................. 20
Table A.1 Summary statistics for reported and simulated fuel expenditure .............................. 31
Table A.2 Mean reported and simulated spending on fuels, selected groups ............................ 31
Table A.3 Reported and simulated carbon tax liabilities as a percentage of disposable income, by income decile ............................................................................................ 32
LIST OF FIGURES Figure 3.1 Distributional impact of progressive carbon tax reforms ............................................ 12
Figure 3.2 Distributional impact of other carbon tax reforms ..................................................... 13

Abbreviations | v
ABBREVIATIONS
AHC After Housing Costs
CSO Central Statistics Office
HBS Household Budget Survey
OLS Ordinary Least Squares
PUP Pandemic Unemployment Payment
SILC Survey of Income and Living Conditions
SEAI Sustainable Energy Authority of Ireland
TWSS Temporary Wage Subsidy Scheme

Executive summary | vii
EXECUTIVE SUMMARY
This paper examines how the Irish carbon tax can be raised without increasing poverty and disproportionately affecting low-income households. It shows that poverty can in fact be reduced and the lowest-income fifth of households left better-off using a third of revenues from a carbon tax rise on targeted increases in welfare payments, as proposed in the recent Programme for Government. This reverses the regressive impact of an uncompensated carbon tax rise, which arises because goods subject to the carbon tax make up a larger share of spending for lower- than higher-income households.
The lowest-income fifth of households is heavily comprised of working-age adults in receipt of social welfare payments and their dependents. These can be compensated for a rise in the carbon tax through increases in the maximum rates of the main working-age welfare payments or raising Increases for Qualified Children (IQCs) paid alongside these benefits to those with dependent children. We show that doing so using a third of the €159 million Revenue estimate that a €7.50 per tonne carbon tax increase raises would reduce the overall poverty rate by 0.2 percentage points (ppts) and leave the lowest-income fifth of households on average better-off. Using the revenue to increase IQCs would reduce the child poverty rate by twice that (0.4ppts): a substantial reduction, given Regan and Maître (2020) estimate child poverty could rise by 1.4ppts this year because of pandemic related job losses, even with some recovery.
Policymakers may also be concerned about the impact an uncompensated carbon tax rise will have on single adults living alone. Using a third of revenues to raise the Fuel Allowance or Living Alone Increase is well targeted at compensating such households, though would not on its own reverse the regressive impact of a carbon tax rise. This is because much of the gain from such benefits goes to households around the middle rather than the bottom of the income distribution, reflected in lower rates of poverty among retired adults than working-age adults or children. However, using one-third of the revenue to fund a combined increase in IQCs and these benefits would be both progressive and poverty reducing.
The Programme for Government also commits to allocating around half of the additional revenue raised from planned carbon tax increases over the next decade to a national housing retrofit programme. The paper provides an overview of the evidence from research on existing housing retrofit programmes administered by the Sustainable Energy Authority of Ireland (SEAI), which finds significant variation in the level of grant aid provided relative to the energy efficiency gain. It also suggests that it would be prudent to incorporate funding for the evaluation of grant effectiveness into any new retrofit programme.


Introduction | 1
CHAPTER 1
Introduction
There is a broad scientific consensus that the accumulation of greenhouse gases in the atmosphere – notably carbon dioxide – is causing global temperatures to rise (Intergovernmental Panel on Climate Change, 2014; 2018). While there is uncertainty about the precise economic and social costs associated with this rise in temperatures,1 the European Union has committed to achieving a 30 per cent reduction on 2005 emission levels by 2030, setting ambitious national targets for emissions reductions, including 20 per cent for Ireland by 2020 and 30 per cent by 2030. In addition to these European Union and other international commitments, Ireland has set a national policy objective of transitioning to a low-carbon economy by 2050 (Government of Ireland, 2015; 2018; Department of Communications, Climate Action and Environment, 2014).
Successive governments have envisaged a key role for a gradually rising carbon tax in meeting these objectives (Government of Ireland, 2007; 2011; 2018; 2020). By putting a price on carbon, the tax addresses the divergence between the private and social costs of emissions that lead to their excessive production in a market economy. Such taxes are easy to administer, cheap to collect and difficult to avoid (Metcalf, 2019). Moreover, a carbon tax is the most efficient way of incentivising carbon abatement; that is, of achieving a given reduction in carbon emissions at the lowest economic cost, with a large literature finding that such taxes would reduce emissions in Ireland with little wider economic costs (e.g. FitzGerald and McCoy, 1992; FitzGerald et al., 2002; Bergin et al., 2004; di Cosmo and Hyland, 2013; Conefrey et al., 2013; de Bruin and Yakut, 2018; 2019).2 Even though few broad-based carbon taxes have been in place for long, there is now also substantial evidence from ex-post evaluations that they are highly effective at reducing emissions, particularly from transport (see, for example, Andersson, 2019; Runst and Thonipara, 2020; Metcalf and Stock, 2020; Best et al., 2020).
However, there is also widespread recognition that carbon taxes can have distributional consequences that policymakers may be concerned about and want to ameliorate.3 This arises largely because certain groups – especially lower-income households – spend a disproportionate share of their incomes on carbon-
1 See Nordhaus (2007) and Stern (2006). Some have argued that uncertainty around these costs is itself an argument for taking action, analogous to taking out an insurance policy (Wagner and Weitzman, 2015).
2 This goes back as far as Baumol and Oates (1971) and Weitzman (1974). See Metcalf (2019) for an accessible summary of this literature and discussion of arguments in favour of a carbon tax over cap-and-trade schemes, namely less administrative complexity, damaging price volatility and potential for adverse policy interactions.
3 In an Irish context, recognition of this dates back to at least Scott (1992) and O’Donoghue (1997). More recently, Bercholz and Roantree (2019), Tovar-Reaños and Lynch (2019), Callan et al. (2009), Healy (2003) and Clinch and Healy (2000) have all examined the distributional impact of carbon taxes and potential compensation packages. This paper updates and develops that work by using the most recent available data to examine a broader range of reforms.

2 | Carbon taxes, poverty and compensation options
intensive goods, in particular heating fuel. As a result, a carbon tax can have a regressive impact on households in the absence of an accompanying package of compensation measures. Arising from such concerns, the present government indicated its intention to ‘ensure that the increases in the carbon tax are progressive’ by using around a third of revenues raised from planned increases in the carbon tax ‘on targeted social welfare and other initiatives’ (Government of Ireland, 2020). This study assesses the effects of a €7.50 per tonne rise in the carbon tax on households’ incomes and poverty in Ireland, with and without reforms to the tax and welfare system which compensate households.
Chapter 2 sets out the methodology underlying the paper. This takes as given the behaviour of households and firms, abstracting from the wider effects on the economy such a tax may have.4 For example, we do not account for changes in prices – beyond those directly arising from the higher carbon tax – that firms charge for their products because of changes to input prices or processes, nor the responses of households to such changes in the relative prices of goods.5 This allows us to isolate the immediate effects of increasing the carbon tax on households’ incomes, identify the groups likely to be disproportionately affected without compensation and design reforms to offset these effects. The combined impact of these packages on poverty and households’ income are considered in Chapter 3. These show that it is possible to use a third of the revenues raised by an increase in the carbon tax to reduce poverty – particularly child poverty – and leave the lowest-income fifth of households better-off on average.
In the longer run, both households and firms will respond to the change in relative prices brought about by the higher carbon tax by changing the goods and services they consume, produce and invest in.6 Given the Irish residential building stock has a relatively low level of energy efficiency and contributes around 15 per cent of total CO2 emissions, one area that will require particularly large investment is residential housing retrofits. The current government has proposed allocating €5 billion from the €9.5 billion in additional revenue that will be raised from increases to the carbon tax over the next decade towards a housing retrofit programme. Chapter 4 provides an overview of evidence from research on existing retrofit programmes administered by the Sustainable Energy Authority of Ireland (SEAI), which finds significant variation in the level of grant aid provided relative to the energy efficiency improvement gained. Chapter 5 concludes by considering the implications of our findings for policy.
4 Research that takes account of such effects finds that higher carbon taxes reduce emissions with negligible impacts on the wider economy (e.g. de Bruin and Yakut, 2019; Conefrey et al., 2013; Bergin et al., 2004).
5 In the medium to long run, these price effects may also change the returns to labour and capital. Research for the United States suggests that these ‘source-side’ impacts are progressive, and may even entirely offset the regressive ‘use-side’ impacts even before compensation (Rausch et al., 2011; Horowitz et al., 2017; and Goulder et al., 2018).
6 de Bruin and Yakut (2019c) and Tovar-Reaños and Lynch (2019) find – as here – that appropriate recycling of revenues can reverse the initial regressive impact of increases to the carbon tax even after accounting for changes in behaviour.

Methodology | 3
CHAPTER 2
Methodology
To investigate the impact an increase in the carbon tax will have on households, this paper uses SWITCH – the ESRI’s tax and benefit microsimulation model – run on data from the nationally representative 2017 Survey of Income and Living Conditions (SILC). Given the substantial impact of the ongoing COVID-19 pandemic on the labour market, the 2017 data are adjusted to be representative of the 2020 population. We do this by simulating an unemployment shock whereby a certain proportion of workers in each sector of the economy are assumed to lose their job or to continue in employment with the support of the Temporary Wage Subsidy Scheme (TWSS). The number of individuals affected by this shock is calibrated from publicly available Department of Employment Affairs and Social Protection data on claims for the Pandemic Unemployment Payment (PUP) and Revenue data on the number of recipients of the TWSS. Both calibrations use figures from the end of June and account for the industry breakdown of recipients of either scheme.7
However, SILC does not collect sufficiently detailed information on expenditure to model the current or potential carbon tax liabilities of households. The Household Budget Survey (HBS) – which does collect such information – was most recently collected in 2015-2016 but does not contain sufficiently detailed information on incomes to allow tax and welfare entitlements to be modelled through SWITCH. As a result, we adopt an approach common in the microsimulation literature of imputing expenditure into SILC from the HBS.
2.1 PROCEDURE FOR IMPUTING FUEL SPENDING INTO SILC
Our approach to imputing expenditure on goods subject to carbon tax follows De Agostini et al. (2017), which has been previously applied in an Irish context by Savage (2017). The overall idea is straightforward; we model expenditure on goods liable to the carbon tax in the HBS using household and demographic characteristics, then take the estimated coefficients of this model and use the same characteristics in SILC to predict each household’s expenditure on goods liable to carbon tax. The details of this approach are described below.
Step 1: Estimate non-durable expenditure
The first step is to use the HBS data to estimate non-durable expenditure using an unconditional ordinary least squares (OLS) model as follows:
ln𝑁𝑁𝑁𝑁𝑁𝑁 = 𝛼𝛼𝐸𝐸 + �𝛽𝛽𝐸𝐸(ln𝑦𝑦)𝑚𝑚 + 𝛾𝛾1𝒙𝒙+ 𝛾𝛾2 ln 𝑦𝑦 ∗ 𝒙𝒙 + 𝛾𝛾3(ln𝑦𝑦)2 ∗ 𝒙𝒙 + 𝜖𝜖𝐸𝐸 𝑚𝑚
7 For further details of this approach, see Beirne et al. (2020) and Regan and Maître (2020).

4 | Carbon taxes, poverty and compensation options
where ln𝑁𝑁𝑁𝑁𝑁𝑁 denotes the logarithm of non-durable expenditure (total spending less that on furniture, appliances and equipment), 𝑦𝑦 denotes disposable income, 𝒙𝒙 is a vector of control variables, and 𝛼𝛼𝐸𝐸 ,𝛽𝛽𝐸𝐸 ,𝛾𝛾1,𝛾𝛾2 𝑎𝑎𝑎𝑎𝑎𝑎 𝛾𝛾3 are parameters to be estimated. Here, 𝑚𝑚 is set to 3. The parameters estimated from this model are used later in Step 4.
The vector of control variables includes a range of demographic and household characteristics. Household characteristics include the following variables; household size, tenure of accommodation, family type, car ownership, the number of dependent children, the number of working members of the household, the number of rooms in the dwelling, the type of accommodation, and rural/regional indicators.
Other household head (HRP) characteristics include work status, gender, age, education, and marital status. For the purposes of this specific step, the model also includes the interaction of each of these demographic and household characteristics with the logarithm of disposable income and its square.
Step 2: Estimate budget shares of goods subject to the carbon tax
The next step is to estimate the budget shares of electricity and goods subject to the carbon tax. Due to the large proportion of households that have zero expenditure on many of the five different types of fuel captured in the HBS (gas, liquid fuel, solid fuel, petrol and diesel), this estimation is done in two stages.
The first stage estimates a probit model in order to calculate the probability of having non-zero expenditure:
Pr(𝑎𝑎𝑁𝑁𝑐𝑐 = 1) = 𝜓𝜓(𝛼𝛼𝑐𝑐,0 + �𝛽𝛽𝑐𝑐,0(ln𝑁𝑁𝑁𝑁𝑁𝑁)𝑚𝑚 + 𝛾𝛾𝑐𝑐,0 𝒙𝒙+ 𝜖𝜖𝑐𝑐,0) 𝑚𝑚
The dependent variable is the probability of having positive expenditure on a given fuel, 𝑐𝑐. The exponent of NDE, 𝑚𝑚, is set to 2, while the vector of covariates contains the same demographic and household characteristics as before.
The second stage uses an OLS regression to estimate budget shares of non-durable
expenditure for a given fuel, 𝑤𝑤𝑐𝑐 = 𝐸𝐸𝑐𝑐𝑁𝑁𝑁𝑁𝐸𝐸
, conditional on having positive expenditure
for that fuel.
wc = 𝛼𝛼𝑐𝑐 + �𝛽𝛽𝑐𝑐(ln𝑁𝑁𝑁𝑁𝑁𝑁)𝑚𝑚 + 𝛾𝛾𝑐𝑐 𝒙𝒙 + 𝜖𝜖𝑐𝑐 𝑖𝑖𝑖𝑖 𝑎𝑎𝑁𝑁𝑐𝑐 = 1 𝑚𝑚

Methodology | 5
A second-order polynomial is again used for the expenditure term, while the control variables are the same as before. The estimated coefficients from both stages of this step are later used in Step 5.
Step 3: Adjust the income distribution from SILC to match the HBS
The distribution of disposable income from SILC is then adjusted in order to align it to the HBS data. We take the weekly disposable income for each household simulated by SWITCH under the baseline tax and welfare policy (described below) in 2015-2016 prices, then identify outliers in the distributions of disposable incomes in both the SILC and HBS datasets. This is done using the Chauvenet method for detecting outliers, an iterative procedure where an observation is marked as an outlier if it falls outside the criterion chosen. In this case, the criterion assumes a lognormal distribution:
(𝑙𝑙𝑎𝑎 𝑦𝑦 − 𝑙𝑙𝑎𝑎 𝑦𝑦�����) /𝜎𝜎ln𝑦𝑦 > 𝑍𝑍(1−2𝑁𝑁)−1
where ln𝑦𝑦����� is the mean and 𝜎𝜎 is the standard deviation of disposable income. Once outliers have been identified, the distribution of disposable income is standardised by scaling it using these moments of disposable income in the HBS, specifically:
𝑦𝑦� = �𝑦𝑦 − 𝑦𝑦�𝜎𝜎𝑦𝑦
� ∗ 𝜎𝜎𝑦𝑦,𝐻𝐻𝐻𝐻𝐻𝐻 + 𝑦𝑦�𝐻𝐻𝐻𝐻𝐻𝐻
Step 4: Impute non-durable expenditure
Once the variables in the SILC dataset have been constructed such that they have the same structure as their HBS counterparts, non-durable expenditure is imputed into the SILC data. This simply involves taking the estimated coefficients from Step 1 above and the values of the variables to generate predicted values of non-durable expenditure for each household in our SILC dataset.
The independent variables for income, as well as their interactions with the control variables, are the adjusted series (from Step 3) and not the original series in the SILC dataset. This means that our imputation procedure accounts for the lower level of employment and disposable income in 2020 arising from pandemic related job losses, though it assumes the relationship between expenditure and these (along with other demographic variables) is the same as in 2015-2016. The resulting imputation of non-durable expenditure is then adjusted in the same manner as income in Step 3 before being used as a variable in the next step.
Step 5: Impute budget shares
In the same manner as the previous step, budget shares are imputed following the two-stage procedure using the estimates from Step 2. The non-durable expenditure variables and their polynomials are again the adjusted series rather than the original prediction.

6 | Carbon taxes, poverty and compensation options
Step 6: Calculate carbon tax liabilities
For each household in our SILC data, we then have a predicted level of non-durable expenditure as well as the share of non-durable expenditure on five fuel types subject to the carbon tax. Simply multiplying the two gives us expenditure on each of the fuels. Appendix Tables A.1 and A.2 show that the distributions of these imputed expenditures are similar to those reported in the HBS.
To calculate the carbon tax paid by each household, the expenditure on each fuel type is divided by its price per unit in 2015/2016 to obtain an estimated quantity.8 We then apply the rate of carbon tax levied on that fuel type to calculate the carbon tax liability paid by each household. Appendix Table A.3 shows that these closely approximate the distribution of carbon tax liabilities by income calculated using the same approach from reported expenditure.
However, an important caveat that accompanies our modelling approach relates to changes in expenditure patterns since 2015-2016 when the HBS data we use were collected. Coffey et al. (2020) show that these changed substantially in the months following the onset of the COVID-19 pandemic, with spending on transport, for example, falling by more than half. Statistics from the Sustainable Energy Authority of Ireland (SEAI) show that although electricity, petrol and diesel demand were well below their 2019 levels in May of this year, kerosene – used for heating in households – was significantly higher.9 More generally, the energy efficiency of both cars and heating systems has improved significantly in recent years and such improvements will not be captured in the spending levels that we impute. As a result, we may overstate the impact of an increase in the carbon tax on certain groups (notably long-distance commuters who are currently working from home and those who have upgraded their home energy systems) and understate it on others (those spending more time in – and heating – energy inefficient homes).
2.2 REFORMS
Using this dataset, we consider the effects on households of a €7.50 per tonne increase in the carbon tax from its current level of €26 per tonne. Revenue estimate that such a rise would yield €159 million per annum on a full year basis.10 Given the current government has indicated its intention to ‘ensure that the increases in the carbon tax are progressive’ by using around a third of revenues raised from planned increases in the carbon tax ‘on targeted social welfare and other
8 We use data on prices collected by the Sustainable Energy Authority of Ireland, taking the average weighted by share of household energy demand, as per de Bruin and Yakut (2019b).
9 See https://www.seai.ie/publications/Tracking-effect-of-COVID-19-on-energy-demand.pdf. The SEAI notes that this may reflect households stocking up on fuel at the start of the pandemic and result in lower deliveries later in the year.
10 See https://www.revenue.ie/en/corporate/documents/statistics/ready-reckoner.pdf.

Methodology | 7
initiatives’ (Government of Ireland, 2020), we examine the combined impact of a €7.50 increase in the carbon tax as part of the following seven reforms:
A. a €4 per week rise in the Increase for Qualified Children paid to recipients of most social welfare benefits with dependent children (from €36/40 per week to €40/44 per week for children aged u12/12+ respectively);
B. a €6.50 per week rise in the rate of fuel allowance, payable to long-term recipients of certain social welfare payments;
C. a €3 per week rise in the maximum personal rate of the main working-age welfare payments, from €203 per week to €206 per week;
D. a €28 per year increase in the personal income tax credit (€1,650 to €1,678);
E. a €4.75 per week rise in the Living Alone Increase, an extra payment for people on social welfare payments who are living alone;
F. a €4 per week rise in the u12 Increase for Qualified Children, €2.50 per week rise in the 12+ Increase for Qualified Children and €1 per week rise in the Living Alone Increase;
G. a €4 per week rise in the u12 Increase for Qualified Children, €2.50 per week rise in the 12+ Increase for Qualified Children and €1.50 per week rise in the fuel allowance;
Estimates from SWITCH suggest that – on a full year basis – each of these would cost €50-55 million per annum compared to the tax and welfare system currently in place and the population as it looked at the end of June 2020.
We assume that households’ behaviour remains unchanged in response to a change in relative prices of goods/services and labour/leisure brought about by the rise in the carbon tax and any compensation package. This means the results are best interpreted as showing the initial ‘first round’ effects of the reforms considered. In the medium or longer run, individuals may adjust whether and how much they work, while households are likely to change the composition of their expenditure away from more carbon-intensive products towards less carbon-intensive ones (De Bruin and Yakut, 2019). Although this may reduce the scale of losses relative to those estimated here, it is unlikely to alter the pattern of these losses unless the magnitude of responses also differs significantly by income level or household type. Other research published by the ESRI (Tovar-Reaños and Lynch, 2019) suggests that this is unlikely to be the case, at least on the expenditure side. While little evidence is available on the extent of labour supply responses by income level and household type in Ireland, the reforms to taxes and benefits considered here are also unlikely to be of sufficient magnitude to induce substantial behavioural responses.


Results | 9
CHAPTER 3
Results
In this chapter we examine the impacts of the potential reforms outlined in Chapter 2. We first look at their effects on poverty, before turning to analyse their distributional impacts. We finish by examining their effect on various other groups that may be of particular interest to policymakers.
3.1 POVERTY11
The impact of a higher carbon tax on certain residential heating fuels has led some to worry about its possible effects on energy poverty, which the government defines as ‘an inability to heat or power a home to an adequate degree’ (Department of Communications, Energy and Natural Resources, 2016). However, measuring energy poverty is a difficult task beset by measurement issues and on which there is no agreed international approach.
Some countries measure energy poverty as the proportion who spend more than a certain share of their disposable income on energy. But this can be very sensitive to the ultimately arbitrary income threshold used, and to whether disposable income is defined before or after housing costs (BHC and AHC income respectively).12 In addition, expenditure-based measures can include some high income households who heat their homes to a high level but exclude others whose incomes are so low that they decide to spend less than e.g. 10 per cent of their incomes on energy and leave their home inadequately heated.13
This has led other countries, such as the UK, to define energy poverty on the basis of the estimated expenditure needed to heat a home adequately, rather than what households actually report spending. However, this approach requires detailed information on dwellings that may not be available, and is sensitive to the precise assumptions made about energy efficiency and sources. Partly for these reasons, other countries again have adopted subjective measures, based on questions asked in surveys about whether households have had to go without heating in the past 12 months, whether the dwelling was not kept adequately warm because of affordability issues, and whether the household was unable to pay utility bills on time for financial reasons.
11 This section draws on the discussion in Bercholz and Roantree (2019). 12 As the amount spent on housing in part reflects preferences for consumption, measuring disposable income after
housing costs means treating a family who decide to live e.g. in a larger house with a garden as ‘poorer’ than a family with identical income but who live in a smaller house without a garden.
13 Coyne et al. (2018) find evidence consistent with this in their study of an energy efficiency upgrade scheme in Ireland. This led to much smaller than expected energy savings, as households responded to the increased efficiency of their dwellings by increasing ‘thermal comfort’.

10 | Carbon taxes, poverty and compensation options
While all these metrics have been used in Ireland at some point, the 2011 Warmer Homes strategy put forward a ‘preliminary’ official definition based on reported expenditure (Department of Communications, Energy and Natural Resources, 2011). This proposed a ‘core indicator’ of energy poverty defined as a household spending more than 10 per cent of its income after housing cost on energy services, and supplementary indicators of ‘severe’ and ‘extreme’ fuel poverty defined as spending more than 15 per cent and 20 per cent respectively.14
Table 3.1 contains our estimate of these official measures in 2020, using the approach outlined in Chapter 2. Without compensation, a carbon tax increase of €7.50 per tonne would raise ‘core’ energy poverty from 17.5 per cent to 18.9 per cent, ‘severe’ energy poverty from 5.6 per cent to 6.1 per cent, and ‘extreme’ energy poverty from 3.0 per cent to 3.3 per cent. Some of the reforms we consider slightly moderate this increased level of energy poverty – particularly for the ‘severe’ energy poverty measures, offsetting a fifth of the rise – but we simulate that in all cases energy poverty would be higher than without a rise in the carbon tax.
However, these indicators are – as noted above – beset by measurements issues. Recent work by Tovar-Reaños and Lynch (2020) finds that such expenditure-based energy poverty metrics perform poorly both in measuring baseline rates of energy poverty and in capturing any changes to energy poverty from carbon taxation. In addition, Watson and Maître (2015) caution against the drawing of a distinction between ‘energy poverty’ and deprivation more generally. They argue that the ‘problem of fuel poverty is primarily one of inadequate resources’ and that ‘its solution lies in understanding and addressing the constellation of factors that erode a household’s material well-being’.
There is therefore a compelling case for focusing on the net impact of any rise in the carbon tax on more established measures of poverty, such as the official at-risk-of-poverty rate. This records the percentage of people living in a household below the poverty line: that is, in a household with less than 60 per cent of median household income, adjusted for household size.
Table 3.1 contains our estimate of this measure of poverty for the population as a whole, adults and children. The results show that it is possible to reduce poverty while raising the carbon tax, even if only a third of revenues are used to
14 The subsequent 2016 Strategy to Combat Energy Poverty committed to establishing an Energy Poverty Advisory Group to review and report to the minister on ‘an appropriate methodology for measuring and tracking energy poverty levels in Ireland’. However, this group has yet to be convened or to meet.

Results | 11
compensate households. Increasing the level of payments received by low-income households with children is particularly effective at reducing poverty, with the reforms which include larger transfers to such households (A, F and G) leading to a 0.2 percentage point reduction in poverty for adults and the population as a whole in addition to a 0.5 percentage point reduction in child poverty. Increasing the maximum personal rate of the main working-age welfare payments (Reform C) leads to a similar reduction in poverty amongst the overall and adult population, but a smaller 0.2 percentage point reduction in child poverty. These are sizeable effects. By means of reference, Regan and Maître (2020) estimate that the at-risk-of-poverty rate for children could rise by 1.4 percentage points this year because of pandemic related job losses even with some recovery.
TABLE 3.1 SIMULATED IMPACT OF €7.50 INCREASE IN CARBON TAX ON POVERTY MEASURES
Baseline With compensation package:
2020 %
None %
A %
B %
C %
D %
E %
F %
G %
Energy poverty >10% AHC income 17.5 18.9 18.9 18.8 18.9 18.9 18.8 18.9 18.9 >15% AHC income 5.6 6.1 6.0 6.0 6.0 6.0 6.0 6.0 6.0 >20% AHC income 3.0 3.3 3.3 3.3 3.2 3.3 3.3 3.3 3.3 At-risk-of-poverty rate Population 14.1 14.1 13.9 14.1 13.9 14.1 14.1 13.9 13.9 Adults 13.3 13.3 13.1 13.3 13.1 13.3 13.3 13.1 13.1 Children 17.5 17.5 17.1 17.5 17.3 17.5 17.5 17.1 17.1
Source: Authors’ calculations using SWITCH version 1.3. Note: Compensation packages as described in Chapter 2.
The other reforms we consider – increasing the Fuel Allowance (B), increasing the personal income tax credit (D) and raising the Living Alone Increase (E) – have no effect on poverty. The reason for this is that few of those who benefit have incomes below but near the at-risk-of-poverty threshold.
The results in this section show that it is possible to raise the carbon tax while reducing poverty – particularly for children – despite the likely rise the reforms would have on the official measure of energy poverty. We now turn to look at the distributional impact of the reforms considered above.
3.2 DISTRIBUTIONAL IMPACT
In addition to concerns about the potential impacts of a higher carbon tax on poverty, the current government has committed to ‘ensuring that the increases in the carbon tax are progressive’. We therefore examine the progressivity of potential reforms considered above by assessing their net impact across the

12 | Carbon taxes, poverty and compensation options
distribution of income, dividing households into ten equally sized groups (deciles) on the basis of their disposable income adjusted for household size.
Figure 3.1 plots the net gain or loss for these deciles as a percentage of disposable income, showing the average impact of the carbon tax rise without compensation alongside the four reforms considered above that lead to reductions in poverty (A, C, F and G). While the impact of the carbon tax increase is regressive without compensation – resulting in small losses of almost 0.3 per cent for the lowest-income decile compared to negligible losses of 0.1 per cent for the highest income decile – each of these measures is sufficient to reverse the regressive distributional pattern. Indeed these reforms leave those in the lowest two income deciles on average slightly better-off, with gains of between 0.1 per cent and 0.3 per cent of disposable income.
FIGURE 3.1 DISTRIBUTIONAL IMPACT OF PROGRESSIVE CARBON TAX REFORMS
Sources: Authors’ calculations using SWITCH version 1.3. Note: Deciles constructed equivalising income using the CSO’s ‘national’ equivalence scale. Gains/losses compared to
baseline 2020 policy without any change in the carbon tax. Reforms as described in Chapter 2.
Reforms A, F and G – which include increases in transfers to low-income households with children – are unambiguously progressive, with gains for the two or three lowest-income deciles and losses for higher-income deciles. Reform C – which increases the maximum personal rate of the main working-age welfare benefits – is also progressive, but with much larger gains for the second lowest rather than very lowest-income decile. The reason for this is that such increases result in a smaller proportional gain for out-of-work claimants with children than
-0.4
-0.3
-0.2
-0.1
0
0.1
0.2
0.3
0.4
Lowest 2 3 4 5 6 7 8 9 Highest
Gain
/loss
as a
% o
f disp
osab
le in
com
e
Decile of equivalised disposable income
No compensation Reform A Reform C Reform F Reform G

Results | 13
without, and claimants with children are more likely to be located further down the income distribution.
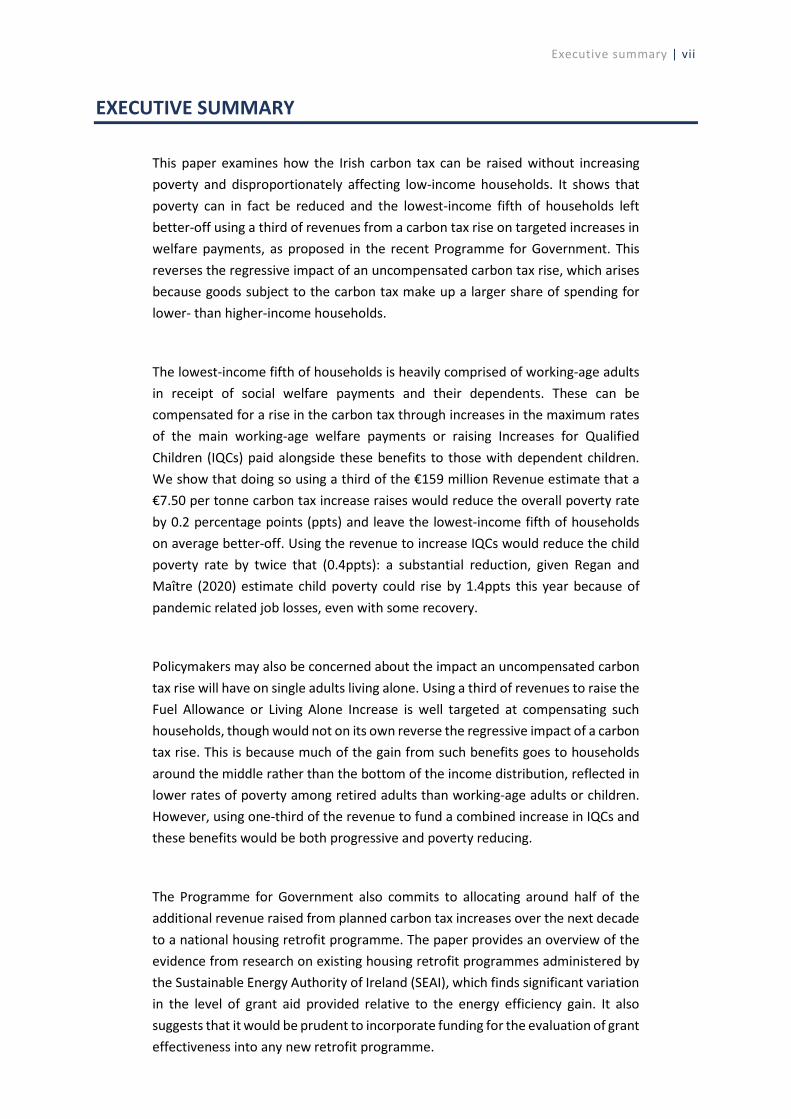
Figure 3.2 shows the net distributional impact for the other reforms. While raising the Fuel Allowance (Reform B) or Living Alone Increase (Reform E) leaves those in the 3rd and 4th lowest-income decile on average better-off, neither provides significant compensation for those in the two lowest-income deciles. This is because most claimants of these benefits are retired single-adults or couples, and few of these are located in the very lowest-income deciles. Nor does increasing the personal income tax credit (Reform D), which mostly benefits higher income households. The reason is that the lowest-income deciles are more likely to be comprised of (recently) jobless working-age households who are not entitled to these payments and do not have high enough incomes to pay income tax.
FIGURE 3.2 DISTRIBUTIONAL IMPACT OF OTHER CARBON TAX REFORMS
Sources: Authors’ calculations using SWITCH version 1.3. Note: Deciles constructed equivalising income using the CSO’s ‘national’ equivalence scale. Gains/losses compared to baseline 2020
policy without any change in the carbon tax. Reforms as described in Chapter 2.
3.3 IMPACT ON OTHER GROUPS
We now turn to look at the net impact of the reforms on the incomes of some other groups that may be of interest to policymakers. The columns in Table 3.1 show the net gain/loss for each group as a percentage of disposable income, the first without any compensatory measures and the remainder for a €7.50 increase in the carbon tax combined with the relevant reform described in Chapter 2.
-0.4
-0.3
-0.2
-0.1
0
0.1
0.2
0.3
Lowest 2 3 4 5 6 7 8 9 Highest
Gain
/loss
as a
% o
f disp
osab
le in
com
e
Decile of equivalised disposable income
No compensation Reform B Reform D Reform E

14 | Carbon taxes, poverty and compensation options
In terms of the impact across family types, the results suggest that an uncompensated carbon tax rise would have a slightly smaller effect on retired and working-age single adults than others. However, with the exception of raising the Fuel Allowance (Reform B, which leaves retired couples on average better-off) and increasing the maximum personal rate of the main working-age benefits (Reform C, which significantly mitigates losses for working-age couples without children), the measures we consider do little to benefit retired couples or working-age couples without children, leaving them most adversely affected. The reason is that the measures we have examined for the most part benefit lower-income households who are at-risk-of-poverty. Couples without children – whether retired or of working-age – have experienced below-average rates of poverty in recent years. Retired couples, for example, have had an at-risk-of-poverty rate of below 10 per cent consistently since 2015, compared to more than a third for working-age single adults and lone parents (CSO, Table SIA16).
TABLE 3.2 NET GAIN/LOSS AS A PERCENTAGE OF DISPOSABLE INCOME
Source: Authors’ calculations using SWITCH version 1.3. Note: Gains/losses compared to 2020 policy without any change in the carbon tax. Reforms as described in Chapter 2.
Package of compensation measures None % A % B % C % D % E % F % G %
Family Type
Working-age single -0.13 -0.12 -0.02 0.03 -0.05 -0.02 -0.10 -0.10 Working-age lone parent -0.16 0.08 -0.16 0.00 -0.12 -0.16 0.01 0.01 Working-age couple, no kids -0.16 -0.14 -0.16 -0.09 -0.08 -0.16 -0.14 -0.14 Working-age couple w/kids -0.16 -0.03 -0.16 -0.11 -0.08 -0.16 -0.06 -0.06 Retired Single -0.14 -0.13 0.36 -0.11 -0.10 0.64 0.03 -0.02 Retired Couple -0.17 -0.18 0.02 -0.15 -0.14 -0.17 -0.18 -0.13
Rural/Urban
Rural -0.18 -0.10 -0.09 -0.11 -0.11 -0.09 -0.10 -0.10 Urban -0.13 -0.06 -0.08 -0.06 -0.06 -0.08 -0.07 -0.07
Tenure
Owned -0.17 -0.13 -0.10 -0.13 -0.10 -0.10 -0.12 -0.12 Rented -0.11 0.07 -0.05 0.05 -0.05 -0.04 0.06 0.06
Household Size
1 -0.14 -0.14 0.25 -0.06 -0.08 0.45 -0.02 -0.05 2 -0.16 -0.15 -0.07 -0.09 -0.09 -0.16 -0.15 -0.13 3 -0.15 -0.09 -0.15 -0.07 -0.08 -0.15 -0.10 -0.10 4 -0.16 -0.08 -0.16 -0.10 -0.08 -0.16 -0.10 -0.10 >5 -0.16 0.08 -0.16 -0.08 -0.09 -0.16 0.03 0.03

Results | 15
Working-age lone parents are left on average better-off by those reforms which raise Increases for Qualified Children (Reforms A, E and F), as are working-age single adults from increasing the maximum personal rate of the main working-age social welfare benefits (Reform C). Similarly, retired singles are left on average better-off by reforms (E and F) which raise the Living Alone Increase. Finally, although they are not left on average better-off by any reform, those which raise Increases for Qualified Children (A, E and F) significantly mitigate losses for working-age couples with children, with those on lower-incomes benefiting most.
In terms of geographic impact, an increase in the carbon tax would disproportionately affect those living in rural areas, with or without any compensation measures. However, as Bercholz and Roantree (2019) showed, this is driven by the particularly large effects on those living in rural areas who commute long distances to work by car. Given the ongoing pandemic and public health advice to work from home where possible, such differential impacts may be moderated by a reduction in long-distance commuting by car.
Owner-occupiers would also be more adversely affected by the increase in carbon tax, with or without compensation. Renters – both in the private and social sector – would be left on average better-off by those measures which raised the personal rate of working-age benefit payments or Increases for Qualified Children (Reforms A, C, E and F). This is because those renting are disproportionately likely to be in receipt of a social welfare payment.
Finally, Table 3.1 shows that while the impact of an uncompensated increase in the carbon tax is broadly similar across small and large households, the compensation measures have very different effects. Reforms which include raising Increases for Qualified Children (A, F and G) would leave 5+ person households on average better-off while those that involve increasing the Fuel Allowance or Living Alone Increase (B and E) would leave single adult households better off.

Retrofitting | 17
CHAPTER 4
Retrofitting
The Programme for Government also proposes allocating €5 billion from the €9.5 billion in additional revenue that will be raised by increases to the carbon tax to part fund a ‘socially progressive national [housing] retrofitting programme’. The expansion of existing support programmes for residential energy efficiency retrofits will help address a significant challenge for the residential sector of substantially reducing its emissions of carbon dioxide (CO2). Currently, in excess of 6 million tonnes per annum, or a 15 per cent share of total national CO2 emissions, are linked to the residential sector.15 Improvements in building energy efficiency should lead to a reduction in fuel consumption necessary to heat homes. Where a carbon tax is an incentive to curtail fossil fuel consumption (and choose low-carbon alternatives), a retrofit grant scheme is an incentive to reduce the quantity of energy necessary to heat homes (and thereby reduce the level of carbon taxation where fossil fuels are consumed). The equity impacts of the combined effects of both a carbon tax increase and an expanded national housing retrofitting programme are much more difficult to discern. The Sustainable Energy Authority of Ireland (SEAI) already administers energy efficiency retrofit schemes targeted at families across the income distribution. A relevant policy question is the extent to which such schemes are equitable in terms of access and benefits? Equally important is understanding what will be the return on €5 billion public investment in residential energy efficiency? Will it be enough to deliver on Climate Action Plan commitments in relation to home retrofits, and ultimately what will be the impact on fuel consumption and emissions? Prior research on existing retrofit programmes administered by the Sustainable Energy Authority of Ireland (SEAI) provides some insight on these issues.
4.1 HOME RETROFITS: SCOPE AND DEPTH
An issue with all government support schemes is understanding who avails of the support and whether the recipients are broadly representative of the target audience. Based on the Climate Action Plan, the policy aim is for housing units to upgrade to Building Energy Rating (BER) B2 standard. Overall, the Irish residential building stock has a relatively low energy efficiency. Over half of the Irish residential building stock is below C3 grade and over one-quarter of properties are classified within the four lowest energy efficiency grades, so the potential target audience of properties for the grant programme is quite broad.16 Not only does the housing stock have a relatively low energy efficiency, there is a correlation between the least energy efficient properties and specific occupant and tenure
15 See spreadsheet download associated with EPA report Ireland’s Final Greenhouse Gas Emissions 1990-2018 at http://www.epa.ie/pubs/reports/air/airemissions/ghg2018.
16 See Table 15 of the CSO’s Domestic Building Energy Ratings statistics, available at https://www.cso.ie/en/releasesandpublications/er/dber/domesticbuildingenergyratingsquarter22020.

18 | Carbon taxes, poverty and compensation options
types. People living in the four lowest energy efficiency grades, comprising grades E1, E2, F and G, are more likely to be older (75+), disabled or have no occupants in gainful employment (Curtis et al., 2015). Furthermore, rental properties – especially low value rentals – have a higher likelihood of being in the EFG categories, many of which are in public sector ownership (ibid). Any expansion in the grant programmes needs to be mindful that the most energy inefficient properties are owned or occupied by families with limited financial resources.
The presence of energy efficiency grant schemes encourages engagement in retrofit activities but not universally across the housing stock. The design of the grant scheme itself may represent barriers to engagement. For example, applicants to the Better Energy Homes scheme between 2009 and 2015 seeking to undertake ‘deeper’ retrofits are more likely to abandon their application, possibly due to administrative and logistical burdens (Collins and Curtis, 2017). Even where retrofits are cost free to the occupants and managed by the landlord, a fraction of rental tenants are reluctant to participate in home retrofits that ultimately will provide benefits to the tenants in terms of improved comfort and lower energy costs (Coyne et al., 2018). However, preliminary findings of ongoing research at ESRI related to the Better Energy Warmer Homes, which is a 100 per cent funded retrofit grant scheme for qualifying disadvantaged households, finds that the probability of abandonment of a retrofit application declines as the intensity of retrofit increases.
4.2 HOME ENERGY RETROFIT COSTS
There is no simple answer to the question of how much an energy efficiency retrofit costs. It varies depending on the number of retrofit measures installed, the building type, the existing energy efficiency status, and the size of the property, among other factors. Data from existing grant schemes provide some insight on average costs. For example, Table 4.1 outlines mean retrofit costs for some selected retrofit measures. Data on costs for other measures are not publicly available, though the measures included in Table 4.1 represent approximately 25 per cent of retrofit grants within the Better Energy Homes scheme, while the combination of attic and cavity insulation represents a further 50 per cent of grants (Mac Uidhir et al., 2020).
What is noticeable from the Better Energy Homes data is that most retrofits can be categorised as shallow rather than deep retrofits. For instance, over 90 per cent of grant applications are for one or two measures only (Collins and Curtis, 2016; 2017), and just over 50 per cent are for attic and cavity insulation (Mac Uidhir et al., 2020). While the figures in Table 4.1 provide indicative costs of specific retrofit measure combinations, the scale of cost associated with achieving a B2 BER status is likely to be substantially higher. Within the Better Energy Homes scheme, the

Retrofitting | 19
mean cost per unit BER improvement (incl. grant) is €72.60/kWh/m2/year across all retrofit measures, property types, and property sizes (Collins and Curtis, 2017). Using this as a rule of thumb, the estimated cost of upgrading a property from the E, F or G BER grades to B2 status could exceed €18,000, though likely to be substantially higher.17 Across 461 homes retrofitted within the SEAI’s Deep Retrofit Pilot Programme retrofits, the average cost to upgrade a home from an average BER rating of F to an average A3 rating is €58,722.18
TABLE 4.1 MEAN RETROFIT COSTS, BETTER ENERGY HOMES (SELECTED MEASURES)
Number of Households
BER Improvement kWh/m2/yr
Total cost of retrofit €
Boiler with Heating Controls* 21,535 96 3,456 Heating Controls only 2,346 55 1,500 Solar Collector 3,800 34 5,897 Boiler w/ Heating Con., Solar* 376 99 8,452 Heating Controls, Solar 397 56 7,066
Source: Collins and Curtis (2018) based on Better Energy Homes administrative data. Note: * Fossil fuel boiler replacement grants under the Better Energy Homes scheme have been discontinued.
4.3 CHANGES IN HOME ENERGY EFFICIENCY, ENERGY USE AND EMISSIONS
While energy efficiency retrofit programmes are primarily policy responses to energy efficiency and climate emissions targets, they have wider social benefits, particularly with respect to improving living conditions. Energy efficiency retrofit programmes can potentially reduce the incidence of energy poverty, though as discussed in Chapter 3 and argued by Watson and Maître (2015), there is a strong case that energy poverty is not a distinct type of deprivation in Ireland and that ‘its solution lies in understanding and addressing the constellation of factors that erode a household’s material well-being’ more generally. Additionally, Tovar-Reaños and Lynch (2020) find that expenditure-based energy poverty metrics perform poorly both in measuring baseline rates of energy poverty and in capturing any changes to energy poverty from carbon taxation.
Irrespective of the merits of energy efficiency retrofit grants on alleviating energy poverty, it is instructive to assess the impact of energy efficiency measures on energy use and associated emissions. In practice there is not an equivalent improvement in energy consumption (and emissions) following an energy efficiency enhancement due to the rebound effect, defined by Sorrell et al. (2009) as ‘any increase in energy service consumption [that] will reduce the ‘energy
17 The rule of thumb calculation assumes the efficacy of individual measures within shallow retrofits, on which the cost figures are estimated, will be the same in deep retrofits. This is unlikely to be the case as the marginal cost of achieving BER improvements is likely to be substantially higher as the BER value (kWh/m2/year) declines.
18 See https://www.seai.ie/grants/home-energy-grants/deep-retrofit-grant/key-findings.
20 | Carbon taxes, poverty and compensation options
savings’ achieved by the energy efficiency upgrade’. A rebound in energy consumption can be attributed to several reasons, including the difference between actual savings and those predicted from engineering models; a change in mean internal temperature after retrofit; and due to changes in user behaviour. In many instances rebound effects may reflect prior deprivations, such as inadequate heating, and therefore rebound effects are desirable policy outcomes (Ryan and Campbell, 2012).
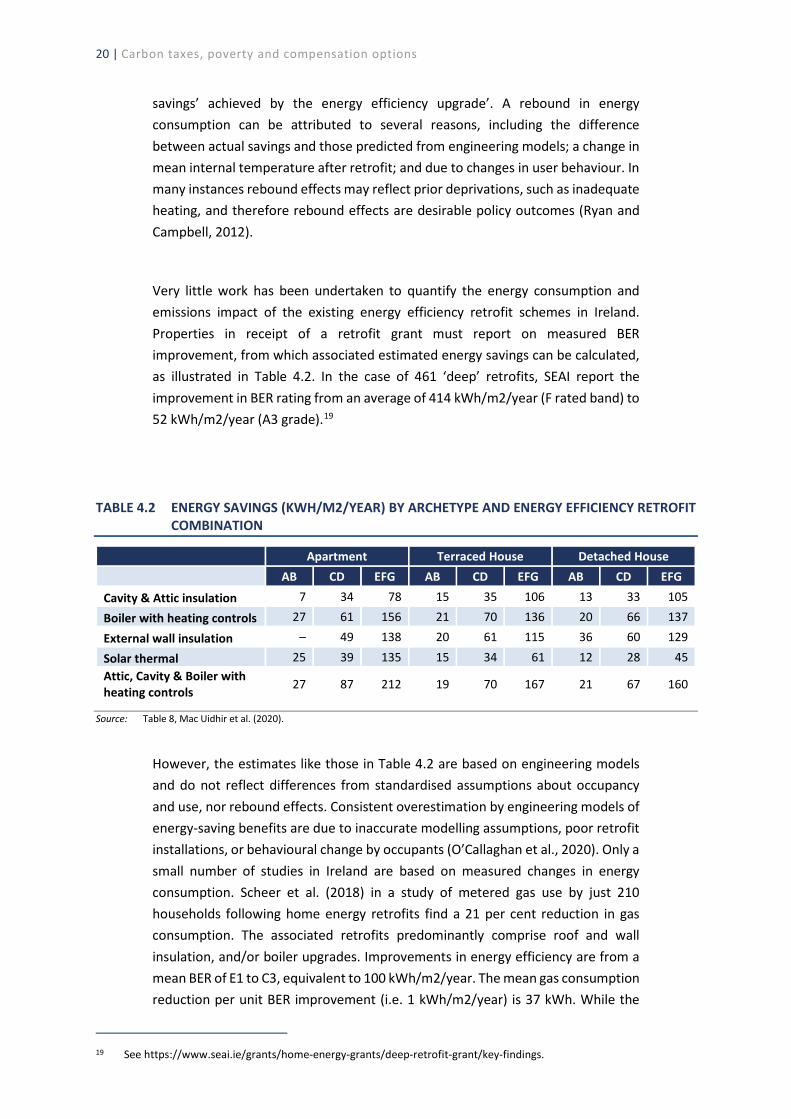
Very little work has been undertaken to quantify the energy consumption and emissions impact of the existing energy efficiency retrofit schemes in Ireland. Properties in receipt of a retrofit grant must report on measured BER improvement, from which associated estimated energy savings can be calculated, as illustrated in Table 4.2. In the case of 461 ‘deep’ retrofits, SEAI report the improvement in BER rating from an average of 414 kWh/m2/year (F rated band) to 52 kWh/m2/year (A3 grade).19
TABLE 4.2 ENERGY SAVINGS (KWH/M2/YEAR) BY ARCHETYPE AND ENERGY EFFICIENCY RETROFIT COMBINATION
Apartment Terraced House Detached House AB CD EFG AB CD EFG AB CD EFG
Cavity & Attic insulation 7 34 78 15 35 106 13 33 105
Boiler with heating controls 27 61 156 21 70 136 20 66 137
External wall insulation – 49 138 20 61 115 36 60 129
Solar thermal 25 39 135 15 34 61 12 28 45 Attic, Cavity & Boiler with heating controls 27 87 212 19 70 167 21 67 160
Source: Table 8, Mac Uidhir et al. (2020).
However, the estimates like those in Table 4.2 are based on engineering models and do not reflect differences from standardised assumptions about occupancy and use, nor rebound effects. Consistent overestimation by engineering models of energy-saving benefits are due to inaccurate modelling assumptions, poor retrofit installations, or behavioural change by occupants (O’Callaghan et al., 2020). Only a small number of studies in Ireland are based on measured changes in energy consumption. Scheer et al. (2018) in a study of metered gas use by just 210 households following home energy retrofits find a 21 per cent reduction in gas consumption. The associated retrofits predominantly comprise roof and wall insulation, and/or boiler upgrades. Improvements in energy efficiency are from a mean BER of E1 to C3, equivalent to 100 kWh/m2/year. The mean gas consumption reduction per unit BER improvement (i.e. 1 kWh/m2/year) is 37 kWh. While the
19 See https://www.seai.ie/grants/home-energy-grants/deep-retrofit-grant/key-findings.

Retrofitting | 21
Scheer et al. (2018) study relates to owner-occupied housing, Beagon et al. (2018) estimate a 14 per cent reduction in gas consumption following deep energy efficiency retrofits by a social housing landlord. A separate study in a social housing setting find 23 per cent and 12 per cent reductions in gas and electricity consumption across 20 households following energy efficiency retrofits (Rau et al., 2020). Across these three Irish empirical studies there is considerable variability in the measured impacts on energy consumption and in all three cases the underlying data samples are quite small so it is difficult to extrapolate the findings to estimate the change in energy consumption due to an expanded retrofit programme within the wider stock of either social or private housing. Furthermore, these studies have focused on networked fuels only. The impact on solid fuel consumption, which can be in excess of one-third of total energy expenditure, on average, within Irish households (Curtis and Pentecost, 2015), has not been considered. Coyne et al. (2018) note that while many social housing households reduced their use of secondary fuels following retrofit, self-reported purchases of coal and other fuels remained surprisingly high in the first year post retrofit. This suggests that households may need some time to gauge the thermal efficiency impact of retrofits and adopt new energy use behaviours. Both Scheer et al. (2018) and Coyne et al. (2018) estimate the shortfall between actual energy savings and technical potential savings based on engineering models, in social and private housing contexts. The shortfall in the private housing sample is 36 per cent compared to 67 per cent (i.e. a lower level of energy savings) among the social housing sample. These findings caution against using ex-ante engineering models to estimate potential energy use savings but also suggest that the impact on energy consumption is likely to exhibit substantial variance across the housing stock.
Current grant schemes, particularly where there is applicant co-funding, are designed to cover a percentage of the total cost of retrofitting. Grants are essentially provided for the purchase and installation of equipment and materials, irrespective of the net energy efficiency outcome. This leads to significant variation in the level of grant aid provided relative to the energy efficiency improvement gained. Across five years of the Better Energy Home scheme, grant aid per unit energy efficiency improvement ranges from €0.62/kWh/m2/year to €4,545/kWh/m2/year with a mean of €20.96/kWh/m2/year (Collins and Curtis, 2017). Using this as a metric, some grants constitute relatively poor value for money from the perspective of the Exchequer. Mac Uidhir et al. (2020) demonstrate that households systematically do not prioritise the most energy efficient retrofit measures when upgrading their homes, suggesting that efficiency gains of up to 86 per cent can be achieved with alternative retrofit choices. Incentives within retrofit grant schemes should be aligned such that award of grant aid is based on verified energy efficiency improvement, i.e. improvement in BER rating. Such an approach may encourage more considered investment and avoid measures that may be unnecessary from an energy efficiency perspective.

22 | Carbon taxes, poverty and compensation options
None of the studies cited above consider the impact of an energy efficiency retrofit on household energy expenditure. Curtis and Pentecost (2015) examine fuel expenditure levels across households with different BER ratings. They estimate that each one point improvement along the 15-point BER scale is associated with a 1.6 per cent reduction in energy expenditure. In absolute terms, mean energy expenditure savings per BER increment are €30, though range between €2 and €636 per annum. This estimate refers to expenditure on all fuels (i.e. gas, oil, electricity and solid fuels). On a proportionate basis the reduction in expenditure is less that the reduction in single fuel use (e.g. gas) from the studies cited above. For instance, when applying the methodology from Curtis and Pentecost (2015) to a change in BER rating from E1 to C3, i.e. the mean BER improvement in Scheer et al. (2018), the estimate of associated difference in gas expenditure is -9 per cent, while the difference in expenditure on all fuels is -5 per cent, both substantially lower than the -21 per cent in gas consumption in Scheer et al. (2018). One possible explanation is that the Curtis and Pentecost (2015) analysis is based on a large nationally representative sample of households (N=5,872) undertaken by the Central Statistics Office, whereas the studies cited above are based on small, unrepresentative samples (N<210).
As the studies by Scheer et al. (2018), Beagon et al. (2018) and Rau et al. (2020) estimate changes in gas consumption levels, and electricity in the case of Rau et al. (2020), the proportionate changes in CO2 emissions for these fuels are the same as for fuel consumption. Separate from the issue that these estimates might not be representative of the wider housing stock, the estimates relate to a single energy source rather that total household emissions. During energy efficiency retrofits, not only are heating systems upgraded but some households switch heating fuels. For example, in a survey of heating system upgrades, 19 per cent of those switching to an oil-fired system had previously used solid fuels (i.e. coal or peat), whereas those switching to gas, 37 per cent had previously used oil or solid fuels (Curtis et al., 2018). Fuel switching in the context of heating system or energy efficiency retrofits can lead to substantial emission savings (Curtis et al., 2020; McCoy and Curtis, 2018). In the context of available evidence from existing energy efficiency retrofit programmes it is not possible to estimate the impact on net CO2 emissions from households. To have a good understanding of how energy efficiency retrofits impact on fuel demand, expenditure and emissions necessitates a broad-based study across different housing types (e.g. apartments, terraced, houses), building vintages, and occupant characteristics (e.g. owner/rental, urban/rural, income, occupational status, etc). Most studies to date have been limited in scale, partly due to the difficulty in accessing suitable samples. Consideration should be given to developing a large bespoke research dataset that can be used to inform policy development by combining administrative datasets on energy use (e.g. utility bills) with data on building attributes and occupant characteristics.

Conclusion | 23
CHAPTER 5
Conclusion
This paper has examined how the Irish carbon tax can be raised without disproportionately affecting low-income households and increasing poverty. It showed that poverty can in fact be reduced and the lowest-income fifth of households left better-off using a third of revenues from a carbon tax rise on targeted increases in welfare payments, as proposed in the recent Programme for Government. This reverses the regressive impact of an uncompensated carbon tax rise, which arises because goods subject to the carbon tax make up a larger share of spending for lower- than higher-income households.
The lowest-income fifth of households is heavily comprised of working-age adults in receipt of social welfare payments and their dependents. These can be compensated for a rise in the carbon tax through increases in the maximum rates of the main working-age welfare payments, or raising Increases for Qualified Children (IQCs) paid alongside these benefits to those with dependent children. We show that doing so using a third of the €159 million Revenue estimate a €7.50 per tonne carbon tax increase raises would reduce the overall poverty rate by 0.2 percentage points (ppts) and leave the lowest-income fifth of households on average better-off. Using the revenue to increase IQCs would reduce the child poverty rate by twice that (0.4ppts): a substantial reduction given Regan and Maître (2020) estimate child poverty could rise by 1.4ppts this year because of pandemic related job losses, even with some recovery.
Policymakers may also be concerned about the impact an uncompensated carbon tax rise will have on single adults living alone. Using a third of revenues to raise the Fuel Allowance or Living Alone Increase is well targeted at compensating such households, though would not on its own reverse the regressive impact of a carbon tax rise. This is because much of the gain from such benefits go to households around the middle rather than the bottom of the income distribution, reflected in lower rates of poverty among retired adults than working-age adults or children. However, using one-third of the revenue to fund a combined increase in IQCs and these benefits would be both progressive and poverty reducing.
There will of course still be some who lose under the reforms examined in this paper, even among those groups that are left on average better-off. Such impacts are inevitable with any tax reform and while ultimately it is a political decision as to who should gain and who should lose, this paper provides evidence on how such impacts can be mitigated and even offset using just a third of revenues raised by a carbon tax rise. It does so using the latest version of SWITCH – the ESRI’s tax and benefit microsimulation model – which has been updated so that the sample of

24 | Carbon taxes, poverty and compensation options
households it runs on is representative of the 2020 population post-COVID related job losses. Previous work has shown that the same outcome can be achieved in more normal times without exhausting revenues raised by the tax, through a combination of social welfare increases and tax cuts (Bercholz and Roantree, 2019; Tovar-Reaños and Lynch, 2019; Callan et al., 2009; Healy, 2003; Clinch and Healy, 2000).
The government has proposed allocating most of the remaining revenue raised by increases to the carbon tax towards a housing energy efficiency retrofit programme. While this spending is likely to reduce household energy consumption – particularly for those in the least energy efficient houses – based on existing research it is difficult to assess the likely impacts in terms of energy consumption, emissions, or the equity implications of spending an additional €5 billion on energy efficiency retrofits. Research evidence based on existing energy efficiency grant schemes is that grant schemes do encourage people to invest in their homes, and that energy efficiency improves but there is significant variation in the level of grant aid provided relative to the energy efficiency gain. An additional €5 billion allocation to residential energy efficiency is considerable but the cost of noticeably improving the energy efficiency of the housing stock (the policy aim within the Climate Action Plan is to achieve a B2 BER standard) is likely to be many multiples higher (and co-funded by homeowners). It is important that incentives for homeowners within a grant scheme be aligned with policy objectives, i.e. grant payments in lieu of measured improvements in energy efficiency. Improvements in energy efficiency will reduce energy consumption and associated emissions but there is limited research to quantify the likely differences across building types, construction standards, regional variations and socio-economic dimensions, including income. It would be prudent that evaluation of grant programme effectiveness, including collection of relevant information to enable strong quantitative assessments, be incorporated into new programme funding. Allocating just a small fraction of the proposed budget for ongoing evaluation of the programme would help ensure the programme can continually evolve to maximise efficiency gains.

References | 25
REFERENCES
Andersson, J. (2019). ‘Carbon Taxes and CO2 Emissions: Sweden as a Case Study’, American Economic Journal: Economic Policy, 11 (4): 1-30.
Baumol, W.J. and W.E. Oates (1971). ‘The use of standards and prices for protection of the environment’, Swedish Journal of Economics, Vol. 71, No. 1, pp. 42-54.
Beagon, P., F. Boland and J. O’Donnell (2018). ‘Quantitative evaluation of deep retrofitted social housing using metered gas data’, Energy and Buildings, 170, 242-256. https://doi.org/10.1016/j.enbuild.2018.04.022.
Bercholz, M. & B. Roantree (2019). Carbon taxes and compensation options. Budget Perspectives 2020 Paper 1. Dublin: Economic and Social Research Institute.
Beirne, K., K. Doorley, M. Regan, B. Roantree and D. Tuda (2020). The potential costs and distributional effect of Covid-19 related unemployment in Ireland. Budget Perspectives 2021 paper 1. Dublin: Economic and Social Research Institute.
Bergin, A., J. FitzGerald and I. Kearney (2004). The macro-economic effects of using fiscal instruments to reduce greenhouse gas emissions, Wexford: Environmental Protection Agency.
Best, R., P.J. Burke and F. Jotzo (2020). ‘Carbon Pricing Efficacy: Cross-Country Evidence’, Environ Resource Econ. 77, 69-94. https://doi.org/10.1007/s10640-020-00436-x
Callan, T., S. Lyons, S. Scott, R.S.J. Tol and S. Verde (2009). ‘The distributional implications of a carbon tax in Ireland’, Energy Policy, Vol. 37, No. 2, pp. 407-412.
Clinch, J.P. and J.D. Healy (2000). ‘Cost-benefit analysis of domestic energy efficiency’, Energy Policy, Vol. 29, No. 2, pp. 113-124.
Coffey, C., K. Doorley, C. O’Toole and B. Roantree (2020). The effect of the COVID-19 pandemic on consumption and indirect tax in Ireland, Budget Perspectives 2021 Paper 3. Dublin: Economic and Social Research Institute.
Collins, M. and J. Curtis (2016). An examination of energy efficiency retrofit depth in Ireland. Energy and Buildings, 127:170-182. http://doi.org/10.1016/j.enbuild.2016.06.012.
Collins, M. and J. Curtis (2017). ‘An examination of the abandonment of applications for energy efficiency retrofit grants in Ireland’, Energy Policy, 100:260-270. http://doi.org/10.1016/j.enpol.2016.10.030.
Collins, M. and J. Curtis (2018). ‘Willingness-to-pay and free-riding in a national energy efficiency retrofit grant scheme’, Energy Policy, 118:211-220. https://doi.org/10.1016/j.enpol.2018.03.057.
Conefrey, T., J.D. FitzGerald, L. Malaguzzi Valeri and R.S.J. Tol (2013). ‘The impact of a carbon tax on economic growth and carbon dioxide emissions in Ireland’, Journal of Environmental Planning and Management, Vol. 56, No. 7, pp. 934-952.
Coyne, B., S. Lyons and D. McCoy (2018). ‘The effects of home energy efficiency upgrades on social housing tenants: evidence from Ireland’, Energy Efficiency, 11:2077-2100 https://doi.org/10.1007/s12053-018-9688-7.

26 | Carbon taxes, poverty and compensation options
Curtis, J., N. Devitt and A. Whelan (2015). ‘Using census and administrative records to identify the location and occupancy type of energy inefficient residential properties’, Sustainable Cities and Society, 18:56-65. http://doi.org/10.1016/j.scs.2015.06.001.
Curtis, J., D. McCoy and C. Aravena (2018). ‘Heating system upgrades: The role of knowledge, socio-demographics, building attributes and energy infrastructure’, Energy Policy, 120:183-196. https://doi.org/10.1016/j.enpol.2018.05.036.
Curtis, J. and A. Pentecost (2015). ‘Household fuel expenditure and residential building energy efficiency ratings in Ireland’, Energy Policy, 76:57-65. http://doi.org/10.1016/j.enpol.2014.10.010.
Curtis, J., M.A. Tovar and G. Grilli (2020b). ‘Access to and consumption of natural gas: spatial and socio-demographic drivers’, Energy Policy, 143. https://doi.org/10.1016/j.enpol.2020.111614.
De Agostini, P., B. Capéau, A. Decoster, F. Figari, J. Kneeshaw, C. Leventi, K. Manios, A. Paulus, H. Sutherland and T. Vanheukelom (2017). EUROMOD extension to indirect taxation: final report. EUROMOD Technical Note EMTN, 3.
de Bruin, K.C. and A.M. Yakut (2018). The economic and environmental impacts of increasing the Irish carbon tax, Research Series No. 79, The Economic and Social Research Institute, Dublin.
de Bruin, K.C. and A.M. Yakut (2019). ‘The effects of an incremental increase in the Irish carbon tax towards 2030’. ESRI Working Paper No. 619, Dublin: The Economic and Social Research Institute.
de Bruin, K.C. and A.M. Yakut (2019b). Construction of the Energy Social Accounting Matrix for Ireland. ESRI Survey and Statistical Report Series No. 78, Dublin: The Economic and Social Research Institute.
de Bruin, K.C., E. Monaghan and A.M. Yakut (2019c). The economic and distributional impacts of an increased carbon tax with different revenue recycling schemes. ESRI Research Series No. 95. Dublin: The Economic and Social Research Institute.
Department of Communications, Climate Action and Environment (2014). National policy position on climate action and low carbon development. Dublin: DCCAE.
Department of Communications, Energy and Natural Resources (2011). Warmer Homes: a Strategy for Affordable Energy in Ireland. Dublin: Department of Communications, Energy and Natural Resources.
Department of Communications, Energy and Natural Resources (2016). A strategy to combat energy poverty: 2016-2019, Dublin: Department of Communications, Energy and Natural Resources.
Di Cosmo, V. and M. Hyland (2013). ‘Carbon tax scenarios and their effects on the Irish energy sector’, Energy Policy, 59: 404-414.
FitzGerald, J., J. Hore and I. Kearney (2002). ‘A model for forecasting energy demand and greenhouse gas emissions in Ireland’, Working Paper 146, Dublin: The Economic and Social Research Institute.
FitzGerald, J. and D. McCoy (1992). The economic effects of carbon taxes. Dublin: The Economic and Social Research Institute.

References | 27
Goulder, L.H., M.A.C. Hafstead, G. Kim and X. Long (2018). ‘Impacts of a carbon tax across US household income groups. What are the equity–efficiency trade-offs?’, Working Paper No. 25181, Cambridge, MA: National Bureau of Economic Research.
Government of Ireland (2007). Programme for Government: 2007-2012, Dublin: Government of Ireland.
Government of Ireland (2011). The National Recovery Plan: 2011-2014, Dublin: Government of Ireland.
Government of Ireland (2015). Climate Action and Low Carbon Development Act 2015, Dublin: Government of Ireland.
Government of Ireland (2018). Draft National Energy & Climate Plan (NECP) 2021-2030, Dublin: Government of Ireland.
Government of Ireland (2020). Programme for Government: Our Shared Future, Dublin: Government of Ireland.
Healy, J. (2003). ‘Fuel poverty and policy in Ireland and the European Union’, Studies in Public Policy, Dublin: The Policy Institute at Trinity College Dublin and Combat Poverty Agency.
Horowitz, J., J.-A. Cronin, H. Hawkins, L. Konda and A. Yuskavage (2017). ‘Methodology for analyzing a carbon tax’, OTA Working Paper No. 115, Washington, DC: Office of Tax Analysis.
IPCC (2014). Climate change 2014: synthesis report, Geneva: IPCC.
IPCC (2018). Global warming of 1.5 °C: an IPCC Special Report on the impacts of global warming of 1.5°C above pre-industrial levels and related global greenhouse gas emission pathways, in the context of strengthening the global response to the threat of climate change, sustainable development, and efforts to eradicate poverty, Geneva: World Meteorological Organization.
Mac Uidhir, T., F. Rogan, M. Collins, J. Curtis and Ó. Gallachóir (2020). ‘Improving energy savings from a residential retrofit policy: a new model to inform better retrofit decisions’, Energy and Buildings, 209. https://doi.org/10.1016/j.enbuild.2019.109656.
McCoy, D. and J. Curtis (2018). ‘Exploring the spatial and temporal determinants of gas central heating adoption’, Resource and Energy Economics, 52:64-86. https://doi.org/10.1016/j.reseneeco.2017.12.004.
Metcalf, G.E. (2019). On the economics of a carbon tax for the United States, BPEA Conference Draft, Washington, DC: The Brookings Institution.
Metcalf, G.E. and J.H. Stock (2020). ‘Measuring the Macroeconomic Impact of Carbon Taxes’, AEA Papers and Proceedings, 110: 101-06.
Nordhaus, W.D. (2007). ‘A review of the Stern Review on the Economics of Climate Change’, Journal of Economic Literature, Vol. 45, No. 3, pp. 686-702.
O’Callaghan, A., K. Purcell and P. Hemmingway (2020). Proceedings of the Institution of Civil Engineers – Energy, 173:2, 49-59. https://doi.org/10.1680/jener.19.00043
28 | Carbon taxes, poverty and compensation options
O’Donoghue, C. (1997). ‘Carbon dioxide, energy taxes and household income’. ESRI Working Paper No. 90, The Economic and Social Research Institute, Dublin.
Pearson, M. and S. Smith (1991). The European carbon tax: an assessment of the European Commission’s proposals, London: The Institute for Fiscal Studies.
Rau, H., P. Moran, R. Manton and J. Goggins (2020). ‘Changing energy cultures? Household energy use before and after a building energy efficiency retrofit’, Sustainable Cities and Society, 54, https://doi.org/10.1016/j.scs.2019.101983.
Rausch, S., G.E. Metcalf and J.M. Reilly (2011). ‘Distributional impacts of carbon pricing: a general equilibrium approach with micro-data for households’, Energy Economics, Vol. 33, pp. S20-S33.
Regan, M. and B. Maître (2020). Child poverty in Ireland and the pandemic recession, Papers BP2021/4, Dublin: Economic and Social Research Institute (ESRI).
Runst, P. and A. Thonipara (2020). ‘Dosis facit effectum why the size of the carbon tax matters: Evidence from the Swedish residential sector’, Energy Economics, 91, 104898.
Ryan, L. and N. Campbell (2012). ‘Spreading the Net: The Multiple Benefits of Energy Efficiency Improvements’, IEA Energy Papers, No. 2012/08, OECD Publishing, Paris, https://doi.org/10.1787/5k9crzjbpkkc-en.
Savage, M. (2017). ‘Integrated modelling of the impact of direct and indirect taxes using complementary datasets’, The Economic and Social Review, 48(2, Summer), 171-205.
Scheer, J., M. Clancy, S. Ní Hógáin, B. Coyne, S. Lyons and D. McCoy (2018). ‘The effects of home energy efficiency upgrades on social housing tenants: evidence from Ireland’, Energy Efficiency, 11:2077-2100 https://doi.org/10.1007/s12053-018-9688-7.
Scott, S. (1992). ‘Theoretical considerations and estimates of the effects on households’, The economic effects of carbon taxes, Dublin: The Economic and Social Research Institute.
Scott, S., S. Lyons, C. Keane, D. McCarthy and R.S.J. Tol (2008). ‘Fuel poverty in Ireland: extent, affected groups and policy issues’, Working Paper No. 262, Dublin: The Economic and Social Research Institute.
Sorrell, S., J. Dimitropoulos and M. Sommerville (2009). ‘Empirical estimates of the direct rebound effect: a review’, Energy Policy, 37(4), 1356-1371. https://doi.org/10.1016/j.enpol.2008.11.026
Stern, N. (2006). Stern review on the economics of climate change, London: Government of the United Kingdom.
Tovar-Reaños, M.A. and M. Lynch (2019). ‘Carbon taxation in Ireland: distributional effects of revenue recycling policies’, ESRI Special Article, Dublin: The Economic and Social Research Institute.
Tovar-Reaños, M.A. and M. Lynch (2020). ‘Are energy poverty metrics fit for purpose? An assessment using behavioural microsimulation’. ESRI Working Paper 665, http://esri.ie/pubs/wp665.pdf

References | 29
Wagner, G. and M.L. Weitzman (2015). Climate shock: the economic consequences of a hotter planet, Princeton, NJ: Princeton University Press.
Watson, D. and B. Maître (2015). ‘Is fuel poverty in Ireland a distinct type of deprivation?’, The Economic and Social Review, 46(2): 267-291. http://hdl.handle.net/2262/71985.
Weitzman, M. (1974). ‘Prices vs. quantities’, Review of Economic Studies, Vol. 41, No. 4, pp. 477-491.


Appendix | 31
APPENDIX
TABLE A.1 SUMMARY STATISTICS FOR REPORTED AND SIMULATED FUEL EXPENDITURE (€/WEEK)
Gas Liquid Solid Petrol Diesel Total Mean
HBS 7.21 8.43 5.00 17.26 16.97 54.87 SILC 7.10 9.16 4.82 17.20 16.52 54.80 Variance HBS 176.74 273.26 181.07 607.03 977.84 2,094.95 SILC 114.24 146.21 45.46 398.66 601.01 1,890.12
Sources: Authors’ calculations using the 2015-2016 Household Budget Survey, 2017 Survey of Incomes and Living Conditions and SWITCH version 1.3.
TABLE A.2 MEAN REPORTED AND SIMULATED SPENDING ON FUELS (€/WEEK), SELECTED GROUPS
Category Gas Liquid Solid Petrol Diesel Total Tenure HBS Owned 7.23 10.18 5.51 18.32 20.49 61.74
Rented 7.32 3.51 3.59 14.48 7.26 36.17 Other 3.90 7.77 4.30 12.27 11.90 40.13
SILC Owned 7.05 11.07 5.45 18.24 19.29 61.10 Rented 7.06 3.11 3.91 12.94 6.36 33.38 Other 5.18 4.91 1.31 15.62 12.04 39.05
Household size HBS 1 5.26 6.79 4.23 9.06 5.36 30.69
2 7.01 9.05 5.86 16.95 13.89 52.77 3 7.57 7.91 5.06 20.50 21.23 62.28 4 8.94 9.09 4.14 21.88 23.99 68.02 5+ 8.54 9.66 5.30 22.68 30.75 76.92
SILC 1 3.93 6.35 3.51 7.98 4.83 26.61 2 6.34 10.58 5.99 16.44 15.37 54.72 3 9.31 9.55 5.60 22.10 23.37 69.93 4 10.18 10.17 4.97 25.56 25.90 76.78 5+ 9.98 11.07 5.62 25.23 27.97 79.86
Rural/Urban HBS Rural 9.61 5.97 3.78 16.65 11.95 47.96
Urban 1.78 14.02 7.75 18.63 28.38 70.56
SILC Rural 10.44 6.49 3.78 16.32 11.53 48.55 Urban 1.43 13.47 6.98 18.11 23.89 63.89
Sources: Authors’ calculations using the 2015-2016 Household Budget Survey, 2017 Survey of Incomes and Living Conditions and SWITCH version 1.3.

32 | Carbon taxes, poverty and compensation options
TABLE A.3 REPORTED AND SIMULATED CARBON TAX LIABILITIES AS A PERCENTAGE OF DISPOSABLE INCOME, BY INCOME DECILE
Gas %
Liquid %
Solid %
Petrol %
Diesel %
Total %
HBS 1 0.08 0.19 0.23 0.17 0.16 0.83 2 0.06 0.15 0.17 0.10 0.10 0.58 3 0.06 0.10 0.12 0.10 0.09 0.48 4 0.05 0.11 0.11 0.10 0.09 0.45 5 0.05 0.08 0.07 0.10 0.11 0.41 6 0.04 0.09 0.07 0.09 0.10 0.40 7 0.04 0.08 0.05 0.07 0.10 0.34 8 0.05 0.07 0.04 0.06 0.09 0.31 9 0.03 0.06 0.03 0.06 0.08 0.26 10 0.03 0.04 0.02 0.04 0.06 0.19 All 0.05 0.10 0.09 0.09 0.10 0.43 SILC 1 0.09 0.16 0.23 0.17 0.16 0.82 2 0.08 0.12 0.14 0.13 0.10 0.56 3 0.07 0.12 0.13 0.11 0.08 0.51 4 0.08 0.11 0.12 0.13 0.12 0.55 5 0.07 0.10 0.11 0.13 0.12 0.53 6 0.06 0.10 0.09 0.12 0.13 0.51 7 0.06 0.10 0.07 0.11 0.12 0.46 8 0.05 0.09 0.06 0.09 0.13 0.42 9 0.05 0.08 0.04 0.08 0.09 0.34 10 0.03 0.06 0.02 0.05 0.07 0.24 All 0.07 0.10 0.10 0.11 0.11 0.50
Sources: Authors’ calculations using the 2015-2016 Household Budget Survey, 2017 Survey of Incomes and Living Conditions and SWITCH version 1.3.

Whitaker Square, Sir John Rogerson’s Quay, Dublin 2Telephone +353 1 863 2000 Email [email protected] www.esri.ieTwitter @ESRIDublinISBN 978-0-7070-0545-4