Embed Size (px)
Citation preview

CARBON TAX POLICY
Economic Development and Growth in Ethekwini Seminar
Sharlin Hemraj, National Treasury , 15th October 2015

• Policy Context
– National Climate Change Response White Paper
– The National Development Plan
– Environmental Fiscal Reform
• GHG Emissions Profile of South Africa
• Options for intervention - rationale for a carbon price / tax
• Carbon tax design, carbon offsets & revenue recycling
• Alignment with carbon budgets / Desired Emission Reduction
Outcomes
• Summary of Carbon tax modelling studies
• Options for addressing competitiveness concerns
• Impact on energy prices & incentive for energy efficiency savings
• Summary
Outline

South Africa’s National Climate Change
Response White Paper, 2011
• South Africa‟s response to climate change has two objectives:
– Effectively manage inevitable climate change impacts through interventions
that build and sustain South Africa‟s social, economic and environmental
resilience and emergency response capacity.
– Make a fair contribution to the global effort to stabilise greenhouse gas
(GHG) concentrations in the atmosphere at the level that avoids dangerous
anthropogenic interference with the climate system within a timeframe that
enables economic, social and environmental development to proceed in a
sustainable manner.
• One of the elements in the overall approach to mitigation is: The deployment of
a range of economic instruments to support the system of desired emissions
reduction outcomes, including the appropriate pricing of carbon and
economic incentives, as well as the possible use of emissions offset or
emission reduction trading mechanisms …
3

South Africa’s response to its economic & social
challenges and to climate change
• South Africa voluntary committed (at COP 15 in 2009) to curb GHG emissions by
34% by 2020 and 42% by 2025 below the BAU trajectory with emissions peaking
in 2020 - 2025, stabilising in 2025 - 2035 and declining in absolute terms from
around 2035, subject to support from developed countries in the areas of climate
finance, capacity building & technology transfers.
• Promoting higher levels of economic growth & job creation are key policy
objectives
• However, economic growth since the great recession in 2008/09 has been
relatively weak
• So how do be balance the need for higher levels of growth and the energy &
carbon intensive nature of our economy with our desire and commitment to help
reduce GHG emissions.
• “the choices – the trade offs – we are told we must make between financial
success and environmental success, between doing well and doing good, are
just plain false (Confessions of a Radical Industrialist, Ray Anderson (with Robin
White, 2009) (page xv – xvi)”.

National Development Plan 2011:
on Climate Change
• “Emissions of carbon dioxide and other greenhouse gases are changing the
earth‟s climate, potentially imposing a significant global cost that will fall
disproportionately on the poor (p.35)”.
• “…. South Africa can manage the transition to a low-carbon economy at a pace
consistent with government‟s public pledges, without harming jobs or
competitiveness (p.51)”.
• “By 2015 … carbon-pricing mechanisms have been put in place (with appropriate
exemptions). These are supported by a wider suite of mitigation policy
instruments that target specific mitigation opportunities (p.214)”.
• “…. reduce carbon emissions from the electricity industry from 0.9kg per kilowatt-
hour to 0.6kg per kilowatt-hour”.
• “… it is possible to both reduce greenhouse gas emissions from electricity
production and still grow the minerals and mineral processing sectors”.
5

Environmental Fiscal Reform Policy
Paper (2006)
• An Environmental Fiscal Reform Policy Paper (published in April 2006 ) provides a foundation to build on and support environmentally related initiatives in South Africa.
• Maintenance of a coherent tax policy framework;
• Development of a coherent process and framework to consider and evaluate environmental taxes; and
• Consider both environmental and revenue outcomes and the “double-dividend” hypothesis.
6

Criteria / Design considerations for
environmentally related taxes
• Environmental effectiveness – linked to the environmental externality and aim for best design possible;
• Tax rate & revenue – tax rate to be phased-in, revenue use in terms of government priorities;
• Support for the tax – public support and acceptance is important (e.g. tax payer morality);
• Legal, technical & administrative feasibility: – Define taxable commodity - tax base; or nature of incentive;
– Setting the tax rate;
– Tax avoidance and evasion;
– Collection costs; and
– Compliance costs.
• Competitiveness impacts – may require phase in approach to allow adequate time for adjustments;
• Distributional impacts – compensating measures may need to be considered; and
• Adjoining policy areas – is the instrument capable of contributing to other social and economic objectives?
7

IEA: Estimated GHG { CO2e } emissions:
Sectoral Approach – Fuel combustion only
8
Mt of CO2: CO2 Sectoral Approach
Country 2010 2008
B People's Republic of China 23.84% 1 22.07% 1
United States 17.73% 2 18.95% 2
B India 5.37% 3 4.88% 4
B Russian Federation 5.22% 4 5.40% 3
Japan 3.78% 5 3.91% 5
Germany 2.52% 6 2.71% 6
South Korea 1.86% 7 1.70% 9
Canada 1.77% 8 1.87% 7
Islamic Republic of Iran 1.68% 9 1.69% 10
United Kingdom 1.60% 10 1.74% 8
Saudi Arabia 1.47% 11 1.31% 13
Mexico 1.38% 12 1.37% 12
Indonesia 1.36% 13 1.24% 17
Italy 1.32% 14 1.48% 11
B Brazil 1.28% 15 1.23% 18
Australia 1.27% 16 1.31% 14
France 1.18% 17 1.26% 16
B South Africa 1.15% 18 1.31% 15
Poland 1.01% 19 1.01% 21
Chinese Taipei 0.89% 20 0.89% 22
Spain 0.89% 21 1.08% 19
Ukraine 0.88% 22 1.05% 20
Turkey 0.88% 23 0.89% 23

CO2 emissions (metric tons per capita) in 2010
(WB, 2014)
9
0
2
4
6
8
10
12
14
16
18
20

GHG Inventory, 2010 – Estimates, DEA
10
2010: GHG Inventory (Estimates) -- Categories Emissions -
CO2 Eq (Gg)
Emissions -
CO2 Eq (Gg)
Total Emissions -
CO2 Eq (Gg)
Percentage
Contribution
1 - Energy 428 368 82.66%
A - Fuel Combustion Activities 402 817 77.73%
1.A.1.A - Electricity 236 798 45.69%
1.A.1.B - Petroleum Refining 2 284 0.44%
1.A.1.C - Manufacture of Liquid Fuels (Synfuel ) 28 611 5.52%
1.A.2 - Manufacturing Industries and Construction 41 117 7.93%
1.A.3 - Transport 47 607
Civil Aviation 3 670
Road Transport 43 440 8.38%
Rail Transport 497
1.A.4 - Other Sectors 44 684 8.62%
B - Fugitive emissions 25 551 4.93%
2 - Industrial Processes and Product Use 44 351 8.56%
2.A - Mineral Industry 4 793
Cement production 4 187
Lime production 502
Glass Production 104
2.B - Chemical Industry 1 011
2.C - Metal Industry 37 513
Iron and Steel Production 24 147
Ferroalloys Production 11 809
Aluminium production 1 468
3 - Agriculture, Forestry, and Other Land Use (25 714) (4.96%)
4 - Waste 19 806 3.82%
Total National Emissions and Removals 518 239 100.00%
International Bunkers 2 572

The Poverty Impacts of Climate Change, Economic
Premise, The World Bank, March 2011. Number 51
• Over the last century, the world has seen a sustained decline in the
proportion of people living in poverty. However, there is a growing
concern that climate change could slow or possibly even reverse
progress on poverty reduction.
• This concern is rooted in the fact than most developing countries are
more dependent on agriculture and other climate-sensitive natural
resources for income and wellbeing, and that they also lack sufficient
financial and technical capacities to manage increasing climate risk
(adaptation).
• Climate change is likely to lead not only to changes in the mean levels of
temperatures and rainfall, but also to a significant increase in the
variability of climate and in the frequency of extreme weather-related
shocks.
• ...much of the poverty impact is expected to be concentrated in Africa
and South Asia, both of which would see more substantial increases in
poverty relative to a baseline without climate change.
11

12
Externalities
• “Externalities refers to situations when the effect of production (and) or consumption of goods and services imposes costs or benefits on others which are not reflected in the prices charged for the goods and services being provided”.
• Positive externalities (“spillovers”) : Research & Development, Health, e.g. immunization, basic education, road safety, street lighting, energy efficiency savings, etc.
• Negative externalities (“spillovers”) : Local air pollution, noise, congestion, water pollution, GHG emissions – climate change, etc.

Options for Intervention
• Command-and-control measures (Regulations):
– Use of legislative or administrative regulations that prescribe certain
outcomes;
– Usually target outputs or quantity, e.g. minimum ambient air quality
standards, within which business must operate.
• Market-based instruments:
– Policy instruments that attempt to internalise environmental
externalities through the market by altering relative prices that
consumers and firms face;
– Utilise the price mechanism and complement command-and-control
measures. Under certain circumstances MBIs are considered more
efficient than command-and-control measures
13

Policy responses mitigation, Stern Review
• Carbon pricing is essential for climate change policy.
• Pricing carbon via taxes, tradable permits or regulation means that people bear the full social costs of their actions.
• Encourages firms and households to shift away from high carbon goods and services and to invest in low-carbon alternatives.
• However, range of other market failures and barriers means that carbon pricing alone is not enough.
• Technology policy is vital to bring forward the range of low carbon and high efficiency technologies to reduce emissions.
• A critical element is policies to remove barriers to behavioural change.
• Policies on regulation, information and financing are also important.

Fiscal policy to mitigate climate change:
A guide to policymakers. Michael Keen, Ian Parry and Ruud de Mooij (editors) IMF, 2012
• “.. carbon pricing should ideally form the centerpiece of mitigation efforts…”
• “Carbon pricing also strikes the cost-effective balance between different emission
reduction opportunities because all behavioral responses are encouraged up to
where the cost of the last tonne reduced equals the emissions price.
• Moreover, the carbon price provides a strong signal for innovations to improve
energy efficiency and reduce the costs of zero- or low-carbon technologies.
• By definition, regulatory policies on their own, like mandates for renewable fuel
generation and energy efficiency standards, are far less effective as they focus
on a much narrower range of emission reduction opportunities.
• A reasonable minimum price to aim for seems to be around $20 per tonne, under
either least-cost climate stabilization or damage valuation approaches.
• Establishing a credible time path for progressively rising carbon prices is also
important to create stable incentives for long-term, clean energy investments”.
15

Rationale for a carbon tax / price
• A carbon tax is a means by which government can intervene by way of a market
based instrument to appropriately take into account the social costs resulting
from carbon emissions.
• A carbon tax seeks to level the playing field between carbon intensive (fossil fuel
based firms) and low carbon emitting sectors (renewable energy and energy
efficient technologies).
• Although this option does not set a fixed quantitative limit to carbon emission
over the short term, a carbon tax at an appropriate level and phased in over time
to the “correct level” will provide a strong price signal to both producers and
consumers to change their behaviour over the medium to long term.
• “The introduction of a carbon price will change the relative prices of goods and
services, making emission-intensive goods more expensive relative to those that
are less emissions intensive. This provides a powerful incentive for consumers
and businesses to adjust their behaviour, resulting in a reduction of emissions”.
16

The Core Policy Mix – a carbon price, energy
efficiency and technology policies (IEA 2011)
17

Carbon Tax Policy Process
18
Environmental Fiscal Reform Policy Paper
(2006)
LTMS
(2007)
Carbon Tax
Discussion Paper
(Dec 2010)
NCCR- WP
(2011)
Carbon Tax
Policy Paper
(May 2013)
Carbon Offsets Paper
(April 2014)
Legislative Process & Alignment
with Carbon Budgets
(2015)
Carbon Tax
Implementation
(mid 2016)

Proposed carbon tax design features
• A carbon tax at R120 per ton of CO2e above the suggested thresholds
with annual increases of 10 per cent until 2019/20 is proposed as from
middle 2016 (1 July ?) .
• A basic tax-free threshold / allowance of 60 per cent is proposed.
• Additional tax-free allowance for process emission (10%)
• Additional relief for trade-exposed sectors (maximum 10%)
• A maximum 5% allowance for above average Performance – Z-factor
• Carbon budget allowance of 5%
• Carbon offsetting allowed to reduce carbon tax liability (5% or 10%)
• Tax-free thresholds will be reduced during the second phase (2020 to
2025) and may be replaced with absolute emission thresholds thereafter.
19

Overview of the proposed carbon tax policy
package
20
Revenue
Carbon tax at R120 per ton of CO2e
60% basic tax free allowance
5% tax free allowance for companies participating
in the carbon budget process
10% tax free allowance for trade exposure
10% tax free allowance for process emissions
5 or 10% allowance for Carbon Offsets
- Tax free allowance of between
60% and 95%.
This implies an effective
carbon tax rate of between
R6 and
R48 t/CO2e
Revenue Recycling
Energy Efficiency Savings tax incentive
Phasing down of the current electricity levy of 3.5 c/kWh
Credit against Eskom‟s carbon tax liability for the renewable energy premium built into the
electricity tariffs
Enhanced free basic electricity / energy for low income households
Improved public passenger transport

Proposed carbon tax design features: (2)
21
Sector Basic tax-free threshold
allowance (%)
Maximum additional allowance for trade exposure
(%)
Additional allowance
for process
emissions (%)
Additional allowance
for fugitive
emissions (%)
Carbon Budget
allowance (%)
Maximum offset
allowance (%)
Electricity 60 - - - 5 10 Petroleum (coal/gas to liquid)
60 10 - - 5 10
Petroleum – oil refinery
60 10 - - 5 10
Iron and steel 60 10 10 - 5 5
Cement 60 10 10 - 5 5 Glass and ceramics 60 10 10 - 5 5 Chemicals 60 10 10 - 5 5 Pulp and paper 60 10 - - 5 10 Sugar 60 10 - - 5 10 Agriculture, forestry, land use
100 - - - 0 0
Waste 100 - - - 0 0 Fugitive emissions – coal mining
60 10 - 10 5 5
Other 60 10 - - 5 10

22
Carbon Tax Design:
Tax Base Considerations (1)
• The carbon tax will cover all direct GHG emissions from
sources that are owned or controlled by the relevant entity
(Scope 1) emissions.
• These emissions relate to energy use (i.e. fuel combustion
and gasification) and non-energy industrial processes.
• For all stationary direct and process emission sources -
based on fuel inputs with approved emissions factors, or an
approved transparent and verified monitoring procedure.
• For non stationary ghg emissions (i.e. liquid / transport
fuels) the carbon tax to be incorporated into the current fuel
tax regime – an add on.

23
Carbon Tax Design:
Tax Base Considerations (2)
• Entities that engage in activities that produce direct GHG
emissions will be liable for the tax and will need to submit
their tax returns based on their own / self assessment of
emissions.
• Department for the Environment (DEA) is working on the
development of mandatory reporting requirements of
emissions in South Africa for economic sectors through the
National Atmospheric Emissions Inventory System (NAEIS),
which shall begin in January 2016.
• The NAEIS / DEA will help the verification process of the self
reported GHG emissions for the purpose of the carbon tax
liability. (for SARS‟ auditing purposes)

24
Revenue Recycling
• In general, “full” earmarking of specific tax revenue streams
are not in line with sound fiscal management practices.
However, the efficient recycling of revenue is important.
• Revenue recycling mechanisms for structural adjustment:
– tax shifting: reducing or not increasing other taxes
(phasing-down of the electricity levy)
– a range of environmental tax incentives, including Energy
efficiency savings tax allowance
– “soft” earmarking (on budget allocations): enhanced free
basic energy / electricity programme, improved public
transport, Carbon Capture and Storage rebate

The carbon offset component of the carbon tax has a dual purpose:
• To serve as a flexibility mechanism that will enable industry to deliver least
cost mitigation, i.e. mitigation at a lower cost to what would be achieved in
their own operations, and thereby lower their tax liability; and
Policy intent of carbon offsets scheme
25
• To incentivise mitigation in
sectors or activities that are
not directly covered by the
tax and/or benefiting from
other government
incentives, especially,
transport, AFOLU, waste.

Carbon offsetting under the carbon tax
• It is proposed that initially carbon credits developed under certain
internationally recognised carbon offset standards be permitted.
• A potential domestic standard would primarily cover the types of projects
that are not well catered for under international standards.
• A specific set of eligibility criteria for carbon offset projects has been
devised to ensure effective implementation of the offset mechanism:
– Projects that generate carbon offset credits must occur outside the
scope of activities subject to the carbon tax.
– Only South African based credits will be eligible for use within the
carbon offset scheme.
– Carbon offset projects registered and / or implemented before the
introduction of the carbon tax regime will be accepted subject to certain
conditions and within a specific timeframe.
– Lists of both eligible and ineligible projects should be introduced.
26

Alignment between DEROs / Carbon Budgets and the
Carbon Tax Design
• A process of aligning the carbon tax design and the DEROs/CBs is under
way and should be completed within the next few months.
• It is envisaged that during the first phase of the carbon tax (2016-2020)
the carbon budgets will be indicative.
• During this period, the total emissions minus all the relative tax free
thresholds (up to 90%) will be the reference point.
• During the subsequent tax phases (from 2021 onwards), the alignment
could be designed around carbon budgets as absolute thresholds
(absolute units of MtCO2-eq.), with the carbon tax applying to the
emissions above that level.
• The alternative would be migrate to a emissions trading scheme (after
say 2025) with the auctioning of allowances and some free allocations
based on benchmarking
.
27

Carbon / energy tax – modelling references
• Van Heerden, J., Gerlagh, R., Blignaut, J., Horridge, M., Hess, S., Mabugu, R. &
Mabugu, M. (2006). Searching for triple dividends in South Africa: Fighting CO2
pollution and poverty while promoting growth. The Energy Journal 27 (2): 113-
141.
• Pauw, K. (2007). Economy-wide modeling: An input into the Long Term
Mitigation Scenarios process, LTMS Input Report 4. Cape Town, Energy
Research Centre. http://www.erc.uct.ac.za/Research/LTMS/LTMS-intro.htm
• Kearny, M. (2008). Modelling the impact of CO2 taxes in combination with the
Long Term Mitigation Scenarios on emissions in South Africa using a dynamic
CGE model.
• Devarajan, S., Go, D.S., Robinson, S. & Thierfelder, K. (2009). Tax Policy to
Reduce Carbon Emissions In South Africa. Policy Research Working Paper
4933. World Bank
• Alton, T., Arndt, C., Davies, R., Hartley, F., Makrelov, K., Thurlow, J., & Ubogu,
M. (2012). The Economic Implications of Introducing Carbon Taxes in South
Africa. Working Paper No. 2012/46. UNU-WIDER
28
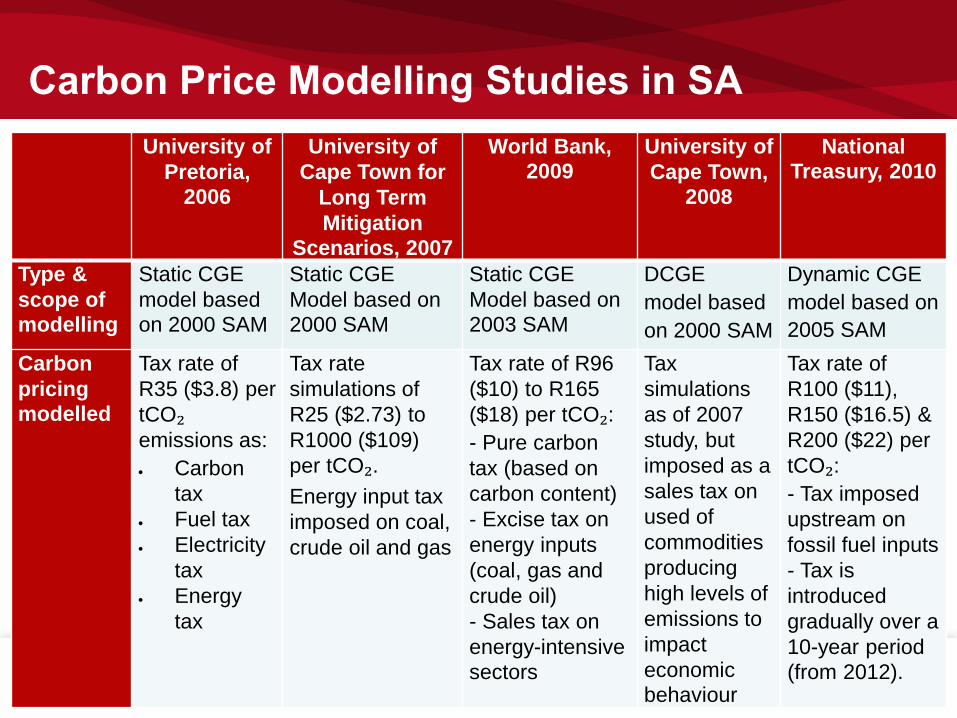
Carbon Price Modelling Studies in SA
29
University of
Pretoria,
2006
University of
Cape Town for
Long Term
Mitigation
Scenarios, 2007
World Bank,
2009 University of
Cape Town,
2008
National
Treasury, 2010
Type &
scope of
modelling
Static CGE
model based
on 2000 SAM
Static CGE
Model based on
2000 SAM
Static CGE
Model based on
2003 SAM
DCGE
model based
on 2000 SAM
Dynamic CGE
model based on
2005 SAM
Carbon
pricing
modelled
Tax rate of
R35 ($3.8) per
tCO₂ emissions as:
Carbon
tax
Fuel tax
Electricity
tax
Energy
tax
Tax rate
simulations of
R25 ($2.73) to
R1000 ($109)
per tCO₂.
Energy input tax
imposed on coal,
crude oil and gas
Tax rate of R96
($10) to R165
($18) per tCO₂:
- Pure carbon
tax (based on
carbon content)
- Excise tax on
energy inputs
(coal, gas and
crude oil)
- Sales tax on
energy-intensive
sectors
Tax
simulations
as of 2007
study, but
imposed as a
sales tax on
used of
commodities
producing
high levels of
emissions to
impact
economic
behaviour
Tax rate of
R100 ($11),
R150 ($16.5) &
R200 ($22) per
tCO₂:
- Tax imposed
upstream on
fossil fuel inputs
- Tax is
introduced
gradually over a
10-year period
(from 2012).

Carbon Price Modelling Studies in SA
30
University of
Pretoria, 2006 University of Cape
Town for Long Term
Mitigation
Scenarios, 2007
World Bank, 2009 University of
Cape Town,
2008
National Treasury,
2010
Type &
scope of
modelling
Static CGE model
based on 2000
SAM with overall
Leontief production
and constant
elasticity of
substitution (CES)
sub structures
Static CGE Model
based on 2000 SAM
+ energy modelling
exercise that
considers mitigation
scenarios for the
energy system by
employing a Markal
model
Static CGE Model
based on 2003
SAM and with zero
substitution through
Leontief technology
of fixed coefficients
or combining inputs
through CES
function
Dynamic CGE
model based
on 2000 SAM
– models
structural
shifts, energy
efficiency
impact and
investment
required
Dynamic CGE model
- contains a series
of production
functions
(disaggregated by
sector) & series of
household
demand functions
(disaggregated by
income group) Carbon
pricing
modelled
Tax of R35 per
tCO₂ emissions as:
Carbon tax
Fuel tax
Electricity tax
Energy tax
(All taxes modelled
have a comparable
effect on
emissions.)
Tax simulations of
R25 to R1 000 per
tCO.
Energy input tax
imposed on coal,
crude oil and gas
Tax of R96 to R165
per tCO₂:
Pure carbon
tax (based on
carbon
content)
Excise tax on
energy inputs
(coal, gas and
crude oil)
Sales tax on
energy-
intensive
sectors
Tax simulations
as of 2007
study, but
imposed as a
sales tax on
used of
commodities
producing high
levels of
emissions to
impact
economic
behaviour
Tax of R100, R150
and R200 per tCO₂:
Tax imposed
upstream on
fossil fuel inputs
Tax is
introduced
gradually over a
10-year period
(from 2012).

Carbon Price Modelling Studies in SA
31
University of
Pretoria, 2006 University of Cape
Town, 2007 World Bank, 2009 University of
Cape Town,
2008
National Treasury,
2010
Revenue recycling measures modelled
- Direct tax break, labour and capital - Indirect tax breaks to all households (VAT) - Reduction in the price of food
- Production subsidies
for nuclear or renew-
able energy and biofuels - Food subsidies - General VAT & PIT subsidies - Household transfers
- Reductions in
distortionary indirect
taxes: production
taxes, sales taxes,
value-added taxes, and
import tariffs
- Lump sum transfers
to households
- Examines
scenarios
associated with
the Long Term
Mitigation
Scenarios
modelling
- Recycling: VAT, PIT,
CIT, transfers to
households and/or government investments
Results - Model finds potential
for double or triple
dividends (GHG
reduction, GDP growth
& poverty reduction) if
revenue is recycled
through lowering existing taxes
- All taxes yield an
emissions dividend, with
carbon tax being the
most effective
- The food tax hand-
back reduces poverty
more than other recycling measures.
- A tax of R75 per tCO₂ and increased to
around R200 per ton seems appropriate.
- It
- Food subsidy yields
the most positive
result, with marginal
increases in GDP at low levels of taxation.
- Revenue recycling
schemes (biofuel, food
VAT) have a positive effect on employment.
- Tax >R600 per ton:
Coal to liquid plants not viable.
- All taxes drive a 15%
reduction in CO₂ emissions
- A direct carbon tax
imposes the lowest
distortion compared
with taxes on energy or
energy-intensive
sectors.
- If revenue is recycled
to reduce pre-existing
tax distortions, the net
welfare cost becomes
negligible;
- The impact on the
GDP or consumption is
generally less than 1
per cent
- If CO2 tax is
combined with
tax relief or re-
investment of
additional
revenue ,
economic impact
is positive
- CO2 tax is
effective in
reducing CO2
emissions
- Employment for
semi- and
unskilled labour
rise with increase
in investment
- With R200 tax
emissions decline by
34% by 2020 and over
42 per cent by 2025,
relative to the baseline.
- If carbon tax revenues
are recycled via VAT
rate, it leads to a smaller
negative impact on GDP (–0.2) by 2035.
- Reductions in CIT or
PIT see the GDP
decrease by 0.4 per cent by 2035.
- Recycling revenue by
increasing government
savings and investment results in positive gains.

International Competitiveness – NERA Economic Consulting, December 2011
• In the absence of a global GHG emissions reduction agreement, a
carbon tax in South Africa would be imposed in an international context
in which some trading partners – as well as other countries with which
South Africa competes in export markets – did not face similar carbon
costs.
• Industries most at risk of being put at a competitive disadvantage due to
the carbon tax are those with energy / or carbon intensive products and
those that are relatively homogenous and widely traded globally.
• There are three main approaches to soften the adverse impact on
competitiveness:
– Free allocations (ETS)
– Domestic tax rebates
– Border carbon adjustments (levies on imports, rebates for exports or
both)
32

Policy responses to carbon leakage: how to
support sectors at risk – vivideconomics, 2015
• Policy makers have considered and/or adopted a range of policy
instruments to reduce the risk of leakage when designing a carbon
pricing regime. These instruments can be split into two main groups:
measures that are integrated into design of a carbon pricing scheme, or
„integrated measures‟ such as free allowance allocation, and measures
that are external to and operate in parallel with the carbon pricing
scheme, typically known as „complementary measures‟. These include
cash transfers to offset some of the carbon cost firms face, rebates on
non-carbon taxes, direct support for emissions reduction projects and
energy efficiency measures.
• Three main forms of integrated measures are either operating in practice
and/or have been discussed heavily in the relevant literature:
– free allowance allocations;
– administrative exemptions; and
– border carbon adjustments (BCAs).
33

Energy-intensive and trade-exposed sectors
34
Energy-intensive sectors Trade-exposed sectors EITE sectors
Iron and steel Basic iron and steel Iron and steel
Non-ferrous metals Basic non-ferrous metals Non-ferrous metals
Non-metallic minerals
Chemical and petrochemical products
Mining and quarrying Gold and uranium ore mining Gold and uranium mining
Coal mining Coal mining
Other mining Other mining
Machinery and equipment
Source: Winkler et al. (2010: 135).

Energy sector & carbon pricing
• Pricing energy appropriately is important to ensure that the external
costs of climate change and other environmental damages are
reflected in the price of energy and that the relative prices between
carbon intensive and low carbon technologies are correctly reflected.
• A carbon price / tax will influence future investment decisions and reduce
the price-cost differentials between fossil fuel-based electricity and
renewable energy.
• Some consideration to be given to the pass through mechanism of
the carbon tax to ensure that appropriate incentives are maintained for
changes in both production and consumption patterns.
– The electricity sector is able to pass on the carbon tax to final
consumers.
– However, the current regulatory framework for determining the prices
of liquid fuels (petrol, diesel, paraffin and gas) does not allow for a
pass-through – either in full or in part – of the carbon tax imposed at
refinery level.
35

Electricity generation levy
• The levy implemented on 1 July 2009 on the production / generation
of electricity from non-renewables including coal, petroleum-based fuels,
natural gas and nuclear. The objectives were:
– Complement demand side management efforts
– As a first step towards developing a carbon tax to achieve long term climate
change objectives
• Electricity generated from renewables and qualifying cogeneration are
excluded from the levy
• Now also incorporate provision for the funding of energy savings measures
such as the SWH, previously included in the electricity tariff and funding to
rehabilitate some of the roads that were damaged due to the large volumes
of coal trucks in one of the Provinces.
• To ensure the effective pricing of carbon and facilitate the structural change
currently taking place in the energy sector, a gradual phasing-down and
restructuring of the current electricity levy will be considered
36

Impact on electricity prices
37
Standard Average Electricity Price (c/kWh) (MYDP 3 + )
Carbon Tax as % of Price
Carbon Tax as % of Price
2016/17 87.56 80% TFA 60%
1 Headline carbon tax rate per ton of CO2: Rand 120 Average
2 Tax free allowance / threshold 60% 70% 80% 90% 95%
3 Taxable emissions 40% 30% 20% 10% 5%
4 Effective tax rate per ton of CO2 : Rand 48 36 24 12 6
5 cents per kWh - Total 5.02 3.77 2.51 1.26 0.63 2.51 90.07 2.8% 92.58 5.4%
6 cents per kWh for every R10 pre ton CO2 1.05 1.05 1.05 1.05 1.05
2017/18 94.56
1 Headline carbon tax rate per ton of CO2: Rand 132
2 Tax free allowance / threshold 60% 70% 80% 90% 95%
3 Taxable emissions 40% 30% 20% 10% 5%
4 Effective tax rate per ton of CO2 : Rand 52.8 39.6 26.4 13.2 6.6
5 cents per kWh - Total 5.52 4.14 2.76 1.38 0.69 2.76 97.32 2.8% 100.09 5.5%
6 cents per kWh for every R10 pre ton CO2 1.05 1.05 1.05 1.05 1.05
0.50 0.38 0.25 0.13 0.06
2018/19 102.13
1 Headline carbon tax rate per ton of CO2: Rand 145.2
2 Tax free allowance / threshold 60% 70% 80% 90% 95%
3 Taxable emissions 40% 30% 20% 10% 5%
4 Effective tax rate per ton of CO2 : Rand 58.08 43.56 29.04 14.52 7.26
5 cents per kWh - Total 6.07 4.56 3.04 1.52 0.76 3.04 105.16 2.9% 108.20 5.6%
6 cents per kWh for every R10 pre ton CO2 1.05 1.05 1.05 1.05 1.05

Energy Efficiency Savings Tax Incentive
• The energy-efficiency savings tax incentive (EESTI) was introduced in
November 2013 to complement the proposed carbon tax. The EESTI will run
until January 2020. Some of the carbon tax revenue will be recycled through the
EESTI.
• The EESTI allows businesses to claim deductions against there taxable income
for energy-efficiency saving measures – measures in kWh equivalent.
• The rate at which the deductions is calculated will been increased from
45c/ kWh to 95 c/kWh.
• As at end of April 2015 (slightly over a year in operation) about 3 826 MWh of
potential energy savings was lodged from about 74 registered projects and more
than 100 users are registered in the system. Some of the projects come from the
most energy intensive users are large in the size of potential energy savings.
38
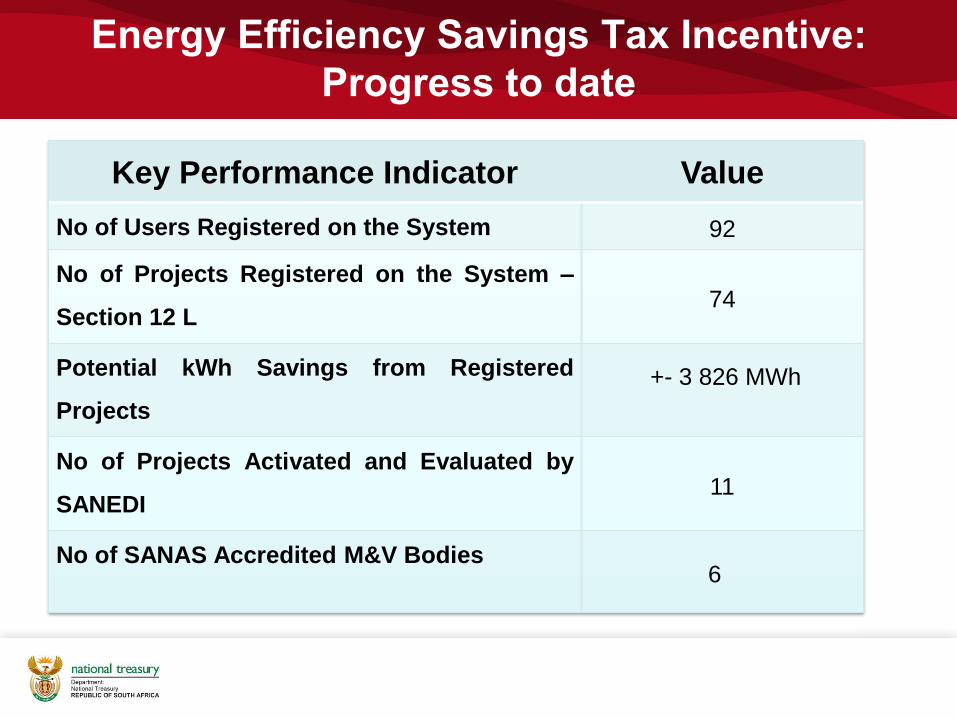
Energy Efficiency Savings Tax Incentive:
Progress to date
Key Performance Indicator Value
No of Users Registered on the System 92
No of Projects Registered on the System –
Section 12 L 74
Potential kWh Savings from Registered
Projects
+- 3 826 MWh
No of Projects Activated and Evaluated by
SANEDI 11
No of SANAS Accredited M&V Bodies 6

Energy Efficiency Savings Tax Incentive:
Applications per sector to date
Sector No of
Applications
Comments
Mining 28 Mainly large projects awaiting baseline submissions
Agriculture 3 Awaiting baseline submissions
Industrial 20 Large projects, awaiting baseline submissions
Commercial 21 Mainly lighting & air-conditioning retrofits in commercial buildings,
including hotels and two possible cogeneration projects
Transport 2 One logistics fleet and one mining/ haulage project
Total 74

Summary and next steps
• Policy development & public consultation with regard to a carbon price /
carbon tax in South Africa commenced in 2010
• The Climate Change Response White Paper in 2011 provided the
broader policy context for a carbon price / tax as one a suite of measures
to address the challenge of clime change and the transition to a low-
carbon economy
• The proposed design of the carbon tax tries to address concerns about
the impact of higher energy prices on low income households and on the
international competiveness of South Africa firms (especially the mining
& manufacturing sectors ).
• The emission trading schemes in China and the carbon tax initiatives in
Mexico, Chile and other developed and emerging economies should be
noted.
• The Carbon Tax Bill will be submitted to Cabinet for approval for
publication for public comment.
41

Thank you
Questions?

Electricity, Fuel & Transport Services: Average % household
consumption expenditure by deciles (2010/11 IES) - (4)
43
0.0%
1.0%
2.0%
3.0%
4.0%
5.0%
6.0%
7.0%
Lower 2 3 4 5 6 7 8 9 Upper
Electricity as a % of TOTAL Expenditure- by expenditure decile
Fuels and lubircants as a % of TOTALExpenditure - by income decile
5, 9.2%
7, 7.0%
8, 4.6%
0.0%
1.0%
2.0%
3.0%
4.0%
5.0%
6.0%
7.0%
8.0%
9.0%
10.0%
Lower 2 3 4 5 6 7 8 9 Upper
Transport services as a % of TOTALExpenditure - by expenditure decile
Passenger transport by road as a % ofTOTAL Expenditure - by income decile