Embed Size (px)
Citation preview

Carbon Science• A new synthesis of the present carbon budget.• Building an earth system model for century time
scale scenarios• An examination of the long term consequences of
continued fossil fuel use• “Scouts”

Observations of Growth Rate of Carbon Reservoirs
Keeling et al. (2000) & Marland et al. (2000)

Carbon Sources and Sinks (Pg C yr-1)a
1980's 1990’s
Fossil Fuel Emissions +5.4 ± 0.3 +6.3 ± 0.4
Atmospheric Increase −3.3 ± 0.1 −3.2 ± 0.1
NET Oceans & Land −2.1 ± 0.3 −3.1 ± 0.4aBased on IPCC (Prentice et al., 2001)
What are the sizes, causes, and expected future behavior of the land and ocean carbon
sinks?

O2/N2 and CO2 allow us to separate the land and ocean carbon sinks
Measurements by Bender at Cape Grim, Tasmania
(1992 to present)

Carbon Sources and Sinks (Pg C yr-1)a
1980's 1990’s
Fossil Fuel Emissions +5.4 ± 0.3 +6.3 ± 0.4
Atmospheric Increase −3.3 ± 0.1 −3.2 ± 0.1
NET Oceans & Land −2.1 ± 0.3 −3.1 ± 0.4aBased on IPCC (Prentice et al., 2001)
Land & Ocean Breakdown Using Oxygen and Carbon Dioxide Observationsb
Ocean Sink -1.8 ± 0.6 -2.2 ± 0.5
Net Land Sink -0.3 ± 0.7 -0.9 ± 0.7bCorrected for ocean warming (Keeling & Garcia, 2002; Plattner et al., 2002; Bopp etal., 2002)
Ocean uptake confirmed by ocean inverse (Gloor Gruber, & Sarmiento, 2003), new analysis of oceanic CFC observations (McNeil et al., 2003), & ocean models (Princeton + many others).

Ocean uptake is due to chemical dissolution. The ocean has the capacity to dissolve 85% of the present atmospheric anthropogenic CO2, but because of slow circulation, it presently contains only 37% of the
combined atmosphere-ocean inventory
Gruber & Sarmiento (2002)

The net land sink includes deforestation. Subtracting this gives the size of the total land
sink, as shown below:
Land & Ocean Breakdown Using Oxygen and Carbon Dioxide Observationsb
Ocean Sink -1.8 ± 0.6 -2.2 ± 0.5
Net Land Sink -0.3 ± 0.7 -0.9 ± 0.7bCorrected for ocean warming (Keeling & Garcia, 2002; Plattner et al., 2002; Bopp etal., 2002).
Land BreakdownTropical deforestationc 0.6
(0.3 to 0.8)0.9
(0.5 to 1.4)Total Land Sink -0.9
(-0.6 to –1.1 ± 0.7)-1.8
(-1.4 to –2.3 ± 0.7)cDeFries et al. (2002)

Land sink mechanism:
Northern hemisphere forest uptake = 0.7 Pg C y –1Adding reservoirs and rivers, agricultural soils, fire
suppression in non-forest gives ~ 1 to 1.5 Pg C y-1
(Goodale et. al., 2002; cf. Pacala et al., 2001 on North
America)

Forest uptake does not appear to be due to CO2fertilization, but rather to regrowth in abandoned farmland and previously logged areas as well as to fire suppression (at
least in the U.S.)
Schlesinger & Lichter (2001); cf. Caspersen et al. (2000) & Pacala et al. (2001)

Carbon Science• A new synthesis of the present carbon budget.• Building an earth system model for century time
scale scenarios• An examination of the long term consequences of
continued fossil fuel use• “Scouts”

Net Primary Production predicted by new
Princeton land and ocean carbon models
(kg C m-2 y-1)
Upper is observations, lower is model(mmol C m-2 d-1)

Simulation of El Niño by new GFDL Climate Model
QuickTime™ and a Animation decompressor are needed to see this picture.

Future scenarios by two Earth System models with CO2
fertilization
Note: The IPSLEarth System model
land biosphere is <0.5x as sensitive to warming, and oceanic
uptake is 1.8x as strong as Hadley
Friedlingstein et al. (in press); Sarmiento
& Gruber (2002)

Prediction of future North American carbon sink if due to forestregrowth & fire suppression rather than CO2 fertilization (Pg C y-1;
Hurtt et al., 2002)
-0.5
0
0.5
1
1.5
1980 2000 2020 2040 2060 2080 2100
Year
Flux
of C
arbo
n (P
g C/
y)
Fire suppression ends
Fire suppression continues

Carbon Science• A new synthesis of the present carbon budget.• Building an earth system model for century time
scale scenarios• An examination of the long term consequences of
continued fossil fuel use• “Scouts”
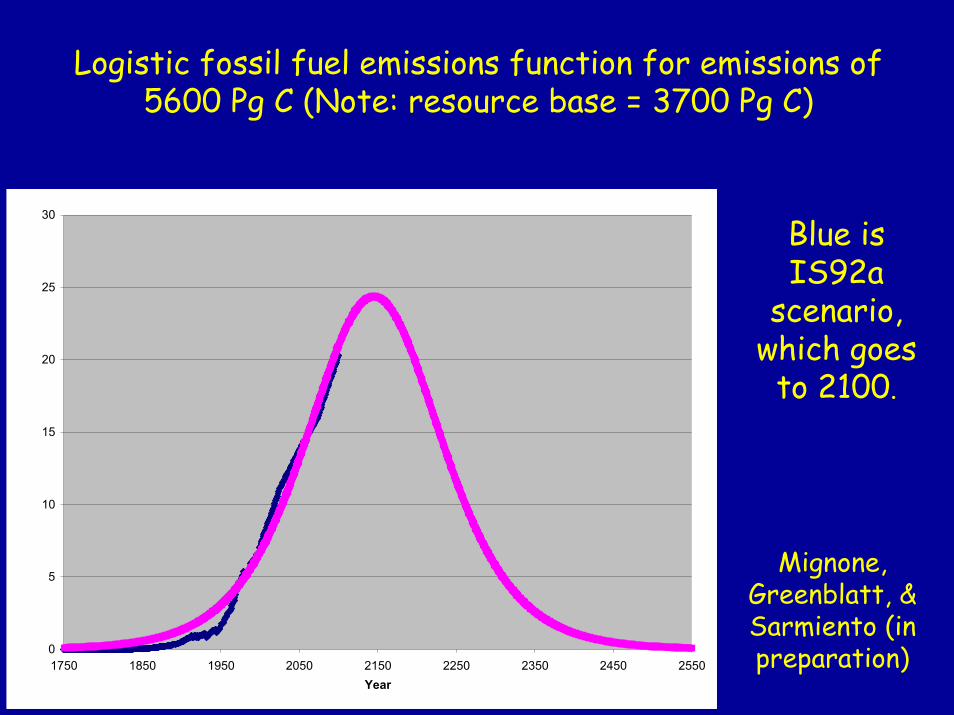
Logistic fossil fuel emissions function for emissions of 5600 Pg C (Note: resource base = 3700 Pg C)
0
5
10
15
20
25
30
1750 1850 1950 2050 2150 2250 2350 2450 2550Year
Blue is IS92a
scenario, which goes
to 2100.
Mignone, Greenblatt, & Sarmiento (in preparation)

Predicted with a simplified carbon cycle model being developed for integrated assessment
Atmospheric pCO2
0
500
1000
1500
2000
1500 2000 2500 3000 3500 4000 4500
Year
6.9x pre-industrial
4.4x pre-industrial(2.8x pre-industrial w/
sediments)

Surface Air Warming (°F)
2xCO2 Climate
4xCO2 Climate
GFDL Model (Manabe & Stouffer)

Surface pH
7.4
7.6
7.8
8.0
8.2
8.4
1500 2000 2500 3000 3500 4000 4500
Year
Surface pH and carbonate ion response
(w/o sediments)
Fractional change in Surface Hydrogen IConcentration
0.0
1.0
2.0
3.0
4.0
5.0
6.0
1500 2000 2500 3000 3500 4000 4500
Year
Fractional change in Surface Carbonate IConcentration
0.0
0.2
0.4
0.6
0.8
1.0
1500 2000 2500 3000 3500 4000 4500
Year

Abatement vs. Sequestration
Sequestering CO2reduces peak but
leads to same endpoint
Reducing total emissions reduces peak and endpoint
Ocean sediments will reduce endpoint over many 1000s of years
}

“Scouts”Glacial cycles and atmospheric CO2 (Sigman)Impact of past climate change on human society (Sigman)Detecting warming with Ar/N2 measurements in atmosphere (Bender)Deep ocean injection (Sarmiento group)Ocean fertilization (Sarmiento group)Impacts of wind power on climate (Pacala group)Impacts of biological renewables on climate, hydrology & air quality (Pacala group)

Oceanic Direct Injection for 100
years
Injection sites:• New York• Bay of Biscay• San Francisco• Tokyo• Bombay• Jakarta• Rio de Janeiro
Atmospheric CO2:• S650 - increases to
650 ppm by ~2150
OCMIP study

Development of improved ocean circulation models
Red = models
Blue = obser-vations
Matsumoto et al. (in preparation)
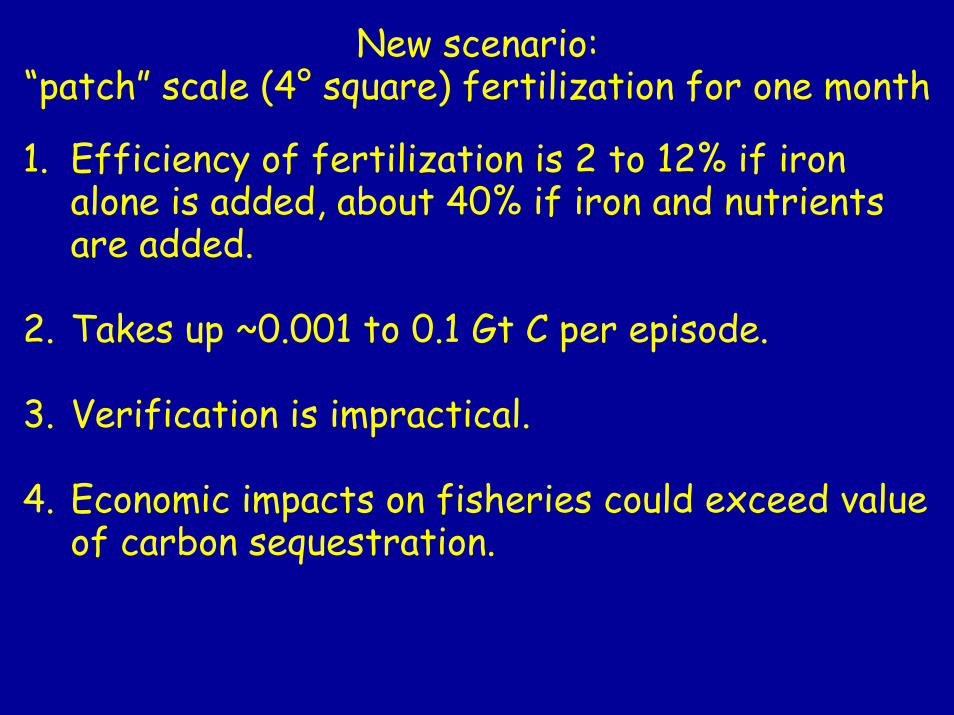
New scenario:“patch” scale (4° square) fertilization for one month
1. Efficiency of fertilization is 2 to 12% if iron alone is added, about 40% if iron and nutrients are added.
2. Takes up ~0.001 to 0.1 Gt C per episode.
3. Verification is impractical.
4. Economic impacts on fisheries could exceed value of carbon sequestration.

Climate Change and the Collapse of the Mayan Civilization
Haug et al. (2001)
The figure shows that the IntertropicalConvergence Zone
changes with season in both the Mayan
Lowlands and CariacoBasin.

High rainfall
Low rainfall
Titanium in Cariaco Basin
SedimentsXRF measurements of titanium provide an
annual record of rainfall!
The fall of the Classical Maya civilization
occurred during a period of increased dryness
exacerbated by extreme events.

Carbon Science - Future• Continue to improve our understanding of the
ongoing carbon sinks.• Complete basic earth system model development
and begin scenario studies.• Add new components to earth system model (e.g.,
functional biodiversity)• Contribute to development of “integrative
products” in next phase of CMI• Scouts