Embed Size (px)
Citation preview

?
d
CARBON RESISTORS FOR CRYOGENIC L IQUID LEVEL MEASUREMENT
R I C H A R D C. M U H L E N H A U P T A N D P E T E R SMELSER
U. S. DEPARTMENT OF COMMERCE I'?ATCONA? BUREAU OF STANDARDS

. 1 . .
THE NATIONAL BUREAU OF STANDARDS
Functions and Activities
The functions of the National Bureau of Standards are set forth in the Act of Congress, March 3, 1901, as amended by Congress in Public Law 619, 1950. These include the develop- ment and maintenance of the national standards of measurement and the provision of means and methods for making measurements consistent with these standards; the determination of physical constants and properties of materials; the development of methods and instruments for testing materials, devices, nnd structures; advisory services to government agencies on scientific and technical problems; invention and development of devices to serve special needs of the Government; and the development of standard practices, codes, and specifications. The work includes basic and applied research, development, engineering, instrumentation, testing, evaluation, calibration services, and various consultation and information services. Research projects nre also performed for other government agencies when the work relntes to nnd supple- ments the basic program of the Bureau or xbcn !he Biireau’s unique competence is required. Tile scope of activities is suggested by the iisting of divisions and sections on the inside of the back ccrer.
Publications
The results of the Bureau’s research are published either in the Bureau’s own series of publications or in the journals of professional and scientific societies. The Bureau publishes three periodicals available from the Governmrnt Printing Office. The Joiirna1 of Rewnrrh pubiisiied in four separate sections, presents cornpiere scienLiiic und Leciiniciti papers; che Tech- nical News Bulletin presents summary and preliminary reports on work in progress; and the Zeiiiriii Radio I’1 upugiiiiuii i ~ i h i ~ I ~ U I Y I ~ ~ i i ~ : p h < * i ic I’I etlicLiuiis p10* iueb dai t i foi &i+emii&ig the best frequencies to use for radio communications throughout the world. There are also five series of nonperiodical publications: Monographs, Applied JInthemtitics Series, Handbooks, Miscellaneous Publications, and Technical Notes.
A complete listing of the Bureau’s publications can be found in National Bureau of Stand- ards Circular 460, Publications of the Xational Bureau of Standards, 1901 to June 1947 ($1.25), and the Supplement to National Bureau of Standards Circular 460, July 1947 to June 1957 ($1.50), and Miscellaneous Publication 240, July 1957 to June 1960 (includes Titles of Papers Published in Outside Journals 1950 to 1959) ($2.23); available from the Superintendent of Documents, Government Printing Office, Washington D.C.
. 1
20402.

NATIONAL BUREAU OF STANDARDS Cechnical q o t e 200
Issued October 9, 1963
' CARBON RESISTORS FOR CRYOGENIC
L I Q U I D LEVEL MEASUREMENJ
9 6 ' 5 31p (JRichard C. Muhlenhaupt and Peter Srnelsey) 9 0 * '
-Cryogenic Engineering Labdratory Divfsion National Bureau o f Standards J
d / Boulder, Colo/ado
NBS Technical Notes a re designed to supplement the Bu- reau's regular publications program. They provide a means for making available scientific data that a r e of transient or limited interest. Technical Notes may be listed or referred to in t h e openliterature.
@\
F o r sa!e by the Super!n!enden! nf D"cuF.en!s; I-!: s ; G o v e r n m e n t Pr int ing Office Washington, D.C. 2 0 4 0 2
PRICE 2 5 CENTS

IMPORTANT NOTICE
NATIONAL BUREAU OF STANDARDS REPORTS are usually preliminory or progress accounting docu- ments intended for use within the Government. Before moterial i n the reports is formally published it i s subjected to additional evaluation and review. For this reason, the publicotion, reprinting, reproduc- tion, or open-literoture listing of this Report, either in whole or in part, i s not authorized unless per- mission i s obtoined in writing from the Office of the Director, Notional Bureau of Standordr, Washington 25. D. C. Such permission i s not needed, however, by the Government ogency for which the Report has been specifically prepared i f that ogency wishes to reproduce odditionol copies for i t s own US..
CCNTENTS
Page
1 . Introduction 1
2 . Description of Test Apparatus . . . . . . . . . . . . 2
3 . Experimental Procedure . ; . . . . . . . . . . . . 3
4 . Discussion of Results . . . . . . . . . . . . . . . 4
. . . . . . . . . . . . . . . . . . . .
5 . Relative Precision and Reliability of Resis tors . . . . 5
6 . Conclusion . . . . . . . . . . . . . . . . . . . . 7
7 . Appendix . . . . . . . . . . . . . . . . . . . . . 7

CARBON RESISTORS FOR CRYOGENIC LIQUID LEVEL MEASUREMENT
Richard Muhlenhaupt and Pe te r Smelser
j L l 3 7.25 Data a r e shown in graphical form. One set of plots
presents resistance ratio R / R as a function of "warming
second se t of plots presents resistance ratio R /R L O function of nominal resistance at various levels of constant power dissipation.
up" t ime at various levels o F L constant power dissipation. A as a
The use of the data and the design of a practical liquid level inidcator a r e discussed i n the appendix.
4 J T U O R
1. Introduction
In the past few years sufficient interest has been shown in the
use of ordinary carbon composition res i s tors for cryogenic liquid level
measurement to warrant a study of the various parameters involved
in the design of this type of liquid level indicator.
monly used for the detection of liquid levels when a simple and inexpen-
sive point sensor i s desired and when precise indication and fast time
response a r e not cri t ical requirements.
Res is tors a r e com-
The principal of operation i s based upon (1) the heat transfer
character is t ics of the res i s tor in gas and liquid, and (2 ) the large
negative temperature coefficient of resistance which occurs when the
res i s tor is in a cryogenic environment.
The circui t ry required for the detection of liquid levels by this
method includes a Wheatstone bridge (the liquid level res i s tor being one
of the arms), a power supply, an amplifier, and the desired readout
equipment (lightbulb, galvanometer , relay, etc. ).
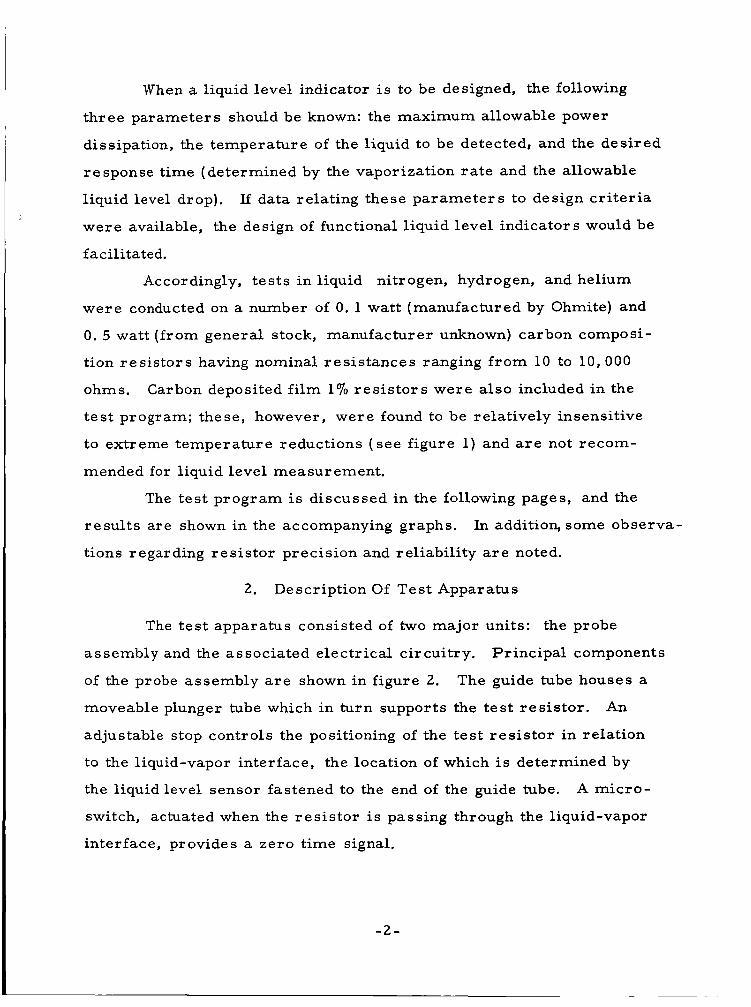
When a liquid level indicator is to be designed, the following
three parameters should be known: the maximum allowable power
dissipation, the temperature of the liquid to be detected, and the desired
response time (determined by the vaporization r a t e and the allowable
liquid level drop). If data relating these parameters to design c r i te r ia
were available, the design of functional liquid level indicators would be
facilitated.
Accordingly, tes ts in liquid nitrogen, hydrogen, and helium
were conducted on a number of 0. 1 watt (manufactured by Ohmite) and
0. 5 watt ( f rom general stock, manufacturer unknown) carbon composi-
tion res i s tors having nominal res is tances ranging f rom 10 to 10 ,000
ohms. Carbon deposited film 1% res i s to r s were also included in the
tes t program; these, however, were found to be relatively insensitive
to extreme temperature reductions ( see figure 1) and a r e not recom-
mended for liquid level measurement.
The tes t program is discussed in the following pages, and the
resul ts are shown in the accompanying graphs.
tions regarding resis tor precision and reliability a r e noted.
In addition, some observa-
2. Description Of Test Apparatus
The tes t apparatus consisted of two major units: the probe
Principal components assembly and the associated electrical circuitry.
of the probe assembly a r e shown in figure 2.
moveable plunger tube which in turn supports the tes t res is tor .
adjustable stop controls the positioning of the tes t res i s tor in relation
to the liquid-vapor interface, the location of which i s determined by
the liquid level sensor fastened to the end of the guide tube. A micro-
switch, actuated when the res i s tor i s passing through the liquid-vapor
interface, provides a zero time signal.
The guide tube houses a
An
-2 -

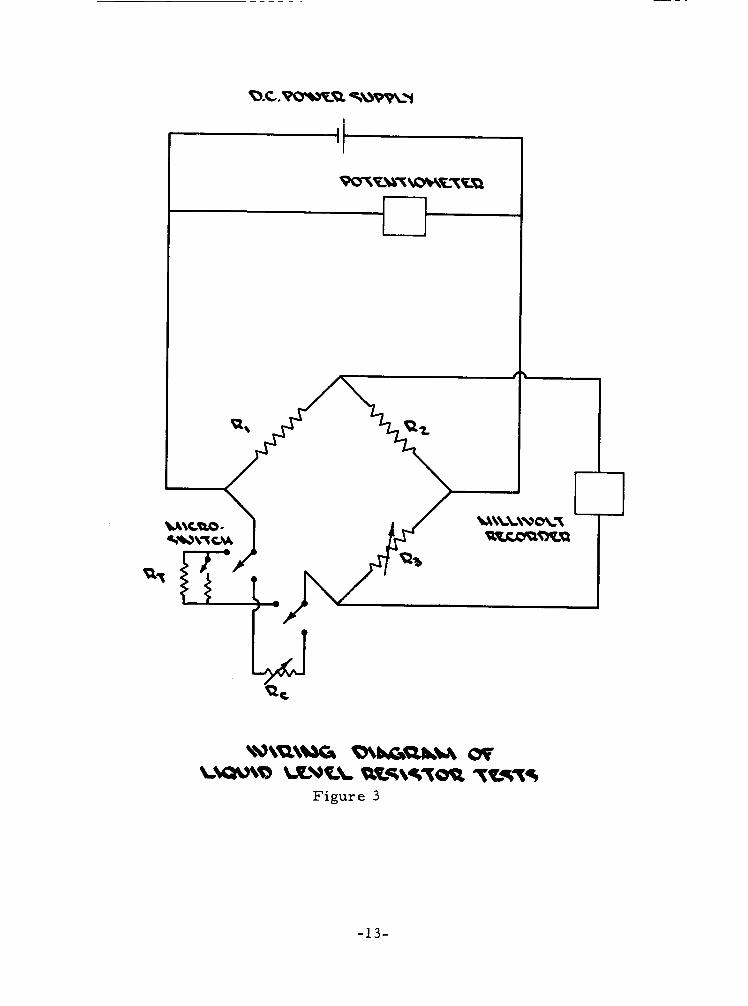
The electrical circuitry is shown in figure 3. A 60 watt, D. C.,
constant voltage, power supply provides Ifhe necessary power. Resis tors
R1, RZ, R3, and either R
box R is used to balance the bridge when the tes t res i s tor is in the
circuit, and decade box R
resis tance of R and to calibrate the recorder. A recorder char ts the
bridge unbalance a s the res i s tor passes through the liquid-vapor interface.
or RC form a Wheatstone bridge. Decade T
3 (checking resis tor) is used to determine the C
T
A potentiometer i s used to measure the voltage drop ac ross the bridge.
3. Experimental Procedure
Twelve 0. 1 watt and twelve 0. 5 watt carbon composition r e s i s to r s
were tested. For each power rating, three r e s i s to r s of each value
(10, 100, 1000, and 10,000 ohms) were chosen. After the selected
res i s tor was attached to the leads on the plunger tube, its room tem-
perable res is tance (R
Wheatstone bridge.
permit moving the tes t res i s tor from a submerged position to a point
slightly above the liquid-vapor interface.
in figures 13 and 14) was measured with a 0 Then the travel of the plunger tube was adjusted to
With the sensor in the submerged position, the magnitude of
the resis tance in liquid (R
balancing the bridge, substituting checking res i s tor R and adjusting
the resis tance of R
established by adjusting R
determined resis tance levels and recording the resulting recorder
deflections.
in figures 4 through 12) was determined by L
C' equal to that of R C L' A resis tance calibration was
(while in the circuit) to a number or p re - C
The actual testing was begun with the tes t res i s tor submerged in
the liquid bath.
tube was quickly ra i sed causing the microswitch to be actuated, which
The recorder chart drive was turned on, and the plunger
-3 -

momentarily placed a resis tance in parallel with R
indication.
the chart drive was turned off.
the bridge was measured with the potentiometer.
for the zero t ime T
When a res is tance change of about 5% had been reached,
During this process, the voltage ac ross
This procedure was repeated three t imes at approximately the
same bridge supply voltage.
provide a new power level and testing was resumed.
been conducted at three or four. different voltage settings, a new res i s tor
was selected and the process repeated.
The supply voltage was then changed to
When tes t s had
4. Discussion of Results
The data obtained f rom the tes t program were plotted in the form
Each of the first of curves which a r e presented in figures 4 through 14.
nine graphs (figures 4 through 12) show resis tance ratio (R /R ) as a G L
function of "warming up" time at various levels of power dissipation.
The plots show that level indicating sensitivity improves with
increased power dissipation.
when the temperature of the r e s i s to r ' s environment is lowered (i. e . ,
sensitivity is best in helium, next best in hydrogen, and poorest in nitrogen).
They also show that sensitivity i s increased
It w a s expected that the ratio R /R G L in the time response curves
would begin at unity and continuously approach some lower value; how-
ever, for most plots this is not the case. Instead, the rat io becomes
la rger than unity before dropping to lower values. This suggests that
the resis tor , after passing through the liquid-vapor interface, senses a
lower temperature.
this behavior has been worked out.
At the present t ime no satisfactory explanation of
In order to avoid this initial "negative" effect, it is suggested
that a resistance rat io of 0. 98 (an a rb i t ra ry figure that may be adjusted
to the designer 's requirements) be used as the t ime response determining
-4-

figure.
It should be noted that: (1) the test conditions could not be identically
reproduced for r e s i s to r s of the same nominal rating, and (2) much of
the data was combined in order to reduce the number of final graphs.
The plots represent average data derived f rom three individual runs
for each tes t condition.
gave reasonable response t imes were those having 0. 1 watt nominal rating,
and furthermore these gave usable results only when used in helium.
deviations were observed, it was felt that they were insufficient to impair
the usability of the curves.
In addition, the only 10 ohm res i s to r s which
Although
The final two graphs (figures 13 and 14) show resistance ratio
as a function of nominal resistance for several s e r i e s of r e s i s to r s
operated at various power levels. On these graphs the resistance ratio
i s the measured resis tance in liquid (R ) divided by the measured
resis tance at room temperature (R ), while the abscissas of the graphs
represent the nominal resistance rating of the res i s tors .
that as the nominal resistance increases or as the temperature of the
environment decreases, the resistance rat io becomes greater. In addition,
increased power dissipation tends to decrease the resis tance ratio.
Within experimental e r r o r the semi-log plots appear as straight lines.
L
0 It will be noted
With the help of these graphs it becomes a simple matter to
determine the expected magnitude of the resis tance in liquid once the
following a r e known: (1) the maximum allowable power dissipation,
(2) the nominal rating of the selected resis tor , and ( 3 ) the liquid to be
detected.
5. Relative Precis ion And Reliability of Resis tors
The precision of a number of liquid level sensors was determined
-5-

[ 11. in separate tes ts conducted at the Cryogenic Engineering Laboratory
The sensors were lowered into a liquid hydrogen bath until a wet indica-
tion was noted and then raised until a dry indication was observed, the
distance traveled being measured to the nearest . 001 inch.
data a bandwidth denoting the maximum distance between the wet and dry
indications for any given sensor was produced.
how pressurizing the liquid affects the magnitude of the bandwidth, a
se r i e s of runs were conducted on each sensor at p re s su res ranging f rom
F r o m these
In order to determine
two to 200 psig.
Among the commer cia1 liquid level indicator s evaluated in this
manner was a 0. 1 watt, 1000 ohm carbon res i s tor type, (manufactured by
Ohmite), which was positioned with its major axis parallel to the liquid-
vapor interface.
Bandwidths varying f rom 0. 020 to 0. 028 inch were found for a hot wire
sensor similarly tested.
and bandwidth.
The bandwidth was found to vary f rom 0. 015 to 0. 122 inch.
No simple correlation was found between pressure
Response time, determined in the same tes t program, was
found to vary from 0. 003 to 1. 128 seconds for the hot wire sensor, while
the response time of r e s i s to r s in the present program ( see Discussion
of Results and figures 4 through 12) ranges f rom about 0. 5 to 8.0 seconds.
Although reliability tes ts were not included in either program,
r e s i s to r s have been frequently used for liquid level sensors at the
Cryogenic Engineering Laboratory, and it has been found that their
characterist ics vary at times. Prolonged thermal cycling, for example,
[ D. A. Burgeson, W. G. Pestalozzi, and R. J. Richards, "The Performance Of Point Level Sensors In Hydrogedl Cryogenic Engineering - 9, In P r e s s .
Advances in
- 6 -

has been known to cause resistance changes of as much as lo%, but
this can be corrected by a minor circuit adjustment.
In general, the resis tor leads should be cut as short as possible
to reduce the effective mass, care should be taken when attaching the
lead-out wires because heating can increase the resis tance by as much
as lo%, and the probe design should provide for liquid drainage away
f rom the resis tor .
6. Conclusion
The resul ts of the tes t program show that the time response of
r e s i s to r s is somewhat slower than that of a hot wire sensor.
depends upon the allowable power dissipation and the temperature of the
liquid being detected, greater sensitivity being obtained when the power
is increased or when the temperature of the liquid i s decreased.
value of the resistance in liquid depends upon (1) the power dissipation,
(2) the ohmic rating of the res i s tor , and (3) the liquid.
three parameters have been selected, the magnitude of the resistance
in liquid may be readily determined,
Ciensitivity
The
Once these
The bandwidth of 1 / 8 inch for a horizontally mounted res i s tor
is adequate for all but the most precise requirements.
inexpensive and easy to mount and the associated electrical circuitry
can be simple.
Resis tors a r e
It is apparent that ordinary carbon composition r e s i s to r s perform
reasonably well as liquid level sensors, and within the indicated l imits,
they a r e well suited for this purpose.
7 . Appendix
The bridge com-ponents ( see figure 15-a) a r e governed by the
following considerations: the power dissipation of the ratio a r m s should
-7 -

be a reasonable value, the resistance rat io R /R should be approximately
equal to RB/R
relation to the amplifier 's input impedance in order that high sensitivity
may be obtained.
L A and the resis tances of R and Rc should be small in C' B
The design of a practical liquid level indicator will now be con-
sidered. Arbitrari ly selected parameter s a r e :
(1) maximum allowable power dissipation: 125 milliwatts o r less
(2) liquid to be detected: hydrogen
( 3 ) desired time response: two seconds o r less .
Readily available components a re :
(1) power supply: 26. 5 volt, D. C . , 600 ma
(2) indicator: 6 volt, 150 ma, #47 lightbulb
(3) amplifier: two-stage, transistorized, 2 w 5000 ohms
(4) balancing potentiometer: 1000 ohm, 2 watt.
Figure 9 shows that a 1000 ohm, 0. 5 watt res i s tor dissipating
115m watts satisfies the above cr i ter ia , and figure 14 shows that a
res i s tor of this nominal rating will have a resis tance ratio R / R L O of
about 2. 50.
2500 ohms.
is added to the resis tance of R L' I'd" on figure 15-a is 3000 ohms.
The resistance of R
When half the resis tance of the potentiometer (design null)
the resis tance between points "a" and
is then found to be approximately L
In order to find suitable resistance values for the other three
arms of the bridge, it i s convenient to f i r s t find the current in the
branch ad,-. L' Since 115 milliwatts a r e dissipated in R
= 6. 78 ma, and _ I mmw-- -
adc 2500 ohm I
= 3900 ohm. - 26. 5 v -
adc 6. 78 ma R
-8 -

This leaves 400ohmsfor res is tor R
(the nearest nominal resistance rating) is therefore selected.
resistance rat io of the two adjacent a r m s then becomes
A 0. 5 watt, 390 ohm res i s tor A' The
= 3000/890 R ad dc
= 3. 37.
Recalling that high sensitivity will be obtained when the resistance
of r e s i s to r s R and R a r e small compared to the input impedance of B C the amplifier, a 300 ohm resis tor is arbi t rar i ly selected for R The B' resistance of R is then calculated from the relation
C
- RB/RC - ad dc
or
R = 300/3. 37 C
= 89 ohms.
C' A 91 ohm resis tor i s therefore selected for R
It remains to be determined whether o r not these res i s tors will
produce a reasonable power dissipation.
the circuit will be
The current in this portion of
- 26. 5 volts 391 ohms
- I abc
= 68 ma.
With this current, R will dissipate 1. 39 watts, which i s somewhat high. B This indicates that l a rger res i s tors should be used to reduce I If abc'
-9 -

R is 1000 ohms, R will be about 300 ohms and the power dissipated in
the larger res i s tor will be 0. 4 watt.
the resis tor and R
of the amplifier.
The res i s tors finally selected for the bridge a r e
B C This is below the power rating for
is still low when compared with the input impedance abc
RS: 1000 ohm, 0. 5 watt
RA: 390 ohm, 0. 5 watt
RB: 1000 ohm, 0. 5 watt
RC: 300 ohm, 0. 5 watt.
-10-

7
!
I
+-
In 0
8
Y 0
L
W I-
o
-
-11 -

-12-
1
-1 3-

f - 8
2
I
' T
1U/9U ' O l l V U 33NVlSIS3U
-14-

-15-

(u 0
i
-16-

-17-

I
-18-

i F co C L -
\
c
a
0
1 k J / 9 k J 'OllVkJ 33NWlSIS3U
-19-

f
1tl19tl ' O l l V t l 33NVlSIS3kJ
-20-

f F
L
s
8 \
1
’tl I9tA ‘ O l l V t l 33NVlSIS3t l
-21 -

f
f -6-
- % - rL rc!
o!
0
-22 -

P I 0

I I +
t m Lo .. -
' t l / ' t l 'O l lWt l 33NWlSIS3tl
-24-

SENSOR
TRA NSFORM€R N 7 / 6 v
GE 47
V
TRA NSFORMZR
SCH€MAT/C OF A L/QU/D M V € L INDICATOR
Figure 15-a
PROBE ASS€M0L Y
Figure 15 -b
-25-
GPO 836.534