Embed Size (px)
Citation preview

Cna
Ba
b
a
ARRAA
KCCNNG
1
ttfipaucntcatt
E
h0
Sensors and Actuators B 205 (2014) 401–410
Contents lists available at ScienceDirect
Sensors and Actuators B: Chemical
jo ur nal home page: www.elsev ier .com/ locate /snb
arbon nanochips and nanotubes decorated PtAuPd-basedanocomposites for glucose sensing: Role of support materialnd efficient Pt utilisation
aljit Singha, Eithne Dempseya,∗, Fathima Laffirb
Centre for Research in Electroanalytical Technologies (CREATE), Institute of Technology Tallaght (ITT Dublin), Tallaght, Dublin 24, IrelandMaterials and Surface Science Institute (MSSI), University of Limerick, Limerick, Ireland
r t i c l e i n f o
rticle history:eceived 11 March 2014eceived in revised form 9 July 2014ccepted 10 August 2014vailable online 8 September 2014
eywords:arbon nanochipsarbon nanotubesanocomposites
a b s t r a c t
An efficient approach for nanoparticle decoration of carbon nanochips and carbon nanotubes togetherwith effective utilisation of Pt for direct glucose determination is demonstrated. The synthesised materialswere investigated using morphological, compositional, structural and electrochemical characterisations.TEM data indicated the successful nanoparticles decoration with average particle sizes in the range of2.5 ± 0.4 nm for all the synthesised nanomaterials. The overall aim was to reduce precious Pt contentin addition to improve the Pt surface utility, via, using multicomponent catalytic system and effectiveparticles dispersion on carbon-based supports. Amperometry was employed for non-enzymatic glu-cose determination and the best response among the bi/tri-metallic nanomaterials was achieved forPt2Au1Pd1/f-CNC (sensitivity = 11.24 �A mM−1 cm−2 at Eapp = 0.43 V vs Ag/AgCl), over the range 0–10 mM
on-enzymaticlucose detection
glucose, in neutral pH conditions. The results confirm an excellent choice of novel carbon support (carbonnanochips, CNC) which doubles the electro-active surface area (SEL = 56.2 m2/g) and active surface cover-age (� = 36.5% for Pt2Au1Pd1/f-CNC) compared to CNT supported catalysts (SEL = 26.7 m2/g and � = 18.1%for Pt2Au1Pd1/f-CNT) and demonstrated the role of support materials in effective nanoparticle utilisationand performance.
© 2014 Elsevier B.V. All rights reserved.
. Introduction
The choice of a support material is an important parameterhat affects the performance of electrocatalysts owing to interac-ions and surface reactivity. In this regard as well as to achievene dispersion and high utilisation, nanocatalysts are usually sup-orted on high-surface area materials. Carbon-based materialsre widely used as support for proper distribution and optimumtility of nanosized particles. Various carbon materials such asarbon blacks, carbon nanotubes, carbon nanofibers and carbonanohorns are reported in this context [1–6]. Studies have shownhat carbon nanotubes (multi-walled) are much superior to otherarbon supports [5,6]. In principle, multi-walled carbon nanotubes
re seamless cylinders, but they often have defect sites, wherehe nanoparticles attachment most likely occurs. The combina-ion of CNTs with nanoparticles provided the possibility of their∗ Corresponding author. Tel.: +353 1 4042862; fax: +353 1 4042404.E-mail addresses: [email protected] (B. Singh),
[email protected] (E. Dempsey).
ttp://dx.doi.org/10.1016/j.snb.2014.08.034925-4005/© 2014 Elsevier B.V. All rights reserved.
use in catalysis, chemical and electrochemical sensors [7–9]. Butfor CNT-based sensors, there are still some developmental chal-lenges to be addressed. One such barrier is the insolubility ofCNTs in most of the solvents, which may greatly limit their use[10,11]. To improve water solubility of CNTs, functionalisationis required, which results in decoration of carbon–oxygen-basedfunctional groups at the ends and sidewalls of carbon nanotubes.The surface activation of carbon support is believed to improve thehydrophilic–hydrophobic properties and hence electron/protonmass transfer during the electro-catalytic processes.
Carbon nanochips (CNCs, Fig. S1 – Electronic SupplementaryInformation (ESI)) are a very interesting new class of graphitenanofibers developed by Baker [12], which consist of rolled sheetsof graphene, resulting in structures that resemble flattened nano-tubes containing (up to) 6–8 layers. The distance between theinner layers can be as small as 0.34 nm, which is significantly nar-rower than of single-walled nanotube. Graphite nanofibers were
heat treated in the presence of an inert gas at temperatures from2300 ◦C to 3000 ◦C to convert them to carbon nanochips (CNCs). Thishigh temperature heat treatment gives the CNC their unexpect-edly improved catalytic properties compared to similar graphite
4 Actua
nsrtttm
aanostf
2
2
(Mr((ahatpel
2
snofdsstkitcdtnaar
2
oas85o
02 B. Singh et al. / Sensors and
anofibers. There is a concomitant increase in the average poreize of CNCs as a function of temperature treatment [12]. Theseemarkable characteristics of CNCs make them suitable as a newype of highly conductive catalyst support material. Additionally,he functional groups on the surface of CNCs can be well con-rolled and is expected to become an excellent choice as support
aterial.Here we presented an approach to reduce precious Pt content
nd to improve the Pt utility by using multimetallic catalyst systemnd effective Pt dispersion on carbon-based supports. Synthesisedanomaterials showed excellent response toward glucose electro-xidation. Studies also provide an excellent choice of novel carbonupporting matrix (CNC) along with the stability associated withhe multicomponent catalytic system, which combined can avoidouling and dissolution of Pt.
. Experimental
.1. Chemicals and materials
Carbon nanotubes (CNTs, purity ∼ 99%) and carbon nanochipsCNCs, HT3000, 99.99% carbon) were supplied by Catalytic
aterials LLC. Hexachloroplatinic acid (H2PtCl6•6H2O), gold chlo-ide trihydrate (HAuCl4•3H2O), sodium tetrachloropalladate (II)Na2PdCl4), sodium borohydride (NaBH4) and silver nitrateAgNO3) were used as received from Sigma–Aldrich. Sulphuriccid, phosphate buffer saline (PBS, 0.01 M, pH 7.4), isopropyl alco-ol, Nafion® (5% solution in a mixture of lower aliphatic alcoholsnd water) were also purchased from Sigma–Aldrich and solu-ions were prepared according to requirements. Ultra pure waterurified with purelab option water equipment was used in all thexperiments. The glucose stock solution was kept overnight (ateast 24 h) before use, to allow mutarotation.
.2. Functionalisation of carbon supports
To anchor and deposit nanoparticles onto the carbon-basedupports, activation via acid treatment was applied. The carbonanochips (as received) have been heated to 3000 ◦C in the presencef argon. However, as received CNCs were treated in acid solutionor further purification and functionalisation before subsequenteposition of nanoparticles. The carbon nanochips (300 mg) wereonicated for 2 h in concentrated H2SO4/HNO3 (3:1, 125 ml acidolution diluted to 250 ml with distilled water) acid mixture solu-ion, followed by further dilution (total volume to 500 ml) beforeept overnight, subsequently filtered and washed with, acetone,sopropyl alcohol and distilled water (excess) in order to removehe residual impurities. The sonication was repeated again but inoncentrated acid mixture (H2SO4/HNO3, 3:1) for 2 h, followed byilution of the acid mixture with distilled water and finally the solu-ion was filtered and washed with excess distilled water (until aeutral pH) and dried under vacuum at 90 ◦C for 13 h. The samecid treatment was applied to carbon nanotubes, and function-lised nanotubes and nanochips are denoted as f-CNT and f-CNCespectively.
.3. Synthesis of nanocomposites
Nanoparticle decoration was achieved according to our previ-usly reported method [13]. In a typical synthesis; the calculatedmount (53.1 mg, 20% w/w) of H2PtCl6•6H2O was dissolved and
tirred in 180 ml of deionised water. Carbon nanotubes (f-CNTs,0 mg) in 90 ml of deionised water were dispersed by sonication for0 min to achieve a homogeneous suspension, followed by additionf the hexachloroplatinic acid solution dropwise using a droppingtors B 205 (2014) 401–410
funnel, maintained the addition rate at 0.5 ml min−1, with con-tinuous stirring. NaBH4 (0.6 M) in distilled water was maintainedat 0 ◦C before addition and then added to the reaction solutionwith continuous stirring, followed by further stirring for 30 min.The mixture was refluxed at 100 ◦C for 2 h, followed by cooling toroom temperature with constant stirring. The solution was filteredusing a 0.45 �m pore size Millipore polycarbonate membrane, fol-lowed by washing with deionised water until all chloride ions wereremoved (confirmed by the silver nitrate test). The sample was thendried in a vacuum oven at 100 ◦C. The synthesised nanocompos-ite was labelled as Pt/f-CNT. The same procedure was followed forthe synthesis of other nanocomposites by maintaining the overallmetallic weight at 20% (w/w) on the carbon-based supports (80%).The metallic composition of the nanocomposites was controlled byvarying the feeding of metal precursors in the synthetic solutions.Composition 1:1 indicates 50% Pt and 50% Pd, based upon the over-all total metallic weight (20%) in the carbon supports (80%) and wasdenoted as Pt1Pd1/C. The similar denotation was applied to othernanocomposites.
2.4. Instrumentation and electrochemical measurements
The surface morphology and distribution of the synthesisednanomaterials were characterised using transmission electronmicroscopy (TEM) with a JEOL 2011 operated at 200 kV using aLaB6 filament equipped with a Gatan Multiscan Camera 794. Thesurface morphology of the nanocomposites was also examinedusing SEM (JEOL JSM 6390 LV, both backscattered and secondaryimages, data not shown) over a range of magnifications and accel-erating voltage. The identity of each element in the samples wasconfirmed by EDX (SEM/EDX). Thermogravimetric analysis (TGA)was performed using a Thermal Advantage Q50 with a platinumpan, balance N2 flow 40 ml min−1 and sample N2 flow 60 ml min−1.The X-ray diffraction (XRD) pattern of the catalysts were obtainedusing a Rigaku D/MAX-PC 2500 X-ray diffractometer with a CuK�(� = 1.54 A) radiation source operating at 40 kV and 200 mA. X-ray photoelectron spectroscopy (XPS) was performed using KratosAXIS 165 spectrometer, (using monochromatic Al K� radiations ofenergy 1486.6 eV). High-resolution spectra were taken at fixed passenergy of 20 eV. The surface charge was efficiently neutralised byflooding the sample surface with low energy electrons. C 1s peak at284.8 eV was used as a charge reference to determine core levelbinding energies. For peak synthesis of high-resolution spectra,a mixed Gaussian–Lorenzian function with a Shirley type back-ground subtraction were used. Relative sensitivity factors usedare from CasaXPS library containing Scofield cross-sections. Thesample powder was dusted onto double-sided adhesive tape formeasurements.
The electrochemical experiments were performed using anelectrochemical workstation (CH Instruments Inc. 900), usinga conventional three-electrode cell. A glassy carbon electrodemodified with synthesised nanomaterials served as the workingelectrode, while platinum wire and a standard Ag/AgCl electrodewere used as the counter and the reference electrode respectively.Prior to each experiment, glassy carbon electrode (geometric area,0.0707 cm2) was polished with 1.0, 0.3, 0.05 micron size aluminapowders and the electrode was sonicated in deionised water andacetone and finally washed with deionised water and dried. A typ-ical catalyst suspension was prepared by suspending 2.5 mg ofthe synthesised nanomaterials in 1 ml of water isopropyl alcoholmixture (3:1). The calculated amount of Nafion® solution (1% v/v,
diluted from the 5% Nafion® solution) was added to the suspension,to maintain the catalyst to Nafion ratio at 8:1. The mixture was soni-cated for 30 min in order to achieve uniform dispersion of particles.The suspension was then quantitatively (loading shown in Table 2)
Actua
ta
3
3c
mFnaapoaecaCPdNbdtc(tc(2p(s
t2mcro2s(tsbowirnirbcnaSt
(al
B. Singh et al. / Sensors and
ransferred onto the electrode surface using a micropipette to form thin film and dried in air at room temperature.
. Results and discussion
.1. Morphological, compositional and structuralharacterisations
TEM analysis provided clear information regarding the surfaceorphology, particle size and distribution of nanoparticles (NPs).
ig. 1 shows the transmission electron micrographs for all theanocomposites, verifying the successful nanoparticle decorationnd distribution achieved. From TEM images, dispersion of NPsppears relatively better for bi/tri-metallic nanocomposites com-ared to monometallic counterpart Pt/f-CNT. The average diameterf nanoparticles and particle size distributions (Fig. 1) were cre-ted by measuring 500 particles from randomly chosen areas inach case and TEM results are summarised in Table 1. TEM analysisonfirmed that the particle size for all the nanomaterials is within
narrow size distributions with average particle size found, Pt/f-NT (2.8 nm), Pt1Pd1/f-CNT (2.2 nm), Pt2Au1Pd1/f-CNT (2.2 nm) andt2Au1Pd1/f-CNC (2.1 nm). From the TEM studies and particle sizeistribution histograms (Fig. 1) of all the nanocomposites, thePs were well dispersed and decorated on the surface of carbon-ased materials (f-CNTs and f-CNCs) within a narrow particle sizeistribution. The average particle size for bi/trimetallic composi-ions (2.1–2.2 nm) are relatively smaller than the monometallicounterpart Pt/f-CNT (2.8 nm) and is smallest for Pt2Au1Pd1/f-CNC2.1 nm). This together with median/mode data collectively explainhe role of bi/trimetallic compositions and support materials in effi-ient NPs decoration and distribution. For CNC supported catalystPt2Au1Pd1/f-CNC), majority of NPs is within the range of approx.
nm, which further explains uniform particle distribution. EDXrofiles (Fig. S2, ESI) confirm the identity and presence of elementsPt, Au and Pd in addition to C and O from the functionalised carbonupports).
Thermogravimetric analysis (TGA) provided confirmation of theotal weight % of metal content on carbon supports (theoretically0% metal loading on 80% carbon supports). Fig. 2 shows the ther-ogravimetric profiles; (a) as received (before functionalistion)
arbon nanotubes and carbon nanochips over the temperatureange 20◦–900 ◦C and (b) for labelled metallic nanocomposites,ver the temperature range 20◦–800 ◦C. A temperature ramp of0 ◦C/min up to 600 ◦C in N2 gas environment, followed by theame temperature ramp (after 600 ◦C) but in the presence of O2for ready oxidation of stable support materials) was applied beforehe final stable residue weights were obtained. In blank carbonupports (carbon nanotubes and carbon nanochips, Fig. 2(a)), a sta-le response (compared to nanoparticle decorated materials) wasbserved initially approximately up to 450 ◦C, followed by rapideight loss due to carbon degradation/oxidation before resulting
nto stable residue response. From the stable residue response,esidue weight of 0.8% for carbon nanotubes and 1.0% for carbonanochips were found, which could either be due to the metal
mpurities left during the synthesis of these carbon support mate-ials or due to any possible instrumental error or a combination ofoth. These residue weights were found for the as such receivedarbon materials. We treated the carbon nanotubes and carbonanochips in acid solution for further purification and function-lisation (as explained in functionalisation of carbon supports,ection 2.2) before subsequent deposition of nanoparticles in allhe nanocomposites.
In the thermogravimetric profiles for metallic nanocompoistesFig. 2 (b)), the slight initial weight loss (say up to 450 ◦C) isttributed to the loss of residual water and functional groups fol-owed by rapid weight loss due to carbon degradation/oxidation.
tors B 205 (2014) 401–410 403
Fig. S3 (ESI) shows the TGA and differential TG (DTG) curves for(a) Pt/f-CNT and (b) Pt2Au1Pd1/f-CNC nanocomposites, black line(TGA profile) and blue line (DTG profile). The comparison showsthat for both the nanocomposites, the major weight loss occur ataround 600 ◦C (peaks in DTG profiles). In both the materials, theinitial weight loss (5–7%) is due to loss of residual water, followedby slow carbon degradation (15–18%, ∼400–600 ◦C). The major andsharp weight loss for Pt/f-CNT (54.4%) and Pt2Au1Pd1/f-CNC (59.3%)occurred at ∼600 ◦C, which completes around 650 ◦C for both thematerials. The sharp weight loss within this region (600–650 ◦C)is due to the ready oxidation of carbon supports, due to the pres-ence of O2 (temp. ramp 20 ◦C/min, 600 ◦C–800 ◦C, is in the presenceof oxygen). Similar behaviour was observed for other nanocom-posites (Pt1Pd1/f-CNT and Pt2Au1Pd1/f-CNT). The stable residuemetallic wt (%), after 655 ◦C onwards, was observed for all themetallic nanocomposites, and the metallic weight (wt %) for Pt/f-CNT (20.6%), Pt1Pd1/f-CNT (21.2%), Pt2Au1Pd1/f-CNT (21.4%) andPt2Au1Pd1/f-CNC (20.7%) were quantified. The results are in goodagreement with the experimental metal loading (20%, w/w).
The X-ray diffraction patterns for all the nanocomposites areshown in Fig. 3(a). A small peak centered at approximately 26.2◦
for f-CNT supported catalysts and at 26.7◦ for f-CNC supportedtrimetallic catalyst corresponds to carbon and again confirmsits presence in nanocomposites. The diffraction pattern of themonometallic Pt/f-CNT, showed a typical face centered cubic (fcc)structure and reveals a high degree of crystallinity in the synthe-sised catalyst and exhibits strong diffraction peaks at 2� = 40.1◦,46.5◦, 67.9◦, 81.7◦ and 86.0◦. The diffraction peaks can be indexedto (1 1 1), (2 0 0), (2 2 0), (3 1 1) and (2 2 2) reflections respectively.A more or less similar XRD pattern was observed for Pt1Pd1/f-CNTwith slight shift in peak positions showing the effect of Pd on thecrystal lattice of Pt.
The XRD patterns of trimetallic nanocomposites clearly showsets of reflections for each plane (rather than a single peak), con-firming their unalloyed nature. Fig. 3(b) shows the comparisonof Pt/f-CNT with Pt2Au1Pd1/f-CNT and it is clear that peaks cor-responding to Au were clearly observed in Pt2Au1Pd1/f-CNT inaddition to the Pt peaks and verifying the unalloyed character. Thepeaks corresponding to Au in Pt2Au1Pd1/f-CNT were observed atapproximately 38.6◦ (1 1 1), 44.7◦ (2 0 0), 65.1◦ (2 2 0) and 78.1◦
(3 1 1). A similar response was observed for Pt2Au1Pd1/f-CNC. Intrimetallic nanocomposites, the Au peak positions were observedat slightly higher positions (compared to our previous results forAu/C and Pt1Au1/C nanocomposites [13]) and showed a small shifttowards Pt positions. For better understanding, the Au (1 1 1) peakin this study was observed at 38.6◦ (Pt2Au1Pd1/f-CNT) compared to38.35◦ (Au/C) and 38.39◦ (Pt1Au1/C) [13]. This indicates the possi-bility of some alloy character in the nanocomposites in addition todominant unalloyed/bimetallic character. From comparison of thepeak positions and from Fig. 3(b), it is very clear that, Au addi-tion in trimeatllic nanocomposites clearly results in two sets ofreflections and these reflections are appeared as separate peaks(dominant unalloyed/bimetallic nature) rather than a single alloyedpeak. From all the analysis, two sets of reflections together withthe peak positions indicated that the nanoparticles are dominantlyunalloyed in nature with the possibility of some alloy character.
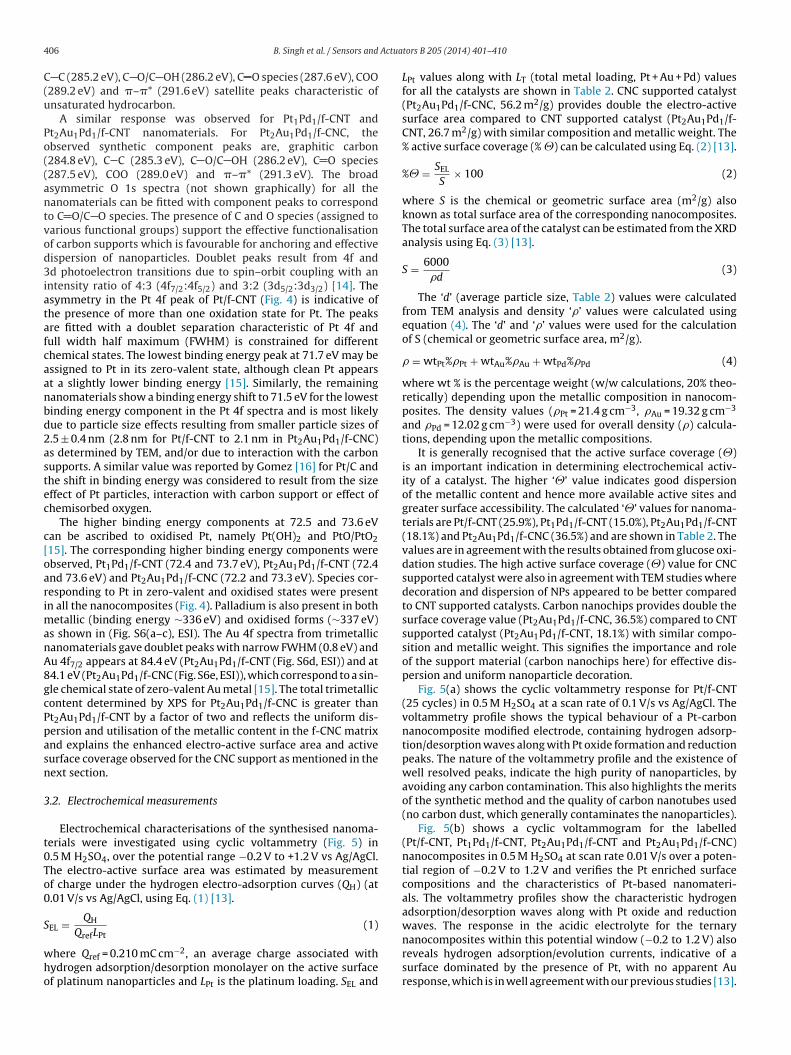
In order to investigate the oxidation states and surface species inthe nanomaterials, X-ray photoelectron spectroscopy (XPS) analy-sis was performed. Fig. 4 along with Fig. S4–S6 (ESI) summarize theXPS results for all the nanomaterials with C 1s, Pt 4f, Pd 3d and Au4f core level regions examined. Survey spectra (Fig. S4, ESI) of thenanomaterials show the presence of C, O, Pt and Au/Pd in agreement
with synthetic compositions. Fig. S5 (ESI) shows high-resolution C1s spectra which can be fitted with synthetic components to repre-sent different chemical environments. For Pt/f-CNT, the syntheticcomponent peaks can be assigned to graphitic carbon (284.8 eV),
404 B. Singh et al. / Sensors and Actuators B 205 (2014) 401–410
Fig. 1. Transmission electron micrographs (TEM, scale bar 20 nm) and particle size distributions for (a) Pt/f-CNT, (b) Pt1Pd1/f-CNT, (c) Pt2Au1Pd1/f-CNT and (d) Pt2Au1Pd1/f-CNCnanocomposite materials.
Table 1TEM results for all the nanocomposites.
Sample Avg. size 〈d〉 (nm) Median (nm) Mode (nm) Max. size (nm) Min. size (nm)
Pt/f-CNT 2.8 2.7 2.9 7.8 0.6Pt1Pd1/f-CNT 2.2 2.1 1.8 5.6 0.9Pt2Au1Pd1/f-CNT 2.2 2.2 1.8 4.9 0.7Pt2Au1Pd1/f-CNC 2.1 2.0 2.0 9.2 0.7

B. Singh et al. / Sensors and Actuators B 205 (2014) 401–410 405
200 400 600 80020
40
60
80
100
Pt/f-CN T Pt1Pd1/f-CN T Pt2Au1Pd1/f-CNT Pt2Au1Pd1/f-CNC
Temperature / 0C
Wei
ght/
(%)
100 200 300 400 500 600 700 800 9000
20
40
60
80
100
Wei
ght/
(%)
Temper ature / oC
CNT
CNC
(b)(a)
Fig. 2. Thermogravimetric profiles: (a) as recieved (before functionallisation) carbon nanotubes (CNT) and carbon nanochips (CNC), over the temperature range 20◦–900 ◦Cat temperature ramp, 20 ◦C/min. (b) labelled nanocomposites, over the temperature range 20◦–800 ◦C at temperature ramp, 20 ◦C/min.
20 40 60 80
2
4
6
8
10
12
14
2θ (degree)
Cou
nts x
103
Pt/f-CN T Pt1Pd1/f-CN T Pt2Au1Pd1/f-CN T Pt2Au1Pd1/f-CN C
20 40 60 80
3
4
5
6
7
8
9
Cou
nts x
103
2 (degre e)
Pt/f-C NT Pt2Au1Pd1/f- CNT
(b)(a)
θ
Fig. 3. XRD pattern (a) for labelled nanocomposites showing characteristic peaks of crystalline face centered (fcc) arrangements. (b) Comparison of XRD patterns for Pt/f-CNTand Pt2Au1Pd1/f-CNT, clearly shows a set of reflections for Pt2Au1Pd1/f-CNT.
(b)
(c) (d)
(a)
Fig. 4. XPS spectra of Pt 4f regions for (a) Pt/f-CNT, (b) Pt1Pd1/f-CNT, (c) Pt2Au1Pd1/f-CNT and (d) Pt2Au1Pd1/f-CNC nanocomposites, confirming the presence of differentoxidation states for Pt.
4 Actua
C(u
Po((antvod3iatafcaanbd2astec
c[oarimanA8gcPpasn
3
t0To0
S
who
06 B. Singh et al. / Sensors and
C (285.2 eV), C O/C OH (286.2 eV), C O species (287.6 eV), COO289.2 eV) and �–�* (291.6 eV) satellite peaks characteristic ofnsaturated hydrocarbon.
A similar response was observed for Pt1Pd1/f-CNT andt2Au1Pd1/f-CNT nanomaterials. For Pt2Au1Pd1/f-CNC, thebserved synthetic component peaks are, graphitic carbon284.8 eV), C C (285.3 eV), C O/C OH (286.2 eV), C O species287.5 eV), COO (289.0 eV) and �–�* (291.3 eV). The broadsymmetric O 1s spectra (not shown graphically) for all theanomaterials can be fitted with component peaks to correspondo C O/C O species. The presence of C and O species (assigned toarious functional groups) support the effective functionalisationf carbon supports which is favourable for anchoring and effectiveispersion of nanoparticles. Doublet peaks result from 4f andd photoelectron transitions due to spin–orbit coupling with an
ntensity ratio of 4:3 (4f7/2:4f5/2) and 3:2 (3d5/2:3d3/2) [14]. Thesymmetry in the Pt 4f peak of Pt/f-CNT (Fig. 4) is indicative ofhe presence of more than one oxidation state for Pt. The peaksre fitted with a doublet separation characteristic of Pt 4f andull width half maximum (FWHM) is constrained for differenthemical states. The lowest binding energy peak at 71.7 eV may bessigned to Pt in its zero-valent state, although clean Pt appearst a slightly lower binding energy [15]. Similarly, the remaininganomaterials show a binding energy shift to 71.5 eV for the lowestinding energy component in the Pt 4f spectra and is most likelyue to particle size effects resulting from smaller particle sizes of.5 ± 0.4 nm (2.8 nm for Pt/f-CNT to 2.1 nm in Pt2Au1Pd1/f-CNC)s determined by TEM, and/or due to interaction with the carbonupports. A similar value was reported by Gomez [16] for Pt/C andhe shift in binding energy was considered to result from the sizeffect of Pt particles, interaction with carbon support or effect ofhemisorbed oxygen.
The higher binding energy components at 72.5 and 73.6 eVan be ascribed to oxidised Pt, namely Pt(OH)2 and PtO/PtO215]. The corresponding higher binding energy components werebserved, Pt1Pd1/f-CNT (72.4 and 73.7 eV), Pt2Au1Pd1/f-CNT (72.4nd 73.6 eV) and Pt2Au1Pd1/f-CNC (72.2 and 73.3 eV). Species cor-esponding to Pt in zero-valent and oxidised states were presentn all the nanocomposites (Fig. 4). Palladium is also present in both
etallic (binding energy ∼336 eV) and oxidised forms (∼337 eV)s shown in (Fig. S6(a–c), ESI). The Au 4f spectra from trimetallicanomaterials gave doublet peaks with narrow FWHM (0.8 eV) andu 4f7/2 appears at 84.4 eV (Pt2Au1Pd1/f-CNT (Fig. S6d, ESI)) and at4.1 eV (Pt2Au1Pd1/f-CNC (Fig. S6e, ESI)), which correspond to a sin-le chemical state of zero-valent Au metal [15]. The total trimetallicontent determined by XPS for Pt2Au1Pd1/f-CNC is greater thant2Au1Pd1/f-CNT by a factor of two and reflects the uniform dis-ersion and utilisation of the metallic content in the f-CNC matrixnd explains the enhanced electro-active surface area and activeurface coverage observed for the CNC support as mentioned in theext section.
.2. Electrochemical measurements
Electrochemical characterisations of the synthesised nanoma-erials were investigated using cyclic voltammetry (Fig. 5) in.5 M H2SO4, over the potential range −0.2 V to +1.2 V vs Ag/AgCl.he electro-active surface area was estimated by measurementf charge under the hydrogen electro-adsorption curves (QH) (at.01 V/s vs Ag/AgCl, using Eq. (1) [13].
EL = QH (1)
QrefLPthere Qref = 0.210 mC cm−2, an average charge associated withydrogen adsorption/desorption monolayer on the active surfacef platinum nanoparticles and LPt is the platinum loading. SEL and
tors B 205 (2014) 401–410
LPt values along with LT (total metal loading, Pt + Au + Pd) valuesfor all the catalysts are shown in Table 2. CNC supported catalyst(Pt2Au1Pd1/f-CNC, 56.2 m2/g) provides double the electro-activesurface area compared to CNT supported catalyst (Pt2Au1Pd1/f-CNT, 26.7 m2/g) with similar composition and metallic weight. The% active surface coverage (% �) can be calculated using Eq. (2) [13].
%� = SEL
S× 100 (2)
where S is the chemical or geometric surface area (m2/g) alsoknown as total surface area of the corresponding nanocomposites.The total surface area of the catalyst can be estimated from the XRDanalysis using Eq. (3) [13].
S = 6000�d
(3)
The ‘d’ (average particle size, Table 2) values were calculatedfrom TEM analysis and density ‘�’ values were calculated usingequation (4). The ‘d’ and ‘�’ values were used for the calculationof S (chemical or geometric surface area, m2/g).
� = wtPt%�Pt + wtAu%�Au + wtPd%�Pd (4)
where wt % is the percentage weight (w/w calculations, 20% theo-retically) depending upon the metallic composition in nanocom-posites. The density values (�Pt = 21.4 g cm−3, �Au = 19.32 g cm−3
and �Pd = 12.02 g cm−3) were used for overall density (�) calcula-tions, depending upon the metallic compositions.
It is generally recognised that the active surface coverage (�)is an important indication in determining electrochemical activ-ity of a catalyst. The higher ‘�’ value indicates good dispersionof the metallic content and hence more available active sites andgreater surface accessibility. The calculated ‘�’ values for nanoma-terials are Pt/f-CNT (25.9%), Pt1Pd1/f-CNT (15.0%), Pt2Au1Pd1/f-CNT(18.1%) and Pt2Au1Pd1/f-CNC (36.5%) and are shown in Table 2. Thevalues are in agreement with the results obtained from glucose oxi-dation studies. The high active surface coverage (�) value for CNCsupported catalyst were also in agreement with TEM studies wheredecoration and dispersion of NPs appeared to be better comparedto CNT supported catalysts. Carbon nanochips provides double thesurface coverage value (Pt2Au1Pd1/f-CNC, 36.5%) compared to CNTsupported catalyst (Pt2Au1Pd1/f-CNT, 18.1%) with similar compo-sition and metallic weight. This signifies the importance and roleof the support material (carbon nanochips here) for effective dis-persion and uniform nanoparticle decoration.
Fig. 5(a) shows the cyclic voltammetry response for Pt/f-CNT(25 cycles) in 0.5 M H2SO4 at a scan rate of 0.1 V/s vs Ag/AgCl. Thevoltammetry profile shows the typical behaviour of a Pt-carbonnanocomposite modified electrode, containing hydrogen adsorp-tion/desorption waves along with Pt oxide formation and reductionpeaks. The nature of the voltammetry profile and the existence ofwell resolved peaks, indicate the high purity of nanoparticles, byavoiding any carbon contamination. This also highlights the meritsof the synthetic method and the quality of carbon nanotubes used(no carbon dust, which generally contaminates the nanoparticles).
Fig. 5(b) shows a cyclic voltammogram for the labelled(Pt/f-CNT, Pt1Pd1/f-CNT, Pt2Au1Pd1/f-CNT and Pt2Au1Pd1/f-CNC)nanocomposites in 0.5 M H2SO4 at scan rate 0.01 V/s over a poten-tial region of −0.2 V to 1.2 V and verifies the Pt enriched surfacecompositions and the characteristics of Pt-based nanomateri-als. The voltammetry profiles show the characteristic hydrogenadsorption/desorption waves along with Pt oxide and reductionwaves. The response in the acidic electrolyte for the ternary
nanocomposites within this potential window (−0.2 to 1.2 V) alsoreveals hydrogen adsorption/evolution currents, indicative of asurface dominated by the presence of Pt, with no apparent Auresponse, which is in well agreement with our previous studies [13].
B. Singh et al. / Sensors and Actuators B 205 (2014) 401–410 407
-0.2 0.0 0.2 0.4 0.6 0.8 1.0
-0.4
-0.2
0.0
0.2
Cur
rent
/mA
Pt/f-CN T Pt1Pd1/f-CNT Pt2Pd1Au1/f-CNT Pt2Pd1Au1/f-CNC
-0.2 0.0 0.2 0.4 0.6 0.8 1.0 1.2
-0.6
-0.4
-0.2
0.0
0.2
0.4
Cur
rent
/mA
Pote ntial/ V
Pt oxidation
Pt oxide redu ction
AdsorptionH++ e- => Hads
DesorptionHads => H++ e-
Pt/f-CNT (b)(a)
F at scan
Tns
pgtafIvttcvp
fpvsr1p((Tmpo(ccsmtmg
TC
〈(i(
ig. 5. (a) Cyclic voltammetric response (25 cycles) for Pt/f-CNT in 0.5 M H2SO4
anocomposites (labelled) in 0.5 M H2SO4 at scan rate 0.01 V/s vs Ag/AgCl.
he hydrogen adsorption/evolution response for bi/tri-metallicanocomposites does not completely resemble to that of Pt/f-CNT,ignifying the effect of the presence of Au and Pd.
As mentioned in our previous report [13], that bimetallic com-ositions are notably affected by adsorbates from the surroundingaseous environment and the metal having the highest affinity forhese adsorbates will preferentially segregate to the surface. It islso mentioned that in the presence of ligands such as CO, sur-aces of Pt–Au-based bimetallic particles become enriched with Pt.t seems that CO like species forms strong bonds with Pt and pro-ides a driving force for pulling Pt atoms to the surface. It is plausiblehat oxygen, towards which Pt has the higher affinity and formshe more stable oxide, shows a similar behaviour. The XPS studiesonfirmed the presence of Pt oxide species and support this obser-ation as well as the Pt surface enrichment in agreement with ourrevious studies [13].
The stability response (continuous potential cycling, 25 cycles)or the nanocomposite modified electrodes in 0.5 M H2SO4 isrovided in supplementary information (Fig. S7). The maximumariation (in acidic conditions, 0.5 M H2SO4) in current responseeems to occur at around 0.6 V (Pt oxide reduction wave) withespect to cycling (25 cycles) over the potential range −0.2 V to.2 V. The current responses for 2nd and 25th cycles were com-ared and the catalysts demonstrated quite stable responses with%) decrease in electro-activity–Pt/f-CNT (14.2%), Pt1Pd1/f-CNT14.8%), Pt2Au1Pd1/f-CNT (13.7%) and Pt2Au1Pd1/f-CNC (17.3%).hough the (%) activity decrease is more or less same for all theaterials but CNC-based catalyst (Pt2Au1Pd1/f-CNC) exhibits least
eak shifting (3.8 mV) among all the materials during continu-us potential cycling (25 cycles). The similar CNT-based materialPt2Au1Pd1/f-CNT) shows 16.6 mV peak shifting for the similaromparison (continuous potential cycling, 25 cycles), which indi-ates the associated stability and superior nature for the CNCupport. Overall, data indicate that the interaction between the
etallic content and carbon supports is quite strong with respecto cycling over this potential range and the nanocomposite/nafionodified electrodes are stable enough for further amperometric
lucose determination studies.
able 2ompositional (weight%, loading), electrochemical and amperometric results for all the n
Catalyst 〈d〉 (nm) wt (%) LPt (�g) LT (�g)
Pt/f-CNT 2.8 20.6 10.30 10.30
Pt1Pd1/f-CNT 2.2 21.2 5.30 10.60
Pt2Au1Pd1/f-CNT 2.2 21.4 5.35 10.70
Pt2Au1Pd1/f-CNC 2.1 20.7 5.17 10.35
d〉 is the average particle size (nm) from TEM analysis, wt is the weight in (%) obtained from�g, based upon metallic weight calculations using TGA analysis). S is the chemical or geos the active surface coverage. �1 is the sensitivity (�A mM−1 cm−2) for glucose detecti1–10 mM).
Potential/V
n rate 0.1 V/s vs Ag/AgCl. (b) Cyclic voltammetric responses (1 cycle) for all the
3.3. Glucose electro-oxidation studies
Fig. 6(a) shows cyclic voltammetry response for Pt1Pd1/f-CNTmodified glassy carbon electrode in (1) absence and (2) in presenceof 20 mM glucose in phosphate buffer saline solution (PBS, pH 7.4)at scan rate 0.02 V/s vs Ag/AgCl. The peak current increased overthe potential range (+0.40 to 0.45 V) following glucose addition. Asimilar response was observed for all the nanocomposites undersimilar operating conditions. From all the cyclic voltammetry mea-surements, the applied potentials of 0.43 V was chosen for furtheramperometric studies.
Fig. 6(b) shows the amperometric response for Pt/f-CNTnanocomposite, immobilised at a glassy carbon electrode inphosphate buffer solution (pH 7.4) over the glucose concen-tration level 1–10 mM (Eapp = 0.43 V vs Ag/AgCl). The sensitivity(�A mM−1 cm−2) was determined using a calibration plot, and thesensitivity value (� = 20.3 �A mM−1 cm−2) was calculated for Pt/f-CNT. The catalyst exhibits good sensitivity response in terms of�A mM−1 cm−2 (�1 = 20.3) as well as in terms of �A mM−1 cm−2
per �g Pt (�2 = 1.97), but the response was not stable enoughwith increased glucose additions as is evident from the amper-ometric response. The Pt/f-CNT showed a large response forthe initial glucose additions (1 mM each), which decreases andbecomes noisy with increased glucose concentration (with glucoseadditions) in phosphate buffer solution. This reflects a com-mon problem of monometallic Pt-based electrodes, i.e. surfacefouling and poisoning effects due to the accumulation of inter-mediate and product species. This is one of the reasons, whywe have chosen the binary/ternary catalytic systems to improvethe sensitivity response (even with reduced Pt content) and Ptutility.
Fig. 6(c) shows the amperometric responses for (1) Pt1Pd1/f-CNT, (2) Pt2Au1Pd1/f-CNT and (3) Pt2Au1Pd1/f-CNC nanocom-posites, immobilised at glassy carbon electrode in phosphate
buffer solution (pH 7.4) over the glucose concentration level1–10 mM (Eapp = 0.43 V vs Ag/AgCl). All the nanocompositesshowed excellent performance towards glucose determination. Thesensitivity (�A mM−1 cm−2) and limit of detection (�M) for theanocomposites.
S (m2/g) SEL (m2/g) � (%) �1 �2
100 25.9 25.9 20.3 1.97163 24.4 15.0 7.4 1.40147 26.7 18.1 8.4 1.57154 56.2 36.5 11.2 2.17
TGA analysis. LPt and LT are the Pt and total metal (Pt + Au + Pd) loading respectivelymetric surface area in m2/g. SEL is the electro-active surface area in m2/g. � (=SEL/S)on (1–10 mM). �2 is the sensitivity (�A m M−1 cm−2/�g Pt) for glucose detection

408 B. Singh et al. / Sensors and Actuators B 205 (2014) 401–410
500 1000 1500 20000
2
4
6
8
Cur
rent
/
Time/s
(1)
(2)
(3)
0 2 4 6 8 10
0
2
4
6
8
10
Cur
rent
/μΑΑ
Glucose Conc./ mM
-0.6 -0.4 -0.2 0.0 0.2 0.4 0.6 0.8-40
-20
0
20
40
60
Potential/V
Cur
rent
/ 1
2
500 1000 1500 20000
5
10
15
Time/s
Cur
rent
/
(c) (d)
(1)
(2)
(3)
1 mM
10 mM
μ ΑΑμ ΑΑμ ΑΑ
(b)(a)
Fig. 6. (a) Cyclic voltammetric response for Pt1Pd1/f-CNT modified electrode in the (1) absence and (2) presence of 20 mM glucose in PBS (pH 7.4) at scan rate 0.02 V/svs Ag/AgCl. (b) Amperometric response for Pt/f-CNT in PBS (pH 7.4, glucose level (1–10 mM)) at Eapp = 0.43 V vs Ag/AgCl. (c) Comparison of amperometric response for (1)Pt1Pd1/f-CNT, (2) Pt2Au1Pd1/f-CNT and (3) Pt2Au1Pd1/f-CNC in PBS (pH 7.4, glucose level (1–10 mM)) at Eapp = 0.43 V vs Ag/AgCl. (d) Calibration curves for (1) Pt1Pd1/f-CNT,(
e(opC(l(
s(C1Psawicwfdrwv(mabi
2) Pt2Au1Pd1/f-CNT and (3) Pt2Au1Pd1/f-CNC nanomaterials.
lectrocatalysts were determined by plotting calibration curvesFig. 6(d)) over the range 1–10 mM glucose. The observed orderf sensitivity (�A mM−1 cm−2) for the binary/ternary nanocom-osites follows the trend, Pt2Au1Pd1/f-CNC (11.24) > Pt2Au1Pd1/f-NT (8.36) > Pt1Pd1/f-CNT (7.40). The order of sensitivity in�A mM−1 cm−2 per �g of Pt) for the nanocomposites also fol-ows the same trend, Pt2Au1Pd1/f-CNC (2.17) > Pt2Au1Pd1/f-CNT1.57) > Pt1Pd1/f-CNC (1.4).
The sensitivity results among binary/ternary compo-itions (Pt = 10%), demonstrated that Pt2Au1Pd1/f-CNC11.7 �A mM−1 cm−2) showed the best performance. Pt2Au1Pd1/f-NC resulted in sensitivity (�A mM−1 cm−2/�g Pt) improvement,.4 times that shown by Pt2Au1Pd1/f-CNT and 1.55 times oft1Pd1/f-CNT. This clearly demonstrates the importance of theupport material and confirmed that the carbon nanochips aren excellent material for effective NPs dispersion and decorationhich resulted in optimum utilisation of precious Pt and in activity
mprovement. Carbon nanochips are much easier to functionaliseompared to nanotubes, which is also supported by TEM analysishere improved dispersion and decoration of NPs were achieved
or CNC-based catalyst. The uniform and excellent nanoparticlesispersion achieved for carbon nanochips, explains the improvedesponse for Pt2Au1Pd1/f-CNC compared to Pt2Au1Pd1/f-CNT,ith the same composition and metallic content. Studies are a
aluable aid in providing an excellent choice of support materialCNCs) which could be an alternative to CNTs (one of best carbon
aterials used in catalysis). Results (sensitivity comparison above)lso demonstrated the importance of Au addition to the Pt/Pd-ased nanocomposites as Au addition favours the enhancement
n response (possibly due to the high stability associated with Au
and due to its promoting effect) and Pt2Au1Pd1/CNT resulted insensitivity 1.12 times that shown by Pt1Pd1/f-CNT. The presenceof Au helps in reducing Pd content from 10% (Pt1Pd1/f-CNT) to5% (Pt2Au1Pd1/f-CNT), can modify the surface structure, whichseems the reason for the improved response for Pt2Au1Pd1/f-CNTcompared to Pt1Pd1/f-CNT.
From the investigations and results, it is clear that the sup-port material (carbon nanochips) is the major factor (togetherwith possibly some contribution from the presence of Au, particlesize and effective surface utility of precious Pt) which contributestoward observed response for glucose electro-oxidation. The over-all aim was to reduce precious Pt content and to demonstratethe use of carbon nanochips as an excellent support and weachieved it successfully without compromising the performance.The best response was achieved for Pt2Au1Pd1/f-CNC material(sensitivity = 11.24 �A mM−1 cm−2 and limit of detection (LoD,S/N = 3) = 2.9 �M) in neutral pH conditions. It may be concludedthat the bi-trimetallic nanocomposites showed sensitive and stableresponses compared to Pt/f-CNT and the optimised applied poten-tial (Eapp = 0.43 V) provided sufficient surface active sites for glucoseelectro-oxidation and avoided the accumulation of intermediatespecies on the electrocatalyst surface. Pt-based alloy/bimetallic cat-alysts are well known for activity improvement which has beenattributed to the so-called bifunctional, ensemble and/or electroniceffects. The presence of Au (as well Pd) may aid in providing stabil-ity and regeneration of active sites by avoiding the accumulation of
intermediate species on catalytically active Pt sites. The Pt contentis efficiently utilised, which is well supported by the surface charac-terisations and electrochemical studies. A comparison of differentglucose sensors in terms of sensitivity, linear range and applied
B. Singh et al. / Sensors and Actua
Table 3Comparison of different enzymatic/non-enzymatic glucose sensors in terms of sen-sitivity, linear range and applied potential.
Electrode material Sensitivity(�A mM−1 cm−2)
Linear range(mM)
GOx-PVP-Os-AA/Au [17] 0.015 (0.30 V) 2–20GOx-MWNT-sol–gel/bppg [18] 0.196 (0.30 V) 0.2–20GOx-Pt-SWNT/GC [19] 2.11(0.55 V) 0.0001–5.0GOx-SWNT-PPy/Pt [20] 7.06 (0.70 V) 1–50GOx-SWNT-PVI-Os/SPE [21] 32 (0.30 V) 0.2–7.5Pt2Pb alloy [22] N.A. (−0.15 V) Up to 15Mesoporous Pt, Park et al. [23] 9.6 (0.40 V) Up to 10Porous Au [24] 11.8 (0.35 V) 2–10Nanoporous Pt [25] 1.65 10PtPbNP/MWCNT [26] 17.8 (0.30 V) Up to 11Nanoporous PtPb Networks [27] 10.8 (0.40 V) Up to 16PtPb nanowire [28] 11.25(−0.20 V) Up to 113-dimensional gold film [29] 46.6 (−0.30 V) 0.005–10MnO2/MWNTs [30] 33.19a (0.30 V) Up to 28PG/OPPyNF/CoPcTS electrode [31] 5.695a (0.40 V) 0.25–20Ni/Al-LDH/CHT electrode [32] 0.182a (0.90 V) Up to 10Nanoporous Pt-Ir [33] 93.7 (0.10 V) 0–10PtM/CNT-ionic liquid composite [34] 10.6 (−0.1 V) Up to 15Pd-Cd/GC [35] 146.21 (−0.4) 0–10Pd−SWNTs (40% Pt) [36] 160 (−0.35 V) 0.5–17Pt1Au3/C (5.55% Pt) [13] 4.7 (0.35 V) Up to 10Pt1Au3/C (9.22% Pt) [37] 27.0 (0.35 V) Up to 10Pt19.2/f-CNF80.8 (19.2% Pt) [38] 22.7 (0.51 V) Up to 10
a
pst
4
sastbimatfptsa
A
ecD(Dsi2
A
t
[[[[
[
[[
[[[[[[[[[[
[[[[[[
[
[
[
[[[
Pt/f-CNT (20.6% Pt), this work 20.3 (0.43 V) Up to 10Pt2Au1Pd1/f-CNC (10.35% Pt), this work 11.2 (0.43 V) Up to 10
Sensitivity (�A mM−1).
otential is shown in Table 3. This work with reduced Pt contenthowed good responses and the sensitivity compares well amonghe similar approaches.
. Conclusions
An efficient approach with effective Pt phase dispersion andurface utilisation in addition to role of novel carbon nanochipss an excellent support material is demonstrated. Nanocompositeshowed sensitive (best achieved for Pt2Au1Pd1/f-CNC) responsesowards glucose sensing, contradicting to common problem of Pt-ased monometallic catalysts and provide a highly desired solution
n reducing precious Pt content without compromising the perfor-ance. The synthesised materials are capable of mass production
nd are capable of stable and robust operation under environmen-al conditions (pH, temperature etc.) where enzyme-based systemsail (e.g. bioprocess monitoring). Features such as nanoparticle dis-ersion, sensitivity, low operating potential and limit of detection,ogether with the ability to respond in neutral conditions, demon-trate potential in catalytic, sensing and electrochemistry-basedpplications.
cknowledgements
Dr Baljit Singh and Prof. Eithne Dempsey thank and acknowl-dge Technological Sector Research Strand III for funding (projectode: PC06TA06). We also acknowledge Dr Wynette Redington andr Calum Dickinson at the Materials and Surface Science Institute
MSSI), University of Limerick, Ireland for XRD and TEM analysis.r Fathima Laffir acknowledge the INSPIRE programme for XPS
tudies, funded by the Irish Government’s Programme for Researchn Third Level Institutions, Cycle 4, National Development Plan007–2013.
ppendix A. Supplementary data
Supplementary material related to this article can be found, inhe online version, at http://dx.doi.org/10.1016/j.snb.2014.08.034.
tors B 205 (2014) 401–410 409
References
[1] E.S. Steigerwalt, G.A. Deluga, C.M. Lukehart, J. Phys. Chem. B 106 (2002)760–766.
[2] R. Yang, X. Qiu, H. Zhang, J. Li, W. Zhu, Z. Wang, X. Huang, L. Chen, Carbon 43(2005) 11–16.
[3] J.J. Gooding, Electrochim. Acta 50 (2005) 3049–3060.[4] G. Pagona, A.S.D. Sandanayaka, Y. Araki, J. Fan, N. Tagmatarchis, G. Charalam-
bidis, A.G. Coutsolelos, B. Boitrel, M. Yudasaka, S. Iijima, O. Ito, Adv. Funct. Mater.17 (2007) 1705–1711.
[5] B. Singh, L. Murad, F. Laffir, E. Dempsey, Nanoscale 3 (2011) 3334–3349.[6] S.J. Park, J.M. Park, S.Y. Lee, Carbon Lett. 14 (2) (2013) 121–125.[7] Z. Sun, H. Yuan, Z. Liu, B. Han, X. Zhang, Adv. Mater. 17 (2005) 2993–2997.[8] L.Q. Rong, C. Yang, Q.Y. Qian, X.H. Xia, Talanta 72 (2007) 819–824.[9] M. Yang, Y. Yang, Y. Liu, G. Shen, R. Yu, Biosens. Bioelectron. 21 (2006)
1125–1131.10] Z.H. Wen, Q. Wang, Q. Zhang, J.H. Li, Adv. Funct. Mater. 17 (2007) 2772–2778.11] Z.H. Wen, Q. Wang, J.H. Li, Adv. Funct. Mater. 18 (2008) 959–964.12] X. Xu, R. T. K. Baker, US Patent 7550611 (2009).13] B. Singh, F. Laffir, T. McCormac, E. Dempsey, Sens. Actuators B: Chem. 150 (2010)
80–92.14] D. Briggs, M.P. Seah, Practical Surface analysis, second ed., Wiley & Sons, Chich-
ester, 1990.15] NIST-XPS database, version 3.5.16] J.L. Gomez de la Fuente, S. Rojas, M.V.M. Huerta, P. Terreros, M.A. Pena, J.L.G.
Fierro, Carbon 44 (2006) 1919–1929.17] K. Sirkar, A. Revzin, M.V. Pishko, Anal. Chem. 72 (2000) 2930–2936.18] A. Salimi, R.G. Compton, R. Hallaj, Anal. Biochem. 333 (2004) 49–56.19] S. Hrapovic, Y. Liu, K.B. Male, J.H.T. Luong, Anal. Chem. 76 (2004) 1083–1088.20] M.D. Shirsat, C.O. Too, G.G. Wallace, Electroanalysis 20 (2008) 150–156.21] Q. Gao, Y. Guo, W. Zhang, H. Qi, C. Zhang, Sens. Actuators B 153 (2011) 219–225.22] Y. Sun, H. Buck, T.E. Mallouk, Anal. Chem. 73 (2001) 1599–1604.23] S. Park, T.D. Chung, H.C. Kim, Anal. Chem. 75 (2003) 3046–3049.24] Y. Li, Y.Y. Song, C. Yang, X.H. Xia, Electrochem. Commun. 9 (2007) 981–988.25] S. Joo, S. Park, T.D. Chung, H.C. Kim, Anal. Sci. 23 (2007) 277–281.26] H.F. Cui, J.S. Ye, W.D. Zhang, C.M. Li, J.H.T. Luong, F.S. Sheu, Anal. Chim. Acta 594
(2007) 175–183.27] J. Wang, D.F. Thomas, A. Chen, Anal. Chem. 80 (2008) 997–1004.28] Y. Bai, Y.Y. Sun, C.Q. Sun, Biosens. Bioelectron. 24 (2008) 579–585.29] Y. Bai, W. Yang, Y. Sun, C. Sun, Sens. Actuators B 134 (2008) 471–476.30] J. Chen, W.D. Zhang, J.S. Ye, Electrochem. Commun. 10 (2008) 1268–1271.31] L. Ozcan, Y. Sahin, H. Turk, Biosens. Bioelectron. 24 (2008) 512–517.32] H. Ai, X. Huang, Z. Zhu, J. Liu, Q. Chi, Y. Li, Z. Li, X. Ji, Biosens. Bioelectron. 24
(2008) 1048–1052.33] P.H. Hindle, S. Nigro, M. Asmussen, A. Chen, Electrochem. Commun. 10 (2008)
1438–1441.34] F. Xiao, F. Zhao, D. Mei, Z. Mo, B. Zeng, Biosens. Bioelectron. 24 (2009)
3481–3486.35] A. Ahmadalinezhad, S. Chatterjee, A. Chen, Electrochim. Acta 112 (2013)
927–932.36] L. Meng, J. Jin, G. Yang, T. Lu, H. Zhang, C. Cai, Anal. Chem. 81 (2009) 7271–7280.37] B. Singh, E. Dempsey, ECS J. Solid State Sci. Technol. 1 (3) (2012) M25–M32.38] B. Singh, E. Dempsey, C. Dickinson, F. Laffir, Analyst 137 (2012) 1639–1648.
Biographies
Baljit Singh (BSc, MSc, MTech, PhD, MRSC) working as a Technology Gateway Sci-entist at MiCRA-Biodiagnostics (ITT Dublin, Ireland) and contributing in the deliveryof short- and long-term industrial projects, to reinforce links with industry, IPcommercialisation, support gateway development and materials characterisationand analysis. He obtained his PhD (Nanoscaled Materials and Electrochemistry,2011) from CREATE at ITT Dublin (Ireland), Master in Technology (Advanced Chem-ical Analysis, 2007) from Indian Institute of Technology – Roorkee (IIT-Roorkee,India) and MSc in Chemistry from Kurukshetra University Kurukshetra (Haryana,India). Earlier, he worked as Senior Postdoctoral (EI Commercialisation Fund) andPostdoctoral Researcher (Innovation-Industry projects) at MiCRA-Biodiagnostics(2011–2014). Formerly, he worked as Lecturer (Chemistry) at D.A.V. CollegePehowa – Kurukshetra University, India. He has expertise and interests in nano-structured and nanoporous materials, materials chemistry/characterisation andanalysis, electrochemical technologies for human/animal diagnostics, electrochem-ical biosensor/immunosensor development, mobile ELISA technologies and deviceprototyping, laser machining, stencil/screen printing of electrodes, microfluidics andfuel cells. He has more than 10 research publications in peer-reviewed internationaljournals.
Eithne Dempsey (BSc, PhD, MRSC, CCHEM) currently manages the Centre forResearch in Electroanalytical Technology (CREATE) and is Principal Investigatorwithin the Centre of Applied Science for Health at ITT Dublin. She currently holdsthe post of extraordinary Professor of Chemistry at the University of the West-
ern Cape, South Africa. Following a PhD in electroanalytical chemistry at DublinCity University, Prof. Dempsey was employed as an EU funded postdoctoral fel-low at St. Vincent’s Hospital, Dublin, with an industrial placement at Ciba, Basel,Switzerland. She since look up a lecturing post in Physical/Analytical Chemistry atITT Dublin and has contributed to undergraduate programmes in Applied Chemistry,
4 Actua
SarM1Ppfsm
10 B. Singh et al. / Sensors and
ports Science and Health, Bioanalysis and Pharmaceutical Science at Levels 6, 7nd 8. She has been successful in the acquisition of MSc, PhD and postdoctoralesearch funding, securing >D 4.5 M from sources which include EU FP6 and 7 –arie Curie IIF and IRSES, Enterprise Ireland, Technological Sector Research Strands
and III, Environmental Protection Agency and Science Foundation Ireland. 17+
hD/MSc students have graduated under the direct supervision of Prof. Dempseyroviding a range of dissemination mechanisms, oral and poster international con-erence participation, patents and publications in peer-reviewed journals in areasuch as electroanalysis, nanomaterials, biosensor technology as applied to ani-al/human health, electrochemical ELISA and immunodiagnostics, environmentaltors B 205 (2014) 401–410
analysis, microdialysis, nanofabrication and conducting polymers. She has morethan 50 peer-reviewed publications in international journals.
Fathima Laffir received her primary degree in chemistry at the Institute of Chem-istry, Sri-Lanka. She received her PhD in 2007 at the University of Cambridge, UK
and remained within the Surface Science Group as a research assistant. In 2008,she moved to Materials and Surface Science Institute (MSSI), University of Limer-ick, Ireland as a postdoctoral researcher and since then she is responsible for theX-ray photoelectron spectrometer (XPS). Her interests are mainly in kinetics anddynamics of gas-surface interactions, heterogeneous catalysis and biomaterials.