Embed Size (px)
Citation preview
Carbon in live woodland trees in BritainNational Forest Inventory Report

2 Carbon in live woodland trees in Britain
Introduction
National forest inventories are carried out by the Forestry Commission to provide accurate, up-to-date information about the size, distribution, composition and condition of the forests and woodlands in Great Britain (GB). This information is essential for developing and monitoring policies and guidance to support sustainable forest management.
The current National Forest Inventory, which began in 2009 (the first cycle due for completion in 2014), is a multi-purpose operation that has involved the production of a forest and woodland map for GB and a continuing programme of field surveys of the mapped forest and woodland areas. Information and data collected by the National Forest Inventory will be used for a number of purposes, including estimates and 25-year forecasts of forest metrics such as:
•Standing volume
•Timber availability
•Tree growth and increment
•Carbon storage
•Biomass
Estimates of aspects of the biodiversity and social value of forests and woodlands will also be provided by the Inventory.
This Inventory Report sets out the results (as at 31 March 2011) for the amount of carbon contained in living trees within all forests and woodlands in GB. Further information on this and other National Forest Inventory outputs is available from www.forestry.gov.uk/inventory.
Carbon
The last estimate of carbon stocks within forests and woodlands in GB was published by the Forestry Commission in the 2012 Research Report Understanding the carbon and greenhouse gas balance of forests in Britain. This new report, in addition to providing the latest overall estimates of total carbon stocks, gives a breakdown of carbon by species group, ownership type and by country and National Forest Inventory region (see map on page 11).
This assessment of woodland carbon stocks will form a new baseline for carbon accounting within British forests and woodlands and it will be used in the development of the forthcoming (2015) reporting on Land Use, Land-Use Change and Forestry (LULUCF) and more directly in reporting to the United Nations Food and Agriculture Organization (FAO) for the 2015 Forest Resources Assessment.
Summary
The National Forest Inventory provides a record of the size and distribution of forests and woodlands in Great
Britain and information on key forest attributes. This Inventory Report provides an estimate of the amount of
carbon in living trees within British woodlands – including estimates for England, Scotland and Wales – broken
down by principal species and by Forestry Commission and Private sector management.
•Total carbon in all forests and woodlands in Great Britain is estimated to be 213 million tonnes of carbon
(780 million tonnes carbon dioxide equivalent (MtCO2e)). For England this is 105 million tonnes, for Scotland
85 million tonnes and for Wales 22 million tonnes.
•Total carbon for the Forestry Commission estate is estimated to be 48 million tonnes.
•Total carbon for the Private sector estate is estimated to be 165 million tonnes.
•Total carbon for coniferous trees is estimated to be 109 million tonnes.
•Total carbon for broadleaved trees is estimated to be 104 million tonnes.
Carbon is defined as carbon stored in all living plant material in both the above and below ground parts of trees (including major roots, stumps, stems, branches, twigs and foliage) in stands with a mean diameter (at breast height) of 7 cm or more. The estimates do not include carbon in young stands that have not grown to this minimum mean diameter, nor, for example, carbon in the stems of coppice that are harvested before reaching this minimum mean diameter. Also excluded is carbon in standing dead trees, growing saplings and seedlings, shrubs (except shrubs growing with the morphology of trees), other ground layer vegetation, lying dead wood, litter, soil, harvested wood products and substitution effects (e.g. avoided emissions by using timber in place of steel). See the Glossary for further explanation of the terms used in this report.

National Forest Inventory Report 3
How carbon is estimated
Estimates of total carbon are determined by:
•Woodland area.
•Woodland characteristics (e.g. tree height) within this area.
•Number and size of trees.
The estimates of carbon in this report have been derived separately for the Forestry Commission estate and for the Private sector estate. They are based on the same principles but use different data sources. For the Forestry Commission estate, information on woodland area and woodland characteristics has been extracted from the Forestry Commission’s long-established Sub-compartment database. For the Private sector estate, the estimates were derived from results obtained to date from the National Forest Inventory.
Sub-compartment database
The Sub-compartment database (SCDB) is a record of all land managed by the Forestry Commission. Each stand of trees is represented spatially, together with information on individual stand characteristics (for example species, planting year, spacing and yield class) which is periodically updated. As new surveys of stands are conducted (e.g. for operational purposes), survey results are also recorded against the stands. In addition, the SCDB contains details of how the stands are being managed – in particular, the planned frequency and type of thinning operations and a ‘due date’ for felling.
National Forest Inventory
The National Forest Inventory is composed of two elements: a woodland map and a field survey. The woodland map covers all forests and woodlands over 0.5 hectares with a minimum of 20% canopy cover (or the potential to achieve it), including new planting, clearfelled sites and restocked sites. It is based upon 25 cm resolution colour aerial photography for England and Scotland and 40 cm resolution aerial photography for Wales. The map was validated and updated using satellite imagery, which gave an independent crosscheck of woodland present. Satellite imagery was also used to identify areas of recently felled forests and woodland. Particular attention was paid to identifying areas of woodland loss verified as being due to the establishment of windfarms or the restoration of habitats.
Field survey work is used to refine the map-based estimates of woodland and clearfelled areas and to measure detailed aspects of the forest. The results in this report were derived from field surveys carried out between 2009 and 2012. This involved the ground surveying of one-hectare sample squares that were
partially or entirely covered by forest, including clearfelled areas, according to the woodland map. Further details of the mapping work and the derivation of forested areas can be found in the 2010 Woodland Area reports at www.forestry.gov.uk/inventory.
Carbon estimates
The stand attributes derived from data from the SCDB and the National Forest Inventory are used to estimate the amount of biomass contained in the living trees of the stand. Estimates exclude biomass contained in other vegetation associated with the stand (e.g. shrubs and herbs). The derivation involves the application of allometric relationships of the volume of tree components to the size and shape of trees, and species-specific estimates of wood density that convert volume to weight of biomass.* By this means, separate biomass estimates are obtained for the various components of the trees of the stand in roots, stems, branches and leaves. For the purposes of estimation, it is assumed broadleaves are in full leaf.Estimates of total carbon in the trees are derived by multiplying the biomass estimates by a value for the carbon content of tree biomass.**
Estimates for the Forestry Commission estate
Information from the SCDB was used to estimate carbon in living trees at the reference date of 31 March 2011 on a stand-by-stand basis. This was then aggregated to produce the estimated total across a defined geographic area for particular types of stand (classified, for example, by species, tree age or tree size class). For each stand, if an operational survey had been carried out close to the reference date, information from that survey was used to estimate total carbon. Otherwise, an estimate was made of the state of the stand, normally involving the application of standard Forestry Commission growth and yield models that take into account the past management of the stand. Estimated carbon is then modelled from the output of this stand modelling process.
Because the resulting estimates are based on a full record of data from the SCDB, there is no sampling error involved in the estimation process, therefore no sampling standard error is calculated. However, the nature of the estimation process within each individual stand does introduce estimation error, with variable contributions from stand to stand, due to the type, age and accuracy of the information held in the SCDB. In addition to these estimation errors, the reported carbon estimates have been derived from predictive models that estimate the amount of carbon present in stands of a given state. Application of these models introduces modelling errors in addition to estimation errors.* These estimation and modelling errors have not been quantified in this report.
*Details of the BSORT model are available from www.forestry.gov.uk/forecast. **Details are available in Forestry Commission Technical Paper 4: The carbon content of trees.

4 Carbon in live woodland trees in Britain
Estimates for the Private sector estate
Forests on the National Forest Inventory woodland map were first separated into Forestry Commission estate and Private sector estate holdings using Forestry Commission spatial records of management boundaries. Estimates of carbon on the Private sector estate used a woodland area obtained from the map updated to 31 March 2011 (published in May 2012). This map contained a larger area (around 2.2 million hectares) of Private sector woodland than has been estimated by previous forest inventories.
Data from 4036 surveyed sample squares from the National Forest Inventory field survey were used to produce the results in this report. These sample squares represent a sub-sample of a planned 15 000 statistically representative squares covering all GB woodland that will be surveyed during this first cycle of the National Forest Inventory survey (due for completion in 2015).
At each sample square, the forest was stratified into different woodland types or stands, where information on species, age, management and a range of other parameters was collected. An average of around two stands per square was found, resulting in 8052 stands being assessed. Within each stand, field-based computer systems were used to locate two or three 100 m2 (0.01 hectare) circular plots, within which all trees of greater than or equal to 4 cm diameter at breast height (DBH) were mapped, species identified and diameters measured. A total of 228 311 trees were measured in the sample used for this report. For 59 334 of these trees, additional measurements of tree height and crown dimensions were taken. The resulting data were used to estimate total carbon in the living trees. All squares were marked on the ground with metal pegs and GPS data of their location recorded for checking and future measurement. At least 3% were re-measured by an independent quality assurance team to ensure standards. Further details of the methodology are available from www.forestry.gov.uk/forecast.
The results for individual surveyed squares were aggregated and scaled up to the areas identified by the woodland map, using standard statistical survey methodology, to produce the estimates in this report. Along with these estimates, associated sampling standard errors have also been calculated and reported in relative terms as percentages of the estimate. The sampling standard error will account for random variation arising from the selection of the sample, and random measurement errors.
It should be emphasised that, for the Private sector estimates, while large sampling standard errors indicate less reliability in the quoted estimates due principally to relatively small numbers of samples available for estimation purposes, the converse of a small sampling standard error does not in itself imply that
the quoted estimate is subject to a small amount of error. This is because, as described above, the derivation of carbon estimates at the stand and component level is based on the application of a series of modelled relationships and calculation parameters that convert the field measurements and observations in the sample squares to total tree carbon estimates. The errors and biases that may be present in these series of models and calculation parameters are not accounted for in the quoted sampling standard errors and are therefore additional, unquantified errors that may have a significant impact on the overall accuracy of the carbon estimates. More precise estimates for this sector, derived from a larger sample, will become available when the first cycle of the National Forest Inventory field survey is completed in 2015.
Results for carbon
This section provides the estimates of total carbon stocks in living trees in forests and woodlands in GB. Estimates are also provided at individual country level and at National Forest Inventory region level (see map on page 11), with breakdowns for the Forestry Commission and Private sector estates; coniferous trees and broadleaved trees; and principal tree species.
All estimates are of total carbon stocks in living trees in forests and woodlands as at 31 March 2011. The estimates are given in millions of tonnes of carbon, which should not be confused with the alternative measure of carbon storage: megatonnes carbon dioxide equivalent (MtCO
2e). The figures in the tables
may not add to the totals shown as they have been individually rounded or, in some cases for Private sector estimates, because the estimates have been independently calculated per species from slightly different samples within the survey. Sampling standard errors (SE) attached to Private sector estimates are expressed in relative terms (%) to the right of the relevant estimate. Standard errors do not include any errors arising from modelling errors (empirical and allometric) and conversion factors (volume to biomass to carbon content).
The estimate of total carbon stocks in living trees in woodlands in Great Britain is 213 million tonnes (Table 1). Of this, 48 million tonnes (23%) is estimated to be on the Forestry Commission estate and 165 million tonnes (77%) on the Private sector estate. The estimate of total carbon stocks is composed of an estimate of 109 million tonnes (51%) in coniferous trees and 104 million tonnes (49%) in broadleaved trees. These results are illustrated in Figures 1a and 1b.
Tables 2, 3 and 4 provide the equivalent estimates for England, Scotland and Wales respectively, and these are illustrated in Figures 2a, 2b, 3a, 3b, 4a and 4b.

National Forest Inventory Report 5
Figure 1a Total carbon stocks in conifer and broadleaved woodland trees in Great Britain.
All speciesBroadleavesConifers0
25 000
50 000
75 000
100 000
125 000
150 000
175 000
200 000
Car
bon
(000
tonn
es)
FC Estate Private sector Standard error
Figure 1b Share of total carbon stocks in principal woodland tree species in Great Britain.
Figure 2a Total carbon stocks in conifer and broadleaved woodland trees in England.
0
10 000
20 000
30 000
40 000
50 000
60 000
70 000
80 000
90 000
100 000
All speciesBroadleavesConifers
Car
bon
(000
tonn
es)
FC Estate Private sector Standard error
Figure 2b Share of total carbon stocks in principal woodland tree species in England.
Sitka spruceScots pineCorsican pineNorway spruceLarchDouglas firLodgepole pineOther conifersOakBeech
SycamoreAshBirchSweet chestnutHazelHawthornAlderWillowOther broadleaves
Table 1 Total carbon stocks in principal woodland tree species in Great Britain.
Principal speciesFC Private sector
Total000 t 000 t SE%
Great Britain
All conifers 42 012 67 154 2 109 165
Sitka spruce 23 870 31 129 3 54 999
Scots pine 4 716 13 084 4 17 800
Corsican pine 1 935 1 691 11 3 626
Norway spruce 1 839 3 580 8 5 418
Larches 3 064 8 165 5 11 229
Douglas fir 1 811 3 314 10 5 125
Lodgepole pine 3 767 3 128 9 6 895
Other conifers 1 009 3 007 12 4 016
All broadleaves 5 996 97 961 2 103 957
Oak 1 922 28 945 4 30 867
Beech 1 546 12 892 7 14 439
Sycamore 89 10 713 6 10 802
Ash 218 13 823 5 14 041
Birch 845 9 650 4 10 495
Sweet chestnut 61 3 010 10 3 071
Hazel 34 3 029 6 3 063
Hawthorn 0 1 710 7 1 710
Alder 64 3 848 8 3 912
Willow 0 2 394 10 2 394
Other broadleaves 1 217 8 416 6 9 633
All species 48 008 164 964 1 212 972
Table 2 Total carbon stocks in principal woodland tree species in England.
Principal speciesFC Private sector
Total000 t 000 t SE%
England
All conifers 8 593 19 104 3 27 697
Sitka spruce 2 902 2 977 9 5 879
Scots pine 1 381 5 191 7 6 572
Corsican pine 1 645 1 502 11 3 147
Norway spruce 489 1 955 10 2 444
Larches 563 3 367 7 3 930
Douglas fir 881 1 940 13 2 821
Lodgepole pine 302 411 25 713
Other conifers 430 1 792 10 2 222
All broadleaves 3 804 73 900 2 77 704
Oak 1 498 22 994 5 24 492
Beech 1 308 9 679 7 10 987
Sycamore 65 7 942 8 8 007
Ash 171 10 614 5 10 785
Birch 187 5 239 6 5 426
Sweet chestnut 57 2 901 10 2 959
Hazel 16 2 440 7 2 456
Hawthorn 0 1 416 8 1 416
Alder 26 2 443 10 2 468
Willow 0 1 797 12 1 797
Other broadleaves 476 6 771 6 7 247
All species 12 397 92 991 2 105 388

6 Carbon in live woodland trees in Britain
Figure 3a Total carbon stocks in conifer and broadleaved woodland trees in Scotland.
All speciesBroadleavesConifers
Car
bon
(000
tonn
es)
0
10 000
20 000
30 000
40 000
50 000
60 000
70 000
FC Estate Private sector Standard error
Figure 3b Share of total carbon stocks in principal woodland tree species in Scotland.
Figure 4a Total carbon stocks in conifer and broadleaved woodland trees in Wales.
0
2 500
5 000
7 500
10 000
12 500
15 000
17 500
All speciesBroadleavesConifers
Car
bon
(000
tonn
es)
FC Estate Private sector Standard error
Figure 4b Share of total carbon stocks in principal woodland tree species in Wales.
Sitka spruceScots pineCorsican pineNorway spruceLarchDouglas firLodgepole pineOther conifersOakBeech
SycamoreAshBirchSweet chestnutHazelHawthornAlderWillowOther broadleaves
Table 3 Total carbon stocks in principal woodland tree species in Scotland.
Principal speciesFC Private sector
Total000 t 000 t SE%
Scotland
All conifers 27 316 42 638 2 69 955
Sitka spruce 17 480 25 247 3 42 727
Scots pine 3 153 7 781 6 10 934
Corsican pine 107 108 49 215
Norway spruce 954 1 400 14 2 354
Larches 1 608 3 845 8 5 453
Douglas fir 488 762 23 1 249
Lodgepole pine 3 242 2 567 10 5 809
Other conifers 284 853 34 1 137
All broadleaves 1 517 14 112 5 15 630
Oak 258 2 784 14 3 042
Beech 67 2 244 17 2 311
Sycamore 19 1 629 14 1 648
Ash 18 1 148 23 1 166
Birch 632 3 883 5 4 514
Sweet chestnut 0 0 - 0
Hazel 17 170 22 187
Hawthorn 0 126 21 126
Alder 31 724 23 755
Willow 0 229 15 229
Other broadleaves 476 1 197 18 1 673
All species 28 834 56 607 2 85 441
Table 4 Total carbon stocks in principal woodland tree species in Wales.
Principal speciesFC Private sector
Total000 t 000 t SE%
Wales
All conifers 6 102 5 411 6 11 513
Sitka spruce 3 488 2 905 11 6 393
Scots pine 182 112 46 294
Corsican pine 184 81 43 265
Norway spruce 396 225 42 621
Larches 892 953 20 1 845
Douglas fir 442 612 25 1 054
Lodgepole pine 223 150 35 373
Other conifers 295 362 38 657
All broadleaves 675 9 948 6 10 623
Oak 167 3 167 14 3 334
Beech 171 969 26 1 141
Sycamore 5 1 142 22 1 148
Ash 29 2 061 16 2 090
Birch 26 529 17 555
Sweet chestnut 3 109 85 112
Hazel 1 419 19 420
Hawthorn 0 167 24 167
Alder 8 681 17 689
Willow 0 368 27 368
Other broadleaves 265 447 20 712
All species 6 777 15 365 5 22 143

National Forest Inventory Report 7
Table 5 and Figure 5 provide a comparative representation of the estimated amount of carbon in living woodland trees in Great Britain and in each of the three individual countries. They show that England is estimated to have a total of 105 million tonnes of carbon in living trees (50% of the total for Great Britain); Scotland is estimated to have 85 million tonnes (40% of GB); and Wales is estimated to have 22 million tonnes (10% of GB).
Tables 6 and 7 provide the estimates of total carbon stocks in living trees in forests and woodlands for each of the National Forest Inventory regions in England and Scotland respectively (Wales is not split into separate regions in the Inventory). These results are illustrated in Figures 6 and 7.
Figure 5 Total carbon stocks in conifer and broadleaved woodland trees in GB and countries.
GB PS England PS Scotland PS Wales PS
0
25 000
50 000
75 000
100 000
125 000
Broa
dlea
ves
Con
ifers
Broa
dlea
ves
Con
ifers
Broa
dlea
ves
Con
ifers
Broa
dlea
ves
Con
ifers
Car
bon
(000
tonn
es)
GB FC England FC Scotland FC Wales FC
Table 5 Total carbon stocks in conifer and broadleaved woodland trees in GB and countries.
CountryFC Private sector
Total000 t 000 t SE%
England
All conifers 8 593 19 104 3 27 697
All broadleaves 3 804 73 900 2 77 704
All species 12 397 92 991 2 105 388
Scotland
All conifers 27 316 42 638 2 69 955
All broadleaves 1 517 14 112 5 15 630
All species 28 834 56 607 2 85 441
Wales
All conifers 6 102 5 411 6 11 513
All broadleaves 675 9 948 6 10 623
All species 6 777 15 365 5 22 143
Great Britain
All conifers 42 012 67 154 2 109 165
All broadleaves 5 996 97 961 2 103 957
All species 48 008 164 964 1 212 972
Table 6 Total carbon stocks in principal woodland tree species in National Forest Inventory regions. England.
Principal speciesFC Private sector
Total000 t 000 t SE%
North West England
All conifers 943 1 978 8 2 921
Sitka spruce 656 861 17 1 517
Scots pine 53 257 20 310
Corsican pine 24 24 99 47
Norway spruce 23 185 27 208
Larches 94 485 16 579
Douglas fir 32 8 64 40
Lodgepole pine 46 97 60 143
Other conifers 16 63 53 80
All broadleaves 162 5 238 8 5 401
Oak 52 1 525 13 1 577
Beech 19 673 39 692
Sycamore 5 1 165 22 1 170
Ash 12 418 20 430
Birch 23 618 19 641
Sweet chestnut 2 31 82 34
Hazel 10 64 25 74
Hawthorn 0 71 25 71
Alder 2 419 19 422
Willow 0 80 28 80
Other broadleaves 36 144 25 181
All species 1 105 7 237 6 8 343

8 Carbon in live woodland trees in Britain
Table 6 (continued) England.
Principal speciesFC Private sector
Total000 t 000 t SE%
North East England
All conifers 2 268 2 364 8 4 632
Sitka spruce 1 677 676 20 2 354
Scots pine 133 767 18 900
Corsican pine 17 16 85 33
Norway spruce 177 223 36 400
Larches 70 429 28 499
Douglas fir 24 71 54 95
Lodgepole pine 149 132 48 281
Other conifers 22 50 50 72
All broadleaves 55 2 378 9 2 433
Oak 4 431 28 435
Beech 10 204 25 214
Sycamore 3 375 27 378
Ash 0 240 23 240
Birch 8 486 22 494
Sweet chestnut 0 0 - 0
Hazel 0 113 26 113
Hawthorn 0 15 32 15
Alder 3 267 32 270
Willow 0 130 59 130
Other broadleaves 27 109 17 136
All species 2 324 4 761 6 7 085
Yorkshire and the Humber
All conifers 769 1 935 6 2 704
Sitka spruce 211 562 17 773
Scots pine 234 414 14 648
Corsican pine 35 88 37 123
Norway spruce 26 142 21 168
Larches 146 468 12 614
Douglas fir 31 75 39 107
Lodgepole pine 60 122 32 182
Other conifers 26 63 27 90
All broadleaves 137 5 342 5 5 478
Oak 24 1 271 15 1 295
Beech 23 706 17 729
Sycamore 18 1 355 14 1 373
Ash 12 681 13 693
Birch 22 436 12 458
Sweet chestnut 0 39 58 39
Hazel 0 39 24 39
Hawthorn 0 107 15 107
Alder 1 232 21 233
Willow 0 109 21 109
Other broadleaves 36 376 12 412
All species 906 7 269 4 8 175
Principal speciesFC Private sector
Total000 t 000 t SE%
East Midlands
All conifers 563 858 16 1 421
Sitka spruce 19 2 110 21
Scots pine 167 519 26 686
Corsican pine 280 122 33 403
Norway spruce 22 72 36 94
Larches 16 105 26 121
Douglas fir 7 23 81 30
Lodgepole pine 24 0 - 24
Other conifers 27 15 59 42
All broadleaves 430 5 201 7 5 631
Oak 224 1 399 15 1 623
Beech 38 67 32 105
Sycamore 11 766 21 777
Ash 61 1 354 20 1 415
Birch 29 245 21 274
Sweet chestnut 4 167 50 171
Hazel 0 97 22 98
Hawthorn 0 224 20 224
Alder 1 51 63 52
Willow 0 131 41 131
Other broadleaves 63 698 18 761
All species 993 6 058 6 7 051
East England
All conifers 1 053 1 497 9 2 550
Sitka spruce 0 12 70 12
Scots pine 261 669 16 931
Corsican pine 710 371 23 1 081
Norway spruce 4 101 33 105
Larches 11 178 25 190
Douglas fir 38 79 37 117
Lodgepole pine 1 0 - 1
Other conifers 26 87 33 113
All broadleaves 245 8 052 6 8 297
Oak 69 2 324 15 2 393
Beech 74 718 22 792
Sycamore 6 1 050 21 1 056
Ash 16 1 015 18 1 031
Birch 24 454 21 478
Sweet chestnut 6 411 30 417
Hazel 1 123 26 124
Hawthorn 0 60 19 60
Alder 4 229 53 232
Willow 0 263 48 263
Other broadleaves 46 1 406 18 1 452
All species 1 298 9 549 5 10 847

National Forest Inventory Report 9
Principal speciesFC Private sector
Total000 t 000 t SE%
West Midlands
All conifers 615 2 443 12 3 058
Sitka spruce 30 115 64 145
Scots pine 108 634 27 742
Corsican pine 121 288 33 408
Norway spruce 37 362 30 398
Larches 69 417 24 486
Douglas fir 199 273 37 472
Lodgepole pine 9 50 73 60
Other conifers 43 304 32 347
All broadleaves 178 8 867 8 9 045
Oak 67 3 523 16 3 590
Beech 42 617 35 659
Sycamore 4 969 36 973
Ash 10 1 236 21 1 246
Birch 15 474 25 490
Sweet chestnut 3 299 35 302
Hazel 1 325 25 326
Hawthorn 0 169 20 169
Alder 2 272 34 274
Willow 0 147 28 147
Other broadleaves 34 842 25 877
All species 792 11 330 6 12 123
Table 6 (continued) England.
Principal speciesFC Private sector
Total000 t 000 t SE%
South East England and London
All conifers 993 3 766 6 4 759
Sitka spruce 4 64 43 68
Scots pine 305 1 430 13 1 735
Corsican pine 259 395 21 653
Norway spruce 76 386 16 462
Larches 43 538 15 581
Douglas fir 167 313 23 479
Lodgepole pine 2 6 107 8
Other conifers 137 651 17 788
All broadleaves 1 855 21 259 3 23 114
Oak 805 6 390 7 7 195
Beech 821 4 170 10 4 992
Sycamore 9 742 20 750
Ash 27 2 627 9 2 653
Birch 47 1 871 8 1 917
Sweet chestnut 18 1 290 13 1 307
Hazel 1 918 11 919
Hawthorn 0 440 14 440
Alder 9 426 26 435
Willow 0 294 17 294
Other broadleaves 119 2 160 10 2 280
All species 2 848 24 972 3 27 820
South West England
All conifers 1 390 4 263 6 5 653
Sitka spruce 305 685 20 990
Scots pine 120 501 18 621
Corsican pine 199 199 29 398
Norway spruce 124 485 18 610
Larches 113 748 14 861
Douglas fir 384 1 098 19 1 482
Lodgepole pine 11 3 105 14
Other conifers 132 558 17 690
All broadleaves 741 17 564 5 18 305
Oak 253 6 131 10 6 384
Beech 281 2 524 15 2 804
Sycamore 9 1 521 13 1 529
Ash 35 3 044 8 3 078
Birch 20 655 13 675
Sweet chestnut 24 664 24 688
Hazel 2 762 13 764
Hawthorn 0 330 20 330
Alder 4 546 20 551
Willow 0 644 19 644
Other broadleaves 114 1 036 13 1 150
All species 2 131 21 815 4 23 946
Figure 6 Total carbon stocks in conifer and broadleaved woodland trees in National Forestry Inventory regions of England.
0
5 000
10 000
15 000
20 000
25 000
Broa
dlea
ves
Con
ifers
Car
bon
(000
tonn
es)
FC Estate Private sector
Broa
dlea
ves
Con
ifers
Broa
dlea
ves
Con
ifers
Broa
dlea
ves
Con
ifers
Broa
dlea
ves
Con
ifers
Broa
dlea
ves
Con
ifers
Broa
dlea
ves
Con
ifers
Broa
dlea
ves
Con
ifers
NW NE Yorks* EastMidlands
WestMidlands
E SE SW
*Yorks = Yorkshire and the Humber
10 Carbon in live woodland trees in Britain
Principal speciesFC Private sector
Total000 t 000 t SE%
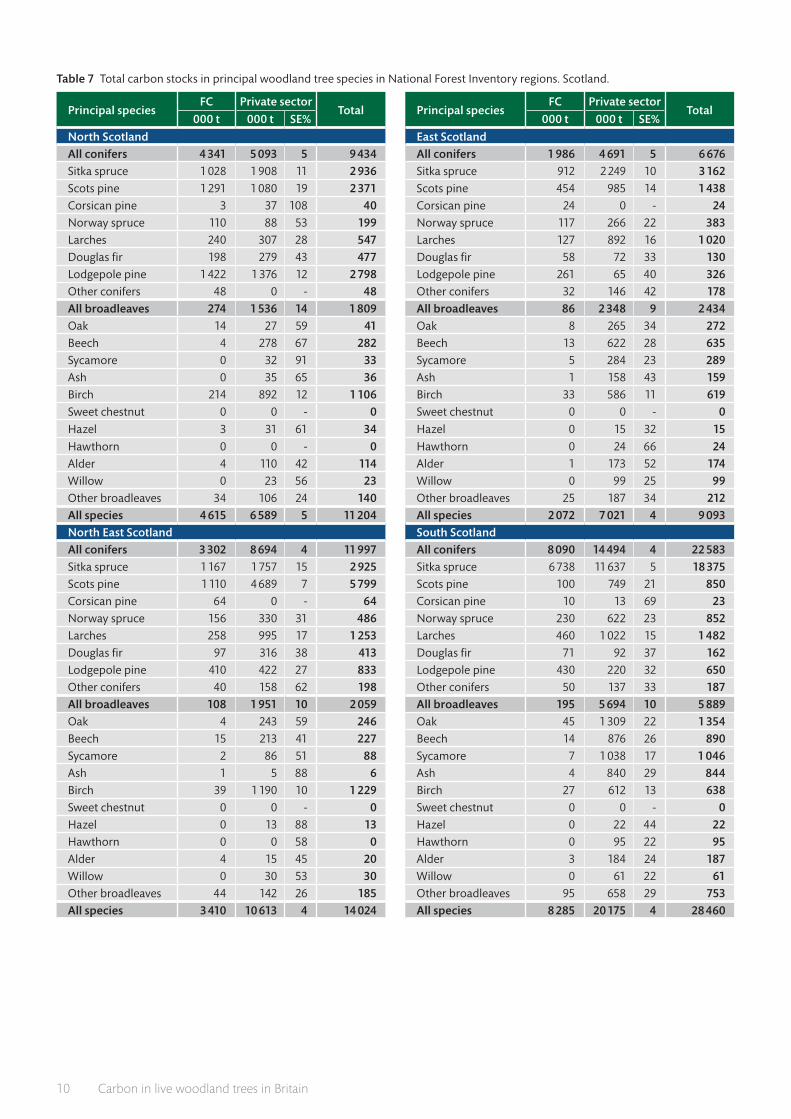
North Scotland
All conifers 4 341 5 093 5 9 434
Sitka spruce 1 028 1 908 11 2 936
Scots pine 1 291 1 080 19 2 371
Corsican pine 3 37 108 40
Norway spruce 110 88 53 199
Larches 240 307 28 547
Douglas fir 198 279 43 477
Lodgepole pine 1 422 1 376 12 2 798
Other conifers 48 0 - 48
All broadleaves 274 1 536 14 1 809
Oak 14 27 59 41
Beech 4 278 67 282
Sycamore 0 32 91 33
Ash 0 35 65 36
Birch 214 892 12 1 106
Sweet chestnut 0 0 - 0
Hazel 3 31 61 34
Hawthorn 0 0 - 0
Alder 4 110 42 114
Willow 0 23 56 23
Other broadleaves 34 106 24 140
All species 4 615 6 589 5 11 204
North East Scotland
All conifers 3 302 8 694 4 11 997
Sitka spruce 1 167 1 757 15 2 925
Scots pine 1 110 4 689 7 5 799
Corsican pine 64 0 - 64
Norway spruce 156 330 31 486
Larches 258 995 17 1 253
Douglas fir 97 316 38 413
Lodgepole pine 410 422 27 833
Other conifers 40 158 62 198
All broadleaves 108 1 951 10 2 059
Oak 4 243 59 246
Beech 15 213 41 227
Sycamore 2 86 51 88
Ash 1 5 88 6
Birch 39 1 190 10 1 229
Sweet chestnut 0 0 - 0
Hazel 0 13 88 13
Hawthorn 0 0 58 0
Alder 4 15 45 20
Willow 0 30 53 30
Other broadleaves 44 142 26 185
All species 3 410 10 613 4 14 024
Principal speciesFC Private sector
Total000 t 000 t SE%
East Scotland
All conifers 1 986 4 691 5 6 676
Sitka spruce 912 2 249 10 3 162
Scots pine 454 985 14 1 438
Corsican pine 24 0 - 24
Norway spruce 117 266 22 383
Larches 127 892 16 1 020
Douglas fir 58 72 33 130
Lodgepole pine 261 65 40 326
Other conifers 32 146 42 178
All broadleaves 86 2 348 9 2 434
Oak 8 265 34 272
Beech 13 622 28 635
Sycamore 5 284 23 289
Ash 1 158 43 159
Birch 33 586 11 619
Sweet chestnut 0 0 - 0
Hazel 0 15 32 15
Hawthorn 0 24 66 24
Alder 1 173 52 174
Willow 0 99 25 99
Other broadleaves 25 187 34 212
All species 2 072 7 021 4 9 093
South Scotland
All conifers 8 090 14 494 4 22 583
Sitka spruce 6 738 11 637 5 18 375
Scots pine 100 749 21 850
Corsican pine 10 13 69 23
Norway spruce 230 622 23 852
Larches 460 1 022 15 1 482
Douglas fir 71 92 37 162
Lodgepole pine 430 220 32 650
Other conifers 50 137 33 187
All broadleaves 195 5 694 10 5 889
Oak 45 1 309 22 1 354
Beech 14 876 26 890
Sycamore 7 1 038 17 1 046
Ash 4 840 29 844
Birch 27 612 13 638
Sweet chestnut 0 0 - 0
Hazel 0 22 44 22
Hawthorn 0 95 22 95
Alder 3 184 24 187
Willow 0 61 22 61
Other broadleaves 95 658 29 753
All species 8 285 20 175 4 28 460
Table 7 Total carbon stocks in principal woodland tree species in National Forest Inventory regions. Scotland.

National Forest Inventory Report 11
Figure 7 Total carbon stocks in conifer and broadleaved woodland trees in National Forest Inventory regions of Scotland.
0
5 000
10 000
15 000
20 000
25 000
Car
bon
(000
tonn
es)
FC Estate Private sector
Broa
dlea
ves
Con
ifers
NorthScotland
North EastScotland
EastScotland
SouthScotland
WestScotland
Broa
dlea
ves
Con
ifers
Broa
dlea
ves
Con
ifers
Broa
dlea
ves
Con
ifers
Broa
dlea
ves
Con
ifers
Table 7 (continued) Scotland.
Principal speciesFC Private sector
Total000 t 000 t SE%
West Scotland
All conifers 9 597 9 667 5 19 265
Sitka spruce 7 634 7 696 5 15 330
Scots pine 197 278 32 475
Corsican pine 6 58 58 64
Norway spruce 341 93 64 434
Larches 524 628 20 1 152
Douglas fir 63 3 84 67
Lodgepole pine 718 484 24 1 203
Other conifers 114 412 63 526
All broadleaves 854 2 584 13 3 438
Oak 187 941 22 1 128
Beech 21 256 65 277
Sycamore 4 188 70 193
Ash 12 108 45 121
Birch 319 603 13 922
Sweet chestnut 0 0 - 0
Hazel 14 90 31 104
Hawthorn 0 7 77 7
Alder 18 242 50 260
Willow 0 16 37 16
Other broadleaves 278 104 43 382
All species 10 452 12 208 5 22 660
The National Forest Inventory regions.
NorthScotland
North EastScotland
EastScotland
SouthScotland
NorthEast
England
NorthWest
England
Yorkshire &the Humber
East Midlands
East England
South East England& London
South West England
West MidlandsWales
WestScotland
The Wales area is treated as both a country and a region in the Inventory.
12 Carbon in live woodland trees in Britain
What the results tell us
This is the first National Forest Inventory estimate of the amount of carbon contained in living woodland trees in Great Britain. The combination of National Forest Inventory data and Forest Research models has provided the most accurate estimate of carbon produced to date in Great Britain. The results provide a snapshot, as at March 2011, of both the total amount of carbon and its geographic distribution.
The results show that, of the National Forest Inventory regions* in England, the largest carbon stocks in living woodland trees are contained within forests and woodlands in South East England and London with an estimated 28 million tonnes of carbon, and in South West England with an estimated 24 million tonnes.
Of the National Forest Inventory regions in Scotland, the largest carbon stocks in living woodland trees are contained within forests and woodlands in South Scotland with an estimated 28 million tonnes of carbon, and West Scotland with an estimated 23 million tonnes.
The results also show that there is a significantly higher amount of carbon in forests and woodlands in Great Britain than previous reported estimates. For example, there is around 30% more carbon than the upper boundary of those estimated in 2012 in the Forestry Commission Research Report Understanding the carbon and greenhouse gas balance of forests in Britain, although this report did point to the likely revision and improvement of those estimates when National Forest Inventory data were available. The estimated carbon stocks are also over 50% higher than those reported to the United Nations Food and Agriculture Organization (FAO) for the 2010 Forest Resources Assessment. Again, the text was similarly qualified in anticipation of the forthcoming Inventory data.
The principal source of the difference between estimates is an improvement in the inventory data upon which the estimates were based (for example due to the application of more advanced technology such as satellite imagery, geographic information systems and computer models, all of which have improved the accuracy of estimates). It is now evident that previous inventories, such as the National Inventory of Woodlands and trees (NIWT), under-estimated both forest area and numbers of trees, which therefore led to an under-estimate of associated carbon stocks. There are also differences in scope between the National Forest Inventory and the previous NIWT surveys; the former, for example, includes woods found in urban areas that the latter excluded.
However, while improved methodology and more accurate tools account for the majority of the difference between the National Forest Inventory and the previous NIWT surveys, the results are, to some extent, a reflection of the real growth and increment of forest and woodland trees in Britain and the fact that Britain currently harvests less than that annual tree growth (see the National Forest Inventory Reports GB 25-year forecast of standing coniferous volume and increment, 50-year forecast of hardwood timber availability and Forestry Facts and Figures 2013). The average age and average size of trees will have increased between the inventories and as a consequence carbon stocks will also have risen. The evidence of this can be seen from the age class and mean stand diameter data reported in the Inventory Reports Standing timber volume for coniferous trees in Britain and Preliminary estimates of quantities of broadleaved species in British woodlands, with a special focus on ash. The age class data in the reports show that most trees in Britain are currently relatively immature and, by comparing their current age to the average duration of tree crop rotations, it can be deduced that the majority of trees were younger and smaller at the time of the NIWT survey.
Differences such as these are particularly relevant when trying to make comparisons between this Inventory Report and Land Use, Land-Use Change and Forestry (LULUCF) reporting to the United Nations Climate Change Secretariat. As LULUCF reports place particular emphasis on changes in balances in carbon stocks arising from direct human-induced land-use impacts, the differences in reported stocks arising from the National Forest Inventory methodology are not directly applicable to LULUCF reporting. Nevertheless the new figures reported here represent a substantive improvement in our knowledge of forest and woodland carbon stocks and how they are changing over time. The new figures will be used in the development of the 2015 LULUCF reports and more directly in reporting to the FAO for the 2015 Forest Resources Assessment.
A direct measure of changes in carbon stocks will be available when the second cycle of the National Forest Inventory Reports in 2020.
*It should be noted that National Forest Inventory regions are not equal in area and these rankings are not established on a per unit area basis.

National Forest Inventory Report 13
Glossary
Age class: a grouping of trees into specific age ranges for classification purposes.
Allometric relationship: a mathematical relationship explaining the change in size (growth) of one or more parts of an organism. Allometric relationships are often used in forestry to estimate a difficult-to-measure variable, such as volume, from an easily measured attribute, such as diameter at breast height (DBH).
Area (forest/woodland): forest and woodland area is divided into net forest area – the land area actually covered by trees (in the National Forest Inventory defined to the drip line of the canopy), and gross forest area – which includes both the area covered by trees and the small open spaces (of less than 0.5 hectares) within the forest boundary (e.g. rides, glades, ponds).
Biomass: all of the material making up a tree, or one of its components, such as the stem or branches.
Broadleaves: trees and shrubs that belong to the angiosperm division of the plant kingdom (as distinct from the gymnosperm division that includes conifers). Most in the UK have laminar leaves and are deciduous. Sometimes referred to as ‘hardwoods’ but not all produce hardwood timber.
Canopy: the mass of foliage and branches formed collectively by the crowns of trees.
Carbon dioxide equivalent: equivalent CO2 (CO2e) is the concentration of CO2 that would cause the same level of radiative forcing as a given type and concentration of greenhouse gas. The conversion factor for carbon to carbon dioxide equivalent is 44/12.
Carbon stock: a quantity of carbon forming a reservoir, generally as part of terrestrial or marine systems. Examples include the carbon in biomass of marine plants, in organic matter of terrestrial soils and in reserves of fossil fuels. For living trees forming forests, the biomass of the trees constitutes a carbon stock.
Clearfelling: cutting down of an area of woodland (if it is within a larger area of woodland it is typically a felling greater than 0.25 hectares). Sometimes a scatter or small clumps of trees may be left standing within the felled area.
Conifers: trees and shrubs that belong to the gymnosperm division of the plant kingdom (as distinct from the angiosperm division that includes broadleaves). Conifers mostly have needles or scalelike leaves and, with the exception of larch, all are evergreen. Sometimes referred to as ‘softwoods’, they produce softwood timber.
DBH (diameter at breast height): the diameter of a tree (overbark) at breast height, which is usually defined as 1.3 m along the axis of the stem from the ground.
Forest (and woodland): land predominately covered in trees (defined as land under stands of trees with a canopy cover of at least 20%, or the ability to achieve this, and with a minimum area of 0.5 hectares and minimum width of 20 m), whether in large tracts (generally called forests) or smaller areas known by a variety of terms (including woods, copses, spinneys or shelterbelts).
Forestry Commission: the government department responsible for the regulation of forestry, implementing forestry policy and management of state forests in Great Britain as at 31 March 2014. Forestry policy is devolved, with the exception of common issues addressed on a GB or UK basis, such as international forestry, plant health and forestry standards.
Forestry Commission estate: forests, woodlands, open land and other property managed by the Forestry Commission as at 31 March 2014.
Great Britain (GB): England, Scotland and Wales.Overbark: a term used in measurements of wood volume that
include the bark.Private sector estate: forests and woodlands in GB not managed by
the Forestry Commission. In the context of the National Forest Inventory, ‘Private sector’ is used for convenience although it includes land owned or managed by bodies such as local authorities and charities.
Production forecast: a forecast of softwood availability from the Forestry Commission (GB), the Forest Service, an agency within the Department of Agriculture and Rural Development in Northern Ireland) and potential softwood availability from the Private sector (UK).
Softwood: wood of coniferous trees or the conifers themselves.Stand: a relatively uniform collection of trees (from either planting or
natural regeneration) composed, for example, of a single species or a single age class.
Standard error (SE): the measure of the margin of error associated with an estimate as a result of sampling from a population with statistical variability. Larger standard errors indicate less precision in the estimate. Standard errors in this report are quoted in relative terms (i.e. as percentages of the value of the estimate).
Standing volume: a measurement of timber volume within standing trees. Usually expressed as cubic metres overbark standing (m3 obs). In the Production forecast, standing coniferous volume is defined as live coniferous stemwood and useable branchwood (to 7 cm top diameter and at least 3 m in length). It excludes roots, below-ground stump material, small branches, foliage and deadwood. For Private sector woodland only, it also excludes standing volume in trees in woodlands less than 0.5 hectares.
Stemwood: the volume of wood in stems, with stems being defined internationally as the above-ground part of the main shoot (or offshoots) with apical dominance. In GB stemwood includes wood from the stump up to 7 cm top diameter of the main stem and sometimes branchwood at least 3 m in length with a minimum top diameter of 7 cm.
Stocked area: the area stocked with living trees. The stocked areas in this report are quoted in gross terms for the Forestry Commission estate and in net terms for the Private sector estate (see definitions of Area above).
Sustainable forest management: the stewardship and use of forests and forest lands in a way, and at a rate, that maintains their biodiversity, productivity, regeneration capacity and vitality and their potential to fulfil, now and in the future, relevant ecological, economic and social functions at local, national and global levels, and that does not cause damage to other ecosystems.
Thinning: the removal of a proportion of trees in a forest after canopy closure, usually to promote growth and greater value in the remaining trees.
Top diameter: diameter of the smaller (top) end of a log, often used to define different categories of wood products (e.g. sawlogs, roundwood, pulp) and merchantable timber.
Top height: the mean total height of the 100 largest DBH trees per hectare.
Yield class (YC): a classification based on tree species, height growth (top height) and tree age, used to assess the volume production of a stand of trees. It reflects the potential productivity of the site for the tree species growing on it.

This report is one of a series of Inventory Reports that will report on the outputs from the Forestry Commission National Forest Inventory. See www.forestry.gov.uk/inventory for more information. The woodland map and areas calculated from it can be found in the ‘National Forest Inventory Woodland Area Statistics’ for Great Britain, England, Scotland and Wales, which can also be downloaded here.
The National Forest Inventory supports sustainable forest management in Great Britain. For more information see The UK Forestry Standard and its supporting Guidelines on:
•Forests and Biodiversity
•Forests and Climate Change
•Forests and Historic Environment
•Forests and Landscape
•Forests and People
•Forests and Soil
•Forests and Water
www.forestry.gov.uk/ukfs
ISBN: 978-0-85538-907-9 © CROWN COPYRIGHT
FCN
FI113/FC-G
B(PURE)/W
WW
/MAY14
Enquiries relating to this publication should be addressed to:
Ben DitchburnForestry CommissionSilvan House231 Corstorphine RoadEdinburgh EH12 7AT [email protected] www.forestry.gov.uk/inventory
This is an Official Statistics publication. More information about Official Statistics and the UK Statistics Authority is available at www.statisticsauthority.gov.uk
Forestry Commission statistician: Alan Brewer
If you need this publication in an alternative
format, for example in large print or another
language, please telephone us on 0300 067 5046
or send an email to: [email protected]