Embed Size (px)
Citation preview

RESEARCH Open Access
Carbon fluxes in ecosystems of YellowstoneNational Park predicted from remote sensingdata and simulation modelingChristopher Potter1*, Steven Klooster2, Robert Crabtree3, Shengli Huang3, Peggy Gross2 and Vanessa Genovese2
Abstract
Background: A simulation model based on remote sensing data for spatial vegetation properties has been usedto estimate ecosystem carbon fluxes across Yellowstone National Park (YNP). The CASA (Carnegie Ames StanfordApproach) model was applied at a regional scale to estimate seasonal and annual carbon fluxes as net primaryproduction (NPP) and soil respiration components. Predicted net ecosystem production (NEP) flux of CO2 isestimated from the model for carbon sinks and sources over multi-year periods that varied in climate and (wildfire)disturbance histories. Monthly Enhanced Vegetation Index (EVI) image coverages from the NASA ModerateResolution Imaging Spectroradiometer (MODIS) instrument (from 2000 to 2006) were direct inputs to the model.New map products have been added to CASA from airborne remote sensing of coarse woody debris (CWD) inareas burned by wildfires over the past two decades.
Results: Model results indicated that relatively cooler and wetter summer growing seasons were the mostfavorable for annual plant production and net ecosystem carbon gains in representative landscapes of YNP. Whensummed across vegetation class areas, the predominance of evergreen forest and shrubland (sagebrush) cover wasevident, with these two classes together accounting for 88% of the total annual NPP flux of 2.5 Tg C yr-1 (1 Tg =1012 g) for the entire Yellowstone study area from 2000-2006. Most vegetation classes were estimated as netecosystem sinks of atmospheric CO2 on annual basis, making the entire study area a moderate net sink of about+0.13 Tg C yr-1. This average sink value for forested lands nonetheless masks the contribution of areas burnedduring the 1988 wildfires, which were estimated as net sources of CO2 to the atmosphere, totaling to a NEP flux of-0.04 Tg C yr-1 for the entire burned area. Several areas burned in the 1988 wildfires were estimated to be amongthe lowest in overall yearly NPP, namely the Hellroaring Fire, Mink Fire, and Falls Fire areas.
Conclusions: Rates of recovery for burned forest areas to pre-1988 biomass levels were estimated from a uniquecombination of remote sensing and CASA model predictions. Ecosystem production and carbon fluxes in theGreater Yellowstone Ecosystem (GYE) result from complex interactions between climate, forest age structure, anddisturbance-recovery patterns of the landscape.
BackgroundThe Greater Yellowstone Ecosystem (GYE) provides aunique opportunity to study carbon cycles in the wes-tern evergreen forests and rangelands of North America.The GYE is the largest remaining continuous wildlandarea in the United States outside of Alaska. YellowstoneNational Park (YNP) is considered to be one of theworld’s largest intact sub-alpine ecosystem in the
northern temperate zone [1]. The absence of historicalforest management for timber production in YNP andthe extensive wildfires of 1988 combine to make thecentral GYE a landscape with complex controls on plantproduction and woody biomass pools (both standingand downed).Fire has played a major role in influencing the ecologi-
cal processes and landscape patterns of YNP [2-5]. Asreviewed by Kashian et al. [6], the 1988 Yellowstonefires resulted in a 250,000-ha mixed landscape covermainly of lodgepole pine (Pinus contorta var. latifolia
* Correspondence: [email protected] Ames Research Center Mail Stop 242-4, Moffett Field, CA 94035 USAFull list of author information is available at the end of the article
Potter et al. Carbon Balance and Management 2011, 6:3http://www.cbmjournal.com/content/6/1/3
© 2011 Potter et al; licensee BioMed Central Ltd. This is an Open Access article distributed under the terms of the Creative CommonsAttribution License (http://creativecommons.org/licenses/by/2.0), which permits unrestricted use, distribution, and reproduction inany medium, provided the original work is properly cited.

Englem. ex Wats.), with regrowing sapling densities ran-ging from fewer than 50 stems ha-1 to more than500,000 stems ha-1 [7,8]. These fires represented a nat-ural disturbance event that occurs at intervals of 100-300 years in this region [4]. Smaller fires (usually lessthan 5000 ha) occur more frequently on the Yellowstonelandscape during the interval between these large fires[5]. As a result of this fire regime, Yellowstone currentlycontains a mosaic of young forest stands created by the1988 fires and small fires that have occurred since 1988,as well as more mature stands of up to 450 years old.Non-forest cover including mixed grassland, sage-
brush, and wetland sedge vegetation in YNP providescritical grazing lands for a unique community of largeungulate herbivores [1]. Two-thirds of the historicalwinter range for these large ungulate herds is withinYNP’s northern and central rangelands [9,10]. Naturalfire return intervals in Yellowstone may be as short as20-25 years for shrub and grasslands in the NorthernRange [11].Previous studies of plant production patterns in YNP
have pointed to soil types and elevation gradients asimportant determinants [12]. Turner et al. [7] reportedthat most of the variation in plot-based abovegroundproductivity and leaf area index (LAI) in post-fire lodge-pole pine stands measured across YNP was explained bysapling density, with minor variation explained by theabiotic factors, elevation and soil class. Analysis of envir-onmental variables on CASA model NPP (at 8-km spa-tial resolution across YNP) by Crabtree et al. [13]revealed that soil properties had the strongest influenceon NPP spatial patterns, followed by solar radiation.The diverse topographic variation in YNP with largeamounts of shade intolerant lodgepole pine favors NPPresponding to solar radiation. The next strongest influ-ence on NPP reported by Crabtree et al. [13] was preci-pitation. However, precipitation and temperature werespatially correlated across YNP and collectively repre-sent the influence of climate in the model. The hypoth-esis was offered by Crabtree et al. [13] that gradients intemperature, precipitation, and wildfire severity havehad a lesser effect on NPP in YNP during the last dec-ade than either soil fertility or solar radiation patterns.Previous field measurements of carbon cycling in for-
est ecosystems of YNP have revealed that stand struc-ture and woody biomass increment are closely linked[6,14,15]. Aboveground NPP and belowground carbonallocation increase with forest age to around 250 yearsof pine stand growth [16,17].The objective of this study was to quantify the carbon
cycle of all ecosystems in YNP over the period 2000-2006, including the residual effects of the wildfires of1988 on forest biomass decomposition and regenerationrates. We applied the CASA model [18,19] using
MODIS EVI inputs at 250-meter spatial resolution. Ourmodeling framework has been designed to estimate his-torical as well as current monthly patterns in plant car-bon fixation, living biomass increments, nutrientallocation, litter fall and decomposition, long-term decayof downed woody pools, soil CO2 respiration, and soilnutrient mineralization before, during, and after distur-bance events such as wildfires. To our knowledge, this isthe first study to take full advantage of 250-meterMODIS land products together with airborne remotesensing to make annual net biome production (NBP)estimates for YNP.The three main study questions that could be uniquely
addressed with MODIS satellite observations (years 2000- 2006) and the CASA ecosystem model were:
• What is the year-to-year variability in net primaryproduction as represented in different landscapeareas (one to several km2 in size) of YNP?• What is the carbon balance across all ecosystemsof YNP 20 years after the wildfires of 1988?• What are the rates of vegetation production in the1988 burned areas of YNP?
MethodsStudy areaThe study area was YNP, located in Wyoming (96%),Montana (3%), and Idaho (1%) and its Northern Range[11] (Figure 1; NW corner coordinates: 45°15’ N, 111°12’W; SE corner coordinates: 44°5’ N, 109°49’ W). ThePark area has elevations ranging from 1540 m to 3760m. Nearby mountain ranges include the Gallatin Rangeto the northwest, the Beartooth Mountains in the north,the Absaroka Range to the east, and the Teton Rangeand the Madison Range to the southwest and west. TheContinental Divide of North America runs diagonallythrough the southwestern part of the Park. The divide isa topographic feature that separates Pacific Ocean andAtlantic Ocean water drainages. About one third of thepark lies on the west side of the divide.The climate is generally cool and dry with mean Janu-
ary and July temperatures of -11.4°C and 10.8°C, respec-tively, and mean annual precipitation of 56.3 cm [20].Winters are long and cold, lasting from mid-Novemberto mid-March. Summers are short and often dry, usuallylasting from July through August. Average annual snowdepth is around 33 cm [21].4Soils in YNP at higher elevations are largely nutri-
ent-poor rhyolites and andesites with low water-hold-ing capacity [22]. Valley bottoms and floodplainscontain glacial out-wash and alluvial soils that arehigher in nutrients and water-holding capacity. Soilsderived from rhyolitic parent materials typically arecoarser and have fewer base cations and lower water-
Potter et al. Carbon Balance and Management 2011, 6:3http://www.cbmjournal.com/content/6/1/3
Page 2 of 16

holding capacity than soils derived from andesite orlacustrine sediments. Lacustrine sediments typicallyhave the highest silt and clay content, base cations,and water-holding capacity [5].Most of the forests of YNP consist of five conifer tree
species [23]: lodgepole pine, whitebark pine (Pinus albi-caulis), Douglas fir (Pseudotsuga menziesii), Engelmannspruce (Picea engel-mannii), and subalpine fir (Abieslasiocarpa). Elevation and soil fertility are considered tobe the two most important abiotic gradients controllingforest vegetation on the subalpine plateaus [5,13]. Non-forest vegetation is divided into four major groups:grassland, sagebrush steppe (shrubland), wet sedge andwillow meadow, and alpine meadow. The distributionsof these vegetation types are influenced strongly by
elevation. Big sagebrush grows in dry to moderatelymoist areas at middle and lower altitudes, such as in theLamar River Valley. Silver sage grows in wetter areashigher than 2130 m, for example, in the Hayden andPelican Valleys. Alpine meadows are present at eleva-tions higher than 3050 m. Sedge marshes and other wet-land vegetation thrive in areas of year-round standingwater at various elevations throughout YNP [23].For this study, we selected five landscapes (Figure 2),
none of which had been severely affected by wildfiresduring the 1988 fires, for validation and characterizationof CASA predictions of (unburned ecosystem) carboncycles within YNP. The selected landscape areas aredescribed briefly below in terms of vegetation andtopography.
Figure 1 Yellowstone study area boundaries, shown with a MODIS true-color composite image and 1988 fire area labels.
Potter et al. Carbon Balance and Management 2011, 6:3http://www.cbmjournal.com/content/6/1/3
Page 3 of 16

Gardiner BasinThe Gardiner River Basin in the northwestern corner ofYNP consists of a variety of sagebrush habitats includingthe Wyoming big sagebrush (Artemisia tridentata wyo-mingensis) and blue bunch wheatgrass (Agropyron spica-tum) that is found primarily at lower elevations in thebasin. Mountain big sagebrush (A. t. vaseyana) - Idahofescue (Festuca idahoensis) habitat type dominates themajority of Gardiner Basin [24]. The landscape has rela-tively mild winter conditions compared to ranges furtherinside YNP, owing to its lower elevation and windsweptslopes, which affords reliable winter foraging for ungu-lates. The selected transect of four 250-meter seriesareas examined within the Gardiner Basin landscaperanged moderately in elevation, from 2320 m to 2400 m.Blacktail Deer PlateauThe Blacktail Deer Plateau is an important part of thenorthern winter range of YNP. The area consists ofapproximately 100 km2 of moderately sloping terrain(elevation 2000-2300 m). Sagebrush (Artemisia spp.)mixed with grasslands and scattered aspen (Populus tre-muloides) clones occur across much of the plateau.These upland areas are interspersed with willow andsedge (Carex spp.), plus grass meadows in swales andriparian zones. The transect of four 250-meter areasexamined within this landscape ranged moderately inelevation, from 2256 m to 2291 m.
Soda Butte Creek DrainageSoda Butte Creek is located west of Cache Creek acrossthe forested drainage divide formed partly by MountNorris ion the northeastern corner of YNP. The Creekflows for a length of approximately 30 kilometers fromits headwaters near Cooke City, MT, just outside north-east corner of YNP, until it empties into the LamarRiver. Forest cover in the drainage basin is predomi-nantly lodgepole pine giving way to subalpine fir (Abieslasiocárpa), Douglas-fir (Pseudotsuga menziesii), andEngelmann spruce (Picea engelmánnii). Owing to themountainous terrain of the drainage, the transect offour 250-meter areas examined within this landscaperanged widely in elevation from 2209 m to 2687 m.Lamar River ValleyThe Lamar River is a tributary of the Yellowstone River,approximately 48 kilometers long, located entirelywithin YNP. The Lamar River headwaters are located inthe Absaroka Range, on the eastern edge of the Park.The main channel is joined by many tributary streams,including Soda Butte Creek and Slough Creek, and emp-ties into the Yellowstone River near Tower Junction.Pleistocene outwash deposits have created an expansivevalley floor that ranges from 1 to 2 km in width. Grass-land and sagebrush - Idaho fescue (Festuca idahoensis)vegetation types occur on most of the northern winterrange of the Lamar Valley. Herbaceous cover is com-posed also of blue bunch wheatgrass (Agropyron spica-tum), june grass (Koeleria macrantha), needle grasses(Stipa comata), basin wild rye (Elymus cinereus), bluegrasses (Poa spp.), and various forbs.Hayden ValleyHayden and Pelican Valleys makes up a large portion ofthe central winter range for grazing animal in YNP. Thevalleys are situated on ancient lakebed left over fromthe last Ice Age and the soils there are still influencedby deposits of lake sediment. As in the Lamar Valley,the vegetation in this landscape is dominated by a mixof sagebrush and Idaho fescue cover. The transect offour 250-meter areas examined within the Hayden Val-ley landscape ranged in elevation from 2356 m to 2402m.
Background on CASA Carbon ModelingThe launch of NASA’s Terra satellite platform in 1999with the Moderate Resolution Imaging Spectroradi-ometer (MODIS) instrument on-board initiated a newera in remote sensing of the Earth system with promis-ing implications for carbon cycle research. Direct inputof satellite vegetation index “greenness” data from theMODIS sensor into ecosystem simulation models isnow used to estimate spatial variability in monthly netprimary production (NPP), biomass accumulation, andlitter fall inputs to soil carbon pools. Global NPP of
Figure 2 Landscape transects selected within YNP, togetherwith field survey plot locations (black dots) in grasslands ofthe Gardiner Basin, Lamar and Hayden Valleys.
Potter et al. Carbon Balance and Management 2011, 6:3http://www.cbmjournal.com/content/6/1/3
Page 4 of 16

vegetation can be predicted using the relationshipbetween leaf reflectance properties and the absorptionof photosynthetically active radiation (PAR), assumingthat net conversion efficiencies of PAR to plant carboncan be approximated for different ecosystems or arenearly constant across all ecosystems [25,26].Operational MODIS algorithms generate the
Enhanced Vegetation Index (EVI) [27] as global imagecoverages from 2000-present. EVI represents an opti-mized vegetation index, whereby the vegetation indexisolines in red and near infra-red spectral bands aredesigned to approximate vegetation biophysical isolinesderived from canopy radiative transfer theory and/ormeasured biophysical-optical relationships [28]. EVI wasdeveloped to optimize the greenness signal, or area-averaged canopy photosynthetic capacity, with improvedsensitivity in high biomass regions. The EVI has beenfound useful in estimating absorbed PAR related tochlorophyll contents in vegetated canopies [27] and hasbeen shown to be highly correlated with processes thatdepend on absorbed light, such as gross primary pro-ductivity (GPP) [28,29].As documented in [30], the monthly NPP flux, defined
as net fixation of CO2 by vegetation, is computed inNASA-CASA on the basis of light-use efficiency [31].Monthly production of plant biomass is estimated as aproduct of time-varying surface solar irradiance, Sr, andEVI from the MODIS satellite, plus a constant light uti-lization efficiency term (emax) that is modified by time-varying stress scalar terms for temperature (T) andmoisture (W) effects (Equation 1).
NPP = SrEVI emax T W (1)
The emax term was set uniformly at 0.55 g C MJ-1
PAR, a value that derives from calibration of predictedannual NPP to previous field estimates [18]. This modelcalibration has been validated globally by comparingpredicted annual NPP to more than 1900 field measure-ments of NPP [19,32]. Interannual NPP fluxes from theCASA model have been reported [33] and validatedagainst multi-year estimates of NPP from field stationsand tree rings [34]. Our NASA-CASA model has beenvalidated against field-based measurements of NEPfluxes and carbon pool sizes at multiple forest sites[35-37] and against atmospheric inverse model estimatesof global NEP [18].The T stress scalar is computed with reference to
derivation of optimal temperatures (Topt) for plant pro-duction. The Topt setting will vary by latitude and long-itude, ranging from near 0°C in the Arctic to the middlethirties in low latitude deserts. The W stress scalar isestimated from monthly water deficits, based on a com-parison of moisture supply (precipitation and stored soil
water) to potential evapotranspiration (PET) demandusing the method of [38].The 2001 National Land Cover Dataset (NLCD) 30-
meter map from the U. S. Geologic Survey was aggre-gated to 250-meter pixel resolution and used to specifythe predominant land cover class for the W term in eachpixel as either forest (evergreen or deciduous), shrubland,grassland, or other classes such as open water or urba-nized area. The NLCD product is derived from 30-meterresolution Landsat satellite imagery and has been shownto have a high level of accuracy in the western UnitedStates [39]. Monthly mean surface air temperature andprecipitation grids for model simulations over the years2000-2006 came from PRISM products [40]. Monthlymean inputs of solar radiation flux to the model werederived from Huang et al. [21]. Soil settings in the modelfor texture classes (fine, medium and coarse) and depthto bedrock for maximum plant rooting depths wereassigned to the YNP map product of Rodman et al. [22].Carbon accumulation rates in forest biomass at the
stand level are a function of both growth and mortalityof trees, related to other factors such as soils and micro-climate. For the CASA model, Potter and Klooster [41]reported that these processes could be expressed interms of the mean residence time (τ, in years) of carbonin the aboveground wood tissue pools. Tissue allocationratios (a percent of NPP) were expressed in a similarmanner, based on estimates from the global ecosystemliterature. These default forest values for τ (50 years)and a (45%) together determine the model’s estimationof potential accumulation rates of forest biomass, bothliving and dead. These potential accumulation rates ofwoody biomass are based on the assumption of forestgrowth to mature stand status, but are subject to valida-tion and readjustment based on comparisons to inven-tory measurements.Evapotranspiration in CASA is connected to water
content in the soil profile layers (Figure 2), as estimatedusing the CASA algorithms described by Potter et al.[18]. The soil model design includes three-layer (M1-M3) heat and moisture content computations: surfaceorganic matter, topsoil (0.3 m), and subsoil to rootingdepth (1 to 2 m). These layers can differ in soil texture,moisture holding capacity, and carbon-nitrogendynamics. Water balance in the soil is modeled as thedifference between precipitation or volumetric percola-tion inputs, monthly estimates of PET, and the drainageoutput for each layer. Inputs from rainfall can rechargethe soil layers to field capacity. Excess water percolatesthrough to lower layers and may eventually leave thesystem as seepage and runoff.Based on plant production as the primary carbon and
nitrogen cycling source, the NASA-CASA model is
Potter et al. Carbon Balance and Management 2011, 6:3http://www.cbmjournal.com/content/6/1/3
Page 5 of 16

designed to couple daily and seasonal patterns in soilnutrient mineralization and soil heterotropic respiration(Rh) of CO2 from soils. Net ecosystem production(NEP) can be computed as NPP minus Rh fluxes,including the effects of wildfires and other localized dis-turbances or vegetation regrowth patterns on carbonfluxes. The soil model uses a set of compartmentalizeddifference equations. First-order decay equations simu-late exchanges of decomposing plant residue (metabolicand structural fractions) at the soil surface. The modelalso simulates surface soil organic matter (SOM) frac-tions that presumably vary in age and chemical compo-sition. Turnover of active (microbial biomass and labilesubstrates), slow (chemically protected), and passive(physically protected) fractions of the SOM are repre-sented. Along with moisture availability and litter qual-ity, the predicted soil temperature in the surface (M1)layer controls SOM decomposition.The soil carbon pools were initialized to represent sto-
rage and flux conditions in near steady state (i.e., anannual NEP flux less than 0.5% of annual NPP flux)with respect to mean land surface climate recorded forthe period 1999-2000. This initialization protocol wasfound to be necessary to eliminate any notable disconti-nuities in predicted NEP fluxes during the transition toour model simulation years of interest prior to MODISEVI availability. Initializing to near steady state doesnot, however, address the issue that some landscapesmay not in equilibrium with respect to net annual car-bon fluxes, especially when they are recovering frompast disturbances such as wildfires.
Validation of CASA Aboveground NPP EstimatesDuring the summer growing seasons of 2008 and 2009,128 non-riparian field plots 35 meters in diameter weresurveyed in grasslands of the Gardiner Basin, LamarValley and Hayden Valley (Figure 2) for total productionof aboveground herbaceous biomass. YNP is a protectedarea with many dangerous wild animals (e.g. wolf, bear,and bison), so it is required that any field teams workingthere avoid specific wildlife management areas, remaininvisible to Park visitors, and use only non-destructivesampling methods. The short growing season furtherrestricts field surveys to be completed within fourmonths. For all these reasons combined, Huang et al.[42] adopted a time-saving and cost-effective ocular esti-mation method for these aboveground biomass mea-surements, which is a widely employed method forvegetation evaluation [43] and shown to have high accu-racy and precision [44]. Ocular estimates can neverthe-less be influenced by observer bias and person-to-person variability [45]. For this reason, at least four per-sons together conducted the field surveys and the
average of their biomass estimates was computed foreach plot.Average aboveground production estimated from
grassland field survey plots was 99.7 g C m-2 yr-1 with aCV = 88% (CV is the coefficient of variation; defined asthe 100 times the ratio of the standard deviation to themean). Based on a conversion factor of 0.45 for above-ground biomass carbon as a fraction of total (above andbelow-ground) NPP from the model for non-riparianherbaceous cover [45]. CASA average aboveground pro-duction was estimated at 90.6 g C m-2 yr-1 with a CV =25% for these same 128 field plot locations. Althoughthere was a high level of variance for the plot surveyestimates of aboveground production, CASA predictedthe measured mean value within about 10% across awide variety of grassland ecosystems types in YNP.The spatial layer for coarse woody debris in burned
areas of the GYE from Huang et al. [46] was used forthe first time in this paper for computing post-fire car-bon decomposition emissions of CO2. Our coarsewoody debris remote sensing product was validated tohave an accuracy level of 85% compared to field plotmeasurements throughout YNP forested sites. This layerhas been validated as well to separate downed versusstanding dead wood pools.We note that none of the field measurement data
from previous forest carbon cycling studies in YNP[6,7,14-17,47] could be made available to us (uponrequest) with precise geographic locations and withmatching time periods of measurement to CASAmodel predictions for 2001-2006. Measurements ofaboveground forest production [7,47] are not compar-able to total forest (above- and belowground) NPPmodel predictions. Furthermore, carbon measurementdata from pre-2000 field measurements for post-1988burned forest areas cannot be used for validation ofCASA model NPP predictions for 2001-2006, becausethe rate of sapling regrowth since 1988 has been chan-ging rapidly.
ResultsCarbon Cycling at Landscape ScalesCASA model predictions of seasonal and inter-annualNPP and NEP were characterized within the selectedlandscape transects of YNP (Figure 3). Comparisons ofannual NPP results showed that 2002 and 2003 werethe lowest production years in the Gardiner Basin, onBlacktail Deer Plateau and in Hayden Valley (commonlyat NPP less than 250 g C m-2 yr-1), whereas 2004 wasthe lowest production year on Soda Butte Creek drai-nage at 133 g C m-2 yr-1 (Figure 3a-d). Along all thetransects, 2005 and 2006 were generally the most pro-ductive years in the time series, with annual NPP
Potter et al. Carbon Balance and Management 2011, 6:3http://www.cbmjournal.com/content/6/1/3
Page 6 of 16
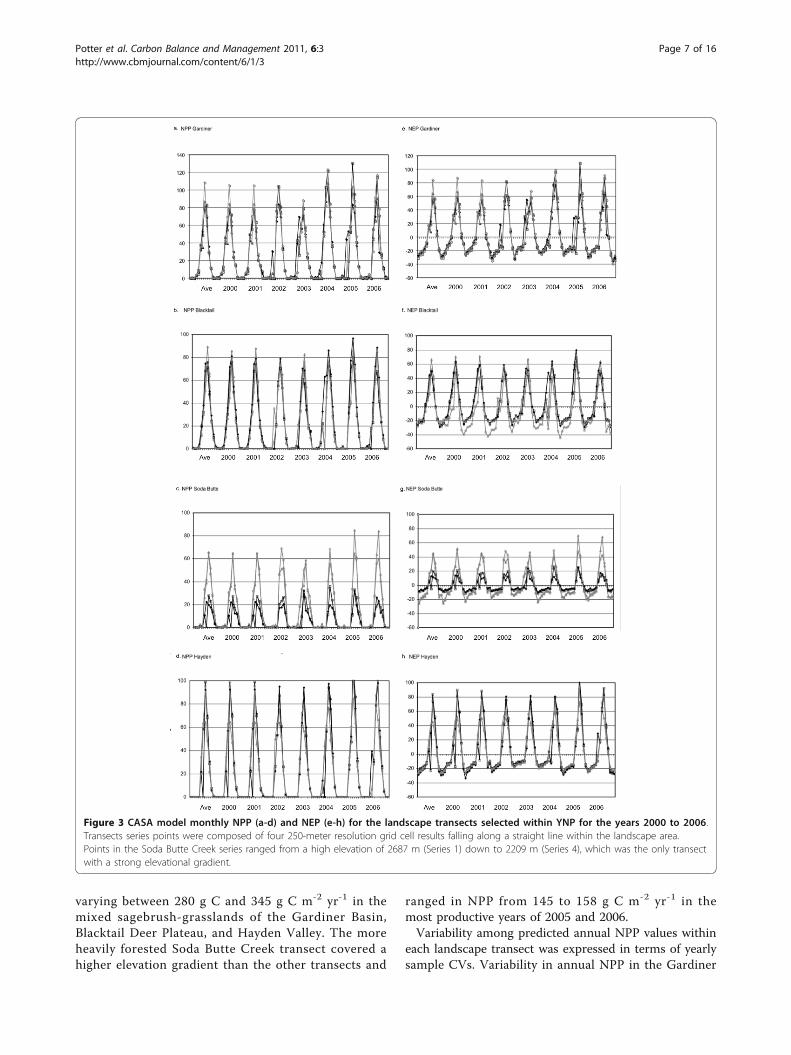
varying between 280 g C and 345 g C m-2 yr-1 in themixed sagebrush-grasslands of the Gardiner Basin,Blacktail Deer Plateau, and Hayden Valley. The moreheavily forested Soda Butte Creek transect covered ahigher elevation gradient than the other transects and
ranged in NPP from 145 to 158 g C m-2 yr-1 in themost productive years of 2005 and 2006.Variability among predicted annual NPP values within
each landscape transect was expressed in terms of yearlysample CVs. Variability in annual NPP in the Gardiner
Figure 3 CASA model monthly NPP (a-d) and NEP (e-h) for the landscape transects selected within YNP for the years 2000 to 2006.Transects series points were composed of four 250-meter resolution grid cell results falling along a straight line within the landscape area.Points in the Soda Butte Creek series ranged from a high elevation of 2687 m (Series 1) down to 2209 m (Series 4), which was the only transectwith a strong elevational gradient.
Potter et al. Carbon Balance and Management 2011, 6:3http://www.cbmjournal.com/content/6/1/3
Page 7 of 16

Basin and Hayden Valley was consistently low, with CVsbetween 4 and 11%. Annual NPP on Blacktail Deer Pla-teau showed its lowest variance (CV = 6%) in 2002 andits highest variance (CV = 21%) in 2004. Variability inannual NPP across the Soda Butte Creek transect wasconsistently the highest, with CVs around 50% for everyyear.Comparisons of CASA annual NEP results (Figure 3e-
h) showed that mixed sagebrush-grassland ecosystemsin the Gardiner Basin and in Hayden Valley were con-sistent yearly sinks for atmospheric CO2, at rates ofbetween +50 to +90 g C m-2 yr-1. Estimated annual NEPwas highest in the Gardiner Basin during 2004 at +130g C m-2 yr-1. Annual NEP was more variable on Black-tail Deer Plateau, with an estimated net source flux ofCO2 to the atmosphere of -7 g C m-2 yr-1 in 2002 chan-ging to a net sink flux of +31 g C m-2 yr-1 in 2003.Annual NEP for other years on Blacktail Deer Plateauwas estimated at net sink flux of around +23 g C m-2
yr-1. The higher elevation forested Soda Butte Creekecosystems were also variable from year to year in termsof NEP flux estimates, ranging from a small net sink of+2 g C m-2 yr-1 in 2004 to larger net sink flux of +31 gC m-2 yr-1 in 2006.Interannual variation in NPP and NEP can be
explained in part by climate input variations to themodel. The warmest summer months in the seven-yeartime series were recorded in 2003, particularly on theNorthern Range of the Yellowstone, whereas the coolestsummer months were recorded in 2004 and 2005.Annual precipitation was highest in the years 2003 and2005, where annual precipitation was well below-averagein 2001 and 2002. These results imply that the relativelycooler and wetter summer growing seasons were themost favorable for annual plant production and net eco-system carbon gains in these landscapes of YNP.
NPP Patterns Across YNPAnnual NPP can vary substantially by vegetation class,which is the result of many abiotic and biotic factors inYNP, including adaptations to (1) harsh winter climates(2) soil fertility and moisture regimes and (3) elevationand topography (Crabtree et al., 2009). These adapta-tions were reflected in predicted NPP per unit area (m2)averaged by vegetation class (Table 1a), which in orderfrom highest to lowest, was: deciduous forest (mainlyaspen, Populus tremuloides), wooded grassland, mixedforest, shrubland (sagebrush), evergreen forest, Ggrass-land, and barren land. When summed across the vegeta-tion class areas, the predominance of evergreen forestand shrubland (sagebrush) cover was evident however,with these two classes together accounting for 88% ofthe total annual NPP for the Yellowstone study area of2.5 Tg C yr-1 (1 Tg = 1012 g = 1 million metric tons).
Aboveground production (ANPP) measurementsreported by Turner et al. [7] for post-fire lodgepole pinestands in YNP averaged 280 g C m-2 yr-1 (no estimateof variance reported). Lodgepole pine NPP measure-ments reported by Litton et al. [48] for 110 year-oldstands in YNP averaged 240 g C m-2 yr-1 (with a stan-dard error of 20 g C m-2 yr-1). Both of these measuredestimates are well within the typical range of total forestNPP (above- and belowground) from CASA models pre-dictions for conifer forests of 180 - 430 g C m-2 yr-1
(Table 1).Examined by landscape areas, mean annual NPP was
highest (around 300 g C m-2 yr-1) in the Gardner RiverBasin, in Hayden and Pelican Valleys, along the Yellow-stone River southeast of Yellowstone Lake, and in theFalls River Basin in the extreme southwest corner ofYNP (Figure 4a). Mean annual NPP was lowest (lessthan 100 g C m-2 yr-1) in high elevation areas (above2500 m) of the Madison Plateau (45°23’ N, 110°57’ W)and the Pitchstone Plateau (44°14’ N, 110°47’ W). Theseareas in the southwest corner of YNP are dominated byglaciated rubble and alluvial deposits derived from rhyo-lite [22].When computed for CASA soil texture classes, pre-
dicted average NPP per unit area (m2) was highest formedium-fine textures (205 g C m-2 yr-1) and lowest forfine textured soils (141 g C m-2 yr-1), with all coarsertexture soil classes making up the middle range ofannual NPP (Table 1b). Although the medium-fine andfine texture soil classes covered relatively small areas ofYNP, they are of interest due to their different locations- the medium-fine textured soils located in the extremesouth of YNP along the Snake River (45°15’ N, 111°12’W) and the fine texture soils located in the extremenorth of YNP along the Gardner Canyon (45°15’ N, 111°12’ W).CASA results showed that there were several 1988
burned areas over which mean annual NPP was higherthan 250 g C m-2 yr-1, implying that vegetation cover inthese areas was recovering rapidly from the impacts ofthe 1988 wildfires. Areas in this rapid recovery category(all greater than 350 hectares) were found within theMink Fire (44°3’ 9” N, 111°15’ 37"W), the North ForkFire (44°41’ 13” N, 110°57’ 38"W and 44°36’ 22” N, 111°4’ 36"W), the Clover-Mist Fire (44°34’ 54” N, 110°13’33"W), and the Snake Fire (44°18’ 28” N, 110°17’ 24"W)boundaries. Burned areas with the highest overall(mean) NPP were the Red-Shoshone and Mist Fires atmore than 200 g C m-2 yr-1.Burned areas with the lowest overall (mean) NPP were
the Hellroaring, Mink, Stormcreek, and Falls Fires atless than 150 g C m-2 yr-1 (Table 1c). Each of theseburned areas with low average productivity wasobserved to have sub-areas with near zero annual NPP.
Potter et al. Carbon Balance and Management 2011, 6:3http://www.cbmjournal.com/content/6/1/3
Page 8 of 16
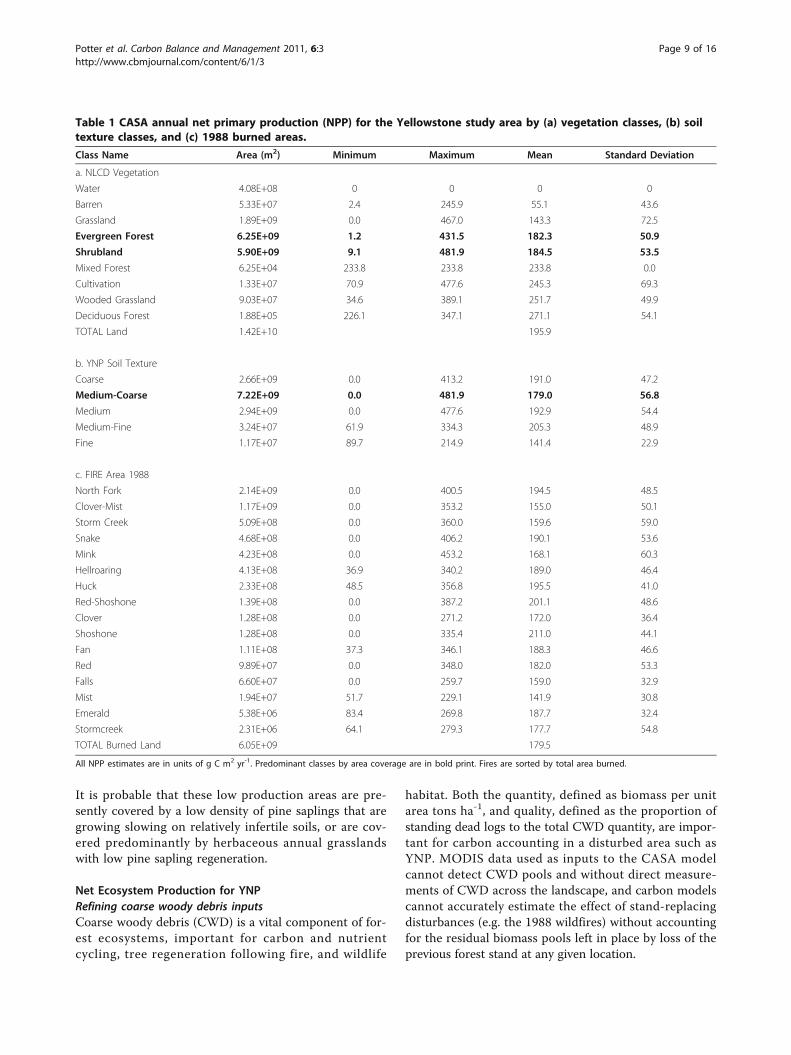
It is probable that these low production areas are pre-sently covered by a low density of pine saplings that aregrowing slowing on relatively infertile soils, or are cov-ered predominantly by herbaceous annual grasslandswith low pine sapling regeneration.
Net Ecosystem Production for YNPRefining coarse woody debris inputsCoarse woody debris (CWD) is a vital component of for-est ecosystems, important for carbon and nutrientcycling, tree regeneration following fire, and wildlife
habitat. Both the quantity, defined as biomass per unitarea tons ha-1, and quality, defined as the proportion ofstanding dead logs to the total CWD quantity, are impor-tant for carbon accounting in a disturbed area such asYNP. MODIS data used as inputs to the CASA modelcannot detect CWD pools and without direct measure-ments of CWD across the landscape, and carbon modelscannot accurately estimate the effect of stand-replacingdisturbances (e.g. the 1988 wildfires) without accountingfor the residual biomass pools left in place by loss of theprevious forest stand at any given location.
Table 1 CASA annual net primary production (NPP) for the Yellowstone study area by (a) vegetation classes, (b) soiltexture classes, and (c) 1988 burned areas.
Class Name Area (m2) Minimum Maximum Mean Standard Deviation
a. NLCD Vegetation
Water 4.08E+08 0 0 0 0
Barren 5.33E+07 2.4 245.9 55.1 43.6
Grassland 1.89E+09 0.0 467.0 143.3 72.5
Evergreen Forest 6.25E+09 1.2 431.5 182.3 50.9
Shrubland 5.90E+09 9.1 481.9 184.5 53.5
Mixed Forest 6.25E+04 233.8 233.8 233.8 0.0
Cultivation 1.33E+07 70.9 477.6 245.3 69.3
Wooded Grassland 9.03E+07 34.6 389.1 251.7 49.9
Deciduous Forest 1.88E+05 226.1 347.1 271.1 54.1
TOTAL Land 1.42E+10 195.9
b. YNP Soil Texture
Coarse 2.66E+09 0.0 413.2 191.0 47.2
Medium-Coarse 7.22E+09 0.0 481.9 179.0 56.8
Medium 2.94E+09 0.0 477.6 192.9 54.4
Medium-Fine 3.24E+07 61.9 334.3 205.3 48.9
Fine 1.17E+07 89.7 214.9 141.4 22.9
c. FIRE Area 1988
North Fork 2.14E+09 0.0 400.5 194.5 48.5
Clover-Mist 1.17E+09 0.0 353.2 155.0 50.1
Storm Creek 5.09E+08 0.0 360.0 159.6 59.0
Snake 4.68E+08 0.0 406.2 190.1 53.6
Mink 4.23E+08 0.0 453.2 168.1 60.3
Hellroaring 4.13E+08 36.9 340.2 189.0 46.4
Huck 2.33E+08 48.5 356.8 195.5 41.0
Red-Shoshone 1.39E+08 0.0 387.2 201.1 48.6
Clover 1.28E+08 0.0 271.2 172.0 36.4
Shoshone 1.28E+08 0.0 335.4 211.0 44.1
Fan 1.11E+08 37.3 346.1 188.3 46.6
Red 9.89E+07 0.0 348.0 182.0 53.3
Falls 6.60E+07 0.0 259.7 159.0 32.9
Mist 1.94E+07 51.7 229.1 141.9 30.8
Emerald 5.38E+06 83.4 269.8 187.7 32.4
Stormcreek 2.31E+06 64.1 279.3 177.7 54.8
TOTAL Burned Land 6.05E+09 179.5
All NPP estimates are in units of g C m2 yr-1. Predominant classes by area coverage are in bold print. Fires are sorted by total area burned.
Potter et al. Carbon Balance and Management 2011, 6:3http://www.cbmjournal.com/content/6/1/3
Page 9 of 16
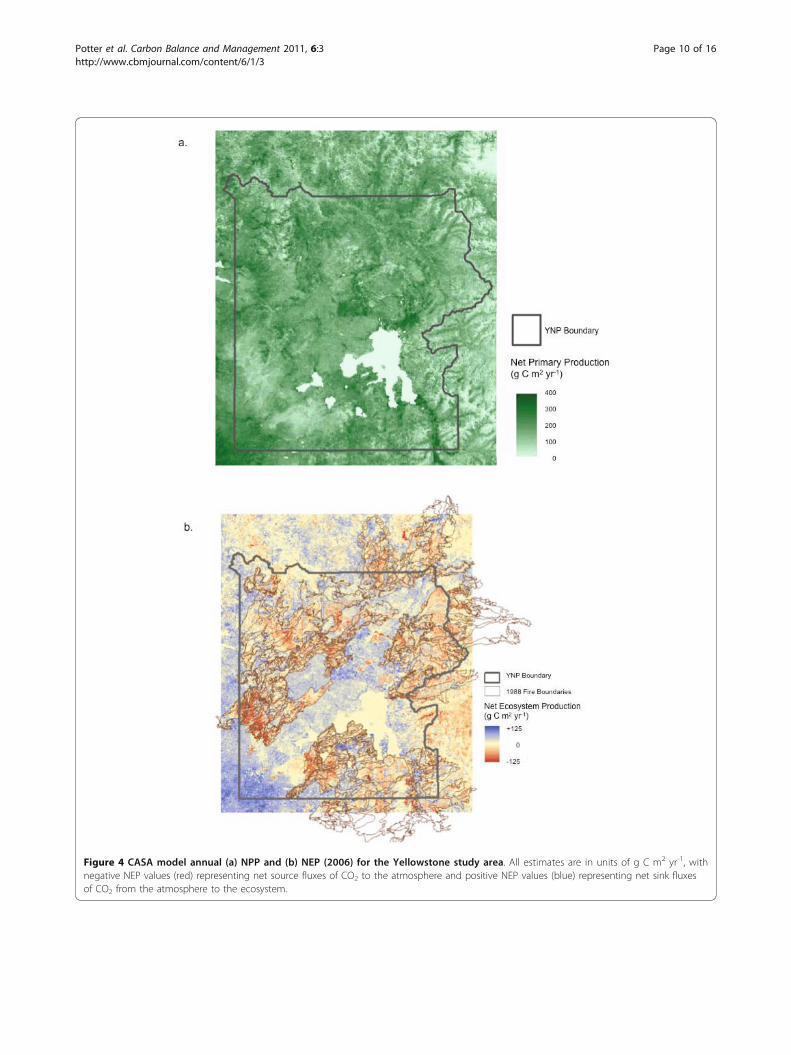
Figure 4 CASA model annual (a) NPP and (b) NEP (2006) for the Yellowstone study area. All estimates are in units of g C m2 yr-1, withnegative NEP values (red) representing net source fluxes of CO2 to the atmosphere and positive NEP values (blue) representing net sink fluxesof CO2 from the atmosphere to the ecosystem.
Potter et al. Carbon Balance and Management 2011, 6:3http://www.cbmjournal.com/content/6/1/3
Page 10 of 16

Huang et al. [46] used remote sensing methods toclassify and map spatially explicit structural characteris-tics of CWD in the Yellowstone post-fire ecosystem. Atotal of 21 AirSAR scenes were acquired in 2003 and anextensive AVIRIS hyperspectral image was acquired onSeptember 25, 2006 for this analysis. As validation oftheir CWD image classification method, Huang et al.[46] conducted field surveys on 186 plots that weremade in summer of 2007 using the line intersectmethod to inventory downed CWD. CWD volume wascalculated according to the methods of Van Wagner[49]. Huang et al. [46] also surveyed the standing CWDand calculated the standing CWD fraction (versusdowned CWD) in each plot. The result of this fusionanalysis of radar and hyperspectral imagery showed thatCWD classified into two categories of ≤ 60 t biomass/haand ≥ 60 t biomass/ha had an accuracy level of 85%compared to field plot measurements throughout YNP.The gridded map products of Huang et al. [46] for
carbon in down CWD fractions in contact with soil sur-face were used to reset the “default” decomposing woodpool in CASA model runs starting in the year 2000. Thedefault algorithm in CASA estimated CWD amountswith inputs proportional to annual NPP of live woodbiomass, this assuming in the absence of residual bio-mass pools left in place by loss of the previous foreststands to fires. The ratio of CASA’s default predictionfor down CWD to the actual pools of down CWDreported by Huang et al. [46] was computed (Figure 5a).This result indicated that 2-4 times more biomass indecomposing wood had actually fallen to the ground inburned forest areas of the central and eastern portionsof YNP (particularly in the Clover-Mist and StormCreek Fire areas) since 1988 than was predicted byCASA default algorithms for CWD pools in these sameareas. Our comparison of CASA default predictions tothe radar-hyperspectral fusion product for down CWDalso suggested that burned forest areas from 1988 onthe western boundary of YNP (within the North ForkFire area) have very little residual CWD remaining fromthe former forest stands that were growing in thoseareas.Predicted net ecosystem carbon fluxesExamined by landscape areas, mean annual NEP washighest (net sink greater than +50 g C m-2 yr-1) in Hay-den Valley, on southern shores of Yellowstone Lake, andin the Falls River Basin in the extreme southwest cornerof YNP (Figure 4b), all of which were not burned duringthe 1988 fires. Mean annual NEP was lowest (in excessof -100 g C m-2 yr-1) on the Madison and PitchstonePlateaus and in the northeast sections of the North ForkFire area. These areas of lowest annual NEP were char-acterized by low annual NPP (less than 120 g C m-2 yr-1
; Figure 4a) and relatively high amounts of CWD still incontact with the soil surface (Figure 5a)Summarized by vegetation classes, CASA predicted
NEP per unit area (m2) was a net source flux of CO2 tothe atmosphere only for shrubland (sagebrush) areas inYNP, with a mean value of -22 g C m-2 yr-1 (Table 2a).All other vegetation classes were estimated as net eco-system sinks of atmospheric CO2 on annual basis, withthe predicted NEP for evergreen forest at a mean valueof +47 g C m-2 yr-1, making the entire study area amoderate net sink for atmospheric CO2 about +0.13 TgC yr-1.This positive average NEP sink value for forested
lands can nevertheless mask the contribution of forestsburned during the 1988 wildfires, which were estimatedas net source areas for CO2 with an overall mean valueof -7 g C m-2 yr-1 and a total NEP flux of -0.04 Tg C yr-1 for the entire burned area. The burned areas with thelargest net sources of CO2 were (in order of mean NEPvalues) the Falls Fire, the Storm Creek Fire, and the Clo-ver-Mist Fires, with a range of -21 to -12 g C m-2 yr-1 asnet source fluxes of CO2 from the decomposition ofCWD remaining in contact with the ground from the1988 wildfires (Table 2b). We could also identify manysub-areas (all greater than 350 hectares) within theseburns with NEP fluxes in excess of -75 g C m-2 yr-1,and isolated areas with NEP fluxes in excess of -150 g Cm-2 yr-1.To further examine the impacts of the 1988 wildfires
on forest carbon cycling, we focused more closely onthe Falls Fire area, which had the lowest mean NPP andthe highest NEP source fluxes from the CASA model ofany major fire area in YNP (Table 2b). This burn waslocated in the southern section of YNP between 4 and 8km south of Lewis Lake (Figure 6). The Falls Fireextended in a southwestern direction from 44°14’ N,110°35’ W to 44°8’ N, 110°50’ W with a width of 3-4km. The burned area was dominated by middle- andlate- successional lodgepole pine stands prior to the1988 fires [5]. Total aboveground stem biomass forthese mature forest stands prior to 1988 would haverepresented around 80 tons (106 g) C ha-1 [16]. Consis-tent with these pre-fire conditions, the post-fire pools ofCWD mapped from airborne remote sensing by Huanget al. [46] for the Falls Fire were estimated at between50-100 tons C ha-1 in the northern portions of theburned area and less than 50 tons C ha-1 in the south-ern portions.CASA model predictions for annual NEP were typi-
cally source fluxes of between -50 and -75 g C m-2 yr-1
in the northern portions of the burned area andbetween 0 and -50 g C m-2 yr-1 in the southern portionsof the Fall Fire area. These NEP flux patterns followed a
Potter et al. Carbon Balance and Management 2011, 6:3http://www.cbmjournal.com/content/6/1/3
Page 11 of 16

drop in elevation from 2550 to 2200 meters, along witha gradient of average annual NPP of 120 g C m-2 yr-1 inthe northern portions of the burned area to NPP of 200g C m-2 yr-1 in the southern portions. CASA modelingidentified large northern sections (around 44°14’ N, 110°37’ W) of the Falls Fire burn that were late-successionallodgepole pine stands prior to 1988, which appeared tobe regrowing slowly from the fire effects, based on NPPmodel predictions circa 2006. At current NPP rates ofgrowth (Figure 6), we can project linearly that it wouldtake nearly 135 years to reestablish the aboveground
carbon pools of middle- and late- successional lodgepolepine stands in much of the Falls Fire area.
DiscussionA wide range in elevational gradients, precipitation pat-terns, soil types, fire histories, and wildlife managementpolicies have made YNP a complex landscape in whichto understand ecosystem carbon cycles. A protectedarea as large and inaccessible as YNP presents manychallenges to ground-based measurement efforts. Fortu-nately, remote sensing using a combination of airborneand satellite platforms, has started to capture many ofthese co-varying spatial factors over the study area.Combined with process simulation models like CASA,many important observational constraints can bebrought to bear on ecosystem production estimates.A prime example (shown in Figure 5b) is the combi-
nation of actual pool sizes of post-1988 CWD detectedby Huang et al. [46] from fusion of airborne imagery toour CASA mean annual NPP fluxes (years 2000-2006)computed from MODIS satellite images. The result ofthis combination ratio is a map, in units of years, thatrepresents the time necessary to regrow every foreststand in YNP to its mature (pre-1988 fire) standingwood biomass. Since the current pool sizes of totalCWD from remote sensing would be just slightly lowerthan the pre-1988 standing biomass amounts (due tocombustion losses; [17]), and CASA annual NPP inunits of carbon flux is roughly proportional (50% frac-tion; [30]) to the amount added to aboveground stemwood pools each year, a comparison of the two imagesgenerates a detailed forest regrowth product.The shortest projected regrowth time was estimated at
less than 50 years over the western portions of theNorth Fork Fire and parts of the Red-Shoshone Fire(Figure 5b); these areas were dominated by early-succes-sional lodgepole pine stands prior to 1988 [5]. Theburned areas with the longest projected regrowth time,estimated at more 200 years, were located on the south-ern extreme of the North Fork Fire (Madison Plateau)and in the Shoshone Fire areas, where middle- and late-successional lodgepole pine stands dominated prior to1988 [5]. Most of the other burned areas in YNP wereassigned projected regrowth times of between 50 and200 years.Crabtree et al. [13] reported that CASA predicted NPP
increases with successional stage of (lodgepole) pine themost common cover type in YNP, but drops back downin the mature/climax stage to the young, post-distur-bance levels of NPP. As stand age increases, mature lod-gepole pine cover types may experience relatively higherautotrophic respiration rates during the growing season,compared to younger age stands characterized by smal-ler bole diameters and lower metabolic baselines [50].
Figure 5 (a) Ratio of CASA’s default prediction for down CWDto the actual pools of down CWD reported by Huang et al.(2009b) in 2003-2007, and (b) Ratio of actual pools of totalCWD reported by Huang et al. (2009b) to CASA annual NPPfluxes.
Potter et al. Carbon Balance and Management 2011, 6:3http://www.cbmjournal.com/content/6/1/3
Page 12 of 16

The successional pattern of CASA NPP in lodgepolepine stands, as well as the negative correlation betweenfire severity index and NPP in the spatial autocorrelationmodel of Crabtree et al. [13], supports the hypothesisthat an area subjected to a burn will have reduced NPPin the short-term, then will slowly recover to pre-burnNPP levels, followed by a gradual decrease in NPP dur-ing later successional stages.An overarching question is whether there will be long-
term loss of carbon from forest areas burned in the1988 Yellowstone fires. Ryan et al. [47] reported onchronosequence measurements of carbon pools (liveand dead wood) in 77 stands in western YNP, replicatedacross age and tree density. The conclusions of thiswork were that carbon in subalpine forests of YNPrecovers ‘quickly’ (within 50 years) after a fire, regardlessof tree density. It was hypothesized that, if a forest inYNP replaces itself after disturbance, there will be nolong-term loss of carbon from the ecosystem. Kashian etal. [15] submitted that wildfire is unlikely to change
carbon stored in forests by more than 10%, unless fireconverts forests to grasslands.The uncontrolled variable in these inventory-based cal-
culations, however, is climate change. McMenamin et al.[51] reported trends in Yellowstone weather stationrecords since 1949 that showed increases in averagespring (March-May) and summer (June-August) tem-peratures. Over the same period, stations reported anincrease in maximum annual temperature, and a decreasein total annual precipitation. The decrease in precipita-tion was most severe during the winter months (Decem-ber, January, and February) and has lead to a reduction insnowpack, as well as notable wetland desiccation. In theyears since 2000, YNP has experienced the most severedroughts on record, dating back over 100 years.Climate change impacts on C and N fluxes among
mature and regenerating lodgepole pine stands in YNPwere modeled by Smithwick et al. [52]. Their resultscould not be seen as definitive, however, with total Cstorage predicted to be 0-9% higher under one climate
Table 2 CASA annual net ecosystem production (NEP) for the Yellowstone study area by (a) vegetation classes and (b)1988 burned areas.
Class Name Area (m2) Minimum Maximum Mean Standard Deviation
a. NLCD Vegetation
Barren 5.33E+07 -188.5 191.4 22.6 36.7
Evergreen Forest 6.25E+09 -162.3 148.5 46.7 45.3
Shrubland 5.90E+09 -195.8 158.4 -21.9 40.7
Mixed Forest 6.25E+04 -77.0 92.5 5.3 20.7
Cultivation 1.33E+07 -158.6 112.8 -3.5 40.5
Wooded Grassland 9.03E+07 40.6 77.8 56.9 15.5
Deciduous Forest 1.88E+05 -163.2 217.6 4.9 41.8
TOTAL Land 1.42E+10 14.0
b. FIRE Area 1988
North Fork 2.14E+09 -162.1 164.1 -7.8 46.9
Clover-Mist 1.17E+09 -162.8 140.3 -12.4 40.0
Storm Creek 5.09E+08 -124.1 149.4 -1.0 37.5
Snake 4.68E+08 -144.9 179.3 -10.1 46.1
Mink 4.23E+08 -161.3 158.4 -2.7 43.9
Hellroaring 4.13E+08 -147.2 160.2 3.7 41.8
Huck 2.33E+08 -135.7 165.2 -6.8 43.2
Red-Shoshone 1.39E+08 -124.2 167.1 8.9 46.2
Clover 1.28E+08 -142.6 93.5 -13.6 36.4
Shoshone 1.28E+08 -162.3 128.5 -9.8 36.0
Fan 1.11E+08 -151.7 117.7 -5.6 47.1
Red 9.89E+07 -137.3 114.7 -11.5 48.5
Falls 6.60E+07 -134.2 108.4 -21.1 41.9
Mist 1.94E+07 -163.2 95.6 -16.7 40.6
Emerald 5.38E+06 -86.0 70.0 -16.9 40.8
Stormcreek 2.31E+06 -79.6 65.4 -17.4 35.0
TOTAL Burned Land 6.05E+09 -7.1
All NEP estimates are in units of g C m2 yr-1, with negative values representing net source fluxes of CO2 to the atmosphere and positive values representing netsink fluxes of CO2 from the atmosphere. Fires are sorted by total area burned.
Potter et al. Carbon Balance and Management 2011, 6:3http://www.cbmjournal.com/content/6/1/3
Page 13 of 16

model outcome, and 5-6% lower under another climatemodel outcome. Overall, this modeling experiment sug-gested that fire return intervals would need to be dra-matically reduced (from around 300 years to 175 years)to affect long-term carbon storage in the Yellowstoneecosystem, due to large soil N pools and relatively fastrecovery of aboveground C pools following fire.
ConclusionsEcosystem production and carbon fluxes in the Yellow-stone region over the next century will likely reflectcomplex relationships between climate, forest age struc-ture, and disturbance-recovery patterns of the landscape,plus management policies for large grazing herbivoresand their predators. Ground-based measurement datasets for YNP have provided process-level understandingof carbon cycles that can help address this complexmatrix of factors, aided by remote sensing of all areas ofthe Park. The need for further analysis of airborne andsatellite observations at high spatial resolutions (< 100m) of vegetation structure and recovery patterns istherefore a high priority for future research.
AcknowledgementsThe authors thank the many field crews of the Yellowstone EcologicalResearch Center for their dedicated field survey work. We are grateful toAnn Rodman, PJ White, and Roy Renkin of the Yellowstone Center forResources, National Park Service, for their guidance on data usage andresearch planning.
Author details1NASA Ames Research Center Mail Stop 242-4, Moffett Field, CA 94035 USA.2California State University, Monterey Bay, Seaside, CA 93955, USA.3Yellowstone Ecological Research Center, 2048 Analysis Drive, Bozeman, MT59718, USA.
Authors’ contributionsAll authors have made substantial contributions to the analysis andinterpretation of data, have been involved in drafting the manuscript andrevising it critically for important intellectual content, and have given finalapproval of the version to be published.
Competing interestsThe authors declare that they have no competing interests.
Received: 3 May 2011 Accepted: 11 August 2011Published: 11 August 2011
References1. Schullery P: Our living resources: a report to the nation on the
distribution, abundance, and health of U.S. plants, animals andecosystems. In The Greater Yellowstone Ecosystem. Edited by: LaRoe ET,
Figure 6 CASA predicted NPP in the Falls Fire area of Yellowstone National Park.
Potter et al. Carbon Balance and Management 2011, 6:3http://www.cbmjournal.com/content/6/1/3
Page 14 of 16
Farris GS, Puckett CE, Doran PD, Mac MJ. USDI National Biological Service,Washington, DC; 1995:312-314.
2. Romme WH: Fire and landscape diversity in subalpine forests ofYellowstone National Park. Ecological Monographs 1982, 52:199-221.
3. Knight DH: Parasites, lightning, and the vegetation mosaic in wildernesslandscapes. In Landscape heterogeneity and disturbance. Edited by: TurnerMG. Springer-Verlag, New York, New York; 1987:59-84.
4. Romme WH, Despain DG: Historical perspective on the Yellowstone firesof 1988. BioScience 1989, 39:695-699.
5. Despain DG: Yellowstone vegetation: consequences of environment andhistory in a natural setting. Rinehart, Boulder, Colorado, USA; 1990.
6. Kashian DM, Turner MG, Romme WH, Lorimer CG: Variability andconvergence in stand structural development on a fire-dominatedsubalpine landscape. Ecology 2005, 86:643-654.
7. Turner MG, Tinker DB, Romme WH, Kashian DM, Litton CM: Landscapepatterns of sapling density, leaf area, and aboveground net primaryproduction in postfire lodgepole pine forests, Yellowstone National Park(USA). Ecosystems 2004, 7:751-775.
8. Kashian DM, Tinker DB, Turner MG, Scarpace FL: Spatial heterogeneity oflodgepole pine sapling densities following the 1988 fires in YellowstoneNational Park, Wyoming, USA. Canadian Journal of Forest Research 2004,34:2263-2276.
9. Romme WH, Turner MG, Wallace LL, Walker JS: Aspen, elk and fire innorthern Yellowstone National Park. Ecology 1995, 76(7):2097-2106.
10. National Research Council (NRC): Ecological Dynamics on Yellowstone’sNorthern Range Washington, D.C., National Academy Press; 2002.
11. Houston DB: Wildfires in northern Yellowstone National Park. Ecology1973, 54(5):1111-1117.
12. Turner MG, Romme WH, Gardner RH, Hargrove WW: Effects of fire size andpattern on early succession in Yellowstone National Park. EcologicalMonographs 1997, 67:411-433.
13. Crabtree R, Potter C, Mullen R, Sheldon J, Huang S, Harmsen J, Rodman A,Jean C: A modeling and spatio-temporal analysis framework formonitoring environmental change using NPP as an ecosystem indicator.Remote Sensing of Environment 2009, 113:1486-1496.
14. Kashian DM, Turner MG, Romme WH: Variability in leaf area andstemwood increment along a 300-year Lodgepole pine chronosequence.Ecosystems 2005, 8:148-61.
15. Kashian DM, Romme WH, Tinker DB, Turner MG, Ryan MG: Carbon storageon landscapes with stand-replacing fires. Bioscience 2006, 56:598-606.
16. Litton CM, Ryan MG, Knight DH, Stahl PD: Soil-surface CO2 efflux andmicrobial biomass in relation to tree density thirteen years after a standreplacing fire in a lodgepole pine ecosystem. Global Change Biology 2003,9:680-696.
17. Tinker DB, Knight DH: Temporal and spatial dynamics of coarse woodydebris in harvested and unharvested lodgepole pine forests. EcologicalModelling 2001, 141:125-149.
18. Potter C, Klooster S, Myneni R, Genovese V, Tan P, Kumar V: Continentalscale comparisons of terrestrial carbon sinks estimated from satellitedata and ecosystem modeling 1982-98. Global and Planetary Change2003, 39:201-213.
19. Potter C, Klooster S, Huete A, Genovese V: Terrestrial carbon sinks for theUnited States predicted from MODIS satellite data and ecosystemmodeling. Earth Interactions 2007, 11:1-21.
20. Dirks RA, Martner BE: The Climate of Yellowstone and Grand Teton NationalParks. U. S. Natl. Park Serv. Occas 1982, 6.
21. Huang S, Rich PM, Crabtree RL, Potter CS, Fu P: Modeling monthly near-surface air temperature from solar radiation and lapse rate: Applicationover complex terrain in Yellowstone National Park. Physical Geography2008, 2:158-178.
22. Rodman A, Shovic HF, Thoma D: Soils of Yellowstone National Park.Yellowstone National Park, Yellowstone Center for Resources. Mammoth,WY 1996, 324.
23. Kokaly RF, Despain DG, Clark RN, Livo KE: Mapping vegetation inYellowstone National Park using spectral feature analysis of AVIRIS data.Remote Sensing of Environment 2003, 84:437-456.
24. Wambolt CL, Sherwood HW: Sagebrush response to ungulate browsing inYellowstone. Journal of Range Management 1999, 52:363-369.
25. Running SW, Nemani RR: Relating seasonal patterns of the AVHRRvegetation index to simulated photosynthesis and transpiration offorests in different climates. Remote Sens Environ 1998, 24:347-367.
26. Goetz SJ, Prince SD: Variability in light utilization and net primaryproduction in boreal forest stands. Can J Forest Res 1998, 28:375-389.
27. Huete A, Didan K, Miura T, Rodriguez EP, Gao X, Ferreira LG: Overview ofthe radiometric and biophysical performanceof the MODIS vegetationindices. Remote Sens Environ 2002, 83:195-213.
28. Rahman AF, Sims DA, Cordova VD, El-Masri BZ: Potential of MODIS EVI andsurface temperature for directly estimating per-pixel ecosystem C fluxes.Geophys Res Lett 2005, 32:L19404.
29. Xiao X, Zhang Q, Braswell B, Urbanski S, Boles S, Wofsy S, Moore B, Ojima D:Modeling gross primary production of temperate deciduous broadleafforest using satellite images and climate data. Remote Sens Environ 2004,91:256-270.
30. Potter CS: Terrestrial biomass and the effects of deforestation on theglobal carbon cycle. BioScience 1999, 49:769-778.
31. Monteith JL: Solar radiation and productivity in tropical ecosystems. JAppl Ecol 1972, 9:747-766.
32. Zheng D, Prince S, Wright R: Terrestrial net primary production estimatesfor 0.5°grid cells from field observations - A contribution to globalbiogeochemical modeling. Glob Change Biol 2003, 9:46-64.
33. Malmstrom CM, Thompson MV, Juday GP, Los SO, Randerson JT, Field CB:Interannual variation in globalscale net primary production: Testingmodel estimates. Global Biogeochem Cycles 1997, 11:367-392.
34. Behrenfeld MJ, Randerson JT, McClain CR, Feldma GC, Los SQ, Tucker CI,Falkowski PG, Field CB, Frouin R, Esaias WE, Kolber DD, Pollack NH:Biosphericprimary production during an ENSO transition. Science 2001,291:2594-2597.
35. Potter CS, Bubier J, Crill P, LaFleur P: Ecosystem modeling of methane andcarbon dioxide fluxes for boreal forest sites. Canadian J Forest Research2001, 31:208-223.
36. Amthor JS, Chen JM, Clein JS, Frolking SE, Goulden ML, Grant RF, Kimball JS,King AW, McGuire AD, Nikolov NT, Potter CS, Wang S, Wofsy SC: Borealforest CO2 exchange and evapotranspiration predicted bynineecosystem process models: Inter-model comparisons andrelations tofield measurements. J Geophys Res 2001, 106, 33,623-33, 648.
37. Hicke JA, Asner GP, Randerson JT, Tucker CJ, Los SO, Birdsey R, Jenkins JC,Field CB, Holland EA: Satellite-derived increases in net primaryproductivity across North America, 1982-1998. Geophys Res Lett 2002,29(10):1427.
38. Thornthwaite CW: An approach toward rational classification of climate.Geogr Rev 1948, 38:55-94.
39. Wickham JD, Stehman SV, Smith JH, Yang L: Thematic accuracy of the1992 National Land-Cover Data for the western United States. RemoteSensing of Environment 2004, 91(3-4):452-468.
40. Daly C, Halbleib M, Smith JI, Gibson WP, Doggett MK, Taylor GH, Curtis J,Pasteris PA: Physiographically-sensitive mapping of temperature andprecipitation across the conterminous United States. International Journalof Climatology 2008.
41. Potter CS, Klooster SA: Dynamic global vegetation modeling (DGVM) forprediction of plant functional types and biogenic trace gas fluxes. GlobalEcology and Biogeography Letters 1999, 8(6):473-488.
42. Huang S, Potter C, Crabtree RL, Hager S, Gross P: Fusing optical and radardata to estimate sagebrush, herbaceous, and bare ground cover inYellowstone. Remote Sensing of Environment 2009.
43. Hatton TJ, West NE, Johnson PS: Relationships of the error associatedwith ocular estimation and actual total cover. Journal of RangeManagement 1986, 39(1):91-92.
44. Bråkenhielm S, Quighong L: Comparison of field methods in vegetationmonitoring. Water, Air, and Soil Pollution 1995, 79:75-87.
45. Seefeldt SS, Booth DT: Measuring plant cover in sagebrush stepperangelands: a comparison of methods. Environmental Management 2006,37:703-711.
46. Huang S, Crabtree RL, Potter C, Gross P: Estimating the quantity andquality of coarse woody debris in Yellowstone post-fire forest ecosystemfrom fusion of SAR and optical data. Remote Sensing of Environment 2009.
47. Ryan MG, Kashian DM, Romme WH, Turner MG, Smithwick EAH, Tinker DB:Fire and carbon cycling for the Yellowstone National Park landscape,Proceedings of the IAWF Meeting. The ‘88 Fires: Yellowstone and Beyond,Jackson, WY; 2008, 22-27.
48. Litton CM, Ryan MG, Knight DH: Effects of tree density and stand age oncarbon allocation patterns in postfire Lodgepole pine. EcologicalApplications 2004, 14(2):460-475.
Potter et al. Carbon Balance and Management 2011, 6:3http://www.cbmjournal.com/content/6/1/3
Page 15 of 16

49. Van Wagner CE: The line-intersect method in forest fuel sampling. ForestScience 1968, 14:20-26.
50. Ryan MG, Binkley D, Fownes JH: Age-related decline in forest productivity:Pattern and process. Advances in Ecological Research 1997, 27:213-262.
51. McMenamin SK, Hadly EA, Wright CK: Climatic change and wetlanddesiccation cause amphibian decline in Yellowstone National Park. ProcNatl Acad Sci USA 2008, 105:16988-16993.
52. Smithwick EAH, Ryan MG, Kashian DM, Romme WH, Tinker DB, Turner MG:Modeling the effects of fire and climate change on carbon and nitrogenstorage in lodgepole pine (Pinus contorta) stands. Global Change Biology2008, 14:1-14.
doi:10.1186/1750-0680-6-3Cite this article as: Potter et al.: Carbon fluxes in ecosystems ofYellowstone National Park predicted from remote sensing data andsimulation modeling. Carbon Balance and Management 2011 6:3.
Submit your next manuscript to BioMed Centraland take full advantage of:
• Convenient online submission
• Thorough peer review
• No space constraints or color figure charges
• Immediate publication on acceptance
• Inclusion in PubMed, CAS, Scopus and Google Scholar
• Research which is freely available for redistribution
Submit your manuscript at www.biomedcentral.com/submit
Potter et al. Carbon Balance and Management 2011, 6:3http://www.cbmjournal.com/content/6/1/3
Page 16 of 16