Embed Size (px)
Citation preview


CarbonFinance
The Financial Implicationsof Climate Change
SONIA LABATTRODNEY R. WHITE
John Wiley & Sons, Inc.

Copyright c© 2007 by Sonia Labatt and Rodney R. White. All rights reserved
Published by John Wiley & Sons, Inc., Hoboken, New Jersey.Published simultaneously in Canada.
Wiley Bicentennial Logo: Richard J. Pacifico
No part of this publication may be reproduced, stored in a retrieval system, or transmitted inany form or by any means, electronic, mechanical, photocopying, recording, scanning, orotherwise, except as permitted under Section 107 or 108 of the 1976 United States CopyrightAct, without either the prior written permission of the Publisher, or authorization throughpayment of the appropriate per-copy fee to the Copyright Clearance Center, Inc., 222Rosewood Drive, Danvers, MA 01923, (978) 750-8400, fax (978) 646-8600, or on the Webat www.copyright.com. Requests to the Publisher for permission should be addressed to thePermissions Department, John Wiley & Sons, Inc., 111 River Street, Hoboken, NJ 07030,(201) 748-6011, fax (201) 748-6008, or online at http://www.wiley.com/go/permission.
Limit of Liability/Disclaimer of Warranty: While the publisher and author have used theirbest efforts in preparing this book, they make no representations or warranties with respect tothe accuracy or completeness of the contents of this book and specifically disclaim any impliedwarranties of merchantability or fitness for a particular purpose. No warranty may be createdor extended by sales representatives or written sales materials. The advice and strategiescontained herein may not be suitable for your situation. You should consult with aprofessional where appropriate. Neither the publisher nor author shall be liable for any loss ofprofit or any other commercial damages, including but not limited to special, incidental,consequential, or other damages.
For general information on our other products and services or for technical support, pleasecontact our Customer Care Department within the United States at (800) 762-2974, outsidethe United States at (317) 572-3993 or fax (317) 572-4002.
Wiley also publishes its books in a variety of electronic formats. Some content that appears inprint may not be available in electronic books. For more information about Wiley products,visit our Web site at www.wiley.com.
Library of Congress Cataloging-in-Publication Data:
Labatt, Sonia.Carbon finance: the financial implications of climate change / Sonia Labatt
Rodney R. White.p. cm. —(Wiley finance series)
‘‘Published simultaneouly in Canada.’’Includes bibliographical references and index.ISBN-13: 978-0-471-79467-7 (cloth)ISBN-10: 0-471-79467-8 (cloth)
1. Emissions trading. 2. Greenhouse gases—Economic aspects. 3.Environmental economics. I. White, Rodney R. II. Title
HC79.P55L33 2007363.738′746—dc22
2006033468
ISBN-13 978-0-471-79467-7
Printed in the United States of America
10 9 8 7 6 5 4 3 2 1

Foreword
After decades of debate, there is now a clear scientific consensus thatclimate change is occurring and that human activities are a major
contributory factor.Furthermore, the groundbreaking report from Sir Nicholas Stern,
released in October 2006, shows clearly that it is a serious economicthreat, not just a scientific concern. In his comprehensive report for theU.K. government, the former chief economist at the World Bank describesclimate change as ‘‘the greatest market failure the world has seen.’’
Unabated climate change could cost as much as 20 percent of globalgross domestic product (GDP), he estimates. By acting promptly to avoidthe worst impacts of global warming, however, he says the cost could belimited to around 1 percent of GDP.
A variety of responses are required, including education and aware-ness raising, improvements in energy efficiency, and measures to stimulatethe deployment of low-carbon technologies. But, Stern says, a key policyrequirement is carbon pricing—assigning a cost to emissions of greenhousegases—through taxation, regulation, and/or emissions trading.
Thanks to the Kyoto Protocol, tools for pricing carbon already exist.The 1997 treaty, which eventually came into force in February 2005, createdtwo mechanisms—Joint Implementation (JI) and the Clean DevelopmentMechanism (CDM)—to encourage investments in projects that reducecarbon emissions in industrialized and developing countries, respectively.In addition, it imposed binding emissions limits on industrialized nationsand set out the rules for a global market in emission reductions. Such amarket should ensure that the cheapest reductions are targeted first, thusminimizing the overall cost of tackling global warming.
To create the foundations for this market, industrialized countries haveeach been assigned a limited number of emission allowances and those thatfind it difficult to stay within their limit will be allowed to buy allowancesfrom those with an excess. Also, in return for investing in CDM or JIprojects, these countries will receive emission reduction credits or ‘‘carboncredits’’ that can be used to offset their own emissions.
The first international attempt to implement such a system was launchedby the European Union in January 2005 and required its 25 member statesto impose emissions caps on individual industrial facilities. As a result,
iii

iv FOREWORD
greenhouse gas emissions are now a routine risk management issue, andhave a direct impact on the bottom line, for some 5,000 companies acrossEurope.
Within 18 months of the program being set up, prices reached ¤30per metric ton of carbon dioxide (the standard trading unit in the carbonmarket) and the value of the market in 2005 was estimated at around¤6.5 billion, even though a majority of the affected companies have neitherbought nor sold allowances yet. But the EU Emissions Trading Scheme (ETS)represents a financial exposure even for those companies that have not yettraded since all installations covered by the scheme face substantial financialpenalties if their emissions exceed their annual allocation of allowances.
In late 2006, average daily volume in the market was around 4 millionallowances, despite an overgenerous allocation process that means, overall,there will be no shortage in the pilot phase of the program, which runs untilthe end of 2007. The rules will be tightened to ensure that there is a genuineshortage of allowances in Phase II (2008–12).
Other countries and regions, especially in the United States, Australia,and Japan, are keeping a close eye on the European Union (EU) scheme andsome have plans for similar initiatives of their own. Several other Europeancountries—notably Norway, Switzerland, and Iceland—have announcedfirm plans to join the EU ETS.
In line with the Kyoto Protocol, the EU trading program also allowscompanies to buy carbon credits from CDM and JI projects to supplementtheir own emission reduction efforts. By mid-2006, more than $6 billionhad been assigned to dedicated ‘‘carbon funds’’ that aim to purchase creditsfrom such projects to help companies and countries meet their emissionstargets.
According to the World Bank, the overall carbon market—includingthe EU ETS, CDM and JI transactions, and other smaller emission reductionprograms—was worth some $22 billion in the first nine months of 2006.This is more than double the figure for the whole of 2005, and compara-ble to some established commodity markets, although still very small bycomparison with equity, interest rate, and currency markets.
As trading volumes increase, there will naturally be a growing demandfor insurance products linked to carbon prices. And, as the market expands,hedge funds and other speculators are showing an interest in trading carboncredits, which represent a new asset class that is uncorrelated with mostconventional securities.
Corporate emissions of carbon dioxide, methane, and other greenhousegases are therefore no longer just the concern of environmental, health,and safety staff, but are increasingly a matter for senior management, as

Foreword v
well as equity analysts, project financiers, insurers, and even mainstreaminstitutional investors.
In addition to the major European emitters that are subject to themandatory requirements of the EU ETS, thousands of other companiesaround the world are taking voluntary action to reduce their emissions.They are generally motivated either by a desire to gain some kind of first-mover advantage ahead of expected legislation, or to boost their reputationwith consumers and shareholders.
The latter are increasingly holding companies to account for theircontribution to climate change. A prime example is the Carbon DisclosureProject, an initiative backed in 2006 by more than 200 institutional investorsrepresenting some $31 trillion of assets under management—around a thirdof the world’s investment capital. The investors sent a questionnaire tothe chairmen of the world’s largest companies asking them to disclose‘‘investment-relevant information concerning their emissions of greenhousegases.’’ Responses are made public and those that fail to respond are namedand shamed.
And, while the EU ETS currently targets only large industrial emitters,the responsibility for reducing emissions will not stop there. To complementthe trading of emission allowances, carbon taxes are increasingly beingintroduced to penalize the use of highly emitting goods and services. Insome countries vehicles are already taxed according to how much carbondioxide they emit, and electricity suppliers are obliged to inform consumershow much of the power they sell comes from low-carbon sources.
There is even talk among European politicians of giving individuals theirown ‘‘carbon allowance’’ each year, which could be credited and debitedaccording to their purchases, travel choices, and energy consumption.
Sonia Labatt and Rodney White have provided a highly readableoverview of the key developments in this fast-evolving area of carbonfinance. It should be a valuable guide for anyone wishing to understandthe implications of this innovative market-based approach to combatingclimate change.
Graham Cooper
PublisherEnvironmental Finance magazine
December 2006


Contents
Foreword iii
About the Authors xiii
Acknowledgments xv
List of Acronyms xvii
CHAPTER 1
Introduction 1
Introduction 1The Changing Climate 3
The Scientific Context of Climate Change 5The Political Context of Climate Change 8
Corporate Climate Risk 11Regulatory Risk 11Physical Risks 13Business Risks 14
Climate Policies 15Mitigation Policies 15Adaptation Measures 19
Role of the Financial Services Sector 21Conclusion 23
CHAPTER 2
The Energy Chain 27
Introduction 27The Energy Chain and the Value Chain 28Carbon Policies 32
Policy Approaches 32The Broader Policy Context 33National and Local Self-Sufficiency 33
Impacts of Different Users and Uses on Climate Change 34Users: Business, Households, and Government 34
vii

viii CONTENTS
Uses: Manufacturing, Transportation, Heating, Water,and Solid Waste 34
Sources of Energy: Fossil Fuels 36Coal 36Oil 37Gas 38
Sources of Energy: Nuclear Energy 39Sources of Energy: Hydroelectric Power 41Sources of Energy: Renewables 42
Traditional Biomass 44Wind Energy 44Solar Energy 46Tidal Energy and Wave Energy 47Modern Biomass and Biofuels 48Geothermal Energy 50
Key Issues 50A Hydrogen Economy Based on Fuel Cells? 51Carbon Sequestration 52Unintended Discharges 53
Financing the Transformation of the Energy Chain: The Roleof Venture Capital 53
Conclusion 55
CHAPTER 3
Regulated and Energy-Intensive Sectors 57
Introduction 57Power Industry 57Integrated Oil and Gas Industry 65
Government Mandates 65Physical Capital 66Restricted Access to Oil and Gas Reserves 66The Coming Age of Gas, and Beyond 68Global Concerns Regarding Energy Security 70
Transportation 71Automotive Industry 72Factors Affecting Auto Manufacturers’ Carbon Profile 76Aviation 80
Cement 82Competitive Implications of Climate Risk in Regulated
and Energy-Intensive Sectors 84Conclusion 87

Contents ix
CHAPTER 4
The Physical Impacts of Climate Change on the Evolution of Carbon
Finance 89
Introduction 89Physical Impacts on Unregulated Sectors 90
Water Supply and Treatment 90Agriculture 92Forestry 94Fisheries 96Real Property and Production Facilities 96Transportation 97Tourism 97Municipalities 98The Built Environment 100
Physical Impacts on Carbon-Regulated Sectors 103Electric Power 103Oil and Gas Producers 104
Financial Services 105Banking 105Investment 106Insurance 106
Conclusion 108
CHAPTER 5
Institutional Investors and Climate Change 111
Introduction 111Institutional Investors: Size and Global Reach 112Environmental Reporting 112
Corporations 112Institutional Investors 113
Corporate Environmental Reporting 113New Era of Fiduciary Responsibility for Institutional
Investors 116Investment Decision Making 117Active Engagement 118Shareholder Resolutions and Proxy Voting 120
Mutual Funds 122New Momentum in the Corporate World 125Barriers to the Financial Consideration of Climate Change 127Institutional Investors and Climate Change 130
x CONTENTS
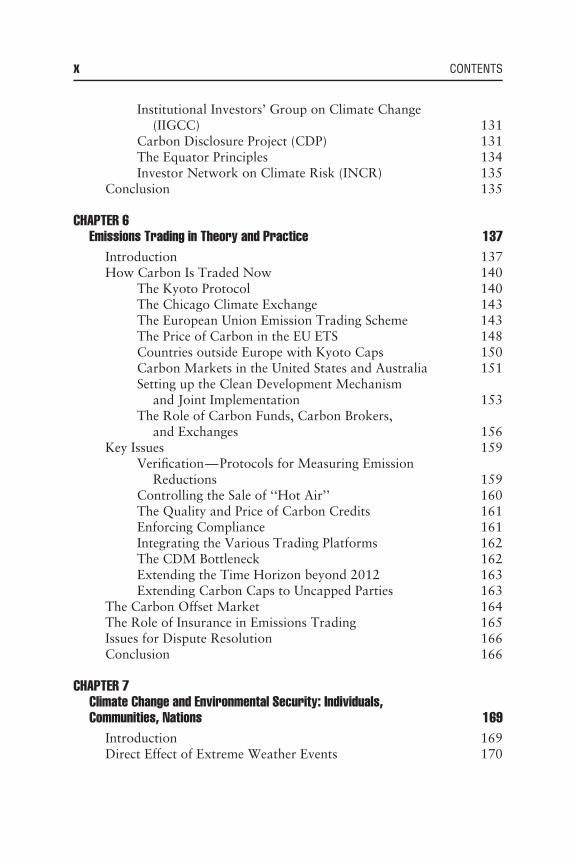
Institutional Investors’ Group on Climate Change(IIGCC) 131
Carbon Disclosure Project (CDP) 131The Equator Principles 134Investor Network on Climate Risk (INCR) 135
Conclusion 135
CHAPTER 6
Emissions Trading in Theory and Practice 137
Introduction 137How Carbon Is Traded Now 140
The Kyoto Protocol 140The Chicago Climate Exchange 143The European Union Emission Trading Scheme 143The Price of Carbon in the EU ETS 148Countries outside Europe with Kyoto Caps 150Carbon Markets in the United States and Australia 151Setting up the Clean Development Mechanism
and Joint Implementation 153The Role of Carbon Funds, Carbon Brokers,
and Exchanges 156Key Issues 159
Verification—Protocols for Measuring EmissionReductions 159
Controlling the Sale of ‘‘Hot Air’’ 160The Quality and Price of Carbon Credits 161Enforcing Compliance 161Integrating the Various Trading Platforms 162The CDM Bottleneck 162Extending the Time Horizon beyond 2012 163Extending Carbon Caps to Uncapped Parties 163
The Carbon Offset Market 164The Role of Insurance in Emissions Trading 165Issues for Dispute Resolution 166Conclusion 166
CHAPTER 7
Climate Change and Environmental Security: Individuals,
Communities, Nations 169
Introduction 169Direct Effect of Extreme Weather Events 170

Contents xi
Health Effects of Climate Change 173Direct Effects of Temperature Extremes: Heat Waves
and Cold Spells 174Indirect Effects of Climate Change: Vector-Borne
Infectious Diseases 175Polar Regions 179Climate Systems and National Sovereignty 181
The Gulf Stream and the Thermohaline Current 181The El Nino/Southern Oscillation (ENSO) 183
Conclusion 185
CHAPTER 8
Adapting to Adverse and Severe Weather 187
Introduction 187Adverse Weather: The Role of Weather Derivatives 188
Weather Derivative Instruments 191Examples of Weather Derivative Contracts 192Current Status of Weather Markets 193Constraints on the Weather Derivatives Market 196
Severe Weather: The Role of Catastrophe Bonds 198The Structure of a Catastrophe Bond 199Catastrophe Bonds and Carbon Finance 200
Conclusion 201
CHAPTER 9
Key Players in the Carbon Markets
by Martin Whittaker, guest author 205
Introduction 205Basic Elements of the Market 206
EU ETS Trading 206Clean Development Mechanism (CDM) and Joint
Implementation (JI) Projects 207Intermediaries, Speculators, and Professional Services 208
Key Private-Sector Players 210Compliance Participants 210Commercial Banks 210Carbon Funds 211Speculative Investors 211Project Developers and Aggregators, Consultants 213Equity Research 213Carbon Brokers 215

xii CONTENTS
Exchanges 216Credit Rating Agencies 217Insurers 217
Key Players from the Public Sector 218National Governments 218National Business Associations 219Multilateral Banks 219
Information Services 220Professional Services 221
Accounting 221Legal 221
New Horizons for the Carbon Market 222Carbon as an Asset Class 222Mainstreaming into Project Finance 222
Conclusion 223
CHAPTER 10
Carbon Finance: Present Status and Future Prospects 225
Introduction 225Trading Volumes in Carbon and Weather Markets 227
Carbon Markets 227Weather Derivatives 228
What Can Be Traded Where? (and What Cannot?) 229Price Discovery 230The Evolution of Products for Carbon Finance 231Litigation over Responsibility for Climate Change 232Is Carbon Finance Likely to Help Us Avert Dangerous Levels
of Climate Change? 234Carbon Finance within the Broader Field of Environmental
Finance 235Conclusion 237
Endnotes 241
Web Sites 245
References 247
Index 263
About the Authors
Sonia Labatt is an associate faculty member at the Centre for Environment,University of Toronto. She has been engaged in the academic world ofenvironmental finance through her graduate-level courses at the university,and in the financial services world as an active investor. Dr. Labatt broadensher environmental concerns, experience, and commitment through herassociation with World Wildlife Fund Canada.
Rodney R. White, Professor of Geography at the University of Toronto,was director of the university’s Institute for Environmental Studies1994–1999 and 2000–2005. He is also an Associate Fellow of the Environ-mental Change Institute at the University of Oxford and a Senior Fellow atMassey College, University of Toronto. His recent books include Buildingthe Ecological City and Planning in Cities (with Roger Zetter).
In 2002 Sonia Labatt and Rodney White published EnvironmentalFinance: A Guide to Environmental Risk Assessment and Financial Products(Wiley Finance).
Martin Whittaker, Carbon Finance guest author, leads the environmen-tal finance strategy at MissionPoint Capital Partners, a Connecticut-basedprivate investment firm. Prior to joining MissionPoint, he was part ofthe Environmental and Commodity Markets team at Swiss Re FinancialServices. Dr. Whittaker holds a PhD in environmental science from theUniversity of Edinburgh and an MBA from the University of London. Pre-voiusly, he was an adjunct professor at the Unversity of Toronto, where hetaught environmental finance.
xiii


Acknowledgments
While writing this book we have benefited from the knowledge of a numberof people, many of whom have become experts in the new field of carbonfinance. They include: Jane Ambachtsheer (Mercer Investment Counseling),Dominic Barton (McKinsey & Company), Ann-Marie Brinkman (Inter-national Energy Agency), Frances Buckingham (SustainAbility), ValerieCooper (Weather Risk Management Association), Renata Christ (Intergov-ernmental Panel on Climate Change), Julie Desjardins (CICA consultant),James Evans (RBC Financial Group), Odette Goodall (Endiang HoldingsInc.), Charles Kennedy (MacDougall, MacDougall & MacTier Inc.), YannKermode (UBS AG), Ian Hart (Pacific Institute), John Lane (Johns Hop-kins University Press), Helen Lup (The Economical Insurance Group), SueMcGeachie (Innovest Strategic Value Advisors), Andrea Moffat (CERES),Sibyl Nelson (Pew Center on Global Climate Change), Brenda Norris(Commissioner, Roosevelt Campobello International Park Commission),Nick Parker (Cleantech Capital Group LLC), Alexander Pohl (HSBC), JaneRigby (Environment Canada), Dr. Armin Sandhoeval (Allianz Climate CoreGroup), Elizabeth Sandler (Science magazine), Ashraf Sharkawy (AllianzGlobal Risks), Gray Taylor (Bennett Jones), William (Bill) Tharp (TheQuantum Leap Company Limited), John Turner (Miller Thomson LLP),Angelika Wirtz (Munich Re), Alan Willis (Alan Willis and Associates),Errick Willis (ICF International), and Martin Whittaker (Mission PointCapital Partners).
Once again, we owe special thanks to Graham Cooper, foundingpublisher of the journals Environmental Finance and Carbon Finance, forhis foresight in recognizing the emergence of the field of carbon finance inanticipation of a carbon-constrained world. For a second time, Graham hasbeen kind enough to write the foreword to our book.
Finally we recognize our spouses, Sue White and Arthur Labatt, whooffered wise counsel, encouragement, and support, and have shown patiencebeyond their call of duty.
Even with all this help, no doubt errors do remain, for which the authorsalone take all responsibility.
Sonia Labatt and Rodney R. White
xv


List of Acronyms
AAUs assigned amount unitsABI Association of British InsurersACEA Association des Constructeurs Europeen d’Automobiles
(Association of European Automobile Manufacturers)AGM annual general meetingAIM Alternative Investment Market (London)AMD Accounts Modernization Directive (U.K.)ART alternative risk transferCAFE Corporate Average Fuel Economy standard (U.S.)CalPERS California Public Employees’ Retirement SystemCalSTERS California State Teachers’ Retirement SystemCARB California Air Resources BoardCBOT Chicago Board of TradeCCS carbon capture and storageCCSA Carbon Capture and Storage Association (U.K.)CCX Chicago Climate ExchangeCDD cooling degree dayCDM Clean Development MechanismCDP Carbon Disclosure ProjectCEC Commission of the European CommunitiesCEO chief executive officerCERs Certified Emissions Reduction units from the Clean
Development Mechanism (CDM)CFIs Carbon Financial Instruments (at the CCX)CFO chief financial officerCHP combined heat and powerCICA Canadian Institute of Chartered AccountantsCME Chicago Mercantile ExchangeCOP Conference of the Parties: the United Nations Framework
Convention on Climate ChangeDefra Department for Environment, Food, and Rural Affairs
(U.K.)DSRF deep southerly return flow
xvii

xviii LIST OF ACRONYMS
EBITDA earnings before interest, taxes, depreciation, andamortization
ECX European Climate ExchangeEEZ Exclusive Economic ZoneEFET European Federation of Energy TradersEH&S environment, health, and safetyEIB European Investment BankENSO El Nino/Southern OscillationEOR enhanced oil recoveryEPA Environmental Protection Agency (U.S.)ERPA Emission Reduction Purchase AgreementERUs emission reduction units from Joint Implementation (JI)ETS emissions trading schemeEUA European Union AllowancesEUETS European Union Emissions Trading SchemeGAAP General Agreement on Accounting PracticesGGCAP Greenhouse Gas Credit Aggregation Pool (Natsource)GHGs greenhouse gasesGTL gas-to-liquid (refinery process)HDD heating degree dayHEP hydro-electric powerHFCs hydrofluorocarbonsHOV high occupancy vehicles (road lanes reserved for)IATA International Air Transport AssociationICE internal combustion engineICLEI International Council for Local Environmental InitiativesIET international emissions tradingIETA International Emissions Trading AssociationIFC International Finance CorporationIFIC Investment Fund Institute of CanadaIGCC integrated gasification combined cycle (power station)IIGCC Institutional Investors’ Group on Climate ChangeINCR Investor Network on Climate RiskIPCC Intergovernmental Panel on Climate ChangeIPE International Petroleum ExchangeIPO initial public offeringIRRC Investor Responsibility Research CenterISDA International Swaps and Derivatives AssociationJAMA Japan Automobile Manufacturers’ AssociationJI Joint Implementation

List of Acronyms xix
KAMA Korea Automobile Manufacturers’ AssociationLEED Leadership in Energy and Environmental DesignLFG landfill gasMAC marginal abatement costLIBOR London Interbank Offered RateLNG liquified natural gasMCCF Multilateral Carbon Credit FundMD&A management’s discussion and analysisMOP meeting of the Parties to the Kyoto ProtocolMW megawattNAIC National Association of Insurance Commissioners (U.S.)NGO non-governmental organizationNOx nitrogen oxidesNAP National Action Plan (EU ETS)OECD Organisation for Economic Co-operation and
DevelopmentOMERS Ontario Municipal Employee Retirement SystemOPEC Ogranisation of Petroleum-exporting CountriesOTC over the counter (trading)PDI power dissipation indexREC Renewable Energy CertificateRGGI Regional Greenhouse Gas InitiativeSEC Securities and Exchange Commission (U.S.)SMUD Sacramento Municipal Utility DepartmentSO2 sulfur dioxideSRI socially responsible investmentSUV sports utility vehicleTBE tick-borne encephalitisTHC thermohaline circulationTIAA-CREF Teachers’ Insurance and Annuity Association—College
Retirement Equities FundUKCIP United Kingdom Climate Impact ProgrammeUNEP United Nations Environment ProgrammeUNEPFI United Nations Environment Programme Financial
InitiativeUNFCCC United Nations Framework Convention on Climate
ChangeUSS Universities’ Superannuation Scheme (U.K.)VAT value-added taxWAIS Western Antarctic Ice Sheet

xx LIST OF ACRONYMS
WBCSD World Business Council for Sustainable DevelopmentWMO World Meteorological OrganizationWNV West Nile virusWRI World Resources InstituteWRMA Weather Risk Management AssociationZEV zero-emission vehicle (California’s mandate)
CHAPTER 1Introduction
One thing that we’ve really broadly started to appreciate more isthat climate is not an environmental issue. Climate change is asystemic and fundamental issue about the way our economicswork and the way we get our energy.
—Robert Bradley, World Resources Institute
INTRODUCTION
Environmental concerns in general, and issues regarding climate change inparticular, are moving from the realm of corporate Environment, Health,and Safety (EH&S) personnel, into that of corporate financial strategy,which involves chief executive officers (CEOs) and chief financial officers(CFOs) as well as boards of directors. The pace of this transformation hasleft few unaffected, from companies and cities managing their greenhousegas emissions to equity and debt analysts paying close attention to climateliabilities along with physical concerns regarding the potential impacts ofclimate change patterns.
Carbon finance explores the financial implications of living in a carbon-constrained world—a world in which emissions of carbon dioxide andother greenhouse gases1 carry a price. Thus, carbon finance:
� Represents one specific dimension of environmental finance.� Explores the financial risks and opportunities associated with a carbon-
constrained society.� Anticipates the availability and use of market-based instruments that are
capable of transferring environmental risk and achieving environmentalobjectives.
1

2 CARBON FINANCE
This conveys a more inclusive meaning than the one adopted by theWorld Bank:
Carbon finance is the term applied to the resources provided to aproject to purchase greenhouse gas emissions reductions. (WorldBank 2006)
Our broader definition is consistent with the usage adopted by thejournal Carbon Finance, which covers ‘‘market solutions to climate change.’’
A variety of drivers influence the discipline of carbon finance, which inturn takes many forms (Figure 1.1). It is shaped by national and interna-tional regulations, which require producers and consumers to emit fewergreenhouse gases (GHGs), or to pay the price. Some of these regulations hadtheir origin in an earlier piece of legislation designed to curb air pollution,conserve energy, and promote renewable energy. Others have been createdby international agreements such as the Kyoto Protocol and the EuropeanUnion Emission Trading Scheme.
GovernmentPolicies
Price of Carbon
New Financial Products
Alternative Investment
Opportunities
(Strategies)
CarbonExchanges
Environmental Damage
Resource Scarcityand Security
ConsumerPressures
New Consumer Products
New (Clean) Technologies
Corporations
CARBON FINANCE
Investors
FIGURE 1.1 Carbon Finance: Its drivers and markets

Introduction 3
Putting a price on greenhouse gas emissions will have a significanteffect on country and company bottom lines. At the same time, governmentclimate policies can do much to change behavior patterns and encouragemarkets to mitigate these issues. Thus, we define carbon finance broadly interms of the financial nature of these impacts and examine actions that havebeen taken, and markets that have developed, to reduce them.
While other environmental issues, such as contaminated land and acidrain are either sector or regionally specific, climate risk is a global phe-nomenon that has the potential to affect all companies, all sectors, andwhole economies. Thus, climate change has become one of the most finan-cially significant environmental concerns facing investors. New financialplayers have emerged beyond the traditional public markets that offeralternative private investment opportunities within the carbon economy. Inaddition, the establishment of a price for carbon has spawned the newestof trading activities, as carbon exchanges are established and utilities andenergy companies join brokers, traders, hedge funds, and venture capitalistsin this new field of carbon finance. (See Chapter 9.)
THE CHANGING CLIMATE
Although the issues surrounding climate change are perceived as being fairlynew, a brief reflection on the history of research in the area reveals studiesin the nineteenth century that involved the concept of global warming.Early works by the French mathematician and physicist Joseph Fourier(1768–1830) explored the field of terrestrial and radiant heat, and con-cluded that the atmosphere could, indeed, trap heat. Fourier suggested thatthe atmosphere warms the earth’s surface not only by letting through high-energy solar heat, but also by trapping part of the longer-wave radiationthat bounces back from its surface. Fourier’s work provided the impetusfor the Swedish scientist Svante Arrhenius (1859–1927) who recognizedthe importance of atmospheric CO2 content and the warming of the earth’ssurface. He is credited with the idea that increases in the volume of carbondioxide in the atmosphere, due to the burning of fossil fuels in factoriesduring the Industrial Revolution, was changing the composition of theatmosphere, and could heat the climate. He was the first to publish ascientific article that predicted a temperature increase of 1.5 to 5.5◦C fromdoubling CO2 levels—no mean feat considering the absence of computersin the late 1800s. Current predictions are in the same temperature range.
Since the Industrial Revolution, levels of carbon dioxide in the atmo-sphere have grown by more than 30 percent as a result of burning fossilfuels, land use change, and other man-made emissions. This human behavior

4 CARBON FINANCE
has amplified the natural ‘‘greenhouse effect,’’ leading to an average surfacetemperature increase of 0.6◦C during the twentieth century. The distin-guished scientists Hans Suess and Roger Revelle revealed that changes wereunder way in the earth’s atmosphere, with notable increases in CO2 levels.Following confirmation of these findings by David Keeling2 in Hawaii in1957 (Keeling and Whorf 2001), the United States National Academy ofSciences published the following warning in 1979:
The current trajectory (of CO2 emission levels) could produce 6◦Cwarming by 2150 . . . CO2 may change the world climate. (Charney1979)
Since that time, the Mauna Loa Observatory measurements have revealeda steady increase in CO2 concentrations (Firor 1990). Fifty percent of theincrease in emissions has been released in the 30-year period from 1974to 2004, with the largest increase in CO2 emissions occurring in 2004,in both absolute and relative terms (Baumert, Herzog, and Pershing 2005).From a temperature perspective, average global temperatures have beenthe warmest since reliable records have been kept over the last 125 years,with 10 of the warmest years on record all having occurred since 1990(Figure 1.2). The summer of 2005 was recorded as the hottest ever observedin the Northern Hemisphere (Silver and Dlugolecki 2006).
−0.6
−0.4
−0.2
0
0.2
0.4
0.6
0.8
1855 1865 1875 1885 1895 1905 1915 1925 1935 1945 1955 1965 1975 1985 1995 2005
Tem
pera
ture
anom
aly
(°C
)
FIGURE 1.2 Global temperature anomaliesSource: Climatic Research Unit, University of East Anglia www.cru.uea.ac.uk/cru/info/warming.
Introduction 5
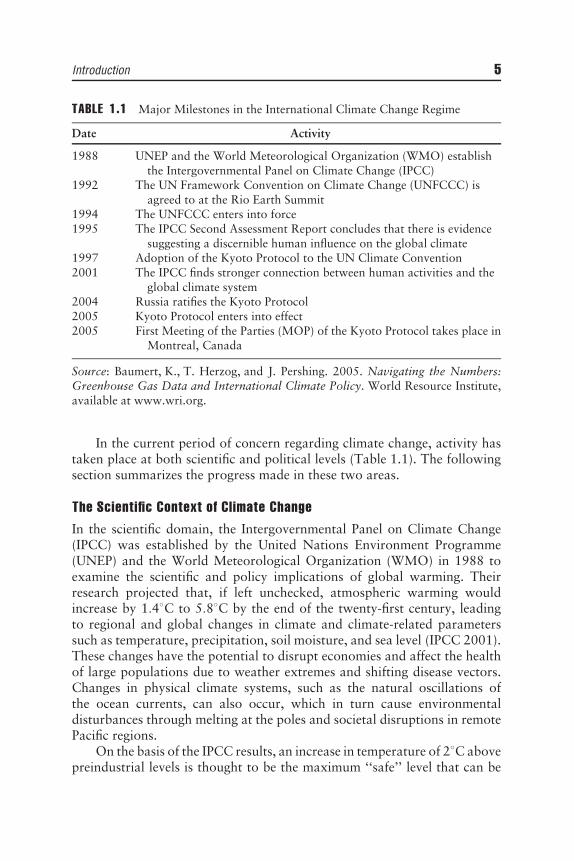
TABLE 1.1 Major Milestones in the International Climate Change Regime
Date Activity
1988 UNEP and the World Meteorological Organization (WMO) establishthe Intergovernmental Panel on Climate Change (IPCC)
1992 The UN Framework Convention on Climate Change (UNFCCC) isagreed to at the Rio Earth Summit
1994 The UNFCCC enters into force1995 The IPCC Second Assessment Report concludes that there is evidence
suggesting a discernible human influence on the global climate1997 Adoption of the Kyoto Protocol to the UN Climate Convention2001 The IPCC finds stronger connection between human activities and the
global climate system2004 Russia ratifies the Kyoto Protocol2005 Kyoto Protocol enters into effect2005 First Meeting of the Parties (MOP) of the Kyoto Protocol takes place in
Montreal, Canada
Source: Baumert, K., T. Herzog, and J. Pershing. 2005. Navigating the Numbers:Greenhouse Gas Data and International Climate Policy. World Resource Institute,available at www.wri.org.
In the current period of concern regarding climate change, activity hastaken place at both scientific and political levels (Table 1.1). The followingsection summarizes the progress made in these two areas.
The Scientific Context of Climate Change
In the scientific domain, the Intergovernmental Panel on Climate Change(IPCC) was established by the United Nations Environment Programme(UNEP) and the World Meteorological Organization (WMO) in 1988 toexamine the scientific and policy implications of global warming. Theirresearch projected that, if left unchecked, atmospheric warming wouldincrease by 1.4◦C to 5.8◦C by the end of the twenty-first century, leadingto regional and global changes in climate and climate-related parameterssuch as temperature, precipitation, soil moisture, and sea level (IPCC 2001).These changes have the potential to disrupt economies and affect the healthof large populations due to weather extremes and shifting disease vectors.Changes in physical climate systems, such as the natural oscillations ofthe ocean currents, can also occur, which in turn cause environmentaldisturbances through melting at the poles and societal disruptions in remotePacific regions.
On the basis of the IPCC results, an increase in temperature of 2◦C abovepreindustrial levels is thought to be the maximum ‘‘safe’’ level that can be

6 CARBON FINANCE
estimated.3 To stabilize atmospheric CO2 concentrations at this level, world-wide emissions would need to peak around 2015 and subsequently declineby 40 percent to 45 percent by 2050, compared to 1990 levels. However,since both world populations and economies are expected to grow duringthe twenty-first century, substantial changes in energy use and advances inefficiency, conservation, and alternative energy sources, as well as techno-logical innovations, will be required to reduce emissions. It is possible thatmajor impacts on ecosystems and water resources could occur even with atemperature increase of between 1◦C and 2◦C. The risk of negative impactson global food production and water supply is anticipated to increasesignificantly once global temperature increase exceeds 2◦C (CEC 2005).
IPCC studies identified potentially serious changes, including increasesin the frequency of extreme high-temperature events, floods, and droughtsin some regions (Table 1.2). Indirect impacts identified include changes inthe distribution and activity of parasites, altered food productivity, as wellas the likely disturbance of complex ecological systems, such as tropicalforests (Stripple 2002). IPCC published its First Assessment in 1990, andhas updated its documents in 1996 and 2001. Drafts are now circulating ofthe fourth assessment, which is due in 2007.
Although there remain some Kyoto detractors who are skeptical of thescience, scope, and causes of climate change, there is a growing consensusas to the validity of the fact that natural climate fluctuations have been aug-mented by anthropogenic activities. In 2001 the IPCC compared the averageglobal surface temperature, as measured since 1860 (dark line) to computersimulations (Figure 1.3) predicting average temperatures that both exclude(natural forcing only) and include (natural + anthropogenic forcing) theeffects of emissions caused by human activity. The IPCC research sug-gests that the actual temperature correlates with the scenario where humanemissions are a factor (Mercer Investment Consulting 2005).
In 2006, even the United States withdrew its claim that a discrepancyexisted in the validity of climate modeling and acknowledged evidence ofthe human impact on global temperature increases (U.S. Climate ChangeScience Program 2006). The same year, scientists were joined by the eminenteconomist, Sir Nicholas Stern, in the debate on global climate change. Inhis report, Stern (2006) warned that global climate change will cost worldeconomies as much as $7 trillion in lost output and could create as manyas 200 million environmental refugees unless drastic action is taken bygovernments worldwide. Sir Nicholas writes:
Our actions over the coming few decades could create risks ofmajor disruption and social activity later in this century and in thenext, on a scale similar to those associated with the great wars andthe economic depression of the first half of the 20th century.
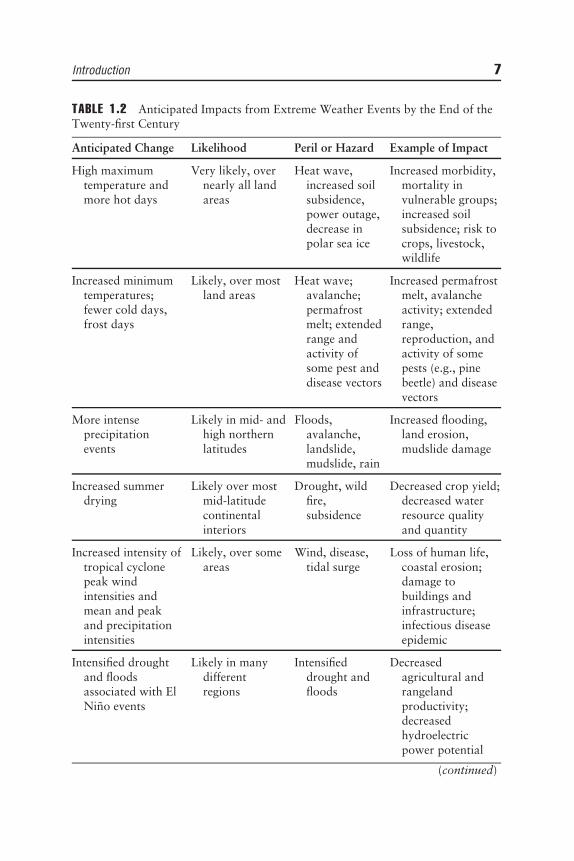
Introduction 7
TABLE 1.2 Anticipated Impacts from Extreme Weather Events by the End of theTwenty-first Century
Anticipated Change Likelihood Peril or Hazard Example of Impact
High maximumtemperature andmore hot days
Very likely, overnearly all landareas
Heat wave,increased soilsubsidence,power outage,decrease inpolar sea ice
Increased morbidity,mortality invulnerable groups;increased soilsubsidence; risk tocrops, livestock,wildlife
Increased minimumtemperatures;fewer cold days,frost days
Likely, over mostland areas
Heat wave;avalanche;permafrostmelt; extendedrange andactivity ofsome pest anddisease vectors
Increased permafrostmelt, avalancheactivity; extendedrange,reproduction, andactivity of somepests (e.g., pinebeetle) and diseasevectors
More intenseprecipitationevents
Likely in mid- andhigh northernlatitudes
Floods,avalanche,landslide,mudslide, rain
Increased flooding,land erosion,mudslide damage
Increased summerdrying
Likely over mostmid-latitudecontinentalinteriors
Drought, wildfire,subsidence
Decreased crop yield;decreased waterresource qualityand quantity
Increased intensity oftropical cyclonepeak windintensities andmean and peakand precipitationintensities
Likely, over someareas
Wind, disease,tidal surge
Loss of human life,coastal erosion;damage tobuildings andinfrastructure;infectious diseaseepidemic
Intensified droughtand floodsassociated with ElNino events
Likely in manydifferentregions
Intensifieddrought andfloods
Decreasedagricultural andrangelandproductivity;decreasedhydroelectricpower potential
(continued)

8 CARBON FINANCE
TABLE 1.2 (continued)
Anticipated Change Likelihood Peril or Hazard Example of Impact
Increased Asiansummermonsoonprecipitationvariability
Likely in temperateand tropical Asia
Increase in floodand droughtmagnitude anddamages
Increased risk tohuman life,health, property,productivity;damage tofarmland,buildings, andinfrastructure
Increased intensityof mid-latitudestorms(extra-tropicalcyclones)
Little agreementbetween currentmodels as of2001b
Increase in stormevents
Increased risk tohuman life andhealth; propertyandinfrastructurelosses; damage tocoastalecosystems
aLikelihood refers to judgemental estimates of confidence used by IPCC Summary forPolicymakers TAR WG1:very likely (90 to 99% chance); likely (66 to 90% chance).b Subsequent research Knufson/Trenberth/MIT/ABI) has shown increased likelihoodof hurricane damages.Sources: Derived from: IPCC. 2001a. Climate Change 2001: Synthesis Report.Summary for Policymakers. Available at www.ipcc.org; Ceres. 2005a. Availabilityand Affordability of Insurance under Climate Change: A Growing Challenge for theU.S., June, www.ceres.org.
Stern and some scientists suggest that, not only are human-inducedchanges taking place in our climate, but that the IPPC used language thatwas too cautious. They argue that today’s computer climate models failto include recent knowledge on the increased risk of dramatic climatechange and feedback loops, thus understating the magnitude of warm-ing dramatically, and producing forecasts of future warming that are fartoo low (Economist 2006e; Stern 2006). Recent temperature and weatherdevelopments support their more dire predictions.
The Political Context of Climate Change
At the political level, diverse countries of the world met in 1992 under theauspices of the United Nations at the ‘‘Earth Summit’’ in Rio de Janiero,and agreed on the Framework Convention on Climate Change (UNFCCC).

Introduction 9
Natural forcing only
Te
mp
era
ture
an
om
ali
es
in
°C
1.0
0.5
0.0
1850 1900 1950 2000
−0.5
−1.0
1.0
0.5
0.0
−0.5
−1.0
Model results
Observations
Natural + anthropogenic forcing
1850 1900 1950 2000
1.0
0.5
0.0
−0.5
−1.0
1.0
0.5
0.0
−0.5
−1.0
Model results
Observations
Te
mp
era
ture
an
om
ali
es
in
°C
FIGURE 1.3 Simulations of the earth’s temperature variationsSource: IPCC 2001, Third Assessment Review Summary for Policymakers, Inter-governmental Panel on Climate Change Third Assessment Report (TAR), WorkingGroup (WG) 1, at www.ipcc.org.
The Convention was signed in 1992 and entered into force in 1994. Thisagreement has nearly universal membership, with 189 countries supportingthe voluntary commitments to address climate change, including the UnitedStates and all major GHG-emitting countries. The key objectives of theConvention are to reduce emissions from economic activity and to lessen

10 CARBON FINANCE
the impact of unavoidable climatic changes. Strategies under the UNFCCCare known as mitigation policies and adaptation measures. Mitigationpolicies have drawn the most attention, because they affect the globaleconomy and often feature unfamiliar regulations. Adaptation, however, isdirected at vulnerable activities, and may only represent an extension ofcurrent measures (Allianz and WWF 2005).
The Convention commitments, however, were voluntary and did littleto establish firm governmental targets. Recognizing this shortcoming as wellas the firmer scientific evidence on human contributions to global warming,the third UNFCCC Conference of the Parties (COP3) met in Kyoto in 1997and produced the Kyoto Protocol, under which 39 of the industrialized‘‘Annex 1’’ countries4 agreed to mandatory reductions of GHG emissions,totaling 5.2 percent, from 1990 levels by the end of the First CommitmentPeriod of 2008 to 2012.
5 Other countries, such as India and China, havejoined the Protocol, but without binding targets (Baumert, Herzog, andPershing 2005).
In order to be legally binding, the Protocol required ratification byat least 55 countries that account for 55 percent of developed countriesemissions. Although the United States and Australia opted out of theagreement, Russia’s decision to ratify the Protocol finally brought it intoforce in February 2005. Pledges of targets are scheduled to come into effectin the First Commitment Period of 2008 to 2012. Negotiations for thesecond period started in late 2005 at COP11/MOP16 in Montreal, Canada.
The Protocol does not prescribe how emission reductions should bemet. It does, however, propose three flexible mechanisms that are designedto help Annex 1 countries meet their emission reduction obligations: namelyemissions trading schemes (ETS), Joint Implementation (JI), and the CleanDevelopment Mechanism (CDM).
Emissions trading scheme (ETS) uses a ‘‘cap-and-trade’’ mechanism,similar to the U.S. Acid Rain Program that was designed to control SO2 andNOx from fossil fuel–burning power plants (see Chapter 6). Under the ETS,emissions caps are set for each country, followed by GHG caps for variouscompanies within those different jurisdictions. Although the protocol is anagreement between national governments, industry is expected to deliverthe majority of emissions savings.
Within an international ETS, the ‘‘cap’’ mechanism ensures that envi-ronmental objectives will be met. The ‘‘trade’’ implies that the objective isachieved at the lowest possible cost since entities that have been assignedcaps may trade credits for any emission reductions they achieve beyondtheir targeted goals. An ETS allows developed countries to trade part oftheir emissions budget, known as assigned amount units (AAUs).

Introduction 11
Joint Implementation (JI) mechanisms are project-based instruments,whereby an Annex 1 country can invest in a project in another industrializednation or a country with economies in transition, and receive emissionreduction units (ERUs) for its achievement in emissions reductions.
The Clean Development Mechanism (CDM) allows industrialized coun-tries to invest in a project in a developing country and obtains CertifiedEmissions Reductions credits (CERs) for having reduced emissions and pro-moted sustainability. CDM projects are intended to be, inter alia, a vehiclefor investment and technology transfer into developing countries.
CORPORATE CLIMATE RISK
The future of a carbon-constrained society presents a significant challengefor industries and investors alike. Companies will be exposed to differentlevels of climate risk, depending on the sector and geographic location oftheir operations. Investors must, then, be aware of the competitive dynamicsthat are being created by varying climate policies and physical manifestationsof climate change.
There are three ways that climate change can have an impact oninstitutions, each of which carries its own economic implications andexposure to carbon finance (see Figure 1.4). Two of these, regulatory andphysical risks, affect all companies within a sector, while business risksapply to decisions made at the company level.
Regulatory Risk
Within the discipline of carbon finance, regulatory risk is viewed in termsof a corporation’s record of compliance with respect to any carbon policiesthat are likely to have a material effect on its financial performance. Theeffect is greatest on GHG-intensive sectors, such as utilities, and dependsvery much on the stringency of GHG policies. GHG regulations have vary-ing competitive implications for corporations in different countries. Theymust be considered in analysts’ assessments of their effects on companies’earnings, profitability, or return on capital invested. For any company, itscarbon exposure can be found in three levels of the value chain:
1. Emissions from the company’s own operations.2. Indirect emissions from the company’s supply chain, especially energy.3. Emissions linked to the use of a company’s goods and services.

12 CARBON FINANCE
Industry-specific Risk
Global Risk
REGULATORY PHYSICAL
Company-specific Risk Reputation Litigation Competitiveness
Carbon Products and Services
RECs Carbon Credits Weather hedges
Markets Banking InsuranceAsset
Management
CLIMATE CHANGE • Mitigation • Adaptation
FIGURE 1.4 Climate change, industry, and the financial markets
A number of companies have taken the lead in their response toclimate change, through a range of actions that are referred to as carbonmanagement. Simply put, carbon management refers to a company’s:
� Evaluation of emissions across the value chain.� Understanding of the risks and opportunities associated with a carbon
constraint.� Establishment of priorities for action.

Introduction 13
� Communication of these results to its stakeholders, including the invest-ment community (Carbon Trust 2005a).
Climate policies will affect different sectors at different times and indifferent ways. The power sector is one of the most vulnerable to this typeof risk (see Chapter 3), and is the earliest of industries to feel the impactof limiting GHG emissions. Within this sector, a company’s generatingassets, installed technologies, fuel mix, and market position will shape theimpact it feels from carbon constraints. Some companies will be at greaterrisk, because they produce power from carbon-intensive coal, while othersgenerate power from cleaner sources, such as natural gas. Other emitters,such as transportation sector, may have either GHG emissions capped orbe subject to fuel efficiency standards, or possibly both (Chapter 3). Automanufacturers with models that are designed to meet these new climatepolicies, for example, are in a better competitive position than those whoare concentrating on larger, carbon-intensive products.
Physical Risks
Physical risks arise from the direct impacts of climate change, such asdroughts, floods, storms, and rising sea levels. Industries that are particu-larly exposed include agriculture, fisheries, forestry, health care, tourism,water, real estate, and insurance. Similar weather developments can alsohave negative consequences for carbon-regulated industries such as electricpower, oil, and gas producers (see Chapter 4). In addition to storm and flooddamage to property, climate change and variability can have a significantimpact on the wealth and well-being of different populations, depending ongeographic region and levels of vulnerability. Temperature-related effectson health include both reduced winter deaths because of milder weather,and increased heat stress deaths due to hotter summers. In addition, thespread of vector-borne diseases is associated with changes in temperatureand precipitation patterns (see Chapter 7).
Rising emissions and a disrupted climate are leading to a range ofimpacts, including more frequent heat waves, increased frequency andseverity of storms, flooding, wildfires, and droughts, as well as an extensionof the geographic range and season for vector-borne diseases. These changeshave already manifested themselves in terms of real economic losses:
� A recent study by the Association of British Insurers concludes that risingcarbon dioxide emissions could increase average annual losses fromthree major types of events—U.S. hurricanes, Japanese typhoons, andEuropean windstorms7 —by $27 billion a year, a two-thirds increase bythe 2080s (ABI 2005).

14 CARBON FINANCE
� U.K. claims for storm and flood damages from 1998 to 2003 doubledcompared with previous five years.
� In 2002, severe flooding across Europe caused $16 billion of directlosses.
� The 2003 heat wave that affected much of Europe is estimated to havecaused 50,000 premature deaths and an estimated economic loss of¤13.5 billion (Silver and Dlugolecki 2006).
� Insured losses due to Hurricane Katrina in 2005 are thought to be$45 billion, greater than the combined insured losses of the four hurri-canes that hit the southeastern United States in 2004 (see Table 7.1).
� Infectious diseases, such as malaria, are currently the world’s lead-ing cause of death, killing 17 million people each year and creatingsignificant economic hardship due to lost productivity (see Chapter 7).
Business Risks
At the corporate level, business risks include legal, reputational, and com-petitive concerns.
Legal risks arise when litigation is brought against companies thatcontribute to climate change.
� In 2004, eight states and New York City filed an unprecedented lawsuitagainst five American power companies, demanding that they reducetheir CO2 emissions.
� In 2006, the attorneys general of 12 states challenged the EnvironmentalProtection Agency (EPA) in the U.S. Supreme Court on its refusal toregulate greenhouse gases as pollutants (Carbon Finance 2006a).
� Some lawyers believe that such cases could follow the trajectoryof tobacco and asbestos litigation, saddling high-emitting companiesthat failed to act on GHGs, with potential massive claims for dam-age (Lambert 2004).
Reputational risks evolve as corporate response patterns to climatechange alter the perception of brand values by customers, staff, suppliers,and investors. Companies that are viewed in a negative light with respect tocarbon management in their policies, products, or processes risk a backlashfrom consumers and shareholders in environmentally sensitive markets.This is particularly evident in highly competitive sectors, such as the autoindustry, where brand loyalty is an important attribute of company value,and the airlines, where up to 50 percent of its brand value may be at riskas greenhouse regulations are being considered (Carbon Trust 2005a; Ceres2005b). (See Chapter 3.)

Introduction 15
Competitive risks can change depending on a company’s responsepattern to climate regulatory frameworks. Within this area, operationaland market risks are exposed as carbon constraints impinge on existingassets and capital expenditures, as well as on the changing dynamics forcompanies’ goods and services (Henderson Global Investors 2005a). Withinthe investment community, consideration of carbon profiles help analystsdetermine the effects that GHG constraints will have on a company’s currentassets, capital expenditures, and costs of inputs, thereby affecting investmentvaluations (Wellington and Sauer 2005).
CLIMATE POLICIES
Strategies under the UNFCCC, which are designed to reduce emissionsfrom economic activity, as well as to lessen the impact of unavoidableclimate change effects, are defined as mitigation and adaptation (Figure 1.5).Mitigation has the potential to affect the global economy, while adaptationis directed at particular populations and activities.
Mitigation Policies
Governments can improve all aspects of carbon finance in a tangible way by:
� Developing clear mitigation policies.� Encouraging the use of market mechanisms.� Creating an environment that promotes diverse energy sources.� Creating incentives for new and cleaner technologies.
A wide range of measures to mitigate the impacts of climate changeexists for policy makers depending on regulatory frameworks that havebeen established within different countries. These policies have the potentialto change the cost structure of some companies, while creating new marketsand product opportunities for others. To date, a number of climate policieshave either been instigated or considered within varying regulatory frame-works. Mitigation policies designed to reduce carbon emissions include:
A carbon tax, such as the Climate Change Levy in the United Kingdom,is designed to put a price on carbon, which increases the cost of fuels inproportion to their GHG content. This policy option creates an incentivefor consumers and companies to use less energy as well as using less carbon-intensive energy. The effect, which generates an economic incentive similarto a cap-and-trade structure, is further discussed with regard to the autoindustry in Chapter 3.

16 CARBON FINANCE
Impacts ExposureVulnerabilities
Climate ChangeHuman Activities
Policy Responses
• Improved building codes• Land-use planning• Flood Control • Investment in infrastructure (dykes, tidal flood defenses, rainwater sewage systems)• Early warning systems for floods, forest fires
Adaptation Planning
• Carbon trading programs• Product and process standards• Technology incentives and investments• Carbon taxes• Incentives for renewable fuels• Renewable portfolio standard programs
Mitigation
FIGURE 1.5 Mitigation and adaptation measures in climate policies
Product or Process GHG Standards are set by governments for certainindustrial processes and products in order to reduce GHG emissions. Aprime example of this policy tool is the standards that are being establishedby a number of countries, setting future limits on either fuel consumptionor emissions of CO2 from automobiles (see Chapter 3).
Technology Incentives have been created through a variety of regula-tions that are designed to provide incentives for the development of cleanertechnologies. The U.S. Energy Production Tax Credit represents this typeof policy, whereby producers of renewable energy gain a 1.8 cents/kWhtax benefit over the more polluting forms of energy production from fossilfuels (Union of Concerned Scientists 2005; Allianz AG and WWF 2005).Other incentives, such as the solar power subsidy in California, will providerebates to consumers and businesses that install solar panels, which convertsolar energy to electricity without causing pollution (Globe and Mail 2006).
Renewable Portfolio Standards require a specified percentage of autility’s overall generating capacity or energy sales to be derived fromrenewable sources, for example, solar, wind, tidal, or biomass. States suchas Texas, New Jersey, and Maine in the United States have establishedvarious standards for utilities, which differ in energy source, percentages,and timing (www.energy.gov).

Introduction 17
A carbon trading program, such as the European Union EmissionsTrading Scheme (EU ETS), is structured as a cap-and-trade system, whereincaps are set on emissions, and tradable permits are allocated to key industrialsectors: energy generation, ferrous metals, minerals, as well as pulp andpaper. If emissions from companies within these industries exceed theirallocations, operators must either purchase permits or pay a fine. If emissionsare below the cap, however, surplus permits can be sold.
Several carbon markets already exist, with the EU ETS being largestand most advanced. The European Union (EU-15) as a whole agreed toreduce its CO2 emissions by 8 percent under Kyoto. This agreement isa burden-sharing one, in which some countries (Spain, Greece, Portugal)are allowed to increase emissions, while others (France, Germany) haveagreed to reduce theirs. In a bid to reduce emissions, the EU launchedits Emission Trading Scheme, which came into effect in January 2005. Itis the largest multicountry, multisector GHG emissions trading scheme inthe world, covering over 11,000 installations in 25 countries. Trading inthese markets is already active, involving companies in carbon-intensivesectors, banks, trading houses, and specialized funds, such as the WorldBank Prototype Carbon Fund and the European Carbon Fund. The EU ETSoffers an opportunity to gain insight into the design and implementation ofa large and complex market-based program, and to assess its implicationsfor corporate competitiveness, technological development, and efficiencyopportunities. (See Chapter 6 for an analysis of the EU ETS.)
Emission trading schemes have created a new market in carbon dioxideallowances that are valued around ¤35 billion per year, predicted to rise toover ¤50 billion by the end of the decade (CEC 2005). To date, however,the true price of carbon has been hard to establish due to a number offactors (see Box 1.1).
As well as reducing CO2, climate policies have competitive and financialimplications at all levels of the value chain, from energy inputs, throughthe production process to product use and disposal. In some sectors, con-sumption of goods and services create more emissions than those associatedwith the carbon intensity9 of the production phase. A prime example can befound in the auto industry, where the majority of an automobile’s life cyclecarbon emissions come from its use, rather than from the production of rawmaterials for manufacturing (e.g., plastic, steel) and the vehicle assemblage(Figure 3.4). Policies that target either increased fuel efficiency or decreasedgasoline consumption will alter demand patterns and create incentives fornew product within the auto industry.
All of these policies have a linkage to the broader field of carbon finance.In the energy field, renewable portfolio standards are stimulating newmarkets in areas such as renewable resources. At the same time, the EU ETS

18 CARBON FINANCE
BOX 1.1 THE DIFFICULTY OF PUTTING A
PRICE ON CARBON
In creating a market for carbon credits, the EU ETS has also establishedthe basis for the price of carbon, both within Europe and beyond. Eachallowance that is being traded allows the holder to emit one metricton of CO2 (tCO2). At the launch of the EU ETS in January 2005, theprice of allowances was less than ¤7 ($9), but by July of that year theyhit a peak of nearly ¤30. In early 2006, prices hovered around ¤23($30) before plunging to ¤8. (The reasons for the sudden decrease areexamined in Chapter 6.)
Large power generators provide the major demand for allowances,with the most critical driver in that industry being the relationshipbetween the cost of coal and gas. Analysts partake in a debate overthe CO2 emissions price level that would encourage the switch fromcoal-fired generation to generation from gas-fired combined cycle gasturbines. Some say that an allowance at ¤25 would trigger the change,while Citigroup predicts a price of about ¤60/tCO2 would be requiredto make coal generation less attractive than gas.
Extreme weather patterns and emissions prices are also closelylinked, as increased heating requirements during a cold snap precipi-tates as increase in coal-fired electricity generation.
Disparities between prices in the EU ETS, which are close to $25/t,and those of CDM credits that range between $3.60 and $7.20 hasalso caused a certain amount of confusion in the marketplace (Nicholls2005a). A further difference exists between the EU ETS and pricesquoted in the marketplace on the Chicago Climate Exchange (CCX),where prices are quoted in the $1.70 range. Some analysts predict thatthe price of carbon will trend down, as emissions reductions come onthe market from suppliers of allowances outside the power sector, forinstance, from companies in eastern Europe.
Activities associated with the second phase of the ETS(2008–2012) also contribute to the difficulty of putting a price oncarbon. In some cases, companies are back-loading the required reduc-tions to the second part of the 2008–2012 period. Others suggest that,given the level of carbon constraint required by the ETS in the secondphase, some of the demand will have to be met by JI and CDMprojects, as well as allowances from Russia and Ukraine. The EU ETSmay even consider the inclusion of forestry projects into the EU Emis-sion Trading Scheme. In addition, unused allowances in the National

Introduction 19
Allocation Plans (NAPs) of new entrant reserves for the EU maybecome available for use, since few new power stations that wouldqualify for the allowances are being built.Sources: Bettelheim 2005/2006; Carbon Finance 2005–2006; Nicholls2005a, 2006a.
has also created opportunities in the financial services sector, with increaseddemands for weather derivatives and private equity as well as corporatefinancial advisory services in light of the new GHG asset/liability class.Further public and private finance has been mobilized by the World Bankas its carbon investment funds channel close to $1 billion into emissionsreduction projects across the developing world. In doing so, the Bank hasbecome the world’s largest buyer of credits.
Adaptation Measures
While wealthier nations have economic resources to offset the cost of adap-tation and are therefore better able to adapt to the impacts of climate change,developing countries will be affected the most, since they are the most vul-nerable and have the least capacity to respond to negative effects. Extremeweather events, for example, can have enormously widely varying effectson different populations, depending on their capacity to cope. Cyclones inBangladesh in 1970 and 1991 are estimated to have caused 300,000 and139,000 deaths, respectively, whereas Hurricane Andrew, which struck theUnited States in 1992, caused 55 deaths, albeit also causing $30 billionin damages. Climate-related adaptation strategies, then, must also be con-sidered in relation to broader regional characteristics—population growth,poverty, sanitation, health care—that also influence a population’s vulner-ability and ability to adapt (WHO 2003).
To date, few climate change adaptation programs have been reportedin OECD (Organisation for Economic Co-operation and Development)countries. One example of a systematic approach to adaptation, however,is the U.K. Climate Impact Programme (UKCIP), which was set up bystakeholders in 1997 and funded by the Department for Environment,Food, and Rural Affairs (DEFRA). UKCIP is designed to help differentgroups assess their risks of climate change and prepare for its impacts(www.ukcip.org.uk/).
In many countries the impacts of climate change have been reducedthrough adaptive programs such as improved building codes for the design

20 CARBON FINANCE
and construction of new buildings. Land-use and urban planning programsin vulnerable areas, along with infrastructure investments in dikes, tidalflood defenses, and rainwater sewers, have also helped moderate the harmof some impacts attributed to climate change (Box 1.2). Early-warningsystems for floods and forest fires can also be considered as other importantaspects of adaptation.
A conference hosted by Yale University has suggested a creative functionfor the process of adaptation planning. Delegates at the conference werecharged with analyzing the gap that exists between climate science and actionin the United States, as well as examining the questionable status and lack ofappeal that climate change holds within its general population. To improve
BOX 1.2 WINNIPEG, MANITOBA’S FLOOD
ADAPTATION MEASURES
In 1950, the Canadian city of Winnipeg, Manitoba, experienced oneof the largest spring floods in the province’s history. In response to thisevent, a floodway was constructed that diverts excessive spring runoffwater from the swollen Red River around the city of Winnipeg. Thefloodway has been in operation since 1968 and has been used on over20 occasions since that time. It is estimated to have saved the provincemore than $8 billion in flood damage.
In 1997, the province experienced its third worst flood on record,which stretched the capabilities of the floodway to its limit. Theevent forced 28,000 Manitobans from their homes and caused an esti-mated $400 million in damage. In the decade following this ‘‘Floodof the Century,’’ the provincial and federal governments implementeda number of measures to protect those outside the massive flood-way, including building extra dikes, elevating roads, and improvingflood forecasting. Most recently, the two levels of government haveannounced plans to expand the existing floodway system.
These adaptation policies have been proven effective for thisCanadian province. In 2006, spring water levels rose again to thelevels experienced in 1997, but the region was relatively unscathed,due to the floodway’s diverting some of the flow safely around the citywhile rings of dikes and elevated roads have provided protection inthe rural areas.Sources: MacAfee 2006; www.floodwayauthority.mb.ca.

Introduction 21
the public’s perception, the delegates suggested that citizens be engaged inthe process of adaptation planning, thereby first raising their awarenessand understanding of the effects of climate change and, second, creatingan opportunity to develop a dialogue on mitigation efforts and emissionsreductions. Such a move could shift climate change from the abstract to aconcrete issue, and transfer the comparison of the economic costs of climatechange regulation from the status quo to the cost of inaction. Thus, thedelegates supported, qualified by some reservations, a recommendation thatcalled for increased emphasis on adaptation and preparedness that wouldserve as an introduction to discussions of mitigation (Abbasi 2006).
From a public health perspective, improved infrastructure, such as san-itation facilities and waste water treatment systems enhance a population’sadaptive capacity. Also, government programs that either enforce adequatecoverage or provide financial aid help revive an area that has experienceddevastating effects of climate change (see Chapter 3) (CEC 2005).
ROLE OF THE FINANCIAL SERVICES SECTOR
Climate change has become an important factor for the financial sector inits banking, insurance, and investment activities. Challenges for the sectorwill appear from the different directions that have been identified earlier inthis chapter: regulations that are designed to limit GHG emissions, physicalchanges that take place due to climate change impacts, legal challenges to bebrought on by inadequate governance, reputational fallout for companiesdue to corporate positions on climate change, and competitive pressures inthe marketplace as production costs shift and products are substituted inresponse to the new reality of a carbon-constrained world. Indeed, reportshave been published warning of the potential exposures in all segments ofthe sector (see, for example, ACF 2006; Lloyd’s 2006).
Companies in the financial services sector have a dual responsibility: thefirst is to prepare themselves for the negative effects that climate change mayhave on both their clients and their own business. The second role of thefinancial sector is to provide products and services that will help mitigatethe economic risks of a carbon-constrained society. Roles and levels ofresponsibility that exist within different groups of the financial servicessector include:
� Trustees of institutional investors investigating the linkages betweenclimate change and their fiduciary duty.
� Institutional investors actively engaging actively within the climatepolicy process.

TABLE 1.3 Risks and Opportunities of Climate Change within the FinancialServices Sector
Class of Business Risks Opportunities
BankingRetail banking Direct losses due to
physical risks: e.g.,precipitation, drought,
Offering new climatemitigation products
Policy changes, e.g.,termination of subsidiesfor renewable energy
Microfinance forclimate-friendly activities
In creased credit risks byaffected clients
Advisory service for smallrenewable energy projectloans
Corporate bankingand projectfinancing
Higher energy costs forconsumers
Clean-tech investments
Price volatility in carbonmarkets
Reputational risk due toinvestments incontroversial energyprojects
InsuranceProperty, casualty, life,
underwritingsLosses from: More demand for alternative
risk transferWeather and extremeevents New insurance products
Business disruptioncoverage
Counterparty credit forcarbon trading
Impacts on human health Carbon neutral insurancecoverage
Carbon-delivery guaranteefor CDMs
Insurance for emissionstrading
Carbon as an insurable assetInvestmentsInvestment banking
and assetmanagement
Investments in immaturetechnologies
Investing in climatechange–related products
Additional costs due tochange in weatherpatterns, e.g., in theutilities sector
Offering weather derivatives
Loss of property assets
Establish Carbon FundsTrading Services in the EUETS
Green technology
Source: Derived from Allianz AG and WWF International. 2005. Climate Change &the Financial Sector: An Agenda for Action. Gland: Allianz AG Munich and WWFInternational.
22

Introduction 23
BOX 1.3 SWISS RE PROVIDES INSURANCE
FOR CDM
In mid-2006, European International Insurance, a subsidiary of theglobal reinsurer Swiss Re, developed an insurance product designedto assist RNK Capital, a U.S.-based private equity fund manager,to handle its Kyoto-related risk as it invests in CDM projects. Theinsurance policy covers some risks associated with the purchase ofcarbon credits. These include the failure of, or the delay in, projectregistration or certification/issuance of CERs related to the CDMprocess. The policy does not, however, cover political or country risk,nor is it triggered by any error in the Designated Operational Entityor delivery risk related to problems with the International TransactionLog.
If RNK faces a carbon credit shortfall due to CER certification orissuance problems, the policy will pay out for the expected future flowsof CERs that RNK had expected to receive. The insurance product hasthe flexibility to pay out in kind, in cash, or a combination of the two.Source: Carbon Finance 2006a, p. 3.
� Investment consultants integrate climate change into advice they provideinstitutional investors, as well as their evaluation of asset managers.
� Fund managers evaluating how climate change affects investment deci-sion making (Mercer Investment Consulting 2005).
These challenges present new risks and opportunities for financialservice companies. The sector will have to adapt internal policies, processes,products, and services, in order to meet the challenges that its clients faceand to protect its own viability. At the same time, climate change will openup new opportunities for the sector. Table 1.3 outlines some of the risksand opportunities that exist for the banking, insurance, and investmentmanagement industries within the financial services sector, while Box 1.3provides an example of a new product and approach taken by Swiss Re.
CONCLUSION
Climate change has become a salient issue, seen constantly in the headlinesand discussed at the highest political level as evidenced by the 2005 G8

24 CARBON FINANCE
summit. It poses a major risk to the global economy, affecting the wealth ofsocieties, the availability of resources, the price of energy, and the value ofcompanies.
Carbon risk management is expected to increasingly affect shareholdervalue, due to higher energy prices, restrictive GHG targets, and increasedlosses due to severe and adverse weather events. In this way, global warminghas become the environmental issue that has the most potential to effect theprofitability—and in extreme cases the actual existence—of a number ofcompanies. We examine the consequences of regulatory changes, physicalimpacts, and the effect of putting a price on carbon. We also explore newregions of endeavor that have developed due to the evolution of carbonfinance, such as the interrelationship between weather and energy markets,the creation of new markets in carbon currencies, and the reinterpretationof fiduciary duties of institutional investors, seen in the light of climate risk.
We believe that climate change will become even more visible overthe next five years, as extreme weather events increase and press coverageintensifies over the political and environmental feasibility of nuclear power,as well as any negotiations regarding post-2012 international emissionsregulations. In this context, climate change could become a mainstreamconsumer issue by 2010.
As this chapter has illustrated, evidence of climate change is not hardto find. Average surface temperatures have been rising, against a backdropof rapidly increasing atmospheric concentrations of CO2. Following thisintroduction to the Kyoto Protocol and the policies and markets thatshape a carbon-constrained society, Chapter 2 takes a close look at theentire energy chain and its relationship to the value chain. It then examinesthe different sources of energy, its uses, its users, and the key issues affectingthis sector as it responds to increasing pressure from government policies.The next two chapters introduce the impacts of the two drivers found at thesector level in Figure 1.4: namely, the implications of government actionsand physical impacts on different sectors within the global economy.
Chapter 5 examines the fiduciary duty of institutional investors as theyassess the financial effects of climate change within the investment commu-nity. Chapter 6 focuses on the flexible mechanisms designed by the KyotoProtocol and the experience of the EU Emissions Trading Scheme. Chapter 7takes a closer look at some health issues that arise from changes in climaticconditions, as well as the physical impacts of climatic changes that are caus-ing both economic and social concerns in various geographical locations.This is followed by an examination of some products for Alternative RiskTransfer that are designed to cover environmental risks associated withclimate change.

Introduction 25
Martin Whittaker has contributed Chapter 9, which gives shape tothe carbon finance marketplace, and explains the speed with which it hasdeveloped and the complexity of its growth. The concluding chapter, entitled‘‘Carbon Finance: Present Status and Future Prospects,’’ outlines concernsregarding increased levels of climate change, the opportunities for playersand products to alleviate some of the potential impacts, and the role thatcarbon finance plays in this global phenomenon.


CHAPTER 2The Energy Chain
INTRODUCTION
The energy chain is the sequential use of energy in the production ofgoods and services. Thus, it parallels the value chain, which describes
sequential value-adding activities—from the production of raw materials,the provision of energy for electricity and steam, the manufacture of goods,their lifetime use, and their final disposition.
An understanding of the nature of the energy chain includes knowledgeof the sources of energy by type, the uses of energy by sector, and theusers of energy by function. The energy chain differs markedly from oneeconomy to another, and these differences affect the capacity of an economyto respond positively to the challenge of a carbon-constrained future.
Until 250 years ago the economy was powered by somatic energy—thebodily energy of people and their domesticated animals—and the burningof biomass, mostly wood, peat, and organic waste material. A little coal wasused, but it was expensive to move on the rudimentary transport systemsof the day, and coal mines were very dangerous and prone to flooding. TheIndustrial Revolution quickly changed this enduring picture. The harnessingof steam power pumped floodwaters simultaneously out of the minesand provided ships and railways for cheap bulk transportation—thus, themodern energy transition was launched. Modernizing economies movedfrom burning biomass to burning coal; then to petroleum and natural gas;and, in the 1950s, to nuclear power. Large-scale hydroelectric power wasalso developed in this transition.
In the 1950s, scientists rediscovered an unfortunate side effect of burningfossil fuels, which was first noted in 1826 by Joseph Fourier, and calculatedin 1896 by Svente Arhenius (see Chapter 1). Because greenhouses gases(GHGs) stay in the atmosphere for many years before they are absorbedon land and in the oceans, our emissions have the potential to change theclimate by warming the lower atmosphere. Since 1957 direct monitoring of
27

28 CARBON FINANCE
the accumulation of carbon dioxide began to show this effect very clearly.In the next 30 years, the love affair with nuclear energy began to wane asthe challenges of waste management, operational safety, and the costs ofdecommissioning refused to go away. So where was the energy transitiongoing now?
The immediate answer is that there is a lot of inertia in the system.This means that giant emerging economies, such as China, India, Indone-sia, and Brazil, are still following the West’s energy transition into deepdependence on fossil fuels, nuclear energy, and large-scale hydroelectricpower. In China’s major cities, as recently as 10 years ago, transportationwas provided by ‘‘rivers of bicycles’’ that seemed to swarm effortlesslythrough the streets. Now, in all of China’s modernizing cities, bicycles arebeing banned from major thoroughfares because they get in the way offossil fuel–driven transport. While some countries in the West are pullingback—or at least questioning—the modern energy transition, the neweconomies are embracing it as they adopt Western technology and lifestyle.
There are many and varied users, uses, and sources of energy. Table 2.1presents an approximate picture of their relative importance in the contextof carbon finance.
So, how is this energy related to the value chain in industry, and whatcan be done to control the emissions that are changing our climate? Thenext section draws a linkage between energy use and users’ value chain,and is followed by a discussion of policy approaches to reduce carbonemissions. Then we examine the users and uses of energy, along with itstraditional sources. We also recognize that alternatives to fossil fuels needto be taken into account, including conservation, renewable sources, andnuclear power. The implications of these imperatives are considered withinthis chapter.
THE ENERGY CHAIN AND THE VALUE CHAIN
Although six GHGs are regulated under the Kyoto Protocol, the predomi-nance of carbon dioxide in emissions means that the battle to control therate of climate change will be won or lost on the speed with which we canreduce this pollutant. As the Intergovernmental Panel on Climate Change(IPCC) stated in its ‘‘Climate Change 2001: Synthesis Report’’:
Emissions of CO2 due to fossil fuel burning are virtually certain tobe the dominant influence on the trend of atmospheric CO2 duringthe 21st century. (IPCC 2001a, p. 27)

TABLE 2.1 Energy Sources, Uses, and Users and Their Emissions
Energy Sources Energy Uses Energy Users Gases Emitted % Total GHG
Fossil fuels Transportation Cars, air, rail transport CO2 13.5Coal, Oil,Gas Electricity Buildings (commercial, residential) CO2 33.6
Heat GovernmentsOther fuel combustion Industry
Nuclear Industry and industrialprocesses
Iron, steel, cement, chemicals,aluminum/nonferrous metals, pulp andpaper, printing, food, tobacco
CO2
CH4
HFCs
13.8
Hydroelectric Fugitive emissions Coal mining CH4 3.8Oil and gas (extraction, refining, processing)
Renewable Land use change Deforestation, afforestation, reforestation, CO2 18.2Wind harvest/managementSolarTidal Agriculture Agricultural soil CH4 13.5Wave Livestock and manure N2OGeothermal Rice cultivationBiomass Waste Landfill CH4 3.6Biofuels Waste water
Other waste
Source: Derived from Baumert, K., T. Herzog, and J. Pershing. 2005. Navigating the Numbers: Greenhouse Gas Data andInternational Climate Policy. World Resource Institute, available at www.wri.org, Figure 1.3, pp. 4–5.
29

30 CARBON FINANCE
Industrial processes and the combustion of fossil fuels are responsible for80 percent of carbon dioxide emissions, with most of the rest coming fromthe cutting and burning of forests (Baumert, Herzog, and Pershing 2005).Hence, an understanding of the energy chain—especially the extraction anduse of fossil fuels and the disposal of related waste products—is essentialto the development of a climate change strategy by governments, corpora-tions, nongovernmental organizations, local governments, households, andindividuals.
The energy chain can be matched to a value chain, as value is addedprogressively from material extraction, assembly, and processing to productdistribution, use, and disposal (Figure 2.1). Thus, every product has acertain amount of energy used, or embodied, in it before it is deliveredfor use. Similarly, disposal of the product at its end of life will require theexpenditure of energy. There is a dilemma then, in a carbon-constrainedworld, as to where in the value chain the responsibility lies for monitoringenergy use and the reduction of GHGs and how these choices will governthe evolution of carbon finance.
GHG Emissions
CO2, CH4, N2O, HFCs, PFCs, SF6
ProductionProduct
distributionProduct
useDisposal
Inputs
• Energy
(Upstream) (Downstream)
• Raw materials
FIGURE 2.1 Overview of emissions across the value chain

The Energy Chain 31
In The Greenhouse Gas Protocol: A Corporate Accounting and Report-ing Standard (WBCSD and WRI 2004), the authors draw a distinctionbetween the ‘‘direct emissions’’ for which an entity is responsible, and those‘‘indirect emissions’’ upstream and downstream in the value chain, for whichit may not be responsible (WBCSD and WRI). Figure 2.1 summarizes in aschematic way how the emissions are related to the value chain.
More specifically, the authors of The Greenhouse Gas Protocol identifythree scopes or sets of emissions that exist and recommend that companiesreport on at least the first two (see Table 2.2). Whether a company decidesto monitor, and maybe reduce, Scope 3 emissions will depend on whetherthe company is prepared to go beyond basic compliance. In the oil and gassector, for example, it is recognized that the use of their products producesapproximately nine times the emissions associated with the manufacturingof the product.
The purpose of this exercise is to make sure that significant sourcesof greenhouse gas emissions are neither overlooked nor double counted.The Protocol considers both ownership (an equity stake) and operationalcontrol perspectives to determine what emissions fall under which ‘‘scope’’for any particular company. The emissions targeted for management, then,
TABLE 2.2 Scoping of Direct and Indirect CO2 Emission Sources
SCOPE 1Direct greenhouse gas emissions
Production of electricity, heat, or steamPhysical or chemical processingTransportation of materials, products, waste, and employeesFugitive emissions
SCOPE 2Greenhouse gas emissions from imports of electricity, heat, or steam
SCOPE 3Other indirect greenhouse gas emissions
These ‘‘are a consequence of the activities of the reporting company, but occur fromsources owned or controlled by another company’’ (WBCSD/WRI 2004, p. 25)
Employee business travelTransportation of products, materials, and wasteOutsourced activitiesEmissions from waste (e.g., methane from landfill)Emissions from final disposal of productsEmployees commuting to and from workProduction of imported materials
Source: WBCSD/WRI 2004, pp. 25–29.

32 CARBON FINANCE
will depend on which approach is adopted, for it is possible to have amajority stake in a company and yet not have operational control.
CARBON POLICIES
Policy Approaches
The first policy choice relates to where in the energy chain the policy impactshould be felt and what form should it take. Whatever part of the chain istargeted, the impacts will be felt throughout the chain, beginning with thedownstream arm. One factor governing the choice of target is the ease andcost with which the policy instrument can be applied. Political sensitivity isanother important factor.
Until 10 years ago, the policy choice would almost certainly have beencommand and control, wherein a regulation is passed and enforced. Nowwe have a much greater range of possibilities, many of them developed inthe field of environmental finance, whereby environmental objectives can beachieved using market forces. Under the old command-and-control model,industries would typically stall legislation as long as possible using thecollective strength of their trade associations. Under the new model, the firstcompany out of the gate may enjoy a substantial ‘‘first mover’’ advantage.In the best of circumstances, the market might achieve an environmentalobjective more quickly and at lower cost by harnessing the efficienciesbrought on by competition.
When the environmental objective is a low-carbon future, we examinethe energy chain to determine the point of impact and the approach adopted.Several complementary measures might be adopted, affecting both produc-ers and consumers simultaneously. In targeting consumers, for example,an approach might adopt ‘‘market transformation’’ as the preferred mode,relying on labeling and efficiency standards to change consumer prefer-ences (Fawcett, Hurst, and Boardman 2002; Boardman et al. 2005). Theidea of ‘‘personal carbon credits’’ is conceptually appealing, with eachconsumer having his or her carbon emissions capped and then making alldecisions within this constraint. However, this would be complicated toadminister and politically unpopular.
In the case of the European Union Emissions Trading Scheme (EU ETS),however, the decision was taken to target power producers and energy-intensive manufacturers. With a cap-and-trade system on the major energy-producing and energy-consuming manufacturers, the aim is to work onreductions across 40 percent of the current GHG emissions in the EuropeanUnion. Simultaneous measures, such as product efficiency measures, willalso push producers toward a lower-carbon future.

The Energy Chain 33
There have been some criticisms to the effect that some companies havebeen made to shoulder the burden that should be at least partly carriedby consumers, other sectors of the economy, and various institutions,including governments and universities. In practice, the rest of the systemwill eventually respond to the emission reduction targets imposed on heavyindustry. Indeed, some of these institutions (including some universities) fallwithin the EU definition of a major power producer, which is describedas any entity that operates a facility with a capacity in excess of 20MW.Furthermore, the price impact will be passed on down the chain. Indeed,there is already a dispute in Germany between power producers and majorindustrial users about energy price increases associated with the EU ETS.
Similarly, any entity that is placed under a carbon cap will look to itsupstream suppliers to reduce the carbon burden. In this case, lower carbonfuels will enjoy stronger demand than higher carbon alternatives. We arealready seeing this happen.
The Broader Policy Context
The threat of climate change is not the only reason that modern societyshould embrace a low-carbon future. For several decades, oil geologistshave been predicting a peak in oil and gas production as newly discoveredsupplies have been falling behind the growing demand. Production fromthe continental United States has been declining since the 1960s; NorthSea oil is now following suit. As outlined in Chapter 3, new supplies arebeing developed in less dependable places such as the former Soviet Union,the Middle East, and Africa. Present reserves/production ratios suggest thatcurrent usage indicates that oil will be exhausted in 40 years, and gas in60 years, compared with 200 years for coal (Boyle, Everett, and Rammage2003, p. 11).
Since public enthusiasm for nuclear power seems to have waned, it isnot at all clear where the solution lies. It is a little too soon to believethat ‘‘clean coal,’’ or ‘‘carbon capture and storage’’ will fill the gap. (For adiscussion of these technologies, see Chapter 3.) Thus, a low-carbon futureis driven by powerful forces other than climate change. Even if the fossil-fueleconomy could be extended by building more gas pipelines and tanker fleetsfor liquefied natural gas, security and price would remain problematic, aswas demonstrated by the sudden concern over Russian gas reaching westernEurope as a side effect of Russia’s dispute over gas price with Ukraine in thewinter of 2005–2006.
National and Local Self-Sufficiency
From time to time, the issue of national and local self-sufficiency resurfaces,usually after a bout of political instability or a technological failure, as with

34 CARBON FINANCE
the blackouts in California in the summer of 2002, in North America inthe summer of 2003, and in western Europe in the winter of 2003–2004.Clearly, there are advantages in drawing power from a national (andinternational) grid. However, at a time when some countries have takenon national carbon reduction targets, it might be useful to focus on energyself-sufficiency at the national level. Similarly, if regions within the nationalbody are asked to accept more than their per-capita share of a nationalreduction, it might be useful if planners could identify some local energyadvantage, in terms of either reliability or price.
IMPACTS OF DIFFERENT USERS AND USES
ON CLIMATE CHANGE
Users: Business, Households, and Government
Because all users and uses of energy are connected through the energy andvalue chains, the impact on one component will be passed on to the others.The effect may be amplified or dampened depending on the interplay withother factors. For example, as we have seen above, the drive toward alow-carbon future may be hastened by concerns about the availability andprice of energy supplies. Conversely, a slowdown in the economy wouldincrease the reluctance of governments to impose what might be perceivedas a financial burden on consumers (as voters).
One type of government that has taken a leadership role in reducingenergy use is the local authority, known variously as the municipality, thecity corporation, urban district, regional government, and so on. All gov-ernment entities use energy. However, the local authority has a compactand visible physical presence, and also has levers of power that enable it tochange patterns of energy consumption for both business and households.For example, it has some control over land use and transportation—majorfactors affecting energy use. It can also work with senior levels of gov-ernment, the private sector, and consumer associations to change energyuse at the local level, using bylaws to require energy efficiency. Althoughmunicipalities adopted an early lead on the Kyoto Protocol, their potentialto accelerate our journey toward a low-carbon future has been consistentlyneglected by higher levels of government.
Uses: Manufacturing, Transportation, Heating, Water,and Solid Waste
At the beginning of this chapter, we described the energy policy context asoperating within a matrix of users, uses, and sources. The users and uses

The Energy Chain 35
have been described very briefly as this is a well-known topic, based oneveryone’s daily experience. More space will be devoted to sources of energyin the following section because this is where policy options become moreobscure and the impacts of various policies become more difficult to predict.
In all emissions cap-and-trade systems to date, including sulfur dioxideand nitrogen oxides in the United States, it is industry that has been targeted.Specifically, major power producers and power users are the focus. Thisis because they are large and stationary—good qualities for a target. Bycomparison, household energy uses such as heating, water, and appliancesare small and highly dispersed. No government wants to be responsiblefor knocking on doors and checking meters. Yet household use of energyis—on a per-capita basis—steadily on the rise. In the end, we, as consumers,have to be brought into line with the vision of a low-carbon future. In themeantime, the large, stationary targets are the government’s first choice forcarbon reductions.
The transportation sector’s GHG emissions are rising rapidly, but trans-port is a highly mobile sector, and is also difficult to regulate, monitor, andreduce, compared to stationary sources such as power stations. Eventually,transportation, too, will have to be brought within the low-carbon net.Right now (2006) the EU is taking the first steps to bring the aviationindustry within the ETS, which should mean that current trends toward ahuge surge in global mass tourism will be slowed down. In the same way,the cheap international transportation of flowers and foodstuffs by air maybe curtailed and the era of the ‘‘international avocado’’ may be coming to anend, encouraging local farmers’ markets to prosper. Hebert Girardet (1992)coined the avocado phrase in the early 1990s in an attempt to make peopleaware that this development had taken place and that their shopping habitshad significant implications for global energy use. Some shops now labeltheir food produce with the country of origin so that shoppers at least havethe relevant information and can make an informed choice by developing abetter understanding of the sources of the products they consume.
Meanwhile, the single most important physical input to the quality oflife is water. We will not belabor the obvious. Under climate change thehydrological cycle will become intensified because there will be more energyin the system. According to the IPCC, this means that we should expectmore intense rainfall events, more droughts, and more uncertainty—whilethe historical record becomes less reliable as a predictor for future conditions(IPCC 2001, p. 5).
The treatment and delivery of potable water is a major user of energy. InNorth America it is common for 60 percent of a municipality’s energy use tobe consumed by water management, specifically for treatment and pumping.Currently, in North America, municipal water systems are gauged to meet

36 CARBON FINANCE
peak summer demand, which is about six times peak winter demand, duealmost entirely to excessive lawn watering. Few of these users are metered,and thus are subsidized through the tax system by lower-income, smallerwater users. Under a lower carbon economy, this should change.
Similarly, all substandard solid waste management situations carry ahigh—and avoidable—carbon cost. The fabrication of nonbiodegradableproducts, their transportation to a landfill, and the gases they emit—allthese activities impose an avoidable burden on the energy chain. Someintermediate gains have been made by capturing methane from landfills, butthe better goal is to reduce landfill material to zero.
SOURCES OF ENERGY: FOSSIL FUELS
Coal
Modern industrial society was built on coal, which still provides more thanone-fifth of the world’s primary energy consumption (Boyle, Everett, andRammage 2003). Although there are many good reasons to be coal free assoon as possible, apart from the climate change risk, we will not move awayfrom our coal legacy easily. Coal has been challenged before because of itsadverse environmental effects, notably for the particulates that could lead tosmog, and to sulfur dioxide and nitrogen oxides, which caused widespreadacidification. Both of these problems have been greatly reduced by treatingthe coal before combustion and by filtering by-products as they leavethe stack. Coal combustion also produces carbon dioxide, methane, andmercury—the first two being the major GHGs and hence drivers of globalwarming. Again, there is some improvement to be had from cleaning the coaland from abstracting the gases as they leave the plant. Today, there is muchresearch being conducted on ‘‘clean coal’’ and ‘‘carbon capture and storage’’(see Box 3.1 and Section 2.9.2). Coal mining can also be an exceedinglydangerous business for miners—estimates for annual fatalities run to thetens of thousands. One contributor to the toll is the explosion of methaneunderground, particularly in China, where mines are poorly ventilatedcompared with the West. Fortunately, the removal and combustion ofmethane from coal mines is included in the list of acceptable activities underthe Clean Development Mechanism. (See Chapter 6 for details.)
There are several different types of coal, some containing more sulfurthan others, some producing more carbon dioxide. The most carbon dioxideintensive is brown coal, or lignite, which is used extensively in Europe(Figure 2.2). Again, improvements to the combustion process can reducethe amount of carbon dioxide emitted. This is an issue at the level of the EUETS National Allocation Plan, for Greece, for example, where the largest

The Energy Chain 37
0
200
400
600
800
1000
1200
Hydro Nuclear Gas Oil Coal Lignite
Fuel Type
Em
issio
ns k
gC
O2/ M
Wh
FIGURE 2.2 Emission factors of various fuelsSource: PricewaterhouseCoopers and Enerpresse, 2002. Climate Change and thePower Industry, www.pwcglobal.com.
power station in the country burns lignite. It is also an issue for companiesincluded in the Carbon Disclosure Project, such as the German utilitiesconglomerate, RWE, which owns several power stations that burn lignite.
However, the future of coal in the primary energy mix has less to dowith new technology than with the future price of carbon. If concern aboutclimate change leads to tighter caps in the EU ETS and an early decision ona second Commitment Period of the Kyoto Protocol (post 2012), then theprice of carbon will rise and carbon intensity will become the factor thatdefines the future for an energy source. The bottom line is that an energyproducer can halve its carbon emissions by switching from coal to naturalgas. Natural gas is expected to become scarce (based on today’s knownreserves) in 60 years but that exceeds the lifetime of the installation. Energyproducers could soon be living in a world where the carbon cost of theirfuel exceeds the cost of procurement of the fuel. If that happens, the switchfrom coal to gas becomes unavoidable.
Oil
If the nineteenth-century Industrial Revolution was built on coal, then thetwentieth-century Industrial Revolution was built on oil. Oil has a much

38 CARBON FINANCE
higher calorific value (energy output/weight input) than coal, and it is muchmore flexible in use. The combustion of coal requires large boilers in powerstations, ships, and trains, but oil can be burned even in tiny internalcombustion engines, which revolutionized land-based transportation andmade aviation possible. (Think about designing an airplane reliant on coal.)The world has become so reliant on oil that we have, in the words of GeorgeW. Bush’s 2006 State of the Union address, ‘‘become addicted to it.’’
Even as we rush toward global warming, even as the oil price reachesrecord highs, even as Exxon and Shell make the largest profits in corporatehistory, we should stand back and ask: ‘‘Where are we going?,’’ as LordBrowne, CEO of BP, did at Stanford in 1997. The paradox is that whilea large component of the private sector is gearing up for climate change,a huge number of activities in the oil sector are proceeding with businessas usual. The most notable project in the business-as-usual corner is thedevelopment of the Alberta oil sands in Canada, while Venezuela also hassignificant oil sands awaiting development. These heavy oil deposits aretouted as a second Saudi Arabia, yet the energy input/output ratios makelittle sense from a climate change perspective, because they will require ahuge energy input to extract the oil; so both the production and use of theseresources will have very negative consequences for climate change. Thereis talk in Canadian government circles of exempting the oil sands from thecountry’s Kyoto commitment. So which sectors of the economy are goingto reduce their carbon output to make way for the oil sands?
Gas
Gas has become the fuel of choice in the late stages of the modern energytransition. Certainly, it produces less carbon per unit of energy output thanoil or coal; thus, in a carbon-strained world, it is cleaner. However, it doesemit carbon dioxide and supplies are limited, currently projected to last60 years. So, gas is the ‘‘transition fuel’’ to a lower-carbon future and isrecognized as such by BP (www.bpalternativeenergy.com); however, it issubject to flaring at the point of extraction and leakage during transmission.The pipeline network is under expansion worldwide, notably from Alaskato the Lower 48 states of the United States, and from Russia and CentralAsia to Europe. Gas can be liquefied (LNG) and transported by tanker andthe global LNG marine infrastructure is expanding rapidly (see Chapter 3).
Gas is indeed the ideal transition fuel from the historic reliance on coaland oil to a lower-carbon future. As such, its development is to be welcomedas countries and companies learn to live in a carbon-constrained world. Itwill provide a bit of a breathing space, but nothing more. Its use doesproduce carbon dioxide and its installations are very vulnerable to attack,as has been seen over the years in Nigeria. It is not a long-term solution.

The Energy Chain 39
SOURCES OF ENERGY: NUCLEAR ENERGY
While some people do not see a happy solution to the next stage of themodern energy transition, for others the answer is glaringly obvious—a newdawn for nuclear power. Nuclear power is widely touted as being carbonfree, although this is not strictly true. Energy is used in the construction ofnuclear power stations and so is a great deal of cement, both of which createcarbon emissions. Fossil fuels are used to provide transportation duringits operating phase and during the prolonged refurbishments that manyplants have undergone. More energy is used in the decommissioning phase.However, compared with fossil fuels, nuclear power is certainly ‘‘carbonlow.’’ Furthermore, the fuel supply is much more secure than oil and gas.Why, then, is the solution not entirely obvious, and why have very fewplants been built in the past 20 years—none in the industrialized worldwith the sole exception of Finland?
For critics of nuclear power, concerns fall into the four groups of issuesoutlined below:
1. Cost: Once a nuclear plant is operating the recurrent costs of productionare lower than most other sources. However, the capital costs are muchgreater, as is the time from design to completion. In addition to the costsof construction, many nuclear plants have undergone costly and time-consuming episodes of refurbishment. Only recently have we developedsome experience of the cost of decommissioning at Dounreay, on thenorth coast of Scotland. There remains the unknown cost of the disposalof spent fuel.
2. Disposal of spent fuel: The cost of spent fuel disposal is largely unknownbecause very little of it has been permanently disposed of; instead, itis kept in temporary storage on site. Because the spent fuel remainsradioactive for hundreds of thousands of years, the disposal problemis quite different from other waste materials. One U.K. governmentdocument even stated the waste could remain radioactive for millionsof years. Many ingenious solutions have been proposed, from insertionin salt domes to railways under the ocean. In the United States, there isa disposal facility at Yucca Mountain (Nevada), but it is not expected tocome into use until 2010, by which time the amount of nuclear waste inthe United States will require the entire capacity of the site. The federalgovernment has developed proposals to expand capacity; meanwhile,local senators and congressmen promise that the facility will never beused. Nobody wants this particular waste in their backyard.
3. Operational safety: Operational safety is widely perceived as a problemafter the accidents at Windscale/Sellafield (United Kingdom), Three Mile

40 CARBON FINANCE
Island (United States), and Chernobyl (former USSR). Proponents of
nuclear power are quick to point out that this is a very small number
of accidents and that the fatalities associated with them were even
smaller—zero, zero, and 30+—compared with oil rigs and coal mines.
(Critics point out that the long-term health effects, such as leukemia and
birth defects, will come in the thousands.) However, even in the short
term, from the risk perception perspective there is an all-important
difference between the public’s fear of fossil fuels and the fear of
nuclear power, because for fossil fuels the fatalities are usually among
the hapless workers in the sector, while for nuclear power it is potentially
the greater public that is at risk. The fact that risks from nuclear power
plants are excluded from homeowners’ insurance policies (or limited to
a token compensation) reinforces the view that there is potentially a
big risk from a mishap at a nuclear power plant. Other fears arise from
the suspected connection between radiation and leukemia; thus, even a
small leak might carry a serious health risk. Critics also point out that
the most recent installations have been built in low-income countries
where the safety culture, taken for granted in the West, is much weaker.
4. Global security: Then there are issues of global security. First, on a
national scale, there is the concern that peaceful use of nuclear power
could lead to the development of nuclear weapons. This is the issue
surrounding Iran and North Korea at this time. Next, terrorists might
obtain nuclear fuel to make their own bomb. Then there is the alarming
thought that terrorists might attack a nuclear power plant. Indeed, it
is this latter worry that moved the U.S. Congress to request a study
surrounding the safety and security of commercial spent nuclear fuel
that is stored in cooling pools at nuclear reactor sites. The National
Research Council’s study (NRC 2006) concluded that, not only were
nuclear power facilities desirable terrorist targets, but that such an attack
could start a fire in the power plant’s spent-fuel pool, where radioactive
waste is stored after its removal from a reactor. Power plants around
the world store used fuel rods in a swimming pool–like structure while
they ‘‘cool,’’ or lose their radioactive potency. Terrorists might drain
the water from the pool and trigger a fire in the spent-fuel rods, which
are protected by radioactively stable, but flammable, zirconium metal.
A fire fueled by the zirconium cladding around these waste rods could
unleash radioactive plumes worse than those at Chernobyl (NRC). The
report recommended the repositioning of some spent-fuel assemblies in
their pools to minimize the buildup of heat, as well as the installation of
water-spray systems to cool the spent fuel should the pools be drained.

The Energy Chain 41
There is no doubt that climate change has brought the nuclear powerissue back on the table. Proponents of nuclear power say that new plantswould be cheaper, safer, and built on time (Ritch 2006). However, it willbe a very difficult idea to sell to the public, no matter how frightening thespecter of global warming becomes. Japan’s plans for a new generationof plants remain stalled due to public opposition. Attempts in the UnitedKingdom and in the province of Ontario in Canada to privatize the industrywere largely unsuccessful because the private sector did not want to takeon the historic legacy of aging power plants and their waste fuel, nor thefuture costs of decommissioning them. In the United Kingdom it has beensuggested that new nuclear plants could be built on the site of old plantsand thus avoid having to seek planning permission for a new location. Itremains to be seen how planning authorities and the public will react tothis stratagem. In a curious way, the history of nuclear power follows thehistory of fossil fuels—significant commitment of public money, continuingsubsidies from government, discovery of a troublesome by-product, andan understandable aversion on the part of the private sector to take onthe enterprise with all its associated risks. A recent government-appointedcommission in the United Kingdom concluded:
We are concerned that a new nuclear programme could imposeunanticipated costs on future generations without commensuratebenefits. (Cooper 2006)
SOURCES OF ENERGY: HYDROELECTRIC POWER
Like other forms of energy, hydroelectric power (HEP) has its pros andcons. Under the global warming debate, those issues have come up forreview: Is HEP a green, renewable source of energy? Does it have a placein a renewable energy portfolio? Is it an acceptable activity for the CleanDevelopment Mechanism? The short answer that is emerging in responseto these questions is that small HEP is green and renewable, but big HEPis not. However, HEP is a more heterogeneous source of energy than coal,oil, or gas because everything about it is site specific.
The drawbacks to the use of HEP—at least for big HEP—is that itusually involves making major changes to the landscape and the ecology(specifically fish habitats), and often requires the displacement of the peoplewho live in the area that is flooded. As an illustration, the Three Gorges Damin China required the resettlement of more than a million people. A hundredyears ago, when HEP was in its infancy, these issues were less salient.Furthermore, HEP sites were often in remote, sparsely settled, mountainous

42 CARBON FINANCE
areas. Gradually, the sites with the greatest potential have been developedand the era of big dam building may well close with the construction ofthe 18.2GW Three Gorges facility. The withdrawal of World Bank fundingfrom the proposed Damodar Valley dam project in India signaled the successof local resistance to a major scheme for which—from the local people’sperspective—the costs far outweighed the benefits.
There are many varieties of small HEP that can claim to belong tothe green and renewable side of the energy family. The simplest approachrequires no dam at all and operates purely from the power produced by thenatural run of the river. A smaller-scale HEP may require no displacementof people and minimal impact on the local ecology. Two projects inthe first group registered under the Clean Development Mechanism wereHEP facilities in Honduras. The main drawback with small hydro, fromthe energy planner’s perspective, is precisely that it is small. Even whennumerous, such projects will not make the significant contribution to baseload on the scale provided by big hydro.
As noted in Chapter 3, hydroelectric power—whether big or small—isvulnerable to the changes anticipated under global warming. More irregularrainfall regimes will make planning and operating HEP more complicated.A regime with heavier downpours and longer periods of drought will,inevitably, require more storage capacity, which means that more water willbe lost to evaporation. In northern countries, the reduction of the snowpackwill further increase the need for increased storage capacity. Despite theseproblems, small hydro at least will be included in the green, renewableenergy portfolio, which will be discussed later in this chapter in the sectionentitled ‘‘Financing Clean Technology.’’
SOURCES OF ENERGY: RENEWABLES
Spelled out in full, renewable energy means ‘‘energy supply based on arenewable source.’’ No energy production unit lasts forever—wind turbinesand solar panels are replaced, dams silt up. The energy supply is availableon site, without the costs and uncertainty of a global transportation system.The energy source is also free, apart from the recurrent costs of maintainingthe facility. Renewable energy emits no GHGs other than those embodiedin its construction, maintenance, and decommissioning.
With all of these powerful advantages over fossil fuels, nuclear power,and large HEP, it is perhaps surprising that the world has not moved morequickly to renewable sources of energy. The simple answers to this paradoxare scale, inertia, and the cost to the consumer. Fossil fuels provided primaryenergy on a scale that the preindustrial world had never seen. Electricity

The Energy Chain 43
made power ubiquitous through all industrially developed parts of the world.Coal and oil were subsidized by governments to encourage employment inthese sectors and make possible the expansion of the economy. Many oftoday’s private power companies started out in the public sector, with thebenefit of guaranteed funding and frequently with monopoly power. Incontrast, renewable forms of energy production are perceived as small scaleand experimental. Also, their sources of energy (wind, light) are intermittent.Even open-minded people would say:
It’s all very nice, but renewables can’t provide the massive base loadpower that we get from nuclear and fossil fuels. What happens atnight, and when the wind drops?
It has been difficult for renewables to compete on cost, as the subsidiesprovided for them by government were insignificant compared with thepublic money spent on coal, oil, nuclear power, and large-scale HEP.
Two driving forces have begun to change this situation. One is climatechange—a problem identified over 50 years ago, but only now becomingwidely accepted. BP was the first oil and gas major to publicly announce,in 1997, that it was an energy company, but not necessarily a fossil-fuelcompany. In January 2005, the EU ETS came into force; the followingmonth, the Kyoto Protocol was ratified. Even the most conservative energycompanies had to recognize that change was upon them whether they likedit or not. Actually, many had been investing in renewable energy for severalyears, while still maintaining, in public, a hostile skepticism toward climatechange and the Kyoto Protocol.
The second major driver for a change in the energy mix was the growinginsecurity of the price and availability of oil and gas—the fossil fuels ofchoice. Although the global gas industry holds a distinct advantage in present
Globalizing Gas Industry
Piped GasH2 Fuel Cells
WindSolar
Biomass
Present 5 Years 10 Years 15+ Years
LNG/GTL
FIGURE 2.3 The Coming Age of Gas and BeyondSource: Derived from Ling A., J. Waghorn, S. Forrest, and M. Lanstone. 2004.Global Energy: Introducing the Goldman Sachs Energy Environmental and SocialIndex, London, Goldman Sachs Global Investment Research.

44 CARBON FINANCE
and near future markets, the focus of development in the longer term will bein the new sources of renewable energy from wind, solar power, hydrogencells, wave, and biomass (Figure 2.3). In 2002, these ‘‘new’’ renewablesaccounted for only 2.3 percent of the world’s primary energy in 2002. Dueto national and regional policy initiatives, however, they have suddenlygained increased attention and market share (Boyle 2004).
These two drivers—climate change and energy security—have encour-aged governments (from the United Kingdom to Texas) to mandate arenewable energy requirement from energy producers and/or distributors.These requirements have provided the spur for a rapid expansion of therenewable contribution to the energy mix.
Traditional Biomass
For all but the last 150 years of known human history, we have lived off theenergy of the sun, the energy of our bodies, the energy of our domestic ani-mals, some wind and water capture, and the burning of biomass, includingwood, charcoal, animal dung, and crop wastes. Many people in developingcountries still live off these sources. In some respects, this is very positive,because they are living within a balanced carbon cycle, which—if we alldid the same—would keep the earth’s climate in equilibrium. But peoplereliant on traditional biomass for their energy supply live in developingcountries, where many are very poor, have low life expectancy, and arevery vulnerable to the changes and impacts that high-carbon emitters indeveloped economies have thrown into the carbon cycle. They are exposedto heavy storms, flooding, and droughts. They need more fuel, food, andlivelihood security, but they will not find this by remaining dependent ontraditional biomass or by embracing our modern energy transition.
A further reason for discouraging the use of traditional biomass as asource of energy is that it contributes to the deforestation trend in tropicalcountries. It is not, however, the major factor, as it is far outweighed byforest clearance for agriculture and logging, both legal and illegal. Oneof the steps taken at the COP/MOP1 in Montreal was the beginning of‘‘a process to consider awarding carbon credits to developing countries inexchange for conserving rainforests.’’ (Nicholls 2006b, 6)
Wind Energy
In the modern age, people in the West have largely forgotten how much theyowe historically to wind energy. Wind (along with small hydro) has providedenergy for grinding corn—a staple food. Wind also drained potentiallyrich wetlands to expose nutrient-rich soils for intensive agriculture. Wind

The Energy Chain 45
drove the ships which built the first stage of the modern global economy.Then wind was forgotten, as all of these activities were powered on a muchlarger scale and apparently much more cheaply by fossil fuels. Modern windenergy is provided by large turbines grouped in combinations known aswind farms. Although they are often located on existing farms, they areclearly an industrial enterprise.
These units can be envisioned in two very different ways—either asoff-the-grid supplies for isolated communities or as input to a regional,national, even international grid. The former clearly meets a need that themodern fossil fuel–powered grid cannot meet. The problem for the secondrole is to develop wind power on a significant scale.
Objections to wind power fall into the categories outlined below:
� Landscape aesthetics: Inevitably, onshore wind farms are located inwild moorlands and coastal regions where landscape aesthetics are animportant concern, both for the local inhabitants and for visitors whoprovide economic opportunity for those local people. Whereas somepeople might admire the graceful turning of the turbines’ blades, otherssee the turbines as a desecration of the natural landscape. The mostpersistent objections to new wind farms are based on loss of asceticamenity in places like mid-Wales, where they have already acceptedmany wind farms. Companies in the wind farm business are hopingthat they will achieve greater output with much less opposition by sitingtheir facilities offshore, where the wind is stronger and more consistent,and there are no protesting neighbors.
� Noise: People might associate the giant turbines with aircraft jet enginesand assume they are noisy. Yet, countless tests have shown that, evenwhen you stand right under a wind turbine, the noise is less than youwould hear as background noise in your own house, let alone standingby a highway or near an airport.
� Intermittent supply: The source is intermittent, it is true. There aretwo solutions to this fact. If you are running a small, local facilityunconnected to the grid, then you will need to invest in storage batteries,which will increase the cost. If you are connected to the grid, the problemis not a significant increase to the cost because fluctuations are managedin the context of the grid system as a whole. So long as wind powercontributes only 20 percent of the total power in the grid, this is not asignificant cost (Gross et al. 2006; Sweeney 2006).
� Bird deaths: There have been a great number of studies of bird deathsattributable to wind power ever since the unfortunate siting of a windfarm in a canyon in California in the 1970s, to which the deaths ofmany American eagles were attributed. In this particular project, the

46 CARBON FINANCE
structure supporting the blades was a lattice—conducive to birds sitting,even nesting, and quite unlike the smooth, hollow cylinder used today.Subsequent studies report bird deaths are several orders of magnitudegreater for large buildings illuminated at night, for highway traffic, andfor cats, than for wind turbines. Deaths from wind farms amount totwo birds per turbine per year.
� Electromagnetic impacts: The electromagnetic impacts of wind farmsfall into the same risk category of any transmission of electricity. Peoplecomplain that they interfere with television reception. More seriously,there is still an open book on the health impacts of electromagneticfields, particularly with high-voltage transmission lines in urban areas.Wind farms do not add to this potential risk, especially as they arelocated in areas of very low population density.
Solar Energy
The quintessential power of the planet is the sun. The most fundamentaluse of solar power is photosynthesis, whereby plants use the sun’s energyto convert carbon dioxide and water into vegetal matter such as celluloseand starches. It is no accident that BP—in its quest to find a future beyondpetroleum—has transformed its circular logo into a sort of sunflower.
Modern solar power includes two processes, one being the passive useof sunlight to warm water, which can be used directly as hot water andalso for space heating. The other process needs a group of interconnectedphotovoltaic cells to convert daylight into electricity. The photovoltaic effectwas first observed by Edmond Bequerel in 1839, but it wasn’t until the 1950sthat high-efficiency solar cells were developed, primarily for use in remotelocations that could not be linked efficiently to the grid, or for specializedapplications such as space flight and orbiting satellites. The drive to increasethe solar segment of the energy mix significantly has risen in parallel withthe rise of wind power, although currently solar accounts for only 0.21percent of the worldwide primary energy consumption compared with 0.57percent provided by wind energy.
Like wind, solar power shares the disadvantage of intermittency andthe disadvantage of higher recurrent costs compared with fossil fuels andnuclear power. That, however, is beginning to change, as major playersare making heavy investments in new technology, driven by the need toprovide fuel security and combat climate change. Solar power enjoys theimportant advantage of being highly suited for use in the home and otherbuildings. Roofs can be adapted for solar heating panels and photovoltaicarrays. Several local authorities in the United Kingdom, including Londonboroughs, require that a percentage of newly built homes incorporate solarpower in their design.

The Energy Chain 47
Tidal Energy and Wave Energy
Like wind power and solar power, tidal energy is intermittent. However,it is extremely predictable, and it could deliver electricity on a scale andat a competitive price that equals large HEP, fossil fuels, and nuclearpower. Furthermore, there is a successful model—the 240MW Rancebarrage, which was built near St. Malo in the 1960s. In addition, threesmaller projects are operating in Canada, Russia, and China. In the UnitedKingdom, studies have been made of the tidal potential of several majorestuaries, notably the Severn, the Dee, the Mersey, Morecambe Bay, theSolway Firth, and others (Boyle 2004). The Severn scheme would have aturbine capacity of 12,000 MW. Power can be drawn on the ebb or the flowof the tide, or both. But even when generating power from both ebb andflow, two tides per day, power would be generated only one-third of theday. So the annual output would equal fossil fuel and nuclear stations withonly one-third of the megawatt capacity, assuming uninterrupted productionfrom them. Fortunately, there is a considerable difference in the timing of thetides around the coast, so one facility could balance the production of others.
So what is holding back the development of tidal power? Althoughthere are some environmental concerns, they are less significant than thoseassociated with wind farms. The visual impact on the landscape is veryminor—less than a cantilevered bridge or a transmission line. However,there are concerns that changes in the tidal habitat will have a negativeeffect on birds and aquatic ecosystems.
The real problem, in fact, is cost. The estimated capital cost of the Severnbarrage in 1992 was £10.2 billion (Boyle 2004). Obviously, the smallerprojects would cost less, but they would also deliver less power. Theassumption at that time was that public funds would be needed, andthe Treasury was unwilling to back the scheme, since the trend in the UnitedKingdom for the past 30 years has been to encourage the private sector totake the risk and the opportunity. But much has changed since 1992. In theUnited Kingdom, there was a certain amount of complacency that its Kyototarget would be achieved easily because of the switch from coal to gas forbase load electricity generation. This complacency has been dented by therealization that the much vaunted ‘‘dash for gas’’ has been negated by surgingenergy use in the household sector and in transportation (road and aviation).
Another interesting factor that could have an impact on the developmentof tidal energy in the United Kingdom is the gradual acceptance of toll roads,beginning ironically with the first bridge across the Severn Estuary. A newdesign for the Severn barrage for this purpose would surely include a road,and possibly a rail link as well. Barrages across the Mersey and Dee wouldcertainly attract a road link. Toll roads on such shortcuts across the geog-raphy of Britain would dramatically change the economics of the potential

48 CARBON FINANCE
for tidal power. Furthermore, the carbon credits that such projects mightnow earn would add another significant plus to the cost–benefit analysis.
Wave power is more on the scale of wind and solar power. To makeit commercial requires multiple small energy converters yoked together inwave farms. Prototype projects have been running for over a decade. Theenergy potential is certainly there; the perceived negative environmentalimpacts are minimal compared with onshore wind farms, because—as withoffshore wind farms, and tidal barrages—there are no neighbors at sea. It isa huge source of potentially cheap energy waiting to be harnessed. Estimatedcosts of delivered energy have fallen dramatically over the past 25 years from30 pence per kilowatt hour to 4 pence per kilowatt hour (Boyle 2004). Itappears that wave energy is at the point that solar energy and wind energywere 10 years ago:
Wave energy technology has moved into the commercial world andseveral developers are anxious to demonstrate prototypes beforeexecuting ambitious plans to deploy multiple devices generatingelectricity at favorable prices. Coupled with incentives for avoidedcarbon dioxide emissions, the economic prospects for commercialwave energy exploitation appear to be good. (Boyle 2004, p. 333)
In other words, we appear to be at the point where the development ofwave energy will pass from the inventors to the investors. And, unlike themassive capital costs and daunting planning permission required for tidalpower, wave energy can develop in an incremental manner.
Modern Biomass and Biofuels
Biomass is where we started when we moved away from simple reliance onsomatic, bodily energy. We burned wood to cure and cook food and to heatsimple habitations. Now we are coming out of the modern energy transitionlooking for new solutions, which leads us straight back to biomass.
Traditional biomass combustion, as discussed in this chapter, is nota solution. It depletes the forest and provides energy very inefficiently forits users. However, modern biomass combustion is very different, and itprovides valuable auxiliary energy for its users.
In Sweden and Finland, where biomass contributes about 20% ofprimary energy, the use of residues in the pulp and paper industriesis important. And advanced systems for domestic heating, districtheating and combined heat and power have helped Sweden towardsa 5-fold increase in the use of bio-energy over the past decade orso. (Boyle 2004, p. 109)

The Energy Chain 49
Several trends are now supporting a renewed drive toward findingthe most efficient and least polluting means of deriving energy from thecombustion of biomass—both directly to produce heat, steam, and elec-tricity, and also to produce biofuels for the transportation sector. First, theprice of oil and gas is likely to remain high since the supply situation isunlikely to improve, while demand will continue to grow, particularly inthe emerging economies, including those of central Europe, China, India,and Brazil. Secondly, tighter landfill and pollution regulations (especiallyin Europe) mean that products formerly seen as waste, such as straw inthe fields and animal waste, must now be disposed of in a nonpollutingway. Third, climate change is providing strong pressure to reduce GHGemissions through the EU ETS and the Kyoto Protocol. Specifically, theClean Development Mechanism will provide added incentives to managefarm wastes more efficiently. After the Organization of Petroleum ExportingCountries (OPEC) price squeeze in the early 1970s, many such initiativeswere taken up—notably ethanol in Brazil—only to be abandoned once theprice fell back. This time a significant fall in the in the price of oil and gas isextremely unlikely.
Organic matter can provide renewable energy from two types of sources:organic waste matter and crops grown specifically to produce energy. Thereis a considerable variety of combustible waste, including forestry residues,crop residues, bagasse from sugar production, animal manure and litter,sewage sludge, commercial solid waste, municipal solid waste, and methanefrom landfills. Energy crops include maize, miscanthus grass, sorghum,sugar cane, and many oil seeds suitable for biofuels such as soy beans,cottonseed, and sunflower seeds. Indeed, any waste organic product can becombusted if its water content is low enough, its calorific value high enough,and if there is sufficient supply, available close by, to make the conversioneconomically viable.
What has happened, as the carbon-constrained world has evolved, isthat producers of an increasing number of products must consider closingthe ecological loop by turning waste products into a valuable input toanother process. In this case, that input is the production of energy. It isno longer permissible in the EU to send old tires to a landfill, so they arechipped and burned to produce electricity. Farmers can no longer burnwaste straw at the conclusion of the harvest, so near Ely (United Kingdom)there is now a 36MW, straw-fueled generator supplying power to 80,000households (Boyle 2004). In Los Angeles, the most recently constructedsewage treatment plant is powered internally from its own waste gas.
That is not to say that we are out of the woods, but certainly there area number of encouraging trends that are likely to be sustained through thenext phase of the energy transition. Each of the renewable energy sources

50 CARBON FINANCE
discussed in this sector fills a particular niche in our energy demands. Solarpower is ideal for building new components into more energy efficienthousing, while biofuels can reduce fossil fuel demand from the still rapidlygrowing transportation sector. One could argue that landfill methane is notstrictly renewable because a typical project lasts 15 to 20 years before thegas is exhausted. However, it was admitted as meeting the criteria for theUnited Kingdom’s Non-Fossil-Fuel-Obligation, which provided a spur forits rapid development. One could argue that drawing waste gas from alandfill is not the most efficient way to convert waste into energy, but—inthe meantime—it is a useful response to deriving energy from a problematicwaste product.
Geothermal Energy
Many communities have made use of steam and warm water emerging fromthe rocks, wherever a heated rock structure diffused heat to an aquifer.Iceland, New Zealand, Italy, Hungary, and California provide examples.The Romans utilized geothermal heat at their spa in Bath (now UnitedKingdom). During the 1970s oil crisis, we saw a great increase in interestin the potential of geothermal energy worldwide. It is the most reliablesource as it produces constant output, independent of the atmosphericor hydrological cycles. It is right under your feet, so there is no risk ofinternational political crises disrupting your supply. Strictly speaking, it isnot exploited in a renewable way, as producers tended to extract more heatthan is replaced by the thermal processes underground. But, in favorablecircumstances, a properly managed site could have its boreholes rotatedin such a way that the heat source would be replenished over a period ofdecades.
Energy from geothermal sources can be accessed either as warm water,used mainly for space heating and hot water supply, or, with sufficient ther-mal gradient, electricity can be produced. The leading producers today arethe Philippines, the United States, Indonesia, Mexico, and Italy. Favorableconditions for exploitation are extremely site specific, but the potential issignificant and very secure, while emitting very small quantities of green-house gases. Interest waned as oil prices came down after the 1970s OPECprice spike, but now, with the expectation of oil and gas prices staying high,development will proceed steadily.
KEY ISSUES
Carbon finance is inextricably tied into the evolution of the energy chainworldwide. This process has become highly unpredictable since consensus

The Energy Chain 51
has developed around the realization that the age of fossil fuels is coming toan end, while nuclear power is unlikely to take its place. At the same time,energy use is growing steadily as consumers in the West adopt new activitieswhich require more energy and as emerging economies bring millions ofnew consumers to join the energy feast. If you were observing us in a globalaquarium you would see that we are engaged in the energy equivalent of afeeding frenzy.
Conservation and the use of renewable sources of energy are clearlypossible solutions to this problem. Yet conservation in one area is swampedby new consumption in another, while renewables—although growingrapidly—are still a small percentage of the mix, if you exclude traditionalbiomass and large-scale hydro from the renewable side of the equation.Are there other scenarios, other than energy conservation and a dramaticincrease in the use of renewables?
The hydrogen economy is offered as a vision of the future, wherebyhydrogen would power fuel cells, the hydrogen being produced either byfossil fuels or by renewable sources of energy. The fuel cell was first patentedin the 1880s, so it is another old idea being revisited. Can carbon fromfossil-fuel combustion be sequestered, taken away, and trapped in some inertstate? There are many proposals for how this might be done. Can we burnclean coal so that no GHGs are emitted? We have enough coal to burn foranother 200 years, so this is certainly something that should be examined.
A Hydrogen Economy Based on Fuel Cells?
Fuel cells produce electricity by the combination of hydrogen and oxygenin the presence of a catalyst such as platinum, without going through thecombustion process that produces GHGs and other pollutants. WilliamGrove, an English barrister, invented the fuel cell in 1850. Its subsequenthistory closely parallels the history of photovoltaics—a nineteenth-centuryinvention, developed by scientists in the 1950s, boosted by the spaceprogram, used for specialized applications in industry, and dusted off to facethe energy transition crisis of the 1990s. The production of energy from fuelcells is wonderfully modular. For example, a partnership between BallardFuels and Coleman Stoves produces a portable stove for camping. Mostsignificantly, fuel cells can provide power for all kinds of transportation,including automobiles and buses. Trials for buses have been under way(from Ballard and DaimlerChrysler) since the early 1990s. Fuel cells canalso provide major base load generation from stationary sources.
At the risk of becoming too euphoric, fuel cells could represent asimportant a transition in our use of energy as the shift from the open fire tothe modern electric power plant. Again, why has this technology not stepped

52 CARBON FINANCE
in to solve the carbon crisis? The answer is that everything depends on theprice of oil and gas. The development of fundamentally new technologiesis expensive and requires some degree of predictably. The share price ofBallard Fuels—to take one example—surged from $5 to $80 in the earlydays, and later fell back. In this case, the transportation fueling processneeds to see hydrogen as accessible and as price competitive as gasoline ordiesel. It is difficult to judge euphoria against a sanguine assessment. Hereis one attempt to balance the scenarios:
By the middle of the twenty-first century it looks increasingly likelythat hydrogen . . . ., a zero-carbon fuel, will be playing an importantrole in the world’s energy systems. Some of this hydrogen willprobably be generated by electrolysis from renewable sources suchas hydro, wind or solar power. But it is likely that much of it will beproduced from fossil fuels such as natural gas or coal, with captureand sequestration of the CO2 produced as part of the conversionprocess. (Boyle, Everett, and Rammage 2003, p. 588)
Carbon Sequestration
Are there reliable ways to burn fossil fuels while safely burying the resultantcarbon dioxide emissions for all time?
Forests are the largest natural absorbers of carbon dioxide over whichhumans have immediate control by reducing the rate of de-forestation and byan aggressive global program of reforestation from which multiple benefitscould be derived in addition to carbon dioxide sequestration. However, theIPCC estimates that even if such a program were maximized up to 2050only 12 to 15 percent of the emissions (from the burning of fossil fuels)to that date could be taken up; thereafter, the forest would have to becarefully managed and replaced when harvested. Thus, even with the mostfavorable result, this would be a one-shot impact over that time period. Afurther contribution can be made by changing tillage practices to minimaltillage, thereby reducing carbon dioxide from agricultural soils. Likewise,the conversion of land use from arable land to pasture will provide afurther reduction. Desirable as these activities may be, they clearly offer aless-than-complete answer to the problem of carbon dioxide emissions.
An alternative approach is to capture carbon dioxide in the combustionprocess by absorption into liquids or solids, adsorption onto the surface ofsolids, or physical capture by porous inorganic membranes. The capturedgas can then be injected into depleted oil and gas fields, coal seams, salineaquifers, or the deep ocean. Injection of carbon dioxide into oil and gasfields and into coal seams is already being done in order to enhance recovery

The Energy Chain 53
of oil and gas, or methane from the coal beds. There are questions over thesecurity of the stored carbon dioxide, and obviously this depends on thenature of the geological formation into which it is pumped. Furthermore,carbon dioxide can be readily captured only from large, stationary emitterssuch as power stations and major industrial facilities.
Finally, research is being done on the effectiveness of increasing theocean’s absorptive capacity by the development of phytoplankton throughartificial nutrient enrichment. It is not known what long-term effects thismight have on oceanic processes. However, all these attempts to captureand sequester carbon dioxide are end-of-pipe, technical fixes that cannotrestore the balance to the carbon cycle.
Unintended Discharges
The discussion so far has been presented on the assumption that the globaleconomy and ecology continues to operate as usual. However, there areseveral disturbing examples of activities that could suddenly increase theanthropogenic discharge of GHGs to the atmosphere. The greatest risk isfrom an increase in forest fires on the scale of the 2003 fires in Europe, whichtook hold from Portugal to Russia. Major fires have also occurred alongthe North American Pacific coast, Indonesia, and southeastern Australia.In a warmer world, subject to longer periods of drought, these events areto be expected. Unfortunately, they represent the possibility of a feedbackthat could intensify the rate of global warming by driving additional carbondioxide into the atmosphere.
Additional, unintended increases would result from warfare, the sab-otage of oil field infrastructure (as is happening in Iraq and in Nigeria),and industrial accidents such as the December 2005 fire at the oil depot atBuncefield, near Hemel Hempstead (United Kingdom), which is describedas the largest fire in Europe since World War II. No one has yet deter-mined how these unintended emissions are to be accounted for—whethersignatory countries under the Kyoto Protocol would have to compensate forthem with increased reductions elsewhere, or whether they would simply beaccepted as a global target forgone.
FINANCING THE TRANSFORMATION OF THE ENERGY
CHAIN: THE ROLE OF VENTURE CAPITAL
The emphasis today is not to use taxpayers’ money to perform ser-vices that could be offered by private enterprise, and to motivate private

54 CARBON FINANCE
enterprise to do the job by developing legislation which encourages mar-kets to achieve various goals—environmental, medical, educational, andsocial—more quickly and at lower cost. With global warming upon us, itis in everybody’s interest to slow down the rate of climate change and bestprepare global society to adapt to the inevitable transition to new climateregimes.
Venture capital is the most flexible form of capitalism because itseeks out higher-than-average returns on investment by taking higher, well-judged risks in investment. Venture capitalists live higher up the risk-returncurve than your average investor. In the climate change field, they sharethis search for higher returns with major corporations already invested incarbon-constrained sectors, such as BP and AEP, with institutional investors,including banks and pension funds, with government funded investors, forexample, the Carbon Trust in the United Kingdom, and with private equitysuch as charitable foundations, which may not consider itself a traditionalventure capital. One prime example is that of the Carbon Trust’s investmentin Ocean Power Delivery, which operates the Pelamis wave-energy converterin northern Scotland, ‘‘which is already generating electricity from wavepower and feeding into the national grid’’ (Pullan 2005, p. vi).
Investors are looking for lucrative, low-carbon deals, becoming involvedin start-up companies, then holding them from three to seven years beforeexiting via initial public offerings (IPOs) or selling them to companies alreadyestablished in the sector. The hope is that this investment opportunity in‘‘cleantech’’ will emulate the solid returns earned from biotech and avoidthe disastrous hype of the dot-com boom and bust. For example, a survey ofprivate equity investment in renewable energy technology companies from2001 to 2004 listed the following sub-sectors in order of capital invested(number of projects in brackets: Table 2.3)
The drivers behind these investment opportunities are the same as wehave seen elsewhere in this appraisal—the continuing high and volatile priceof oil and gas, the coming into force of the Kyoto Protocol, the EU ETSand other trading regimes, and the dramatic emergence of better alternativetechnologies for the more efficient use of energy and the development ofrenewable energy.
The spotlight in 2006 is on greenhouse gas emissions, but the moreimminent, underlying environmental issue is water quality and water avail-ability. Water is already a critical issue for agriculture, municipalities,semiconductors, and power supply, including thermal and nuclear. Wateris very heavy and hence can be difficult and expensive to move around. Thecubic meter of water that a small, frugal household uses every day weighsone metric ton, which must be pushed up to your top floor by the pressurein the pipe maintained by your municipality’s electricity power use (and
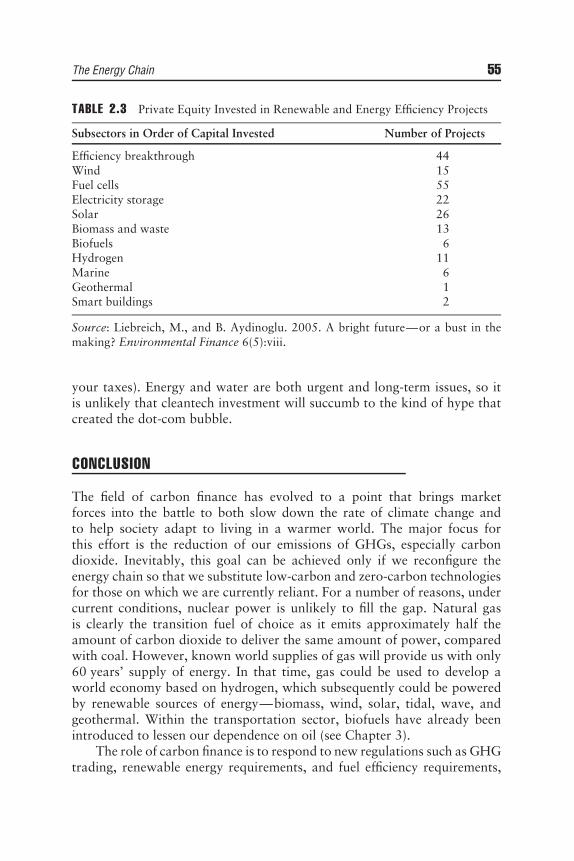
The Energy Chain 55
TABLE 2.3 Private Equity Invested in Renewable and Energy Efficiency Projects
Subsectors in Order of Capital Invested Number of Projects
Efficiency breakthrough 44Wind 15Fuel cells 55Electricity storage 22Solar 26Biomass and waste 13Biofuels 6Hydrogen 11Marine 6Geothermal 1Smart buildings 2
Source: Liebreich, M., and B. Aydinoglu. 2005. A bright future—or a bust in themaking? Environmental Finance 6(5):viii.
your taxes). Energy and water are both urgent and long-term issues, so itis unlikely that cleantech investment will succumb to the kind of hype thatcreated the dot-com bubble.
CONCLUSION
The field of carbon finance has evolved to a point that brings marketforces into the battle to both slow down the rate of climate change andto help society adapt to living in a warmer world. The major focus forthis effort is the reduction of our emissions of GHGs, especially carbondioxide. Inevitably, this goal can be achieved only if we reconfigure theenergy chain so that we substitute low-carbon and zero-carbon technologiesfor those on which we are currently reliant. For a number of reasons, undercurrent conditions, nuclear power is unlikely to fill the gap. Natural gasis clearly the transition fuel of choice as it emits approximately half theamount of carbon dioxide to deliver the same amount of power, comparedwith coal. However, known world supplies of gas will provide us with only60 years’ supply of energy. In that time, gas could be used to develop aworld economy based on hydrogen, which subsequently could be poweredby renewable sources of energy—biomass, wind, solar, tidal, wave, andgeothermal. Within the transportation sector, biofuels have already beenintroduced to lessen our dependence on oil (see Chapter 3).
The role of carbon finance is to respond to new regulations such as GHGtrading, renewable energy requirements, and fuel efficiency requirements,

56 CARBON FINANCE
in creative ways to reach the targets on time and as efficiently as possible.The regulators must design the framework for these new markets withan appropriate time frame so that the private sector can proceed with aslittle uncertainty as possible. Whatever point at which they impose theirregulations on the energy chain, the impact will be felt throughout the valuechain with the costs ultimately passed on to consumers.

CHAPTER 3Regulated and
Energy-Intensive Sectors
INTRODUCTION
Climate change policies are anticipated to have an effect on a number ofindustries. The most sensitive sectors are either energy-intensive, includingaviation and cement, or energy industries, such as oil, gas or coal, andpower utilities, or those sectors that provide energy-consuming products,such as automobiles. The power industry, among others, is being heavilytargeted by regulatory bodies as ‘‘large final emitters.’’ The transportationsector, which also emits a large percentage of CO2, is also being affected bygovernment measures (Table 3.1).
In Chapter 1, we defined carbon risks at the sectoral level as beingeither regulatory or physical. This chapter provides a brief outline of therisks and opportunities that climate change presents within sectors affectedby government policies. Chapter 4 discusses the physical manifestations ofclimate change on a number of sectors, both regulated and unregulated.
POWER INDUSTRY
The power industry represents a major portion of global CO2 production(Figure 3.1). Measured in terms of economic importance and environmentalimpact, it is one of the most important sectors in the world. Nearly everyaspect of industrial productivity and daily life are dependent on electricity,for which there is no reliable or adequate substitute. Interruption in energysupply can be highly disruptive, as illustrated by the California energy crisisof 2001–2002 and the August 2003 blackouts in eastern Canada and in theU.S. Northeast and Midwest.
57

58 CARBON FINANCE
TABLE 3.1 A Summary of Policies Affecting Selected Regulated Energy-intensiveIndustries
Carbon PoliciesSector Regulations Standards
Present Future Mandated Voluntary
Utilities EU, CanadaOil and gas EU, CanadaAutomobile EU, (biofuels, carbon tax) Canada, Japan,
China KoreaUSA EU (emissions)
Federal (CAFE)7 States
Aviation EUBuilding EU
materials
The greenhouse gases that power producers emit are directly related tothe fuel mix used, as well as the efficiency of their plants. The emission factorper utility is defined in terms of its total emissions/total power generated(emissions kgCO2/generation MWh). As shown in Figure 2.2, a utility’scarbon intensity decreases as its fuel mix moves from coal and lignite to gasor nuclear.
Manufacturing (exc. cement) 17%
Other sectors 14%
Transportation 24%
Cement 5%
Energy Industry 5%
Heat and Power 35%
FIGURE 3.1 Global CO2 productionSource: WBCSD 2005, The Cement Sustainability Progress Report, World BusinessCouncil for Sustainable Development, Geneva, www.wbcsd.org.

Regulated and Energy-Intensive Sectors 59
The profile of the power industry has changed in recent years, as dereg-ulation has led to major consolidations within this sector. In Europe sevenproducers now have a cumulative market share of 70 percent of generation.The United States has a mixed system, where rates are regulated even thoughsome deregulation exists at the wholesale level. It is anticipated, however,that government policies will inevitably drive mergers and acquisitions inthis sector in the United States.
In Europe, 10 companies in the power and heat sector account for morethan 60 percent of total emissions. The average emissions factor per utilityin the EU is 353 kgCO2/MWh, while the same measurement for the UnitedStates is more than twice the EU average (720 kgCO2/MWh). Comparativefigures for the Japanese grid indicate a carbon factor at about the same levelas the EU in 2002 (379 kgCO2/MWh) (PricewaterhouseCoopers 2003).
Figure 3.2 illustrates not only the similarity of emissions between Japanand European Union (EU) markets, but also that the 10 largest Europeanpower producers generate 35 percent more power and emit 35 percentless CO2 than the 10 largest U.S.-based utilities. The differences betweenthese countries’ utility carbon intensities lie in a combination of production
0
400
800
1200
1600
Generation (TWh) Emissions (MtC 02) Carbon Intensity(kgCO2/MWh)
USA EU Japan
FIGURE 3.2 Carbon intensity of power sector by regionSource: Based on data from PricewaterhouseCoopers and Enerpresse 2003:Climate Change and the Power Industry, www.pwcglobal.com and Pricewater-houseCoopers and Enerpresse. 2002. Climate Change and the Power Industry,www.pwcglobal.com.

60 CARBON FINANCE
efficiencies and the fuel mix of generation. From an efficiency perspective,thermal plants in Europe are 10 to 25 percent more efficient, on average, thantheir U.S. counterparts (PricewaterhouseCoopers and Enerpresse 2002).
Looking at the fuel mix used in the EU and the United States, coal-basedgeneration exceeds 50 percent of U.S. output, whereas the EU has reducedits use of coal to approximately 35 percent. The balance of the differenceis due to the use of nuclear (20 percent in the United States, 33 percentin Europe). In comparing similar figures for the EU and Japan, coal andnuclear play a greater role in the Japanese power sector, compared to thegreater use of hydro and gas in Europe (PricewaterhouseCoopers 2003).
There is a need, however, to reconcile the growing demand for afford-able and reliable electricity supplies with the necessity to reduce greenhousegas (GHG) emissions. A number of options exist to address this imbalance.In the near term, fuel switching and increased efficiency of productioncan contribute to emission reductions. Government actions aimed at con-trolling GHGs from large final emitters are anticipated to accelerate theshift in resource use from coal to gas as the primary fuel used in powerplants (Ling et al. 2004). Based on carbon prices of about ¤25 per metricton CO2 within Europe, some forecasts predict that investments in new gasplants and writing off obsolete coal plants would be more than covered byincreased operating profits arising from a predicted 40 percent rise in thewholesale price of electricity (Leyva and Lekander 2005). Others anticipatethat a coal-to-gas transition would not take place before carbon pricesreached ¤60/metric ton CO2 (Citigroup 2005).
In the longer term, a gradual deployment of lower-carbon technolo-gies and the expansion of renewable technologies, such as biomass, willcontribute to improved carbon profiles for many utilities. Demand-sidemanagement also has a role to play in reducing the amount of electric-ity used. Table 3.2 summarizes the different points of entry (generation,grid, end user) and timing of where changes can be made to the energyindustry (Morgan, Apt, and Lave 2005).
Most recently, two of these technologies, integrated gasification com-bined cycle (IGCC) and carbon capture and storage (CCS) have gainedincreased profiles in climate policy agendas within the European Union emis-sions trading scheme (EU ETS) and the Kyoto Protocol’s clean developmentmechanism (CDM).
The rapid economic growth that exists today in India and China isclosely linked to an equally increasing demand for generating capacityand electricity. The greatest potential for large-scale cuts in CO2 emissionswhen coal is used is likely to come from a range of advanced technologies,including CSS combined with IGCC. In an IGCC system, coal being used toproduce electric power is reformed, using steam, into a synthetic gas, which

Regulated and Energy-Intensive Sectors 61
can be easily separated into a concentrated stream of CO2 and gaseoushydrogen. The hydrogen provides a clean, carbon-free fuel for combustion,distributed generation applications, or as a fuel for automobiles. The CO2
is sequestered by pumping it underground. CSS involves the capture of fluegases exiting the combustion chamber of large point sources, the strippingof CO2 from the gases and its subsequent storage in an undergroundgeological reservoir. CO2 can be captured from sources including powerstations, natural gas processing facilities, and steel and cement plants. Thiscombination of IGCC and CCS can deliver power plant efficiencies in theregion of 50 percent, with only 3 to 4 percent energy penalty for CO2
capture and handling.In the CCS process, CO2 can be stored in geological reservoirs that are
more than 800 meters below ground level, in depleted oil and gas reservoirs,deep saline formations both on and offshore, and can be used in enhancedoil recovery (EOR) and coal-bed methane retrieval processes. The oil andgas industry can offer a wealth of knowledge and experience both in storageof CO2 in depleted oil and gas fields and in the well-established use of CO2
for EOR. The capture and transport of carbon, in itself, requires energy andcreates emissions, but net CO2 emissions are estimated to be cut to just 10to 20 percent of a plant that does not use CCS. The electricity industry isanticipated to be one of the greater users of carbon capture and storage.(See Box 3.1.)
BOX 3.1 CARBON CAPTURE AND STORAGE
(CSS) PILOT PROJECT BY VATTENFALL
The Swedish power company, Vattenfall, has taken the first steptoward developing a commercial CCS system for carbon-free powergeneration based on coal. The institution is building the world’s first30MW thermal pilot plant for CO2 capture near its lignite-fired powerplant in Swartze Pumpe in Germany. It is scheduled for completionby 2008.
Among the different technologies that exist for CO2 capture, Vat-tenfall has chosen an ‘‘oxyfuel’’ combustion system, wherein oxygen ismixed with recycled flue gas containing CO2, and then used for com-bustion, resulting in a flue gas that contains only water and CO2. TheirCO2 will be stored in subsurface geological sites, such as depleted oiland gas fields.Source: Stromberg, von Gyllenpalm, and Gortz 2005.

TABLE 3.2 Summary of Availability of New Technologies Affecting the Electricity Industry
Generation TechnologiesTechnology Impacts Limitations Availability
Integrated gas combined cycleturbines (IGCC)
Reduce CO2 emissions; higherconversion efficiency; wellsuited to meet intermediateand peak demands
Gas price and supplyuncertainty; still emits someCO2
Now
Nuclear Power No direct CO2 emissions High cost, public perception,spent fuel, security
Now
Biomass Large CO2 reduction Cost of collection; aesthetics;technical limits to % that canbe co-fired with coal
10 years
Wind Power Most competitive renewableenergy option; recentgrowth driven by incentives(taxes, credits) andrenewable portfoliostandards
Land availability; aesthetics;high cost of storage
10 years
Solar Photovoltaic (PV) power High % of CO2 reduction Intermittent; conversion is bothexpensive and inefficient
25 years
Hydrogen (used in fuel cells) Potentially large CO2
reduction from electricpower
Hydrolysis of water is costly;natural gas (HC4), coalgasification the most likelysources
40 years
62

Distributed Generation1
Internal combustion engines(ICE)
Use of natural gas reducesCO2 emissions; use ofCHP3; increases end-useefficiency
Many current regulations limitdistributed generation andmicro-grids
Now
Micro-turbines Use of natural gas reducesCO2 emissions; use of CHPincreases end-use efficiency
Many current regulations limitdistributed generation andmicro-grids
15 years
Grid TechnologiesAdvanced flow control systems Improved system efficiency
and reliabilityMarket learning needed to bring
costs down5 years
Superconducting material Reduced line lossesGreater control over power
flowEnergy Efficient End-Use Devices and Advanced Load Control
Energy-efficient end-usedevices and advanced loadcontrol
Reduce energy consumption Mainly behavioral andinstitutional
Now
More efficient end-useappliances
1Distributed generation is a generic term for small scale electricity production technology that can be located near the point ofend-use.Source: Adapted from Morgan, G., J. Apt, and L. Lave. 2005. The U.S. Electric Power Sector and Climate Change Mitigation.Pew Center on Global Climate Change, Arlington, VA.
63
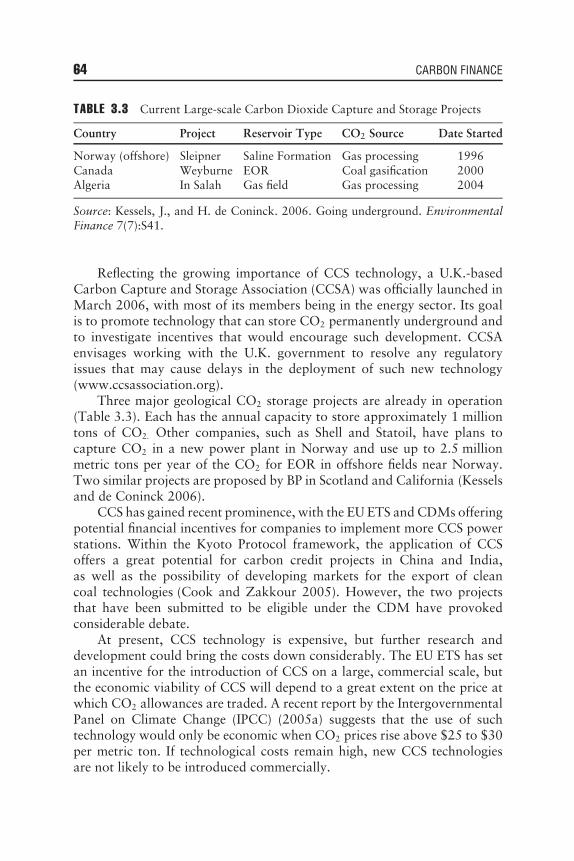
64 CARBON FINANCE
TABLE 3.3 Current Large-scale Carbon Dioxide Capture and Storage Projects
Country Project Reservoir Type CO2 Source Date Started
Norway (offshore) Sleipner Saline Formation Gas processing 1996Canada Weyburne EOR Coal gasification 2000Algeria In Salah Gas field Gas processing 2004
Source: Kessels, J., and H. de Coninck. 2006. Going underground. EnvironmentalFinance 7(7):S41.
Reflecting the growing importance of CCS technology, a U.K.-basedCarbon Capture and Storage Association (CCSA) was officially launched inMarch 2006, with most of its members being in the energy sector. Its goalis to promote technology that can store CO2 permanently underground andto investigate incentives that would encourage such development. CCSAenvisages working with the U.K. government to resolve any regulatoryissues that may cause delays in the deployment of such new technology(www.ccsassociation.org).
Three major geological CO2 storage projects are already in operation(Table 3.3). Each has the annual capacity to store approximately 1 milliontons of CO2.
Other companies, such as Shell and Statoil, have plans tocapture CO2 in a new power plant in Norway and use up to 2.5 millionmetric tons per year of the CO2 for EOR in offshore fields near Norway.Two similar projects are proposed by BP in Scotland and California (Kesselsand de Coninck 2006).
CCS has gained recent prominence, with the EU ETS and CDMs offeringpotential financial incentives for companies to implement more CCS powerstations. Within the Kyoto Protocol framework, the application of CCSoffers a great potential for carbon credit projects in China and India,as well as the possibility of developing markets for the export of cleancoal technologies (Cook and Zakkour 2005). However, the two projectsthat have been submitted to be eligible under the CDM have provokedconsiderable debate.
At present, CCS technology is expensive, but further research anddevelopment could bring the costs down considerably. The EU ETS has setan incentive for the introduction of CCS on a large, commercial scale, butthe economic viability of CCS will depend to a great extent on the price atwhich CO2 allowances are traded. A recent report by the IntergovernmentalPanel on Climate Change (IPCC) (2005a) suggests that the use of suchtechnology would only be economic when CO2 prices rise above $25 to $30per metric ton. If technological costs remain high, new CCS technologiesare not likely to be introduced commercially.

Regulated and Energy-Intensive Sectors 65
A further major challenge of making CCS commercially viable is thedevelopment of a legal framework for CO2 storage. At present, there areno regulations relating specifically to long-term responsibility for storage,although some global and regional environmental treaties on climate changeand the marine environment may be relevant to the permissibility of CO2
storage (IPCC 2005a).
INTEGRATED OIL AND GAS INDUSTRY
At present, the oil and gas sector is undergoing profound structural changes.The globalization of the gas industry, the rise of new emerging market play-ers, and the worldwide reach of investors’ involvement have all contributedto the creation of a more competitive and complicated industry. At thesame time, companies within this sector are major emitters of GHGs, andas such are facing a number of challenges related to climate change risks.The industry is vulnerable to:
� Government mandates in areas such as gas flaring and facility abandon-ment.
� The direct impacts of adverse weather brought on by climate change(see Chapter 4).
� The shift away from oil toward natural gas in recent years, as naturalgas is viewed as a cleaner fuel from a climate change perspective.
� The political and legal risks that confront companies within the sectoras they seek new sources of reserves.
The major challenges in these areas are outlined below.
Government Mandates
� Gas flaring: Gas flaring is known to have a negative impact with respectto global warming and climate change. Nigeria and Angola, alone,account for approximately 15 percent of global gas flaring activity.To address this worldwide concern, West African governments haveagreed to cease flaring activities in 2008. The rise in the global liquefiednatural gas (LNG) industry has, however, allowed for an economicallybeneficial transition from flaring to exportation of LNG.
� Facility abandonment: The looming liability of decommissioningmature sites is expected to be significant as regulations governing theabandonment of facilities such as drilling platforms in the North Seacome into effect. However, such concerns have stimulated the industryto look at alternative uses for the platforms, such as offshore wind andwave power generation facilities (Ling et al. 2004).

66 CARBON FINANCE
Physical Capital
Volatile global weather conditions that are often associated with climatechange have increasingly been found to interrupt activities in major oil andgas production in such areas as the Gulf of Mexico. The 2002 and 2004hurricane seasons resulted in substantial losses of oil and gas productionin this region. Then in 2005, Hurricanes Katrina and Rita wrought bothphysical loss and economic damage to the oil industry in the Gulf of Mexico,damaging oil rigs, temporarily knocking out 95 percent of its oil refiningcapacity and 88 percent of its natural gas production, and causing some pro-duction and refining capacity to be completely shut down (Laidlaw 2005).Indeed, the devastation is considered to be the world’s first ‘‘integratedenergy shock,’’ which disrupted the flows of oil, natural gas, and electricpower simultaneously (Yergin 2006).
Restricted Access to Oil and Gas Reserves
The oil and gas industry is also facing growing challenges in its attempts togain access to new reserves. Political and legal risks have created uncertaintyin the Middle East and in many potential new sources, such as Russia andNigeria. In addition, increased energy prices have produced a resurgence ofnationalist policies in oil-producing countries, with a return to a 1970s styleof ‘‘resource nationalism.’’ Writing in the journal Foreign Policy, ThomasFriedman (2006) describes this inverse relationship between the price of oiland the pace of freedom as ‘‘the First Law of Petropolitics,’’ wherein theprice of oil and the tempo of democratic reform always move in oppositedirections in oil-rich states. This power shift has been observed recently invarious forms:
� The Bolivian and Russian governments have taken outright control ofoil and gas fields.
� Nigeria and Kazakhstan give highly preferential treatment to statecompanies over foreign installations.
� Ecuador seized the assets of Occidental Petroleum Corporation in May2006 and raised taxes on oil companies to 50 percent when prices goabove the levels stipulated in contracts.
� The Venezuelan government asserted its hold on 32 small oil fieldsdeveloped by foreign companies and increased taxes from 56.6 percentto 83 percent.
There is concern that states, intent on taking over their oil industries,often cut back on exploration and production by diverting their newfoundoil revenues to costly social, health, and education programs, as well as
Regulated and Energy-Intensive Sectors 67
other necessary reforms. Lack of reinvestment in the industry erodes bothexploration and production levels of the very resources that they are soeager to exploit. This effect has already been seen in Venezuela, where thegovernment cut its oil export target for 2006 by 100,000 barrels a day.
In addition, these actions threaten to drive away foreign capital andfuture private investments in the oil industry, precisely when they needit most. Friedman (2006) expresses a further concern that such a swingin Petropolitics could have far reaching implications for global stability.Japan, for example, being the world’s third largest consumer of oil (afterChina and the United States) is heavily reliant on oil imports. With nearly90 percent of its imports coming from the Middle East, Japan’s sourcesof supply becomes susceptible to Petropolitics, and may oblige Japan tooverlook the actions of petro-authoritarians, such as Iran and the latter’sdedication to nuclear technology (Barta 2006).
Further constraints to development and production of oil and gasreserves are found in the difficulty of reaching their sources in technicallyremote regions such as the Arctic and Asia-Pacific. Goldman Sachs estimatesthat over 70 percent of future energy assets will come from non-OECDcountries by 2012, up from 21 percent in 1970 and 42 percent in 2002 (Linget al. 2004). Such projects will require not only traditional geological andtechnical skills, but also the ability to work with diverse partners, nationaloil companies, host governments, and nongovernmental organizations. Thishas certainly been the experience of Niko Resources Ltd., a Canadiancompany from Calgary, in its pursuit of gas reserves in Bangladesh. Nikohas been involved in price disputes with the host government, and has had tomeet angry villagers’ demands for compensation for gases that were leakingout in the marketplace. In the aftermath of a blowout, it suffered lawsuits, afrozen bank account, verbal attacks by citizens, and daily denunciations bythe local media. Top executives at the company are quoted as saying that
it is of crucial importance to understand the political landscapewhen investing in a foreign country—and never to assume it issimilar to Canada. (York 2006)
The oil and gas sector has encountered other challenges in gaining accessto resources as communities in remote regions oppose increased productionin their effort to protect pristine areas and fragile ecosystems. Past troublesencountered by Texaco in Ecuador, and Shell in Nigeria, herald futuredifficulties within the sector. Present-day constraints in this respect are seenin the Arctic National Wildlife debate within the United States and theMackenzie River natural gas pipeline in Canada (Austin and Sauer 2002).
The transportation of oil and natural gas by tankers is also experiencingits own form of opposition. In Canada, Enbridge Inc.’s gateway pipeline

68 CARBON FINANCE
project is encountering resistance to the prospect of its ships (bulk-liquid car-riers) traveling through narrow channels off the coast of British Columbia, inorder to export its oil sands crude to China (Ebner 2006). On the Canadianeast coast, there is concern about the planned siting of an LNG terminal onthe U.S. Passamquoddy tribal lands adjacent to Eastport, Maine. Proposalsfor LNG plants have been considered and rejected in other locations onthe U.S. eastern seaboard because of their potential negative impacts ontourism. Now, the citizens of New Brunswick, Canada, are distressed aboutthe choice of the St. Croix River as an LNG facility location, because of theeffects of enormous tankers navigating through narrow Canadian territorialwaters. Head Harbor and the Canadian side of Passamaquoddy Bay holdgreat importance for the region, with its aquaculture, lobster and fishingindustries, and seasonal tourism (Norris 2005).
The Coming Age of Gas, and Beyond
Concerns over climate change and political instability in the Middle East,as well as advances in gas-to-liquid technologies, are seen to be drivingthe intensity of research and development in the gas sector. As previouslydiscussed, about three-quarters of global proven gas reserves are in theformer Soviet Union and the Middle East. Due to the political uncertaintyin these regions, it is felt that potential political risk in these areas may notattract the massive investment needed to develop these industries. This mayprovide one explanation for the emergence of Qatar as the Middle Easternkingpin of gas, while other areas such as Iran and Saudi Arabia remainlargely untapped (Economist 2004b; Saunders 2006).
In the United States, demand for gas is growing at just below grossdomestic product (GDP) levels, while oil demand growth is less than halfof that. Consumption of gas in that country is predicted to overtake oil asearly as 2015 as Americans seek a flexibility within their energy strategiesto alleviate energy sourcing concerns. In addition, an increasing focus onclimate change will accelerate this move to gas, since emissions from gasare 25 percent less than from oil, and 50 percent less than from coal (Linget al. 2004).
To date, LNG has been the focus of the gas industry in the UnitedStates, with LNG imports projected to increase every year at an averagerate of 8.6 percent. More recently, however, attention has been turningto gas-to-liquid (GTL) capacity (Box 3.2), notably in the Arabian emirateof Qatar, which has little oil but an abundance of natural gas. In 2006,Qatar Petroleum and South Africa’s Sasol opened a GTL facility thathas the capacity to transform Qatar’s abundance of natural gas into a

Regulated and Energy-Intensive Sectors 69
BOX 3.2 GAS-TO-LIQUID TECHNOLOGIES
AND STRATEGIC DIESEL FUEL
Gas-to-liquid (GTL) is a refinery process designed to convert naturalgas or other gaseous hydrocarbons into longer-chain hydrocarbons.The GTL Fischer Tropsch process can produce a high-quality dieselfuel from natural gases, coal, and biomass. Using such processes,refineries can convert some of their waste products into valuable fueloils, which can be sold as, or blended with, diesel fuel. This process isbecoming increasingly significant as crude oil resources are depleted,while natural gas supplies are projected to last another 60 years. Inaddition, GTL fuel can be blended with noncompliant California AirResources Board (CARB) diesel fuels to comply with more stringentdiesel standards in regions such as California.Source: Economist 2006d.
synthetic fuel similar to diesel. GTL diesel has a number of advantagesover LNG: Vehicles can run on it, it does not require as much dedicatedinfrastructure as LNG, it is cheaper to ship than natural gas, and it canbe shipped in normal tankers and unloaded at ordinary ports (Economist2006d). Although the GTL industry is in its infancy, recent data regardingthis middle-distillate process suggests that GTL could challenge traditionaloil refinery production. In addition, GTL’s capability of producing nearlyzero sulfur transportation diesel could accelerate the oil-to-gas transition.Thus, companies that dominate the global gas industry will have a distinctadvantage in the markets in the near future (Ling et al. 2004).
In the longer term, the focus of development in energy sources willbe in the area of renewables from wind, solar power, wave, and biomass,as outlined in Chapter 2. At present, wind is the renewable source that ismost economically viable. However, many energy companies have alreadymade substantial investments in a variety of renewable energy projects, inresponse to both national and regional policy initiatives.
� In the EU, the United Kingdom requires 10 percent of U.K. electricityto be supplied by renewable sources by 2010.
� The sustainable energy industry in Australia is growing at about 25percent per year (Innovest Strategic Value Advisors 2004).

70 CARBON FINANCE
� In the United States:� Over 20 states have adopted Renewable Portfolio Standards, which
mandate electricity suppliers to source a percentage of their powerfrom renewables.
� Fifteen states have special ‘‘benefit funds’’ for renewable energy andenergy efficiency.
� State policies for ‘‘net metering’’ have created markets for solar energyand other distributed generation.
� The Energy Policy Act (2005) renewed the Production Tax Credit forwind power and other renewables (Eckhart 2005).
� New policies have created a new status for fuel cell technologies.Connecticut, California, and Ohio, among others, have made signifi-cant financial commitments toward fuel cell development (Brooks andBarnett 2006).
Global Concerns Regarding Energy Security
The traditional interpretation of energy security had its beginnings duringthe 1973 oil crisis. Seen from energy-importing nations’ perspective, it wasdefined in terms of sufficient supplies at affordable prices, in the wakeof the disruption of oil supplies from producing countries. Viewed fromthe energy-exporting countries’ standpoint, ‘‘energy security’’ focuses on‘‘security of demand’’ for their exports, which generate the majority oftheir governments’ revenues. As discussed earlier in the chapter, politicaluncertainties have destabilized this confidence in some exporting countries,including Russia and Bolivia. More recently, power outages in NorthAmerica and Europe, as well as chronic shortages of electricity in India andChina, put a broader perspective on the meaning of energy security, both interms of geographic range and the entire energy chain.
The destruction of infrastructure in the 2005 hurricane season inthe United States presents another dimension of energy security, as largesegments of its oil production (27 percent) and refining capacity (21 percent)were shut down. It also illustrates how fundamental the power grid is to theoil industry, as some refineries were unable to function, not because theywere damaged, but because they lacked power to operate.
Thus, the definition of energy security must be expanded to acknowledgethe globalization of the system and to recognize not only a dependenceon secure and new sources of oil and gas, but also an understandingthat the entire energy supply chain and its infrastructure needs to beprotected (Yergin 2006).
Daniel Yergin of U.S.-based Cambridge Energy Research Associates sug-gests that, among other things, countries that are concerned about maintain-ing energy security must remain flexible and diversify their supply. In support

Regulated and Energy-Intensive Sectors 71
TABLE 3.4 The Relationship of the Cost of Oil andthe Development of Energy Sources
Cost of Fuel Viability of Energy Source
$80 Biodiesela
$60 US corn-based ethanola
$50 America’s shale oil$40 Canadian tar sands; Brazilian cane-based
ethanol; gas-to- liquidsb; coal-to-liquidc
$20 Conventional oil
aExcluding the impact of tax credits.bIf gas feedstock price is $2.50 or less per m BTU.cIf feedstock price is $15 per metric ton or less.Source: Economist. 2006c. Steady as she goes: Why theworld is not about to run out of oil. Economist, April22–28, pp. 65–67.
of his thesis, Yergin quotes Churchill, who shifted the power source forBritish naval ships from coal to oil during World War I, while maintainingthat ‘‘energy security lies in variety and variety alone’’ (Yurgin 2006, p. 1).
Despite the pessimism that exists in many countries regarding sources ofenergy and higher oil prices, the increase in cost does have the effect of mak-ing marginal opportunities for the development of alternate energy sourceseconomically viable, thus attracting increased investments. As Table 3.4illustrates, the feasibility of developing renewable energy sources is verymuch dependent on the price of oil. Unless the world experiences anotherprice collapse, as occurred in 1985 and 1998, renewables such as cellulosicand corn-based ethanol, along with other alternative energy sources, willbecome economically viable.
With changes in the economics of these energy sources, it appears thatunconventional sources can become conventional over time.
TRANSPORTATION
On a global scale, the transportation sector accounts for a major proportionof GHG emissions (see Figure 3.1). Within the sector, highway vehicles(passenger cars, light and heavy trucks) dominate both energy use and GHGemissions, with on-road transportation in the United States accounting for72 percent of both measures (Figure 3.3). Air transport places a distantsecond with 10 percent, followed by rail, marine, and other forms oftransportation.

72 CARBON FINANCE
Light Trucks 19%
Heavy Trucks 16%
PassengerCars 37%
Marine 5%
Aircraft 10%
Rail 2%
Buses 1%
Other 10%
FIGURE 3.3 Transportation GHG emissions by mode (2000)Source: Greene, D., and A. Schafer. 2003. Reducing Greenhouse Gas Emissions fromU.S. Transportation, Pew Center on Global Climate Change, www.pewclimate.org.
Automotive Industry
New regulatory pressures with respect to fuel economy and tailpipe emis-sions, along with rising consumer expectations for better fuel efficiency, haveplaced a competitive premium on auto manufacturers, who have developedstrategies to address these challenges. Due to the carbon profile of a typicalautomotive vehicle (Figure 3.4), the primary force felt by the industry is tolower the carbon intensity of passenger cars (gCO2/ km) while increasingfuel economy during the use of their vehicles.
Measures to encourage fuel efficiencies within the auto industry, seen inthe form of regulations, standards, taxes, and fiscal incentives, are being feltin the EU, Canada, China, Japan, Australia, and some regional markets inthe United States (see Table 3.5). In the European Union, the auto industryassociation ACEA1 signed a voluntary agreement with the government in1998 to have manufacturers reduce CO2 emissions on new passenger cars by25 percent by 2008, with a possible further 10 percent reduction by 2012. Atthe same time, all member states have imposed a tax on fossil fuels, creatingan incentive for car buyers to choose lower consuming vehicles (Mettler,Wellington, and Hartmen 2005). Both the Korean (KAMA)2 and Japanese(JAMA)3 Manufacturers Associations have similar agreements with ACEA,which have been altered with respect to target ranges and time horizon, to
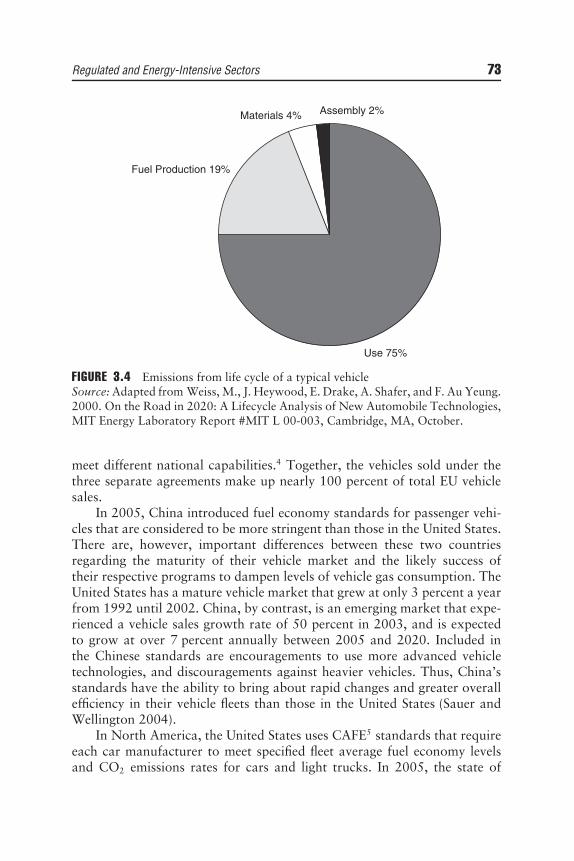
Regulated and Energy-Intensive Sectors 73
Use 75%
Assembly 2%Materials 4%
Fuel Production 19%
FIGURE 3.4 Emissions from life cycle of a typical vehicleSource: Adapted from Weiss, M., J. Heywood, E. Drake, A. Shafer, and F. Au Yeung.2000. On the Road in 2020: A Lifecycle Analysis of New Automobile Technologies,MIT Energy Laboratory Report #MIT L 00-003, Cambridge, MA, October.
meet different national capabilities.4 Together, the vehicles sold under thethree separate agreements make up nearly 100 percent of total EU vehiclesales.
In 2005, China introduced fuel economy standards for passenger vehi-cles that are considered to be more stringent than those in the United States.There are, however, important differences between these two countriesregarding the maturity of their vehicle market and the likely success oftheir respective programs to dampen levels of vehicle gas consumption. TheUnited States has a mature vehicle market that grew at only 3 percent a yearfrom 1992 until 2002. China, by contrast, is an emerging market that expe-rienced a vehicle sales growth rate of 50 percent in 2003, and is expectedto grow at over 7 percent annually between 2005 and 2020. Included inthe Chinese standards are encouragements to use more advanced vehicletechnologies, and discouragements against heavier vehicles. Thus, China’sstandards have the ability to bring about rapid changes and greater overallefficiency in their vehicle fleets than those in the United States (Sauer andWellington 2004).
In North America, the United States uses CAFE5 standards that requireeach car manufacturer to meet specified fleet average fuel economy levelsand CO2 emissions rates for cars and light trucks. In 2005, the state of

74 CARBON FINANCE
TABLE 3.5 Measures to Promote Fuel-efficient Vehicles around the World
Fuel Efficiency Approach Country/Region Measure
Fuel EconomyStandards
U.S., Japan, Canada,Australia, China,Taiwan, South Korea
Numerical standards inmpg, km/L or L/100 km
GHG emissionsstandards
EU, California g/km or gm/mile
High fuel taxes EU, Japan Tax 50%>crude oil baseprice
Fiscal incentives EU, Japan Tax relief based on enginesize, efficiency, CO2
emissionsR&D Programs US, EU, Japan Incentives for technology
and alternate fuelsEconomic penalties US Gas-guzzling taxTechnology
mandates andtargets
California Sales requirements forZEVsa
Traffic controlmeasures
Several U.S. states(hybrid HOV lanes)
Hybrids allowed in HOVb
lanes; ban on SUVsc
Paris (SUV ban)
aZEVs = California’s zero emission vehicles.bHOVs = high occupancy vehicles.cSUVs = sport utility vehicles.Source: An, F., and A. Sauer. 2004. Comparison of Passenger Vehicle Fuel Economyand Greenhouse Gas Emission Standards around the World. Pew Center on GlobalClimate Change, www.pewclimate.org.
California proposed its own set of GHG emissions standards for passengercars, and in some cases, sports utility vehicles (SUVs) and large trucks.New motor vehicles sold in that state would be required to cut GHGsby about 30 percent by 2017 (Minerva 2005). California’s plan to reduceemissions from automobiles appears to be spreading across the UnitedStates as a number of other states6 followed suit. However, automak-ers in California have sued that state, alleging that the regulations onfuel efficiency fall under federal purview. They also claim that stringentregulations would impose unreasonable cost increases to car buyers andimpede sales, because of the expensive technologies necessary to meet themandate.
Further in the United States, the Pew Center on Global Climate Change(2006) has recommended that transportation be included in U.S. GHGreduction policies, since transportation is responsible for one-third of all

Regulated and Energy-Intensive Sectors 75
that country’s CO2 emissions. In order to make the U.S. emission reductionprogram more comprehensive, the Center proposes the conversion of theexisting vehicular mileage standards into CO2 standards that would measurethe average CO2 emissions per mile for cars and light trucks. It suggeststhat manufacturers who ‘‘overachieve’’ would receive allowances that couldbe traded or banked. However, the report acknowledges that a system fortracking and reporting GHG emissions has to be established before such aplan would be viable.
Canada’s automobile industry has agreed to voluntarily follow theU.S. CAFE standards. However, the Canadian government has taken thestandards one step further in announcing its goal of reducing CO2 emissionsfrom all new passenger cars and light trucks by 25 percent by 2010 throughdecreased fuel consumption (Bustillo 2005).
It is difficult to make a direct comparison among different regions’and countries’ vehicular standards, since they differ not only in formand structure, but also in terms of stringency, levels of measurement andimplementation requirements (voluntary or mandatory) (see Table 3.6).Japanese and Chinese fuel economy standards are based on a weightclassification system where vehicles must comply with the standards fortheir weight class. By contrast, the fuel economy standards in the UnitedStates depend on vehicle type, while in Taiwan and South Korea they arerelated to an engine classification system (An and Sauer 2004).
By normalizing the different fleet average fuel economy levels of thesecountries and regions by CAFE cycles, An and Sauer (2004) have, however,
TABLE 3.6 Varying Global Vehicular Fuel Economy and GHG Standards
Country/Region Type Measure Structure Implementation
United States Fuel Mpg Car and light trucks MandatoryEU CO2 g/km Overall light-duty fleet VoluntaryJapan Fuel km/L Weight-based MandatoryChina Fuel L/100-km Weight-based MandatoryCalifornia GHG g/mile Cars and two categories
of light trucksMandatory
Canada Fuel L/100-km Car and light trucks VoluntaryAustralia Fuel L/100-km Overall light-duty fleet MandatoryTaiwan Fuel km/L Engine size MandatorySouth Korea Fuel km/L Engine size Mandatory
Source: An, F., and A. Sauer. 2004. Comparison of Passenger Vehicle Fuel Economyand Greenhouse Gas Emission Standards around the World. Pew Center on GlobalClimate Change, www.pewclimate.org.

76 CARBON FINANCEM
iles P
er
Gallo
n (
MP
G)
-C
on
vert
ed
to
CA
FE
Test
Cycle
2016201420122010200820062004200220
30
40
25
35
50
45
55
EU
Japan
California
Australia
US
China
Canada
FIGURE 3.5 Comparison of fuel economy and GHG emission standardsnormalized by CAFE-converted mpgSource: An, F., and A. Sauer. 2004. Comparison of Passenger Vehicle Fuel Economyand Greenhouse Gas Emission Standards around the World, www.pewclimate.org.
been able to demonstrate that the European Union and Japan have the moststringent standards, while the United States and Canada have the loweststandards, in terms of fleet-average fuel economy ratings. The new Chinesestandards are more stringent than those in North America and Australia,but less so than the EU and Japan. It also shows that when the CaliforniaGHG standards take effect, they would narrow the gap between the UnitedStates and the EU (Figure 3.5).
Factors Affecting Auto Manufacturers’ Carbon Profile
While a number of low-carbon technologies have been introduced into thetraditional internal combustion engine (ICE), other technological advancesare poised to challenge traditional gasoline vehicles and to improve anautomaker’s carbon profile (Economist 2004a). The current popularity ofdiesel-fueled cars has resulted in some pollution reduction. Over the nextdecade, alterations in fuel mix and improved fuel efficiency, as well as somelow-carbon innovations in diesel, hybrids, and fuel cell technology, havethe potential to alter the competitive balance of the entire auto industry(Figure 3.6). With a view to the longer term, several auto manufacturershave established external partnerships and alliances that provide them withgreater access to these new technologies.

Regulated and Energy-Intensive Sectors 77
Fuel Cells
Internal CombustionEngine (ICE)
IncrementalTechnologies
DieselTechnologies
HybridTechnologies
Up to 2015 Post 2015
Timeline of Changes in Vehicular Technologies
FIGURE 3.6 Timeline of changes in vehicular technologiesSource: Minerva, L. 2005. Presentation at Climate change and Investment Confer-ence, London, June 6–7.
From a fuel efficiency perspective, the use of biofuels (Box 3.3) holdssome promise, having been already used for cars in countries in North andSouth America, as well as those within the European Union. The currentsurge in interest in biofuels is due to a number of governmental targets andincentives in the EU and North America that can be met by blending smallamounts of biofuel with conventional fuels. In Europe, tax incentives wereintroduced for biofuels in 2003, in order to make them more competitive.The same year, the Biofuels Directive set targets for EU-wide biofuel useof 2 percent by December 2005 and 5.75 percent by December 2010, andcalled on member states to do the same. To date, France, Austria, andSlovenia have introduced mandatory requirements for fuel suppliers to sella certain percentage of biofuels.
The U.S. 2005 Energy Bill included, for the first time, a set of manda-tory national transportation targets, requiring fuels to include a certainpercentage of biofuel. The Energy Bill also provides for a trading scheme,so that fuel suppliers can sell credits to firms that have not reached theirrequired level. One advantage of such a mandatory system is that it canfavor more environmentally friendly forms of biofuel production. The U.S.Energy Bill’s fuel standards, for instance, suggest that two and a half creditsbe awarded for every gallon of cellulose-based ethanol against one creditfor the corn-based fuel. Within the United States, states such as Minnesotarequire E20 as a minimum (20 percent ethanol mixed with 80 percent gas).
From an environmental perspective, not all biofuels have equal merit inreducing GHGs (see Figure 3.7) because the amount of energy required in itsproduction varies with the feedstock used. Cellulosic feedstock, for instance,can produce ethanol with very low well-to-wheels7 GHG emissions, since

78 CARBON FINANCE
BOX 3.3 THE CONCEPT AND USE OF BIOFUELS
Bioethanol, which is chemically identical to other forms of ethanol,can be derived from sugar cane, grain, corn, and straw. More recently,biodiesel, which is derived mainly from vegetable oil, has also beendeveloped. The use of these products, referred to collectively as bio-fuels, provide well-to-wheels7 GHG reductions on the order of 20percent to 50 percent compared to petroleum fuels.
The concept of running cars on freshly harvested plant materialrather than the fossilized version is not new. In fact, in the early part ofthe twentieth century, Henry Ford designed his Model T motor car torun on ethanol distilled from grain, as well as gasoline. In the 1970s,Brazil’s response to the oil crisis was to fuel cars with ethanol madefrom sugar cane.
One form of biofuel that is gaining increasing global attention isthat of cellulosic ethanol, which is derived from waste products suchas wood chips and agricultural debris, rather than from valuable cropssuch as corn. The production method for this type of feedstock usespowerful catalysts and enzymes to speed up the natural fermentationprocess of the cellulose. In his 2006 State of the Union address,U.S. President George W. Bush extolled the virtues of bioenergy, andpromised to boost spending in support of new technology, which isdesigned to develop cellulosic ethanol to a commercial level withinsix years. Cellulosic biofuels are predicted to supply two-thirds ofmotor-fuel needs by the year 2050.Source: Bulleid 2006; IEA 2004; Economist 2005a, 2006a, 2006b.
it can use the noncellulose part of the plant (or lignan) as an energy sourceinstead of fossil fuels.
There is also a geographic disparity between regions of supply, wherebiofuels can be produced at the lowest cost, and regions of demand wherethe use of biofuels is increasing rapidly. The cost of producing bioethanol isless in tropical, developing countries where land and labor costs are lower,than in the more temperate, developed nations where energy requirementsfor production and refining are high. Within the EU, for example, thereis a mix of sources of biofuel, with countries such as Spain dependingon domestic production, while Sweden imports most of its ethanol fromBrazil. The geographic and economic discrepancies for production do createopportunities for a potentially significant new source of international trade.
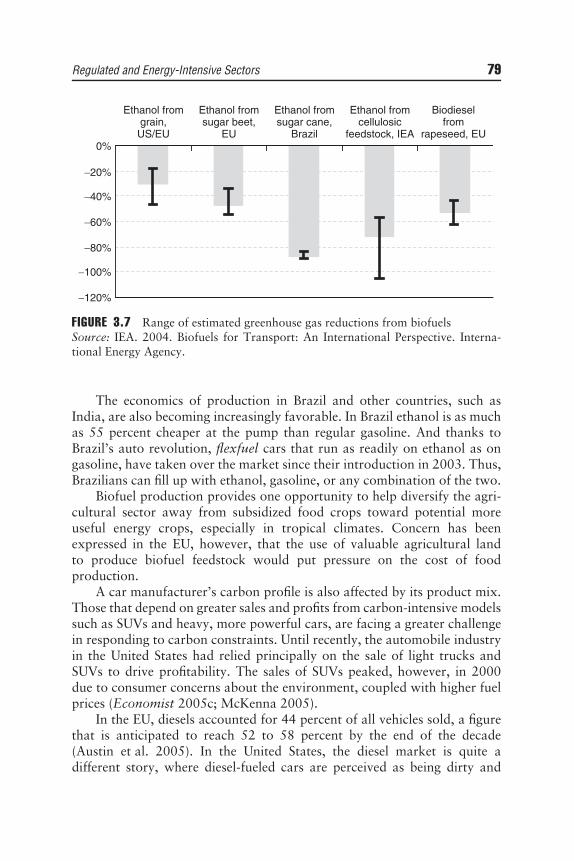
Regulated and Energy-Intensive Sectors 79
−120%
−100%
−80%
−60%
−40%
−20%
0%
Ethanol from grain,US/EU
Ethanol from sugar beet,
EU
Ethanol from sugar cane,
Brazil
Ethanol from cellulosic
feedstock, IEA
Biodiesel from
rapeseed, EU
FIGURE 3.7 Range of estimated greenhouse gas reductions from biofuelsSource: IEA. 2004. Biofuels for Transport: An International Perspective. Interna-tional Energy Agency.
The economics of production in Brazil and other countries, such asIndia, are also becoming increasingly favorable. In Brazil ethanol is as muchas 55 percent cheaper at the pump than regular gasoline. And thanks toBrazil’s auto revolution, flexfuel cars that run as readily on ethanol as ongasoline, have taken over the market since their introduction in 2003. Thus,Brazilians can fill up with ethanol, gasoline, or any combination of the two.
Biofuel production provides one opportunity to help diversify the agri-cultural sector away from subsidized food crops toward potential moreuseful energy crops, especially in tropical climates. Concern has beenexpressed in the EU, however, that the use of valuable agricultural landto produce biofuel feedstock would put pressure on the cost of foodproduction.
A car manufacturer’s carbon profile is also affected by its product mix.Those that depend on greater sales and profits from carbon-intensive modelssuch as SUVs and heavy, more powerful cars, are facing a greater challengein responding to carbon constraints. Until recently, the automobile industryin the United States had relied principally on the sale of light trucks andSUVs to drive profitability. The sales of SUVs peaked, however, in 2000due to consumer concerns about the environment, coupled with higher fuelprices (Economist 2005c; McKenna 2005).
In the EU, diesels accounted for 44 percent of all vehicles sold, a figurethat is anticipated to reach 52 to 58 percent by the end of the decade(Austin et al. 2005). In the United States, the diesel market is quite adifferent story, where diesel-fueled cars are perceived as being dirty and

80 CARBON FINANCE
noisy. A further disincentive to buying diesel is that the United States lacksthe infrastructure to support this form of vehicular energy. Even in theUnited States, diesel does, however, have the potential to grow significantly.
Finally, taxes and fiscal incentives used in combination with fuel econ-omy and GHG standards, as discussed above (Table 3.5), promoted anincrease in fuel-efficient vehicles and have created a change in consumerpreferences. Higher fuel taxes in the EU, for example, are considered tohave contributed to the increase in small and fuel-efficient vehicle models inthe EU market, as well as to fewer vehicle miles traveled. At the same time,the diesel market share increased significantly in the United Kingdom, afterthe car tax on CO2 emissions were raised from 18 percent to 27 percent in2002. California’s zero-emission vehicle (ZEV) mandate is thought to haveencouraged a large increase in research and development efforts in electricand hybrid cars, which switch between electric and conventional motors.New hybrid cars from Honda and Toyota are proving to be increasinglypopular.
Aviation
In the last three decades of the twentieth century, a number of technologicaland operational efficiencies were made in commercial air travel that resultedin significant reduction in energy and carbon intensity within the industry.These gains, however, were offset by the rapid increase in air travel overthe same period. Within the EU, overall CO2 emissions fell by 5.5 percentin the 1990s. What is notable, however, is that CO2 emissions from theinternational aviation sector of its 25 member states increased by 73 percentin the same period, and are projected to rise by 150 percent by 2012,according to the European environment commissioner. Domestic flightswithin the EU accounted for 0.8 percent of the total EU GHG inventory in2003. If emissions from international flights were included, aviation’s sharewould increase to 3.3 percent (CE Delft 2005; Greene and Schafer 2003;IIGCC 2003; Lancaster 2005).
The aviation industry experiences a number of complexities with respectto carbon emissions, which are sector specific. One major complicationarises from the fact that aviation’s contribution to total radiative forcing8
is proportionately greater than its actual emissions, due to the fact thatairplanes’ emissions of GHG take place at higher altitudes than otherindustries that emit at surface level. A multiple of 2.7 is often used asa conversion factor for this effect (IIGCC 2003). A further issue for thisindustry is the effects of non-CO2 emissions on climate. In addition to CO2,emissions from flights also include nitrogen oxides (NOx) and vapor trails(contrails) all of which contribute to global warming. On the positive side,

Regulated and Energy-Intensive Sectors 81
the industry has held one advantage, however, since it has been exemptfrom paying tax on fuel.9
To date, aviation has been excluded from the EU ETS. However, theEuropean Parliament has been considering forms of fiscal measures to reduceemissions and manage increased demand over the next five years, and iscurrently examining ways of bringing this industry into the second phase(2008–2012) of its emissions trading scheme. Fuel and ticket taxationalong with emissions trading and charges are among the policy optionsunder consideration. In May 2006, the EU Environmental Committeeproposed a stand-alone trading scheme for aviation that would run inparallel with, but be separate from, the EU ETS. Along with the allocationof allowances, the proposal calls for a tax on jet fuel, the ending of VATexemptions for air transport, and for some policy instruments to cover thenon–carbon dioxide components of aviation that also have climate impacts.The proposed scheme would coincide with Phase One of the Kyoto Protocol(2008–2012) and would cover all flights to and from EU airports (CarbonFinance 2006b).
The reasons for considering a separate ETS for aviation are fourfold:
1. Aviation is anticipated to be a net buyer of allowances which couldhave a significant impact on the price of carbon and trigger demands byother sectors for a looser cap on their emissions.
2. The Kyoto Protocol does not cover international aviation, so that anyEU allowances allocated for it would not be backed by AAUs.
3. The 2008 date for starting the stand-alone scheme is earlier than currentdates that are anticipated for aviation to join the EU ETS.
4. There are concerns over aviation’s non-CO2 contributions to globalwarming (vapor trails and nitrogen oxide emissions) not being takeninto account by the EU ETS (Carbon Finance 2006b).
However, support for aviation joining the ETS is not unanimous.Although it was well received by some within the sector, such as BritishAirlines, it was slammed by aviation’s trade association, IATA10 (Lancaster2005). Opinions also differ as to its impact on allowance prices. Industriesoutside the transportation sector fear that aviation would be net buyers ofallowances, causing the price of carbon to rise, which in turn would have aneffect on major energy consumers (European Commission 2005). A reportfrom the Centre for European Policy Studies supports this concern andargues that the inclusion of aviation in the EU ETS could have a significantimpact on allowance prices. It states that the sector would need to buy 1 to2 percent of the total allowances available in the market, the same amountthat this market is expected to be short in Phase One (2005–2007), thus
82 CARBON FINANCE
affecting the price considerably (CEP 2006). Others anticipate that the costof aviation joining the ETS will be modest, adding perhaps an additional¤9 ($11) per return flight, depending on the strictness of the cap and onthe individual airline’s emission levels, and that about 1 percent of the totalallowances available in 2012 in the ETS would be bought by the aviationsector (CE Delft 2005; Lancaster 2005).
Unilateral action by the EU to include aviation in its ETS is seen as aproblem for the industry. The first concern is that low cost carriers face thebiggest financial risk. In addition, since the scheme would apply to domesticcarriers whose flights are entirely within the EU, these airlines would also bedisadvantaged, compared to carriers with more globally diversified routes.The nonequivalence of emissions at higher altitudes compared to thoseat ground level, as described above, is also seen to create a problem offungibility within the trading scheme.
CEMENT
Building material manufacturers are feeling the pressure to adapt theirprocesses and product characteristics to meet new and more stringent envi-ronmental demands. Within the broad spectrum of construction industries,cement production is estimated to contribute 5 percent of global man-madeCO2 emissions (see Figure 3.1). Cement, and the concrete made from it,provides the basis for most infrastructures. Its use is growing rapidly in thedeveloping world, and, indeed, after water, concrete is the planet’s secondmost used material globally (WBCSD 2005).
The manufacture of cement involves the quarrying of limestone, theuse of energy to convert the limestone into clinker, and the emission ofpollutants, principally CO2. Fifty percent of these emissions stem fromchemical changes that take place in raw materials (as limestone is convertedto clinker), and 40 percent from fuel combustion. The remaining 10 percentis divided between electricity use and transportation (see Figure 3.8).
Since demand for cement is predicted to grow by 50 to 80 percent overthe next two decades, cement manufacturers will have to reduce emissionsby 30 to 40 percent per kilogram of cement in order to meet long-termKyoto targets (WBCSD 2005). In 1999, the World Business Council onSustainable Development (WBCSD), partnered with cement companies toinitiate the Cement Sustainability Initiative (CSI). Its goal is to address anumber of environmental and social issues, the foremost among these beingemissions reductions, principally CO2.
Cement manufacturers can improve their carbon profile through bothprocess and input changes. The process of making clinker as an intermediate

Regulated and Energy-Intensive Sectors 83
Electricity and Transport 10%
Fuel 40%
Calcination 50%
FIGURE 3.8 CO2 production from the cement industrySource: WBCSD 2005. The Cement Sustainability Progress Report. World BusinessCouncil for Sustainable Development, Geneva, www.wbcsd.org.
product in cement production is highly carbon intensive. The amount ofclinker content needed can be reduced if mineral rich by-products fromother production processes, such as fly ash (from coal-fired power stations)and slag (from blast furnaces) are incorporated into the product. However,customers perceive this form of low-clinker cement as being of inferiorquality, and have used it sparingly to date.
From a process perspective, there are currently two ways of makingcement, each of which has a different energy requirement. The current, mostwidely used wet process consumes nearly twice as much fuel as the newerdry (precalciner) technology. However, changing the process is an expensiveproposition, and scarcely justifiable if savings on fuel expenses are the onlygoal. Another opportunity exists from an energy recovery perspective, sincecement kilns can use nonhazardous waste and biofuels as sources of energy.In Norway, cement kilns have been the preferred method of nonhazardouswaste management for the past 10 years (WBCSD 2005).
Issues regarding the management of imports and exports in the cementindustry depend very much on the price of carbon. Cement imports fromproduction in non-EU countries hold a significant portion of the EU marketand create a cap on cement sales price within the EU. This keeps theselling price of cement down and inhibits EU producers from recoupingtheir rising costs attributed to the ETS. From an exporter’s perspective, EU

84 CARBON FINANCE
seaborne cement exports become less economical with CO2 prices of ¤23/tas witnessed in the first phase of the EU ETS (2005–2007). A change in ratioof cement imports to exports has been suggested in order to improve cementproducers’ financial positions. At this price of carbon, EU companies couldreduce production and sell the CO2 allowances gained from the cutback.However, companies that hold excess capacity in operations outside the EUstand to benefit if the price of CO2 rises above ¤23/t (DrKW 2005).
COMPETITIVE IMPLICATIONS OF CLIMATE RISK IN
REGULATED AND ENERGY-INTENSIVE SECTORS
Several institutions have explored the financial implications of carbonconstraints on a selection of global industries. Table 3.7 summarizes theresults of some of these studies. In all cases, the positive upper limits offinancial impacts capture the opportunities that exist for companies tocapitalize on proactive carbon management within each industry, whilethe lower negative limits reflect the risks for each sector within a carbonconstrained economy.
The impacts of carbon have been related to a variety of financial metrics,each of which highlights a different dimension of the carbon managementchallenge:
� Undisclosed environmental liability contributes to shareholder valuerisk.
� Examining a company’s carbon profile in terms of earnings before inter-est, tax, depreciation, and amortization (EBITDA) shows the company’sability to withstand the impact of internalizing carbon costs, and thusis a commonly used measure of profit.
� The use of market capitalization allows investors to see how muchcarbon is associated with dollars invested (Henderson 2005b).
Policy impacts on the utility sector have been examined both in Europeand the United States. Within the European Union, the introduction ofthe ETS is seen to create a windfall for some utilities and to affect othersadversely, depending on allocation of emissions permits and the cost ofCO2 allowances. In the examination of different scenarios, researchersat Dresdner Kleinwort Wasser (2003b) consider that there will be littledownside for utilities under the EU ETS, while analysts at UBS (2003)suggest some utilities will suffer under a tighter scenario, with positiveequity valuations for others. Using a scenario approach to look at companyprospects, UBS found that coal-based utilities, such as RWE, faced an

Regulated and Energy-Intensive Sectors 85
TABLE 3.7 Financial Impacts of Carbon Constraint on Regulated andEnergy-Intensive Sectors
Range of FinancialIndustry Scope Risk impact (%)
Electric utilitiesEU1
Largest Europeanutilities
EU tradingscheme
> 20% to 0% ofmarket cap
Electric utilitiesEU2
10 large Europeanutilities
EU ETS +57% to −22%SHV
Electric utilitiesU.S.3
26 U.S. companies Regulatoryuncertainty
5 to 50% market cap
Oil and gas4 16 oil and gascompanies
Climate policiesand restrictedaccess toreserves
+2% to −11% SHV
Automotive5 10 automotivecompaniesforecast for2003–2015
Regulations inEU, UnitedStates, andJapan
Estimated EBIT from+9 to −10%
Aviation EU6 Air PassengerDuty Tax –9 to −17% earnings
EU emissionscharge –20 to −28%
earningsCement industry
United States718 companies EU ETS 0 to −13% SHV
Sources: 1. Dresdner Kleinwort Wasser 2003b; 2. UBS 2003; 3. Innovest 2004;4. Austin et al. 2005; 5. Dresdner Kleinwort Wasser 2003a; 6. Austin and Sauer2002; 7. Dresdner Kleinwort Wasser 2004.
uncertain future, with a spread of 70 percent in valuations. By contrast,British utility Scottish and Southern Energy (SSE) was stable with positiveupside in all four scenarios, because it would receive a windfall benefit fromfree emissions allowances. In looking at the U.S. electricity sector, Innovest(2004) indicates that, even under a relatively conservative scenario, up to5.1 percent of market capitalization could be at risk from the consequencesof climate change without appropriate risk management. Under a higher,but still plausible, risk scenario, their calculations indicate that this riskfigure could become 10 times greater.
An array of issues including regulations, energy demands, investorconcerns, supply security, plus environmental and price pressures, are allplacing demands on U.S. utility companies. Investment pressure on utilitycompanies is increasing as investors express their concerns about regulatory

86 CARBON FINANCE
uncertainty and price volatility facing the industry. Within the industry,concerns about security of supply are also spreading. Lack of investmentin infrastructure has been identified as the leading cause of recent supplyfailures (blackouts) in the United States. At the same time, Europeancompanies become further involved within the Asia-Pacific region, Russia,and the former Soviet Union countries, in their hunt for gas and in their desireto build a presence in these emerging markets (PricewaterhouseCoopers2005). The European Union, however, has renewed concerns regardingsecurity of supply, as Russia’s Gazprom announced on January 1, 2006,that it was going to shut down the pipelines that supply Ukraine and westernEurope with natural gas.
In study of the oil and gas sector, the World Resources Institute (2004)found systematic differences in earnings as companies responded to twomajor issues in the coming decade: first, the policies designed to combatclimate change, which will have an impact on market demand and producerprices for crude oil, natural gas, and petroleum products; and secondly,the industries’ restricted access to oil and gas reserves, due to politicalinstability or community opposition to industry development. The scenariostudy anticipated impacts on companies’ earnings in this sector to vary frommarginally positive to a decline of −5 percent, depending on their oil-gasmix, their position in the value chain, and the location of operations andsales.
Using a scenario approach in a study of 10 companies in the automobileindustry, the World Resources Institute (Austin et al. 2005) found significantdifferences of exposure. Honda emerged as having the smallest immediaterisk from carbon constraint, due to its less carbon-intensive product mix(including hybrids). BMW had the largest risk. Toyota was ranked highest inits carbon management strategies, mainly because of its hybrid technology.The analysts concluded that the effect of carbon constraints on individualcorporate earnings (EBIT) ranged from an increase of 9 percent to a declineof −10 percent. These findings reflect, not only the manufacturers’ responseto regulations and consumer pressure, but also to energy price increases andmarket pressures in key emerging markets, such as in China. The reportstates further that a company such as Toyota, with its strong technologicalresearch in hybrid and other technologies, would have a distinct advantagein every scenario.
Also within the transportation sector, aviation is anticipated to incurfinancial challenges, with the degree of decline in earnings depending onincreases in air passenger duties and the application of emission charges.These impacts are expected to vary depending on fleet size and whethercompanies are short- or long-distance operators (Austin and Sauer 2002).A DrKW study (2004) of the impact of EU ETS on the cement industry

Regulated and Energy-Intensive Sectors 87
resulted in a reduced target share price on 8 out of 18 companies in thesector by up to 13 percent. Emissions from cement manufacture currentlyaccounts for 5 percent of global emissions and are growing at 4 percent peryear.
CONCLUSION
Sectors with high levels of carbon dioxide emissions are feeling the effectsof climate change policy measures. Energy industries have been identifiedas ‘‘large final emitters’’ by Canadian, British, and European regulators.Although the United States is not a signatory to the Kyoto Protocol, manystate-level initiatives have evolved that affect the energy sector. The trans-portation sector, which provides energy-consuming products, is also affectedby measures that have been taken, or are being considered, by numerousgovernments. Recent studies indicate that there are winners and losers withineach industry, where some companies have much larger financial exposuresthan others, either because of differences in asset base, voluntary measuresthey have undertaken, or other factors. The exposure of some companies isundoubtedly ‘‘material’’ within the meaning of the SEC disclosure rules (seeChapter 5). Carbon management strategies within carbon-regulated andenergy intensive sectors do, then, influence the competitive balance withinindustries, and as such, hold significant implications for carbon finance.


CHAPTER 4The Physical Impacts of Climate
Change on the Evolutionof Carbon Finance
INTRODUCTION
Economic activities whose greenhouse gases (GHGs) are already subjectto regulation (as discussed in the previous chapter) will be referred to ascarbon-regulated. However, many other economic sectors, which do not facethe imminent prospect of having their GHG emissions regulated, will stillbe closely involved in the evolution of climate change and the evolution ofcarbon markets. Some sectors—specifically forestry and agriculture—couldbecome important suppliers of carbon credits. Others may seek to protectthemselves from adverse weather by buying weather derivatives, the priceof which will also be influenced by the price of carbon credits. (The linkagebetween these markets—the weather market and the carbon market—isdiscussed in Chapter 8.) In the European Union (EU), any company canregister as a trading entity in the carbon market. Thus, although thischapter is mainly concerned with the physical impacts of climate change onvarious sectors of the economy, it also serves to assess the effect of theseimpacts on the evolution of carbon finance. The world of carbon financeis a world in which many economic sectors are trying to adjust to climatechange, even if they do not necessarily make use of the new products directlyassociated with the trading of carbon credits.
Obviously, this chapter is only indicative of the impacts that have eitherbeen observed already or are expected to occur. It is not possible in a workof this scope to make an exhaustive assessment of the economic impactsof climate change. For a more comprehensive survey, reference should bemade to the latest output from the Intergovernmental Panel on ClimateChange (IPCC 2001, 2005b).
89

90 CARBON FINANCE
At this point we should add that the physical impacts of climate changemay damage the adaptive and mitigative measures we may take to reducethose various impacts. For example, hurricanes may damage wind farms,while drought will reduce the effectiveness of biomass sequestration ofcarbon through forestry and agricultural change. These physical impactscould therefore reduce the effectiveness of carbon trading as a strategy forslowing the pace of climate change.
The order in which various sectors are assessed in this chapter is basedon the magnitude of their direct physical vulnerability to climate change,beginning with water, food, and fiber, which are sensitive even to smallshifts in temperature and precipitation. Next, we assess the vulnerabilityof physical property, such as housing, production facilities, the touristindustry, and infrastructure. Finally, the chapter analyzes the ramificationsof these vulnerabilities for the financial services sector, focusing on banking,investment, and insurance. This is by no means an order that reflects theimportance of climate change and carbon finance for these various sectors. Ina sense, we have saved the most affected sector for the last in this sequence,as the insurance industry absorbs a large percentage of the accumulatedlosses suffered by all the other sectors. Furthermore, the insurance industryhas a major role to play in the development of carbon markets, both as aninsurer of this new trading activity (such as counterparty risk) and as aninvestor in the assets (such as carbon credits) produced by carbon markets.
Other accumulators of these various impacts are human health andsecurity. Because of the fundamental nature of this concern, we havedevoted Chapter 7 to the topic.
PHYSICAL IMPACTS ON UNREGULATED SECTORS
Water Supply and Treatment
It could be argued that the water supply and treatment industry is thehuman activity most immediately affected by climate change, given its directdependence for its raw material on everyday experience of precipitation andtemperature. In their response to the Third Carbon Disclosure Project, thedirectors of RWE, the utilities conglomerate, stated:
For our water business, adaptation to climate change is a majorchallenge. More uneven distribution (of water) together with a risein temperatures will lead to serious concern over availability ofsufficient water supplies. If the expectation of society to achieveprogressively higher quality standards is maintained, this could leadto additional use of energy and higher emissions, notwithstanding

The Physical Impacts of Climate Change on the Evolution of Carbon Finance 91
that technology success might be able to reach higher efficiencygains. (Kiernan and Dickinson 2005)
One thing that is certain about climate change is that it will injecta great deal of uncertainty into our lives, especially those whose livesrelate to the production of weather-dependent products, like drinkingwater. In the water supply business—if customers expect the same degreeof reliability that they have enjoyed in the past (admittedly only in thericher, industrialized economies)—then that expectation translates directlyinto additional investment in water supply infrastructure, beginning withstorage capacity and including loss reduction in distribution. One of themost predictable consequences of living in a carbon-constrained world willbe ongoing heavy investment in water supply and treatment.
For example, Britain enjoys a temperate climate with prevailing westerlywinds bringing a constant stream of moist air from the cool waters ofthe North Atlantic. Yet even Britain is experiencing uncertainties andshortages of water supply, as evidenced by the unexpected drought inYorkshire in 1995 (Bakker 2000). At the time, the leading hydrologists andmeteorologists in Britain were reluctant to link this unusual event to climatechange. As Yorkshire Water Services had recently been privatized and thecompany had returned millions of pounds of profit to its parent holdingcompany (Yorkshire Water plc.), public opinion preferred to blame the newmanagement for the shortage, for which the regulators had provided plentyof warning.
Whatever the rights and wrongs of this particular case there is alreadygreater uncertainty for water supply—even in a temperate country likeBritain—and that uncertainty will require substantial, ongoing investmentin the decades ahead. An interesting example of the degree to whichthe situation has changed is provided by the proposal to build a waterdesalination plant to meet the future needs of London! Note: This is not aproposal for Bahrain or Malta. Thames Water plc. tabled the proposal inthe summer of 2005 as an essential part of their plan to meet the anticipatedneeds of the projected increase in population in the region known asthe Thames Gateway, the lands downstream of London, adjacent to theThames. Even before the government water regulators could respond to theproposal, the Mayor of London, Ken Livingstone, dismissed it completely,proclaiming it to be ‘‘the wrong way to go,’’ because the days of supply-sidemanagement were over, and the future lay in ‘‘demand-management,’’ thatis, conservation and reduction in water use.
Thus, it seems very likely that increasingly we will be living in a water-constrained world, as well as a carbon-constrained world. Companies thatmight prosper under these conditions will be low-carbon companies and

92 CARBON FINANCE
Agriculture 15%
Rest of GlobalGHGs 85%
A. Subsector B. Gas
Soils (N2O)
EntericFermentation(CH4)
Rice (CH4)
Energy-Related (CO2)
Manure Mgmt (CH4)
N2O
CO2
CH4
40%
27%
10%
9%
7%
46%
45%
9%6%Other (CH4, N2O)
FIGURE 4.1 GHGs from agricultureSource: Baumert, K., T. Herzog, and J. Pershing 2005. Navigating the Numbers:Greenhouse Gas Data and International Climate Policy, World Resource Institute,available at www.wri.org.
will use water and energy as efficiently as technology allows. If the futurealso sees the gradual removal of subsidies and the freer play of marketforces, it is likely that prices for water, energy, land, and other commoditieswill rise, at least in the short term.
Agriculture
GHG emissions from agricultural activities account for approximately 15percent of global GHG emissions (Figure 4.1), but with a different emissionsprofile than other sectors. Methane (CH4) and nitrous oxide (N2O) makeup about 90 percent of agricultural GHGs, with CO2 from burning fossilfuels and electricity use contributing the remaining amount. Agriculturealso contributes CO2 to the atmosphere through the clearing of land andthe burning of biomass. On the economic front, agriculture accounts forbetween 15 and 23 percent of gross domestic product (GDP) and overhalf the workforce in countries such as China, India, and Indonesia, whilecontributing only between 1 and 4 percent of GDP and employment inindustrialized countries. Thus, considerations of carbon finance play animportant role in the agricultural sector, above all in developing countries.
From the operational perspective, the public in the richer countriestend to take their agricultural water supply for granted because it hasbeen provided cheaply and reliably for many decades. The same public,however, is acutely aware of the vulnerability of agriculture to climateuncertainty because the impacts are more visible, even if those impacts canbe circumvented by consumers by seeking alternative sources of supply.

The Physical Impacts of Climate Change on the Evolution of Carbon Finance 93
Under climate change scenarios the greatest impacts that agriculturalpractices contribute are the greenhouse gases emitted from crop productionand soil management. Physically, the greatest risks arise from heat wavesand the attendant drought. Among weather-related disasters, this hazardproduces the biggest financial losses in the rich countries and the greatestloss of life in the poor countries. A worsening trend should be assumedunder climate change. Even those regions that may appear to benefit fromhigher rainfall are likely to be net losers, as higher temperatures will increasethe rate of evaporation from the soil.
How will carbon finance affect this situation? First, there is a greatopportunity for some farmers to benefit by changing their agriculturalpractices, in order to reduce emissions. This can be achieved by shifting tominimal tillage of arable land, or by changing their crop lands to pastureor forestry (crop switching). Several American states, such as Nebraska,have passed legislation to encourage this transition (Baumert, Herzog, andPershing 2005).
Farmers may also benefit by selling or renting their land to windfarms, which are highly compatible with retaining the land in pasture,as the footprint of a wind turbine requires less than 5 percent of theland it occupies. Like carbon sequestration, this transition requires theencouragement of legislation, such as the Renewable Energy Requirementin Texas, which ‘‘required 2,000 MW of new renewable energy to be builtin the state by 2009’’ (Pew Center on Global Climate Change 2005a). It ishoped that carbon credits and renewable energy credits will become fullyexchangeable (or fungible) as the carbon markets mature, thus providinggreater liquidity and opportunities to embrace an integrated carbon strategy,rather than pursuing a single operation.
The development of weather derivative markets also provides an oppor-tunity for transferring some of the weather risk from farmers to the capitalmarkets at an affordable cost. The three main challenges associated withthis development of weather derivatives in low-income countries are: Lackof weather data, lack of a local insurance market to provide the commercialinfrastructure and assume the risk, and the basic risk inherent in using anindex as a proxy for actual loss incurred. These problems are being tackledin experimental projects funded by the World Bank.
The agricultural sector is typified by its decentralized nature, comprisingmany loosely organized individuals, small firms, and a few multinationalcorporations. In addition, agricultural practices vary, not only by crop andlivestock type, but by soil quality and ecosystem characteristics. Thus, oneproblem in understanding the actual and potential role of the agriculturein carbon finance is the lack of uniform information found in corporatestrategies of other sectors, which is comparable to the data provided by

94 CARBON FINANCE
FT500 to the Carbon Disclosure Project. Since farming in many countries isquintessentially small enterprise, it is unlikely ever to enter the FT500. Also,some global agricultural companies, such as Cargill, are privately held andtherefore not publicly traded.
Forestry
Like agriculture, the forestry sector is local in nature yet subject to globalforces of demand and trade. Forest products, such as timber, rubber,bamboo, and palm oil, are estimated to contribute about 1.2 percent ofworld GDP (Baumert, Herzog, and Pershing 2005). Land-use change withinthe forestry sector, which creates a flux of greenhouse gases (Figure 4.2), isdifficult to characterize at the global level.
Physically, although the greatest losses from heat and drought fall onagriculture, the most dramatic losses—through fire—occur in forestry. Thenatural role of fire in producing a healthy forest has long been acknowledged,although this is a difficult process to simulate and control. Instead, in thericher countries, the usual policy is to suppress fires whenever possible,once they threaten human settlements. In some rich regions, like southeastAustralia, western Canada, and the western United States, this appears to be
Billions of tons of CO2
−6
Afforestation
Slash
−4 0 2 4 6 8
Deforestation
Reforestation
RegrowthHarvest/
Management
Fire Suppression
Non-Forest
Net Total
Products
−2
FIGURE 4.2 Annual emissions and absorptions from land-use change in forestrySource: Baumert, K., T. Herzog, and J. Pershing. 2005. Navigating the Numbers:Greenhouse Gas Data and International Climate Policy, World Resource Institute,available at www.wri.org.

The Physical Impacts of Climate Change on the Evolution of Carbon Finance 95
a growing problem, although the role of climate change is still not entirelyclear. The forest fire risk in southern Europe is also a serious concern.
Several factors have coalesced to increase the fire risk in forests. Thefirst—as in many growing risks—is attributable to the human desire to livein scenic places, such as steep, forested slopes. A second factor is the impactof warmer weather on the spread of pests, such as the pine beetle, which killtrees and thereby provide significantly more readily combustible material.Arson and accidental ignition (cigarettes, camping fires) are frequently citedas important contributors to the risk. During the recent (December 2005)bush fires in southeast Australia, even suburban barbecues were banned.
In addition to the fire risk, the heightened windstorm experience innorthern Europe has also led to very significant losses in forestry. In January2005, for example, a weekend storm, bringing winds of 145 kph, uprooted60 million cubic meters of wood in Sweden—the equivalent of four years’harvest. The forests of Latvia and Estonia were seriously damaged by thesame storm. The sudden availability of this quantity of wood on the marketdepressed prices abruptly.
The role of forestry in carbon finance is pivotal. The trend in manyrich countries has been toward reforestation in the past few decades, fromthe nadir in Europe in the nineteenth century when entire regions weredeforested to provide construction material (including shipbuilding) andfuel. The reversal of this situation in countries like Britain, France, and theUnited States was one of the few large-scale, positive environmental trendsin the twentieth century, although it is an inadequate counterbalance tothe ongoing massive deforestation in tropical countries. Sadly, this positivetrend is threatened by the fire and windstorm risks associated with climatechange. Meanwhile, at the first COP/MOP meeting in Montreal, a groupof tropical companies proposed that they should be compensated by richercountries for not exploiting their forest reserves.
There is the potential for reforestation and appropriate harvestingregimes to sequester additional carbon in forests. This could create an addi-tional revenue stream for forestry companies and forest dwellers, therebyproviding an incentive to encourage careful management of the forestresource and hence outweighing other incentives which encourage neglector short-term, destructive exploitation.
During the negotiations leading up to the adoption of the KyotoProtocol, the Canadian delegation pushed hard for the inclusion of carbonsequestration credits in the agreement, confident that Canada could claima positive contribution, and thereby would need to do less on the carbonreduction side of the equation. However, with the spread of beetles and theever-present danger of more forest fires in a warmer world, the outcome isno longer apparent.

96 CARBON FINANCE
Forestry suffers the same dilemma of measurement uncertainties andlack of comparable data as does agriculture. The flux between absorptionand emission of CO2 in forestry creates a lack of permanence of claimedemission reductions, and poses both uncertainties and technical challengesto policy makers. The forestry sector could, then, become a net contributorto the carbon balance—that is, become a contributor to the carbon overloadin the atmosphere. In the emerging carbon-constrained world, then, the rolethat forestry will play in carbon finance hangs in the balance.
Fisheries
The fisheries sector might appear to have little relevance to carbon finance,other than its minor contribution to GHG emissions through fuel for boats,processing, and distribution. Although it is a relatively low-carbon meansof food production, the fisheries sector is, however, vulnerable to climatechange. Climate change will produce warmer waters which will affect breed-ing and maturation, and—in turn—food quality. This threat is additionalto that of stratospheric ozone depletion, which reduces phytoplanktonavailability for the fish. These effects add to the vulnerabilities that fisheriesalready exhibits, both from overfishing and from the difficulties encounteredin trying to establish international control regimes to protect its stock. Fishfarming is making up an increasing amount of the gap between supply anddemand, but that activity is also contributing to alarm because of the escapeof farmed fish into the wild population and the spread of disease.
Fish are a major source of protein and essential diet throughout theworld, especially in low-income countries that have few arable options forfood production. If the fish stock continues to decline, then pressure willincrease on land-based food such as cereals and livestock, and these, inturn, will reduce the opportunities of converting agriculture to a carbon-sequestering future. Thus, although fish may appear to have little to do withthe price of carbon, any decline in the availability of fish will put pressureon the price of carbon, as more demand comes to bear on land-based foodsystems to make up the dietary deficiency.
Real Property and Production Facilities
Real property and production facilities are a sitting target for extremeweather events, especially windstorms and flooding. Most of the insuredlosses attributed to extreme weather are damage to physical prop-erty—homes and businesses, including losses due to business interruption.The connection between these losses and carbon finance is indirect becausethe owners of the property, unlike agriculture and forestry, have no carbonsequestration potential. Some of the production facilities, including electric

The Physical Impacts of Climate Change on the Evolution of Carbon Finance 97
power utilities, coke ovens, and cement plants, are already regulated underthe European Union emissions trading scheme (EU ETS) and the Kyoto Pro-tocol, as discussed in the previous chapter. Some companies may purchaseweather derivatives to hedge their exposure to adverse weather.
Although the owners of these assets (with the above exceptions) areunlikely to become players in the carbon markets, they will be negativelyaffected in a carbon-constrained world as the losses from extreme weathermount. It is almost inevitable that insurance premiums will rise, deductibleswill rise, limits on policies will be lowered, and exclusions will proliferate forthe most vulnerable properties, such as those in floodplains and on coastallocations. Property is a very important asset class for investors, includinginstitutional investors, so this vulnerability must reduce the value of theassets, even if this impact is masked by high demand in many regions suchas southeast England.
Transportation
Like housing and production facilities, the transportation sector is veryvulnerable physically to extreme weather events, in terms of both actualdamage and disruptions to operating schedules. As fossil fuels are usedubiquitously throughout the sector, their prices are a key to operatingprofit. Some parts of the sector are more carbon intensive than others—roadtransport more than rail, and aviation most of all. For multimodal shipperslike UPS there are several strategies available to help the company movetoward a lower-carbon future.
Although the sector has not yet been regulated for GHGs, that day willcome, with aviation becoming the first industry within the transportationsector to be included, beginning in the EU ETS. Some airlines are alreadypositioning themselves by offering carbon-neutral travel, in which the pas-senger’s share of the carbon can be offset by a contribution to a reforestationproject. Two Japanese automobile companies, Mitsui and Mitsubishi, haveformed partnerships with emissions brokers (CO2e.com and Natsource,respectively) to develop a capacity for emissions trading, while both arealso investing in carbon funds. Ground transportation must simultaneouslycount the financial costs of time lost through routine congestion as well astime lost from disruptions following extreme weather events.
Tourism
The prosperity of the tourism sector is almost as dependent on favorableweather as agriculture and water supply. Indeed, much of the demandfor tourism is driven by a desire to access better weather than the tourist

98 CARBON FINANCE
expects to experience at home, whether this be more sunshine, less rainfall,warmer seas, or more snow. If these expectations are not met then thesector will suffer. Prime destinations in a hurricane zone—like Cozumeland Acapulco—are clearly very vulnerable to this kind of physical risk andthe associated reputational fallout. As the Mediterranean region warms, itmay become much less attractive to tourists and less able to support theirneeds, such as water for golf courses and swimming pools. Many smallisland states in the Caribbean, Indian Ocean, and South Pacific are heavilydependent on international tourism, as well as being the most immediatelyvulnerable to climate change and sea-level rise.
In addition to the direct physical impacts, carbon finance will impingeon tourism in other ways. Getting there is usually a significant part of thecost, and this can be expected to rise as the cost of fossil-fuel consumptiongradually absorbs the full cost of GHG emissions. Aviation-based masstourism cannot escape untouched. There are proposals to bring back hydro-gen airships, but it difficult to see descendants of the Hindenburg replacingBoeing and Airbus soon.
A portion of the weather risks for tourism can be hedged with weatherderivatives, and for some businesses this may be the only way to survive, orat least prolong the activity for a while. Warmer weather is already affectingskiing worldwide, although the lack of natural snow can be compensatedby making snow, albeit with significant energy implications. For majorweather events, such as hurricanes, catastrophe bonds may be availablefor the largest operators. On the positive side, warmer weather may bebeneficial for places currently considered too cold for a vacation, while theincreased cost of travel will favor local destinations.
Municipalities
Although the Kyoto Protocol and the EU ETS have been negotiated bynational governments, a great deal of emission reduction activity has beencarried out by municipalities and other local governments. This is the caseeven in the United States and Australia, both of which withdrew fromthe Protocol. For instance, Melbourne, the second largest city in Australia,has established a goal of zero net emissions of GHGs by 2020 (Bulleid2004–2005). In California, San Diego has set a target of reducing CO2
emissions to 15 percent below 1990 levels by the year 2010.In addition, in the United States, 165 cities belong to the U.S. Mayors’
Climate Protection Agreement, while 147 American cities support the Citiesfor Climate Protection Campaign organized by the International Council forLocal Environmental Initiatives (ICLEI).1 Their climate protection strategiesinclude methane capture from landfills, renewable energy (solar and wind),

The Physical Impacts of Climate Change on the Evolution of Carbon Finance 99
improving energy efficiency in buildings, fueling bus fleets with compressednatural gas and buying hybrid electric vehicles (Bulleid 2004–2005).
In 2003, Transport for London introduced a £5 daily charge forautomobiles entering central London (Box 4.1) in order to reduce congestion
BOX 4.1 LONDON, U.K.: TRAFFIC
CONGESTION CHARGE
In February 2003, Transport for London—London’s traffic manage-ment body—introduced a £5 daily charge for automobiles enteringcentral London. Predictably, motorists driving in the zone and shop-keepers located there opposed the charge and they felt that it wouldnever work because so many people would refuse to pay.
However, more than three years later, the scheme has achievedmany of its objectives and the dire predictions did not come to pass.Very quickly, the number of cars entering the zone—and the associ-ated congestion—was reduced by about 30 percent with concomitantreductions in particulate matter, nitrogen oxides, and carbon dioxide.Bus travel times were reduced, bus ridership increased, and accidentswent down.
In 2004–2005, revenues from the Congestion Charge contributed9 percent of the total earnings of Transport for London, all of which(by law) has to be invested in improving the bus system to make itincreasingly competitive with the use of the automobile. Transportfor London purchases 20 percent of its electricity from green sources,further reducing the transport system’s contribution to carbon dioxideemissions.
The London Chamber of Commerce reports a retailers’ survey assaying that they still think the charge has a negative impact of sales,and no motorists have reported enjoying paying the charge. On thepositive side, the system has achieved its objectives, including a rarereversal in the modal split, taking people out of their cars and intopublic transport, taxis, walking, and cycling. The charge was increasedto £8 in July 2005 and the zone will be doubled in size in February2007. The scheme is being used as a model for extending road pricingto the entire country to reverse the hitherto inexorable growth intraffic on the roads.Source: Transport for London. 2005. Annual Report 2004/05. Avail-able at http://www.tfl.gov.uk/tfl/pdfdocs/annrep-04-05.pdf.

100 CARBON FINANCE
and pollutants in the downtown core. Both the charge and the area, towhich it applies, are to be increased over the years.
A similar range of activities can be found in other parts of Europe,Canada, and elsewhere (Table 4.1). In many cases, targets that have beentaken on by cities exceed those of their national governments.
Although municipalities have been excluded from the internationalclimate change negotiations they are very well positioned to become impor-tant carbon players. Now that emission reductions are being monetized theyshould be able to benefit from their conservation measures by selling theirreduction credits. Some cities (Chicago, Boulder, Oakland, and Berkeley) aremembers of the Chicago Climate Exchange and are already doing so. Themonetary benefits from conservation are well documented, as evidenced byICLEI’s estimate that its Campaign for Climate Protection members reducedCO2 emissions by 22 million metric tonnes between 1994 and 2004, savingthe cities $600 million.
There are multiple side benefits from municipal emissions reductionprograms apart from the cost savings and the potential sale of carboncredits. Energy conservation, and a shift to renewables, directly improveair quality from reduced fuel consumption, and indirectly if they reducetraffic congestion, as has been demonstrated from the operation of theLondon Congestion Charge since 2003. Furthermore, by taking action nowmunicipalities are reducing their exposure to the rising cost of fossil fuels.
The Built Environment
In North America, a number of initiatives have spawned the drive for greenbuilding standards for the construction industry. The LEED (Leadershipin Energy and Environmental Design) building rating system was developedby the U.S. Green Building Council to provide a recognized standard bywhich to assess the environmental sustainability of building designs. Thepoint-based rating system grades buildings in six areas, including waterand energy consumption, indoor air quality, and the use of renewablematerials, to provide four performance ratings (see Table 4.2). The stan-dard has also gained acceptance from the Canada Green Building Council(www.cagbc.org).
Examples of LEED-certified projects abound, as architects and devel-opers strive to meet LEED requirements. In Canada, the new offices of theVancouver Port Authority won a LEED Gold designation for its reduction oflighting (20 percent), energy (36 percent), and water (39 percent) required,as well as its use of recycled materials (70 percent) (Lazarus 2006). In theUnited States, two new towers in Manhattan have also qualified for theLEED Gold rating. Features of the Seven World Center tower include: large,

TABLE 4.1 Targets and Reductions made by Leading Cities
City Target Method Reductions Achieved Revenue/Savings
Berlin,Germany
15% reduction on CO2
emissions between 1990and 2000
Use of-CHPa
Solar energyenergy contractingadvisory council onenergy efficiency
17% reduction on CO2
emissions between 1990and 1997
Municipal budget relief of¤2m/year
Leicester,UnitedKingdom
50% reduction in CO2
consumption on 1990levels by 2025
Supply 20% of city’s energyfrom renewables by 2020
Use of CHP incommunity heating
Reduced emissions by47,500 metric tons of CO2
between 1993 and 2001
Saved £3.9m in energycosts since 1993
Minneapolis-St. Paul,UnitedStates
20% reduction in CO2
emissions by 2005 on1988 levels
Energy retrofitsRecycling and waste
reductionEnergy and lighting
conversionTransport
improvements
12% reductions in CO2
emissions between 1988and 1998
Municipal building retrofitssaving $113m/year inenergy costs
(continued)
10
1

TABLE 4.1 (continued)
City Target Method Reductions Achieved Revenue/Savings
San Diego,California
20% CO2 emissionsreductions by 2005 on1990 levels
Use landfill gas to:generate power and
fuel garbage trucksphotovoltaics on city
facilitiesComposting
Energy use from cityoperations by 144m KWh
CO2 emissions by 89,000metric tons
Cumulative energy costsavings of $1.5m fromcity utility bill
Toronto,Canada
20% GHG Emissionreduction by 2005 on1990 levels
Methane capture fromlandfills
Building retrofitsEfficient streetlighting
Improved publictransport
42% GHG emissionreductions in municipalfacilities between 1990and 1998 (mainly throughmethane recapture)
est. $20–30m (CAD) incumulative revenue fromlandfill methane capture
$17m (CAD) savings inenergy and maintenance
Woking,UnitedKingdom
40% reduction in energyconsumption frommunicipal buildings by2001 on 1991 levels
Efficient lightingConstruction of
efficient facilitiesUse of CHP, fuel cells,
solar powerPromotion of
low-carbon vehicles
43.8% reduction in energyconsumption in 2002 on1990 levels
Reduced CO2 emissions71.5% fromcouncil-owned vehiclesand facilities
£4.9m saved in municipalenergy and water billssince 1990
aCHP, combined heat and power.Source: www.theclimategroup.org/index.php?pid=373.
10
2

The Physical Impacts of Climate Change on the Evolution of Carbon Finance 103
TABLE 4.2 LEED Green Building Rating System
LEEDRATINGSCertified Silver Gold Platinum
LEED Points 26–32 33–38 39–51 52–69Energy Savings 25–35% 35–50% 50–60% >60%Annual Utility
Savings$0.40/ft2 $0.60/ft2 $0.80/ft2 $1.00/ft2
Typical PaybackPeriod
<3 years 3–5 years 5–10 years >10 years
IncrementalConstruction Cost
Small Buildings 3% 7% 10% 15%Large Buildings 1% 3% 5% 8%
Source: www.enermodal.com.
low-iron glass areas that maximize daylight and visibility, thus reducing theneed for artificial lighting while minimizing heat; 100 percent of core andshell electricity coming from renewable energy; and rain collection on theroof for cooling the tower and irrigating a nearby park (Pogrebin 2006).
In 2006, the U.K. building regulations were modified to increase theenergy efficiency standards for both new and refurbished buildings. Inresponse to this change, the Carbon Trust launched its Low-Carbon BuildingAccelerator, aimed at accelerating the adoption of cost-effective, low-carboninitiatives in nonresidential building projects (Carbon Trust 2006).
PHYSICAL IMPACTS ON CARBON-REGULATED SECTORS
Electric Power
It may seem ironic that major producers of GHG emissions have themselvesbecome victims of the extreme weather associated with climate change,although perhaps it is no more ironic than the fact that this major disturbanceof human occupancy of the planet is solely the product of human ingenuity.Whatever the judgment, the last few years have seen significant impacts onthe electric power sector from the heat wave/drought conditions mentionedat the beginning of this chapter. The same weather that spells trouble foragriculture and forestry also has immediate negative consequences for theelectric power sector.
First, a drought deprives hydroelectric power (HEP) producers of theirsource of power. Then, the higher temperatures increase evaporation losses

104 CARBON FINANCE
from the reservoirs behind the dams. For the Scandinavian and Alpinecountries, which are heavily dependent on HEP, this can have grave con-sequences—as was experienced in the European heat wave of 2003. Theirpower shortages have a knock-on effect throughout the European powernetwork, obliging producers to burn more fossil fuels to increase supply atthe margin.
Nuclear and fossil-fuel power producers are not immune to the threatbecause they too need water for cooling their turbines. In the 2003 Europeanheat wave, nuclear plants were shut down in France, as were coal-firedplants in northern Italy, because of water shortages. The problem soonescalates because higher temperatures raise demand for power to supportair-conditioning. Since Europe is still much less dependent than the UnitedStates on air-conditioning, this is not yet as serious when it will be in thefuture, as the demand for air-conditioning will spread through Europe,spurred on by warmer summers. The same conditions will increase thedemand for water for irrigation.
Electric power utilities will become central to the evolution of carbonfinance because of the regulations that require them to reduce emissions.While some will have surplus credits to sell, others will be buyers. Some willalso be significant buyers for weather derivatives to hedge their exposureto heat waves and droughts. In order to meet the needs of HEP utilities,derivatives have also been designed based on stream flow in the rivers thatpower their turbines.
For electric power producers, the interplay between the carbon marketsand weather derivatives is particularly important. Droughts that are pro-longed enough to affect HEP utilities will force the power producers to burnmore fossil fuels, which will drive up the price of carbon credits. This, inturn, will drive up the price of the weather derivatives that are sold to hedgethis risk. In addition to the drought and water problem, electric powerproducers’ infrastructures are also vulnerable to direct physical impactsfrom extreme weather events such as windstorms, hurricanes, and flooding.
Oil and Gas Producers
This sector’s vulnerability to direct physical impacts from extreme weatherevents was dramatically exposed by the 2005 hurricane season in the Gulfof Mexico. However, shutdowns of oil rigs as a storm approached anddamage inflicted as the storm hit, have been a recurrent pattern in the Gulfof Mexico for several years. Similar impacts have occurred in the NorthSea from winter storms. Rising sea levels add to the vulnerability of oil rigsand oil storage platforms which were designed in the 1960s, long before theimpacts of climate change became a serious concern.
The Physical Impacts of Climate Change on the Evolution of Carbon Finance 105
The temporary shortage of oil products as a result of extreme weatherevents adds upward pressure to their price, just at the time when producersof oil products are having to factor in carbon regulation compliance costs.The hurricanes in the Gulf of Mexico in the fall of 2005 demonstratedthe paradox whereby oil and gas companies are making record profit fromhigher prices at the same time as they are suffering heavy damage fromthe changing climate to which they are contributing. Thus, a newspapercaptured the paradox in the title ‘‘Platform snag mars bumper BP profits’’when one of its major oil platforms was heavily damaged by hurricaneKatrina (The Independent, October 20, 2005). At the same time, MunichRe increased insurance rates on oil rigs by 400 percent (Aon Risk Bulletin#94, November 10, 2005, p. 14).
It seems likely that these forces will jointly push the cost of crude oil andoil products steadily upward. To date, there is no carbon finance solutionthat can alter this upward trend in these prices. What carbon finance cancontribute is to make the choices available explicit—now that emissionshave been monetized. Individuals, corporations, and governments will haveto develop low-carbon strategies if they are to remain viable.
FINANCIAL SERVICES
Banking
All of these varied sectoral concerns eventually pass through the filter of thefinancial services sector—for commercial bank loans, trading of companyshares on the world’s exchanges, initial public offerings (IPOs) for newcompanies, and insurance. The response of the financial services sector tothe first alarms over climate change was extremely varied, even from thesame sort of company in the same country. Such intercompany differencesare still apparent in the results from the third run of the Carbon DisclosureProject (Chapter 5) (Kiernan and Dickinson 2005).
In the 1990s some commercial bankers appeared to believe that climatechange either did not exist or, even if it did, that it was not their problem.They looked at the ‘‘green housekeeping’’ issues, did a bit of energyconservation, reviewed corporate travel, and promoted recycling. Very fewwere prepared to look at the wider picture and ask how they were usingtheir capital, and whether their strategy was in the shareholders’—or theplanet’s—long-term interest. For some commercial banks, such a reviewwas unthinkable because important clients who were major emitters ofGHGs had directors on the bank’s board.
Gradually, some banks broke the ranks and acknowledged their keyrole in shaping the global response to the climate change challenge. Twelve

106 CARBON FINANCE
such banks (and diversified financials) are recognised in the CDP’s ClimateLeadership Index for 2005—the largest sectoral representation. In addition,many have become signatories to the Equator Principles that govern projectfinancing (see Chapter 5).
Investment
Investment banks and major institutional investors, such as pension fundsand mutual funds, were equally slow to awaken to a risk that had beenpublicly identified since the 1970s and 1980s. (See Chapter 5 for a furtherassessment of the role of institutional investors.) They generally saw climatechange as very uncertain and very marginal to their traditional criteria forscreens for investment. This attitude is still prevalent in some quarters of thefinancial services sector today. However, as scientific opinion on the realityof climate change has become almost unanimous, major investors have hadto reconsider their position. In addition, institutional investors have beenpushed by legislative changes, such as the Pension Disclosure Regulation(2000) in the United Kingdom, and the U.S. proxy voting rules in 2004,which help redefine environmental issues, including climate change, in termsof fiduciary responsibility.
As will be discussed further in Chapter 5, the Sarbanes-Oxley Bill (2002)in the United States has tightened all reporting standards in the wake ofthe Enron and WorldCom scandals, which were aimed primarily at fraud.Environmental issues, including climate change, rode in on the coattails ofthis bill. In Canada, it was determined that if climate change might havea material impact on earnings, then such a judgment should be reportedin the Management’s Discussion and Analysis (MD&A), which is preparedquarterly by publicly listed companies. Similar legislation was broughtforward in the United Kingdom and France. Suddenly, almost by accident,a fringe issue was on center stage for investment houses.
Insurance
The implications of all of the physical impacts of climate change end up onthe insurers’ desk. Almost all of the real property losses for homeowners,automobile owners, and businesses are insured, plus the losses from businessinterruption. Major events will also spill over into life insurance, healthinsurance, and workers’ compensation. Unlike many of their clients, insurersare not as physically exposed to risk from climate change—unless theiroffices are located in a hurricane zone. Their assets are financial rather thanphysical plant and inventory. The insurers’ own operations are not really atrisk, because the major players have established back-up office operations in
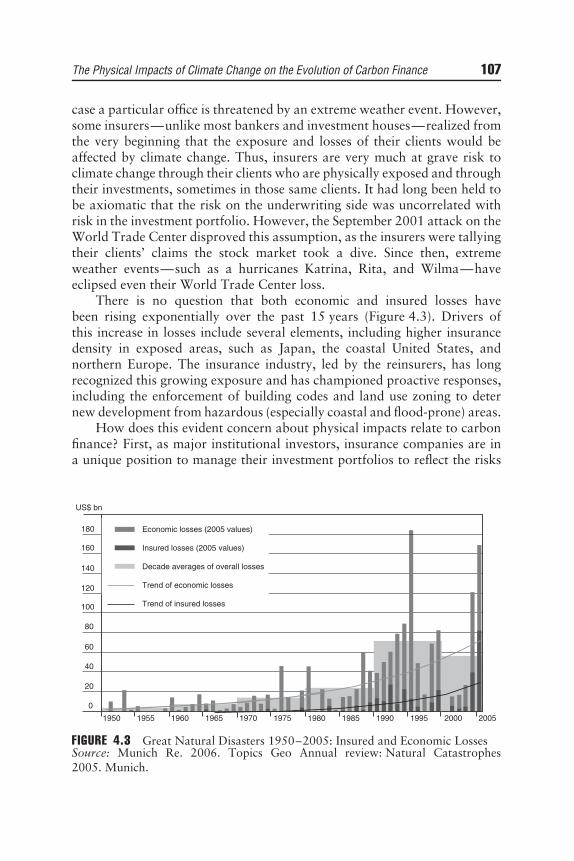
The Physical Impacts of Climate Change on the Evolution of Carbon Finance 107
case a particular office is threatened by an extreme weather event. However,some insurers—unlike most bankers and investment houses—realized fromthe very beginning that the exposure and losses of their clients would beaffected by climate change. Thus, insurers are very much at grave risk toclimate change through their clients who are physically exposed and throughtheir investments, sometimes in those same clients. It had long been held tobe axiomatic that the risk on the underwriting side was uncorrelated withrisk in the investment portfolio. However, the September 2001 attack on theWorld Trade Center disproved this assumption, as the insurers were tallyingtheir clients’ claims the stock market took a dive. Since then, extremeweather events—such as a hurricanes Katrina, Rita, and Wilma—haveeclipsed even their World Trade Center loss.
There is no question that both economic and insured losses havebeen rising exponentially over the past 15 years (Figure 4.3). Drivers ofthis increase in losses include several elements, including higher insurancedensity in exposed areas, such as Japan, the coastal United States, andnorthern Europe. The insurance industry, led by the reinsurers, has longrecognized this growing exposure and has championed proactive responses,including the enforcement of building codes and land use zoning to deternew development from hazardous (especially coastal and flood-prone) areas.
How does this evident concern about physical impacts relate to carbonfinance? First, as major institutional investors, insurance companies are ina unique position to manage their investment portfolios to reflect the risks
140
120
100
80
60
40
20
0
1950
160
180
US$ bn
1955 1960 1965 1970 1975 1980 1985 1990 20001995 2005
Economic losses (2005 values)
Insured losses (2005 values)
Decade averages of overall losses
Trend of economic losses
Trend of insured losses
FIGURE 4.3 Great Natural Disasters 1950–2005: Insured and Economic LossesSource: Munich Re. 2006. Topics Geo Annual review: Natural Catastrophes2005. Munich.

108 CARBON FINANCE
that they themselves are experiencing first hand, as insurers meeting claims.Strangely, their investment and underwriting arms seem to be slow to makethis connection (Silver and Dlugolecki 2006). Insurance companies—asmajor institutional investors—are in a unique position to develop andmanage carbon finance markets. Secondly, as insurers, they are developingnew products to insure the complex counterparty risk for carbon financetransactions. The viability of our economic system, as a whole, relies heavilyon the insurance sector to develop appropriate instruments for the transferof risk to meet the new conditions.
CONCLUSION
There is a diminishing number of skeptics left in the corporate world whoare willing to bet that climate change is not happening now—and willnot happen ever. Even if there are those who doubt the computer-basedsimulations of future climates, there are few who could deny that the climatehas already begun to change—the temperature record alone illustrates thetrend. The physical impacts of climate change are having an effect on mostsectors of the world economy—rich and poor, agricultural, industrial, andservices.
Carbon finance is a new type of endeavor that helps corporations andgovernments to respond to the risk posed by climate change. The centerpieceof this new field is the trading of GHG emission reduction credits, knownas the carbon market. Those companies whose GHG emissions are alreadyregulated have begun making their emissions inventories, assessing theirmarginal abatement costs, and deciding whether to participate in the carbonmarket. The market is also being used by investors and speculative tradersfor whom carbon is fast becoming just another commodity.
The weather market is developing in parallel with the carbon market,as corporations assess the need to hedge the weather risks associated with achanging—and hence more uncertain—climate. The sectors most directlyaffected by extreme and adverse weather are oil and gas, electric power,agriculture, forestry, water supply and treatment, construction, and tourism.Weather derivative products are being developed to meet their diverse needs.This market is described in more detail in Chapter 8.
Banking and investment have been slow to respond to the challengeof climate change compared to the proactive insurance companies, someof which have been monitoring a deteriorating loss experience for morethan a decade. Insurers have had to reassess their entire industry as theclimatic changes have become more apparent. This reassessment is ongoing,leading to changing policy conditions, demanding higher standards of risk
The Physical Impacts of Climate Change on the Evolution of Carbon Finance 109
management from their clients, and developing new products, such ascounterparty risk for carbon trading.
Although new products and conditions may help to redistribute therisks associated with climate change, there is only one sure way to slowthe rate at which the climate changes, and that is to change our patterns ofenergy use in order to reduce the emissions of carbon dioxide, the principalGHG. No country, corporation, or individual is exempt from this risk.Chapter 5 examines in more detail the critical importance of the deepeningengagement of institutional investors in the response to climate change.


CHAPTER 5Institutional Investors and
Climate Change
INTRODUCTION
There is an increasing awareness among financial analysts and investmentmanagers that companies are being exposed to differing levels of climate-
related risks, depending on their sector and geographic location. As outlinedin Chapter 3, certain industries with significant greenhouse gas (GHG)emissions face increasing regulatory risk as governments around the worldfocus on these sectors to reduce emissions. Accompanying this risk is thepotential threat of legal action against major emitters that are governedby such regulations. At the same time, sectors that are directly dependenton the natural environment are exposed to physical risk, such as extremeweather and changes in resource availability (Chapter 2). It is evident thatall of these pressures can affect corporate competitiveness.
Evidence is growing that companies that are able to manage environ-mental risks and opportunities better than their peers tend to out-performthem financially as well (Sustainability 2005; Dowell, Hart, and Yeung2000; Stanwick and Stanwick 2000). Institutional investors are showingan increasing degree of concern regarding climate-related impacts on theirinvestments. The combination of pressures from heightened environmen-tal regulations, tougher corporate disclosure requirements, and increasedscrutiny on the part of institutional investors seems certain to increase thepremium surrounding carbon risks and opportunities even further. In thischapter, we examine corporate and institutional reporting requirementsregarding materiality of environmental risk and the role that institutionalinvestors, consultants, analysts, and sell-side brokers can play in scrutinizingthe effects of carbon constraints on shareholder value.
111

112 CARBON FINANCE
INSTITUTIONAL INVESTORS: SIZE AND GLOBAL REACH
By virtue of the size and global reach of their investment portfolios, managersof institutional portfolios, which as a group include insurance companies,pension funds, mutual funds, brokers, endowments, and foundations, havethe power to move carbon governance and improved carbon strategies intothe mainstream of investment decision making.
Within the Organisation for Economic Co-operation and Development(OECD) countries, the size of pension fund investments is second onlyto those of insurance companies (OECD 1999). Among institutionallymanaged portfolios in the United States and United Kingdom, pensionfunds alone account for over one-third of corporate equity. In the UnitedStates, mutual funds control over one-quarter of publicly traded equities,and as such are also well positioned to examine corporate risks of climatechange. In the final months of 2005, Canadian trusteed pension fundsheld assets approaching $800 billion (Statistics Canada 2006), while theCanadian mutual fund industry stood at $599 billion (IFIC 2006). In thisrespect, Canadian institutional investors collectively own nearly 40 percentof Canadian equity markets.
In addition to sheer size, the global span of institutional investments isnow so diverse that they actually represent a broad cross section of the globaleconomy, or, in Monks and Minnow’s words (2001), they have become‘‘universal owners.’’ As substantial shareholders with a broad geographicalreach, institutional investors have the potential to hold significant swayover the governance and environmental behavior of companies within theirinvestment.
ENVIRONMENTAL REPORTING
Corporations
In the United States, corporations are called on to disclose their materialenvironmental risks, both under the SEC S-K regulations and the Man-agement Discussion and Analysis 10-K filings. These requirements obligecorporate managers to disclose financially material information with respectto environmental costs, liabilities, and future risks, which serve, amongother functions, to inform investors as to the nature and effects of corporateenvironmental decision-making practices.
Following the enactment of the Sarbanes-Oxley Act, the U.S. Securitiesand Exchange Commission (SEC) instigated new rulings in 2002 on cor-porate governance issues for companies, their auditors, and their lawyers

Institutional Investors and Climate Change 113
that provide corporate officers opportunities to link climate change to corevalue drivers. These new rules will, in the long run, take into accountcorporate boards’ involvement in strategic environmental planning and themonitoring of companies’ carbon liability. The U.K. Department of Tradeand Industry had introduced similar reporting rules in its Operating andFinancial Review (OFR) requirements for corporate environmental report-ing, then abandoned them in November 2005 (Nicholls 2004–2005). Butenvironmental and social reporting will still be required from U.K. compa-nies, under the European Union’s (EU’s) Accounts Modernization Directive(AMD) (Thomas 2005–2006).
Institutional Investors
From the institutional perspective, new regulations that specifically targetpension funds regarding their social and environmental reporting havealso come into effect in some countries. Changes in the U.K. PensionDisclosure Regulation in 2000 oblige trustees of pension funds to statethe extent to which social, environmental, and ethical considerations aretaken into account in the selection, retention, and realization of their funds’investments. The success of the U.K. regulation has made other countriessuch as Germany and Australia consider similar rulings.
To further the transparency of institutional investors’ proxy votingon corporate resolutions, new U.S. SEC rules went into effect in 2004,requiring all investment management companies, including mutual funds, todisclose their voting policies and proxy votes (Brennan and Johnson 2004).Examples of social and environmental disclosure can be seen in the U.S.state of Connecticut’s proxy voting policies (www.state.ct.us.ott) as well asin two of Canada’a largest public pension plans, the Canadian Pension Plan(www.cpp-rpc.ca) and Ontario Municipal Employee Retirement System(OMERS) (www.omers.com).
These shifts in disclosure and requirements oblige institutions to takeaccount of environmental issues in general, and climate change initiatives inparticular, in their critical analyses of investment opportunities. In so doing,we see a potentially significant change in how ‘‘fiduciary responsibility’’ willbe interpreted by institutional investors.
CORPORATE ENVIRONMENTAL REPORTING
Recent reviews of corporate reporting with respect to material environ-mental issues reveal that companies’ environmental disclosures have been

114 CARBON FINANCE
uneven and inadequate. In the words of Douglas Cogan of the InvestorsResponsibility Research Center (IRRC):
Climate change information in company annual reports runs thegamut from mere blurbs to detailed accounts of science, policy andcompany positions. (Cogan 2004, p. 41)
In most studies, at least one company provides climate-related disclosuresin SEC filings in each sector, while others within the same sector failto recognize or report environmental risk and uncertainties to investors.In addition to sectoral differences, considerable disparity is found in thereporting practices of companies in different geographic areas, with non-U.S. companies reporting at a rate of 56 percent compared to 15 percentfor U.S. firms. The discrepancy becomes evident in the insurance industry,where only one of 14 large U.S. property and casualty companies discussesglobal warming in its annual SEC filings. By contrast, European insurers,most notably Swiss Re and Munich Re, demonstrate particular leadershipin understanding the potential effects of climate change on insurance andreinsurance (FOE 2002). A further disparity in attitude was noted in the oilindustry’s reporting of environmental strategies and materiality of climatechange. European companies, such as BP and Royal Dutch/Shell, reportthat they are increasing their commitment to renewable energy technologiesand, as such, are well positioned to deal with emerging climate changeissues. Conversely, American-based ChevronTexaco, ConocoPhillips, andExxonMobil appeared to devote the majority of their development effortstoward fossil fuels (Cogan 2003).
In examining the disclosure records of U.S. electric companies’ SEC 10-K filings, Repetto (2003) found that few had disclosed the financial impactsof multipollutant cap-and-trade bills or carbon controls, even though theyare known material uncertainties. The few that did recognize these concernsas being material confined their environmental disclosure to regulations thathad already been made public.
In general, U.S. companies were perceived to discount global warmingthreats and continue with ‘‘business as usual,’’ while European, Canadian,and Japanese companies were more likely to report on the financial risk andtheir climate change mitigation strategies. Although there have been signifi-cant improvements in the reporting of GHG emissions by companies, manystill do not disclose any emissions data. As a result, financial institutionshave to find other sources of information in order to analyze carbon profilesof companies and sectors. For example, in its attempt to conduct a compre-hensive study of the FTSE 100 companies, Trucost Plc. had to supplementpublished data with estimates derived from other environmental profilingsystem (see Box 5.1).

Institutional Investors and Climate Change 115
WILLIAM THARP— INVITED AUTHOR’S
COMMENT: THE CARBON PROJECT
FINANCING CONTINUUM
Venture capitalists and term financiers have different perspectives oncarbon risk and valuation of projects. Venture capital has the capacityto take carbon risk management into account, and consider theirinvolvement in a project to be one of value creator. Traditional long-term project financiers, however, consider their capacity as that ofvalue recognition. As such, longer-term financiers analyze the intrinsicvalue of a project, but are highly unlikely to take any lending riskin which the return of capital is dependent on carbon monetization,without first addressing the management of such risk on a stand-alone basis. Because of this distinctive risk, a gap exists in the projectfinancing continuum (see diagram).
Ris
k a
nd
typ
ica
l R
etu
rns o
n I
nve
stm
en
t
12
–1
5%
15
–2
2%
22
–4
0%
0−2 Years
ValueRecognition
Value Conception
Source of
Finance
Available
Ma
rke
t C
ap
ita
liza
tio
n (
$m
lns)
0–
22
–2
5
Developmental EquityGrants < VC > Equity
MezzanineConstruction
Term Financing
0.5−3 Yrs 1+ Yrs +20 Yrs Time
25
–5
00ValueGAP
Risk
Value Creation
To overcome this discrepancy, two trends are emerging thatstrengthen the flow of funds to projects:
1. Traditional capital providers are attempting to build their knowl-edge base, through partnerships with specialists, in order tounderstand and manage discrete carbon opportunities and risks

116 CARBON FINANCE
(for example, the Carbon Facility, a joint venture between EcoSe-curities in the United States, a recognized carbon specialty firm,and the Standard Bank Group in Johannesburg, South Africa).
2. Specialized funding entities and/or pools of capital are beingformed to meet this need, for example, RNK Capital, a specializedenvironmental attribute/carbon-focused hedge fund in the UnitedStates.
The skills required to manage financing at the mezzanine and con-struction phases are found in a combination of the technology/venturecapital investor working with a project or term lender. Areas wherewe’ve now seen successful collaborations between these skill setsinclude wind power projects in Europe, energy and efficiency projectsin the United States, and landfill gas (LFG) projects in South Amer-ica—risk and long-term capital joining to provide a complete fundingpackage.
William R. Tharp is the chief executive officer of the Quantum Leap Company
Limited, Toronto, a diversified management company working as partner,
advisor, and shareholder with the mandate of building value in energy and
efficiency. In addition to directorships on several asset management and
industry companies, Mr. Tharp is also a member of Sustainable Development
Technology Canada (SDTC) investment committee (a $550 million foundation
supporting climate change, clean air, high water quality, and soil technologies)
and of the (Canadian) National Round Table on the Environment & Economy,
Capital Markets & Sustainability section.
NEW ERA OF FIDUCIARY RESPONSIBILITY
FOR INSTITUTIONAL INVESTORS
Through the power of persuasion due to sheer size and global reach, backedby economic pressure, institutional investors have the capacity to holdcorporations accountable for the environmental impacts. They can adoptthis role by:
� Incorporating environmental opportunities into investment strategies.� Engaging environmental underperformers in active dialogue.

Institutional Investors and Climate Change 117
� Filing environmental resolutions and voting proxies at companies’annual general meetings (AGMs) in order to improve their corporateenvironmental performance.
The following section describes how institutional investors, in concertwith their links to investment analysts and consultants in the financialservices sector, can achieve this goal.
Investment Decision Making
From an investment decision-making perspective, some companies withinsectors will exhibit better environmental risk management than others,making investment managers’ key decision one of stock selection. In othercases, a whole sector is at risk due to its carbon profile or energy intensity,thus making the key assessment one of the appropriate exposure to thatsector within the fund’s asset mix.
Historically, pension fund reform, diminishing returns, and a fear ofnot being able to meet their future liabilities have fueled the debate amongpension fund mangers as to the right balance between equities and bondsin asset allocation (Economist 2003). More recently, efforts to improvepension fund yields have led to the substitution of alternative asset classes,including real estate, ‘‘climate-themed’’ private equity, venture capital andhedge funds, and new markets such as emissions trading, in place oftraditional equities and bond investments.
The growing segment of venture capital and private equity funds thatinvest in alternative energy forms and energy efficiency have become increas-ingly important in their potential to help to meet growing commitments tothe reduction of greenhouse gas emissions (see Tharp p. 115). Firms in thisfield raise capital from institutional inventors such as pension funds, insur-ance companies, and banks. The life cycle of these funds is typically up to10 years, with investments taking place in years 1 to 3, growth of companiesin the portfolio in the years 3 to 7, and exits via an initial public offering(IPO) or sale in years 6 to 10. At this stage, other forms of longer-termfinancing have traditionally emerged (see author’s comment below).
Clean technology (‘‘cleantech’’) funds focus on all aspects of the clean-tech energy supply chain (Figure 5.1), as well as technologies that transformthe way water and waste are managed. Many of these cleantech energy tech-nologies are closely related to the availability of new energy applicationssummarized in Table 3.2.
Both large and small pension funds in the United States, Canada,and Europe have been targeting cleantech funds, with investment inclean technology growing by 30 percent annually in the United King-dom alone (Biello 2005). Investment in this niche market varies regionally,

118 CARBON FINANCE
USE Technologies that improve energy efficiencies at point ofconsumption
DISTRIBUTION Improvedinfrastructuretechnologiesrelated to energydelivery
PRODUCTION Improvements in energy generation technology: bothpower and heat
INPUTS Exploration anddevelopment of renewable/clean energysources
FIGURE 5.1 Key stages in the clean technology energy supply chainSource: Based on Carbon Trust 2006.
however, with Europe taking the lead in early stages of wind power, whilethe United States is more focused on energy as a whole (Carbon Trust2005b; Echarri 2006). Involvement in this area allows pension funds totake advantage of industries that are predicted to grow in response to envi-ronmental and health concerns, technological advancements, and legislativereform. As well as the growth factor, such projects have a long-term horizonand focus on results, as should pension fund investment patterns.
Fund companies, such as Henderson Global Investors, are reorientingthe criteria of two of its socially responsible investing (SRI) funds inorder to focus on ‘‘industries of the future’’ that are working to solveproblems of pollution, climate change, and the increased consumption ofresources (Bulleid 2005a). Others, such as Swiss Re’s clean energy fund,will provide mezzanine financing and opportunities to monetize resultingcarbon credits. Chapter 9 provides a detailed discussion of the growth andcomplexity of this dimension of carbon finance.
Taking climate-related investment decision making to a new level, Hen-derson Global Investors commissioned two pioneering reports by TrucostPlc.—the first to evaluate total carbon emissions of the FTSE 100, and thesecond to conduct a carbon audit of its own Global Care Income Fund(see Box 5.1). The audit demonstrates that an active approach to SRI notonly produces financial returns but also delivers environmental benefits(Henderson Global Investors 2005a,b).
Active Engagement
The most direct way for pension fund managers to address issues ofenvironmental risk and corporate governance in their equity portfolios isthrough active engagement with investee companies. Such direct activityencourages change within companies and allows firms the chance to addressrisk factors internally, before any investment decision on the part of afund manager is revised. An analyst’s request for a firm’s carbon profile, forexample, will make the company consider both its potential exposure as well

Institutional Investors and Climate Change 119
BOX 5.1 CARBON AUDIT OF HENDERSON’S
GLOBAL CARE INCOME FUND
The analysis calculates global direct emissions, along with any firsttier supply emissions of greenhouse gases of each holding in the fund,but does not includes emissions associated with goods and services.The measure of carbon dioxide equivalents (CO2-e) for each holding isconverted to relative carbon emissions per unit of market capitalization(showing the amount of carbon associated with each pound investedin the fund), and is then compared to the carbon intensity of the fund’sbenchmark, FTSE All Share.
Researchers at Trucost found that the investments in Global CareIncome Fund displayed 32 percent less carbon intensity than its FTSEbenchmark. The largest positive impact on the fund’s carbon intensitywas attributed to its underweighting position in mining and oil and gassectors, while an overweighting in utilities contributed to the biggestnegative impact.
TABLE 5.1 Overall Performance
Income Fund FTSE All Share
Total Value1 (£m) 102.82 1,519,012.12Total carbon emissions (tCO2-e) 61,329 1,350,334,454Carbon intensity (tCO2-e/(£m) 596 877
Due to the fact that goods and services are not included in the anal-ysis, along with the fact that there are substantial emissions generatedby the consumption of oil, gas, and coal, the fund’s underweightingin this sector means that the fund has limited exposure to regulatorymeasures being taken to reduce consumption of these carbon-intensivefuels.Sources: Henderson 2005a, b.1 Valuation date 31/12/2004
as what action the corporation may take to reduce this risk. The advantagefor the company that reacts positively to this process is that investors willwithdraw any pertinent shareholder resolution that had been slated for thecompany’s AGM. Through their strategies of active engagement and proxyvoting, some of the most powerful institutional investors, such as California

120 CARBON FINANCE
Public Employees’ Retirement System (CalPERS) and Teachers Insuranceand Annuity Association–College Retirement Equities Fund (TIAA-CREF),have become increasingly vocal and visible on environmental and socialissues (see Chapter 9).
Shareholder Resolutions and Proxy Voting
If it is assumed that improved environmental performance is related toimproved productivity, competitiveness, and shareholder value, then it isincumbent on institutional investors to vote the shares in a manner that isconsistent with their fiduciary duty to act in the best interest of their clients.
A shareholder’s resolution is deemed successful based on a variety ofoutcomes:
� If the proposal receives 50 percent of the shareholders’ votes.� If management takes the action requested with less than a 50 percent
positive response rate.� If the proposal generates a significant abnormal return if profit maxi-
mization is the goal (Del Guercio and Hawkins 1999).
Early shareholder resolutions have dealt with issues, such as takeoverdefenses and greenmail. Until the late 1980s, it was rare for the proposal togarner more than 10 percent of the votes in its favor. More recently, share-holder submissions have been related to the selection of directors, executivecompensation, and environmental issues, including climate change.
Although environmental resolutions are at a formative stage, thereis mounting evidence that they are gaining momentum. Issues of carbonreporting and liabilities have been the focus of several recent environmentalsubmissions. In 2005, there were 33 filings of global warming shareholderresolutions in the United States, a significant increase from the 25 submis-sions the previous year. Filers include, among others, state and city pensionfunds,2 labor, three foundations, and socially screened mutual funds.3 Awide range of sectors was targeted, including oil and gas companies, elec-trical power producers, automakers, and financial institutions. Many of theresolutions sought greater disclosure on how the companies are respondingto, and preparing for, rising regulatory and competitive pressures to reduceGHG emissions. Ford and General Motors, for example, have been asked,among other things, to report on how they plan to remain competitivegiven the growing pressure to reduce GHG emissions from motor vehicles(www.climatbiz.com). ExxonMobil, along with some manufacturers, hasreceived a resolution that focuses specifically on how the company plans tomeet Kyoto GHG reduction targets.

Institutional Investors and Climate Change 121
Recent evidence indicates that institutional investors have had someinfluence on companies that they hold in their portfolios, through the proxyprocess. In 2004, the largest CO2 emitter, the U.S. electric power sector,received the majority of the resolutions. As a result of those submissions,Southern Company and TXU agreed to report publicly on how theircompanies are planning for potential constraints on carbon dioxide andother emissions (Ceres 2005c). Reliant Energy agreed to expand its securitiesfilings and 10-K disclosures to include an assessment of environmental issues.Given these proactive responses, shareholders withdrew their submissionsto these three companies. Similarly, global warming shareholder resolutionswere filed and then withdrawn when American Electric Power (AEP) andCinergy Corporation agreed to issue carbon risk reports. Indeed, AEP has setthe sectoral benchmark for disclosure standards, and developed a model foroptimizing responses to climate and environmental mandates (see Box 5.2).Excel Energy, however, challenged a similar shareholder resolution andreceived permission from the SEC to omit the proxy from the company’sstatement (Ceres 2004).
BOX 5.2 AEP’S RESPONSE TO SHAREHOLDER
ACTIVISM
American Electric Power (AEP) is the largest generator of electricity inthe United States. It relies heavily on coal as the primary energy sourceto generate a reliable supply of affordable electricity. Thus, signifi-cant among its economic drivers are current and future environmentalpolicies, including mandatory controls on emissions of greenhousegases. In response to a shareholder proposal submitted at its 2004Annual Meeting, AEP has prepared a 100-page report, which evalu-ates, among other things, the impact of proposed policies on carbondioxide reduction on the company; assesses technologies available tothe company to control those emissions; and reviews analyses of thecosts of several control scenarios.
The report details the actions that AEP has undertaken to effec-tively manage future carbon constraints, including investments interrestrial carbon projects and geological sequestration research andinvestment in renewables. AEP is one of the largest wind generatorsin the United States. It was also a founding member of the ChicagoClimate Exchange (CCX).

122 CARBON FINANCE
Most significant in the report, in the light of current uncertaintiesof public policy regarding carbon constraints, is its commitment tobeing an industry leader, in partnership with others, by developingIntegrated Gasification Combined Cycle (IGCC) technology. IGCCtechnology converts coal into a gas and passes it through pollutant-removal equipment before the gas is burned. The process not onlylowers CO2 emissions, it also results in less SO2, NOx, and mercurybeing emitted. Carbon capture from an IGCC plant is anticipatedto be easier than from pulverized coal plants, the latter being onemeans known to reduce CO2 from coal. Taking this commitment onestep further, AEP has said it will build one or more commercial-scalebase-load IGCC plants (up to 1,000 MW) before 2010.
Source: www.aep.com
MUTUAL FUNDS
Although there has been growing support for global warming resolutions byother institutional investors, the majority of mutual fund managers appearto be hesitant to undertake such actions. In fact, the mutual fund indus-try raised strong objections to the 2004 SEC requirements that investmentmanagement companies disclose both their proxy votes and their voting poli-cies (Brennan and Johnson 2004). They argued that such disclosures would
politicize the proxy voting process and hinder funds from engagingin quiet diplomacy to elicit better financial information and enactbeneficial corporate reform. (Brennan and Johnson 2004)
A 2004 survey of U.S. mutual fund companies indicated that 25 ofthe 28 investment management companies responsible for the top 100largest mutual funds maintained proxy voting policies that abstained oropposed shareholder resolutions seeking greater disclosure on the financialrisks and opportunities presented by climate change (Cogan 2004). Only2 percent of the assets held in those top 100 mutual funds supportedany form of global warming resolution that year (Table 5.1). A follow-upsurvey was undertaken in 2005, after the new disclosure requirements formutual funds came into effect, mandating the disclosure of how they votedproxies in companies in which they invest. The results revealed virtuallyno change in voting patterns, with 28 of the 31 investment managementcompanies having similar proxy voting policies to before. Only three fund

Institutional Investors and Climate Change 123
TABLE 5.1 Fund Companies’ Response Patterns to Climate Change ShareholderProposals
Fund Companies Proposals
YEAR # Companiesa Opposed Supported # Filed Voted/Withdrawn/Omitted
2004 28 21 3 25 11/7/72005 31 25 3 33 11/17/5
a Representing the top 100 funds.Sources: Cogan, D. 2004. Unexamined Risk: How Mutual Funds Vote on GlobalWarming Shareholder Resolutions. December. Boston: CERES; Washington, DC:IRRC; and Cogan, D. 2006. Unexamined Risk: How Mutual Funds Vote onGlobal Warming Shareholder Resolutions. January. Boston: CERES; Washington,DC: IRRC.
companies, Columbia, Franklin Templeton, and Neuberger Berman, haveguidelines that allow some proxy votes to be cast in favor of climate changeproposals (Cogan 2004, 2006).
The reports cite two reasons for such lethargy: (1) the ‘‘Wall StreetRule,’’ the outdated portfolio management philosophy that discouragesportfolio managers from voting against corporate managers; and (2) thatglobal warming resolutions are lumped in with issues of corporate socialresponsibility, and as such are exempt from serious consideration in proxyvoting guidelines.
From these results, it would appear that the vast majority of mutualfund managers are ignoring the link between climate change and shareholdervalue. This reluctance is surprising, since mutual fund companies emphasizetheir in-depth knowledge of companies in which they invest; while at thesame time, their approach to the financial implications of climate changeruns counter to the fiduciary practices that have been adopted by otherinstitutional investors.
This could change as mutual fund shareholders react to new disclosurerules for investment managers and begin to stress global warming to theirfund companies, and to demand added disclosure on climate change forfund share- and unit holders. Mutual fund companies will recognize thegrowing concern that their consumers are voicing on the subject. A recentsurvey of 842 U.S. mutual fund holders found that:
� Three out of four (74 percent) mutual fund investors wanted their‘‘mutual funds to ask questions about the potential impacts of globalwarming on the companies in which they invest their money.’’
� More than seven out of ten (71 percent) want ‘‘company managementto pay more attention to global warming concerns.’’

124 CARBON FINANCE
� The same number, 71 percent, want their ‘‘mutual fund compa-nies to support global warming shareholder resolutions on theirbehalf ’’ (Cogan 2006, p. ii).
There are exceptions, however, to this lack of environmental focuswithin the mutual fund industry. In an early attempt to improve responsepattern to industry-specific environmental concerns, Real Assets InvestmentManagement (now Inhance Investment Management) filed resolutions withCoca-Cola and PepsiCo in 2002 that addressed the impact of their oper-ations on water use in areas of water scarcity. The filers withdrew theproposal before the Coca-Cola AGM, when the company signaled its com-mitment to addressing this emerging business issue. By contrast, PepsiCorequested permission to omit the resolution from its proxy statement in2002. The SEC denied this request, and obliged PepsiCo to include the res-olution on its proxy statement in 2003 (ishareowner.com). Since that time,both Coca-Cola and PepsiCo have implemented water efficiency audits andimprovements in water use management. Indeed, Coca-Cola has reduced itsworldwide use of water by 3 percent (www.realassets.ca).
In 2003, issues of carbon constraint and climate change became onefocal point of shareholder activism in Canada. Real Assets along withEthical Funds of Vancouver, filed environmental shareholder resolutionswith a number of major Canadian banks, asking for details on their riskassessment and criteria used in evaluating carbon and environmental risksin project financing. Significant progress was made in some cases, butnot in others. Toronto Dominion Bank’s reaction was to take advantageof a technical rule in the Bank Act that allowed it to avoid circulatingthe proposal to shareholders. The Bank of Montreal, however, not onlycirculated the proposal, but also recommended that shareholders vote infavor of it. For its part, the Canadian Imperial Bank of Commerce (CIBC)agreed to sign on the Equator Principles (described later in this chapter)and incorporate environmental performance indicators in its credit riskmanagement assessments, along the lines of Global Reporting Initiative’s(GRI’s) Financial Sector Guidelines. The filers of these resolutions hope thatat least one of the banks will emerge as a leader in reporting in this area,and have a spillover effect, thus raising the bar for all Canadian banks(www.realassets.ca).
Altogether, 25 global warming resolutions were filed in 2004, with 11coming to a vote and 7 being withdrawn after satisfactory agreements werereached with the companies involved. The resolutions at AEP, SouthernCompany, and TXU were discussed earlier in the chapter, with respect totheir agreements to conduct board-level assessments and report publicly ontheir carbon constraint policies. In addition to the electric utilities, eight

Institutional Investors and Climate Change 125
oil companies also received global warming or related renewable energyresolutions in 2004. Key policy changes were announced regarding improveddisclosure and reporting on climate risk (Devon Energy), voluntary emissionreduction targets, and greater involvement in cleaner and renewable formsof energy (ChevronTexaco and Valero Energy).
In 2005, both the number of global warming resolutions filed (33)and those withdrawn (17) reached a record level, after a successfulagreement was attained with the company involved. Notable among theresponses were:
� Three major power companies (DTE, FirstEnergy, and Progress Energy)agreed to issue a report that assesses the impact of GHG emission limitson their profits and competitive position.
� Six oil companies agreed to a range of responsibilities, including:� Disclosure of operational or end-product GHG emissions.� Setting absolute emission goals and reduction targets.� Increasing investment in low- and no-carbon technology.� Factoring carbon costs into capital allocation decisions.� Integrating climate risk into core business strategies.
� A resolution filed at ExxonMobil asking the company’s board to reviewhow it will meet its GHG reduction targets garnered 28.3 percentbacking of the shares cast, making it the greatest support on record fora climate change proposal at ExxonMobil (Cogan 2006).
NEW MOMENTUM IN THE CORPORATE WORLD
In addition to the demands being exerted by institutional investors pressingfor new investment research and strategies to address climate change,several investment banks are launching programs to address climate change,while a number of U.S. companies are calling for compulsory controls onGHGs. These initiatives are examined in greater detail in Chapter 9, butthe following examples are representative of new programs initiated byinvestment houses, insurance companies, and pension funds:
� ABN Amro launched a new climate risk-management services in 2005,including trading of GHG emission allowances through its commoditydesk. In June 2005, the bank brokered its first carbon-credit transactionbetween two private corporations.
� Goldman Sachs issued a new Environmental Policy Framework for itsinvestment banking operations in November 2005, in which climatechange is included in its share valuation models

126 CARBON FINANCE
� The reality of the legal responsibility of carbon is further magnifiedby Swiss Re and Munich Re’s potential denial of liability coverage todirectors or officers in any companies that are not making efforts toreduce their impact on global warming. Insurance of this type wouldprotect the executives from lawsuits that allege mismanagement of acompany’s carbon management (Ball 2003).
� HSBC has joined the ranks of other financial institutions in waging waron climate change (see Box 5.3).
BOX 5.3 HSBC: THE WORLD’S FIRST CARBON
NEUTRAL BANK
As well as examining the indirect impacts of carbon risk throughtheir lending and investment portfolios, HSBC has also addressedits direct impacts on climate change, and became the first majorbank to announce it was carbon neutral. In 2004, HSBC made acommitment to be the world’s first major bank to achieve carbonneutrality, with a Carbon Management Task Force announcing atarget of 5 percent reduction over three years. The HSBC CarbonManagement Plan consists of three phases: (1) to manage and reduceits direct emissions through energy efficiencies; (2) to reduce the carbonintensity of the electricity used by buying renewable ‘‘green’’ electricity;and (3) by offsetting the remaining emissions through offset creditsfrom offset projects around the world. These credits must be credibleand additional, and the projects must be commercially viable.
To meet its 2005 commitment, HSBC bought 170,000 metric tonsof carbon offsets from four projects around the world:
Project 1: Te Apiti wind farm in the North Island, New Zealand(125,000 metric tons).
Project 2: Organic waste composting, in Victoria, Australia(15,000 metric tons).
Project 3: Agricultural methane capture in Sandbelendorf, Ger-many (14,000 metric tons).
Project 4: Vensa Biotek biomass co-generation, in Andhra Pradesh,India (16,000 metric tons).
Sources: Williams 2006; www.hsbc.com/hsbc/csr/environment/hsbc-and-climate-change.
Institutional Investors and Climate Change 127
� In 2004, the California State Treasurer initiated a new investment ini-tiative, the Green Wave Environmental Investment Initiative, calling onthe state’s two largest pension funds, CalPERS and CalSTRS (CaliforniaState Teachers’ Retirement System), to commit $1.5 billion to invest incutting-edge clean technologies and environmentally responsible com-panies (Pew Center on Global Climate Change 2005b).
In addition, there are a growing number of large companies that aredemanding mandatory controls on GHG emissions in order to clarify policyuncertainties, which would, in turn, help them in their strategic planningof new business initiatives. The CEOs of influential corporations, such asDuke Power and General Electric, have spoken out in support of mandatorypolicies on emission constraints. BP is noted for its ‘‘Beyond Petroleum’’commitment as its Chairman John Browne remarks on the displacement ofpolluting forms of power generation by low-emission technologies. Indeed,BP established a new Alternative Energy business entity in November 2005that is slated to invest $8 billion in renewable and integrated gasificationenergy technologies over the next decade (Cogan 2006).
Climate change will affect companies of every stripe. . . and man-agers who fail to respond to calls for more transparency andbetter planning will face greater public censure and even charges of‘‘dereliction of duty.’’ (Grobbel, Maly, and Molitor 2004)
BARRIERS TO THE FINANCIAL CONSIDERATION
OF CLIMATE CHANGE
A number of barriers exist, however, that prevent financial institutionsand analysts from evaluating and integrating climate change risk intoinvestment analyses and decision making (Table 5.2). In the first instance,the mainstream financial world has failed, until recently, to relate climaterisks and opportunities to bottom-line financial performance of companies(see invited author piece on pages 129–130). Second, climate change hasthe potential to cut across nearly all functions of the financial servicessector, creating a sense of shared responsibility that deters any one groupfrom taking an active role in including climate change in evaluations andproviding products and services focused on adaptation and mitigationefforts.
Further barriers are encountered at the political level, as delays anduncertainty on the part of regulators hampers the development of long-term,binding emissions reductions targets and impede the encouragement of

128 CARBON FINANCE
TABLE 5.2 Barriers Preventing the Financial Sector from Early Engagement withClimate Change
Market/Cognitive Political Analytical Operational
FI view issues ofclimate change asmarginal tocompanies’ FP
Delay in creatingfavorablepoliticalconditions forvaluing carbonmanagement
Poor data available,making analysisof potentialcorporate risksdifficult
Lack of marketmechanisms togive thetechnologycommercialadvantage
FI do not see theconnectionbetween climatechange andfinancial risk
Uncertainty aboutregulators’commitments toclimate policiesand emissionstrading
Insufficient analysisand informationfrom finance andinsuranceadvisors
Inefficiencies andcomplexities inpresent GHGETS
Short-term horizonfor optimizingportfolios
Various localrestrictions onforeign financialinstitutions
Littleunderstanding ofthe financialbenefits ofproactive carbonmanagement
Initial investmentrequired can bedisproportionateto project sizeand can havehigh transactioncosts
FI, financial institutions; FP, financial performance.Sources: UNEPFI 2002. CEO Briefing Thomas, S. 2005–2006. Looking beyondthe OFR, Environmental Finance, 7(3):22 (December–January). Key findings of theUNEP’s Finance Initiatives Study, www.UNEPFI.org.
potential investors in sectors such as renewable energy. Additional difficul-ties are seen at the analytical level, where low awareness of climate changeamong key finance and insurance advisors result in poor data availabilityand insufficient analysis. In addition, understanding of financial benefitsof climate-friendly projects is low within the sector. And finally, at themarket level, complexities within emissions trading markets have, to date,deterred financial institutions from getting more involved, while potentialinvestors in clean technology seek specific policies, such as tax incentivesor renewable energy trading schemes, to give their investments some clearmarket advantage. Further to these issues, some investments, such as thosein renewable energy, are small in comparison to the scale that investmentfunds required, and therefore appear to have, relatively high overhead andtransaction costs (UNEPFI 2002).

Institutional Investors and Climate Change 129
CLIMATE CHANGE AND FINANCIAL
REPORTING— AN ACCOUNTING PERSPECTIVE
Corporations are increasingly finding it necessary to consider cli-mate change issues in their strategic planning and risk management.More and more, institutional investors also realize the importanceof considering the financial implications of climate change in theirinvestment analysis and decision making. As a result, climate changeis now showing up in various components of financial reporting. Forexample, information on climate change will increasingly be found infinancial statements and, in North America, management’s discussionand analysis reports. In the United States these reports are incorporatedinto 10K filings. In Canada information about climate change mattersmay also be found in a third filing, the Annual Information Form.
Climate change issues will impact financial statements in a vari-ety of areas, including strategic capital investments and complianceand risk management costs. For example, in jurisdictions where thereare GHG emissions trading programs and where companies choose toengage in emissions trading, transactions occur that must be recognizedand accounted for in financial statements—whether as assets, liabili-ties, revenues, or expenses. The appropriate application of accountingstandards is necessary to reflect the substance of the programs andreport fairly the financial impact of relevant regulations and trans-actions. The International Accounting Standards Board is addressingthese financial statement reporting issues as and when necessary todevelop interpretations and guidance that will promote consistent and,where possible, comparable accounting treatment of climate changeissues in financial statements.
Climate change issues may also need to be disclosed in man-agement’s discussion and analysis (MD&A) reports that accompanyfinancial statements. In the United States and Canada, securities reg-ulators require public companies to disclose material informationabout known trends, risks, and uncertainties. Material informationis considered to be that which would influence an investor’s decisionwhether to invest or not in a company. To the extent that climatechange issues are deemed to be material to investor decision making,there should be MD&A disclosures about management’s response tothe opportunities and risks posed by climate change matters. Secu-rities regulators’ disclosure rules do not explicitly mention climatechange as a matter for disclosure. However, the Canadian Institute of

130 CARBON FINANCE
Chartered Accountants released in 2005 a Discussion Brief, MD&ADisclosure about the Financial Impact of Climate Change and OtherEnvironmental Issues (see www.cica.ca/cpr), to encourage companiesto consider what MD&A disclosures they should make about climatechange issues.
Alan Willis, a chartered accountant and former partner in an internationalaccounting firm, is a consultant in corporate business reporting, control, andgovernance. He represented the Canadian Institute of Chartered Accountants(CICA) on the Canadian Advisory Council for the development of the ISO14064 international standard, Measurement, Reporting and Verification ofGreenhouse Gas Emissions. He also served as CICA’s representative on theoriginal steering committee of the Global Reporting Initiative (1997–2002),which developed the 2002 version of the GRI Guidelines for SustainabilityReporting.Julie M. Desjardins, a chartered accountant, is a consultant in the area ofcontinuous disclosure reporting and in climate change disclosures. She wasprincipal author for The Canadian Institute of Chartered Accountants’ (CICA)preliminary research on accounting for greenhouse gas emission liabilities andcredits in corporate financial statements. She also authored an issues paperon accounting for Kyoto obligations in government financial statements. Atpresent, she is the CICA representative on the Canadian Standards AssociationTechnical Committee on Climate Change.
Mr. Willis and Ms. Desjardins co-authored the CICA’s 2005 Discussion Brief
MD&A Disclosure about the Financial Impact of Climate Change and Other
Environmental Issues and its 2001 publication Environmental Performance:
Measuring and Managing What Matters. They were also both members of the
advisory panel for the Canadian version of the Carbon Disclosure Project’s
fourth global survey and report in 2006.
INSTITUTIONAL INVESTORS AND CLIMATE CHANGE
It is evident that issues of climate change liability and uncertainty havemoved from the fringe to more mainstream thinking among many invest-ment analysts and managers. As well as undertaking shareholder engagementactivities with individual companies, institutional investors also have thepotential to engage with policy makers and participate in the public pol-icy debate around climate change. Many climate-related policies, such asincreased corporate disclosure, carbon taxes, emission reduction targets, andtrading schemes, have ramifications for long-term asset owners. To this end,

Institutional Investors and Climate Change 131
institutional investors have undertaken a number of initiatives to legitimizeclimate change as an investment and fiduciary issue and to encourage poli-cies that best meet the long-term goals of their mandates (Mercer InvestmentConsulting 2005). As a result of these activities, a number of initiatives arebeginning to legitimize climate change as both an investment and fiduciaryissue for institutional institutions. The following section highlights someactivities that have been undertaken by groups of institutional investorsboth in the United Kingdom and the United States, to address the risksand opportunities that climate change presents in light of their fiduciaryresponsibility.
Institutional Investors’ Group on Climate Change (IIGCC)
In 2001, the third largest pension fund in the United Kingdom, The Univer-sities Superannuation Scheme (USS), published a discussion paper, ‘‘ClimateChange: A Risk Management Challenge for Institutional Investors,’’ whichaddresses the implications of climate change for institutional fiducia-ries (Mansley and Dlugolecki 2001). Following this publication, USS formedan Institutional Investors’ Group on Climate Change (IIGCC), which is madeup of 11 European institutional investors representing ¤600 billion in assets.IIGCC members believe that engagement in climate change policy discus-sions is an essential part of formulating an effective, long-term investmentstrategy for enhancing shareholder value. Thus, they embarked on a pro-gram of engagement with companies and policy makers in order to better‘‘understand’’ and ‘‘influence’’ the development of climate change policies.To further this pursuit, IIGCC has engaged with three leading Europeansectors—aviation, construction, and power producers—to help assess theirareas of exposure to climate constraints (www.iigcc.org).
Carbon Disclosure Project (CDP)
In 2002, the Carbon Disclosure Project (CDP) was introduced, in which35 institutional investors, managing more than $4.5 trillion, asked theworld’s 500 largest companies to disclose how climate change could affecttheir businesses. Of the companies surveyed at that time, the first CDPreport (CDP1) concluded that only 8 percent of the companies, representing53 percent of the emissions of the S&P 500 constituents, disclosed theiremissions. The report further revealed that emissions disclosures wererarely contemporaneous with the companies’ financial reporting (InnovestStrategic Value Advisors 2003).
In 2005, the third Carbon Disclosure Project (CDP3) grew in effec-tiveness as it mobilized 143 institutional investors with over $21 trillion in

132 CARBON FINANCE
assets under management. CDP3 results indicate a growing awareness ofclimate change and disclosure of related data among FT500 firms, some ofwhich are taking leading positions in the growing market for low-carbontechnologies and solutions. This elevation of climate change as a criticalshareholder value issue for investors is due, in no small part, to the entryinto force of the Kyoto Protocol and the launch of the EU Emissions TradingScheme. Some progress was recorded in both the disclosure and strategicmanagement of climate risk. Equally clear, however, is the fact that thereare significant gaps between levels of awareness and concrete action thathas been taken to address carbon-related risks and opportunities.
Many changes have occurred since the inception of CDP. Results ofthe most recent survey indicate growing response and disclosure ratesalong with significant developments in carbon-related profit opportunities(see Table 5.3). Some of the key positive findings gleaned from corporateresponses to the questionnaire include:
� ‘‘Clean tech’’ investments have increased significantly.� Many U.S.-based companies have taken proactive and high-profile
positions on climate change.� ‘‘Carbon funds’’ that invest in emissions reductions credits have grown
substantially.� Several FT500 financial services are offering innovative climate-linked
financial and insurance products to corporate clients.
On the more negative side, only half of the companies that flaggedclimate change as a potential commercial risk or opportunity in 2003 haveimplemented emissions reductions programs. Fewer than half of these haveeven established emission reduction targets. In fact, in the period betweenCDP2 and CDP3, 56 percent of companies with comparable data over thistime span, reported an increase in emissions.
Disclosure of emissions data in CDP3 fluctuated significantly, bothamong companies and among sectors. High impact sectors, such as oil andgas conglomerates, surface transportation, and aerospace, exhibited poordisclosure rates of less than 50 percent. In the low- and medium-impactsectors, there was a wide range of opinions regarding the financial relevanceof climate change. This trend was most evident in the financial servicessector, where many firms disregard climate change because both the directrisks of emission regulations and physical impacts on those institutions aredeemed to be low. What these institutions have failed to consider, however,is their indirect carbon exposure when providing loan and credit services totheir clients (Kiernan and Morrow 2005).
Organizations associated with the Carbon Disclosure Project continueto press the world’s leading companies to improve their carbon disclosures.

Institutional Investors and Climate Change 133
TABLE 5.3 The Evolution of the Carbon Landscape since the Inception of CDP
CDP1 (2002) CDP3 (2005)
CDPResponse rate 78% 89%Complete disclosure rate
by companies toquestionnaire
47% 71%
Support by InstitutionalInvestors
35 with $4.5 trillionin assets
155 with more than$21 trillion in assets
Progress of Policy Initiatives
Kyoto Protocol Exists, but is not ratified Protocol enters into force inFebruary 2005 with Russianratification
EU ETS Proposal gains politicalassent
Comes into effect on January1, 2005
Investment Opportunities and Accounting for Carbon
Global investments in‘‘clean tech’’
$1.10 billion $1.21 billion
Carbon Markets World Bank and Dutchgovernment involved incarbon purchaseprograms
Almost 50 public and privatecarbon funds and carbontender programs with>1.5 billion in dedicatedcapital1
Carbon Accounting Little or no guidanceavailable
Specific accounting guidanceby accounting organizationson accounting for carbonassets/liabilities anddisclosure in MD&A
Institutional Investors
Collaborations IIGCC (2001) Equator Principles (2003)CDP (2002) INCR (2004)
EAI (2004)
Sources: Adapted from Kiernan, M., and D. Morrow. 2005. The good news . . .
and the bad. Confronting climate risk: Business, investment and the Carbon Disclo-sure Project. Environmental Finance, supplement, October; and Nicholls, M., andR. Bulleid. 2005. Following the money. Environmental Finance 6(7):S28–S33.
In fact, on the instigation of two of its largest affiliates, CalPERS andCalSTERS, the climate risk survey will be extended to include 300 of theworld’s largest electric utilities. This is the first of several planned extensionsto this institutional investor initiative (Nicholls 2005c).

134 CARBON FINANCE
The Equator Principles
In June 2003, a group of major financial institutions adopted a set ofvoluntary guidelines known as the ‘‘Equator Principles,’’ with the intentionof creating an industry standard for assessing and managing environmentaland social issues in the project finance sector. The Principles were developedin response to nongovernmental organization (NGO) criticism and pressureregarding financial support for projects, such as China’s Three GorgesDam, that they considered to be socially and environmentally damaging.They are based on the policies and procedures of the International FinanceCorporation (IFC), the private-sector development arm of the World Bank.Originally, the guidelines were applied globally, across all industry sectors,including mining, forestry, and oil and gas, and to all projects with acapital cost of US$50 million or more. This was revised in July 2006 toapply to all projects worldwide, over US$10 million (including advisoryroles). They have now been adopted by 43 financial institutions, that arealso required to comply with the IFC Performance Standards and the IFCEnvironmetal Health and Safety Guidelines (www.equator-principles.com;Economist 2005d). While most major North American financial institutionsare Equator Signatories, the greatest hurdle to universal acceptance of theprincipals is the competition felt from Chinese, and some Japanese andFrench institutions, that are viewed as applying virtually no environmentalcontrols to the projects they finance.
Signatories to the Equator Principles are required to categorize projectsaccording to their environmental risk as either A (high), B (medium), or C(low). Borrowers for category A and B projects will be required to conductan environmental assessment. Borrowers for category A and some CategoryB projects will have to develop ‘‘an environmental management plan’’ basedon that assessment (Mathias 2003).
The introduction of these Principles by leading institutional investorsin the private sector is predicted to fundamentally change how projects arefinanced. Critics, however, maintain that much also depends on how theyare implemented, and to what extent lenders are determined to enforcethe Principles against their borrowers (Barrett and Mack 2004). Alreadyin 2004, NGOs have stirred a controversy regarding the approval of a$250 million loan for the Baku-Tbilisi-Ceyhan (BTC) oil pipeline, which isslated to run through Azerbaijan, Georgia, and Turkey. The 1,760-kilometerproject has been criticized on the basis that it violated the Equator Principlesin strategic environmental and social areas (Sohn 2004). At present the mostcontroversial Equator Prinicpal projects include the Sakhalin Island oil andgas project involving Shell (ABN Amro), the Botania Pulp and Paper Millin Uruguay (ING), and the Belene Bulgaria nuclear power plant (HVB).
Institutional Investors and Climate Change 135
Investor Network on Climate Risk (INCR)
In November 2003, treasurers and comptrollers from 13 US states,4 alongwith other leading investment stakeholders, met for the first time to assesstheir responsibilities in light of the financial risk posed by climate change. Anew investment forum called the Investor Network on Climate Risk (INCR)emerged as a direct result of this meeting. The participants representedalmost $1 trillion in assets under management (Innovest 2005).
In 2005, INCR (now numbering over 20 public, labor, and foundationfunds with over $2 trillion in investable assets) issued an aggressive 10-point ‘‘Renewed Call for Action,’’ urging pension funds, fund managementcompanies, and regulators to intensify efforts to provide the analyses anddisclosures required to manage climate risk. The group also committed$1 billion toward business opportunities that are emerging from the driveto reduce emissions. This commitment is designed to press their moneymanagers to integrate climate risk considerations into stock selection andportfolio construction process (INCR 2005). Members of INCR were alsopart of a larger group that called on the largest electric power companies inthe United States to report within a year how future greenhouse gas limitswill affect their financial bottom lines (Ceres 2005d).
Enhanced Analytics Initiative (EAI) With an eye to promoting better researchfrom sell-side analysts, a group of pension fund and fund managers formedthe Enhanced Analytics Initiative in 2004. Twice a year, the group examinesthe quality and coverage of sell-side research output. Their evaluation servesas a basis for EIA members’ allocation of a minimum of 5 percent of theirbrokerage commissions ($4.8 million in the third and fourth quarters of2005) to those research houses that are most effective at analyzing materialextrafinancial and intangible issues (Lespinard 2005).
CONCLUSION
It is evident that climate risks and opportunities are now embedded, tovarying degrees, in every business and investment portfolio. Environmen-tal liabilities and weather-related factors have already had an impact onthe earnings of some companies. Physical and mitigation-related climatechange policies will have a profound influence on corporations’ abilities tocreate and maintain wealth for their shareholders. In addition to regula-tory pressures, stronger disclosure requirements and shareholder activismare likely to impose further challenges to corporations in the near future.Investors at all levels will want to ensure that corporate climate changerisks and associated opportunities are being addressed. Thus, companies
136 CARBON FINANCE
that move proactively to reduce their environmental footprint and addressissues of carbon constraint may reap significant benefits by reducing costsand increasing profits and shareholder value. Thus, climate change couldhave a material impact on funds’ investments over the long term.
At the same time, there is the sense that climate risk has been neitherfully acknowledged nor managed by the institutional investors. Within thefinancial services sector, however, they do have the potential to becomeimportant players in future systems of corporate environmental governance.A recent study examining the legal limits of investment managers’ discretionin different jurisdictions concluded that, to fulfill their fiduciary duties,institutional investors must take into account material environmental factorsthat have an impact on financial performance (UNEPFI 2005a).
As the global challenges of carbon finance emerge, therefore, it seemsintuitive that institutional investors, portfolio managers, and financial ana-lysts have a responsibility to encourage the reduction of potential adverseimpacts of pollution and climate change on the wealth of their beneficiaries.A failure to do so could be interpreted as a breach of fiduciary duty.
Investors who fail to take account of climate change and carbonfinance issues in their asset allocation and equity valuations maybe exposed to significant risks, which, if left unattended, will haveserious investment repercussions over the course of time. (InnovestStrategic Value Advisors 2003, p. 2)

CHAPTER 6Emissions Trading in Theory
and Practice
Building on the innovative mechanisms set up under the KyotoProtocol . . . the EU has developed the largest company-levelscheme for trading in emissions of carbon dioxide, making it theworld leader in this emerging market. The emissions tradingscheme started in the 25 EU Member States on 1 January 2005.
European Commission 2005, p. 3
If your installation carries out any of the activities in Schedule 1 ofthe UK Regulations, you must have a greenhouse gas emissionspermit—in effect, a licence to operate and emit carbon dioxide.
Defra 2006, p. 9
INTRODUCTION
The trading of emissions under a cap-and-trade system immediately placesa company in a very different situation from the old command-and-
control approach. First, if the company expects to be short in the market,it must consider the available technology that might allow it to meet thecap. Second, it compares the cost (the marginal abatement cost) of adoptingthat technology with the current trading price of the emission in question.These assessments are pursued in competition with other producers in thesector. The key assumption behind this type of system is that the trading ofemission reduction credits among the parties will allow a given reduction tobe achieved at the lowest possible cost for the set of capped installations asa whole. The trading system obliges all participants to compete to meet the
137

138 CARBON FINANCE
reduction targets at the least cost. At this level, the theory of a cap-and-tradeemissions reduction system is extremely simple. It is a choice between makeor buy—either they make the reductions or they buy a credit from someonewho has done more than required by the cap (Marcu 2006). In practice, theimplementation of these systems is a great deal more complicated than thetheory might suggest.
Under command and control, it is true that companies could be finedfor noncompliance, and it is true that reputations could suffer for seriousbreaches of regulations. But these were rare and intermittent events, quiteunlike the attention that must be paid to a dynamic market that directlyaffects the bottom line on a daily basis.
There is still some hostility and skepticism about emissions trading. Thehostility comes from companies whose leadership believes that concernsabout climate change are exaggerated and do not require mandatory caps.Happily, this group is much smaller and less vocal than before. There is alsoskepticism from some on the environmental side of the debate who do notthink it is right that companies be allowed to ‘‘trade pollution.’’ As RichardSandor said in 1992 at the Rio Earth Summit, where the idea of tradingcarbon dioxide emission reductions was first mooted: ‘‘The right wingobjected to our vision because they thought we were environmentalists. Theleft wing objected because they thought we were capitalists’’ (Sandor 2004b,p. 14). However, what is happening now is not as dramatic or peculiar asthe critics on either side might think. Essentially, what the Kyoto Protocoland the other emission trading regimes have done is establish a market forenvironmental virtue.
We can take a simpler, hypothetical example to illustrate that this isnot as strange as it sounds. Let us say that a society wished to increasethe amount of volunteer service that people performed for the communityand that each able-bodied person between the ages of 15 and 65 was givena quota of 50 hours per year. People could do more than 50 hours, andthey would be given a credit for each extra hour above the target. Somepeople would do less because their time was overcommitted or they did notwant to participate. For every hour less than 50, they would have to buy acredit in the market. Given the proper degree of oversight by a communityboard and sufficient transparency for the trading mechanism, a market inservice credits could flourish and the work would be accomplished. Othercommunities might follow suit, and soon they would need an agreement onthe mechanisms for trading credits between communities.
One might feel that measuring hours of community service would be alot easier than measuring carbon credits, but would it really? It could stillbe done fraudulently by individuals who signed for work that was not done.One could certainly argue that some types of service were more difficult, or

Emissions Trading in Theory and Practice 139
more effective than others. One could make an argument to exclude youngpeople still at school or exclude people over the age of 60. For the KyotoProtocol these types of rules were hammered out during discussions at theMarrakech COP in 2001 and they are collectively referred to as the Mar-rakech Accords, or simply as the ‘‘Kyoto rulebook’’ (Marcu 2004, p. xxix).
Even as the Kyoto platform was under development, useful lessonswere gained from the experience of the U.S. markets in sulfur dioxide andnitrogen oxide emissions (the gases responsible for acid rain), which openedfor trading in 1995. Legislation, enacted under an extension to the CleanAir Act under the surveillance of the U.S. Environmental Protection Agency(EPA), prioritized the region with the heaviest concentration of pollutingpower stations located in the Ohio Valley. After four years running thisregional pilot scheme, the legislation was extended to the whole country in2000, going from 260 installations in Phase One to 2,100 installations inPhase Two.
Despite the usual opposition to this type of innovative activity it appearsto be a great success. The caps on emissions keep coming down. Initially,even proponents of the scheme were predicting that it would cost $400per ton of sulfur dioxide reduced, while opponents claimed $800 per ton,massive layoffs, and the decline of the economy. For the first eight years,the price rarely broke $150 per ton, although from the beginning of 2005 itbegan to rise as the cheaper abatement opportunities have been exhausted.It peaked in November at $1,650 and has since (June 2006) fallen back to$600 (Environmental Finance 2006b). There were (and still are) disputesbetween the states and the EPA, and between upwind and downwindinterests. Such disputes are resolved through negotiation or through thecourts.
Skeptics on carbon trading are correct to point out there are very impor-tant differences between managing sulfur dioxide (and nitrogen oxides) andcarbon dioxide. A key physical difference is the residence time in the atmo-sphere. The gases responsible for acid rain stay in the atmosphere only anumber of days (30 to 60), compared with decades for greenhouses gases(GHGs), and thus they are deposited much closer to their source, many ofthem within the same country as their origin. This makes the political con-text a lot simpler to understand and manage. Another important physicaldifference is that the technical options for reducing sulfur dioxide were wellknown when the legislation came into force. The simplest decision wouldbe to buy low-sulfur coal if a power station used coal, even if that meanta longer and more expensive transportation haul. The other option is toinstall scrubbers in the stack to remove the pollutants. Similar options existfor carbon dioxide (as discussed in Chapter 2), even if the switch (from coal

140 CARBON FINANCE
to gas) is more dramatic and even though the scrubbing technology is lesswell developed.
In conclusion, the comparison with the U.S. response to emissionscausing acid rain is not exact because there are important physical andpolitical differences. Nonetheless, the situations are sufficiently comparableto provide useful lessons. One is that there was widespread skepticism acrossa wide range of stakeholders as to whether this approach would work—yetit appears to have done so. The second point is that markets were the keyto reducing emissions in a cost-effective way.
Many people know how markets work and how one might be madeto work for carbon dioxide emission reductions. In theory, a market worksif a set of conditions can be met, such as differentiated abatement costsbetween participants, transparency of transactions so as to permit pricediscovery, provision for counterparty risk, and so on. The political problemis to discover how such a market might be started. Who will move first?Who will claim a special status to justify nonparticipation? How will theregulatory system be funded? How can monitoring and verification protocolsbe established so that participants may have confidence that emissions reallyhave been reduced? How can this climate change emergency be dovetailed,as a global priority, with the continuing problem of deep and widespreadpoverty in the world? If the Western industrial model (heavily dependenton fossil fuels) is the most successful one, why should those countries thatare emerging, or developing, not be allowed—even encouraged—to use it?After all, the Western commitment to global development was based onthe assumption that they would do exactly that, thereby opening up newmarkets for Western goods and services.
Obviously, there are no handy off-the-shelf answers to these problems.So, the question remains: How might a carbon market be started? Fortu-nately, this is no longer a hypothetical question, because the carbon marketis already a reality.
HOW CARBON IS TRADED NOW
The Kyoto Protocol
The Kyoto Protocol was introduced in Chapter 1, with the milestonessummarized in Table 1.1. The Protocol grew out of the United NationsFramework Climate Change Convention (UNFCCC), adopted at the RioEarth Summit in 1992. UNFCCC signatories first met as a Conference ofthe Parties (COP) in Berlin in 1995. This process and terminology followeda UN model that had been used many times before for internationalenvironmental agreements. They held COPs at least once per year until the

Emissions Trading in Theory and Practice 141
participating countries agreed to the Kyoto Protocol in 1997; thereafter,COPs continued to meet regularly to hammer out the details. Some partiesratified their adherence to the Protocol at once; some went through moretortuous procedures; while other parties, notably the United States (in 2001)and Australia (in 2002), withdrew. Despite these setbacks, the Protocol cameinto force in February 2005.
The evolution of the Protocol witnessed some strange reversals of theposition of the parties. The most important of these was that the UnitedStates was the champion of a partially market-based approach to emissionreduction, no doubt drawing on its successful experience with the acidrain problem. The Europeans were very skeptical about this, as they hadassumed that Kyoto would follow the command and control approach usedby European Union (EU) Directives. Then, following a change of president,the U.S. government withdrew from the Kyoto process. Ironically, theEuropeans retained the American proposal for trading and went ahead withthe inclusion of the so-called flexible mechanisms in their elaboration of theimplementation of the Kyoto Protocol. Furthermore, they adopted it as anessential element in the EU emissions trading scheme (ETS).
The advantage of using the trading mechanism is illustrated in Box 6.1.The scheme will have far-reaching consequences, not only for GHGs,but also for some of the more difficult challenges mentioned in theprevious section, notably coupling the challenge of climate change withthe sustainable development of low-income countries and the transfer ofthe capacity to develop clean technology.
Under the Kyoto Protocol, caps are accepted by the industrializedcountries that signed Annex 1 of the Protocol. The EU signed collec-tively as a bubble or aggregate commitment, retaining the right to allocatenational responsibility for the reductions among themselves. This deci-sion has assumed even more importance as the EU itself has greatlyexpanded—to include the 10 so-called accession countries, mainly fromcentral Europe (Williams and Kittel 2004).
There are three flexible mechanisms in the Protocol: international emis-sions trading (IET), the Clean Development Mechanism (CDM), and JointImplementation (JI). The principal operating entity under the Kyoto Proto-col is the signatory country—there is no explicit role given to subnationalentities in the Protocol. Thus, at the end of the day, national governmentsare responsible for ensuring that they physically meet their pledged carbonreductions, or for buying carbon credits on the market. In the case of ashortfall, they must ensure that the flexible mechanisms will make up thedifference. Trading will take place electronically, requiring the establish-ment of an International Transaction Log, which is scheduled to becomeoperational in 2007.

142 CARBON FINANCE
BOX 6.1 BENEFITS FROM TRADING EMISSION
REDUCTION CREDITS
The following is a hypothetical example offered by the European Unionin the brochure ‘‘EU Action against Climate Change,’’ showing howdifferences between companies’ marginal abatement costs (MACs)provide the stimulus for the creation of a market in emission reductioncredits. Two companies, A and B, each emit 100,000 metric tonsof CO2 per year and each has been allocated allowances for 95,000metric tons under their respective National Allocation Plans. Thus,each will be short 5,000 metric tons unless some action is taken, eitherto make the reduction to fit the cap or to buy credits on the market,currently trading at ¤10 per metric ton. For company A, the cost tocut 10,000 metric tons is ¤5 per metric ton so it decides to make thatreduction. For company B, the MAC is ¤15 per metric ton, and thusit is cheaper for the company to buy on the market.
The net result of these decisions is that company A receives¤50,000 from the sale of its 5,000-metric-ton surplus emission cutsand thus fully covers the cost of its reduction. For company B, with themuch higher MAC, the cap has been met at a cost of ¤50,000, insteadof the ¤75,000 it would have cost to make the required reductionin-house.Source: European Union 2005, p. 8.
Essentially, each of the mechanisms reflects the tri-status nature ofthe parties. Some parties accepted actual caps on emissions (essentiallythe Organisation for Economic Co-operation and Development [OECD]countries); some signed on in principle but retained flexibility (includingthe emerging economies of central Europe); others remained as parties but,because of their developing country status, accepted no caps. (Among theaccession countries, Malta and Cyprus do not have caps.) For internationalemissions trading (IET), both parties must have accepted caps; for JI, bothparties must have signed on in principal—allowing exchanges betweenwestern Europe and central Europe; while the CDM is designed for apartnership between capped signatories and developing countries withoutcaps. These various country categories, which are incorporated into the EUETS through the Linking Directive, are somewhat fluid, which makes thelonger-term implications of a country’s status in the Kyoto system far fromcertain. The first Kyoto Commitment Period runs from 2008 to 2012.

Emissions Trading in Theory and Practice 143
The Chicago Climate Exchange
Throughout the Kyoto negotiations, the European Union was preparingits collective responsive to the climate change challenge. In the meantime,a voluntary group in the United States was preparing to establish a pilottrading program known as the Chicago Climate Exchange (CCX) to buildinstitutions and skills. This turned out to be an extremely prescient deci-sion, given the federal government’s subsequent withdrawal from the Kyotonegotiations. Membership is drawn from a broad array of North Americancorporations, plus some municipalities, universities, and institutions. Trad-ing in the six greenhouse gases opened in December 2003. CCX is nowestablished in Europe (the European Climate Exchange—a joint venturewith the International Petroleum Exchange in London), in Canada (theMontreal Climate Exchange in partnership with the Montreal Exchange),and has plans to open offices in Japan, Russia, and New York. A Chinesetechnology company has become the latest member.
The European Union Emission Trading Scheme
It is the EU that has maintained the pace of innovation in carbon marketsthroughout the painful gestation of the Kyoto Protocol (Williams andKittel 2004). The EU ETS was designed to provide a three-year PhaseOne (2005–2007), running up to the beginning of the Protocol’s FirstCommitment Period, and a Phase Two (2008–2012) to run in parallelwith it.
The ETS was the EU’s plan to meet its Kyoto commitment of 8 percentreductions on the 1990 baseline as an aggregated or bubble target. Withinthe 8 percent bubble various targets were assigned/accepted by membercountries as described in Table 6.1 Each country then had to identifyall its installations targeted under the ETS, which included all sites with agenerating capacity of 20 MW, or more, among power producers (electricity,heat, and steam); mineral oil refiners; ferrous metal producers; pulp andpaper producers; and cement, glass, and ceramics (Dodwell 2005). Thisamounted to approximately 11,500 installations among the EU’s 25 memberstates, each of which produced a National Allocation Plan (NAP) in whichthe national cut was apportioned by site or installation. An importantcomponent of each Plan was a quantity of allowances set aside as a NewEntrant Reserve, in order to provide flexibility for new installations andnew companies.
Trading in EU Allowances began in 2004 in anticipation of the formalinitiation of the scheme in January 2005. Volumes traded rose from 8.5 MtCO2 in 2004, to 322 Mt CO2 in 2005, and 203 Mt CO2 in the first quarterof 2006 alone.

144 CARBON FINANCE
TABLE 6.1 Installations, Targets, Allowances, and Achievements for MemberStates
AverageAnnual
Allocation Short/of CO2 Emissions Long
Kyoto Allowances in of CO2 in theNumber of Target % Metric Tons in Tons CO2
Country Installations Change 2005–2007 in 2005 Market
Austria 205 –13 32,674,905 33,372,841 ShortBelgium 363 –7.5 59,853,575 55,354,096 LongCzech Rep. 435 –8 96,907,832 82,453,727 LongCyprus 13 No cap n/a n/aDenmark 378 –21 31,039,618 26,090,910 LongEstonia 43 −8 18,763,471 12,621,824 LongFinland 535 0 44,857,032 33,072,638 LongFrance 1,172 0 150,500,685 131,147,905 LongGermany 1,849 –21 495,073,574 473,715,872 LongGreece 141 +25 71,135,034 71,033,294 LongHungary 261 –6 30,236,166 25,714,574 LongIreland 143 +13 19,238,190 22,397,678 ShortItaly 1,240 –6.5 207,518,860 215,415,641 ShortLatvia 95 –8 4,054,431 2,854,424 LongLithuania 93 –8 11,468,181 6,603,869 LongLuxembourg 19 –28 n/a n/aMalta 2 No cap n/a n/aNetherlands 333 –6 86,439,031 80,351,292 LongPoland 1,166 –6 n/a n/aPortugal 239 +27 36,898,516 36,413,004 LongSlovakia 209 –8 30,363,848 25,237,739 LongSlovenia 98 –8 8,691,990 8,720,550 ShortSpain 819 +15 162,111,391 181,063,141 ShortSweden 499 +4 22,530,831 19,306,761 LongUnited Kingdom 1,078 –12.5 209,387,854 242,396,039 ShortTotal 11,428 1,829,476,015 1,785,337,819 LONG
Source: European Union 2005, 10; European Union 2006, available at http://ec.europa.eu/comm/environment/ets.
Each company that is capped under the scheme provides an annualprogress report on the achievement of reductions, which must be verifiedby an independent, approved consulting company. The reports for 2005emissions were delivered in March 2006, while National Allocation Plansfor Phase Two were due in June 2006. Unfortunately, every member state,

Emissions Trading in Theory and Practice 145
TABLE 6.2 The Emission Trading Year
1 January Start next monitoring period28 February Receive allowances for coming year31 March Complete and submit verified annual emissions to regulator1 April Enter verified emissions data into registry30 April Surrender allowances from registry account15 May Installation list indicating compliance published30 June Submit improvement report to regulatorsNovember Begin annual verification processDecember Prepare annual emissions report31 December End of monitoring period
Source: Based on Defra. 2006. An Operator’s Guide to the EU Emissions Trad-ing Scheme: the Steps to Compliance. Available at www.defra.gov.uk/environ-ment/climatechange/trading/eu/pdf/operatorsguide.pdf.
except Estonia, failed to meet this NAP 2 deadline (carbon-financeonline.com 2006).
This process, despite the setbacks, establishes a series of repeatedevents known as ‘‘the emissions trading year’’ shown in Table 6.2. Thefollowing section provides details on the NAP process for one of the smallestemitters—Malta—and one the largest—Britain. Although Switzerland andNorway do not belong to the EU, they have developed analogous nationalplans that should allow them to trade in the EU ETS.
The National Allocation Plan for Malta With a population of 397,000, Maltais by far the smallest country in the EU, and, although its gross domesticproduct (GDP) per capita sits in the middle range for the EU, it has one ofthe lowest emission rates of GHGs at 7 metric tons per capita, comparedwith the EU average of 11 metric tons. It has only two installations thatfall within the EU Directive (2003/87/EC), those being two coal-fired powerstations with a combined capacity of 576 MW, although peak demand isconsiderably below the installed capacity. They are both operated by thestate-owned energy utility, EneMalta.
Within the Kyoto Protocol, Malta (like Cyprus, another accessioncountry to the EU) is accorded developing country status and hence hasno obligation to reduce its GHG emissions at this time. Nonetheless, as amember state of the EU, Malta has produced a National Allocation Plan formanaging its carbon dioxide emissions. The Plan notes that even a singlenew entrant to the system can have a disproportionate effect in such asmall system. Nor could a new entrant be blocked for want of availableallowances, as this would be in conflict with competition policy in the EU.

146 CARBON FINANCE
The basis of the Malta NAP is to encourage energy efficiency and renewableenergy to counter the upward pressure of an expanding economy basedheavily on tourism. Tourism boosts the demand for water, which consumesnearly 10 percent of Malta’s electricity, as it relies on energy-intensivereverse-osmosis desalination plants for half of its water supply.
Thus, although it is a small system without GHG caps, the carbonimplications of Malta’s economic growth could be difficult to manage ifcaps were required in the post-2012 commitment period, because even smalleconomic increments would have a disproportionate impact on the system.Therefore, Malta’s NAP contains—in miniature—the provisions found inother EU NAPS, identifying opportunities for future improvements in energyefficiency, demand management, fuel switching, renewable energy, reduceddependence of the private automobile, and methane capture from landfills(European Commission 2004).
National Allocation Plan for the United Kingdom The U.K. Plan set targets bysector, allocating the biggest emission reductions to power stations, as theywere assumed to be less subject to international competition than othersectors such as automobiles, pulp and paper, iron and steel, and so on.Companies that were already participating in the United Kingdom’s ownemissions trading scheme were allowed to opt out of the first phase of theEU ETS (which is why the number of installations identified under the Planis greater than the number reporting verified emissions to the EU in May2006). Schedule 1 of the U.K. Regulations targets the following activities:
� Energy activities (boilers, electricity generation, combined heat andpower).
� Production and processing of ferrous metals.� Mineral industries (ceramics, tiles, brickworks).� Pulp and paper industries (Defra 2004).
Using the 20MW capacity cutoff for power generation and variousdefinitions of critical scale for other activities, the Plan covers more than1,000 installations, distributed by sector as shown in the following list.
Sector Number of Installations
Cement 27Ceramics (incl. bricks and tiles) 110Chemicals 107Engineering and vehicles 51Food and drink 146Power stations 134

Emissions Trading in Theory and Practice 147
Glass 36Iron and steel 15Lime 9Nonferrous metals 1Offshore oil and gas 112Onshore gas distribution 36Pulp and paper 93Refineries 12Services (hospitals, education,
airports, government) 170Textiles 4Source: Defra 2004
When the verified emission reductions for carbon dioxide in 2005 werereported, the United Kingdom was one of only six member states thatexceeded its allowances (see Table 6.1). Ironically, the United Kingdom hadbeen engaged in a legal process with the EU to increase its allowances, butlater dropped the case. Table 6.3 shows the returns from some of the UnitedKingdom’s reporting installations.
A key feature in the EU ETS was the inclusion of two of Kyoto’s threeflexible mechanisms even in Phase One, before Kyoto’s First CommitmentPeriod, specifically emissions trading and the CDM can be used to help acompany (or country) achieve its allocated reduction, even though there isstill a lack of clarity on how much use can be made of these mechanisms
TABLE 6.3 Examples of Allowances and Emissions from Installations in theUnited Kingdom
Allocated Verifiedallowances emissions Short/Longfor 2005 for 2005 in the
Installation in tons in Metric Tons CO2 market
Drax Power Station 14,554,187 20,771,624 ShortDidcot Power Station 4,164,052 6,342,700 ShortFreshfield Brickworks 19,649 15,473 LongHumber Refinery 2,580,539 2,351,567 LongSo’ton Geothermal 13,888 16,582 ShortTeesside Iron & Steel 6,306,630 6,370,456 ShortToyota Motor Mfg 13,312 11,765 LongOxford University 3,969 3,443 Long
Source: http://ec.europe.eu/environment/climat/emissions/pdf/citl uk.pdf.

148 CARBON FINANCE
2005 - 2007EU ETS
Phase One
Use Carbon Trading &The Clean Development Mechanism
2008 - 2012EU ETS
Phase Two
Use Carbon Trading The Clean Development Mechanism
& Joint Implementation
FIGURE 6.1 The use of Flexible Kyoto’s instruments in the EU ETS
as a percentage of the overall target. For Phase Two of the EU ETS,projects under JI may also be used (see Figure 6.1). Even within the EU,progress through these complex steps has been very mixed. Both Britain andDenmark had earlier set up their own cap-and-trade systems, which werethen dovetailed into the EU market. However, even with this practice run,there have been delays in setting the system in motion and surprises alongthe way.
The Price of Carbon in the EU ETS
From the beginning, the price of carbon has symbolized the principalgoal of carbon finance, which is to internalize the cost of GHG emis-sions into the decision-making process of governments, corporations,and—eventually—individuals. In theory, the price would be strongly relatedto the marginal abatement cost of carbon emissions reduction. In practice,the price dynamics immediately became much more complex.
The first price of carbon to emerge on the market came from the ChicagoClimate Exchange in September 2003 at the US$1.50 to 2.50 range. Thiswas a voluntary market and experts believed that the price was lowerthan would emerge in a compulsory system with enforceable penalties fornoncompliance. The ¤40 and ¤100 penalties for the first and second phaseof the EU ETS signaled an expected upper bound in that market, while thefirst Certified Emissions Reductions from the CDM were in the ¤5 to ¤7range, reflecting the high transaction costs for the pioneer buyers.
In the early stages in 2005, it was not possible to see any price interplaybetween the CDM project market and the EU ETS, partly because bothmarkets were new and small. Instead, the most evident linkage for the EUETS allowance was the cost of energy, especially the dark/spark spreadbetween the cost of coal and the cost of natural gas. As gas prices rosebecause of supply shortages, producers at the margin would switch to coal,if able to do so, thus pushing up the price of carbon credits, reflecting thegreater carbon intensity of coal. Rising carbon prices would further increasepressure on fuel prices. Weather also influenced the price of energy and

Emissions Trading in Theory and Practice 149
carbon as low rainfall depressed hydroelectric power (HEP) production,while warmer summers and colder winters increased demand for energy.
Correlations between the price of carbon and the price of energyseemed to support this interpretation in the first few months of the EU ETS.However, possible problems in the design of the first compulsory carbonmarket came in for discussion throughout 2005. While there was certainlya correlation, the direction of causation was disputed. Attention focusedon what was widely perceived as a mistaken decision to allocate emissionallowances at zero cost. Major power users then had to grapple with priceincreases as the energy producers passed on the opportunity cost of theallowances (Sijm et al. 2005; Kanen, forthcoming; World Bank and IETA2006). Retrospective taxes and allowance claw backs were proposed asenergy suppliers were perceived as reaping windfall profits, derived from thesurge in oil and gas prices and the distribution of free carbon allowances.
From the turmoil, it was difficult to know if the pricing of carbontogether with a rise in the cost of oil and gas had encouraged any actualreduction in carbon emissions, as predicted by the designers of the EUETS. Emitters’ concern about the impending deadline for reporting theiremissions by April 30, 2006, drove the carbon price (for the 2006 vintage)beyond ¤20 in the fall of 2005, decoupling the carbon price from anycorrelation with energy prices, until it reached nearly ¤30 per metric ton inmid-April, as the reporting deadline approached. Suddenly, the ¤40 penaltyfor noncompliance in Phase One began to look quite prescient. It appearedas if a lively market had emerged exactly as the architects of the scheme hadpromised.
National reports on 2005 emissions were due to be released by theEU on May 15, but some national results were released on April 25. Theywere all dramatically long; while rumors indicted that there would be moreof the same. In 48 hours the price plunged to ¤8 for the 2006 vintage.Most of the remaining reports were released by the official due date, andthey confirmed the picture of a widespread overallocation of allowances,except for the handful of countries that reported short (see Table 6.1). Thequestion of ‘‘who knew what, and when?’’ remains unanswered. It is likelythat the market suffered from a systemic weakness of overallocation ofallowances because governments were anxious to ensure participation bythe companies that had been capped by the scheme. This situation mighthave become apparent only as the aggregated results came in (Lekander2006, personal communication).
Once the initial shock had passed the market rallied for reasons thatremain obscure (Nicholls 2006d). Perhaps traders took a longer-term viewand drew some assurance that at least the emissions data for Phase Twowould rest on a much firmer base and that the EU Commissioners and all

150 CARBON FINANCE
the member states would need to formulate realistic plans for Phase Two inorder to meet their Kyoto targets.
Many other potential price factors have yet to be felt in the carbonmarket, such as the supply and quality of credits from the CDM and JI. Itis also apparent that a longer time frame than Phase One (three years) isneeded if corporations are to make significant investment decisions in linewith their carbon abatement costs. In their preliminary announcements ofPhase Two NAPs, some countries have already indicated that in the nextround some allowances will be auctioned (e.g., United Kingdom, 7 percent;France, 10 percent), while some have indicated for the first time the actuallimits for the contribution of the CDM and JI to emission targets (UnitedKingdom, 8 percent at the installation level; Ireland, 50 percent; Germany,12 percent; Italy, 10 percent; France, 10 percent).
We have heard the predictable cries for government-guaranteed pricecaps on the carbon market, but the EU has maintained its position that theprice will be determined by demand and supply. Despite the surprise in thelast week of April, Phase One has served its purpose as an important trialperiod for the EU before beginning the First Commitment Period of Kyotoin 2008. Perhaps what is most fundamental is that the scheme has producedthe first database of emissions at the installation level, verified by approved,independent third parties. As the Kyoto Period opens, the EU will havethree years of such data and the danger of overallocation of allowances willbe greatly reduced. The Directives that created the EU ETS also includedprovision for a review of the scheme to be conducted after the completionof the first year of operation (in 2006). The review specifically excluded anyconsideration of the post-2012 situation, implying that the scheme wouldcontinue indefinitely (Zapfel 2006).
Countries outside Europe with Kyoto Caps
Compared to the activity and excitement in the EU carbon market, verylittle has happened in those counties outside Europe that do nonethelesshave Kyoto caps on their emissions. Japan, Canada, and New Zealandhave all confirmed their adherence to the Protocol and have produced theirown National Action Plans, although they are nowhere close to the samekind of detail and comprehensiveness as required in the EU. Each of thesethree countries is hampered by isolation from the EU, the main center ofactivity, and by the absence of their major trading partners (United Statesand Australia) from the Protocol. It is still not clear to what extent theywill be able to operate their own carbon trading platforms and to whatextent they will be able to link up to the EU ETS. As the theory of thismarket implies that the bigger the carbon market the lower the overall cost

Emissions Trading in Theory and Practice 151
of compliance will be, companies in these isolated parts of the system willbe paying a higher price for compliance than companies in the EU, unlessthey can negotiate a fluid linkage with the main platform. If they fail to dothis, then the small scale of purely national markets will, at the very least,seriously inhibit the development of liquidity.
Carbon Markets in the United States and Australia
In the meantime, the United States and Australia have started an Asia-PacificPartnership on Clean Development and Climate with India, China, Japan,and South Korea to discuss voluntary approaches to emission reduction,relying on technology, but with no targets and no caps (Morris 2006). Thecurrent (2006) federal governments of the United States and Australia seemto share three assumptions with the now defunct Coalition Against ClimateChange, a group of mainly American industrial corporations that lobbiedagainst the Kyoto Protocol in the early 1990s. Of their assumptions, thefirst is that the science of climate change is still so uncertain that action isnot clearly indicated. Second, Coalition members assumed that any countrythat adopted a cap on its emissions risks putting itself at grave competitivedisadvantage with the countries that did not. Third, that so long as majoremitters among the developing countries (especially China and India, withtheir huge economies heavily dependent on burning coal) do not sign up tocaps, then action on the part of any other country would be pointless.
To some extent these were legitimate concerns in the early 1990s. Thereare still uncertainties about the science of climate change, though muchless so than 10 years ago. The second fear has proved to quite groundless;indeed, the opposite is true. As BP demonstrated several years ago, it ispossible to make significant cuts in emissions and make a profit from theenergy savings. Other major corporations, such as Alcan, Alcoa, Dupont,IBM, Shell, and Toyota, have demonstrated the same outcome. Proof ordisproof of the legitimacy of the third concern still lies in the future. Butwhatever that uncertainty amounts to, the obligation to make immediatecuts clearly lies on the shoulders of the first industrialized countries thatprospered while lodging excess GHGs in the atmosphere. For the olderindustrialized countries, their historical contribution to GHGs currentlyin the atmosphere is much greater than their current share. For example,Britain’s historic share is three times its present percentage.
It is too soon to speculate on the likely outcome of the Asia-Pacific Part-nership. What is clear is that the lack of commitment at the federal level,in both the United States and Australia, is in stark contrast to the hive ofactivity at all others levels of government, in communities, and in the privatesector. Chapter 4 alluded to activity at the municipal level under the U.S.

152 CARBON FINANCE
Mayors Climate Protection Agreement and the Cities for Climate Protectionorganized by the International Council for Local Environmental Initiatives.The majority of the U.S. states now have a program that reduces GHGemissions, often while meeting complementary objectives. For example,Nebraska has a reduced tillage incentive scheme that will reduce carbondioxide emissions from the soil while supporting soil conservation and diver-sifying farmers’ incomes. Texas introduced a Renewable Portfolio Standardin 1999, mainly to provide a supplementary source of clean energy at the timeof peak demand in the summer. The program has already brought approxi-mately 2,000 MW of new capacity to the state, mostly from wind farms, plussome solar power and small hydro. In California, the Public Utilities Com-mission has approved a Solar Initiative that aims to stimulate 3,000 MW ofrooftop solar capacity by 2017, relying on ‘‘rebates for solar installations,funded by surcharges on utility distribution rates’’ (Pospisil 2006).
One of the most ambitious multistate initiatives is the Regional Green-house Gas Inventory, a cap-and-trade system supported by eight states fromNew England and the mid-Atlantic, which is now going to the state leg-islatures for ratification (Gillenwater 2005; Lancaster and Pospisil 2006).Recently, 10 states in the West have proposed a regional GHG reductionplan. A specific problem faced by these subnational schemes is the dangerof leakage, as energy consumers choose to import energy from outside theparticipating region rather than participate in a cap-and-trade regime.
This plethora of actions is welcome, although it will present potentialcarbon traders with a complex set of related, but not necessarily compatibleopportunities (Danish 2006). Fortunately, several initiatives have been takenby Congress to bring together a national approach to GHG reduction,including the tabling of a white paper by the Democrat and Republicanleaders of the Senate Energy and Natural Resources Committee. The paperoutlined a mandatory market-based greenhouse gas regulatory system tobe presented to Congress as an amendment to the Energy Policy Act of2005 (Domenici and Bingaman 2006). Their analysis follows closely theissues covered in Chapter 2 regarding the choices available for regulatingemissions from the energy chain, especially the pros and cons of regulatingthe upstream or the downstream part of the chain—the upstream, intheir view, being the fossil-fuel producers, and the downstream the powerproducers and energy-intensive industries—identified as steel, aluminum,chemicals, pulp and paper, and cement.
A similar process has taken place in Australia, where the first ministersof the states and territories have reached agreement on 10 design principlesto underpin a planned national emissions trading scheme—despite thefederal government’s steadfast refusal to support the initiative. The mosttrading has taken place in the New South Wales GHG Abatement Scheme,

Emissions Trading in Theory and Practice 153
which began in 2004 with caps and fines for noncompliance focused onpower producers (World Bank and IETA 2006).
Setting up the Clean Development Mechanismand Joint Implementation
The problem of getting started alluded to above was nowhere more obviousthan in finding a means to bring developing countries into the climatechange challenge without expecting them to accept caps on their greenhousegas emissions. After a number of false starts, the Clean DevelopmentMechanism (CDM) was designed to encourage Kyoto-capped countries toinvest in greenhouse gas reduction projects in developing countries andthereby earn Certified Emission Reductions (CERs), which they could usetoward their own reduction targets.
These projects had a number of conditions attached to them. First, eachprotocol used for measuring emission reductions had to be approved by theExecutive Board set up for the CDM, and every type of project (landfillgas, manure management, energy efficiency, small hydro, etc.) would needits own protocol for project design, operation, and monitoring. Later, theBoard had to approve each project in order that the CERs could be issued.Furthermore, it was essential that the CDM was not seen as a way ofletting richer countries off the hook for reducing their own GHG emissions
BOX 6.2 TRADING THROUGH THE CLEAN
DEVELOPMENT MECHANISM
The Dutch government has been in the forefront of CDM finance.In one project in the Indian province of Rajasthan, it has funded theconstruction of two biomass-fueled power stations with a combinedcapacity of 14.8MW. The power stations burn mustard crop residues,cotton stalks, and rice husks, displacing older facilities that burnedlignite and coal. The project provided additional income and employ-ment locally while generating 637,737 Certified Emission ReductionCredits (CERs) over the period 2004–2013.
A second Dutch-funded CDM project in the province of InnerMongolia, China, installed a 22-turbine wind farm with a capacity of25.8MW, avoiding further reliance on coal, and generating 523,914CERs over the same period.Source: European Union 2005, p. 18.

154 CARBON FINANCE
by simply diverting their overseas development assistance into this newprogram (World Bank 2006, FAQ). Thus, each project had to meet thegoal of sustainable development in the host (developing) country. Also eachproject had to meet the additionality requirement, meaning that it hadto be demonstrated that it was not simply the aid equivalent of businessas usual, and, furthermore, the technology used in the project would betransferred to the host country. An important part of this demonstrationrequired establishing that it was the value of the CERs themselves that madeotherwise unattractive projects bankable. It also had to be shown that theproject was not already slated for funding in the host country’s developmentplan. Finally, there was the supplementarity requirement with regard to theinvesting country’s GHG reduction strategy, meaning that the CDM couldbe only a minor part of the strategy, and that real emission reductions wouldhave to be made at home. (See above for examples.)
All of these complex requirements were included for good reason, toensure that the CDM would operate in the interests of the host (developing)countries and that it not be used as a vehicle that would allow the investingcountry to ignore the need to make significant emission reductions athome. However, some of these requirements have proved very difficult tooperationalize and might produce perverse results. For example, a hostcountry might avoid making energy efficiency part of its developmentstrategy in order that such projects could meet the additionality criteria forthe CDM.
Even so, the CDM has not yet emerged to fill the ambitious rolefor which it had been designed, especially as a catalyst for sustainabledevelopment in the uncapped countries of the developing world. The mix ofprojects currently in the CDM pipeline is shown in Table 6.4. This showsthat the CDM contribution toward GHG reductions is skewed towardindustrial projects that yield a very large number of CERs because of the highglobal warming potential of the gases they control. Specifically, the reductionof hydrofluorocarbons (HFCs) in refrigeration and semiconductor plants,the reduction of N2O emissions from nitric acid plants, and the capture anduse of methane from landfills and coal mines have proved profitable andpopular among investors. In comparison, renewable energy projects and thecontrol of emissions from agricultural practices require greater investment,more time to fruition, and more uncertainty in operation (Willis, Wilder, andCurnow 2006). Waiting for the availability of the International TransactionLog has been another factor that has delayed the evolution of a liquidmarket in CDM projects.
Joint Implementation (JI) is the third flexible mechanism (after emissionstrading and the CDM) set up by the Kyoto Protocol. It was designed to allowcountries with Kyoto caps to invest in other industrialized Kyoto signatories,

Emissions Trading in Theory and Practice 155
TABLE 6.4 CDM Projects in the Pipeline by Technology (as % share of volumecontracted)
Technology January–December 2004 January 2005–March 2006
Agro-forestry/LULUCF 2 1Animal waste 15 2Biomass 9 3Coalmine methane 2 6Energy efficiency 4 2HFC destruction 36 58Hydroelectric power 5 3Landfill gas (methane) 3 9Nitrous oxide 1 3Wind 7 3Other 16 9
Source: Based on World Bank and IETA. 2006. State and Trends of the CarbonMarket 2006. Paper presented at the 2006 Carbon Expo, Cologne.
BOX 6.3 TRADING THROUGH JOINT
IMPLEMENTATION
The Dutch government has also invested in the construction of a91MW wind farm in Palmerston North, New Zealand. Constructionstarted in May 2004, and will avert a projected shift from expensivegas to cheaper coal. The project will also generate 530,000 EmissionsReduction Units (ERUs), annually, over the first Kyoto CompliancePeriod, 2008–2012.Source: European Union 2005, p. 18.
including the ex-communist economies of central and eastern Europe. Aswith the CDM, the rationale for JI was the potential to transfer capital andexpertise from the richer industrialized countries to other countries wherecost-efficient GHG reductions were available. Box 6.3 provides an exampleof Dutch investment in New Zealand.
Although JI was on the table for discussions from the earliest days of thedevelopment of the Kyoto Protocol, its progress has been more delayed thanthe CDM even though the latter had to confront the additional challengeof working in lower-income countries lacking the necessary databasesand expertise. Certain political factors beyond the control of the Kyoto

156 CARBON FINANCE
planners have been responsible for the lack of progress in JI. First, eightof the key economies that might have provided JI projects joined the EUin 2004 as the accession countries; as such, their GHG reduction creditsbecame eligible as EU allowances, but could no longer be counted as JIEmission Reduction Units (ERUs). The remaining potential major sourceswere Russia and Ukraine, which did not ratify the Kyoto Protocol until 2004,thereby discouraging the development of the JI market until recently (Liese2006). Even after ratification, these potential JI host countries then facedthe demanding tasks associated with setting up the complex bureaucraticinfrastructure required for trading in Kyoto flexible mechanisms.
Not only were the potential hosts slow to build the required capacityto generate JI projects. The UN Conference of the Parties—the ruling bodyresponsible for the design of the mechanisms necessary for the implementa-tion of the Kyoto Protocol—did not provide a key piece of the infrastructureuntil the first COP/MOP meeting in Montreal (December 2005) when itestablished the Joint Implementation Supervisory Committee (Joshi 2006).
The Role of Carbon Funds, Carbon Brokers,and Exchanges
Even though the CDM was an entirely new kind of venture, the WorldBank at least had very extensive knowledge of the development side ofthe equation. Accordingly, the Bank established the Carbon PrototypeFund in 1999 to chart these new waters and demonstrate how the goalsof development could be meshed with emission reduction projects to thebenefit of all the partners involved. There was also concern at the Bankthat, when the CDM did begin to roll, projects would be concentrated inthe largest developing countries (specifically Brazil, China, and India), inorder to reduce transaction costs on the part of the investing parties, and thescheme would thereby ignore the smaller and poorer countries, especiallyin Africa. Above all, the entire mandate of the World Bank for povertyreduction in the poorest countries in the world was being put further at riskby the gathering threat of climate change. Lastly, the timing was very tight.Without commitments beyond 2012, the CDM could close in 2006 or 2007given the gestation period for project identification, CDM approval, projectimplementation, and the generation of marketable carbon credits.
There was no doubt at the Bank that its role in the nascent CDM wasthat of the honest broker, and there could be little question about the need forsuch a player. Countries seeking credits for Kyoto compliance expected theirrespective private-sector partners to source emission reduction opportunitiesthrough the CDM. However, it was not realistic to expect that, for example,an energy producer in the United Kingdom or a cement producer in Italy

Emissions Trading in Theory and Practice 157
would develop a global capacity for sourcing carbon credits. Furthermore,whatever capacity they might develop would probably exclude the smaller,poorer countries about which the Bank was particularly concerned.
Given the circumstances, it was perhaps with some surprise that theBank found itself accused of ‘‘competing unfairly with the private sector,thereby distorting the market’’ (Environmental Finance 2004). Being achampion of market forces long before the development of carbon finance,this kind of criticism may have been found particularly galling at the Bank.As Ken Newcombe, then head of Carbon Finance at the Bank, said,
The last four years have been focused on creating demand of anykind: companies’ appetite to invest in the CDM in the completeabsence of regulatory knowledge has been almost non-existent.Some governments have dabbled, but the only way to get invest-ment into the CDM has been through working with the Bank,to manage transaction costs, and pioneer [baseline] methodologiesand business processes.(Nicholls 2005d, 15)
Since the Bank paved the way in 1999, the role of carbon funds inthe implementation of the Kyoto Protocol has grown steadily, as govern-ments and corporations have built their bridges to countries willing to hostCDM and JI projects. If the term carbon fund is defined as including buyers’pools and government procurement funds, then 45 such funds were activeearly in 2006, representing some US$4.6 billion of capital (Nicholls 2006e).
Despite the difficulties ahead, the private sector will be seeking carboncredits, either to meet their Kyoto obligations (started in 2005 in the EUETS), to fulfill their mandate under a voluntary scheme (such as the UKETS, the New South Wales Scheme, or the Chicago Climate Exchange), orto develop a carbon-neutral status to enhance their reputation and enlargetheir market share as climate change goes up on the scale of global concerns.
In hindsight it seems fairly clear that the Bank’s Carbon PrototypeFund was a key initiative in the struggle to get this novel approach tointernational relations off the drawing board. Despite all the uncertainties(many of which are still with us), it appears that the role of carbon brokeris now firmly established in the global economy. It remains to be seenwhether the CDM can fulfill its complex mandate of delivering emissionsreduction and sustainable development in developing countries. In thiscontext, the section on Key Issues will take up some of the implications ofthe composition of the projects in Table 6.4.
Just as the role of carbon broker has emerged as a linchpin of thenew world of carbon finance, so has the role of the carbon exchange. Theearliest trading of carbon credits relied on over-the-counter transactions as

158 CARBON FINANCE
companies learned to grapple with this new commodity. With the openingof the EU ETS in January 2005, no less than eight exchanges offered carbontrading services (Bulleid 2005b). The most widely offered contract is theEU Allowance—the basis of the EU ETS—although some offer, or plan tooffer, CERS from the CDM and ERUs from JI projects. Some exchangesalso plan to trade in credits from voluntary allowances. Details of theirprofiles are given in Table 6.5.
TABLE 6.5 Carbon Exchanges Established at the Opening of the EU ETS(January 2005)
Exchange Base Contracts Traded Target Users
Austrian EnergyExchange
Graz Spot EUAs Broad
Chicago ClimateExchange (CCX)
Chicago Spot contracts forCarbonFinancialInstruments
Direct and indirectemitters in the UnitedStates and beyond
Climex Amsterdam Spot EUAs Smaller companies inthe EU ETS
European ClimateExchange (ECX)
Amsterdam Quarterly EUAfutures
Major utilities and oilcompanies, banks,hedge funds
European EnergyExchange (EEX)
Leipzig Spot EUAs Open; started withEurope’s largestpower companies
Greenhouse GasExchange (GHGx)
Toronto Spot AAUs, CERs,ERUs, RMUs,and voluntarycredits
Open; started with largecompanies inpetroleum andforestry
Nord Pool Lysaker Annual forwardcontracts forEUAs
Major European energycompanies, banks,and industrials
Powernext Carbon Paris Spot EUAs Open; started withFrench powercompanies
Sendeco2 Barcelona Spot EUAs Purchasing centre forSpanish companies;bridge between smalland large participants
Source: Bulleid, R. 2005b. Exchanges—coming to the market. EnvironmentalFinance, May 2005. Supplement: Global Carbon 2005, S24–S27.

Emissions Trading in Theory and Practice 159
KEY ISSUES
Verification — Protocols for MeasuringEmission Reductions
The basic measurement problem at the heart of the climate challenge is theaccurate assessment of the amount of carbon avoided by various activities,such as fuel switching, new combustion technology, and so on. We nowhave some confidence in these measurements for industrial processes whereit is possible to measure the key inputs and the quantity of gas emitted. Forenergy production and use, we will eventually measure emissions at everypoint in the chain from materials extraction, manufacturing, product use,and product disposal. Measurements from one part of the chain will helpto verify measurements at other parts of the chain. This is also true for theHFC destruction process, which has so far contributed the largest singlenumber of credits in the CDM.
However, for many of the CDM’s agro-forestry projects such as biomassenergy and manure management, outputs are much less predictable, as theywill depend on temperature, moisture, and fire, as well as the day-to-daymanagement of the activity. This is one reason why the launch of the CDMhas been so challenging.
Within the EU ETS, the completion of the first trading year has providedvaluable lessons that can help to strengthen the verification process. Thefirst and most obvious lesson is that setting up the verification infrastructureis a time-consuming process and the parties responsible should make dueallowance for this. In some countries, installations were late in receivingtheir allowances and verifiers were not approved on time (Rescalvo 2006).Further problems arose from the lack of consistency in the accreditationof verifiers among the Member States and in the lack of consistency inthe guidance provided for the task (Rescalvo 2006; Dornau 2006). At theinstallation level, many operators were unprepared for the operation, whichrequired the integration of reporting procedures for physical and financialsystems for the first time.
No doubt, many of these problems arose because of the novelty of theoperation, the vast physical scale, and the very short time frame. It certainlydemonstrated the value of the EU’s running Phase One before the onsetof the first Kyoto Commitment Period in 2008–2012. It also vindicatedthe critical importance of having independent verifiers who stand betweenthe governments issuing the allowances and the operators submitting theiremissions data.

160 CARBON FINANCE
Controlling the Sale of “Hot Air”
A curious historical coincidence has threatened the integrity of the Kyotoprocess from the beginning. The baseline year for the Kyoto targets was setas 1990, as that was the latest year, at the time, for which emissions datawere widely available. However, that was also the time of the decline ofcommunism and the sometimes chaotic transition to the market economyin the former Soviet Union and other countries of the Warsaw Pact.Once state control was removed, many enterprises were unviable and theirdoors were closed, while the more promising operations were prepared forprivatization. As a result of this political and economic transition, GHGemissions in those countries plummeted. Suddenly, whatever the outcomeof the Kyoto negotiations, all of the former communist countries werefar below their 1990 baseline, their targets having been achieved as theby-product of another process entirely.
The fear among the Kyoto designers was that the moment emissionsreductions became monetized in the carbon market, these accidental reduc-tions would flood the market as hot air, cheap because of their quantity.For the emitters under Kyoto caps, their problem could be solved by buyingcheap credits, while the climate change problem would not be solved atall. For the accession countries that were formerly members of the WarsawPact, this potential windfall has now been reduced, because—for manyof them—the caps under their National Allocation Plans have been estab-lished close to their current emission levels, not at the now meaningless1990 figure.
Despite the widespread concern that the abundance of hot air creditswould completely undermine the integrity of the EU ETS, there was alwaysthe hope that the potential providers of these credits (most notably AAUsfrom JI projects in Russia and the Ukraine) would make the obviousconnection between quantity and price and conclude that it was in their bestinterest to restrict the flow of credits and thereby maintain a lucrative price.Further to this realization, there is a growing consensus that any trade ofthese credits must be backed by meaningful environmental targets, such asthose embedded in Green Investment Schemes whereby the revenues fromthe sale of AAUs are invested in emission reduction activities such as energyefficiency projects (Gorina 2006).
Although there have been delays in engaging Russia and Ukraine inthe Kyoto process—mostly for reasons unrelated the challenge of climatechange—there are many indications now that both countries are determinedto meet the eligibility criteria required for trading in JI and the otherflexible mechanisms (Bodnar 2006). These criteria include, among others,the calculation of the assigned amount of emission reductions required for

Emissions Trading in Theory and Practice 161
the 2008–2012 period, a national register for emissions of GHGs, and aregister for trading all the instruments under the Protocol (Bodnar).
The Quality and Price of Carbon Credits
One of the fascinating questions about the evolution of the global carbonmarket is how soon will it be before the various qualities of carbon creditswill be reflected by transparent price mechanisms. All commodities (exceptperhaps for currencies) exhibit variability in product quality. To understandoil prices, for example, the market uses well established qualities, suchas West Texas Intermediate, or Brent North Sea, as indicators of marketshifts. No doubt, as the carbon market evolves similar market markers willemerge. For example, through 2005 and 2006 the most commonly quotedallowance price of the EU ETS has been for December 2006.
In the early stages of the EU ETS, there was a large discrepancy betweenthe price for EU allowances being traded through exchanges, and the pricefor CDM credits (CERs), the former being (April 2006) about ¤30 andthe latter being less than ¤11. The difference partly reflected differences intransaction costs because the purchasers of the CERs have to invest timeand money to source the CERs, whereas EUAs can be purchased at the costof a single call and a small transaction fee. Another factor was the apparentcertainty of the output from an EUA and the much greater heterogeneityof the credits from the CDM. However, as both products can be appliedto exactly the same obligation, one would expect this price differential tobecome much smaller. In fact, with the plunge in the EUA price at the endof April, there was some fear that the price for the remainder of PhaseOne could drop to near zero, while CDM projects would retain their valueas they could be used for compliance in Phase Two and for other Kyotomarkets.
Enforcing Compliance
A key element in designing markets is identifying the penalty for noncompli-ance. There is, of course, the general threat of the consequences of climatechange. However, the designers of the EU ETS wisely decided that a moreimmediate penalty should be enforced; they settled on ¤40 per metric tonof CO2-e above the cap in Phase One (2005–2007) and ¤100 per metricton for Phase Two (2008–2012). At the time these penalties were selected,expectations for the likely cost of emission reductions were much lower,about ¤6 per metric ton. For example, the Canadian government announcedat the time that the Kyoto Protocol was brought before Parliament that thegovernment would cap the cost of the private sector’s compliance at Cnd$15 per metric ton (= ¤10.50).

162 CARBON FINANCE
Integrating the Various Trading Platforms
The Kyoto Protocol represents a commitment made by national govern-ments. The means of meeting that commitment was left to the parties tothe Protocol. The only national governments that have so far producedthe details of how they would do that are the governments of the Euro-pean Union. Even though the EU trading platform is not yet complete, thetimetable and key expectations of the EU are fairly clear.
Other platforms are only works in progress for those governmentsoutside the EU. Ultimately, they must attempt to link to the EU and otherKyoto signatories to maximize the potential benefit from trading emissionreduction credits. The picture is most complex in the United States andAustralia where lower orders of government—in the absence of federalleadership—have forged ahead and built their own trading platforms.
The CDM Bottleneck
Apart from suffering from procedural complexity, the CDM machinery wasalso starved of resources, having only a handful of staff available to managethe biggest environmental challenge the world has ever faced. Whereasmost other problems can be tackled in a piecemeal fashion, climate changemust be addressed in a coordinated way if we are to have any chance ofsucceeding in reducing the risk in time.
The difficulty of identifying suitable projects and getting them throughthe approval process kept the first flow of projects to a trickle, but soon thefirst key deadline was emerging—December 2005 was the last date to getapproval for a project that would count toward Kyoto’s First CompliancePeriod (2008–2012). Then the trickle turned to a flood once the opening ofthe EU ETS in January 2005 made the carbon market a reality.
At the Montreal COP/MOP in December 2005, two important deci-sions were made. One was to recognize that many projects were in theCDM pipeline awaiting approval and that it was no fault of the projectproponents that they had not been approved in time. Therefore, the deadlinewas extended. The lack of adequate resources for managing the project (andprotocol) approval process was recognized and a levy of $0.20 per carboncredit ($0.10 on projects below 15,000 tonnes) on the value of the CERscreated by the CDM was allocated toward its management (EnvironmentalFinance Online 2005). The number of new protocols requiring approvalshould diminish as new projects will make use of existing protocols. Fur-thermore, all parties will become more familiar with the complex processand understand the potential for the distribution of broad benefits. If theseconditions can be met then the CDM bottleneck should ease.

Emissions Trading in Theory and Practice 163
Extending the Time Horizon beyond 2012
The current timeline for Kyoto compliance is not supportive of the effortrequired to make the system work because abatement decisions require muchlonger timelines for planning and response to incentives. As we have seenwith the EU ETS and the CDM, it takes time to put major new regulationsand incentives in place. For people, corporations, and institutions to committo the system, there must be confidence that the system will endure. Also,the physical parameters about which participants must make decisionsrequire a longer timeline. Power plants may require 10 years to design,receive approval, and construct. Their productive life will run from 15to 30 years. Similarly, biomass sequestration projects, even on short-croprotation, require decades to produce their full value. These timelines arewell known. Within the EU ETS it is quite understood that the commitmentmust continue for a very long time, beyond any current political horizon,even if the Kyoto process falters. At the Montreal COP/MOP, the urgencyof the need for some clarity on this issue resulted in a commitment to begindiscussions on a post-2012 agreement. To provide some encouragement,the World Bank is already buying credits for the post-2012 period, whilepolicy makers in the EU are confident that 2012 will be followed by a seriesof five-year compliance periods (Zapfel 2006).
Extending Carbon Caps to Uncapped Parties
Meanwhile, an equally large challenge is to bring in the OECD nonsigna-tories and the large emitters among the developing countries. Two positivepoints can be noted. First, within both the United States and Australiathere is a huge groundswell of support for tackling climate change. Thismomentum has gathered despite the lack of encouragement—indeed per-sistent opposition—from the federal leadership. In the United States, thebiggest state economies—New York and California—are among the num-ber of states already committed to mandatory caps on GHG emissions.Meanwhile, the RGGI came into force in 2006 and a western group of10 states is planning a similar regional scheme. A white paper from theSenate’s Energy Committee states the same aim, while, in June 2006, 40senators (including John McCain and Hilary Clinton) wrote a strong letterto the president stating that ‘‘U.S. action on global warming is long over-due’’ (United States Senate 2006). They pointed out not only the growingevidence that climate change poses a huge and imminent risk to the world,but also that corporations operating in the United States were falling behindtheir European-based competitors in developing products and services tocombat the threat.

164 CARBON FINANCE
Second, among the countries of the developing world, there has longbeen recognition that urgent action against climate change was needed andthat would require caps on all significant emitters, the poorer as well as thericher. The governments of Argentina, Brazil, and Mexico have all indicatedtheir willingness to accept caps. It is also significant that the first country inthe world to respond to the Rio Declaration in 1992 with a national climateplan was China.
THE CARBON OFFSET MARKET
In addition to the government initiatives to reduce GHG emissions, carbonfinance has been taken up by the nongovernmental sector and the privatesector to enable individuals and businesses to reduce their carbon footprint.This might be done by an individual out of concern for our environmentalfuture or by a business to enhance its reputation. Since the late 1990s,a number of companies, like Climate Care, have emerged to serve thisniche market by funding and managing projects in renewable energy,energy efficiency, and forest restoration. To maintain their credibility, offsetcompanies employ third parties to establish the carbon baseline and tomonitor project progress.
As more people realize that certain activities, like flying, make specificadditions to the GHG burden, the practice of buying carbon offsets shouldbecome more widespread. For example, the U.K. government now assertsthat all official airline use will be covered by purchasing carbon offsetcredits. Every year, more companies declare that their business is conductedin a carbon-neutral fashion, HSBC being the first global bank to announcethis achievement.
Current projects in Climate Care’s offset portfolio include:
� Efficient lighting in households in South Africa and schools inKazakhstan.
� Efficient cooking stoves in Honduras, Bangladesh, and Madagascar.� Renewable energy stoves for schools in India.� Biogas digesters to save tiger habitat in India.� Rainforest restoration in Uganda (http://www.climatecare.org).
Other companies and consortia have established a business presencein the market for carbon offsets. For example, the Chicago ClimateExchange (CCX) supports trading between offset providers (such as farmsand forests) to offset purchasers (such as producers and users of fossilfuels) for offset projects in North, South, and Central America, which

Emissions Trading in Theory and Practice 165
are registered on the exchange. The CCX register is supported by third-party verifiers, many of whom are also working in the EU ETS. (Seehttp://www.chicagoclimatex.com/environment/offsets/index.html.)
Specifically, the CCX offers the following offset projects types:
� CCX Forest: Carbon Emissions Offsets.� CCX Agricultural: Soil Carbon Offsets.� CCX Agricultural: Methane Emissions Offsets.� CCX Landfill Methane Emissions Offsets.� CCX Renewable Energy Emissions Offsets.
THE ROLE OF INSURANCE IN EMISSIONS TRADING
A new class of activities like carbon finance entails new types of risk andnew combinations of previously covered risks. To what extent can new andexisting insurance products be applied to carbon finance? If you took onetype of transaction such as a CER traded through the CDM, overall riskscan be grouped as performance risk, referring to the likelihood that theproduct will be delivered as contracted (Kohler 2005). This performancerisk can be broken down into familiar categories such as:
� Counterparty risk� Carbon regulatory risk� Country investment risk� Technology performance risk� Business interruption� Directors’ and Officers’ liability, and so on (Kohler 2005)
The difficulty in aligning traditional insurance to carbon finance riskis one we have encountered before—how do you get the system started?If every potential client is a special case, then transaction costs will behigh and the market will grow slowly, if at all. Traditional insurers aremost comfortable when they can match a risk with a standard, widely usedproduct, for which there is adequate loss data to form the basis for askinga fair price. Eventually, as products increase in number and clients look forinsurance we should expect to see the establishment of a niche business andthe rise of the carbon underwriter (Kohler 2005).
There will also be some risks that are not insurable but which may becovered by Alternative Risk Transfer, through products such as weatherderivatives and catastrophe bonds (see Chapter 8).

166 CARBON FINANCE
ISSUES FOR DISPUTE RESOLUTION
Inevitably in such a new and complex business, there will be disputes. Projectparticipants will be expected to exercise due diligence even though carbonfinance includes lines of business which are new to all the participants anddependent on the operation of a regulatory system which is still underconstruction. One of the key missing pieces is the International TransactionLog, which is not expected to be up and running until the first quarter of2007 (Zaman and Brown 2005).
Despite this state of incompletion, CERs are being registered on nationallogs, but they cannot be traded until the International Log is operational.The courts already may take many years to deal with major internationaldisputes such as oil spills and contract failure for international waterprivatization projects. Carbon finance disputes are likely to be even morecomplex due to the participants’ unfamiliarity with the business. Therefore,it would seem wise to agree in the contract that disputes will be settled byarbitration by a neutral court in a venue such as the Permanent Court ofArbitration in The Hague (Zaman and Brown 2005).
CONCLUSION
Throughout the negotiations on the Kyoto Protocol, it was very difficult toguess what the final output might be, and major uncertainties still remain.One of the ironies of the process was that it was the delegation fromthe United States that first argued in favor of a market-based emissionstrading system, no doubt encouraged by the successful launch of its acidrain reduction program. Countries from the European Union reluctantlyaccepted the inclusion of carbon trading in the Protocol. Then the U.S.delegation was withdrawn from further negotiations. Despite this unusualbeginning the flexible mechanisms became the hallmark of an entirely newapproach to the management of international environmental problems inwhich the market would motivate private-sector participants and drive thesystem toward the lowest-cost solution. Yet the birth of carbon finance wasnot taking place on any level playing field. This was no celebration of theeconomist’s dream of perfect competition, where all the players enjoyedtransparent access to all the relevant information. The biggest asymmetryin the system was the gap between rich and poor countries, between thosecountries that had accepted caps and those that had not, and all the positionsin between.
A major innovation of the Kyoto Protocol was the CDM, which wasexpected to bridge the yawning gap between rich and poor by ensuring

Emissions Trading in Theory and Practice 167
that the emission reduction projects hosted in poor countries would alsomeet their need for sustainable development. From the beginning, the CDMwas expected to carry a very heavy burden. Despite all the obstacles, thesystem has continued to roll out with surprising persistence. Much of themomentum has been provided by the leadership displayed by players inthe EU ETS, who went ahead with National Allocation Plans, caps forindividual emitters and trading through the flexible mechanisms, eventhough the final destination of the Protocol remained opaque on several keyaspects.
The carbon market is still fragmented and struggling for a long-termcommitment from the countries that are signatory to the Kyoto Protocol.On this key issue, the Montreal COP/MOP1 got no further on this thanan agreement to begin discussions about commitments beyond 2012, ashappened at the United Nations Framework Climate Change Convention(UNFCCC) meeting in Bonn in May 2006. It is important that this decisionis made very soon, in order to provide a realistic 20-year time horizon forthe companies that will be affected. The debate on the post-2012 situationis already well advanced with the European Union (Carl 2006). However,it would be very helpful to participants in the carbon market if the EUformally declared its intention to extend the EU Emission Trading Schemebeyond 2012 by guaranteeing that carbon credits would continue to havecurrency post-2012 in the EU ETS, whatever the rate of progress elsewhereon the Kyoto Protocol (Nicholls 2006b). In the meantime the fact that thepost-2012 commitment is excluded from the review of the ETS stronglysuggests that the commitment is implicit (Zapfel 2006).
The stakes for the project are very high—nothing less than globalenvironmental security.
The remaining chapters examine the wider nature of the risks inherentin a carbon-constrained world (Chapter 7), the development of alternativerisk management products related to the carbon markets (Chapter 8), theemerging players in Carbon Finance (Chapter 9), and a conclusion on thecurrent state of play and future directions (Chapter 10).


CHAPTER 7Climate Change and
Environmental Security:Individuals, Communities, Nations
INTRODUCTION
Difficult as it is to estimate the costs of action to curb climate change, it iseven more difficult to estimate the costs of inaction in anything other thana partial way. We can be fairly sure that the costs of the business-as-usualscenario will not be zero. Indeed, the longer we stay close to this scenario,the higher those costs will be both in terms of the physical damage fromwindstorms, drought, and other meteorological events, and in terms ofimpacts on human health. Within the field of carbon finance, then, it isessential to examine the potential scope of these costs.
Changes in the state of human health and even national security havebeen attributed, in no small way, to climate variability. Its impact has beenfound in many venues, including changes in weather extremes, increasedseverity and frequency of weather events, modifications in physical climatesystems such as ocean currents, and altered distribution of some infectiousdiseases (Figure 7.1). Within this context, environmental security reflectsthe ability of societies to withstand environmental asset scarcity, adversechanges, and environment-related tensions or conflicts.
Human health and security impacts attributed to climate variability canbe classified into several broad categories:
� Direct impacts caused by weather extremes, such as heat waves,droughts, floods, and storms.
� Indirect health consequences due to the effect of changing environmentaland ecological patterns on the transmission of disease.
� Warming effects in the polar regions.
169

170 CARBON FINANCE
70 75 80 85 90 95 00 0527.0
27.5
28.0
Year
Se
a-s
urf
ac
e t
em
pe
ratu
re (
C)
28.5
29.0
NATL EPAC
SIO
WPAC
NIO
5-year running averages
SPAC
30.0
29.5
NATL = North Atlantic
NIO = North Indian Ocean
WPAC = West Pacific
SIO = South Indian Ocean
SPAC = South Pacific
EPAC = East Pacific
FIGURE 7.1 Summer sea surface temperatures by ocean basin—5-year movingaverageSource: Webster, P. J., G. Holland, J. Curry, and H-R Chang. 2005. Changes intropical cyclone number, duration and intensity in a warming environment. Science309(5742):1844–1846.
� Changes in physical climate systems.� National security and sovereignty issues.
The following sections outline the ways in which climate variabilitycan have a significant impact on the health and environmental security ofdifferent populations, and discusses the social and economic implications ofsuch changes, depending on geographic region and level of vulnerability.
DIRECT EFFECT OF EXTREME WEATHER EVENTS
In 2004, about half of the approximately 650 recorded natural catastropheswere windstorm and severe weather events. Harsh storms with torrential

Climate Change and Environmental Security: Individuals, Communities, Nations 171
rains and high winds caused extensive damage in the United States, theCaribbean and Japan, creating a costly natural catastrophe year for theinsurance industry.
Scientific studies show evidence of a summer season warming trendin all tropical oceans, which has amounted to an average of 0.5◦C since1970 (Figure 7.1). The influence of both the natural climatic cycle andof anthropogenic global warming are considered to contribute to theseincreases in recorded temperatures in the upper layers of all ocean basins.
At the same time, the intensity of tropical storms and hurricanes,characterized by their wind speeds and duration, has been shown to beclosely related to sea surface temperature. A 2005 study by Kerry Emmanuelthat reviewed 50 years of data found that over that time period, both theduration and wind speed of hurricanes has increased 50 percent (Figure 7.2).In his report, Emmanuel introduced the ‘‘power dissipation index’’ (PDI) asa new measure of the destructiveness of windstorms.
Hurricanes require a critical temperature to form, which is generallya sea surface temperature above 26.5◦C. After October, the sea sur-face usually cools, and the risk of further hurricanes is greatly reduced.
1.0
0.9
0.8
0.7
0.6
0.5
0.4
0.3
0.21940 1950 1960 1970 1980 1990 2000 2010
Year
Atlantic + W. Pacific PDIAnnual mean HadISST, 30° S−30° N
FIGURE 7.2 Correlation between sea surface temperature and annual intensity ofcyclonesSource: Emmanuel, K. 2005. Increasing destructiveness of tropical cyclones over thepast 30 years. Nature 436(7051):868–688, August 4.

172 CARBON FINANCE
TABLE 7.1 The Most Expensive Hurricanes in U.S. History
InsuredHurricane Date Category Area Affected Losses US$B
Katrina Aug. 23–31, 2005 4 Louisiana,Mississippi,Alabama, Florida,Tennessee
45.0
Andrew Aug. 16–28, 1992 5 Florida, Louisiana,Mississippi,
22.0
Charley Aug. 9–14, 2004 4 Florida, SouthCarolina
7.5
Ivan Sept. 4–24, 2004 3 Florida, Alabama,Texas, Louisiana,
7.1
Wilma Oct. 15–25, 2005 3 Florida, easternUnited States
10.0
Hugo Sept. 9–25, 1989 4 South Carolina,North Carolina
6.4
Frances Aug. 25–Sept. 10,2004
2 Florida, Georgia,South Carolina
4.6
Rita Sept. 17–26, 2005 3 Texas, Louisiana,Mississippi
10.0
Jeanne Sept. 15–29, 2004 3 United States, Haiti 4.0
Source: Derived from Stewart, S. 2005. Insurers take a category 5 hit in the pocketbook. Globe and Mail, October 27, pp. B1, 26; and Swiss Re. 2006a. NaturalCatastrophes and Man-made Disasters 2005, Swiss Re, Sigma No. 2.
Recently, however, the Caribbean’s sea surface is registering 1◦ to 3◦Cabove normal, allowing for the potential of storms later in the sea-son. Global economic losses in 2004, due to natural and man-madecatastrophes, topped US$123 billion, with insured losses rising to over$46 billion, even before the Indian Ocean tsunami devastation of Decemberof that year. The largest claims occurred in the United States and Japan(Swiss Re 2005).
Within the space of a few weeks of each other, hurricanes Charley,Frances, Ivan, and Jeanne created combined economic damage ofUS$56 billion and insured losses of US$23 billion in 2004, as they madetheir way across a number of island states in the Caribbean and subsequentlyto Florida. They also caused great human loss, particularly in Haiti andthe Dominican Republic (Munich Re 2004). For the sake of comparison,the single Hurricane Andrew in 1992 cost US$22 billion in insured claims.Table 7.1 illustrates that seven of the nine most expensive hurricanes in U.S.history made landfall in 14 months in 2004–2005.

Climate Change and Environmental Security: Individuals, Communities, Nations 173
The Pacific region was also hit with extreme weather in 2004. Japanexperienced a series of 10 typhoons in the period of June to October2004, causing economic damage of US$9.4 billion, including US$4.0 billionof insured property claims (Swiss Re 2005). While developed countriesexperienced the greatest economic losses in 2004, developing countriessuffered the highest number of fatalities, with estimates of more than21,000 deaths from catastrophes around the world. Of these, almost halfwere in Africa and Asia. Japan and China experienced multiple tropicalcyclones between June and September 2004, causing over 2,200 fatalities.As the typhoon season was nearing its end, the Philippines were hit withTropical Storm Winnie, which unleashed torrential rains, causing floodingand landslides and 750 more deaths (Bloomberg 2004; Munich Re 2004).
The 2004 hurricane season in the Atlantic was exceptional, not onlybecause of its impacts, but also in terms of its geographical profile. Aber-rations in extreme weather events were seen that year when hurricanesstarted to appear in new locations. Hurricane Catarina (not to be confusedwith the 2005 Katrina) developed in March 2004 and made landfall in thesouthern Brazilian state of Santa Catarina, thereby becoming the first SouthAtlantic hurricane ever recorded. In September of the same year, HurricaneIvan formed further south and east of the Antilles than any other event onrecord, before striking the Caribbean region.
Not to be outdone in intensity and frequency, 2005 matched andsurpassed the 2004 record for extreme weather activity, becoming thecostliest to date, in terms of economic, insured, and human loss. In the fall ofthat year, three Category 5 hurricanes (Katrina, Wilma, Rita) ripped throughthe Caribbean and the southeastern United States, causing US$170 billioneconomic and US$65 billion insured losses, more than double the tally for2004. However, Katrina has been crowned the most destructive hurricanein all U.S. history, causing estimated economic losses of US$135 billion andplacing insured losses at US$45 billion. Katrina’s impact is also being feltmuch longer than any other hurricane in recent American history, with alarge percentage of residents not yet returned to New Orleans and manybusinesses still shut down, a year after the event. As well as these billions ofdollars of damage, Katrina and Rita killed more than 1,200 people (SwissRe 2006).
HEALTH EFFECTS OF CLIMATE CHANGE
Impacts on human health and welfare have also been attributed to variationsin climatic conditions. In many regions, the effect is directly attributed toweather extremes, such as heat waves, drought, and storms. In others,

174 CARBON FINANCE
Climate Change
• Temperature related illnesses and deaths• Extreme weather deaths and injuries• Vector-borne diseases
• Heat waves• Extreme weather• Temperature• Precipitation
Regional Weather Changes
FIGURE 7.3 Potential impacts of climate change on human healthSource: Derived from ABI. 2005. Financial Risks on Climate Change. Associationof British Insurers, summary Report and Technical Annexes, www.abi.org.uk/climatechange.
the health consequences are brought on indirectly, through changes toenvironmental and ecological patterns. Figure 7.3 illustrates schematicallythe linkages that exist between indicators of climate change and evidence ofhealth issues in different geographic populations.
Direct Effects of Temperature Extremes: Heat Wavesand Cold Spells
The very old and very young, and those with preexisting health concerns,are the most at risk due to thermal extremes. At one end of the spectrum,unprecedented heat waves have resulted in a significant increase in thenumber of heat-related mortality cases. Such hazards are made worseby the ‘‘urban heat island’’ effect in cities, where heat stored in cementand metal materials during the day is released at night. On the otherhand, overexposure to extreme cold temperatures can lead to frostbite anddeath. Although climate change is anticipated to increase average wintertemperatures and thus decrease wintertime mortality, the overall direct risksof thermal extremes are considered to be adverse.
In the summer of 2003, Europeans experienced record high tempera-tures, the consequences of which were an estimated 27,000 deaths due toheat stress, with over 15,000 of these in France alone. Hot, dry summersalso had an impact on agricultural productivity, with farmers in Europe ingeneral and France in particular sustaining high crop losses. In addition,power supplies were affected due to air conditioners being run at fullcapacity. As demand for electricity rose, it became increasingly difficultto cool power plants, resulting in reduced production. Some power plants

Climate Change and Environmental Security: Individuals, Communities, Nations 175
were obliged to cut back their output, while others were completely shutdown. In France, a number of nuclear plants had to be either shut down orsprayed externally with water for several days on end. These same recordtemperatures were also blamed for severe wildfires that occurred acrossPortugal, Spain, and France, where economic losses rose to about $US15billion. Elsewhere, excessive heat was blamed for wildfires on Canada’swest coast that were deemed to be the worst experienced in that country inhalf a century (McGuire 2004; Munich Re 2003).
Indirect Effects of Climate Change: Vector-BorneInfectious Diseases
In the latter part of the twentieth century the resurgence and redistribution ofinfectious diseases, such as malaria, Lyme disease, and the West Nile virus,have prompted epidemiologists to explore the connections between weathervariations and the emergence of vector-borne diseases. Malaria and denguefever are uniquely human infections (anthroponoses), where carriers suchas mosquitoes are able to transmit the microbe from one infected human toanother (Figure 7.4). Others (zoonoses), however, involve infections foundprimarily in animals that act as the host for the disease agents. Thesediseases, too, can be transmitted to humans via carriers or vectors.
There are ranges of optimal climatic conditions (temperature, precipi-tation) within which vectors, pathogens, and their hosts survive, reproduce,and spread, resulting in an increased number of human outbreaks (Balbusand Wilson 2000; WHO 2003). Mosquitoes and ticks are highly tempera-ture sensitive. As climate varies, these infectious carriers have been observedto be moving to both higher elevations and higher latitudes. There is evi-dence of mosquitoes carrying malaria to higher mountainous regions ofAfrica and areas of the South Pacific, and ticks carrying encephalitis movingnorthward in Sweden as winters warm (Epstein et al. 1998; Lindgren andGustafson 2001; Martens, Jetten, and Focks 1997).
Since weather and climate influence carriers and pathogens, as wellas their host habitat, climate change may affect the spread of vector-borne diseases more than other forms of human ailment. Apart from theirdebilitating effects, these infections impose considerable material social andeconomic impacts on individuals and regions in which they exist, reducingthe earning capacity of those afflicted. Certain vector-borne diseases mayimpede both economic growth and international investment in developingnations, while some, such as malaria, can also pose risks to tourism andmilitary personnel (Epstein and Mills 2005).
The following section describes modifications in one anthroponosesinfectious disease pattern (human-to-human) and three of the zoonose type

176 CARBON FINANCE
Anthroponoses
Indirect transmissionDirect transmission
Zoonoses
C.) eg. Rabies
ANIMALS
ANIMALS
HUMANS
A.) eg. Tuberculosis, HIV/AIDS
HUMANS
HUMANS
D.) eg. West Nile Virus, Lyme Disease
VECTOR/VEHICLEVECTOR/VEHICLEVECTOR/VEHICLE
VECTOR/VEHICLE
HUMANS
ANIMALS
ANIMALS
B.) eg. Malaria, Dengue Fever
HUMANS
HUMANS
VECTOR/VEHICLE
VECTOR/VEHICLE
FIGURE 7.4 Four main types of transmission cycle for infectious diseasesSource: Adapted from Wilson, M. L. 2001. Ecology and infectious disease, inAron, J. L., and J.A. Patz (eds.), Ecosystem Change and Public Health: A GlobalPerspective. Baltimore: John Hopkins University Press, pp. 283–324.
(animal-to-human) that are attributed to the effect of changing weatherconditions on pathogens, their carriers, and their hosts.
Malaria Malaria is one of the most disabling of the vector-borne maladies.It is transmitted when a mosquito takes a blood meal from someone withmalaria, incubates the parasite, and then bites and injects the microbeinto an uninfected person. Warming weather increases the reproductiveand biting rates of the carrier, as well as prolonging its breeding season.Warmer weather also shortens the length of time it takes the pathogento mature within the mosquito. Weather extremes of rain and droughtalso play a part in the spread of the disease. Heavy rain creates idealbreeding grounds for mosquitoes in pools and along roadways. Droughts,on the other hand, create a condition of ‘‘environmental refugees’’ as humanpopulations migrate from dry regions that are less exposed to malaria intomore fertile, yet malaria plagued, areas. Vectors’ resistance to drugs and

Climate Change and Environmental Security: Individuals, Communities, Nations 177
pesticides, along with deforestation, exacerbate the spread of this disease inaffected areas such as Africa, Southeast Asia, the western Pacific, and theAmericas (Snow et al. 2005).
West Nile Virus The West Nile virus (WNV) is an urban-based mosquito-borne disease. The Culex pipiens mosquito, the primary carrier for WNV,thrives in city storm-catch basins, where small pools of nutrient-rich waterremain in the drains during droughts. The virus draws its name from whereit was first isolated in 1937—the West Nile district of Uganda. Althoughseen infrequently since that time, there have been an increasing number ofoutbreaks of the disease in humans in Romania, Israel, and Russia sincethe mid-1990s. In the latter part of the twentieth century, epidemiologistsfocused their attention on the possible linkage of outbreaks of the virus tochanging climatic conditions (Enserink 2002).
In the western hemisphere, the West Nile Virus was first recognizedwhen it caused an epidemic of encephalitis and meningitis in metropolitanNew York City in 1999. The virus was seen to have spread across NorthAmerica, moving steadily west in the United States and north into Canada,where the first Canadian human death attributed to the virus was recordedin the Toronto region in 2002 (Ford-Jones et al. 2002). Since 1999, WNVhas been reported in all the United States except Hawaii, Alaska, andOregon (Epstein and Mills 2005).
The spread of WNV is associated with the migration and overwinteringof several wild bird species, in particular, the American crow (Andersonet al. 1999; Lanciotti et al. 1999). Although it is not known how the WestNile Virus entered North America, it is known that the virus is spread whenmosquitoes bite infected birds that have a high level of the virus in theirblood. The infected mosquitoes can then transmit the disease to humans orother animals.
Researchers have found that warm winters followed by spring droughtsand hot summers may promote outbreaks of the disease in humans. Thesummer drought of 1999 created stagnant pools of water, thereby producingideal conditions for development of the Culex larvae, and increasing thelikelihood of transmission of the disease to humans (Balbus and Wilson2000; Wilgoren 1999). During the outbreak in New York City that year,when 59 cases and 7 deaths were recorded, the July temperatures wereamong the highest on record. The following year, 2000, was comparativelycool, and only 21 cases were noted.
The ultimate goal of epidemiologists’ WNV studies is to be able topredict future epidemics and develop preventive strategies to minimize theireffects. Thus, the identification of numbers of dead crows has played animportant role in signaling the epicenter of a potential outbreak of the virus,

178 CARBON FINANCE
and alerting the public at an early stage in order to reduce exposure to thevector. In order to minimize human infection, the public has been advised touse insect repellants that contain N,N-diethyl-meta-toluamide (DEET), andto wear long pants and sleeves between dusk and dawn, when the mosquitoesare most active. In addition, the elimination of stagnant pools of water isalso encouraged. Spraying of pesticide over infected locations has beenattempted, with some success, in the New York City area. However, strongpublic opposition to such programs exists, since spraying is hazardous toother valuable insect species, and pesticide residues pollute the environmentover time.
Lyme Disease Lyme disease and tick-borne encephalitis (TBE) are othervector-borne diseases that have shown signs of increasing in Europe andNorth America in the past decades. Characteristically, Lyme disease firstpresents as a rash surrounding the attached tick, and is often accompaniedby fever, weakness, and muscle and joint aches. If left untreated, the diseasecan affect the musculoskeletal and nervous systems and the heart. Lymedisease is the most prevalent vector-borne disease in the United States, beingdiscovered there in 1977, when arthritis occurred in a cluster around Lyme,Connecticut. Since that time, it has spread throughout the Northeast and tonorth central (Minnesota and Wisconsin) and northwestern (California andOregon) states (Epstein and Mills 2005).
Large deer populations act as host for the tick, Ixodes scapalaris, whichis the main vector for the spirochete bacterium, Borrelia burgdorferi, thepathogenic agent of Lyme disease. Milder winters and early arrival ofspring contribute to an increase in the deer population in endemic locations.Since ticks are sensitive to temperature for their survival and development,climate variability has an effect on their prevalence and range as well(Epstein and Mills 2005). In Sweden and Germany, the incidence of TBE,due to the Ixodes ricinus bacterium, has increased substantially since themid-1980s, and was found to peak in 1994, a year that was preceded byfive mild winters and the early arrival of spring (Lindgren and Gustafson2001).
Ross River Virus Studies of the Ross River virus epidemic in Australiaserve as another example of weather conditions being directly related to theincubation period of a mosquito vector with its spillover of infection intothe human population. The Ross River virus, a mosquito-borne disease,produces a disabling form of polyarthritis, the symptoms of which canpersist for months, and in some cases, for years. The primary cycle of thevirus is between vertebrate hosts, typically marsupials, and the mosquitovector. Higher precipitation in late winter/early spring, along with lower

Climate Change and Environmental Security: Individuals, Communities, Nations 179
spring temperatures, has been shown to enhance the breeding and survivalof mosquitoes, and to amplify the virus. Greater incidence of the RossRiver virus has been found during such climatic variations, with an averageof 5,000 cases per year being reported in Australia since 1991 (Woodruffet al. 2002).
In Epstein’s words, then, one might conclude that ‘‘Volatility of (vector-borne) infectious diseases may be one of the earliest biological expressionsof climate instability’’ (Epstein 2002, p. 374).
POLAR REGIONS
Changes in temperature and precipitation in the polar regions are contribut-ing factors to regional ecological and economic concerns. Annual averagetemperatures at the North and South Poles have increased at twice the rateas the rest of the world. In the Antarctic, temperatures have increased by 2.5degrees since 1940, causing huge ice shelves, twice the size of Luxembourg,to detach in the 1990s. In 2002, the entire Larsen B ice shelf broke awaydramatically from Western Antarctic Ice Sheet (WAIS) and disintegratedinto icebergs. As a result of this collapse, ‘‘rivers of ice’’ are acceleratingfrom the WAIS toward the Southern Ocean (Thomas et al. 2004). Thereis worry that small sections of the WAIS on the Antarctic Peninsula couldslip into the ocean, raising the sea levels from several inches to severalfeet over the next decades. There is further concern that the loss of thesemarginal ice shelves will expose grounded ice sheets and the continent itself,which will cause further melting and potential sea rise (Rignot and Thomas2002). Projections from recent observations have been made for sea levelrise, which, barring the collapse of ice sheets, will be one to three feet bythe end of the twenty-first century (Cazanave and Nerem 2004; Churchet al. 2004).
The effects of accelerated warming are also being felt in the Arcticregion. Widespread melting of glaciers and sea ice has been recorded inthe Arctic and Greenland. Sea ice in the Canadian Arctic has been thinningby 40 percent over the last 35 years, and losing 6 percent of its area since1978 (McGuire 2004). In Greenland, accelerated glacier movement and icedischarge has more than doubled the ice sheet mass deficit in the last decadefrom 90 to 220 km3/ year (Rignot and Kanagaratnam 2006).
Reduction in sea ice in the Arctic regions is already having devastatingconsequences on the habitat, food sources and migration patterns of polarbears, seals and other land animals. In addition, thawing of the permafrostand declining snow cover have resulted in a number of negative effects:rising river flows and discharge, increased erosion and landslides, disruption

180 CARBON FINANCE
of transportation, and destabilization of buildings and other infrastructure(ACIA 2004; Hassol 2004). In the Yukon, the inhabitants of Dawson areconcerned that the melting of the permafrost will destabilize the roads anddamage sewers and water lines that are buried in the frozen soil two metersbelow the surface (Beacom 2006). Loss of permafrost has already taken itstoll in the oil and gas industry. Unusually warm weather has created muddyroads that force rigs out of commission and has cut short the spring oildrilling season in Alberta (Ebner 2005).
The 2005 summer shrinkage of the Arctic ice caps was the mostextreme ever recorded and is anticipated to have further economic, andeven sovereignty, implications for the far north (NSIDC 2005). From aneconomic perspective, the polar thaw is causing a number of significantchanges: greater periods of ice-free open water; longer shipping season inthe area; increased marine access to the region’s rich resources of oil and gas1
as well as important commercial fishing areas; a new destination for cruiseships; and perhaps even the emergence of the fabled Northwest Passage. Ifthe rate of melting continues to accelerate, as many experts believe it will,a seasonal sea could develop that measures nearly five times the size of theMediterranean.
From a defensive point of view, the Law of the Seas determines acountry’s territorial boundary by how far out its continental shelf reachesinto the sea, based on its shoreline. Article 76 of the Law allows for nationsto expand their zone if it can convince other parties to the treaty thatthere is a natural prolongation of its continental shelf beyond that limit.In 2001, Russia made the first move in mapping the sea floor and stakingout virtually half the Arctic Ocean, including the North Pole. The UnitedStates, which opposes any infringement on its sovereignty, has not ratifiedthe UN treaty, and thus does not claim the same authority to try andexpand its territory. For its part, Canada has acted aggressively to ensuresovereignty over its Arctic domain that has for long been taken for granted.Since territorial disputes ultimately imply questions of a county’s ability todefend its interests, government services in Canada, including the military,form a major part of its Arctic strategy. More open water suggests thatgovernments will have to increase their military presence in the region,in order to monitor shipping traffic. In 2002, Canada began using armyrangers, a mostly Inuit force, to patrol the most remote Arctic reaches.In 2006, it plans to launch Radarsat 2, a satellite system that will allowsurveillance of the Arctic and sea approaches as far as 1,000 miles offshore.In addition, larger and faster transport planes and reinforced tankers arebeing brought to the region to supply ships patrolling the north (Krauss2004; Krauss et al. 2005).

Climate Change and Environmental Security: Individuals, Communities, Nations 181
Many of these economic and territorial changes have the potentialto destabilize national security. National conflicts are anticipated to growamong nations that at first glance appear to be a world apart, but arein fact relatively close neighbors as their borders converge. Boundariesof five of the eight Arctic nations—Russia, Canada, Norway, Denmark,and the United States—converge in the Arctic region ‘‘like the sections ofan orange meeting at the stem’’ (Krauss et al. 2005). Three other Arcticnations—Iceland, Sweden, and Finland—do not have coasts on the ocean.In the days of empire building, Rudyard Kipling2 depicted the struggles forempire and jockeying for resources among world leaders in central Asia asthe Great Game. More recently, energy analysts characterize the new Arcticrush as ‘‘the Great Game in a cold climate’’ (Krauss et al. 2005).
CLIMATE SYSTEMS AND NATIONAL SOVEREIGNTY
Changes in temperature and precipitation are also implicated in the effectson components of climate systems, such as the Gulf Stream in the NorthAtlantic and the El Nino/Southern Oscillation (ENSO).3 Linkages betweenocean basin temperatures and tropical storm intensity, as described earlier,also contribute to global warming effects on the North Atlantic and Pacificoscillations.
The Gulf Stream and the Thermohaline Current
Climatic anomalies in the Arctic region are having a broader global effect,as melting glaciers in the Arctic and Greenland contribute to rising sealevels and changes in the ocean’s temperature and salinity. Such changesin the climate of the North Atlantic have been linked to a weakening ofthe northern component of the Gulf Stream, known as the thermohalinecirculation (THC).4
The current’s northward flow performs a crucial climatic function asit carries the warm water from the tropics toward Northeastern America,crosses the Atlantic Ocean, and past the United Kingdom and northwesternEurope to the edge of the Arctic Ocean. As it carries heat from the lowerlatitudes, it makes the northern and western European regions warmer,especially in winter. Historically, as the warm sea water reaches higherlatitudes, it is cooled, becoming more saline and consequently denser. Thisdenser water sinks to the ocean bottom and becomes the current that returnspart of this water to warmer climes and draws more warm water at thesurface, northward (Figure 7.5). The current of denser water, which headswestward past Iceland and the tip of Greenland, then southward into the

182 CARBON FINANCE
2525°° N section N sectio
ionecirculaecirculatioibtropical repical ri lpical reSub onioneebtGulf StreamS
coveree coveveWinter sea-ice coverWinter sea-ice coveree coverWinter sea-ic
fresh water entering current
warm surface currents
cold, deep saline currents
own flowurn flon floweturn rly rerly resoutherly reterly reDeep soeeep southerly return f
FIGURE 7.5 The Atlantic conveyor beltSource: Bryden, H. 2005. Slowing of the Atlantic meridional overturning circulationat 25◦N. Nature 438(1):655–657.
Labrador Sea, is known as the Deep Southerly Return Flow (DSRF), whichtogether with the northern arm of the Gulf Stream are referred to as theAtlantic Conveyor Belt (Economist 2005e; NRC 2002).
The sinking force that drives the THC depends critically on the waterbeing sufficiently cold and salty. Anything that alters these conditions canjeopardize the circulation, with potentially serious impacts from melting icerunoff, increased precipitation, and fresh water flows from Siberian rivers.If the surface waters in the Arctic region become less salty due to increasedfreshwater input, or if the temperatures are not sufficiently cold, the resultingwarmer, less saline water will not sink as usual, thus hindering the initiationof the deep convection that links the surface and bottom portions of theconveyor (NRC 2002; UNEP 2005b).
There are already signs of changes in the North Atlantic: changein the freshwater balance near Greenland (Curry and Mauritzen 2005),

Climate Change and Environmental Security: Individuals, Communities, Nations 183
weaker currents (Bryden 2005; Hakkinen and Rhines 2004), and changingtemperatures (Richardson and Schoeman 2004). Any weakening of the THCmay lead to abrupt and unpredictable climatic conditions and could triggerregional cooling from 2◦ to 5◦C in the Northern Hemisphere (NRC 2002;ACIA 2004).
These changes in the North Atlantic could cause abrupt changes to theGulf Stream and the ocean’s conveyor belt that would, in turn, alter theclimate in economically strategic parts of the globe, such as northeasternNorth America, parts of Europe, and the Middle East. A further dangerof such disruptions in the ocean circulation is the prospect of a ‘‘flickeringclimate’’ if, in fact, the climate lurches between cold and warm, beforesettling into a new state. Changes in the Northern conveyor, then, couldwell be the global ‘‘Achilles heel’’ with changes in its behavior precipitatingevents around the globe (Broeker 1997).
The El Nino/Southern Oscillation (ENSO)
The El Nino/Southern Oscillation, defined as ‘‘the warming and cooling ofthe central Pacific Ocean temperatures by means of certain ocean oscillationstrength changes’’ (Aon 2004, p. 6), can have an effect on both sea-level riseand increased storm activity. Small island states in the Indian and Pacificoceans are considered to be the areas most vulnerable to these effects. Risingsea levels contribute to declining agricultural yields, salt contaminationof freshwater resources, and depletion of inshore fisheries (Barnett 2001).Changes in ENSO not only spawn greater weather extremes, but have alsobeen associated with increased evidence of cholera (Pascual et al. 2000).
Climate change has created a litigious atmosphere between this regionand developed countries. The Maldives in the central Indian Ocean, whichhave an elevation in the order of one to three meters, is considered an areawhich will be extremely vulnerable to flooding in the decades to come. Itsgovernment has accused wealthier nations of having caused this situationand demands that they pay for it. The island of Tuvalu in the Pacific isalso well known for its threat to sue the United States as the culprit in itsongoing threat of flooding (IPN 2005).
There is a strong consensus among scientists that inhabitants of theseareas will experience loss of land, declining productivity, economic hard-ships, and cultural disruptions. It is also argued that climate change isbecoming a sovereignty issue, where changing ENSO patterns and sea levelrise may render some small Pacific island states and low-lying coastal areasuninhabitable, such as Tuvalu, Kiribati, the Marshall Islands, and Tokelau.Others, including Papua New Guinea and low-lying outer islands of otherstates, are equally at risk.

184 CARBON FINANCE
Altered resource availability,productivity and land habitability
CO2 emissions
Human economic activity
Regional/global environmental changes
Civil unrest, regional/global conflict
FIGURE 7.6 Environmental routes to conflictSource: Adapted from Chalecki, E. 2002. Environmental security: A case studyof climate change. Pacific Institute for Studies in Development, Environment, andSecurity, research paper 7/23-2002, available at www.pacinst.org.
Tuvalu, for example, is a low-lying state with its highest point being4.5 meters above sea level. It has experienced high waves of up to threemeters that make the island inhabitable. It is anticipated that the 11,300inhabitants of Tuvalu will eventually migrate to New Zealand, at a rateof 75 persons per year, creating a condition of ‘‘environmental refugees’’(Peters et al. 2005). Relocation of inhabitants to more secure areas has thepotential to contribute to overcrowding, unemployment, and social unrestin the new locations (Figure 7.6). Political instability may result if urbanareas cannot provide the necessary infrastructure and services to cope withnew arrivals. Since land ownership plays such a crucial role as an identitysymbol and in ethnic status, loss of property in the Southwest Pacific hasthe potential to exacerbate the situation (Barnett 2001; Edwards 1999).
Loss of land due to sea-level rise can also imply a loss of sea territoryfor a number of island states, reducing an island’s Exclusive Economic Zone(EEZ) as coastlines recede, while at the same time increasing the area that isdesignated as high seas or international waters. For instance, since the seas

Climate Change and Environmental Security: Individuals, Communities, Nations 185
around Kiribati are rich in marine resources and mineral reserves, foreignfishermen and nations may take advantage of any new delineation of theseas in order to exploit its waters (Edwards 1999).
Thus, changes in climatic conditions have the potential to put unduepressures on vulnerable economies and aggravate social tensions, bothof which would contribute to social unrest, and, by extension, politicalinstability.
CONCLUSION
In addition to storm and flood damage to property, climate change andvariability can have a significant impact on human health and well-being.Although milder weather results in fewer winter deaths, temperature-relatedeffects for humans include increased morbidity and mortality due to heatstress during hotter summers. Spread of vector-borne diseases that areassociated with certain ecosystems are also linked to changes in temperatureand precipitation patterns. Furthermore, there are indications that changeswithin the environmental systems of the Polar Regions are also takingplace, creating significant social, ecological, and economic impacts. Glacialmelting, enhanced precipitation, and continental runoff, all of which areprojected to increase fresh water input into the Arctic seas, could causechanges in the ocean circulation, which have the potential to cause abruptchanges in climatic conditions. Weather extremes in the Indian and PacificOceans may well cause relocation of inhabitants and reductions of economicgrowth in the region, and have the potential to lead to civil unrest andconflict.
It is not only the inhabitants of small island states who are vulnerableto climate change. Of the three continents of the developing world, Africais the most vulnerable because it is already the poorest (compared withLatin America and Asia) and is the most deficient in the availability ofwater (Odingo 2006; Vallely 2006). A reflection of this stress is the growingstream of environmental/economic refugees leaving Africa by sea at greatpersonal risk, entering Europe illegally. This imposes huge (often terminal)costs on the refugees and on the unwilling host country. Under climatechange the pressure behind this movement will grow as the water-scarceregions of Africa are subjected to further stress. Unfortunately, the way inwhich some of the decisions have been made in the design of the EU ETSwill make a bad situation worse in Africa. Specifically, the EU excludedafforestation and reforestation from CDM eligibility for the ETS. Yet thesetypes of project represent the greatest potential for Africa to contribute tothe CDM project stream, having almost no opportunities for HFC, N2O,pig manure, or landfill methane projects.

186 CARBON FINANCE
At some point the various implications of the climate change challengemust be brought together under the rubric of sustainable development, aswas the explicit intention of the CDM. Unless the global system as a wholeis sustainable, then none of it is sustainable. In the next chapter we exam-ine certain financial products associated with carbon finance that mightbe developed to spread the risks associated with climate change, specif-ically weather derivatives, catastrophe bonds, and specialized insuranceproducts.

CHAPTER 8Adapting to Adverse and Severe
Weather
INTRODUCTION
We have recognized for some time that even a strenuous effort to reducegreenhouse gases (mitigation in climate change parlance) will require someadaptation to the climate change to which we are already committed. Justas will have to adapt physically to climate change so we will have to adaptfinancially by developing new products as is most clearly demonstrated bythe response of the insurance sector and the energy sector. The former wasforced to respond to an escalation in the number of natural catastrophesdriven (at least partly) by climate change while the latter has recently hadto respond to the fact that carbon now carries a price.
We have defined carbon finance broadly, almost as broadly as ‘‘thefinancial implications of climate change’’ with a focus on the developmentof new financial products. Thus, we are looking at a broader set of intereststhan reducing greenhouse gas (GHG) emissions. Specifically, the changingclimate and our attempts to reduce GHG emissions will drive more thanthe price of carbon. They will influence the price of many other financialproducts, especially weather derivatives and catastrophe bonds, as well asestablished insurance products.
The weather drives both demand and supply for energy. Colder wintersand hotter summers drive up demand for space heating and cooling,respectively. Dry weather reduces the supply of hydroelectric power, and,in extreme conditions, so reduces the amount of water available for coolingnuclear and fossil-fuel plants that they too have to shut down—as happenedin Europe during the heat wave of the summer of 2003. Under currenttechnology, wind and solar energy cannot be readily used to meet a dailydemand-supply gap. Better storage infrastructure might make this possible.Likewise, biomass energy systems rely on fuel being trucked in from thefields on a just-in-time basis in order to minimize storage costs of a very
187

188 CARBON FINANCE
bulky fuel. Again, new technologies might emerge to change this situation.In the meantime the demand-supply gap for electricity is filled by bringing onunused fossil-fuel power stations, invariably fuelled by coal, which increasesthe demand for carbon emission reduction credits.
As has already been seen in the EU ETS, a cold spell in winter drivesup the price for oil and gas, and with it the price for carbon credits aspower producers switch from gas to coal. As Europe adopts more airconditioning, for households and businesses, a similar effect will appear forhot spells in summer. Already, carbon exchanges in Europe offer productsthat allow energy producers to hedge this risk with forward contracts oncarbon credits. In the meantime, there is an interesting linkage developingbetween the carbon market and the weather market. The same firms thatmight need to hedge their carbon credit risk may already hedge their relatedweather risk directly by buying weather derivatives.
Although the insurance industry remains the preeminent actor in thebusiness of risk transfer, there are some circumstances where alternativeapproaches have been adapted. For example, for the largest companiesthe volume of insurance needs is so great that the company can afford toself-insure by setting up its own ‘‘captive insurance company.’’
Weather derivatives are like insurance in several ways, but they can bedesigned to cover risks that are difficult to insure. Catastrophe bonds werecreated in the wake of hurricane Andrew (1992) when it became clear thatthe growing scale of natural disasters might swamp the global insuranceindustry and insurers needed to build bridges to the capital markets withtheir much greater capacity for absorbing risk. In this chapter, we examinethese products and trends and show how they are related to the growingfield of carbon finance.
ADVERSE WEATHER: THE ROLE OF WEATHER
DERIVATIVES
Many businesses, especially those in the energy sector, are exposed tothe risk of adverse, although not catastrophic, weather. Specifically, mildsummers reduce the demand for air conditioning, while mild winters reducethe demand for space heating. Adverse weather likewise affects agriculture,hydroelectric and wind power generation, construction schedules, demandfor certain clothing and beverage products, and outdoor entertainment.Most of these types of exposures are difficult to insure because insurancecontracts are designed to compensate for actual property damage, personalinjury, or business loss, not simply reduced sales (volume risk) or lowerprices.

Adapting to Adverse and Severe Weather 189
Weather derivatives are designed, like other derivative products, torespond to changes in an index, rather than an incurred loss. The mostpopular weather derivatives are designed for energy producers and arebased on the concept of heating degree days (HDD) and cooling degreedays (CDD). Other products are linked to weather parameters such as frostand precipitation, which have adverse consequences for specific businessoperations.
Weather derivatives, like other alternative risk transfer products, havedeveloped slowly due to their novelty, lack of corporate awareness ofweather risk, and the scarcity of weather data in which the buyer and theseller of the derivative share confidence. Price is directly related to datauncertainty. A further factor is the basis risk of a mismatch between thepotential buyer’s exposure and the behavior of the index.
Insurance has traditionally covered the major part of a company’s risktransfer strategy. However, there are situations that conventional insurancemarkets are unwilling or unable to absorb. It is in within this niche ofuninsured risk that the weather derivative market has grown (Swiss Re1996). A derivative is defined as ‘‘a financial contract whose value derivesfrom the value of some underlying asset, such as a stock, bond, currency orcommodity’’ (Swiss Re 2001, p. 6).
Weather risk, defined by various weather parameters, provides thefinancial markets with a new class of underlying assets for which marketscan be designed. The buyer, or end user, of this new class of derivativescould be any business that has the potential to be adversely affected byvarious weather phenomena. It has been suggested that 70 percent of allAmerican companies, for example, have some exposure to weather risk(Nicholls 2004f). However, at the beginning, energy companies dominatedthe demand for weather derivatives.
Each weather contract involves a buyer and seller who reach an agree-ment on the time period, the weather index (W) on which the contract isbased (e.g., temperature, precipitation), the threshold for that index, com-monly referred to as the ‘‘strike’’ (S) and the price per unit of the index(tick k). The strike temperature most commonly referenced in the UnitedStates is 65◦F or 18◦C. If the average temperature on a given day is 55◦F,then 10 HDD are recorded for that day. On the other hand, 10 CDD arerecorded if the average daily temperature is 75◦F. In the current weathermarket, power plants and energy providers predominantly use total heat-ing/cooling degree days (cumHDD/cumCDD), over a period of time, such asthe heating season and the cooling season, in order to hedge sales volumes.
Typically, the weather concerns that affect energy companies are warmwinters or cool summers, when there is less demand for power to heat/cool.Weather contracts are bought by the power companies in order to hedge

190 CARBON FINANCE
potential losses due to such unseasonable weather. In order to assess acompany’s weather exposure risk, the end user must identify:
� The business index (revenues, profits, sales) assumed to be affected byweather conditions.
� The weather index and the nature of that exposure (temperature,precipitation, snow, stream flow).
� The relationship between the weather index and the actual risk to thecompany (the gap being known as the basis risk).
� The contract type required (put, call, swap).� The contract period (three months, six months).� The threshold price (strike).� The payment/unit of weather index (tick).� The price to be paid to the seller for accepting the risk (premium).
On the other side of the weather agreement are the sellers of the weathercontracts, such as banks (Societe Generale, Goldman Sachs, Deutsche Bank)and insurance companies (Swiss Re, AXA, Element Re, Chubb). Initially,each weather derivative contract was designed to meet the needs of aparticular buyer and seller, and then traded over the counter (OTC). As themarket has grown, there is a trend toward standardizing products that arenow traded like other derivatives through an exchange, such as the ChicagoMercantile Exchange (CME). The CME began listing and trading futuresand options on temperature indices for ten U.S. cities in 1999. Their HDDsand CDDs represent the first exchange-traded, temperature-based, weatherderivatives (Moreno 2003). Large banks are viewed as having the greatestpotential to help expand this new asset class, both by becoming involvedin trading weather risk and by recommending weather products to theircustomers that are known to have weather risk embedded in their portfolios(Biello 2004).
Due to the role that insurance has played in weather protection, afurther important group of participants in this market is the transformers,which are usually subsidiaries of insurance companies, such as SCOR andXL. This group transforms insurance contracts into a derivative formator vice versa, depending on the client’s preference (Swiss Re 2003). Sinceinsurance products have the advantage of being more familiar and betterunderstood, some clients might prefer weather-contingent insurance prod-ucts to a derivative form of contract. In addition, a key difference betweenthe two types of contracts lies in their treatment for accounting purposes.Premium charges for an insurance policy are considered allowable expenses.Under the General Agreement on Accounting Practices (GAAP), however,derivatives are treated as an asset on the balance sheet, and changes in their

Adapting to Adverse and Severe Weather 191
fair value must be reported as unrealized gains/losses. This clearly adds alayer of complexity that may deter users from selecting derivatives overinsurance for transferring weather risk (Roberts 2002).
Weather derivative products are traded as commodities, daily, on theenergy desks of both financial institutions and energy companies aroundthe world. The earliest trade on weather derivatives took place in 1997 whenKoch Energy and Enron entered into a contract, based on a temperatureindex for Milwaukee, Wisconsin, for the 1997–1998 winter.
The weather derivative market developed mainly in response to thederegulation of the energy and utility industries in the United States.Price and volume volatility, which were once absorbed by taxpayers, becamethe responsibility of producers and consumers. The negative impact of mildwinters on energy sales (gas volume and electricity consumption) created theinitial driving force in the weather derivatives market. Faced with increaseduncertainty in demand, companies in this sector initially hedged theirprice exposure through energy forwards and futures, in order to stabilizeearnings. However, hedging price alone was inadequate, since volumetricrisk developed as well in the new, competitive wholesale markets (SwissRe 2003).
Weather Derivative Instruments
The most commonly traded instruments that are available in weathermarkets are weather-based call options, put options, and swaps. In weather-based call and put options, the firm seeking weather protection pays for acontract with an up-front premium. This company receives a payout if theaverage temperature over a given period of time (W) is either hotter or colderthan the threshold temperature contracted for (S), depending on whetherthe buyer is seeking protection against mild winters or mild summers. Forboth calls and puts, the payments are keyed to the difference between theindex and the strike level, depending on the contract arrangements.
In the case of call options, the seller pays the buyer when the weatherindex exceeds the specified (strike) level (W > S). The amount paid P iscalculated by multiplying the difference between the realized weather indexvalue W and the predetermined strike level S by the amount of payment to bemade per unit of weather index (known as ‘‘the tick’’ k of the contract), orP = k(W−S). In the case of put options, payment is made to the end useronly when the when the weather index is lower than the strike level (W < S),at the end of the contract, or P = k(S−W). Weather swaps, however, involvethe two counterparties setting the strike over a given period and exchangingcash or assets, depending on the realized temperature (Ellisthorpe andPutnam 2000; Zeng 2000).

192 CARBON FINANCE
TABLE 8.1 Weather hedges using cumHDD put options and swaps
Type of Payout Revenue RevenueWinter (W) cumHDD (S-W) [(S-W) x tick price] without hedge with hedge
cumHDD PUT OPTION
Mild 3,800 200 $12 million $88 million $100 millionStrike (S) 4,000 0 $0 $100 million $100 millionCold 4,200 −200 $0 $112 million $112 million
cumHDD SWAP
Mild 3,800 200 $12 million $88 million $100 millionStrike 4,000 0 $0 $100 million $100 millionCold 4,200 –200 −$12 million $112 million $100 million
Source: MMC Securities. 2005. The Growing Appetite for Catastrophic Risk:The Catastrophe Bond Market at Year-End 2004. Available at www.guycarp.com/portal/extranet/pdf/Cat%20Bond%20Update%20Final%20032805.pdf?vid=1.
Table 8.1 offers a simplified example of weather hedging using a putoption and a swap, with a strike cumHDD of 4,000 and a tick price of$60,000. When the seasonal heating degree days are aggregated (cumHDD),the put option protects the company during a mild winter, while thecompany retains its sales advantage in the event of cold winters. Whenentering into a swap, however, the financial exposure is shared, leaving eachparty less exposed to the risk of adverse weather (Ellisthorpe and Putnam2000). The reverse argument can be made using CDDs in a moderatesummer, when less power is required for air conditioning. For a recentcomparison between returns from hedged and unhedged portfolios, seeAmeko (2004).
Examples of Weather Derivative Contracts
Temperature-based swap: The swap undertaken by two Japanesecompanies that faced opposite weather risks serves as a classic illus-tration of a temperature-based derivative product. Tokyo ElectricityPower (Tepco) experiences increased demand for electricity duringunusually warm summers, swapped a portion of this weather riskwith Tokyo Gas (Togas), which experiences a decrease in demandfor gas-fired water and central heating under the same conditions.In 2001, the two companies entered into a contract from August 1to September 30. The power company contracted to pay Togas ifthe average temperature rose above 26.5◦C during this period, while

Adapting to Adverse and Severe Weather 193
the gas company will pay Tepco if the temperature falls below 25◦Cduring the same period, up to a limit of ¥700 million. The averagetemperature of this period turned out to be 24.5◦C, resulting inTogas paying Tepco ¥320 million on the swap (Nicholls 2002).
Precipitation-based swap: A trade between Sacramento MunicipalUtility Department (SMUD) and Kansas City–based trading firm,Aquila, represents a typical example of a precipitation-based swap.In an attempt to protect itself against the effects of low levels ofprecipitation on electricity production, Aquila agreed to pay SMUDup to $20 million annually when insufficient water flowed throughthe utilities hydro plants, while SMUD would pay Aquila the sameamount during wet years. Although precipitation deals represent avery small proportion of the overall weather market, growth in thisarea is anticipated to come as much from the agricultural sector asthe power sector, as agricultural producers attempt to protect theircrop income from drought (Saunderson 2001).
Wind-based hedge: As wind power projects take on an important role inthe renewable energy sector, the risk of having too little or too muchwind has become an issue in wind power projects. In Germany,where considerable wind power development has taken place, twowind farm operators have hedged adverse wind conditions at severalof their sites. Hamburg-based Centurion Energy, which sells powerinto the German electricity grid, has entered into a three-year deriva-tive contract with the Munich-based HVB. The financial institutionis capable of designing hedges that take into consideration bothlight and strong wind speeds as well as the type of turbines used atspecific sites. Centurion’s transaction involved buying a put optionlinked to a customized wind index for its wind farm site, and financ-ing the purchase by selling a call option on the same index. In a badyear, the contract will pay Centurion, while the opposite occurs ina profitable year. Another wind farm specialist, Konig & Cie, hasentered into a similar three-year wind hedge with HVB, designed toprotect its operations in northern Germany (Saunderson 2004b).
Current Status of Weather Markets
After a promising launch of weather derivatives in 1997, the market sufferedin 2001 from the economic downturn and the crisis in the U.S. energy sector,precipitated by the collapse of Enron. However, since this difficult time,the Weather Risk Management Association (WRMA) 2005 survey signalsan 80 percent upturn in volumes of weather derivatives over the previousthree years (O’Hearne 2005). Their report indicates that the overall weather

194 CARBON FINANCE
$0
$1,000
$2,000
$3,000
$4,000
$5,000
$6,000
$7,000
$8,000
$9,000
2000/1 2001/2 2002/3 2003/4 2004/5
CME Winter
CME Summer
OTC Winter
OTC Summer
Re
su
lts
FIGURE 8.1 Total notional value (in millions U.S. dollars)Source: Weather Risk Management Association (WRMA). 2005. Results of 2005PwC Survey, November 9, www.wrma.org
market grew globally to $8.4 billion, with a sharp increase in volume fromthe Chicago Mercantile Exchange (CME) trades accounting for most of theincrease (Figure 8.1). A possible explanation for the strength in the CMEresults is that the Exchange’s clearinghouse provides protection againstcounterparty bankruptcy (Nicholls 2004a).
As in other years, contracts for the winter heating season accounted forthe bulk of the transactions. Figure 8.2 illustrates that, for any given year,over 80 percent of the transactions were based on temperature variables.It is also evident that other types of contracts based on wind, snow, andrain are slowly moving into the marketplace. To help expand this market,AXA has unveiled its new flash-flood index, which is designed to appealto other insurers who face large claims following heavy or persistent rains.In a further attempt to develop markets outside the energy sector, CDCIXIS Capital Markets in Paris has structured an index that protects insurersagainst losses caused by cold snaps. Their derivative product is structured insuch a way as to take into account the correlation of intensity and durationof a cold spell and its relationship to pipes bursting, snow and ice falling,crop damage, and car accidents (Claquin 2004). It is possible to bundleweather risks together, such as precipitation, temperature, and wind, for theconstruction industry (O’Hearne 2004).
Figure 8.3 indicates that the vast majority of the contracts are under-taken in the North American region, with Asia and Europe trailing. Weatherrisk management is, however, moving beyond the core market in the United

Adapting to Adverse and Severe Weather 195
Other
Wind
Snow
Rain
Other Temp
CDD
HDD
0%
20%
40%
60%
80%
100%
2000/1 2001/2 2002/3 2003/4 2004/5
Re
su
lts
FIGURE 8.2 Distribution of number of contracts (no CME trades)Source: Weather Risk Management Association (WRMA). 2005. Results of 2005PwC Survey, November 9, www.wrma.org
States, Europe, and Japan. The World Bank, for example, is encouragingdeveloping countries to transfer weather risk associated with agriculture byusing weather derivatives. The Bank has been helping governments, microfinanciers, and insurers develop weather indexes related to crop yields.Farmers buy insurance policies based on the indexes, which are in turnaggregated, with the risk being sold to international reinsurers or weather
0
500
1,000
1,500
2,000
2,500
3,000
3,500
4,000
4,500
5,000
2000/1 2001/2 2002/3 2003/4 2004/5
Other
Europe
Asia
NA East
NA Mwest
NA South
NA West
Re
su
lts
FIGURE 8.3 Distribution of total number of contracts by region (no CME trades)Source: Weather Risk Management Association (WRMA). 2005. Results of 2005PwC Survey, November 9, www.wrma.org

196 CARBON FINANCE
derivative dealers. Similar pioneering work in Mexico has the potential tobring tens of millions of dollars weather risk transfer to that country’smarket (Hess 2003; Nicholls 2004b).
A further development in Taiwan has allowed for the structuringof a ‘‘quasi’’-weather derivative by Taiwan’s Central Insurance. A golfcourse and a tourist organization, offering whale-watching excursions,signed contracts that will compensate them for any loss of income causedby heavy rain. The contract is described as ‘‘quasi’’-weather derivatives,because the counterparties must show evidence of loss, such as is required ininsurance contracts, rather than receiving a payout that is contingent simplyon the weather condition actually occurring (Nicholls 2004d).
A number of nonenergy companies are slowly embracing weatherderivatives. AXA Re reports contracts in Europe based on precipitation forgarden centers, when excess rain in spring reduces gardening activity. Thecompany has also structured weather derivatives for clothing manufacturers,designed to encourage retailers to buy collections early, and promising arebate if mild weather in the winter season causes sales of winter clothes tosuffer (Saunderson 2004a).
Increasing transparency has also encouraged the involvement of newparticipants. The success of the CME’s weather products is encouragingrivals such as the London-based International Petroleum Exchange (IPE)to consider launching its own contracts (Saunderson 2004c). In addition, anumber of hedge funds, such as HBK Investment, BNP, Cooper-Neff, andChimera, have either taken on weather derivatives, or are actively investigat-ing the market. For the weather market, entry of this new group of investorsadds both liquidity and disciplined trading knowledge. For the hedge funds,the weather represents a noncorrelated quantifiable asset class (Biello 2004).
Constraints on the Weather Derivatives Market
In the United States, the entire power generation industry has faced reg-ulatory pressures, costly restructuring and massive losses in the wake ofthe California power crisis in 2000–2001, leaving little to be spent onweather risk management. Meanwhile, utilities in Europe appeared to bemore concerned about the EU Emissions Trading Scheme than weatherhedging possibilities (Nicholls 2004e). It has been suggested that this willchange:
Going forward the [EU ETS] scheme should contribute to renewedgrowth in [weather derivatives] activity in Europe, given theeffects that temperature and precipitation (via hydro capacity) haveon electricity supply, and therefore carbon emissions. (O’Hearne2005, p. 16)
Adapting to Adverse and Severe Weather 197
Further hybrid opportunities will be developed by melding commoditytrading and weather trading:
Weather can serve as a hedge or as a source of incremental valuein trading commodities. This can be done on an outright basis, bybetting on a cold winter while, at the same time, also buying naturalgas or heating oil. A hedged strategy might involve buying naturalgas and selling cold-side weather exposure, where the weatherposition will lose if the winter is indeed cold, but be more thanoffset by the value of the natural gas contracts. (O’Hearne 2005,16; Nicholls 2005b)
To date, the U.S. natural gas utility sector has been one of the mostreliable buyers of weather derivative products. One disincentive for thissector to seek weather protection lies in recent weather normalizationagreements that have been struck between gas utilities and state regulators.These agreements allow utilities to charge customers higher rates duringmilder winter when temperatures rise above prearranged norms and demandfor gas is reduced. Atmos Energy of Louisiana, for instance, canceled thelast year of its three-year weather insurance program with XL Weatherand Energy, after regulators approved its weather normalization clause.Participants in the weather markets argue that such agreements are not inthe best interest of the consumer (Nicholls 2003).
While the number of investors in weather risk instruments is growing,the problem in developing this market appears to be in finding new compa-nies that are prepared to hedge their weather risks. Nicholls (2004c) claimsthat this reflects the immaturity of the weather market, when end users arereticent to talk publicly about their use of weather derivatives, and considerthe use of these novel instruments as a source of competitive advantage.In addition, dealers themselves like to protect the identity of their clientsfrom their peers. Presumably, this constraint will weaken as exchange-basedcontracts become more important than OTC transactions. Exchange-basedtrading should provide greater volume and greater price transparency, bothof which will contribute to the liquidity required for a successful market.
Data availability is another significant constraint to the rapid develop-ment of the market. Whereas the world has access to a huge and growingvolume of weather data there still remain major issues to be resolved beforethe data appear widely in usable form. The availability of raw data is notthe only issue. For example, temperature regimes at different locations andfor different seasons each present their own challenges for interpretation(Dischel 2002; Jewson and Caballero 2003b; Pardo et al. 2002).
As long as good-quality data are not available at a reasonable price, allweather derivative contracts will carry a higher premium for the implicit

198 CARBON FINANCE
uncertainty in the contract. Climate change will further complicate thisalready complex issue (Jewson and Caballero 2003a; Hertzfeld et al. 2004).
Another major factor affecting the maturing of the market is a clearunderstanding of the importance of regulation. The market evolved becausethe U.S. government (among others) deregulated gas and electricity markets,thereby exposing producers and consumers to price and volume volatility.A supervisory body is still essential to ensure that the market works in anunfettered fashion and is not subject to manipulation by the suppliers—asappears to have happened in California in 2000. It is equally important thatthe government does not lose its nerve and return to price regulation.
Markets in novel and complex financial products can fail, as wasdemonstrated by the withdrawal of catastrophe options from the ChicagoBoard of Trade (CBOT) in 1999 (White 2001). Even when markets manageto establish themselves this can take some time. Richard Sandor noted: ‘‘Ittook almost three years for the first trade to occur in the Acid Rain Program,and now that same market is worth $4 billion. History has taught us thatenvironmental markets need time to mature’’ (Sandor 2004a).
SEVERE WEATHER: THE ROLE OF CATASTROPHE BONDS
Catastrophe bonds (known as cat bonds) are securities which transfer partof the risk of major losses from the potentially affected party to an investor.They are part of the larger market of insurance-linked securities, whichcover life and nonlife insurance sectors, credit card risk, and potentiallyany combination of risks that can be bundled into a large enough productto be of interest to major investors (Swiss Re 2006). Cat bonds were firstdeveloped as a response to the pressure felt in the global insurance marketfrom the record payout for the losses incurred by hurricane Andrew in1992, followed closely by the Northridge earthquake in 1994. Althoughthe insolvencies resulting from these events were few, it was clear that aseries of similar events in close succession could be overwhelming for theinsurance industry and that the capital markets with their much greater sizeand diversity could be accessed to provide a cushion for such shocks.
The problem lay in designing a product that would provide support forthe insurance function in a package that was understandable and attractiveto investors. As with the development of the weather derivatives marketthe first steps were tentative, 1997 being the first year which witnessedmore than one cat bond issue, since when the market has grown quitesteadily with total risk capital outstanding at US$4.04 billion at the endof 2004 (see Tables 8.2 and 8.3). The sellers, or sponsors, who issuethese bonds are mostly insurers, reinsurers, and some corporations, while

Adapting to Adverse and Severe Weather 199
TABLE 8.2 Catastrophe Bonds: New Issuances and Outstanding Capital forNatural Catastrophes
New Issuances Total Outstanding RiskYear (US$ billion) Capital (US$ billion)
2002 1.22 2.852003 1.73 3.452004 1.14 4.04
Source: MMC Securities 2005
TABLE 8.3 Catastrophe Bonds: Number of Transactions by Size ($millions)
Average MedianYear < $50 $50 < $100 $100 < $200 > $200 Deal Size Deal Size
1997 2 1 1 1 126.6 90.01998 3 3 1 1 105.8 63.11999 3 1 5 1 98.5 100.02000 1 2 4 2 126.6 136.52001 0 0 7 0 138.1 150.02002 1 1 2 3 174.2 175.02003 0 0 3 4 247.1 231.82004 0 0 3 3 190.5 185.2TOTAL 10 8 26 15 146.8 125.0
Source: MMC Securities. 2005. The Growing Appetite for Catastrophic Risk:The Catastrophe Bond Market at Year-End 2004. Available at www.guycarp.com/portal/extranet/pdf/Cat%20Bond%20Update%20Final%20032805.pdf?vid=1
the investors ‘‘include hedge funds, fixed-income portfolio managers andspecialized groups within larger institutional money-managers, commercialbanks, pension funds, life insurers and reinsurers’’ (MMC Securities 2005).
For the seller the attraction is the provision of additional risk capital,which is fully collateralized and available in a multiyear contract. For thebuyer the bond provides a higher rate of return than investments such asgovernment bonds and the risk is uncorrelated with other investment risksas it is dependent on unpredictable events in the natural world and thusprovides an excellent source of diversity.
The Structure of a Catastrophe Bond
The bonds are designed to cover rare but potentially very costly events,typically with a probability of occurrence of less than 1 percent. The capital

200 CARBON FINANCE
TABLE 8.4 Catastrophe Bonds: Transactions by Trigger Type ($millions)
Indemnity Parametric PCS Index ModeledYear Amount Number Amount Number Amount Number Amount Number
1997 431.0 3 90.0 1 112.0 1 0 01998 846.1 8 0 0 0 0 0 01999 602.7 7 100.0 1 0 0 282.1 22000 507.0 4 303.0 2 150.0 1 179.0 22001 150.0 1 270.0 2 265.0 2 281.9 22002 355.0 2 631.5 3 200.0 1 33.0 12003 260.0 2 1,119.8 4 350.8 1 0 02004 227.5 1 267.8 2 547.5 2 100.0 1Total 3,337.3 28 2,782.1 15 1,624.5 8 876.0 8
Source: MMC Securities. 2005. The Growing Appetite for Catastrophic Risk:The Catastrophe Bond Market at Year-End 2004. Available at www.guycarp.com/portal/extranet/pdf/Cat%20Bond%20Update%20Final%20032805.pdf?vid=1
is committed to a Special Purpose Vehicle, which invests the funds in themarket, paying the dividend to the buyer who also receives interest from theseller, to provide a total return usually based on the three-month averagedLondon Interbank Offered Rate (LIBOR). Some bonds are principal pro-tected and the buyer stands to lose only the interest if the bond is triggered bythe catastrophic event from which it is designed to protect the issuer; othersleave the principal-at-risk and, accordingly, attract a higher rate of return.
Triggers may be based on the actual loss suffered by the seller (anindemnity trigger), or on the physical characteristics of the event, suchas the severity of a hurricane on the Saphir–Simpson Scale (a parametrictrigger), or on an index such as the PCS index on industry-wide hurricaneloss, or on the losses from an event as projected by a model. The relativeattractiveness of these various triggers is shown in Table 8.4, which suggeststhat the indemnity approach has been losing ground to triggers based onphysical parameters and an industry index of losses. The reasons for sucha trend may be that the indemnity approach obliges to seller to discloseinformation which may be deemed confidential and would take severalmonths to collect, while the parametric and index approaches are simplerto operate once both parties have confidence in the process and the sellercan be assured that the basis risk in manageable (MMC Securities 2006).
Catastrophe Bonds and Carbon Finance
Cat bonds have evolved to provide valuable ancillary capital for risk fromnatural catastrophes, being applied mostly to earthquake and windstorm

Adapting to Adverse and Severe Weather 201
TABLE 8.5 Catastrophe Bonds: Risk Capital by Specific Peril ($millions)
U.S. U.S. European Japanese JapaneseYear Earthquake Hurricane Windstorm Earthquake Typhoon Other∗
1997 112.0 395.0 0 90.0 0 36.01998 145.0 721.1 0 0 80.0 45.01999 327.8 507.8 167.0 217.0 17.0 10.02000 486.5 506.5 482.5 217.0 17.0 129.02001 696.9 551.9 431.9 150.0 0 120.02002 799.5 476.5 334.0 383.6 0 02003 803.8 416.1 474.1 691.2 277.5 100.02004 803.3 660.8 220.3 310.8 0 0Total 4,174.7 4,235.7 2,109.8 2,059.5 391.5 440.0
∗ ‘‘Other’’ includes European hail, Monaco earthquake, Puerto Rico hurricane, andTaiwan earthquake.Source: MMC Securities. 2005. The Growing Appetite for Catastrophic Risk:The Catastrophe Bond Market at Year-End 2004. Available at www.guycarp.com/portal/extranet/pdf/Cat%20Bond%20Update%20Final%20032805.pdf?vid=1
risk (see Table 8.5). They have not replaced traditional insurance andreinsurance policies and nor are they likely to do so. Initially, they involvedhigh transaction costs while each party familiarized themselves with anew financial product. As with weather derivatives it also took time todevelop adequate databases for accurate risk assessment. The very name‘‘catastrophic risk’’ sounds much riskier than comparable investments (suchas government bonds), and this too may have made it difficult to get themarket started. However, more than 10 years after the first bond was issuedno bond has yet been triggered, although there have been close calls witha Japanese typhoon and hurricane Katrina. Thus, the bonds have paid ahigher-than-average yield and have diversified the investor’s portfolio whilestrengthening the reserves of the insurance industry.
Cat bonds serve as an important example of adaptation to climatechange by the financial services sector, but they do nothing to reduce theunderlying physical risk; they simply transfer part of that risk to investorswho are prepared to move further along the risk-return curve than thesponsors in the insurance industry.
CONCLUSION
Climate change puts pressure on corporations to adapt to both adverseand severe weather as the climate warms and the weather becomes less

202 CARBON FINANCE
predictable. In the last 10 years we have seen the development of newfinancial products designed to transfer some of the risks we will encounterin a world which is now carbon constrained.
A weather market has recently developed to provide hedging opportuni-ties to end users (companies exposed to weather risk), along with enhancedreturns for the suppliers of capital who are willing to accept the transfer ofthis risk. This market ‘‘has grown sharply, from nearly nothing in 1997 toUS$40 billion notional market value in 2005’’ (Swiss Re 2006) to transferthe weather risk from consumers and taxpayers to those corporations bestsuited to absorb the risk. For these new markets to function effectivelythey will require a sufficient volume of transactions and sufficient trans-parency for efficient price discovery. Coincidentally, this development hastaken place at a time of increasing uncertainty in the world’s climate andthe weather conditions associated with that changing climate. This factorundoubtedly complicates the evolution of the market, while at the sametime increasing the need for it. However, if energy companies can effectivelyhedge their weather risk they can reduce earnings volatility and ensurerelatively stable prices for their customers.
The new circumstances require an unprecedented level of cooperationand transparency for public and private sectors of the economy. An analysisof the early stages of the development of this market is encouraging.However, its longer-term success will require a broader understanding andavailability of data that accurately characterize the underlying risk anda clearer understanding of the regulatory responsibility of the relevantlevels of government. Recent developments suggest that players in thebusiness community have enough confidence in weather derivatives as arisk-transfer mechanism to support the emergence of a viable market. Datastandardization and exchange-based trading are the essential componentsto ensure that this happens. It is also essential that government bodiesare willing to learn to develop their new role as regulators, and remaincommitted to the design of efficient markets.
Cat bonds have developed in parallel with weather derivatives totransfer some of the risk associated with extreme weather events which havebecome significant enough to threaten the stability of the global insuranceindustry. This has been a matter of particular concern to the reinsuranceindustry which pays a significant price (sometimes more than half) of thelosses associated with extreme events. The danger to the insurance industrylies in the vulnerability of particular regions of high insurance density suchas northwestern Europe, coastal regions of the United States, and Japan.
In Europe the insurance industry has been in the vanguard of callsfor serious efforts to reduce greenhouse gas emissions (mitigation) as wellas calling for adaptive measures such as enforcement of the building code

Adapting to Adverse and Severe Weather 203
and zoning protection in flood plains, matters in which central and localgovernments have sometimes failed to maintain the proper safeguards. In theUnited States the need to be proactive on these issues was reinforced by the2005 hurricane season in the Gulf of Mexico, especially hurricane Katrinawhich—ironically—caused the postponement of the annual meeting of theNational Association of Insurance Commissioners, which was scheduled tomeet in New Orleans.

CHAPTER 9Key Players in the Carbon
Markets
Martin WhittakerDirector: Mission Point Capital1
INTRODUCTION
The growth of the global carbon market since early 2005, when tradingon the European Union emissions trading scheme (EU ETS) began inearnest and the Kyoto Protocol finally entered into force, has surpassed theexpectations of even the most bullish carbon pundits. Recent reports haveestimated that 2005 saw 799 MtCO2e in carbon-related transactions worthapproximately ¤9.4 billion, with the volume traded in the EU ETS alone in2005 at 262 MtCO2, corresponding to ¤5.4 billion (Point Carbon 2006a).2
This phenomenon has been driven by many factors, including:
� The trading appetite of large corporations regulated under the ETS.� The commitments of European politicians to reduce greenhouse gas
emissions.� The willingness of the market to accept Kyoto carbon credits as a
legitimate compliance currency.� The ability of market authorities to keep to stringent market develop-
ment timelines.� The opportunistic instincts of early speculators and traders.� The development of acceptable legal and accounting standards.� The commitment of certain market pioneers who were prepared to take
a calculated business risk in an unproven marketplace.
The market formation process has not been without its struggles, indeedthere have been moments when the future of Kyoto’s flexible mechanisms
205

206 CARBON FINANCE
looked to be in serious jeopardy. However, with the basic elements of theglobal carbon finance system now in place, the stage is set for long-termmarket development. More and more, organizations from the mainstreamfinancial world are staking out their positions in the market.
This chapter will describe some of the types of organizations that havebecome, or are becoming, the carbon market’s key players; the nature oftheir involvement; some of their experiences to date; and their potentialroles in the future. It is not intended to be an exhaustive list of allmarket participant types, and the bona fides of any companies mentionedbelow cannot be vouched for. Although mention is made of the activitiesof certain public sector and multilateral institutions, the emphasis of thechapter is on the private sector (and particularly the financial sector) andhow carbon finance is being pursued as a new business opportunity. Themacroeconomic implications of climate change itself, the implications ofadaptation requirements, and the broader activities relating to investmentsin low-carbon technologies, renewable energy, and clean industrial processesare described in earlier chapters.
BASIC ELEMENTS OF THE MARKET
EU ETS Trading
As previous chapters have detailed, today’s carbon market is dominated bytwo very different but directly connected transactional environments; the EUETS market, which is a cap-and-trade system confined to European industrialinstallations, and the Kyoto project market, in which carbon credits aregenerated from projects that reduce emissions below business as usualscenarios. Although other markets—notably the Japanese and Canadiandomestic carbon regimes, and various U.S. state-level initiatives such as theRegional Greenhouse Gas Initiative (RGGI)—are under development andhave seen some initial precompliance trading activity, the ETS–Kyoto systemremains the central driving force behind today’s global carbon business and,therefore, the primary context of the discussions in this chapter.
The basic mechanics of the EU ETS have been described in previouschapters. It is estimated that around 50 companies currently trade on aregular basis, although participation has varied considerably depending onproximity to the compliance ‘‘true up’’ period in March and April. Themost frequent traders are mainly utilities and merchant energy compa-nies, industrial conglomerates, as well as a group of financial institutionsthat have established environmental market desks. Trading typically occursvia specialist brokers, clearing agents, or directly on exchanges. Informa-tion on prices and market conditions is generally supplied by the brokers

Key Players in the Carbon Markets 207
(e.g., TFS, Evolution Markets, CO2e.com, Natsource) and exchanges(notably the European Climate Exchange and NORD Pool), in additionto certain specialist information providers and reporting/research organiza-tions (e.g., Point Carbon), and the business journals Environmental Financeand Carbon Finance. Contracts tend to be based on established Interna-tional Swaps and Derivatives Association (ISDA) or European Federationof Energy Traders (EFET) master trade agreements, although a customizedcontract has been developed by the International Emissions Trading Asso-ciation (IETA). Choice of contract tends to depend on previous familiarity:for example, financial institutions tend to prefer the ISDA contract, whereasutilities lean toward the EFET contract. Minor differences still exist betweenthese contract versions although work is under way to create a single stan-dardized document. Legal, accounting, and tax support is provided by agrowing cadre of established professional law and accounting firms.
During 2005, daily volumes for the various forward delivery contractstypically ranged between 100,000 and over 1 million tons, depending onthe vintage. This number is trending upward: In early 2006, increasedparticipation pushed trading volumes of the 2006 contract toward the2 million mark, and during the frenzy of early June of that year, when2005 emissions data first reached the market, beyond 10 million. Bid/askspreads have generally narrowed since trading commenced, and liquidityhas steadily climbed. Continuous spot trading began toward the end of2005 and a derivatives market is currently forming. Two exchanges, ECXand Powernext, recently entered into an agreement to trade both the CO2
emission futures and spot contracts on a continuous basis. Some of thefundamental trends affecting prices are listed in Table 9.1.
Clean Development Mechanism (CDM) and JointImplementation (JI) Projects
As far as the Kyoto project-based markets are concerned, the key playersuntil mid-2005 were the World Bank and certain national governmentslooking to procure carbon credits for market development and Annex 1country buyers concerned about Kyoto compliance, respectively.
During 2005, however, greater confidence in the future of the marketled to the formation of a number of purely private-sector carbon funds thatprovide buyers with the opportunities to benefit from a managed portfolioof carbon securities. Currently, over $3 billion is thought to reside in suchfunds, although the private nature of many of these funds makes the precisenumber difficult to determine. Since the EU Linking Directive made possiblethe use of CERs and ERUs for compliance in the ETS (to what extent stillremains to be seen), demand for such credits has also taken off among large

208 CARBON FINANCE
TABLE 9.1 Fundamental Trends Affecting the Price of Carbon
Bullish Signals Bearish Signals
Colder-than-expected winters;warmer-than-expected summers
Warmer-than-expected winters;colder-than-expected summers
Widening spark and dark spreads(especially in German and U.K.baseload) either due to rising gas/oilprices or rising electricity demand
Thinning of spark/dark spreads, orlower gas/oil prices
Tightening of EUA supply from NAPs Relaxation of emissions controls fromgovernments
Tightening of supply of carbon creditsvia Linking Directive
Loosening of restrictions on use ofKyoto credits for ETS compliance
Heightened political commitment tocutting GHGs after 2012
Softening of political will to extendKyoto or relax efforts to cut GHGemissions
US support for domestic GHGemissions restrictions andcap-and-trade legislation
Distancing of U.S. from Kyoto, GHGemissions controls and market-basedGHG legislation
Source: Point Carbon.
European industrial emitters regulated under the trading scheme seekingto diversify their sources of compliance instruments. Over 1,420 projectsare currently being planned, valued at $2.5 billion at today’s prices. Overthe last 12 months, approximately 58 million tons of CO2e have beenpurchased, at $4 to 8/t, or $232 million to $464 million. Point Carbon hasestimated future demand for credits is currently put at 600 to 700 milliontons annually, worth more than $5 billion (Point Carbon 2006b).
This step up in project activity has not surprisingly lead to a significantpick up in businesses for CDM and JI project developers, to the extent thatsuch companies have seen their standing in the market rise dramatically.Several have become publicly listed companies. The provision of financialand technical verification and engineering services to such projects is also arapidly growing business.
Intermediaries, Speculators, and ProfessionalServices
Beyond the compliance trading market and so-called pure play carbon com-panies lies a growing body of support services, ranging from investmentbanking and equity research to credit ratings and insurance. In particular,the potential for carbon regulation to influence the future market valuation

Key Players in the Carbon Markets 209
of publicly listed companies has required mainstream financial analystsand bond rating agencies to devote research resources to understandingthe implications of carbon finance more thoroughly. The link betweenemissions prices and energy commodity prices has resulted in commoditytrading desks setting up carbon contract trading capabilities as a naturalextension of their energy and power trading operations. To the extentthat carbon finance issues are also affecting power generation economics,corporate operating and finance departments are now incorporating carbonfinance into strategic decision making. Many companies need advice onthis from investment banks, who understand the implications of carbonfinance within the corporate finance complex. Insurers are taking steps todevelop credit delivery guarantees and other structured insurance productsso that counterparties to a transaction can transfer the risk of nondeliveryor project failure more effectively. Banks are being asked to lend againstfuture carbon cash flows. Investors are being invited to provide equitycapital based on a view of the future value of carbon-related business.Private investors in the clean energy infrastructure markets, whether theybe focused on venture, equity, mezzanine, or senior debt financing, needto understand the impact of carbon finance on future cash flows, companyvaluations, and power project economics. A growing number of speculativeinvestors, hedge funds, and private pools of capital are coming to mar-ket in search of new, uncorrelated returns based solely on carbon pricemovements.
Finally, many smaller companies with a direct financial stake in thecarbon market have floated shares on the stock exchange, or raised privateequity and debt capital in the financial markets. This has necessitated theformation of specialty carbon finance expertise within investment banking,brokerage, and advisory companies. The majority of these publicly listedcarbon finance companies have been floated on U.K. equities markets.
� Camco International, a U.K.-headquartered company, listed on theLondon Stock Exchange’s junior market Alternative Investment Market(AIM), in April 2006 (Nicholls 2006f).
� In March 2006, CDM project developer Econergy floated on the juniormarket AIM, raising net £55 million at a price of 100 pence per share.
� Carbon Credit Capital Plc., a fund that will ‘‘buy carbon credits fromClean Development Mechanism projects and sell them to companiesrequired to comply with the Kyoto Protocol,’’ was reported to be raising£40 million through an initial public offering, also on the AIM, untilthe EUA price collapse forced the company to postpone these plans.
� These firms join AgCert, Climate Exchange, Ecosecurities, and TradingEmissions Plc., which floated in London in 2005 (Point Carbon 2006c).

210 CARBON FINANCE
KEY PRIVATE-SECTOR PLAYERS
Compliance Participants
Industrial compliance–driven market participants form the backbone ofthe global carbon market and remain, along with national governments,the major source of business activity. The ETS itself directly affects over6,000 companies and organizations from major industrial sectors includingcement, ceramics, iron and steel, natural gas, pulp and paper, power (whichreceived 56 percent of EUAs issued), and refining. The positioning of thesecompanies in the carbon market—whether they are short or long, whetherthey are pursuing internal abatement strategies or using the market to meetcompliance targets, how they plan to trade and settle their positions duringthe year, and the extent to which they aim to use Kyoto project credits tosatisfy compliance—exerts a major influence on prices and overall marketconditions. U.K. and German energy firms have a substantial allocation ofEUAs, and EUA prices are therefore highly correlated with German baseloadpower contracts and U.K. gas prices. The major compliance traders on theETS during the first year of operation have been the utilities and energycompanies, particularly those with established energy trading desks, whoneed to hedge their financial exposure to emissions compliance by tradingEUAs.
Commercial Banks
With the exception of a few early pioneers, the commercial banking sectorhas been a relative latecomer to the carbon finance market. This can beattributed in part to the conservative nature of these institutions and theimmature state and small size of the carbon business relative to otherfinancial markets. As the market has matured, however, commercial banks,especially those with a strong European presence, have begun to involvethemselves in structuring and financing emissions reduction projects.
A good example of this is provided by the Bank of Ireland, whichstruck an arrangement with Irish power plant Edenderry in which thebank agreed to deliver to Edenderry emission allowances equivalent totheir shortfall at a price indexed to the EUA prices quoted on the ECX(Point Carbon 2005). This agreement provides much more price certaintyfor Edenderry, which will help them budget for emissions compliance moreefficiently. Dutch bank ABN Amro has targeted the carbon market asan area of strategic interest, launching a number of sustainable privateequity funds worldwide, and becoming involved in carbon trading, clearingof exchange-based carbon trades, and the financing of prepaid carboncredits by European corporate buyers (ABN Amro 2005). Belgian bank

Key Players in the Carbon Markets 211
Fortis has also been an early participant in the carbon market’s formation,offering trading, counterparty services, clearing, and financing based oncarbon finance. Many other European-based commercial banks—notablyRabobank, Barclays, and HSBC—are following suit, particularly in the areaof corporate carbon banking and advisory services.
Carbon Funds
The emergence of specialist carbon funds has been a prominent feature ofthe markets over 2005 and 2006. Descendents of the World Bank PrototypeCarbon Fund, these funds now constitute a major source of capital for CERsand ERUs in the global Kyoto markets. It is estimated that approximately$2 billion is committed to such funds, although the actual amount is difficultto determine. Their investors tend to be either major compliance buyerswishing to outsource or diversify their credit purchasing activities (suchas is the case with Natsource’s Greenhouse Gas Credit Aggregation Pool[GG CAP] fund, or the European Carbon Fund), or speculative investorswho take the view that the rising price of carbon is a source of return (seeTable 9.2).
A summary of the carbon funds currently open to outside investors isshown below, although it should be cautioned that this is a rapidly changingarea of the carbon markets, such that the number and size of these fundsmay have varied considerably since publication.
Speculative Investors
The emergence of any new market attracts risk capital and early speculativeinvestors and the carbon market is no exception. A number of hedge fundsand private investment funds from Europe and the United States have begunto deploy capital either in the form of equity stakes in carbon companies oras purchasers and/or traders of carbon credits. These include:
� RNK Capital, a New York–based emissions-focused hedge fund.� Citadel Investment Group, the $12 billion–plus U.S. fund which has,
inter alia, become a participant in the European Carbon Fund.� Tudor Investment Capital, part of the leading U.S. hedge fund company,
which has taken an equity stake in CDM project developer CamcoInternational.
� Stark Investment Management, a Wisconsin-based hedge fund, whichhas expanded its environmental markets capability through strategichires.

TABLE 9.2 Examples of Carbon Funds
Fund Estimated Target Size (¤ million)
World Bank FundsPrototype Carbon Fund (PCF) 150Dutch JI and CDM Funds 222Community Development Carbon Fund 77BioCarbon Fund 77Multilateral Carbon Credit Fund 100Italian Carbon Fund 77Spanish Carbon Fund 200Danish Carbon Fund 27
Government FundsAustrian JI/CDM Tender UnknownBelgium Federal JI/CDM Tender 9Canada PERRL 12Danish Carbon Tender UnknownEcosecurities Standard Bank UnknownFinnish JI/CDM Pilot Tender 20German KfW 80Rabobank/Dutch Gov’t CDM Facility UnknownSwiss Climate Cent 100Japan Carbon Fund Unknown
Private FundsNatsource GG CAP 500European Carbon Fund 105Trading Emissions 200Japan Carbon Finance 110ICECAP 250Merzbach Fund UnknownClimate Change Capital 50
Total 2,366
Source: Based on estimates from Morgan Stanley, International Emissions TradingAssociation, and Point Carbon.
212

Key Players in the Carbon Markets 213
� MissionPoint Capital Partners, a private U.S.-based fund, which hasbeen investing and trading throughout the global carbon markets andis a major shareholder of Ecosecurities.
� Dexion Capital, a hedge fund group, which has launched a new fund ofhedge funds—Dexion Alpha Strategies—advised by RMF InvestmentManagement, part of the world’s largest listed hedge fund firm ManGroup—and is expecting the listing to raise between £60 million and£85 million. In addition to carbon emissions, the fund will also seekexposure to the weather markets and catastrophe risk finance vehicles.
Excitement about the future carbon market has even spawned thecreation of new funds. In early 2006, publicly listed hedge fund AlphaCapital and Dutch Bank ABN Amro announced the listing of a new hedgefund on the London Stock Exchange seeking to exploit opportunities in newsectors including the emissions market (Point Carbon 2006d). The fund’sgeneral partners were reported to be hoping to raise up to £80 million(¤115 million) from the issue of some two million shares.
As the market matures, and liquidity and participation expands, it isexpected that there will be a considerable step up in involvement from moremainstream investors, pension funds, foundations, and other plan sponsors,as has occurred in other markets such as commodities and mortgage backedsecurities.
Project Developers and Aggregators, Consultants
As the Kyoto project markets have taken off, so have the fortunes ofmany of these primarily small companies that have painstakingly developedportfolios of emissions reducing projects over the years. These companieshave typically been involved in the market for many years, some since beforethe emergence of the Kyoto Protocol itself. Table 9.3 summarizes the sizeand nature of the portfolios of leading project developers, in addition totheir respective positions in the market.
Equity Research
Like the commercial banks, the mainstream equity research houses (treatedtogether in this section) have been relative latecomers to the market. How-ever, as capital has begun to be attracted to the market, and as companiesinvolved in the market have sought financial advisory and capital raisingassistance, many established banks have stepped up their interest and soughtto capture a share of the carbon finance market.
The growing involvement of the Wall Street banks is exemplified by therecent spate of research reports focused on the carbon market:

214 CARBON FINANCE
TABLE 9.3 Carbon Project Developers
Company Ownership Portfolio Size Market Position
Ecosecurities Publicly listed 100 million metrictons CO2e
CDM focused, strongin East Asia, LatinAmerica
Camco Publicly listed 97 million metric tonsCO2e
Focus on China andRussia
Vertis Private Unknown JI focused, mainlyEastern Europe
EcoInvest Private Unknown Latin AmericaQuality
TonnesPrivate Unknown; mainly
consulting focusedGlobal
Econergy Publicly listed 2.6 million metric tons(target)
CDM, globallyfocused, strong inLatin America
MGMInternational
Private 50–100 million metrictons
CDM, strong in LatinAmerica
Factor Private Unknown; mainlyconsulting focused
Global
NServe Private Unknown Focus on N2Odestruction projects
AgCert Publicly listed At least 2 millionmetric tons per yearacross all markets
Focus on agriculturallybased projects
JP Morgan’s European Corporate Research team issued ‘‘All you everwanted to know about carbon trading: Quick answers to some key ques-tions’’ on January 11, 2006 (JP Morgan 2006). In the report, JP Morganstates that it believes that CO2 will grow in importance as an issue forEuropean corporates—in all industrial sectors, and not just the powerbusiness—and hence for equity and credit markets.
Morgan Stanley’s European Equities group issued ‘‘Equity Plays onthe Emerging Carbon Market,’’ which examined the background to theemerging carbon market, the fundamental drivers of demand for emissionallowances, and initiated coverage of several carbon industry companies,including AgCert and Climate Exchange (Morgan Stanley 2005).
Merrill Lynch’s Commodities Group arranged a ‘‘Carbon Market Out-look Conference Call,’’ with the Head of Commodity Research and Directorof Emissions Trading, in which they discussed market fundamentals andMerrill’s view on future direction of prices (Merrill Lynch 2006). The com-pany followed this up by issuing a trading note, in which they articulated abelief that EU emissions are still undervalued versus fundamentals.

Key Players in the Carbon Markets 215
Goldman Sachs’ Environmental Policy Framework explicitly states thatthe company intends to act as a market maker in emissions trading (CO2,SO2), weather derivatives, renewable energy credits, and other climate-related commodities, and look for ways to play a constructive role inpromoting the development of these markets (Goldman Sachs, n.d.)
A diametrically opposed view was represented by an e-mailed commu-nication from UBS to its clients in early 2006 which said that the priceof carbon allowances could collapse by May 15, adversely affecting powerprices for utilities and hence their share prices, as there was a ‘‘significantpossibility’’ that the carbon market was not as short of carbon allowancesas was first thought (Point Carbon 2006e).
Deutsche Bank’s European Utilities team issued a report in November2005 entitled ‘‘What if? The risk of much higher carbon and power prices,’’in which they discussed the potential shortfall in permits required to meetthe overall ETS Phase One cap, various other influences over the long-term price of carbon, and the implications for European power generatingcompanies.
These and other bank-based research groups now compete with oneanother to produce the best research on the carbon markets, and the depthand quality of investment research in the sector will likely increase as themarket continues its expansion.
Carbon Brokers
A number of brokers specialize in the carbon markets, usually as part ofa strategic focus on the broader emissions and environmental productsmarket. These brokers are active in both the EU ETS and the Kyoto projectmarkets, where transactions continue to be highly structured and the value-add of a knowledgeable broker is considerable. The key brokers currentlyinvolved in the carbon markets include Evolution Markets, CO2e.com,Prebon, Spectron, TFS, ICAP, and Natsource. The relationships betweenthose buying and selling in the market and their broker is an important one,and is determined by a number of factors including cost, trust, knowledge ofthe market, and transaction structuring skill. Brokers are a critical source ofmarket intelligence for their clients on either the buy or sell side, particularlyin the CDM and JI, where transactions tend to be more highly structured,larger in size, and lengthier in the execution. As the exchanges capture moremarket share within the EU ETS, the Kyoto project market and the regionalcarbon markets will likely be the primary hunting ground for carbon brokersin the coming years.
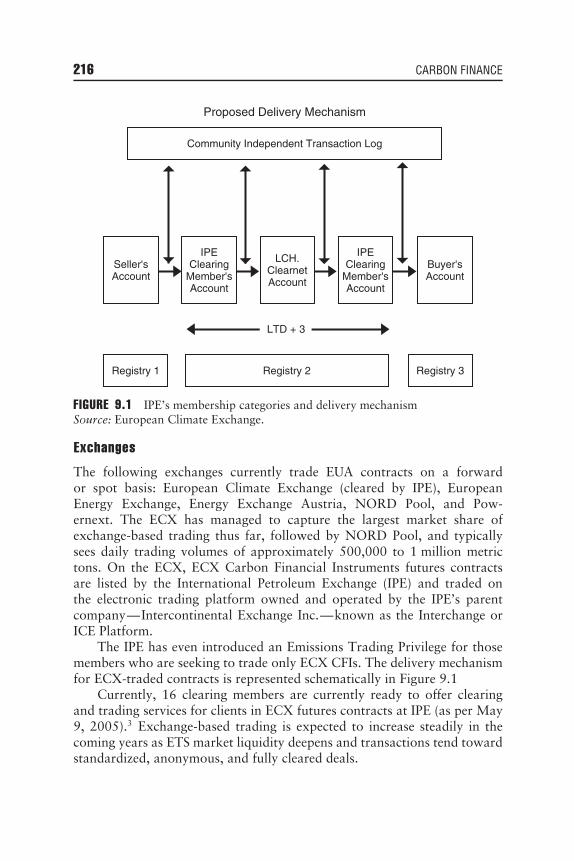
216 CARBON FINANCE
Registry 1 Registry 3Registry 2
Community Independent Transaction Log
Proposed Delivery Mechanism
Seller'sAccount
IPEClearing
Member'sAccount
LCH.ClearnetAccount
IPEClearing
Member'sAccount
Buyer'sAccount
LTD + 3
FIGURE 9.1 IPE’s membership categories and delivery mechanismSource: European Climate Exchange.
Exchanges
The following exchanges currently trade EUA contracts on a forwardor spot basis: European Climate Exchange (cleared by IPE), EuropeanEnergy Exchange, Energy Exchange Austria, NORD Pool, and Pow-ernext. The ECX has managed to capture the largest market share ofexchange-based trading thus far, followed by NORD Pool, and typicallysees daily trading volumes of approximately 500,000 to 1 million metrictons. On the ECX, ECX Carbon Financial Instruments futures contractsare listed by the International Petroleum Exchange (IPE) and traded onthe electronic trading platform owned and operated by the IPE’s parentcompany—Intercontinental Exchange Inc.—known as the Interchange orICE Platform.
The IPE has even introduced an Emissions Trading Privilege for thosemembers who are seeking to trade only ECX CFIs. The delivery mechanismfor ECX-traded contracts is represented schematically in Figure 9.1
Currently, 16 clearing members are currently ready to offer clearingand trading services for clients in ECX futures contracts at IPE (as per May9, 2005).3 Exchange-based trading is expected to increase steadily in thecoming years as ETS market liquidity deepens and transactions tend towardstandardized, anonymous, and fully cleared deals.

Key Players in the Carbon Markets 217
Credit Rating Agencies
The potential for carbon emissions regulation to impact the long-termcreditworthiness of industrial companies has required the mainstream creditrating agencies—S&P, Moody’s, Fitch—to incorporate carbon financeconsiderations into their research processes. This is usually most relevantwithin the utilities and power/energy sector analysis. In their special reporton Emissions Trading, written by the Global Power/North America group,Fitch provided an overview of the various emissions trading markets underdevelopment or currently operational. Fitch’s view was that it
anticipates more stringent pollution control requirements lead-ing to increased operating and capital costs. A well-structuredemission-trading program can assist companies in managing andreducing capital expenditures for compliance with environmentalregulations. (Fitch Ratings 2004)
The involvement of the two primary rating agencies, Standard andPoor’s and Moody’s, has been more observation based. Both companieshave been reported as incorporating carbon finance considerations intotheir respective bond rating activities, and are known to be tracking theemissions trading markets, particularly in Europe.
Insurers
The involvement of the insurance and reinsurance industries in carbonfinance has been driven by two primary forces: a need to understandthe potential impacts of climate change trends on the property, casualty,life, and health risks underwritten by the industry, and the sense of newbusiness opportunities arising from the growth of the carbon market. Asthe two largest reinsurance companies in the world, Swiss Re and MunichRe, initially adopted broader market-building roles that sought to deepenunderstanding of the economic impacts of climate change and explore thedevelopment of new insurance products specifically designed for carbonmarket trading. U.S.-based insurance giant AIG has also recently begun tofollow suit with a string of initiatives announced in early 2006 (LeBlanc2006).
With the sudden expansion of the markets, particularly the CleanDevelopment Mechanism, demand for carbon credit delivery guaranteesthat transfer, the risks of nondelivery of carbon credits away from the buyeror seller has increased. Counterparties to a transaction are increasinglyseeking ways to remove the risks of nondelivery, and insurance has a key

218 CARBON FINANCE
role to play in this. As the need for insurance products has increased, so therole of the insurance brokers, such as Aon and Marsh, has grown.
During 2005 and 2006, interest across the carbon markets has fosteredmore competition among insurance companies for carbon finance business,and large players such as AIG and Zurich have announced plans to intro-duce their own carbon delivery guarantees and project insurance products.As both the size and scope of carbon markets grows, and the financialconsequences of noncompliance or poor risk management becomes a moresignificant financial issue, risk management and insurance services willbecome more prominent. Many industrial companies affected by the ETSdo not view the emissions business as core to strategy, and increasinglylook to transfer risks to third parties capable of helping them meet theircompliance obligations. Larger insurance carriers, with their strong creditrating, risk-taking ability, market knowledge, client/investor relationships,and global reach, have a natural role to play in the development of the mar-ket. The development of integrated risk management product offerings, thathedge total climate-related risk together (weather, emissions, and power), isa particularly attractive growth area for the larger insurance players.
KEY PLAYERS FROM THE PUBLIC SECTOR
National Governments
National governments have been long-time actors in the carbon markets asearly purchasers of carbon credits and as architects of the Kyoto Protocolitself. Annex 1 governments with emissions targets under Kyoto have tendedto purchase CERs and ERUs either directly, or through intermediaries. Directpurchases have typically been made through competitive tendering or directsourcing. An example of this is provided by the Danish government, whichissued a public Request for Proposals for an undisclosed volume of CERsand ERUs via a rolling tender process in early 2006. The Dutch government,among others, has also been a noted leader on a national level, issuing publiccompetitive tenders for CERs and ERUs very early in the Kyoto process wellbefore the Protocol had entered into force.
Indirect sourcing activities typically involve the retention of a third-party organization to administer funds on the government’s behalf. TheDutch government has also been active as an indirect purchaser, settingup a dedicated carbon credit purchasing facility within the European Bankfor Reconstruction and Development, for example. This facility has beenan active buyer of ERUs from central and eastern Europe JI projects.Other governments have begun to follow suit. In fall 2003, the WorldBank entered into an agreement with the Ministry for the Environment

Key Players in the Carbon Markets 219
and Territory of Italy to create a fund for Italian private and public sectorentities to purchase carbon credits from CDM and JI projects (World Bank,n.d.). Similar facilities have also been established for the Spanish, Danish,and Dutch governments. Advising and administering funds on behalf ofnational governments has been and will continue to be an important rolefor carbon businesses as the markets expand.
National Business Associations
In addition to sourcing credits themselves, governments have also encour-aged national business associations and other institutions to enter thecarbon market. In early 2006, for example, the Swiss government hasformed the Klimarappen or Climate Cent Foundation, which aims to pur-chase 10 million metric tons of greenhouse gas (GHG) emission reductions(10 Mt CO2e) by 2012 from CDM and JI projects. The Climate CentFoundation launched activities in October 2005 as a voluntary initiative offour major Swiss business associations.4 The Foundation is a completelyprivate-sector, compliance-driven buyer. It will invest its annual revenuesof 100 million Swiss francs (around $65 million), generated by a chargelevied at a rate of 1.5 Swiss cents (1.0 cents) per liter on petrol and dieselimports, in effective and credible climate protection projects in Switzerlandand abroad.
Similarly, the Japan Carbon Fund, established in December 2004,represents the carbon credit purchasing vehicle of several Japanese privatesector enterprises and public lending institutions, including the TokyoElectric Power Company, Japan Bank for International Commerce andthe Development Bank of Japan. In Germany, government banking groupKfW has set up a carbon fund in cooperation with the Federal GermanGovernment in order to purchase emission credits from JI- and CDM-projects. Three-quarters of the companies participating in the Fund areGerman, the remainder comes from Austria, Luxembourg, and France.The majority is power generating companies, but chemical and cementcompanies also participate. The fund has a total of ¤80 million availablefor purchasing credits and signed its first deal, the purchase of CERs froman Indian HFC 23 project, in October 2005.
Multilateral Banks
The formation of the World Bank’s Prototype Carbon Fund, which gavegovernments and large corporations a low-risk vehicle for accessing car-bon credits and which as of July 2006 had approximately $180 millionunder management, provided the organization with a dominant position in

220 CARBON FINANCE
the Kyoto project markets through the end of 2005. The various WorldBank purchasing facilities have subsequently been consolidated throughthe establishment of the World Bank Carbon Finance Business and theconcomitant creation of other carbon funds, including the CommunityDevelopment Carbon Fund, the BioCarbon Fund, and several nationallyoriented carbon funds.
The World Bank’s private investment arm, the International FinanceCorporation (IFC), has also been active in the carbon finance mar-kets through its Carbon Finance Facilities. These facilities, which asof May 2006 had approximately $80 million under management, aredesigned to purchase CERs and ERUs on behalf of the Government ofthe Netherlands.
Similarly, the European Investment Bank (EIB) made early efforts todevelop carbon-focused funds, in the form an agreement with the WorldBank, to pursue a Pan European Carbon Fund to support climate friendlyinvestment projects throughout Europe. The primary focus of EIB’s activitiesat present is the Multilateral Carbon Credit Fund (MCCF), a joint effort withEBRD that will generate carbon credits from projects in central and easternEurope and the Commonwealth of Independent States (CIS). The MCCFwill be open to public and private-sector participants, and will use externalprivate carbon managers to handle certain operational activities. Finally, theAsian and Inter-American Development Banks have each announced plansto create special financing vehicles for CDM projects in their respectiveregions of operation.
INFORMATION SERVICES
The availability of timely, reliable, and accurate information on the stateof the market and the existence of secure, dependable trade execution andsettlement infrastructure are clearly two critical elements of any properlyfunctioning marketplace. Traders need information to develop and executetrades, develop trade structures, negotiate transaction terms and conditions,price their bids and offers, understand their financial exposure, quan-tify risk factors and market volatility, and interpret fundamental markettrends. The development and creation of high-quality, credible informa-tion networks has therefore been an important stage in the maturation ofthe market.
Such information is primarily provided by carbon exchanges and bro-kers. Market data, including daily bid-ask-last prices; daily settle prices;spot, forward, and options trades; and implied volatility data, are obtainedin real time from brokers (Evolution Markets, TFS, Natsource, GTI) andexchanges (ECX, EEX, Powernext, NORD Pool).
Key Players in the Carbon Markets 221
The most prominent independent supplier of carbon market researchand information is Point Carbon. Point Carbon publishes daily price chartsand research on market fundamentals, as well as complete listings ofCDM and JI projects and host countries. Other sustainability-orientedresearch and investment advisory companies such as Innovest and IRRChave also begun to supply specialized information on the carbon assetsand liabilities of large publicly listed companies, and the Carbon DisclosureProject collects and publishes information on the carbon market strategiesof some of the world’s largest industrial companies. Dow Jones Newswires,Platts, Argus, and Reuters also provide subscribers with daily market sum-maries that include data on prices, trading views, and news on basic marketdrivers.
PROFESSIONAL SERVICES
Accounting
The accounting and tax treatment of carbon credits is another importantconsideration for market participants. Although there has been considerableprogress on the issue over the course of 2005 and 2006, this is still an areaof considerable uncertainty, with many key questions yet to be resolved.In a recent report on the carbon markets, PricewaterhouseCoopers (PWC)summarizes its tax specialists’ current views on how emissions tradingshould be treated from a corporate income tax and value-added tax (VAT)perspective. Accounting practices in the carbon markets are typically basedon an analysis of existing sources such as case law and discussions withauthorities, which are ongoing.
Legal
Law firms have been involved in the development of the carbon market sincethe early stages of the Kyoto Protocol negotiations, the development of theflexible mechanisms, and the formation of the EU ETS. In addition to thebasic legal design issues surrounding these systems, the focus of legal activityhas been the establishment of title over the emissions credits themselves,the means by which title can be transferred via trading, the content anddesign of transaction agreements, the regulations dictating how companiescan trade on the ETS, and so on. Many companies have had to developin-house legal expertise as their trading activities have escalated, and thenumber of lawyers specializing in carbon trading has risen steadily sinceearly 2005.

222 CARBON FINANCE
NEW HORIZONS FOR THE CARBON MARKET
Carbon as an Asset Class
The first phase of the transformation of the carbon markets from a nego-tiated policy instrument to a functioning economic marketplace appears tobe complete. The requisite financial and capital market functions are at anadvanced stage of development and buyers and sellers are coming forward.As the secondary market forms, liquidity deepens and fundamentals becomemore economically rather than politically motivated, the shift toward car-bon becoming a genuine asset class will undoubtedly hasten. As this processtakes place, carbon will increasingly be seen like other commodities, andwill come to be traded and financed and underwritten. Underpinning thisevolution, however, is the attachment of economic value to avoided green-house gas emissions. It is critical to remember at all times that emissionsthemselves are not an economic good, only the avoidance of emissions asframed by international political convention. Thus, a fundamental politi-cal and social commitment to reducing greenhouse gas emissions throughthe use of market-based policy instruments is the ultimate determinant ofcarbon value and the viability of carbon as an asset class in the future.
Mainstreaming into Project Finance
The recognition of carbon as an asset or liability, as a future source ofcash flow or expenditure, or as a source of return and risk, means that theintroduction of carbon finance into the mainstream of financial decisionmaking is assured. However, whether it will become a major factor ormerely a marginal one remains to be seen. The attachment of a clear andpredictable price signal to avoided carbon emissions will be a critical factor.Also important will be the attitudes of carbon market authorities, whomust approve their quality as compliance instruments (for example, on theadditionality issues that relate to the environmental integrity of emissionsreductions) in order for the market to value them. Before establishedproviders of project equity, mezzanine and senior debt within the large,emissions-intensive industrial sectors can price future carbon credit cashflows into the financing equation, they must be confident that these cashflows will materialize and that they will have a value that can be reasonablypredicted. When this happens, carbon finance will have taken a step closerto becoming more fully integrated into mainstream project finance.

Key Players in the Carbon Markets 223
CONCLUSION
The key players in the carbon markets have evolved rapidly over the past24 months as the market has grown. Early market movers were primar-ily government-sponsored entities, large corporations establishing strategicpositions, environmental consultants trying to grow the market, and smallentrepreneurial outfits trying to gain early commercial advantage. Nowa-days, the major players are major industrial GHG emitters, internationalfinancial houses, large hedge funds, clean energy technology providers, andspecialized brokers, traders, and professional services providers. As the sizeand scope of the market continues to expand in the years to come, the needfor specialized carbon finance expertise and services across the financialservices industry will grow commensurately. However, unlike in the earlydays of the market, this expertise is more likely to be embedded withinmuch larger mainstream financial and corporate institutions.


CHAPTER 10Carbon Finance: Present Status
and Future Prospects
We have to stabilize emissions of carbon dioxide within a decade,or temperature will warm by more than one degree. That will bewarmer than in has been for half a million years, and many thingscould become unstoppable. If we are to stop that, we cannot waitfor new technologies like capturing emissions from burning coal.We have to act with what we have. This decade, that meansfocusing on energy efficiency and renewable sources of energy.
Jim Hansen, Director of the NASA Goddard Institute forSpace Studies, in an interview in February 2006
INTRODUCTION
Carbon is now a competitive issue among energy intensive industries andpower producers, while climate change is already physically affecting manysectors of the economy, and financially affecting even more. As a result,climate change is becoming a mainstream issue with institutional investorsas is clearly demonstrated by the rapid growth of the Carbon DisclosureProject which is now backed by investors responsible for approximatelyhalf the global investment in publicly listed companies. (See Table 5.3 inChapter 5.) Boards can no longer afford to dismiss shareholder resolutionscalling for engagement on the issue. Even during the writing of this bookthere has been a marked shift in opinion in the business sector fromseeing climate change as a reputational or a regulatory risk to a business,bottom line risk. The new twist is that the risk for businesses outsidethe European Union (EU) is that their governments will react too late forthem to make the most of the opportunities opened up by the challengeof climate change. As the governor of Arizona stated: ‘‘In the absence ofreal action at the federal level, states are stepping forward to address theserious issues presented by climate change’’ (Environmental Finance 2006).
225

226 CARBON FINANCE
BOX 10.1 CARGILL INVESTS IN BIODIESEL
PRODUCTION IN EUROPE
Cargill, a U.S.-based global food and agriculture company recentlyannounced its acquisition of a 25 percent stake in Greenergy BiofuelsLtd. in the United Kingdom. Tesco owns 25 percent of GreenergyFuels, which owns the other 75 percent of Greenergy Biofuels. Tescois the leading biofuel retailer in the United Kingdom, offering biofuelblends at more than 40 percent of the petrol stations attached to itssupermarkets.
Greenergy Biofuels is building a 100,000-ton (114 million–liter)capacity biodiesel production plant at Immingham on Humberside.There are plans to develop additional production facilities near Liv-erpool, where Cargill already operates a seed crushing plant. Thispartnership thus fully integrates the biodiesel business from provisionof the raw materials, through manufacturing and retailing.
Cargill also has plans to produce biodiesel in Belgium andGermany.Source: Cargill 2006. Available athttp://www.cargill.com/news/news releases/060228 greenergy.htm.
Similarly, major players in the private sector in the United States areinvesting in opportunities that have been created in the EU in response toclimate change. (See, for example, the recent investments of Cargill, theMinneapolis-based agricultural commodities giant in Box 10.1.)
The transformation of the energy chain is clearly the heart of the matter.This can be done via incentives to continually improve energy efficiency, byreducing the need for energy, and by switching from fossil fuels to hydrogenand renewables, while relying on gas as the transition fuel of choice.
Despite its erratic progress, the Kyoto Protocol finally came into forcein February 2005, a few weeks after the opening of the EU emissions tradingscheme (EU ETS), which is linked to Kyoto by its national reduction targetsand the flexible mechanisms—international emissions trading, CDM, andJI. Now we have a real, daily price for carbon. The first CDM projectshave been certified. There is a growing volume of trade in EU EmissionAllowances. In the United States and Australia, there is a continuing pushtoward cap-and-trade systems at every level other than the federal leadership,where—given the U.S. electoral timetable—we can anticipate a change inthe U.S. federal position quite soon.

Carbon Finance: Present Status and Future Prospects 227
Recently, we have seen inclusion of the accession countries into theEU (despite some delays), and the neutralization of their hot air problem.Furthermore, two of those new members (Malta and Cyprus) producednational energy plans even though they were not obliged to accept green-house gas (GHG) caps. Meanwhile, EU-in-waiting countries (Bulgaria andRomania) have also produced NAPs preparatory to developing JI projects.Russia and the Ukraine have approved JI protocols also. As these and othertrading schemes develop, we will see how they affect the transformation ofthe energy chain—the key to a global climate strategy.
The stakes are very high, potentially affecting the well-being of everyoneon earth. We have already seen evidence of impacts at the individual levelthrough the decline of Arctic culture, the spread of disease vectors as theearth warms, and increased deaths from heat stress, forest fires, floods,mudslides, and windstorms.
The world of carbon finance should be seen as broader than thetrading of carbon credits because new financial instruments (such as weatherderivatives and catastrophe bonds) are being developed to facilitate thetransfer of weather-related risks—both for adverse weather and for extremeevents. The use of these products will encourage companies to respond toclimate change in a proactive way, searching for opportunities in thiscomplex challenge. Furthermore, there is an increase in venture capitaland hedge fund activity, which focuses on clean-tech and carbon-reducingactivities.
TRADING VOLUMES IN CARBON AND WEATHER
MARKETS
Carbon Markets
Table 10.1 illustrates the rapid growth of the EU ETS and the CDM.Current indicators also suggest that the ETS is resilient. It is noteworthythat, despite the price plunge in late April (2006), ‘‘During the extremevolatility, the market infrastructure has held up, liquidity has remainedhigh, and participants have been able to trade in and out of their positions’’(Nicholls 2006c, 2).
Volumes of CO2 traded at the CCX—under a voluntary regime—didnot exhibit comparable growth in 2005, although volumes picked up in2006 (see Table 10.2).
Meanwhile, the CCX model has expanded to Canada, Europe, andwill later go to Japan, Russia, and New York. One of the most significantcontributions of the CCX project is to demonstrate the key importanceof transparent price discovery for the development of a viable market. If

228 CARBON FINANCE
TABLE 10.1 The Beginning of the Carbon Market in Europe
2004 2005
EU ETS value in ¤ ¤377 million ¤9.4 billionEU ETS CO2 million tons 17 362CDM CO2e million tons 188 397
Source: Environmental Finance 2006a, based on a Web surveyand interviews by Point Carbon
decision makers know the price of carbon, they can make rational decisionsabout markets and investments.
Weather Derivatives
In the weather derivatives market we can see further proof of the importanceof transparency with the huge increase in the volume of trading once theCME derivatives market came on-stream. (See Chapter 8 and Table 8.1.)The CME was responsible for nearly all of the virtual doubling of trade in2004–2005 over 2003–2004. The weather derivatives market is driven bypowerful forces that are likely to be with us for some time. First, climatechange itself is creating great uncertainty in the weather; it is also producingmore extreme events, from droughts to downpours. Even companies thatput weather risk low on their list of priorities have had to rethink theirbusiness strategy, while those that are heavily dependent on weather—suchas power producers and farmers—need to use alternative risk managementinstruments such as weather derivatives. The growth of the weather marketdepends both on awareness of the risk to drive demand and on the marketinfrastructure (including databases on weather) to attract supply.
TABLE 10.2 Trading in Carbon Financial Instruments (CFI) at theChicago Climate Exchange
CFI Vintage 2005 CFI Vintage 2006
Volume of CO2
traded in 2005in metric tons
483,800 341,800
Volume of CO2
traded in 2004in metric tons
798,700 629,900
Source: The Chicago Climate Exchange. Available athttp://www.chicagoclimatex.com/trading/stats/monthly/st 0602.html

Carbon Finance: Present Status and Future Prospects 229
The second driving force is the growing importance of renewablesources in the energy mix. With the exception of geothermal power (andtidal power to a large extent), renewables depend directly on weatherconditions. Skeptics complain that the weather dependency of renewablesmakes them intermittent and—by implication—unreliable. It is true thatthe sources are intermittent, but that does not mean that they are unreliable.As we have noted, tidal power is intermittent, but it is highly predictable.Wind is less predictable at any particular site, but when aggregated forregions and seasons it is predictable, so the solution is to produce powerfrom a variety of sites which are either linked to the grid or can availthemselves of a storage device. To the degree to which renewable powerproducers are hostage to uncertainty, they should assess the relevance ofweather derivatives to their risk management strategy, especially as newproducts are developed for a greater variety of weather conditions andlocations.
A growing reliance on renewable energy puts us back into dependenceon the physical world. This is counter to the trend in the richer countriessince the beginning of the twentieth century, when increasing numbers ofpeople began to live in cities and became protected from the elements formost of the time. As power prices continue to rise and a greater varietyof sources of energy becomes available, people will have to take a closerinterest in the physical world in which they live.
WHAT CAN BE TRADED WHERE?
(AND WHAT CANNOT?)
Carbon finance is still in its infancy, lacking many characteristics of a maturemarket. For example, what can be traded on this market remains quite lim-ited in scope. Through the Linking Directive, the EU ETS availed itself of theflexible mechanisms designed for the Kyoto Protocol, such that CDM creditswould be eligible for use in the EU ETS Phase One (2005–2007), while bothCDM and JI credits would be eligible for Phase Two (2008–2012), runningconcurrently with the First Commitment Period of the Kyoto Protocol. Theframers of the EU ETS did however make two exceptions—they excludedhot air credits generated by the collapse of the post-communist economiesof Eastern Europe, and they excluded forestry-based carbon credits (forreforestation and afforestation). The principle reason for excluding themwas to prevent a flood of such credits driving down the price of carbon inthe ETS market and hence reducing the incentive to actually cut emissionsof greenhouse gases at the source—the 11,000 installations identified bythe various National Allocation Plans. This decision has, however, hadimportant consequences beyond the EU (Bettelheim 2006).

230 CARBON FINANCE
First, forestry projects are ideal for the CDM criteria—carbon seques-tration and sustainable benefits for local people (Bettelheim 2006). Suchprojects and their Kyoto credits are being bought by many carbon funds,but they cannot trade them, at present, into the EU ETS; they will haveto hold them until they can be counted toward Kyoto’s First CompliancePeriod when it begins in 2008. Demand from the EU would have been ahelpful boost for the CDM market. This exclusion has been particularlyunfortunate for Africa, which lags behind Asia and Latin America in thedevelopment of the CDM. The exclusion will also limit interaction betweenthe EU carbon market and Canada and New Zealand, which both intend touse carbon offsets to meet part of their Kyoto commitment.
Another barrier to trade with the EU and emerging carbon markets isthe nonsignatory status of Australia and the United States. We have seena vigorous growth of carbon trading regimes in both countries at the statelevel. However, the fact that their federal governments have withdrawnfrom the Kyoto Protocol means that carbon credits generated by the statemarkets may not be traded into the EU ETS. Meanwhile, Norway andSwitzerland, although not part of the EU, are both signatories to Kyoto,and they are designing national platforms that will be compatible with theEU ETS and therefore open to trade with it.
PRICE DISCOVERY
There have been many warnings to the effect that the development of acap-and-trade system for carbon would be detrimental to business interests,specifically that it would drive energy-intensive businesses out of the EU andwould have a very negative impact on the economy. This could still happenin some cases, aluminum being a widely touted example. However, the factthat the EU has embraced the challenge of living in a carbon-constrainedworld—before its industrial rivals—has already produced some gains. Forexample, the biofuel business is drawing in major American investors suchas Cargill (see Box 10.1). Others will follow as the drive toward renewableenergy and clean technology gathers momentum.
The symbol of this change is the visible price of carbon, quoted through-out the business day like many other commodities.1 This fact alone hasmoved the climate change challenge from the purview of green reportingand corporate sustainable development reports to the boardroom. Sincethe EU power producers passed along some of the cost of their freeemissions allowances, their major customers—the other large final emit-ters—have raised a protest (Sijm et al. 2005; World Bank and IETA 2006).Governments (such as the United Kingdom and Denmark) considered a ret-rospective tax on these windfall profits. Already the energy chain is reacting

Carbon Finance: Present Status and Future Prospects 231
to increased power costs following the placing of most of the burden ofemission reduction on the power producers. It is ironic that the burden wasplaced on them because they are less subject to international competitionthan the major power users (oil and gas, iron and steel, pulp and paper,etc.), and this same factor has made it possible for them to pass the cost onto their customers.
One reason why it might take a while to work out the secondary impactson the energy chain is that some parts of the various pricing mechanismsfor power are opaque, far from the transparency required for the maximumeffectiveness of the carbon market. There is some discernible competitionin the smaller-scale retail market at the household level, and there is somevisibility in the spot market, but most of the power in Europe is sold underlong-term bilateral contracts between producer and consumer.
The most startling proof of the need for greater transparency camewith the plunge of the ETS allowance price in the last week of April 2006,when the price fell from nearly ¤30 to ¤8 in 48 hours on revelations andrumors about the overallocation of allowances to industry in the Phase Oneof the scheme. It is to be hoped that the growing availability of verifiedand publicly available emission data at the installation level will protect themarket from similar shocks in the future.
THE EVOLUTION OF PRODUCTS
FOR CARBON FINANCE
There is a lingering hope in some quarters that we will find a technologicalsolution to the climate change quandary such that life in the West cancontinue pretty much as it is now. That solution might be clean coal, thehydrogen economy, carbon capture and storage, or maybe cheap, safe, low-waste, proliferation-proof nuclear power. It is this belief that lies behindthe Asia–Pacific Partnership on Clean Development and Climate, whichwas discussed in Chapter 6. This belief tends to downplay the alternativesidentified by Jim Hansen, as noted at the start of this chapter—existingtechnology for energy efficiency and renewable sources of energy. Belief intechnological salvation is usually accompanied by modest amounts of pubicfunding for research or a start-up subsidy for the new technology.
For some problems, this approach might be successful. The wonderfulstory of Harrison’s chronometer (told by David Sobel in Longitude) is agood example where the offer of a modest prize eventually produced thesolution. However, it was a highly targeted application, and it took thelifetime of one very dedicated person to solve the problem. Climate changeis too big, coming upon us too quickly, and promises consequences thatare too grave for us to risk this type of strategy. As Jim Hansen stated, we

232 CARBON FINANCE
need to stabilize emissions within a decade. Then we begin the long haul ofreducing emissions by 80 or 90 percent below 1990 levels.
Fortunately, in the past 15 years, we have seen plenty of evidence thatthere is an approach that is likely to produce results much faster than smallsums of government money and hoping that a genius will discover a solution.There are many examples of goods and services being provided efficientlyand equitably by the public sector. There is also plenty of evidence to suggestthat competition in the private sector is more likely to produce innovation,especially when that innovation is radical and is needed very soon. Whatwe have seen in the successful parts of the water privatization story andin the SO2 and NOx emission reduction markets is that we need a two-track approach—the government needs to regulate the requirement (suchas the cap) and to identify the general means for achieving the goal (suchas trading). We need full transparency as to how the caps are determined(which is not very clear in the EU ETS case), and how the trading takesplace—exchanges are better for this than OTC transactions. These are someof the elements needed for designing markets.
There has to be regulation (such as Kyoto and the EU ETS), whichcreates the need for new products (both technological and financial). Wemust hope these products will be developed in time and that they willensure that we reach our environmental objective. They will not appearspontaneously simply because the world has woken up to the climatechange challenge. They will not be found quickly enough through theencouragement of government research grants and small subsidies. They aremost likely to appear when mandated by regulation, within a market-basedframework.
Nowhere is the evidence of the potential contribution of market forcesclearer than in the world of venture capital, where ‘‘over the past sixyears, more than 1,100 investors have pumped over US $7.7 billion into‘cleantech’ companies in North America, making it the sixth largest ventureinvestment category’’ (Parker and O’Rourke 2006, p. 20). Whereas thisis a private-sector initiative, supportive regulation is essential, such asmandated renewable energy requirements, tax breaks for switching tocleaner forms of energy, and extraction taxes on fossil fuels. Some U.S.states (such as Pennsylvania and Massachusetts) have established their ownclean technology investment funds (Sterlicchi 2006).
LITIGATION OVER RESPONSIBILITY
FOR CLIMATE CHANGE
Who is responsible for the current climate change dilemma, and whowill be found responsible for its resolution? How will governments that

Carbon Finance: Present Status and Future Prospects 233
have undertaken a commitment to reduce greenhouse gases carry out theirobligation? Essentially, the answer to this question requires an examinationof the energy chain and a decision to exact GHG reductions from onesegment of this chain, augmented by complementary actions at other points.For the EU, the targets were the power producers, major industrial energyusers, and all entities that produced energy from facilities with more than20 megawatts of capacity. In the United Kingdom, the NAP placed most ofthis burden on the power producers. In Canada, it appears that the principaltarget is still the large final emitters, similar to the EU plan.
A very different approach—that touches much more closely on theresponsibility issue—is the allocation of personal carbon allowances toeach individual (Boardman et al. 2005). This approach would have thegreat virtue of placing responsibility where it ultimately lies—on rela-tively wealthy consumers; and it would let the individual’s choices filterback up the energy chain. It is an elegant idea, but it comes with twomajor operational problems—it would be hugely complicated to moni-tor, and it would be politically difficult for any government that tried toimplement it.
In the American context, other possibilities arise—namely, litigationby class action. In the American courts, class actions are more favorablyreceived than in other jurisdictions. Here, the issue is not so much a valuejudgment about ‘‘Who is responsible for climate change?’’ but rather, ‘‘Whocan be held to be responsible?’’ As was seen in the Superfund legislation, theAmerican courts are prepared to proceed on this basis. Action on climatechange has been anticipated for more than 10 years in the United States. Asin the asbestos and tobacco cases, the issues revolve around the question:‘‘What did the directors and officers of companies know about the risks, andwhen did they know?’’ Again, the large, stationary emitters are the obvioustargets for litigation. The question remained somewhat hypothetical until2005 when carbon was given a price under the EU ETS. Emitting GHGswas no longer an incidental activity; it was regulated by law and wouldaffect the bottom line of any company that traded in the EU.
On March 3, 2006, ‘‘Twelve U.S. states, three cities and a host ofenvironmental organizations appealed to the supreme court to requirethat the Environmental Protection Agency (EPA) regulate greenhouse gasemissions from road vehicles’’ (Point Carbon 2006f). This is one of severalcurrent initiatives in the United States to use the courts to force the federalgovernment to take action to respond to climate change. What is ironicis that it was the EPA (under another administration) that pioneered thetrading of credits for emissions reduction trading in SO2 and NOx.
On an international scale, now that climate change is recognized asalready affecting lives and livelihoods, it is assuming momentum as a human

234 CARBON FINANCE
rights issue. The Association of Small Island States and the Association ofCircumpolar People have already launched suits based on the denial of theirhuman rights.
IS CARBON FINANCE LIKELY TO HELP US AVERT
DANGEROUS LEVELS OF CLIMATE CHANGE?
Attempts to identify dangerous levels of climate change have been made sincethe early stages of the IPCC process. How could anyone define what was adangerous level? Most people closely involved in the IPCC process probablyfelt that continuing the present trajectory into an age of unquantifiableuncertainty was already dangerous.
One of the first effective communicators of the climate change risk wasJohn Firor, a widely respected meteorologist. He reported that the questionhe was most frequently asked on the public lecture circuit was not about thetechnical implications of climate change, but the more mundane inquiry:‘‘Do we have a problem?’’ (Firor 1990). The public and the politicians hopethat there are actual numbers that the scientists can identify as ‘‘Thus farand no further,’’ and that at that point society can head in a differentdirection.
Unfortunately, this is not the case. First, the science is not that simple.It is not linear. It involves multiple feedbacks that are not predictable ina linear, stop-go sense. Second, there is a huge amount of inertia in thebiospheric system. It has taken modern, fossil-fuel–based society nearly200 years to produce a definable man-made disturbance at the global (meansurface temperature) level. Saying ‘‘It’s time we tried a different path’’ atthis point is not going to cancel the momentum we have created. Althoughpoliticians keep asking the scientists to identify what would be a dangerouslevel of disturbance, this is simply an act of procrastination. The politicians(and their public/voters/taxpayers/consumers), are simply putting off adecision we should have taken 20 years ago.
In answer to the persistent question: ‘‘What is a dangerous level ofdisturbance?’’ the IPCC scientists selected 400 ppm of CO2e in the atmo-sphere. At a climate conference in Exeter (United Kingdom) in January2005 a paper was presented which argued that we had already surpassedthis critical level. So, it is probably too late for carbon finance to help usavoid the suspected dangerous threshold. There are many degrees of dangerand some climate change scenarios are less attractive than others. However,there is every reason to hope that carbon finance will play an important rolein minimizing the ultimate costs of climate change.

Carbon Finance: Present Status and Future Prospects 235
CARBON FINANCE WITHIN THE BROADER FIELD
OF ENVIRONMENTAL FINANCE
The modern age of environmental finance began with the U.S. Acid RainProgram. There have been many attempts to encourage responsible use ofresources through pricing, most notably for water in the past 15 years.Water permits are being traded in the United States and Australia, forexample. But it was the Acid Rain Program that first demonstrated thattradable permits for air pollution allowances could be used to reduce thepollution problem. Despite the important differences between the acid rainproblem and climate change problem, a similar approach has been adoptedand, as a result, the field of carbon finance is evolving rapidly.
Not all the necessary ingredients for success are in place. For a market tooperate effectively there should be no free riders’ who will benefit at no costto themselves. Ultimately, all carbon-emitting human activities—includingtransportation and households—need to be included in the incentive struc-ture, rather than just those parts of the system that are easiest to target. Theleaders of corporations, who have to determine how they are going to meettheir targets, need rules that operate over a reasonable timeline—in thiscase, not less than 30 years. Looking at a big question mark after 2012 isnot helpful. We also need operational transparency so that price discoveryis available to all the participants in the market, including producers andconsumers. If these conditions can be met, then they will provide our bestopportunity to meet Jim Hansen’s first target—the stabilization of carbondioxide emissions within a decade.
Much of the scope of this book has been focused on national, interna-tional, and corporate initiatives to develop carbon markets as an importantpart of a strategy to respond to climate change. However, a great deal ofwork has been done through local initiatives channeled through local gov-ernment. Just how much can be achieved is illustrated by Box 10.2, whichis drawn from a case study on the Borough of Woking (40,000 households),immediately southwest of London. The work began with a drive towardenergy efficiency and broadened out to achieve carbon dioxide emissionreductions and adaptation to climate change. Woking is now ‘‘recognized asthe most energy efficient local authority in the UK’’ (Takingstock.org 2003).
What is remarkable from the perspective of the issues examined in thisbook is that these goals were achieved without the benefit of carbon financeor even a facilitative senior level of government. On the contrary, the sizeof any off-grid operation is specifically limited by U.K. regulation. If thisrestriction were removed, the proponents in Woking argue that ‘‘locallyembedded generation could supply all of the country’s energy needs . . . with

236 CARBON FINANCE
BOX 10.2 ADAPTATION IS WORKING
IN WOKING
Woking Borough Council established 1990–1991 as a base year forits energy and environmental policies and set a target of reducingenergy consumption for the Council’s buildings and transportation by40 percent over 10 years. This target was achieved, and in 2002 theCouncil broadened the scope of its activities from Council operationsto the borough as a whole and shifting the metric from saving kilowatthours to reducing CO2 emissions and adapting to climate change.Their efforts were driven by a conviction that climate change wasalready happening, as they had observed ‘‘weather patterns havebecome more extreme with high winds, floods and high temperaturesaffecting Woking and many other parts of the UK, and there has beena blurring of seasonal changes in recent years.’’
The following is a summary of what they achieved over the10 years from 1991–1992 to 2001–2002.
Energy consumptionsavings
170,170,665 kWh 43.8% saving
Carbon dioxideemission savings
96,588 metric tons 71.5% saving
Nitrogen oxidesemission savings
319.1 metric tons 68% saving
Sulfur dioxideemission savings
976.6 metric tons 73.4% saving
Water consumptionsavings
340,011,000 liters 43.8% saving
Savings in energy andwater budgets
£4,889,501 34.3% saving
Source:Takingstock.org 2003.
The Council and people of Woking realized these goals by imple-menting ‘‘a series of sustainable energy projects, including the UK’s firstsmall-scale combined heat and power (CHP) and heat-fired absorp-tion cooling system, the first local authority private wire (direct supplyto householders) residential CHP and renewable energy systems, thelargest domestic integrated photovoltaic/CHP installations, the firstlocal sustainable community energy system, the first fuel cell CHPsystem, and the first public/private joint venture Energy ServicesCompany.’’

Carbon Finance: Present Status and Future Prospects 237
local sustainable and renewable energy’’ (Takingstock.org 2003). If theseachievements were ever monetized with carbon credits for the reductionsthat they have achieved, then the bottom line would be strengthened evenfurther. Clearly, much more could be done to bring together potentialparticipants in carbon markets.
CONCLUSION
The key concept underpinning the development of carbon finance is thenotion that markets can be designed to reduce greenhouse gas emissionsat the lowest possible cost for the system as a whole, whether the systembe defined as the 11,000 largest power producers and power users in theEU or the global economy. As Richard Sandor noted, when this proposalwas first launched at the Rio Earth Summit in 1992 it was greeted withskepticism on all sides (Sandor 2004). There are still skeptics—fortunately,they comprise a diminishing portion of public opinion as carbon marketsstruggle to emerge and prove that the theory can be put into practice,although perhaps not so elegantly as their supporters might have wished.
The emergence of markets for carbon has been supported by a growingunderstanding that climate change is a huge challenge that will affect every-one on earth, from the poorest to the richest. The strength of the emergingconsensus on this viewpoint is well illustrated by recent indications fromelements in the insurance industry, which previously appeared to be less wor-ried about climate change than the European reinsurers (especially MunichRe and Swiss Re) and insurance organizations such as the Association ofBritish Insurers who have been expressing their growing concern for wellover a decade. The catalysts responsible for the change in attitude were thehurricane seasons in the Gulf of Mexico for 2004 and 2005, culminating inhurricane Katrina—the largest insured loss from a natural disaster in thehistory of insurance industry.
In conclusion, we identify three conservative indicators of a fundamen-tal shift in the corporate attitude to climate change. They are conservative inthe sense that they come from players who have not been in the vanguard ofthe movement to identify climate change as a major global risk. First, in theUnited Kingdom, Lloyd’s has issued a report on catastrophe trends titled‘‘Climate Change—Adapt of Bust’’ in which it acknowledges the growingrisk posed by climate change and the fact that ‘‘the industry has not takenchanging catastrophe trends seriously enough’’ (Lloyd’s 2006). Second, inthe United States, A. M. Best—a rating company specializing in the insur-ance industry—produced a special report on ‘‘Thinking the Unthinkable:How ‘Mega-Cats’ May Bruise Insurers,’’ describing a loss scenario in which

238 CARBON FINANCE
a Category 4 hurricane makes landfall in Atlantic City, New Jersey, causingmore than US$100 billion in insured losses and threatening the solvencyof as many as 50 insurers (A. M. Best 2006). Finally, the CatastropheInsurance Working Group of the National Association of Insurance Com-missioners (NAIC) has called ‘‘on the US Congress to take action on anational catastrophe plan’’ (Aon 2006, p. 7). NAIC had scheduled its 2005annual meeting to take place in New Orleans at the very time that Katrinastruck. At a rescheduled meeting in San Francisco, it became apparent thatbusiness-as-usual had become a dangerous strategy, and that the Associa-tion’s dual mandate to protect the insured and the insurers was increasinglydifficult to fulfill in a world experiencing global warming.
These actions can be taken as conservative indicators that mainstreamworld opinion is coming to accept that climate change is a challenge thancan no longer be ignored or downplayed. The focus of this book hasbeen an attempt to determine the contribution that markets can maketoward achieving environmental goals—for carbon finance the specificgoal is climate change. Can the discipline and drive of the private sector,adequately chaperoned by government regulation, be entrusted with thistask? There is a lingering, perhaps pervasive, hope that this happy resultmight be achieved almost painlessly.
However, as recent experience in the EU ETS has shown, even in themost carefully crafted market, certain primordial elements of competitionmust remain—otherwise, it would not be a market. Furthermore, amongall the invisible hands in the market, not all remain selflessly disinterestedin their own fate as they compete to make a profit, return dividends to theirshareholders, serve their customers, and reward their managers, consultants,brokers, and accountants.
As environmental markets develop they become larger and more com-plex. More capital and more corporations become committed to establishingtheir place in the system. It would be surprising if all the new playersremained quite as dedicated to the green goals as the pioneers who inventedthese markets—many of whom worked for years for slim, or no, returns,hoping that these environmental markets would succeed in saving the planet,where regulation alone had failed. The EU ETS has provided us with theclearest indication, so far, of how the system might evolve.
The EU ETS has survived its first full annual cycle of operations, andthus should be judged a qualified success. Bloodied, but unbowed, it goesinto its second cycle in 2006; it will enter Phase Two in 2008; and itwill push the Kyoto process into the post-2012 world. We should not besurprised that member states of the EU have squabbled over their NAPs, orthat many member states had to contend with industrial sectors squabblingbetween themselves. Nor should we be surprised that enthusiastic pioneers

Carbon Finance: Present Status and Future Prospects 239
of the newly created carbon economy now find their idealistic creationtreated somewhat roughly by some of the new players. In environmentalmarkets—as in all markets—companies have to meet payroll, rent, taxes,and all the other costs of doing business.
In the theoretical world of perfect competition, corporate idiosyncrasiesare irrelevant because all the players have access to the same information,the same access to markets, access to capital, and so on. Outside thistheoretical world the situation is quite different. Richard Sandor stressed(as noted before) the importance of striving to meet the ideal of perfectcompetition in the design of new markets, as best we can, in order to reapthe benefits of a free market system. Specifically, he emphasized the valueof transparency in price discovery and the need to ensure that the marketremains liquid.
As the field of carbon finance evolves we can appreciate the salienceof such an agenda. At this point, the key lessons we can draw include thefollowing:
� Critical information must be freely available on a regular basis (perhapsquarterly, rather than annually for the EU ETS, for example).
� Competition must be ensured, even among those large scale, and geo-graphically constrained, operations such as power supply, water supply,and transportation.
� The public should have the relevant information available to them, sothat they can make an environmentally informed choice as to whatgoods and services they purchase.
Ultimately, carbon finance will help us find a way to meet the climatechange challenge only when all elements of the economy—consumers,producers, and regulators—have to factor GHGs into their bottom line.


Endnotes
CHAPTER 1 Introduction
1. Greenhouse gases include:Carbon dioxide (CO2)Methane (CH4)Nitrous oxide (N2O)Hydrofluorocarbons (HFCs)Perfluorocarbons (PFCs)Sulphur hexafluoride (SF6)Carbon dioxide accounts for the majority of GHG emissions, at about 77 percentof the worldwide total, but is the least potent in terms of contribution towardclimate change. The remainder comes mainly from methane (14 percent),nitrous oxide (8 percent), with a small share coming from fluorinated gases(1 percent). The impacts of these other GHG are, however, usually expressedin terms of carbon dioxide equivalents (CO2-e). The contributions of CH4
and N2O are significantly larger in developing countries, and in some casesare larger than their energy-related CO2 emissions (Baumert, Herzog, andPershing 2005).
2. C.D. Keeling at the Scripps Institute of Oceanography.3. Stabilization targets are sometimes also expressed in relation to atmospheric
concentrations of CO2 (e.g., 450, 550, and 650 ppm CO2-e) as well as totemperature changes.
4. Under the Kyoto Protocol, Annex 1 countries are defined as industrializedcountries and economies in transition listed in Annex 1 of the UNFCC. Theresponsibilities under the Convention include a nonbinding commitment toreduce their GHG emissions to 1990 levels by 2000. Annex ‘‘B’’ countries,on the other hand, are the 39 emissions-capped industrialized countries andeconomies in transition listed in Annex ‘‘B’’ of the Kyoto Protocol that havelegally binding emission reduction obligations. Although there are some differ-ences between the two lists of countries, in practice the terms are used inter-changeably.
5. Certain confusion exists regarding the time frames of the Kyoto ProtocolCompliance Period and the two phases of the EU ETS. The first phase of the EUETS is designed to gain experience with carbon trading, while the second phaseis intended to correspond with the Kyoto Protocol time frame. Their relativetiming is represented as:
241

242 CARBON FINANCE
2005–2007 2008–2012EU ETS EU ETS
Phase One Phase Two(CDM) (CDM, JI)
2008–2012 2012—First Compliance Kyoto ProtocolKyoto Protocol Post-First Compliance
Period Period
6. Conference of the Parties (COP) of UNFCCC and Meeting of the Parties (MOP)of the Kyoto Protocol.
7. Depending on the region and strength, tropical storms forming over trop-ical oceans are referred to variously as hurricanes (Atlantic and NortheastPacific), typhoons (Northwest Pacific), or cyclones (Indian Ocean and Australia)(Faust 2006).
8. RGGI is a joint effort that was established by nine states: Connecticut, Delaware,Maine, Massachusetts, New Hampshire, New York, Rhode Island, and Ver-mont. In late 2005, however, Massachusetts and Rhode Island withdrew fromthe program.
9. Carbon intensity is the ratio of CO2 emissions per unit of economic activityor output—a strong indicator of overall efficiency of a company’s operationswith respect to carbon emissions. At the national level, this indicator is shownas CO2 emissions per unit of gross domestic product (GDP).
CHAPTER 3 Regulated and Energy-Intensive Sectors
1. ACEA (Association des Constructeurs Europeens d’Automobiles) includesBMW, DaimlerChrysler, Fiat, Ford, GM, Porche, PSA Peugeot Citroen, Renault,and VW Group. The agreement commits the auto industry to reach an overallfleet average of 140 grams of CO2 per kilometer by 2008, with the possibilityof extending the agreement to 120 gCO2/km by 2012.
2. KAMA (Korea Automobile Manufacturers Association) includes Daewoo,Hyundai, Kia, and Sangyong.
3. JAMA (Japan Automobile Manufacturers Association) includes Daihatsu,Honda, Isuzu, Mazda, Mitsubishi, Nissan, Subaru, Suzuki, and Toyota.
4. KAMA and JAMA had more lenient terms for reaching intermediate targets,and have an extra year to achieve the final goal of 140gCO2/km.
5. CAFE is the Corporate Average Fuel Economy standard.6. The states that have adopted California’s standards for automobile carbon
dioxide and other GHG emissions are Connecticut, Maine, Massachusetts,New Jersey, New York, Rhode Island, and Vermont.
7. Well-to-wheels refers to the complete chain of fuel production and use, includingfeedstock production, transport to the refinery, conversion to the final fuel,transport to refueling stations, and final vehicle tailpipe emissions.

Endnotes 243
8. Radiative forcing refers to the processes that alter earth’s atmospheric energybalance. These alterations can be caused by a change in the earth’s orbit, byvolcanic activity, or by man-made emissions.
9. The Chicago Convention, which was established in 1947 by the InternationalCivil Aviation Organization (ICAO), exempts the aviation sector from tax onfuel, either via a duty or a value-added tax (VAT).
10. IATA is the International Air Transport Association.
CHAPTER 4 The Physical Impacts of Climate Change on the Evolutionof Carbon Finance
1. The International Council for Local Environmental Initiatives (ICLEI) has nowbeen renamed Local Governments for Sustainability.
CHAPTER 5 Institutional Investors and Climate Change
1. Total Value is a coalition of 165 international companies.2. New York State, New York City, Connecticut Pension Funds.3. In 2005, Boston Common Asset Management, Calvert Asset Management Com-
pany, Citizens Advisers, Domini Social Investments, Ethical Funds Company,Harrington Investments, and Walden Asset Management.
4. California, Connecticut, the district of Columbia, Iowa, Kentucky, Maine,Maryland, Massachusetts, New Mexico, New York State, North Carolina,Oregon, and Vermont.
CHAPTER 7 Climate Change and Environmental Security: Individuals,Communities, Nations
1. The U.S. Geological Survey estimates that one-quarter of all undiscovered oiland natural gas lies in the Arctic (Krauss et al. 2005).
2. Published in 1901, it was Rudyard Kipling’s novel Kim that gave universalcurrency to the phrase Great Game.
3. Natural climate oscillations are not driven by external influences such assolar irradiance or anthropogenic GHG emissions, but are, on the otherhand, enhanced or reduced as a result of changing ocean conditions, suchas temperature and salinity. The oscillations are defined in terms of their respec-tive time scales, for example, El-Nino/Southern-Oscillation (ENSO) events areinterdecadal; the North Atlantic Oscillation, quasi-decadal; and the AMO,multidecadal (Faust 2006).
4. The term thermohaline circulation is derived from ‘‘thermo’’ for heat, and‘‘haline’’ for salt (UNEP 2005b).
CHAPTER 9 Key Players in the Carbon Markets by Martin Whittaker
1. www.missionpoint.com.2. Author’s discussions with ETS brokers.

244 CARBON FINANCE
3. ABN AMRO Cargill Merrill LynchADM Investor Deutsche Bank Morgan StanleyBear Sterns Fimat Banque RefcoBHF Bank Fortis Clearing UBSBNP Paribas Goldman SachsCalyon Financial MAN Financial
4. Swiss Business Federation, Swiss Association of Small and Medium SizedEnterprises, Swiss Road Federation, Swiss Petroleum Association.
CHAPTER 10 Carbon Finance: Present Status and Future Prospects
1. See the daily price on the Point Carbon Web site atwww.pointcarbon.com/Home/News/All%20news/article12242-703.html.

Web Sites
CHAPTER 2
The Carbon Trust: www.thecarbontrust.co.ukGHG Protocol–WCBSD, WRI
www.bpalternativenergy.comhttp://cdm.unfccc.int/Projects/registered.html
CHAPTER 4
Carbon Disclosure Project 3: http://www.cdproject.net/Carbon Disclosure Project 3, company responses: www.cdproject.net/responses
cdp3.aspIntergovernmental Panel on Climate Change: www.ipcc.ch/Intergovernmental Panel on Climate Change, Chairman’s address to COP 12:
www.ipcc.ch/press/sp-07122005.htmPew Center on Global Climate Change: www.pewclimate.org/Thames Water Plc.: www.thames-water.com
CHAPTER 5
The Investment Fund Institute of Canada (IFIC): ific.ca/eng/home/index.aspStatistics Canada: www.statcan.ca
CHAPTER 6
AgCert: www.agcert.comCarbon offsets from Climate Care: http://climatecare.orgCCX: www.chicagoclimatex.com/Carbon offsets from the CCX: www.chicagoclimatex.com/environment/offsets/
index.htmlEcosecurities: www.ecosecurities.comEnvironmental Resources Trust: www.ert.netEUETS: http://europa.eu.int/comm/environment/climat/emission.htmGold Standard: www.cdmgoldstandard.orgKyoto, CDM: http://cdm.unfccc.int/Malta Web site for NAP EU ETS:http://europa.eu.int/comm/environment/climat/pdf/malta.pdf
245

246 CARBON FINANCE
Natsource: www.natsource.com/about/U.S. Senate Energy Committee: http://energy.senate.gov/publicWorld Bank Carbon Finance Unit: www.carbonfinance.org
CHAPTER 9
Goldman Sachs: www2.goldmansachs.com/our firm/our culture/corporatecitizenship/environmental policy framework/index.html
World Bank Carbon Finance Business: www.carbonfinance.org
CHAPTER 10
Cargill: www.cargill.comChicago Climate Exchange: www.chicagoclimatex.comEnvironmental Finance Online News: www.environmental-finance.com/
onlinenews/02marpoi.htmPoint Carbon: www.pointcarbon.com/Woking Borough Council: www.woking.gov.uk

References
Abbasi, D. 2006. Americans and Climate Change: Closing the Gap between Scienceand Action. Yale School of Forestry & Environmental Studies, available atwww.yale/edu/environment/publications.
ABI. 2005. Financial Risks on Climate Change. Association of British Insurers,Summary Report and Technical Annexes, www.abi.org.uk/climatechange.
ABN Amro. 2005. Response to Carbon Disclosure Project, www.cdproject.net.ACF. 2006. False Profits. Australian Conservation Foundation, available at
www.acf.org.au.ACIA. 2004. Impacts of a Warming Arctic. Arctic Climate Impact Assessment [Also
see S. Hassol], www.acia.uaf.edu.Allianz AG and WWF International. 2005. Climate Change & the Financial Sector:
An Agenda for Action. Gland: Allianz AG Munich and WWF International.A. M. Best. (2006) Thinking the unthinkable: How ‘‘mega-cats’’ may bruise insurers.
A. M. Best Special Report, May.Ameko, A. 2004. Managing weather risk to reduce earnings volatility. Environmen-
tal Finance 6(1):56–57.American Electric Power. 2004. www.aep.com/Environmental/performace/emiss-
ionsassessment/default.htm.An, F., and A. Sauer. 2004. Comparison of Passenger Vehicle Fuel Economy and
Greenhouse Gas Emission Standards around the World. Pew Center on GlobalClimate Change, www.pewclimate.org.
Anderson, J., T. Andreadis, C. Vossbrinck, S. Tirrell, E. Wakem, R. Frech, A.Garmendia, and H. Van Kruiningen. 2000. Isolation of West Nile virusfrom mosquitoes, crows and a Cooper’s hawk in Connecticut. Science286(5448):2331–2333, December 17.
Aon. 2004. Annual Global Climate and Catastrophe Report: 2004. Aon ReinsuranceServices.
Aon. 2005. Aon Risk Bulletin 94:14, November 10.Aon. 2006. NAIC calls for national catastrophe plan. Aon Risk Bulletin 108:7,
June 1.Austin, D., and A. Sauer. 2002. Changing Oil: Emerging Environmental Risks
and Shareholder Value in the Oil and Gas Industry, World Resources Insti-tute, www.wri.org.
Austin, D., N. Rosinski, A. Sauer, and C. le Duc. 2005. Changing Drivers, The Impactof Climate Change on Competitiveness and Value Creation in the AutomotiveIndustry. Washington, DC: World Resources Institute, www.wri.org.
Bakker, K. J. 2000. Privatising water, producing scarcity. The Yorkshire drought of1996. Economic Geography 76(1):4–27.
247

248 CARBON FINANCE
Balbus, J., and M. Wilson. 2000. Human Health and Global Climate Change: AReview of Potential Impacts in the United States. Pew Center on Global ClimateChange.
Ball, J. 2003. Insurers turn up Kyoto heat. Globe and Mail, May 7, p. B11.Barrett, J., and J. Mack. 2004 Paying for their Principles? Environmental Finance,
February, pp. 18–19.Barnett, J. 2001. Security and climate change. Tyndall Centre for Climate Change
Research working paper 5.Barnett, T. P., D. Pierce, K. AchutaRao, P. Glecker, B. Santer, J. Gregory, and W.
Washington. 2005. Penetration of human induced warming into the world’soceans. Science 309(5732):284–287.
Barta, P. 2006. Japan coiled to push abroad for new sources of oil, gas. Globe andMail, May 16, p. B12.
Baumert, K., T. Herzog, and J. Pershing. 2005. Navigating the Numbers: GreenhouseGas Data and International Climate Policy. World Resource Institute, availableat www.wri.org.
Beacom, C. 2006. Yukon’s Dawson City threading on thin ice. Globe and Mail,March 6, p. A8.
Bettelheim, E. 2005/2006. The case for forestry sequestration. EnvironmentalFinance 7(3):44–45.
Biello, D. 2004. Here come the hedge funds. Environmental Finance 5(8):16–17.Biello, D. 2005. Institutions up the ante. Environmental Finance 6(7):14–15.Bloom, R. 2003. Ethical funds change with the times. Globe and Mail, March 8,
p. C1.Bloomberg. 2004. Insurance industry storm losses hit $35 billion, Munich Re says.
www.bloomberg.com, December 30.Boardman, B., S. Darby, G. Killip, M. Hinnells, C. N. Jardine, J. Palmer, and G.
Sinden. 2005. 40% House. Oxford: Environmental Change Institute, Universityof Oxford.
Bodnar, P. 2006. Eligible to trade? Environmental Finance, May. Supplement:Global Carbon 2006, S51–S53.
Boyle, G., B. Everett, and J. Rammage (eds.). 2003. Energy Systems and Sustain-ability: Power for a Sustainable Future. Oxford: Oxford University Press inassociation with The Open University.
Boyle, G. (ed.). 2004. Renewable Energy: Power for a Sustainable Future, 2nd ed.Oxford: Oxford University Press in association with The Open University.
Bradley, R. 2005. As quoted in Talking It Through. Environmental Finance 7(2):S16.Brennan, J., and E. Johnson. 2004. No disclosure: The feeling is mutual. Wall Street
Journal, January 14.Broecker, W. 1997. Thermohaline circulation, the Achilles heel of our climate system:
Will man-made CO2 upset the current balance? Science 278:1582–1588.Brown, M., F. Southworth, and T. Stovall. 2005. Towards a Climate-Friendly Built
Environment. Pew Center on Global Climate Change, www.pewclimate.org.Brooks, C., and M. Barnett. 2006. Priming the pump. Environmental Finance
7(5):30–31.

References 249
Bryden, H. 2005. Slowing of the Atlantic meridional overturning circulation at25◦N. Nature 438(1):655–657.
Bulleid, R. 2004–2005. Cities reach for the skies. Environmental Finance 6:3,December–January; Supplement: Low-carbon leaders—profiting from emis-sions reductions, 14–15.
Bulleid, R. 2005a. Henderson looks to sustainable future. EnvironmentalFinance 6(8):5.
Bulleid, R. 2005b. Exchanges—coming to the market. Environmental Finance, May2005. Supplement: Global Carbon 2005, S24–S27.
Bulleid, R. 2006. Planting seeds on the forecourt. Environmental Finance7(4):19–20.
Bustillo, M. 2005. Canada OKs auto emissions pact. Los Angeles Times, March 24.Carbon Finance. 2005–2006. Allowances need to be e 60/t for coal-to-gas
switch—Citigroup. Carbon Finance 3(1):8, December–January.Carbon Finance. 2006a. 12 U.S. states ask Supreme Court to move EPA on GHGs.
Carbon Finance 3(3):8.Carbon Finance. 2006b. European Parliament proposes separate trading scheme for
aviation. Carbon Finance 3(6):7.Carbon-financeonline.com. 2006. EU member states flout NAP deadline. June e-mail
update.Carbon Trust. 2005a. Brand Value at Risk from Climate Change. London, www.
thecarbontrust.co.uk.Carbon Trust. 2005b. Investment Trends in UK Clean Technology. London, www.
thecarbontrust.co.uk.Carl, M. P. 2006. Climate change policy beyond 2012—moving into higher gear.
Presentation delivered at the EU EUROPIA Conference, London, February 16.Carleton, W., J. Nelson, and M. Weisbach. 1998. The influence of institutions on
corporate governance through private negotiations: Evidence from TIAA-CREF.Journal of Finance 53(4):1335–1362.
Cazanave, A., and R. Nerem. 2004. Present-day sea level change: Observations andcauses. Review of Geophysics 42 RG3001.
CCX. (2005. CCX Quarterly 2(2):2, Fall edition, available at www.chicagoclimateexchange.com.
CEC. 2005. Winning the Battle against Global Climate Change. Commission of theEuropean Communities, background paper.
CE Delft. 2005. Giving Wings to Emission Trading: Inclusion of Aviationunder the European Emission Trading Scheme (ETS): Design and Impacts,http://europa.eu.int/comm/environment/climat/aviation en.htm.
CEP. 2006. Reviewing the EU Emissions Trading Scheme (Part II): Priorities forShort-Term Implementation. Report of the Centre for European Policy StudiesTask Force. Available at http//shop.ceps.be.
Ceres. 2004. Southern Company, TXU agree to report to shareholders on prepared-ness for greenhouse gases limits; Reliant energy to expand 10 k disclosure ofissue. Boston, MA, press release, April 28.
Ceres. 2005a. Availability and Affordability of Insurance under Climate Change:A Growing Challenge for the U.S., June, www.ceres.org.

250 CARBON FINANCE
Ceres. 2005b. Framing Climate Risk in Portfolio Management, September,www.ceres.org.
Ceres. 2005c. U.S. companies face record number of global warming shareholderresolutions on wider range of business sectors. Boston MA, press release,February 17.
Ceres. 2005d. Institutional investors call on power sector to focus attention onfinancial risks from climate change. Press release, July 11.
Chalecki, E. 2002. Environmental security: A case study of climate change. PacificInstitute for Studies in Development, Environment, and Security, research paper7/23-2002, available at www.pacinst.org.
Charney, J. 1979. Carbon Dioxide and Climate. National Academy of Sciences.Church, J., N. White, R. Coleman, R. Lambeck, and J. Mitrovica. 2004. Estimates
of the regional distribution of sea level rise over the 1950–2000 period. Journalof Climate 17:2609–2625.
Citigroup. 2005. Utilities 2006: Earnings Outlook Remains Robust. www.citigroup.CF December 2005.
Claquin, T. 2004. Taking the chill out of frost. Environmental Finance 5(4):26.Cogan, D. 2004. Unexamined Risk: How Mutual Funds Vote on Global Warming
Shareholder Resolutions. December. Boston: CERES; Washington, DC: IRRC.Cogan, D. 2006. Unexamined Risk: How Mutual Funds Vote on Global Warming
Shareholder Resolutions. January. Boston: CERES; Washington, DC: IRRC.Cook, G., and P. Zakkour. (2005) The new face of King Coal?, Environmental
Finance 6(9):26–27, July–August.Cooper, G. 2005. IPPC industry back CO2 storage. Environmental Finance 7(1):5.Cooper, G. 2006. Not the magic ingredient. Environmental Finance 7(7):21.Crosariol, B. (2005) Watch what your client says, or else . . . Globe and Mail, August
31, p. B7.Curry, R., and C. Mauritzen. 2005. Dilution of the Northern North Atlantic Ocean
in recent decades. Science 308(5729):1772–1774.Danish, K. 2006. Outside the Oval Office. Environmental Finance, May, Supplement:
Global Carbon 2006, S36–S37.Davis, E. Philip. 2002. Institutional Investors, Corporate Governance and the Per-
formance of the Corporate Sector. Institutional Investors Corporate Governanceand Performance. London: Brunel University.
Davison, J., P. Freund, and A. Smith. 2001. Putting Carbon Back into theGround. EA Greenhouse Gas R&D Programme, www.co2net.com/public/about/putcback.pdf.
Defra. 2004. EU emissions trading scheme. UK National Allocation Plan2005–2007. Installations List, Department for Environment, Food and RuralAffairs, UK.
Defra. 2006. An Operator’s Guide to the EU Emissions Trading Scheme: the Stepsto Compliance. Available at www.defra.gov.uk/environment/climatechange/trading/eu/pdf/operatorsguide.pdf.
Del Guercio, D., and J. Hawkins. 1999. The motivation and impact of pension fundactivism. Journal of Financial Economics 52(1):293–340.

References 251
Dischel, R. S. 2002. Introduction to the weather market: From dawn to mid-morning,in Dischel, R. S. (ed.), Climate Risk and the Weather Market, London: RiskBooks.
Dodwell, C. 2005. EU emissions trading scheme: The government perspective.Presentation made at the Conference on Carbon Finance, London, October31–November 1.
Dohm, D., M. O’Guinn, and M. Turell. 2002. Effect of environmental temperatureon the ability of Culex pipens (Diptera: Culicidae) to transmit West Nile virus.Journal of Medical Entomology 39(1):221–225.
Dohm, D., and M. Turell. 2001. Effect of incubation at overwintering tempera-tures on the replication of West Nile virus in New York. Journal of MedicalEntomology 38(3): 462–464.
Domenici, P. V., and J. Bingaman. 2006. Design elements of a mandatorymarket-based greenhouse gas regulatory system. Available at http://energy.senate.gov/public.
Dornau, R. 2006. Verification: Compliance and strategic issues. Presentation deliv-ered at the conference on EU Emissions trading 2006, Brussels, July 10 and 11.
Dowell, G., S. Hart, and B. Yeung. 2000. Do corporate global environmental stan-dards create or destroy market value? Management Science 46(8):1059–1074.
DrKW. 2005. Emission Trading Update: What Can Cement Companies do? Dresd-ner Kleinwort Wasser, London.
DrKW. 2004. Emission Trading: Cement Falls at the First Bend. Dresdner KleinwortWasser, London.
Ebner, D. 2005. Warm winter cools drilling season. Globe and Mail, March 14,p. B8.
Ebner, D. 2006. Critics target Enbridge pipeline. Globe and Mail, April 20, p. B6.Eckhart, M. 2005. Renewables: Phase II. Environmental Finance 7(2):12.Economist. 2003. In search of those elusive returns. Economist, March 22–28,
pp. 65–66.Economist. 2004a. Driven by the oil price. Economist, August 28–September 3,
p. 54.Economist. 2004b. The future’s a gas. Economist, August 28–September 3,
pp. 53–54.Economist. 2005a. Stirrings in the corn field. Economist, May 14–20, pp. 71–73.Economist. 2005b. Feeling the heat Economist, May 14–20, p. 66.Economist. 2005c.General Motors: That sinking feeling. Economist, November
19–25, pp. 63–64.Economist. 2005d. Environmental economics: Are you being served? Economist,
April 23–29, pp. 76–78.Economist. 2005e. Climate change: Restricted circulation. Economist, December
3–9, pp. 46–48.Economist. 2006a. Energy policy: The pusher-in-chief. Economist, February 4–10,
p. 26.Economist. 2006b. Ethanol: Life after subsidies. Economist, February 11–17,
pp. 60–61.
252 CARBON FINANCE
Economist. 2006c. Steady as she goes: Why the world is not about to run out of oil.Economist, April 22–28, pp. 65–67.
Economist. 2006d. Arabian alchemy. Economist, June 3–9, p. 64.Economist. 2006e. A blast from the past. Economist, February 25–March 3, p. 82.Edwards, M. 1999. Security implications of a worst-case scenario of climate change
in the southwest Pacific. Australian Geographer 30(3):311–330.Ellisthorpe, D., and S. Putnam, 2000. Weather derivatives and their implications for
power markets. Journal of Risk Finance, Winter, pp. 19–28.Emmanuel, K. 2005. Increasing destructiveness of tropical cyclones over the past
30 years. Nature 436(7051):868–688, August 4.Enserink, M. 2002. West Nile’s surprisingly swift continental sweep. Science
397(5589), September 20, 1988–1989.Environmental Finance. 2004. Carbon trading—five years in review. Environmental
Finance, October 2004, p. 18.Environmental Finance Online. 2005 Deal emerges in Montreal on CDM. Available
at www.environmental-finance.com/onlinenews/08deccdm.htm.Environmental Finance. 2006a. Environmental Finance Online News, March
2, 2006. Available at www.environmental-finance.com/onlinenews/02marpoi.htm.
Environmental Finance. 2006b. Data file. Emissions. SO2 spot vintage daily prices.Environmental Finance 7(8):30.
Epstein, P. 2002. Climate change and infectious disease: stormy weather ahead?Epidemiology 13:4:373–375.
Epstein, M., and E. Mills (eds.). 2005. Climate Change Futures. Boston: HarvardMedical School.
Epstein, P., and C. Defilippo. 2001. West Nile virus and drought. Global Changeand Human Health 2(2):105–107.
Epstein, P., H. Diaz, S. Elias, G. Grabherr, N. Graham, W. Martens, E. Mosley-Thompson, and J. Susskind. 1998. Biological and physical signs of climatechange: Focus on mosquito-borne diseases. Bulletin of the American Meteoro-logical Society 78:409–417.
European Commission. 2004. http://europa.eu.int/comm/environment/climat/pdf/malta.pdf.
European Commission. 2005. Reducing the Climate Change Impact of Avia-tion. Report of Public Consultation March–May, http://europa.eu.int/comm/environment/climat/aviation en.htm.
European Union. 2005. EU Action against Climate Change: EU EmissionsTrading—an Open Scheme Promoting Global Innovation. Available athttp://europa.eu.int/comm/environment/climat/docs.htm.
Faust, E. 2006. Changing Hurricane Risk. Munich Re.Fawcett, T., A. Hurst, and B. Boardman. 2002. Carbon UK. Oxford: Environmental
Change Institute, University of Oxford.Firor, J. 1990. The Changing Atmosphere: a Global Challenge. New Haven, CT:
Yale University Press.Fitch Ratings. 2004. Global Power/North America Special Report, December 7,
2004.

References 253
Ford-Jones, E. L., et al. 2002. Human surveillance for West Nile infection in Ontarioin 2000, CMAJ (JAMC) 166(1):29–35.
FOE 2002. Survey of climate change disclosure in SEC filings of automobile,insurance, oil and gas, petrochemical and utilities companies. Friends of theEarth, www.foe.org.
Friedman, T. 2006. The first law of Petropolitics. Foreign Policy, May/June, pp.28–36.
Gillenwater, M. 2005. Verification System Design for a Regional GreenhouseGas Registry and a Regional Greenhouse Gas Initiative. Washington, DC:Environmental Resources Trust. Available at www.ert.net.
Girardet, H. 1992. The Gaia Atlas of Cities: New Directions for Sustainable UrbanLiving. New York: Anchor Books, published by Doubleday.
Goldman Sachs. 2006. www2.goldmansachs.com/our firm/our culture/corporatecitizenship/environmental policy framework/index.html.
Globe and Mail. 2006. California gives green light to solar-power subsidy. Globeand Mail. January 13, p. B8.
Gorina, N. 2006. Cooling down the hot air. Environmental Finance, May. Supple-ment: Global Carbon 2006, S47–S48.
Goulder, L. 2002. Mitigating the Adverse Impacts of CO2 Abatement Policieson Energy-Intensive Industries. Resources for the Future, discussion paper02–22, www.rff.org.
Greene, D., and A. Schafer. 2003. Reducing Greenhouse Gas Emissions from U.S.Transportation. Pew Center on Global Climate Change, www.pewclimate.org.
Grobbel, C., J. Maly, and M. Molitor. 2004. Preparing for a low-carbon future, TheMcKinsey Quarterly 4.
Griffin, M. 2006. States, feds come together on Australian climate plan. Environ-mental Finance 7(5):10.
Gross, R., P. Heptonstall, D. Anderson, T. Green, M. Leach, and J. Skea. 2006.The costs and impacts of intermittency: An assessment of the evidence of thecosts and impacts of intermittent generation on the British electricity network.A report of the Technology and Policy Assessment Function of the UK EnergyResearch Centre. London: Imperial College and The Carbon Trust.
Hakkinen, S., and P. Rhines. 2004. Decline of subpolar North Atlantic circulationduring the 1990s. Science 304(5670):555–559, April 23.
Hassol, S. 2004. Impacts of a Warming Arctic/Arctic Climate Impact Assessment(ACIA), Cambridge: Cambridge University Press, www.acia.uaf.edu.
Henderson Global Investors.2005a. The Carbon 100. www.trucost.com/henderson.html.
Henderson Global Investors. 2005b. How Green Is My Portfolio. www.henderson.com/sri.
Hertzfeld, H. R., R. A. Williamson, and A. Sen, 2004. Weather satellites and theeconomic value of forecasts: evidence from the electric power industry. ActaAstronautica 55:791–802.
Hess, U. 2003. Helping to seed weather markets. Environmental Finance 5(1):17.Houghton, R. A. 2003b. Revised estimates of the annual net flux of carbon to the
atmosphere from changes in land use and land management 1800–2000, Tellus55B:378–390.

254 CARBON FINANCE
IEA. 2004. Biofuels for Transport: An International Perspective. InternationalEnergy Agency.
IFIC. 2006. The Investment Fund Institute of Canada, ific.ca/eng/home/index.asp.IIGCC. 2003. Climate Change and Aviation: Flying into Stormy Weather.
www.iigcc.org.IIGCC. 2004. Climate Change and Construction Materials. www.iigcc.org.INCR 2005. INCR Call for Action, incr.com/05investorsummit/pdf/
INCR05 call for action.pdf.Innovest Strategic Value Advisors. 2002. Value at Risk: Climate Change and the
Future of Governance, Boston: Ceres, www.ceres.org.Innovest Strategic Value Advisors. 2003. Carbon Finance and Global Equity Mar-
kets. London: Carbon Disclosure Project, www.cdproject.net.Innovest Strategic Value Advisors. 2004. The U.S. Electric Utility Industry, New
York.Innovest. 2005. A Review of the Current Status of Integration of Environmental
Research in the Mainstream Financial Community in North America. Projectnumber K2138-3-0011, April 18.
IPCC. 2001a. Climate Change 2001: Synthesis Report. Summary for Policymakers.Available at www.ipcc.org.
IPCC. 2001. Third Assessment Report. Intergovernmental Panel on Climate ChangeUnited National Environment Programme and World Meteorological Organi-sation, Geneva.
IPCC. 2005a. Carbon Dioxide Capture and Storage: Summary for Policymakers andTechnical Summary. Intergovernmental Panel on Climate Change, CambridgeUniversity Press, www.ippc.ch.
IPCC. 2005b. Address of the Chairman of the Intergovernmental Panel on ClimateChange to the 11th Conference of the Parties to the United Nations FrameworkConvention on Climate Change, Montreal, December 7.
IPN. 2005. The Impacts of Climate Change: An Appraisal for the Future, London:International Policy Network.
Jewson, S., and Caballero, R. 2003a. Seasonality in the statistics of surface airtemperature and the pricing of weather derivatives. Meteorological Applications10(4):367–376.
Jewson, S., and Caballero, R. 2003b. The use of weather forecasts in the pricing ofweather derivatives. Meteorological Applications 10(4):377–389.
Joshi, S. K. 2006. Putting the building blocks in place. Environmental Finance, May.Supplement: Global Carbon 2006, S42–S43.
JP Morgan. 2006. JP Morgan European Corporate Research, January 11.Kanen, J. L. M. (forthcoming). Carbon Trading and Pricing: a Guide to the Factors
Influencing the Price of Emission Allowances in the EU. Environmental FinancePublications.
Keeling, C. D., and T. P. Whorf. 2001. Atmospheric CO2 records from sites inthe SIO air sampling network, in Trends: a Compendium of Data on GlobalChange. Oak Ridge, TN: Carbon Dioxide Information Analysis Center, OakRidge National Laboratory, U.S. Department of Energy.

References 255
Kerr, R. 2004. A bit of icy Antarctica is sliding towards the sea. Science305(5691):1897, September 24.
Kessels, J., and H. de Coninck. 2006. Going underground. Environmental Finance7(7):S40–S41.
Kiernan, M., and P. Dickenson. 2005. Carbon Disclosure Project 2005. InnovestStrategic Value Advisors, London.
Kiernan, M., and D. Morrow. 2005. The good news . . . and the bad. Con-fronting climate risk: Business, investment and the Carbon Disclosure Project.Environmental Finance, supplement, October.
Kohler, D. 2005. Insurance and carbon finance. Presentation delivered at the CarbonFinance Conference, London, October 31 and November 1.
Krauss, C. 2004. Canada reinforces its disputed claims in the Arctic. New YorkTimes, August 29.
Krauss, C., S. Myers, A. Revkin, and S. Romero. 2005. The Great Game in a coldclimate. International Herald Tribune, October 10, pp. 1, 8.
Kruse, C. 2004. Climate Change and Construction Materials. F&C Asset Manage-ment for IIGC, www.iigc.org.
Laidlaw, S. 2005. Tight supplies prompt talk of oil at $100 U.S. Toronto Star,September 2, pp. F1, 7.
Lambert, E. 2004. Spitzer strikes again, July 21, www.Forbes.com.Lancaster, R. 2005. Aviation set to join EU ETS before 2012. Environmental
Finance 7(1):5.Lancaster, R. 2006. Asia-Pacific pact will allow emissions to double-WWF. Envi-
ronmental Finance 7(4):6.Lancaster, R., and R. Pospisil. 2006. California plans for emissions cuts as RGGI
wobbles. Environmental Finance 7(3):7.Lanciotti, R., et al. 1999. Origins of the West Nile virus responsible for an outbreak
of encephalitis in the northeastern United States Science 286:2333–2337,December 17.
LeBlanc, A. 2006. AIG’s Strategy on Climate Change, presentation made at NewYork Hurricane Conference, July 19, 2006.
Lespinard, P. 2005. Sell side rises to challenge. Environmental Finance 6(9):32.Leyva, E., and P. Lekander. 2003. Climate change for Europe’s utilities. McKinsey
Quarterly 1, February, pp. 120–131.Liebreich, M., and B. Aydinoglu. 2005. A bright future—or a bust in the making?
Environmental Finance 6(5):viii–ix.Liese, E. 2006. Russia and Ukraine to the rescue? Environmental Finance, May.
Supplement: Global Carbon 2006, S44–S45.Lindgren, E., and R. Gustafson. 2001. Tick-borne encephalitis in Sweden and climate
change. Lancet 358:16–18, July 7.Ling, A., J. Waghorn, S. Forrest, and M. Lanstone. 2004. Global Energy: Introducing
the Goldman Sachs Energy Environmental and Social Index. London, GoldmanSachs Global Investment Research.
Lloyd’s. 2006. Climate change—adapt or bust. 360 Risk Project. Report #1:Catastrophe Trends. Available at www.lloyds.com.

256 CARBON FINANCE
MacAfee, M. 2006. Manitobans brace for Red River flooding. Globe and Mail,April 6, p. A9.
Madigan, N. 2004. Fighting West Nile in the land of 400,000 pools. New YorkTimes, August 30, p. A9.
Mansley, M., and A. Dlugolecki. 2001. Climate Change: A Risk Management Chal-lenge for Institutional Investors. London: University Superannuation Scheme.
Marcu, A. 2004, A wider world of carbon. Environmental Finance, April. Supple-ment: A Market in Carbon—Preparing for the EU Emissions Trading Scheme,pp. xxix–xxv.
Marcu, A. 2006. The business case. Environmental Finance, May. Supplement:Global Carbon 2006, S8–S9.
Martens, W., T. Jetten, and D. Focks. 1997. Sensitivity of malaria, schistosomiasisand dengue to global warming. Climate Change 35:145–156.
Mathias, A. 2003. Bankers see green. Environmental Finance, July–August, pp.15–16.
Mathias, A. 2003–2004. IFC under fire for BTC oil pipeline loan. EnvironmentalFinance, December–January 5.
McFarland, J. (2003). Accounting board dims stock options’ appeal. Globe andMail, March 26, p. B2.
McGuire, B. 2004. Climate Change 2004. Benfield Research Centre.McKenna, B. 2005. GM admits its large SUVs may be endangered species. Globe
and Mail, August 31, p. B8.Mercer Investment Consulting. 2005. A Climate for Change: A Trustee’s Guide to
Understanding and Addressing Climate Change, www.mercerIC.com.Merrill Lynch. 2005. Energy Security & Climate Change: Investing in the Clean Car
Revolution, US, Europe, Korea, China, and Japan. Global Securities Research& Economics Group.
Merrill Lynch. 2006. Merrill Lynch Commodities, Carbon Market Outlook Confer-ence Call, February 2006.
Mettler, P., F. Wellington, and G. Hartmen. 2005. Transparency Issues with theACEA Agreement: Are Investors Driving Blindly?, World Resources Insti-tute, www.wri.org.
Minerva, L. 2005. Presentation at Climate Change and Investment Conference,London, June 6–7.
Mittelstaedt, M. 2006. ‘‘No alarm bells’’ in Manitoba flooding. Globe and Mail,April 7, p. A7.
MMC Securities. 2005. The Growing Appetite for Catastrophic Risk: The Catas-trophe Bond Market at Year-End 2004. Available at www.guycarp.com/ por-tal/extranet/pdf/Cat%20Bond%20Update%20Final%20032805.pdf?vid=1.
Monks, R., and N. Minnow (eds.). 2001. Corporate Governance, 2nd ed. Cam-bridge: Blackwell Publishers.
Moreno, M. 2003. Weather derivatives hedging and swap illiquidity. EnvironmentalFinance 5(1):18–19.
Morgan, G., J. Apt, and L. Lave. 2005. The U.S. Electric Power Sector and ClimateChange Mitigation. Pew Center on Global Climate Change, Arlington, VA.
Morgan Stanley. 2005. Morgan Stanley Equity Research Europe, October 10.

References 257
Morris, M. 2006. A partnership for action. Environmental Finance 7(5):14.Munich Re. 2003. Perspectives: Today’s Ideas for Tomorrow’s World. Zurich:
Munich Re Group.Munich Re. 2004. Press release, December 28.Munich Re. 2005. Annual Review of Natural Catastrophes 2004. www.
munichre.com.Munich Re. 2006. Topics Geo Annual review: Natural Catastrophes 2005. Munich.Nasci, R., et al. 2001. West Nile virus in overwintering Culex mosquitoes, New
York City, 2000. Emerging Infectious Diseases 7(4):742–744.National Research Council. 2006. Safety and Security of Commercial Spent Nuclear
Fuel Storage. Washington, DC: The National Academies Press.Nesbitt, S. 1994. Long-term rewards from shareholder activism: a study of the
CalPERS effect. The Continental Bank Journal of Applied Corporate Finance6(2):75–80
Nicholls, M. 2002. Not trading but hedging. Environmental Finance 3(6):14–15.Nicholls, M. 2003. Gas utilities look to regulatory fixes. Environmental
Finance 4(8):19.Nicholls, M., 2004a. Growth at the margins. Environmental Finance 5(9):14.Nicholls, M., 2004b. Developing country weather markets set to flower. Environ-
mental Finance 5(9):5.Nicholls, M. 2004c. Weather markets mood brightens (comment). Environmental
Finance 5(5):2.Nicholls, M. 2004d. First weather contracts sold in Taiwan. Environmental
Finance 5(9):8.Nicholls, M., 2004e. Hedging hotting up? Environmental Finance 5(7):14–15.Nicholls, M., 2004f. Confounding the forecasts. Environmental Finance 6(1):22–23.Nicholls, M. 2004–2005. New reporting requirements unveiled in UK, Germany.
Environmental Finance 6(3):11, December–January.Nicholls, M. 2005a. Carbon volumes jump, but uncertainties persist. Environmental
Finance 6(8):7.Nicholls, M. 2005b. Guaranteed weather marketing novel investment fund. Envi-
ronmental Finance 7(2):5.Nicholls, M. 2005c. Pension funds back greater reach for CDP. Environmental
Finance 7:1, 6.Nicholls, M. 2005d. World Bank faces down carbon critics. Carbon Finance
2(1):14–15.Nicholls, M. 2006a. Analysts kept guessing on carbon prices. Environmental
Finance 6(8):12.Nicholls, M. 2006b. Montreal sees uptick in carbon market confidence. Environ-
mental Finance 7(3):6.Nicholls, M. 2006c. Make them pay. Environmental Finance 7(8):2.Nicholls, M. 2006d. Defying gravity? Carbon-financeonline.com. June e-mail
update.Nicholls, M. 2006e. Preface from Carbon Funds Directory 2006. Available in hard
copy and CD-ROM from www.environmental-finance.com.
258 CARBON FINANCE
Nicholls, M. 2006f. Carbon’s allure undimmed for investors. EnvironmentalFinance 7(7):6.
Nicholls, M., and R. Bulleid. 2005. Following the money. Environmental Finance6(7):S28–S33.
Nicholls, R., F. Hoozemans, and M. Marchand. 1999. Increasing flood risk andwetland losses due to global sea-level rise: Regional and global analyses. GlobalEnvironmental Change 9 (supplementary issue):69–87.
Nicol, K. 2005. This could be just the start. Globe and Mail, October 22, p. F2.Norris, P. 2005. LNG: Two sides of Passamaquoddy Bay. Bangor Daily News,
November 26.NRC. 2002. Abrupt Climate Change: Inevitable Surprises, Washington, DC:
National Research Council, National Academy Press.NSIDC. 2005. Sea-ice decline intensifies. (U.S.) National Snow and Ice Data Center,
press release, www.nsidc.com.Odinga, R. 2006. We can’t solve poverty until we stop climate change, The
Independent, May 16, p. 39.OECD. 1999. Institutional Investors: Statistical Yearbook. Organisation for Eco-
nomic Co-operation and Development.O’Hearne, B. 2004. Construction, come rain or shine. Environmental Finance
5(10):28–29.O’Hearne, B. 2005. Weather risk—the market’s onward march. Environmental
Finance 7(2):16.Palter, R. 2003. Private Equity Canada 2002: Outlook, Challenges, and Implications.
Toronto, McKinsey and Company.Pardo, A., V. Meneu, and E. Valor. 2002. Temperature and seasonality influences
on Spanish electricity load. Energy Economics 24:55–70.Parker, N., and A. O’Rourke. 2006. A new investment category emerges. Environ-
mental Finance 7(5):20–21.Pascual, M., X. Rodo, S. Ellner, R. Colwell, and J. Bouma. 2000. Cholera dynamics
and El Nino-southern oscillations, Science 289(5485):1766–1769.Peters, R., N. Shariff, and J. Whitmore. 2005. National inspirer, Alternatives
Journal 31(4):5.Pew Center on Global Climate Change. 2004. Taking Climate Change into Account
in U.S. Transportation. In Brief, number 6, available at www.pewclimate3.org.Pew Center on Global Climate Change 2005a. State and Local News. Available
from http://www.pewclimate.org/.Pew Center on Global Climate Change. 2005b. What’s being done in the States.
Press release, www.pewclimate.org.Pew Center on Global Climate Change. 2006. Agenda for Climate Action, available
at www.pewclimate3.org.Point Carbon. 2005. Online newsletter for November 1, 2005. Summary available
from www.pointcarbon.com.Point Carbon. 2006a. Carbon 2006 Annual Report.Point Carbon. 2006b. Carbon Market Europe. Online newsletter for August 11.Point Carbon. 2006c. Online newsletter for March 28.Point Carbon. 2006d. Online newsletter for March 20.

References 259
Point Carbon 2006e. Online newsletter for February 17.Point Carbon. 2006f. Available at www.pointcarbon.com/Home/News/All%20-
news/article14227-703.html.Pospisil, R. 2006. California plans 3,000MW solar programme. Environmental
Finance 7(4):5.Post, L. 2004. Power companies feel the heat: eight states and NYC sue power
companies over global warming. National Law Journal, August 2.PricewaterhouseCoopers. 2005. Under Pressure: Utilities Global Survey
2005, www.pwc.com.PricewaterhouseCoopers and Enerpresse. 2003. Climate Change and the Power
Industry. www.pwcglobal.com.PricewaterhouseCoopers and Enerpresse. 2002. Climate Change and the Power
Industry. www.pwcglobal.com.Pullan, R. 2005. Europe’s clean technology revolution. Environmental Finance
6(5):vi–vii.Repetto, R. 2003. Environmental management in the electric utility sector, Corporate
Environmental Strategy, January.Rescalvo, M. 2006. Making the numbers add up. Environmental Finance, May.
Supplement: Global Carbon 2006, S14–S15.Richardson, A., and D. Schoeman. 2004. Climate impact on plankton ecosystems in
the Northeast Atlantic. Science, 305(5690):1609–1612, September 10.Rignot, E., and R. Thomas. 2002. Mass balance of polar ice sheets. Science
297(5586):1502–1506.Rignot, E., and P. Kanagaratnam. 2006. Changes in the velocity structure of the
Greenland ice sheet. Science 311(5763):986–989.Ritch, J. (2006) An atomic future? Environmental Finance 7(7): 21.Roberts, J. 2002. Weather risk management in the alternative risk transfer market,
in R. S. Dischel (ed.), Climate Risk and the Weather Market, London: RiskBooks.
Rundell, S. 2006. UBS launches biofuel index. Environmental Finance 7(5):8.Sandor, R., 2004a. SO2 emissions allowances—anatomy of a mature market.
Environmental Finance 5(9):13.Sandor, R. 2004b. An economist’s progress. Environmental Finance, October,
12–14.Sandor, R. 2005. Beyond Kyoto: Some thoughts on the past, present and future.
Environmental Finance 6(10):12–13.Sauer, A., and F. Wellington. 2004. Taking the (High) Fuel Economy Road: What
Do the New Chinese Fuel Economy Standards Mean for Foreign Automakers?,Washington, DC: World Resources Institute, www.wri.org.
Saunders, D. 2006. Europe awakes to dependence on Russian gas. Globe and Mail,January 9, p. B7.
Saunderson, E. 2001. Stream flow deals quicken. Environmental Finance3(1):15–16.
Saunderson, E. 2004a. Looking beyond the energy sector. Environmental Finance5(5):14–15.
Saunderson, E. 2004b. Wind farmers turn to hedges. Environmental Finance 5(6):13.

260 CARBON FINANCE
Saunderson, E. 2004c. Exchanges eye emissions, weather contracts. EnvironmentalFinance 5(5):5.
Sijm, J. P. M., S. J. A. Bakker, Y. Chen, H. W. Harmsen, and W. Lise. 2005.CO2 price dynamics: The implications of EU emissions trading for the priceof electricity. Energy Research Centre of the Netherlands (ECN). Available atwww.ecn.nl/docs/library/report/2005/c05081.pdf.
Silver, N., and A. Dlugolecki. 2006. The day before tomorrow. EnvironmentalFinance 7(4):28–29.
Smith, M. 1996. Shareholder activism by institutional investors: Evidence fromCalPERS. Journal of Finance 51(1):227–252.
Snow, R., C. Guerra, A. Noor, H. Myint, and S. Hay. 2005. The global distributionof clinical episodes of Plasmodium falciparum malaria. Nature 434:214–217.
Sohn, J. 2004. NGO spotlight shifts to private sector. Environmental Finance,February, pp. 20–21.
Stanwick, S., and P. Stanwick. 2000. The relationship between environmentaldisclosure and financial performance: An empirical study of U.S. firms. Eco-Management and Auditing 7:155–164.
Statistics Canada. 2006. www.statcan.ca.Sterlicchi, J. 2006. Investors look to the states. Environmental Finance 7(5):22–23.Stern, N. 2006. The Stern Review: The Economics of Climate Change,
www.sternreview.org.uk.Stewart, S. 2005. Insurers take a category 5 hit in the pocket book. Globe and Mail,
October 27, pp. B1, 26.Stripple J. 2002. ‘‘Climate Change as a Scarcity Issue’’ (Chapter 5) in Page, E., and
M Redclift (eds.) Security and the Environment: International Comparisons,Cheltenham: Edward Elgar.
Stromberg, L., M. von Gyllenpalm, and S. Gortz. 2005. Emission-free power.Environmental Finance 7(2):S47–S48.
Sustainability. 2005. Risk and Opportunity: Best Practice in Non-Financial Report-ing, www.sustainability.com/risk-opportunity.
Sweeney, G. 2006. Intermittency is no barrier to development. Presentation made atthe launch of the UKERC Intermittency Report, UK Energy Research Centre,London, April 5.
Swiss Re. 1996. Rethinking Risk Financing. Zurich: Swiss Re.Swiss Re. 2001. Capital Market Innovation in the Insurance Industry. Zurich: Swiss
Re.Swiss Re. 2003. The Picture of ART. Zurich: Swiss Re.Swiss Re. 2005. Natural and Man-Made Catastrophes 2004. Zurich: Swiss Re.Swiss Re. 2006a. Natural Catastrophes and Man-made Disasters 2005, Swiss Re,
Sigma No. 2.Swiss Re. 2006b. Insurance-linked securities market update, March. Available at
http://www.swissre.com.Takingstock. 2003. www.takingstock.org/Downloads/Case Study2-Woking.pdf.Thomas, R., E. Rignot, G. Casassa, P. Kanagaratnam, C. Acuna, T. Akins, et al.
2005. Accelerated sea-level rise from West Antarctica. Science 306(5694):255–258.

References 261
Thomas, S. 2005–2006. Looking beyond the OFR. Environmental Finance 7(3):22,December–January.
Transport for London. 2005. Annual Report 2004/05. Available at www.tfl.gov.uk/tfl/pdfdocs/annrep-04-05.pdf.
Trucost. 2004. Emissions Trading and European Aviation. London, www.trucost.com.
UBS. 2003. European Emissions Trading Scheme: Bonanza or Bust? www.unepfi.org.
UKCIP. 2003. Climate Adaptation: Risk, Uncertainty and Decision-making, May.UNEP. 2005b. Geo Year Book 2004/5: An Overview of Our Changing Climate.
United Nations Environment Programme, www.unep.org/geo/yearbook.UNEPFI. 2002. CEO Briefing: Key Findings of the UNEP’s Finance Initiatives
Study, www.UNEPFI.org.UNEPFI. 2005a. A Legal Framework for the Integration of Environmental,
Social and Governance Issues into Institutional Investment. Available atwww.UNEPFI.org.
Union of Concerned Scientists. 2005. Renewable Energy Tax Credit Saved OnceAgain, but Boom-Bust Cycle in Wind Industry Continues. Union of ConcernedScientist, www.ucsusa.org.
United States Senate. 2006. Letter to the President, June 29, 2006.University of East Anglia. Climatic Research Unit Information Sheets, www.
cru.uea.ac.uk/cru/info/warming.U.S. Climate Change Science Program. 2006. Temperature Trends in the Lower
Atmosphere: Steps for Understanding and Reconciling Differences. U.S ClimateChange Science Program, Synthesis and Assessment Product 1.1, available atwww.climatescience.gov.
Vallely, P. 2006. Africa will suffer most from climate change. The Independent, May16, p. 4.
WBCSD. 1998. Industry, Fresh Water and Sustainable Development. World BusinessCouncil on Sustainable Development, April.
WBCSD. 2005. The Cement Sustainability Progress Report, World Business Councilfor Sustainable Development. Geneva, www.wbcsd.org.
WCBSD and WRI. 2004. The Greenhouse Gas Protocol. A Corporate Account-ing and Reporting Standard. Revised edition. Available at http://www.ghgprotocol.org/DocRoot/DVrpAGhiJbdwkONJSrse/Brochure.pdf.
Weather Risk Management Association (WRMA). 2005. Results of 2005 PwCSurvey, November 9, www.wrma.org.
Webster, P. J., G. Holland, J. Curry, and H-R Chang. 2005. Changes in tropicalcyclone number, duration and intensity in a warming environment. Science 309(5742):1844–1846.
Weiss, M., J. Heywood, E. Drake, A. Shaferand, and F. Au Yeung. 2000. On theRoad in 2020: A Lifecycle Analysis of New Automobile Technologies. MITEnergy Laboratory Report #MIT EL 00–003 Cambridge, MA. October.
Wellington, F., and A. Sauer. 2005. Framing Climate Risk in Portfolio Management.Ceres and World Resources Institute.

262 CARBON FINANCE
White, R. R. 2001. Catastrophe options: An experiment in the management ofcatastrophic risk in the United States. Journal of Environmental Management62(3):323–326, July.
WHO. 2003. Climate Change and Human Health: Risks and Responses, Geneva,World Health Organization.
Wilgoren, J. 1999. New York City mosquito control is weak and late, experts say.New York Times, September 8.
Williams, E., and M. Kittel. 2004, Accession countries—Eastern promise. Environ-mental Finance, April. Supplement: A Market in Carbon—Preparing for theEU Emissions Trading Scheme, pp. xxviii–xxix.
Willis, M., M. Wilder, and P. Curnow. 2006. Powering renewables with carbon.Environmental Finance 7(6):26–27.
Wilson, M. L. 2001. Ecology and infectious disease, in Aron, J. L. and J.A. Patz(eds.), Ecosystem Change and Public Health: A Global Perspective. Baltimore:John Hopkins University Press, pp. 283–324.
Woking Borough Council. 2003. www.woking.gov.uk.Woodruff, R., C. Guest, M. Garner, N. Becker, J. Lindesay, T. Carvan, and K.
Ebi. 2002. Predicting Ross River virus epidemics from regional weather data.Epidemiology 13(4):384–393.
World Bank. 2006. Carbon Finance at the World Bank. Frequently Asked Questions:What Is Carbon Finance? Available at www.carbonfinance.org.
World Bank. Carbon Finance Business, available at www.carbonfinance.org.World Bank and IETA. 2006. State and Trends of the Carbon Market 2006. Paper
presented at the 2006 Carbon Expo, Cologne.WRI and Merrill Lynch. 2005. Energy Security and Climate Change: Investing in
the Clean Car Revolution, www.wri.org.Wrighton, J. 2005. Knight aims lance at Suez. Wall Street Journal Europe, May 5,
p. M1.Yergin, D. 2006. Ensuring energy security, Foreign Affairs, March/April. Also
available at www.cera.com.York, G. 2006. Blowout in Bangladesh: One company’s hard lessons of doing
business in a poor land. Globe and Mail, April 1, pp. B1, B4–5.Zaman, P., and C. Brown. (2005) Ensuring that you buy clean air and not hot air
under CDM Emission Reduction Project Agreements. Presentation delivered atthe Carbon Finance Conference, London, October 31 and November 1.
Zapfel, P. 2006. EU ETS Review—evolution of the scheme beyond 2012. Presenta-tion delivered at the conference on EU Emissions trading 2006, Brussels, July10 and 11.
Zeng, L., 2000. Weather derivatives and weather insurance: concept, applica-tion and analysis. Journal of the American Meteorological Society 81(9):2075–2082, September.

Index
ABN Amro, 125, 134, 210, 213, 243accounting (for climate change), 129–30,
221Acid Rain Program (U.S.), 10, 35, 139–40,
235adaptation (to climate change), 15–16,
19–21AgCert, 209, 214, 245agriculture, 13, 29, 92–4, 195–6AIG, 217–9Algeria, 64American Electric Power, 54, 121–2A. M. Best, 237–8Angola, 65Annex 1 countries (Kyoto Protocol) 10, 218
defined, 241Antarctica, 179–181Aon Ltd., 218Argentina, 164Arizona, 225Arrhenius, Svante, 3, 27Assigned Amount Units, 10Association of British Insurers, 13Australia, 10, 53, 69, 72, 74–6, 94–5, 98,
113, 126, 150–3, 162–3, 178–9, 226,230
Austria, 77, 144, 158, 212, 216automotive industry, 17, 58, 72–80, 85, 97.
See also BMW; Daimler/Chrysler; Ford;General Motors; Honda; Toyota
aviation, 14, 58, 80–2, 85, 98. See also BA
BA, 81Bangladesh, 19, 164banking. See financial services sectorBank of Montreal, 124Ballard Fuels, 51–2Belgium, 210–11Bequerel, Edmund, 46Berlin, 101biofuels. See energybiomass. See energyBMW, 86Bolivia, 66, 70Boxes:
AEP’s Response to Shareholder Activism,121
Benefit from Trading Emission ReductionCredits, 142
Carbon Audit of Henderson’s Global CareIncome Fund, 119
Carbon Capture and Storage (CCS) PilotProject by Vattenfall, 61
Climate Change and Financial Reporting–an Accounting Perspective, by AlanWillis and Julie Desjardins, 129–30
The Concept and Use of Biofuels, 78The Difficulty of Putting a Price on
Carbon, 18–19Gas-to-Liquid Technologies and Strategic
Diesel Fuel, 69HSBC: The World’s First Carbon Neutral
Bank, 126London, U.K.: Traffic Congestion Charge,
99Swiss Re Provides Insurance for CDM, 23Trading Through Joint Implementation,
155Trading Through the Clean Development
Mechanism, 153William Tharp: Invited Author’s Comment
on the Carbon Project FinancingContinuum, 115–16
Winnipeg, Manitoba’s Flood AdaptationMeasures, 20
BP, 43, 54, 105, 114, 127, 151Brazil, 28, 49, 71, 78–9, 156, 164,
173Browne, Lord John, 38, 127built environment, 100–04Bush, President George W., 38
California:Air Resources Board (CARB), 69bird deaths from wind turbines, 45carbon capture and storage, 64electricity blackouts, 33–4, 57, 196emission standards, 74–6, 80geothermal energy, 50greenhouse gas caps, 163lawsuits and automakers, 74
263

264 INDEX
California: (continued)pension funds, 119–120, 127, 133solar initiative, 16, 152
Camco, 211, 214Canada, 20, 38, 41, 47, 57–8, 64, 67–8,
71–2, 74–6, 94–5, 100, 106, 112–3,117, 124, 129, 143, 150, 161, 175, 177,179–81, 206, 212, 230
Canadian Imperial Bank of Commerce, 124Canadian Institute of Chartered
Accountants, 129cap-and-trade mechanism, 10, 15, 17, 35,
206, 226Carbon Disclosure Project, 37, 90, 93–4,
105–6, 131–33, 221, 245Carbon Trust (The), 13–14, 54, 245carbon:
carbon brokers, 157, 215–6. See alsoAgCert; Camco; CO2.com;EcoEnergy; EcoSecurities; EvolutionMarkets; Natsource; TradingEmissions Plc.
carbon capture and storage, 33, 60–65carbon dioxide, 1, 3–4, 13, 28, 57
emissions factors, 37carbon exchanges, 3, 157–8, 207, 216–8carbon finance (definition of), 1–3carbon funds, 17, 22, 156, 211–2,
218–220. See also Climate Exchangecarbon information systems, 220–1carbon intensity, 13, 36–7, 59, 97, 118–9
defined, 242carbon management (defined), 12–13carbon offset markets, 164–5. See also
Chicago Climate Exchange; ClimateCare
carbon, personal allowances, 32, 233carbon policies, 32–4, 57–8carbon price, 15, 18–19, 22, 60, 64,
83–4, 137, 148–50, 161, 207–8,210, 226–7, 231, 39, 243
carbon profile, 15, 72, 118carbon sequestration, 52–3carbon tax, 1, 15, 58, 130
Cargill, 94, 226, 243, 246catastrophe bonds, 165, 187, 198–203, 227
triggers, 199–200cement industry, 58, 82–5Certified Emission Reduction credits (CERs),
11, 23, 153–4Chevron/Texaco, 67, 114, 125Chicago Board of Trade, 198Chicago Climate Exchange, 18, 100, 121,
143, 148, 157, 164–5, 227–8, 245Chicago Mercantile Exchange, 190, 194,
196, 228
China, 28, 36, 41, 47, 49, 58, 67–8, 73, 75,86, 92, 134, 143, 151, 153, 156, 164,214
Cinergy Corporation, 121Citadel Investment Group, 211Clean Development Mechanism (CDM),
10–11, 18, 22–3, 36, 60, 64, 141–2,148, 150, 153–6, 163, 166–7, 185–6,207–8, 212, 215, 217, 245
CDM bottleneck, 162‘‘cleantech’’ (clean technology), 22, 117–8,
232Climate Care, 164climate change, 1, 3–25, 125, 170
and national sovereignty, 181–5Climate Change Levy (U.K.) 15Climate Exchange Plc., 209climate policies, 15–21, 32–4coal. See energyCO2.com, 97, 215Coca-Cola, 124combined heat and power (CHP), 62, 63,
238compliance and enforcement (EU ETS), 161ConocoPhillips, 114Connecticut, 70, 113corporate environmental reporting, 113–4credit rating agencies, 217. See also A. M.
Best; Fitch; Moody’s; Standard & Poor
Daimler-Chrysler, 51Defra (U.K. Department for the
Environment, Food and Rural Affairs),19, 137, 145
Denmark, 181, 212, 230Dexia Capital, 213dispute resolution (for carbon finance) 166Dominican Republic, 172Duke Power, 127
EcoEnergy, 209, 214EcoSecurities, 116, 214, 245Ecuador, 66–7El Nino/Southern Oscillation (ENSO), 7,
183–5, 243emissions trading, 137–67Enbridge, 67energy:
biofuels, 29, 48, 58, 77–80, 187, 226. Seealso Cargill
biomass (modern), 29, 48–50, 60–1coal, 13, 29, 36–7. See also American
Electric Power; Duke Energy;Vattenfall
energy chain, 25–57energy transition, 27–8

Index 265
geothermal, 29, 50hydroelectric power (HEP), 7, 27, 29,
41–2, 103–4, 148–9, 187natural gas, 13, 29, 33, 38, 43–4, 68–70,
85. See also Enbridgenuclear power, 24, 28–9, 33, 39–41, 62,
104oil, 33, 37–8, 58, 65–8, 71, 85oil sands, 38, 67–8. See also BP;
Chevron/Texaco; ConnocoPhilips;ExxonMobil; Shell
renewable energy, 16, 29, 42–50, 55, 69,229
security, 70–1solar energy, 29, 46, 62tidal and wave energy, 29, 47–8wind energy, 29, 44–6, 62, 93
Energy Production Tax Credit (U.K.), 16Enhanced Analytics Initiative, 135environmental security, 169–86Equator Principles, 106, 124, 133–4equity research, 213–5Estonia, 95, 144European Climate Exchange, 216European Federation of Energy Traders, 207European Union/Europe, 2, 14, 17, 32–5,
38, 49, 58–60, 64, 72, 74, 77, 79–81,83–7, 89, 113, 117–18, 144, 174, 188,194, 201–2, 206, 218, 233, 238–9
European Union Emissions Trading Scheme,2, 10, 17–19, 22, 24, 32, 43, 54, 64,81–2, 85, 88, 97, 128, 132, 137,143–50, 163, 166–7, 185–6, 205–7,226–8, 238–9, 245
New Entrant Reserve, 143Evolution Markets, 215, 220Excel Energy, 121Exxon Mobil, 38, 114, 120, 125
fiduciary responsibility, 106, 116–23, 136financial services sector, 21–3, 105–8
banking, 22, 105–6, 108, 209. See alsoABN Amro; Bank of Montreal;Canadian Imperial Bank ofCommerce; Fortis; HSBC; TorontoDominion Bank; UBS investment, 22,106, 108. See also Goldman Sachs;MissionPoint Capital; Quantum LeapCo.
institutional investors, 21, 111–36speculative investors, 211–13
insurance, 13, 22, 89–90, 106–8, 217–8.See also Association of BritishInsurers; AIG; Aon; Lloyds; Marsh &McLennan; Munich Re, Swiss Re
and emissions trading, 165–6
and weather derivatives, 190mutual funds, 122–3
Finland, 39, 48, 144, 212Firor, John, 234fisheries, 13, 96Fitch, 217Ford Motor Co., 78, 120forestry, 13, 44, 94–6, 159, 185, 229Fortis, 211Fourier, Joseph, 3, 27France, 47, 74, 77, 95, 106, 144, 150, 158,
174–5, 194, 219fuel cells, 51–2, 62. See also Ballard Fuels
General Agreement on Accounting Principles(GAAP), 190
General Electric, 127General Motors, 120geothermal. See energyGermany, 33, 61, 113, 126, 144, 150, 158,
178, 193, 208, 210, 212,219
Girardet, Herbert, 35Global Reporting Initiative (GRI), 124global warming and the greenhouse effect,
3–4, 7–9, 122–5Goldman Sachs, 67, 125, 215, 246Greece, 17, 37greenhouse gases, 1, 2, 9–11, 13, 15, 21, 24,
27–30, 35, 54, 76, 88, 92–6, 108–9,114,
120, 239accidental discharges, 53defined, 241Greenhouse Gas Protocol, 31
green housekeeping, 105Greenland, 179–83Grove, William, 51Gulf Stream, 181–3
Haiti, 172Hansen, Jim, 225, 231–2, 235health (and climate change), 13, 21, 169–86heat waves, 7, 14, 104, 174–5hedge funds, 3, 116, 196, 199, 211, 213, 223Henderson Global Investors, 118–9Honda, 80, 86Honduras, 42, 164‘‘hot air’’ 160–1HSBC, 126, 164Hungary, 50, 144hurricanes, 13–14, 19, 90, 98, 104–5,
171–3, 241–2Hurricane Andrew, 19, 172, 188, 198Hurricane Katrina, 14, 66, 105, 107, 172,
201, 203, 237–8

266 INDEX
hydroelectric power. See energyhydrogen economy, 51–2, 62
Iceland, 50Intergovernmental Panel on Climate Change
(IPCC), 5–8, 28, 35, 52, 64, 88, 234Initial Public Offering (IPO), 54, 117India, 28, 42, 49, 92, 126, 151, 153, 156,
164Indonesia, 28, 50, 53, 92Innovest Strategic Value Advisors, 136Institutional Investors Group on Climate
Change (IIGCC), 131,133
insurance. See financial services sectorintegrated gasification combined cycle
(IGCC), 60–1, 62, 122International Council for Local
Environmental Initiatives (ICLEI), 98,100, 242
International Emissions Trading Association(IETA), 207
International Finance Corporation, 134International Swaps and Derivatives
Association (ISDA), 207International Transaction Log (Kyoto
Protocol), 23, 141investment. See financial services sectorInvestor Network on Climate Risk (INCR),
135Iran, 40Iraq, 53Ireland, 150, 210Israel, 177Italy, 50, 144, 150, 212
Japan, 41, 58–60, 67, 72, 74–6, 97, 107,143, 150–2, 192–4, 201–2, 206, 212,219, 227
Joint Implementation (JI), 10–11, 18, 141,148, 154–6, 207–8, 212, 215, 227, 229
Kazakhstan, 66, 164Keeling, C. D., 4, 241Kyoto Protocol, 2, 5–6, 17, 23–4, 28, 34,
37, 43, 47, 54, 60, 64, 81, 87, 98, 120,132–3, 138–42, 141, 143, 161, 166–7,205, 226, 229–30, 245. See Annex 1countries
Latvia, 95, 144Leadership in Energy and Environmental
Design (LEED), 100–103Leicester, U.K., 101Linking Directive (EU ETS), 142, 207–8,
229
Lloyds of London, 237London, 46, 91, 99–100London Interbank Offered Rate (LIBOR),
200London: proposed desalination plant, 91London Stock Exchange: Alternative
Investment Market, 209London Traffic Congestion Charge, 99Los Angeles, 49Lyme Disease, 178
Madagascar, 164Maine, 16malaria, 14, 175–7Maldives, 183Malta National Allocation Plan, 142,
144–6, 227, 245management’s discussion and analysis
(MD&A), 106, 112, 129–30marginal abatement cost (MAC), 137, 142market transformation, 32Marsh & McLennan, 218Meeting of the Parties (Montreal MOP), 5,
10, 44, 95, 156, 162, 167Melbourne, 98Mexico, 50, 98, 164, 196Minneapolis, 101, 226Minnesota, 77, 178, 226MissionPoint Capital Partners, 213mitigation (of climate change), 15–19, 187Moody’s, 217Munich Re, 107, 114, 126, 237municipalities (and climate change), 98–9,
151–2mutual funds. See financial services sector
National Allocation Plans (EU ETS), 18–19,37
National Association of InsuranceCommissioners (U.S.), 203, 238
Natsource, 97, 207, 211–12, 215,220
natural gas. See energyNebraska, 93Netherlands, 133, 153, 155, 158, 166, 210,
212–3Newcombe, Ken, 157New Jersey, 16New York (State), 163New York City, 14, 177–8, 227New Zealand, 50, 126, 150 155, 184, 230Nigeria, 38, 53, 65–7non-governmental organizations (NGOs),
134North Korea, 40Norway, 64, 83, 145, 158, 181, 230

Index 267
nuclear power. See energy
Ohio, 70Organisation for Economic Cooperation and
Development (OECD), 19, 112, 142,163
Organisation of Petroleum ExportingCountries (OPEC), 49–50
oil and gas industry, 65–71, 104–5
PepsiCo, 124Philippines, 50platforms (for trading carbon), 150–1, 162,
216polar regions (and climate change), 179–81Point Carbon, 208, 221, 246Portugal, 17, 53, 144power industry, 57–65, 85–7, 103–4
and weather derivatives, 189–91project finance, 115–6
Qatar, 68Quantum Leap Company, 116
real estate, 7, 13, 106Regional Greenhouse Gas Initiative (U.S.),
152, 163, 206, 242renewable energy. See energyrenewable portfolio standards, 16, 70Revelle, Roger, 4risk, 11–15:
basis,business, 14climate risk, 85, 111, 169–86competitive, 15, 84–7corporate climate risk, 11–12, 24counterparty, 90, 217legal, 14, 65, 221, 232–4physical (from climate change), 89–109performance risk (for CDM projects), 165regulatory, 11, 111reputational, 14risk transfer, 187–203
RNK Capital, 23, 116, 211Romania, 177Ross River virus, 178–9Russia, 10, 18, 33, 38–9, 47, 53, 66, 86,
143, 156, 160, 177, 181, 214, 227RWE, 84–5, 90–1
San Diego, 98, 102Sandor, Richard, 138, 198, 237, 239Sarbanes-Oxley Act (U.S., 2000), 106,
112–3Saudi Arabia, 38Scotland, 39, 54, 64
shareholders resolutions (on climate change),120–5
shareholder value, 111Shell, 38, 64, 114, 134, 151Slovenia, 77, 144socially responsible investment (SRI), 118solar energy. See energySouth Africa, 68, 116South Korea, 58, 72, 75, 151, 164Spain, 17, 78, 158, 212Standard Bank Group, 116Standard & Poor’s, 217Stark Investment Management, 211Stern, Sir Nicholas, 6, 8Suess, Hans, 4Sweden, 48, 61, 78, 95, 144, 175, 178Swiss Re, 23, 114, 118, 126, 190, 237Switzerland, 145, 212, 219, 230
technology transfer, 11. See also CDM.Tesco, 226Texas, 16, 44, 93Thames Water Plc., 91Tharp, William, 115–16tidal and wave energy. See energyToronto, 102, 158, 177Toronto Dominion Bank, 124tourism, 13, 35, 97–8Toyota, 80, 86Trading Emissions Plc., 209transportation, 35, 58, 71–82, 97Trucost Plc., 114, 119Tudor Investment Capital, 211Tuvalu, 183–4
UBS, 84–5, 215Uganda, 164, 177U.K. Climate Impact Programme, 19U.K. historic greenhouses gas emissions, 151U.K. National Allocation Plan, 146–8U.K. Operating and Financial Review (OFR),
113U.K. Pension Disclosure Regulation (2000),
113Ukraine, 18, 33, 39–40, 156, 160United Kingdom, 15, 19, 39, 41, 44, 46–7,
49–50, 53–4, 64, 69, 80, 85, 87, 91,95, 112–3, 143–4, 146–8, 150,208–10, 213, 226, 230, 235–7. See alsoLondon, Leicester, Scotland, Wales.
United Nations Environmental Programme(UNEP), 5, 128
United Nations Framework Convention onClimate Change (UNFCC), 5, 8–10, 15,140, 167

268 INDEX
United States, 6, 9–10, 14, 16, 35, 38–40,50, 57–60, 67–8, 70–4, 77,79, 84–7,94, 98–101, 106–7, 112–3, 116–8,121, 123–5, 129, 135, 139–40, 143,150–2, 158, 162–4, 172–3, 180–1,189–90, 193–4, 201–3, 206, 208, 213,225–6, 230, 233, 237–8, 246
United States Environmental ProtectionAgency (USEPA), 14
United States Energy Production Tax Credit,16, 70
United States National Academy of Sciences,4
United States National Research Council,40
Universities Superannuation Scheme (U.K.),131
UPS, 97
value chain, 12, 17, 27–8, 30Vattenfall, 61vector-borne diseases, 7, 13, 175–9Venezuela, 38venture capital, 3, 53–5, 115verification (of emission reductions), 159Vertis, 214
Wales, 45water supply and treatment industry, 13,
35–6, 54, 90–2, 245. See also RWE;Thames Water Plc.
water for cooling power stations, 104,174–5
weather derivatives, 88, 108, 165, 187–98,201–2, 227–8
Weather Risk Management Association(WRMA), 193–5
West Nile virus, 177–8wind energy. See energywindstorms, 7, 13–14, 95, 104, 170, 227Winnipeg, Canada, 20Woking, U.K., 102, 235–7, 246World Bank, 19, 41–2, 93, 133, 156–7,
195–6, 207, 212, 218–20, 246Prototype Carbon Fund, 17, 157, 211–12,
219World Business Council for Sustainable
Development (WBCSD), 82World Meteorological Organisation
(WMO), 5World Resources Institute, 86
Yorkshire drought, 91