Embed Size (px)
Citation preview

Chapter 7
Carbon Dioxide Uptake in Plants: A Computer-Aided Experimental System
Christopher J. Paradise and Richard J. Cyr
Biology Department The Pennsylvania State University
University Park, Pennsylvania 16802 CJP: [email protected], RJC: [email protected]
Chris received his B.S. from Albany State (1986), has a Master’s degree from Binghamton University (1989), and has been the Introductory Biology Lab Coordinator at Penn State from 1990 to 1994. He is interested in the use of investigative labs in introductory-level biology. Currently, he is pursuing a Ph.D. in ecology and is interested in the effects of abiotic and biotic factors on community structure and composition.
Richard has an A.B. from the University of California, Berkeley, an M.S. from California State University, San Francisco, and a Ph.D. from the University of California, Irvine (1986). He is currently an Assistant Professor of Biology at Penn State and has taught Introductory Biology for 4 years. He is interested in ways which critical thinking and writing skills can be introduced to freshman students in the format of a large lecture course. His research interests are in the area of plant cell and developmental biology.
© 1995 Christopher J. Paradise and Richard J. Cyr 99
Reprinted from: Paradise, C. J. and R. J. Cyr 1995. Carbon Dioxide Uptake in Plants: A Computer-Aided Experimental System. Pages 99–114, in Tested studies for laboratory teaching, Volume 16 (C. A. Goldman, Editor). Proceedings of the 16th Workshop/Conference of the Association for Biology Laboratory Education (ABLE), 273 pages. Although the laboratory exercises in ABLE proceedings volumes have been tested and due consideration has been given to safety, individuals performing these exercises must assume all responsibility for risk. The Association for Biology Laboratory Education (ABLE) disclaims any liability with regards to safety in connection with the use of the exercises in its proceedings volumes.
100 Photosynthetic Pigments
Contents Introduction....................................................................................................................100 Student Outline ..............................................................................................................101 Notes for the Instructor ..................................................................................................107 Acknowledgements........................................................................................................110 Appendix A: Preparatory Notes and Materials..............................................................111 Appendix B: Data Acquisition and Graphics Software .................................................113 Appendix C: Equipment: Costs and Suppliers ..............................................................114
Introduction
The main objective of our introductory biology sequence is to get students to think critically. To that end, we utilize the investigative approach in the laboratory. Students learn to design their own experiments and learn biology in the context of major processes and concepts. Modern technologies are used as a means to achieve these goals and as a way to expose students to the uses of technology in biology. Computers can easily capture dynamic processes graphically, and additionally, can be used to collect large amounts of data for analysis.
One laboratory exercise that we’ve developed allows students to examine how plants (sunflower seedlings) take up CO2 over a short time period in a sealed chamber under various light regimes. Carbon dioxide concentration is measured in parts per million (ppm) with a gas analyzer. The analyzer is connected to a computer with an A/D board; software allows CO2 uptake to be graphed on the computer as changes in the atmospheric concentration of the chamber. The setup is sensitive and allows students to quickly perform multiple experiments.
Students are introduced to the techniques and equipment in the first week of this 2-week lab. Our laboratory sections are 2 hours long, which is partly why this lab takes 2 weeks. Teaching Assistants demonstrate the methods which will be used and the students are given the task of designing an experiment to investigate some aspect of photosynthesis before the second week. The investigative approach works well in this lab because students have experience with the methods and equipment before they design their experiment and the Teaching Assistants can provide the necessary background information which students need to ask appropriate questions about the system. For data analysis, students can print graphs as they go, or store data on disk to be analyzed later on a spreadsheet program. A simple comparison of the slopes will give an indication of the rate of carbon dioxide change in each experiment, although more complex analyses can be performed. By changing the light intensity and using different color filters students can examine the rates of carbon dioxide uptake under various experimental conditions.
This laboratory is part of an introductory course, but modifications would allow it to be used in upper level courses. A comparison of shade tolerant and intolerant plants, or C3, C4, and CAM plants could be performed, for example, as well as studies of area-specific CO2 uptake and energy flow analyses.
Although the initial cost of the equipment may be high, the equipment is useful for many other labs. In fact, we use the gas analyzers and data acquisition software for a yeast respiration lab and the gas analyzers alone in an exercise physiology lab. Any type of recording equipment which has an electrical output can be connected to the A/D boards to collect data on the computer, including spectrophotometers, dissolved oxygen meters, pH meters, etc. The computers and associated hardware/software are quite versatile.
In our lab on photosynthesis and respiration in plants students also investigate starch accumulation in seedlings under varying light intensities, and dissolved oxygen changes in aquatic plants under varying light quantity and quality. Because we have only two CO2 setups/lab it is
Photosynthetic Pigments 101 important for the students to have alternative exercises to work on while other groups are using the CO2 uptake apparatus.
The starch accumulation experiment uses radish or Fastplant (Brassica rapa) seedlings grown for 1 week under different light treatments. Students use a standard technique of clearing pigments with hot ethanol and then use an iodine solution to stain the starch. Seedlings are examined under dissecting microscopes to qualitatively compare the amount of starch present in different treatments. The measurement of dissolved oxygen in aquatic plants is used much the same as the CO2 uptake studies. The dissolved oxygen meter is connected to the computer and aquatic plants (e.g., Chlorella sp.) are exposed to varying light intensities and qualities. Lower wattage flood lights are used in place of high pressure sodium lamps, since the aquatic plants are much more sensitive to temperature fluctuations.
It is appropriate to link together aspects of the three experiments and wrap it all up with material from the lecture at the end of the lab. For instance, one could discuss carbon dioxide uptake and production of oxygen under varying light intensities and make predictions for starch accumulation and subsequent growth of plants. By examining multiple aspects of the photosynthetic process, students are better able to integrate the information into an overall picture which includes cellular mechanisms, physiology, and ecology. The other two exercises are not included here, but the entire lab exercise as it appears in our in-house lab manual is available upon request from either author. Student Outline
Photosynthesis and Respiration in Plants Introduction
Energy from the sun travels through space in the form of photons. The vast majority of life on earth depends directly, or indirectly, on this energy for existence. We (and other organisms on the planet) perceive this energy as either heat, light, or a combination of the two. When light is absorbed by a substance, the energy contained in the photons is transferred to the absorbing substance. In our everyday experience this is best experienced by walking barefoot on a street during the summer. The photons radiating down upon the street are absorbed by the pavement and the energy is converted to heat.
Photonic energy can be converted not only into heat, but also into chemical energy. Indeed, many organisms capture photonic energy and convert it into usable chemical energy. This form of energy conversion provides the power for virtually all life on earth. Organisms which are capable of converting light to chemical energy are most often called plants (although many organisms besides plants have this capability as well). The process of transducing light into chemical energy is called photosynthesis.
Plants and other photosynthetic organisms convert carbon dioxide into energy rich organic molecules which are the precursors of carbohydrates. These molecules are either used by the organism directly, or are passed into the food chain to be utilized by non-photosynthetic organisms. In other words, when we eat vegetables, we utilize the energy rich products of photosynthesis; and when we eat meat, we eat energy rich molecules synthesized in our prey from the products of photosynthesis.
The complete photosynthetic process may be summarized by the following equation: nCO2 + nH2O → (CH2O)n + nO2 (Equation 1) There are many steps involved in the complete process, although it is convenient to divide the process into two fundamental reactions: the light reactions (which require light) and the dark

102 Photosynthetic Pigments reactions (light independent). In the following discussion it is important to remember these reactions are normally coupled in the plant and can only be separated experimentally.
In the first phase of photosynthesis, light energy is used to split water, resulting in the generation of hydrogen and reducing power in the form of electrons (e−). Furthermore, ATP is generated. The light-requiring equations are: H2O → 2H+ + 2e− + (1/2)O2 (Equation 2a) NADP+ + 2H+ + 2e− → NADPH + H+ (Equation 2b) ADP + P1 → ATP (Equation 2c)
In the light-independent phase of photosynthesis, carbon dioxide is fixed, that is, converted from a gas to a non-volatile carbohydrate using the energy-rich molecules NADPH2 (equation 2b) and ATP (equation 2c): CO2 + ATP + NADPH2 → (CH2O)n + ADP + P1 + NADP+ (Equation 3)
Net photosynthesis is the difference between gross photosynthesis (all the energy captured from the sun by the plant) and the energy metabolized by the plant for its growth and maintenance (remember that plants also respire!). Net photosynthesis must be positive for the plant to survive, grow and reproduce. In this lab, we will examine some factors which influence net photosynthesis.
Note in equation 1 that CO2 is consumed in photosynthesis, the carbon is then immobilized or fixed into a higher molecular weight compound, and the oxygen is released. Theoretically, then, we can measure photosynthesis by examining the rate of CO2 uptake by the plant, the accumulation of carbohydrates, and the evolution of oxygen.
Week 1
Objectives 1. Learn to measure CO2 in a plant environmental chamber. 2. Gain experience in analyzing data recorded by a computer. 3. Learn how to manipulate and estimate both light quantity and quality.
Materials Sunflower seedlings (Helianthus annuus) Gas analyzer Dark cloth Gas environmental chamber High pressure Na+ lamps Light meter Red, green and blue acetate sheets Sunglasses (bring your own) IBM-compatible computers with A/D boards and data acquisition software
Photosynthetic Pigments 103 Procedures
Operation of the CO2 Analyzer
Turn the power on and wait for the display to stabilize and the machine to warm up. With the vent line to the atmosphere (to collect ambient levels of gases) turn the pump on; a whirring noise indicates normal pump activity. Use the “zero” knob to adjust the CO2 display to “32”. This is equal to 320 ppm, the approximate level of carbon dioxide in the atmosphere. The machine is calibrated and ready for analysis. See specific instructions for the analyzer you are using.
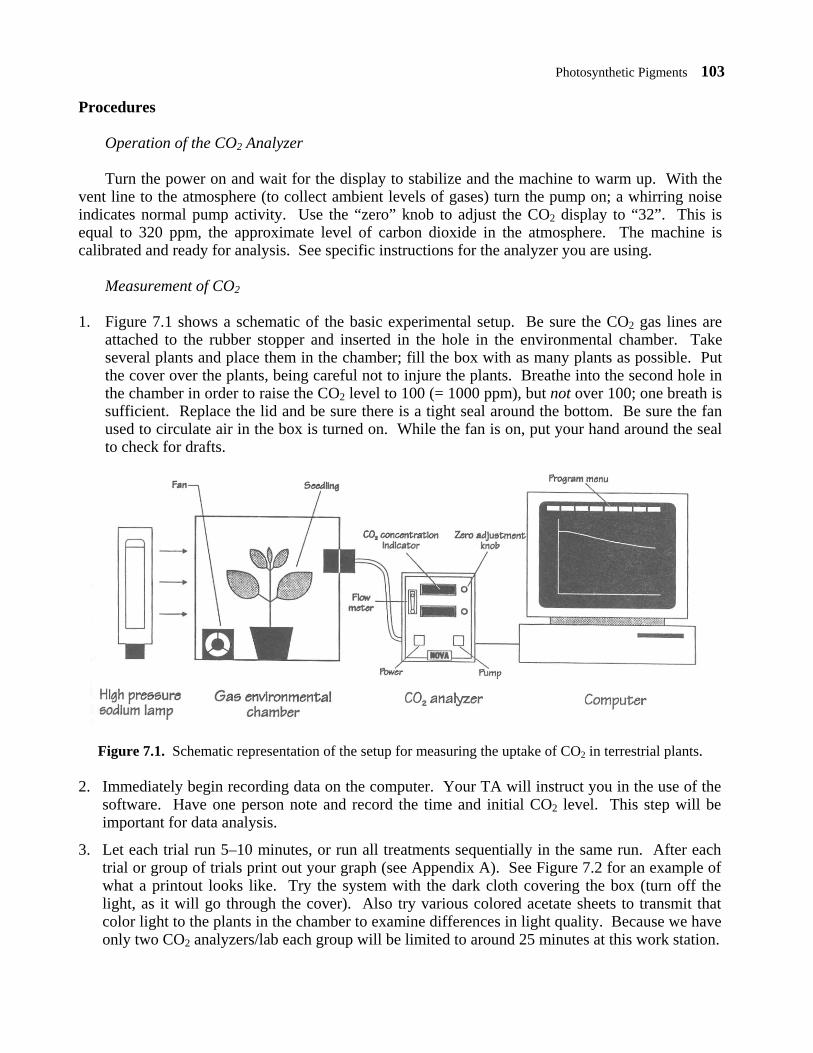
Measurement of CO2 1. Figure 7.1 shows a schematic of the basic experimental setup. Be sure the CO2 gas lines are
attached to the rubber stopper and inserted in the hole in the environmental chamber. Take several plants and place them in the chamber; fill the box with as many plants as possible. Put the cover over the plants, being careful not to injure the plants. Breathe into the second hole in the chamber in order to raise the CO2 level to 100 (= 1000 ppm), but not over 100; one breath is sufficient. Replace the lid and be sure there is a tight seal around the bottom. Be sure the fan used to circulate air in the box is turned on. While the fan is on, put your hand around the seal to check for drafts.
Figure 7.1. Schematic representation of the setup for measuring the uptake of CO2 in terrestrial plants.
2. Immediately begin recording data on the computer. Your TA will instruct you in the use of the software. Have one person note and record the time and initial CO2 level. This step will be important for data analysis.
3. Let each trial run 5–10 minutes, or run all treatments sequentially in the same run. After each trial or group of trials print out your graph (see Appendix A). See Figure 7.2 for an example of what a printout looks like. Try the system with the dark cloth covering the box (turn off the light, as it will go through the cover). Also try various colored acetate sheets to transmit that color light to the plants in the chamber to examine differences in light quality. Because we have only two CO2 analyzers/lab each group will be limited to around 25 minutes at this work station.
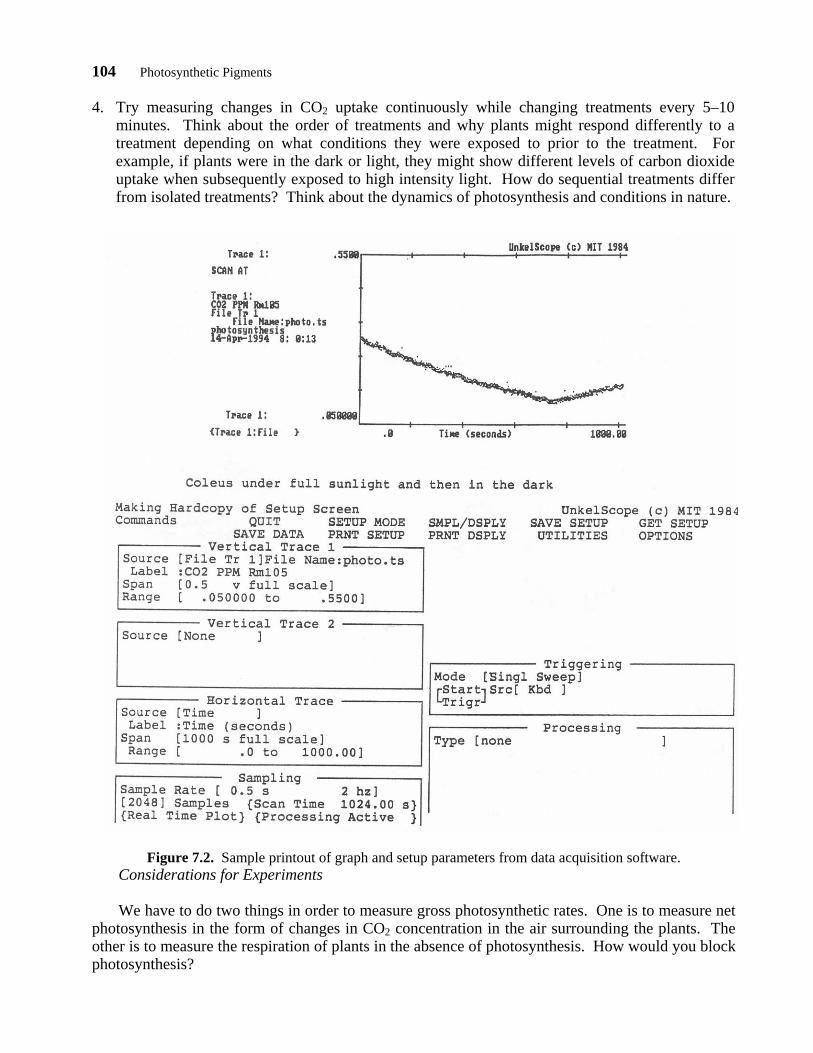
104 Photosynthetic Pigments 4. Try measuring changes in CO2 uptake continuously while changing treatments every 5–10
minutes. Think about the order of treatments and why plants might respond differently to a treatment depending on what conditions they were exposed to prior to the treatment. For example, if plants were in the dark or light, they might show different levels of carbon dioxide uptake when subsequently exposed to high intensity light. How do sequential treatments differ from isolated treatments? Think about the dynamics of photosynthesis and conditions in nature.
Figure 7.2. Sample printout of graph and setup parameters from data acquisition software.
Considerations for Experiments
We have to do two things in order to measure gross photosynthetic rates. One is to measure net photosynthesis in the form of changes in CO2 concentration in the air surrounding the plants. The other is to measure the respiration of plants in the absence of photosynthesis. How would you block photosynthesis?
Photosynthetic Pigments 105
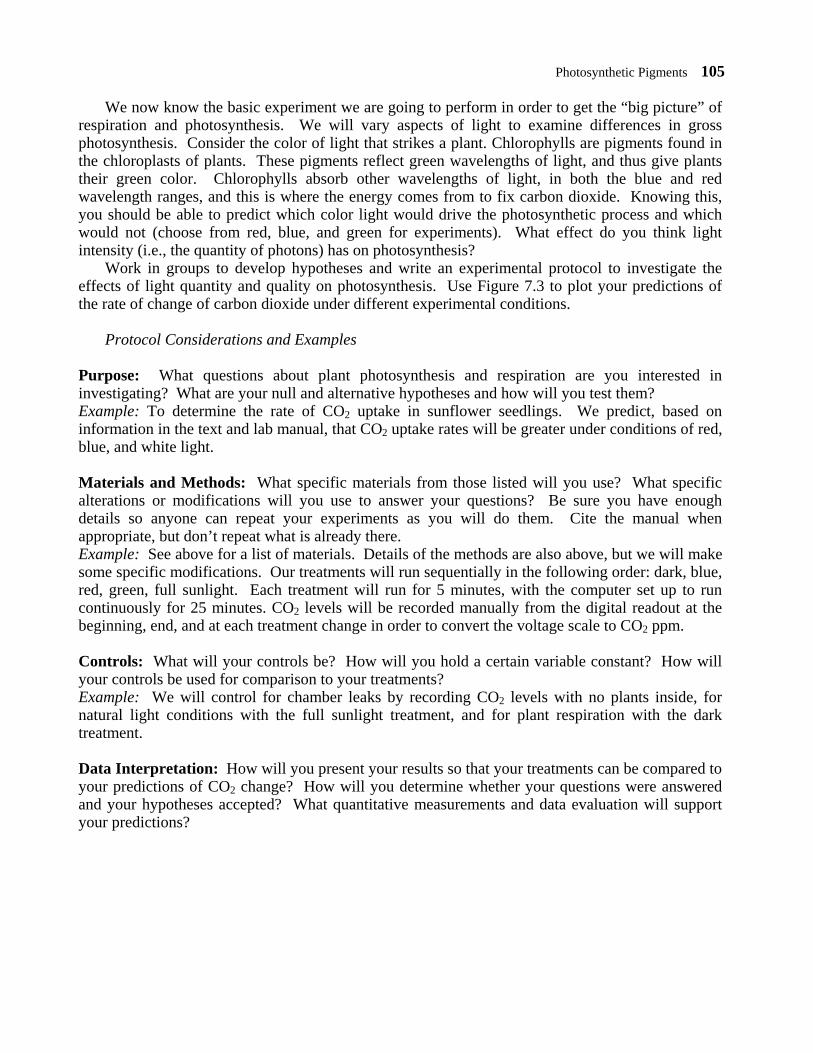
We now know the basic experiment we are going to perform in order to get the “big picture” of respiration and photosynthesis. We will vary aspects of light to examine differences in gross photosynthesis. Consider the color of light that strikes a plant. Chlorophylls are pigments found in the chloroplasts of plants. These pigments reflect green wavelengths of light, and thus give plants their green color. Chlorophylls absorb other wavelengths of light, in both the blue and red wavelength ranges, and this is where the energy comes from to fix carbon dioxide. Knowing this, you should be able to predict which color light would drive the photosynthetic process and which would not (choose from red, blue, and green for experiments). What effect do you think light intensity (i.e., the quantity of photons) has on photosynthesis?
Work in groups to develop hypotheses and write an experimental protocol to investigate the effects of light quantity and quality on photosynthesis. Use Figure 7.3 to plot your predictions of the rate of change of carbon dioxide under different experimental conditions.
Protocol Considerations and Examples Purpose: What questions about plant photosynthesis and respiration are you interested in investigating? What are your null and alternative hypotheses and how will you test them? Example: To determine the rate of CO2 uptake in sunflower seedlings. We predict, based on information in the text and lab manual, that CO2 uptake rates will be greater under conditions of red, blue, and white light. Materials and Methods: What specific materials from those listed will you use? What specific alterations or modifications will you use to answer your questions? Be sure you have enough details so anyone can repeat your experiments as you will do them. Cite the manual when appropriate, but don’t repeat what is already there. Example: See above for a list of materials. Details of the methods are also above, but we will make some specific modifications. Our treatments will run sequentially in the following order: dark, blue, red, green, full sunlight. Each treatment will run for 5 minutes, with the computer set up to run continuously for 25 minutes. CO2 levels will be recorded manually from the digital readout at the beginning, end, and at each treatment change in order to convert the voltage scale to CO2 ppm. Controls: What will your controls be? How will you hold a certain variable constant? How will your controls be used for comparison to your treatments? Example: We will control for chamber leaks by recording CO2 levels with no plants inside, for natural light conditions with the full sunlight treatment, and for plant respiration with the dark treatment. Data Interpretation: How will you present your results so that your treatments can be compared to your predictions of CO2 change? How will you determine whether your questions were answered and your hypotheses accepted? What quantitative measurements and data evaluation will support your predictions?

106 Photosynthetic Pigments Example: Each treatment will be examined separately for changes in [CO2] and compared to the controls and to each other. Slopes will be estimated and rates of [CO2] change will be compared. By taking into account the rate of CO2 released through respiration, we can determine gross photosynthesis for different treatments. Week 2 Objectives 1. Design an experiment before week 2 to assess the effects of light quality and quantity upon CO2
utilization in plants over a short time period. Each group will be limited in time at the apparatus. Plan properly, so you will be able to perform several experiments in the limited amount of time you have, and possibly perform them all in the same run on the computer.
2. Analyze your data and relate your findings to what you have learned about the events which occur during photosynthesis. Did you detect evidence for respiration under any conditions?
Materials
Same as Week 1.
Procedures
Execution of Experiments
Perform the experiments you have designed for studying the effects of light on CO2 uptake in sunflower seedlings. Use the software as your TA instructed you and the instructions from Week 1 procedures. Obtain printouts of your graphs. Label each graph with the treatment and your coordinates. Record initial and final CO2 levels in order to label the y-axis and convert from voltage (as in Figure 7.2). Also record the times during your experiment when you changed treatments or altered the setup in any way.
For each treatment, use the same procedures you used last week, but record the variation in the setup (i.e., what light intensity?, what light quality or color?). In addition to your treatments, you will have at least one control (identify it), and one treatment which will account for respiration (specify that treatment).
Discussion
Present your data for CO2 changes for sunflower seedlings after first reviewing the appendix on graphing techniques (not included here). Work on this as a group. The whole class will then discuss the results and the following questions: What is the response of photosynthesis to changes in light intensity? Light quality? Link the material presented in lecture on photosynthesis and respiration at the cellular level to what is happening at the whole organism level in your experiments.

Photosynthetic Pigments 107
Figure 7.3. Changes in CO2 concentration over time. (Graph your predictions for CO2 changes. Simply draw a line to illustrate the slope of CO2 change over time. The starting and ending points are unimportant; the slope, or the rate of change, is important.)
Notes for the Instructor
The following includes information specific to actually teaching this lab in the context of a large introductory course. Specific preparatory notes for setting up the lab are included in Appendix A.
Introduction to Photosynthesis
Stress the linkage between respiration and photosynthesis, the overall importance of metabolism, and how light energy from the sun is transduced into the chemical energy of glucose (and other carbohydrates). Also note that energy is used not only by the plants, but is exploited by other organisms who can’t convert light energy to chemical energy. Also discuss photosynthesis at the whole organism level (physiological ecology), and the data collection process.
The students should realize that what they see is all the processes at the cellular level discussed in lecture occurring at the level of the organism. Think about all the metabolic pathways (glycolysis, Krebs cycle, electron transport chain, Calvin cycle, etc.) and their functions in the cell which produce the organisms we study (emergent properties), as well as all the other organisms that inhabit this planet. There is a commonality of processes, but still so much variation which produces the wealth of organisms that we observe.
Integrate the three parts of this lab. Link photosynthesis and the CO2 uptake analysis with starch accumulation. Plants that are deprived of light can’t produce carbohydrates and so they must use up more energy reserves (in the form of starch). Respiration may stay the same in this case, but gross photosynthesis is zero. Under extreme stress, respiration increases, and if gross photosynthesis stays the same then the net accumulation of photosynthate will decrease. Discuss

108 Photosynthetic Pigments stresses such as light quality and quantity, heat, and lack of water to emphasize these points. Specifically, CO2 uptake, release of oxygen, and accumulation of starch are condition indicators. They can give us an idea of the health of the plant over the long term and stress on the plant over the short term. These indicators can be used to compare plants from different habitats (e.g., shade-tolerant versus shade-intolerant).
Technology and Methodology
Operation of the gas analyzer is very simple. The zero knob should be used to set the readout to 32 (which = 320 ppm; approximately equal to atmospheric CO2).
Use 1 volt for your full scale on the Unkelscope software. Have your students review the appendix on this software. They must be well prepared and everyone must be well organized since each group gets only a limited amount of time on the apparatus during Week 2.
Check hookups when you are ready to measure CO2. Fill the chamber with as many plants as possible and breath once into the box to raise the [CO2] to 800–1000 ppm. Turn the fan on and set up your software parameters. Students should still record initial and final [CO2] and time by hand. For treatments using the dark cloth, we will also turn the lights off so no light passes through the cloth.
Remember to take the top off the base when not taking readings, and this will keep the plants under less stress. Also take the top off at the end of the lab if there are plants inside. Make sure they are all well watered. If the plants are stressed by heat or lack of water their stomata will close and CO2 levels in the chamber will not change!
For the experiments using filters, tape acetate sheets on the environmental chamber and cover the rest of the box with the dark cloth. Do not allow the light to get closer than 25 cm to the acetates as the heat produced by the sodium lamp will melt the acetate sheets. Caution your students that the lights are very hot. High pressure sodium lamps (1,000 watts) take a few minutes to warm up, so turn them on before you are ready to have the students use the apparatus.
Use the same plants during one section, and save the other ones for the next lab (that way we can continually alternate throughout the day). If, however, the stomata close up and the plants are not photosynthesizing or exchanging gases when they should be, switch them with other plants. In general, stomata will close in hot, dry conditions to prevent water loss. If you switch plants due to stomatal closure, water the plants you take off and choose plants that are already well watered.
Laboratory Organization
Each experiment (starch accumulation, CO2, and dissolved O2) should be written up in protocols. Students should plan accordingly for the two experiments involving computers, in terms of the time they will have to get it all done.
After the students have examined all the equipment and techniques during Week 1, they should begin their protocols. Some groups can set up their seedlings for the starch accumulation experiment, while others work on the aquatic plant and terrestrial plant apparatus. During Week 2, have two or three groups start right away with the limiting apparatus. Other groups can analyze their seedlings for starch.
During Week 2 it is essential that your students are well organized. You must coordinate the students because of the limited access they will have on computer setups.

Photosynthetic Pigments 109
Some data are presented below (Table 7.1). Remember that the initial measurement of parts per million doesn’t matter; it is the concentration change, or the rate of change, that we are interested in.
Data Manipulation and Analysis
The graphs printed out by your students can be used to determine the slope of the line during any treatment, and will indicate the rate of CO2 uptake. Compare different treatments, or different portions of the same graph if more than one treatment is represented.
In the Unkelscope program, functions exist which allow you to perform linear calibration, curve-fitting, regression, correlation, conversion of data, integration, differentiation, and determination of the area beneath a curve (or portion of a curve). Other functions exist as well, and any good data acquisition program will have many analysis tools built in.
Table 7.1. Data from terrestrial plant, carbon dioxide uptake studies (ppm = parts per million).
Treatment Initial ppm
Final ppm
Rate change (ppm/minute)
Light intensity (µmole/second/m2)
Green
1200
900
43.9
40
Green
720
580
20.49
40
Red
1000
630
54.15
655
Red
830
510
46.83
655
15 cm away
1170
570
87.80
2500
50 cm away
900
580
46.83
475
Dark
1050
860
27.80
0
Sunlight
1050
590
67.32
1550
Data can be exported out of the Unkelscope program, and there are associated advantages and disadvantages. The two biggest disadvantages are that it takes time to perform and you must exit the main program to execute this function. The advantages are that a more detailed analysis can be performed on the data. This may be more beneficial to an upper-level course. We have downloaded files from Unkelscope into Lotus 1-2-3, Excel, and Minitab. All three will perform data manipulation and statistics, and have good graphics. Your choice may be dependent on personal preference and what is available at your institution.
As an example, the data in Figure 7.2 were analyzed in Minitab. This is a trace of Coleus plants exposed to full sunlight simulation for approximately 750 seconds. The light was then turned off for the remaining 250 seconds. Observe how CO2 concentrations in the environmental chamber initially decrease, and then increase when lights are turned off. Also note the number of samples taken (two per second). We can decrease this for normal traces; it was done this way in order to get a thick trace for the figure. This high number of samples makes for a large data set, and it was split into data for each of the two treatments. A conversion, determined from initial and final readings on the digital readout, was applied to the voltage data and converted to [CO2] ppm. These data were analyzed statistically and it was shown that there were significant regressions for both treatments.
110 Photosynthetic Pigments A significant negative (CO2 decreased in the chamber) and positive (CO2 increased in the chamber) slope occurred when the plants were in the light or dark, respectively.
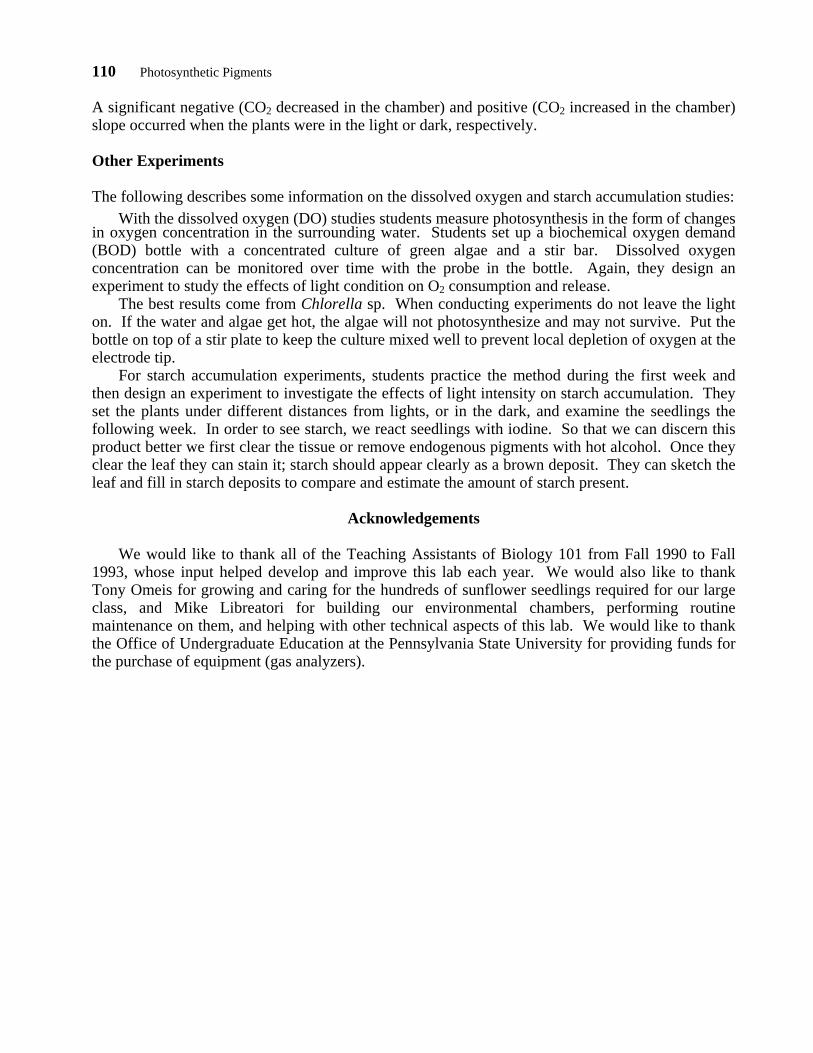
Other Experiments The following describes some information on the dissolved oxygen and starch accumulation studies: With the dissolved oxygen (DO) studies students measure photosynthesis in the form of changes in oxygen concentration in the surrounding water. Students set up a biochemical oxygen demand (BOD) bottle with a concentrated culture of green algae and a stir bar. Dissolved oxygen concentration can be monitored over time with the probe in the bottle. Again, they design an experiment to study the effects of light condition on O2 consumption and release.
The best results come from Chlorella sp. When conducting experiments do not leave the light on. If the water and algae get hot, the algae will not photosynthesize and may not survive. Put the bottle on top of a stir plate to keep the culture mixed well to prevent local depletion of oxygen at the electrode tip.
For starch accumulation experiments, students practice the method during the first week and then design an experiment to investigate the effects of light intensity on starch accumulation. They set the plants under different distances from lights, or in the dark, and examine the seedlings the following week. In order to see starch, we react seedlings with iodine. So that we can discern this product better we first clear the tissue or remove endogenous pigments with hot alcohol. Once they clear the leaf they can stain it; starch should appear clearly as a brown deposit. They can sketch the leaf and fill in starch deposits to compare and estimate the amount of starch present.
Acknowledgements
We would like to thank all of the Teaching Assistants of Biology 101 from Fall 1990 to Fall 1993, whose input helped develop and improve this lab each year. We would also like to thank Tony Omeis for growing and caring for the hundreds of sunflower seedlings required for our large class, and Mike Libreatori for building our environmental chambers, performing routine maintenance on them, and helping with other technical aspects of this lab. We would like to thank the Office of Undergraduate Education at the Pennsylvania State University for providing funds for the purchase of equipment (gas analyzers).

Photosynthetic Pigments 111
APPENDIX A Preparatory Notes and Materials
Be sure that all of your equipment is working well before the start of your lab. We usually begin working with the equipment at least 2 weeks prior to the lab. It doesn’t take 2 weeks to set up, but if there are any problems with equipment, it can be sent to be fixed and received back in time for the lab. If you need any equipment serviced you will find it useful to have more than two weeks. Be sure all the equipment works well together, that is, that you get a clear signal from the gas analyzer to the computer and that the printer has the right emulation to print your graphs from the software. Sometimes signals look quite jumpy on the computer. This indicates that you have either some interference from equipment nearby, or a bad connection in the wiring, or the wrong signal is being analyzed. Since you will have to make your own customized cables (instructions are included in the Unkelscope manual and A/D board instructions) you should make sure they are properly field tested. Gas Analyzers
Our analyzers are designed for continuous analysis of CO2 in air through the use of infrared detectors; CO2 absorbs in the infrared range. Air passes through a stainless steel sample tube with an IR emitter and detector at opposite ends, and an optical filter in between so that only certain wavelengths reach the detector. The presence of CO2 causes less IR energy to reach the detector. Detector signals are then converted to analog output and received by the computer through the analog-to-digital board. These analyzers are very simple to use. Environmental Chambers and Sodium Lamps
These chambers should be made of polycarbonate, which is impermeable to CO2. They can be any size you desire; ours are approximately 45 cm × 45 cm × 40 cm and have a flat base which the rest of the chamber sits on. The sides are glued together with an acrylic glue. There is a foam seal between the base and the top of the chamber. There are two holes drilled in opposite sides which fit a #5 rubber stopper, one for gas analyzer sampling, and the other for students to blow in to raise CO2 levels. A box fan is placed in one corner of the base, facing away from the plants, for circulation and unbiased sampling.
The high pressure sodium lamps are 1,000 watt lights which are high in the yellow spectrum and lower in the blues, so they are not exactly like full sunlight. However, they work very well with the sunflower seedlings, since these plants respond favorably under high light intensities. Caution: These lights get hot, so don’t leave any plants under these conditions for long. They are also bright, hence the need for sunglasses. Additionally, the light meter can be used to measure and quantify light intensity. You should also measure full sunlight outdoors to compare to your experimental conditions. Bulbs may differ in intensity, especially as they get older, so light meter readings should be taken every year. Acetate Sheets and Dark Cloth
The acetate sheets were obtained from our Theatre Department. Particular shades of red and blue were chosen for their action spectra, which match the peaks of absorption spectrum of chlorophyll (450 and 670 nm), and green was chosen to transmit at about 500 nm, where chlorophyll is not photosensitive. The black cloth we use for the dark treatments is made of corduroy and should be big enough to cover the entire chamber. Computers: Hardware and Software
The IBM-compatible computers with A/D boards collect analog (continuous) signal from gas analyzer and convert it to a digital (discrete) signal which the computer and Unkelscope software process. A simple wiring diagram in instructions allow construction of cables with bare wire ends. The ends can be connected

112 Photosynthetic Pigments to any equipment which has electrical output signal between -5 and +5 volts. Unkelscope is a data acquisition software program which can collect up to 8 traces at once and has various other processing capabilities and functions. See Appendix B for more information on software and Appendix C for information on hardware and software.
Printers should be supported by data acquisition software or emulate the drivers in the software. Any IBM graphics compatible printer will work (IBM Proprinter, various Epson, Panasonic, and Okidata models, and Laserprinters with IBM emulation capabilities). Sunflower Seedlings
We use a wild variety of sunflower seedlings (Helianthus annuus), which seem to be more robust in the seedling stage than commercially-grown varieties. Seeds should be planted about 3 weeks prior to the day(s) you need them. They should be planted in 3- or 4-inch pots and they should be between 15 and 25 cm tall for them to fit in the boxes and work well. Plan on needing about 30 plants per lab per day for the first week, and 40 plants per lab per day for the second week. These numbers are for two setups/lab. Plants can be re-used, but they do need a couple of hours to recuperate if they spend a lot of time in an environmental chamber and are subjected to a number of different treatments. Water the plants in the morning before the lab starts and later during the day if they dry out. Well-watered plants will go a long way to ensuring the success of the lab.
APPENDIX B Data Acquisition and Graphics Software
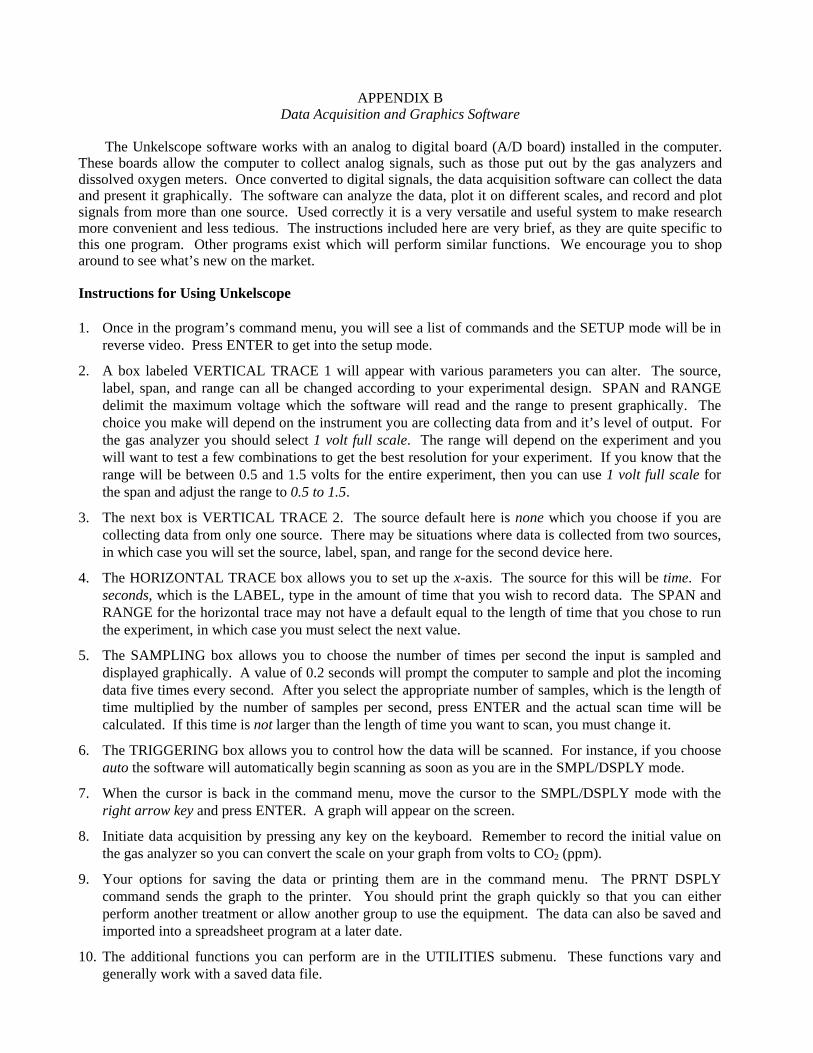
The Unkelscope software works with an analog to digital board (A/D board) installed in the computer.
These boards allow the computer to collect analog signals, such as those put out by the gas analyzers and dissolved oxygen meters. Once converted to digital signals, the data acquisition software can collect the data and present it graphically. The software can analyze the data, plot it on different scales, and record and plot signals from more than one source. Used correctly it is a very versatile and useful system to make research more convenient and less tedious. The instructions included here are very brief, as they are quite specific to this one program. Other programs exist which will perform similar functions. We encourage you to shop around to see what’s new on the market. Instructions for Using Unkelscope 1. Once in the program’s command menu, you will see a list of commands and the SETUP mode will be in
reverse video. Press ENTER to get into the setup mode.
2. A box labeled VERTICAL TRACE 1 will appear with various parameters you can alter. The source, label, span, and range can all be changed according to your experimental design. SPAN and RANGE delimit the maximum voltage which the software will read and the range to present graphically. The choice you make will depend on the instrument you are collecting data from and it’s level of output. For the gas analyzer you should select 1 volt full scale. The range will depend on the experiment and you will want to test a few combinations to get the best resolution for your experiment. If you know that the range will be between 0.5 and 1.5 volts for the entire experiment, then you can use 1 volt full scale for the span and adjust the range to 0.5 to 1.5.
3. The next box is VERTICAL TRACE 2. The source default here is none which you choose if you are collecting data from only one source. There may be situations where data is collected from two sources, in which case you will set the source, label, span, and range for the second device here.
4. The HORIZONTAL TRACE box allows you to set up the x-axis. The source for this will be time. For seconds, which is the LABEL, type in the amount of time that you wish to record data. The SPAN and RANGE for the horizontal trace may not have a default equal to the length of time that you chose to run the experiment, in which case you must select the next value.
5. The SAMPLING box allows you to choose the number of times per second the input is sampled and displayed graphically. A value of 0.2 seconds will prompt the computer to sample and plot the incoming data five times every second. After you select the appropriate number of samples, which is the length of time multiplied by the number of samples per second, press ENTER and the actual scan time will be calculated. If this time is not larger than the length of time you want to scan, you must change it.
6. The TRIGGERING box allows you to control how the data will be scanned. For instance, if you choose auto the software will automatically begin scanning as soon as you are in the SMPL/DSPLY mode.
7. When the cursor is back in the command menu, move the cursor to the SMPL/DSPLY mode with the right arrow key and press ENTER. A graph will appear on the screen.
8. Initiate data acquisition by pressing any key on the keyboard. Remember to record the initial value on the gas analyzer so you can convert the scale on your graph from volts to CO2 (ppm).
9. Your options for saving the data or printing them are in the command menu. The PRNT DSPLY command sends the graph to the printer. You should print the graph quickly so that you can either perform another treatment or allow another group to use the equipment. The data can also be saved and imported into a spreadsheet program at a later date.
10. The additional functions you can perform are in the UTILITIES submenu. These functions vary and generally work with a saved data file.
114 Photosynthetic Pigments
APPENDIX C Equipment: Costs and Suppliers
The following information lists the equipment and suppliers that we use. Other companies may be able to compete with the quoted prices. Check the Thomas Register for other companies dealing with particular products. All prices are in US dollars. Gas analyzers: Purchased from Nova Analytical Systems, Inc., Niagara Falls, NY 14301, (716) 285-0418. This is a small company, with good service and a 10% discount for institutions. We have three Model 306D (measures both oxygen and carbon dioxide), with low and high range CO2 boards, which we have to switch manually. We have just purchased three more model 301D, which have only the CO2 detector (and we had them install two boards in each so we have both high and low detectors). You can get models with just the low range CO2 detector if you are going to use these just for the photosynthesis lab. Current prices (without discount) are as follows: 306D (CO2 and O2 with digital readout), $3,140; 301D (CO2 only with digital readout), $2,535; and extra CO2 detector board (installed), $950. Computers and printers: We use AT&T 6386SX computers which we received on a grant from AT&T. You could purchase similar computers for about $1,000 each. We have one laser printer networked to the labs (also from the AT&T grant), and we have three dot-matrix printers ($300 each) which we have hooked up to the computers right in lab. A/D boards: These cost about $300 each and were purchased from Cole-Parmer Instrument Co., 7425 N. Oak Park Ave., Niles, IL 60714; model G-08109-25. Cables have to be custom made to fit the boards and output devices. Unkelscope software: We paid about $500 for the software, which included a site license. Unkel Software, Inc., 62 Bridge St., Lexington, MA 02173, (617) 861-0181. High-pressure sodium lamps: $300 each, bulbs cost about $70, but last for up to 5 years, and longer with limited use. (You may also be able to obtain lights from your local police, who may have confiscated them from people using them to grow illegal plants! After lights are no longer needed for evidence, police may be perfectly happy to part with them.) Environmental chambers: We purchased one 8' × 4' sheet of polycarbonate from U.S. Plastics (1390 Neubrecht Rd., Lima, OH 45801) and built three chambers (approximately 45 cm × 45 cm × 40 cm) for about $250. This price includes other materials, such as the fans, glue, and foam seal. Light meter: $300 for the model we have (we have one which we split between labs), although cheaper ones may be purchased from Carolina Biological Supply Co., 2700 York Rd., Burlington, NC 27215. Red, green, and blue acetate sheets: These we bought from our Theatre Department, and they are simply filters they use to cover their stage lights. We got some scraps for free, but paid for some full sheets, about $5.00 per sheet.


![Highly Selective Carbon Dioxide Uptake by [Cu(bpy-n (SiF )] (bpy …sqma.myweb.usf.edu/pages/pictures/Publications/P_48.pdf · need to develop improved processes for purification](https://img.dokumen.tips/doc/110x75/60b3e5e630c243401b5572bf/highly-selective-carbon-dioxide-uptake-by-cubpy-n-sif-bpy-sqmamywebusfedupagespicturespublicationsp48pdf.jpg)