Embed Size (px)
Citation preview

1
Carbon-Aware Energy Capacity Planning for Datacenters
Chuangang Ren, Di Wang, Bhuvan Urgaonkar, Anand Sivasubramaniam
Computer Science and EngineeringThe Pennsylvania State University
Aug. 9th, 2012
POWER

2
Energy Consumption of Datacenters
• Increase in number/size of datacenters due to heavy reliance on Internet services
• Datacenters, if treated as a country, fifth in the world for electricity use
• Datacenter electricity usage expected to double in next 5 years and requires 12 new power plants
Environmental Cost
EconomicCost

Electricity Cost of Datacenters
Sources: Koomey 2011 and IDC 2009
Series105
101520253035404550
2000 2005 2010
44
26
15
Year
Electricity Cost for Datacenters (billion US $)
3
4
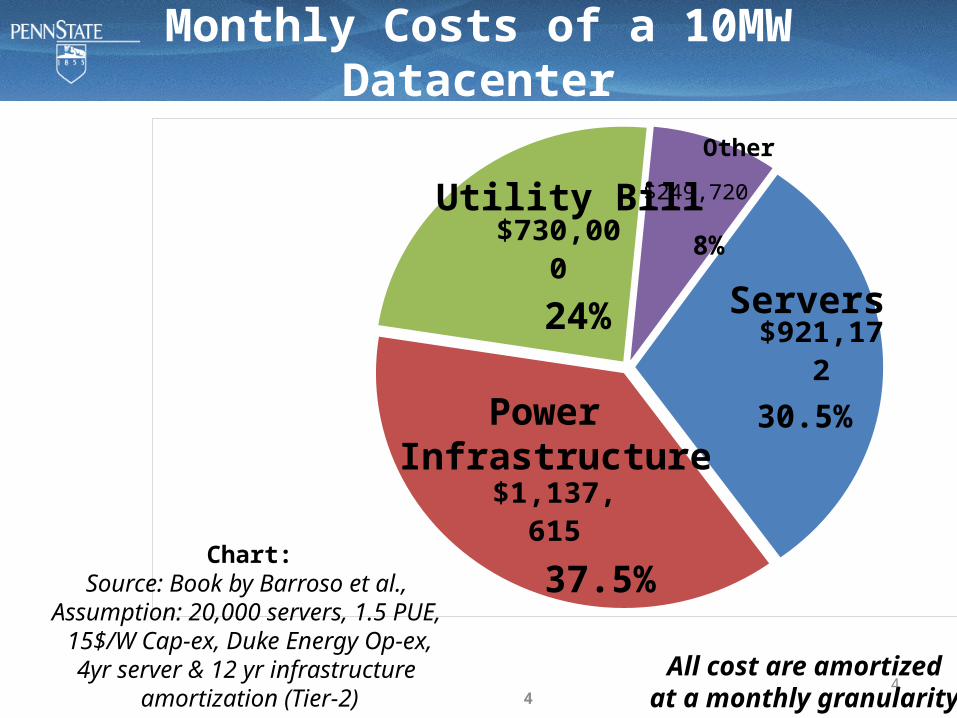
Monthly Costs of a 10MW Datacenter
4
$921,172
$1,137,615
$730,000
$249,720
Servers
Power Infrastructure
Utility BillOther
8%
30.5%
24%
37.5%
All cost are amortizedat a monthly granularity
Chart:Source: Book by Barroso et al.,
Assumption: 20,000 servers, 1.5 PUE, 15$/W Cap-ex, Duke Energy Op-ex,
4yr server & 12 yr infrastructure amortization (Tier-2)

Monthly Costs of a 10 MW Datacenter
Servers
Power Infrastructure
Utility Bill
Other
5
8%
30.5%
24%
37.5%
All cost are amortizedat a monthly granularity
Chart:Source: Book by Barroso et al.,
Assumption: 20,000 servers, 1.5 PUE, 15$/W Cap-ex, Duke Energy Op-ex,
4yr server & 12 yr infrastructure amortization (Tier-2)
Pow
er d
raw
(W)
Energy consumption(area under this curve)
Month
Peak power draw

6
Environmental Cost of Datacenters
Argentina
Netherla
nds
Malays
ia 0
50
100
150
200
250
300
350
400
CO2 Emission by Country in 2007(megatons CO2 per year)
Datacenter
2007Datace
nter
2020
142 146178
80
340
Sources: Mckinsey on Business Technology 2008
Trend: Cap the carbon footprint of large electricity consumers (including datacenters)
Regulations:• Emission Capping and Trading
Schemes (e.g. cap-and trade)• Carbon Tax• Penalties if one fails to comply
with the carbon regulations

7
• Power demand reduction– Numerous endeavors on energy-proportional
computing technologies– Smart cooling system control
Ways to Reduce Datacenter CO2 Emissions

8
• Power demand reduction– Numerous endeavors on energy-proportional computing
technologies– Smart cooling system control
• Renewable energy penetration– Oklahoma Wind to Power Google Data Center– Facebook’s solar-powered datacenter
Ways to Reduce Datacenter CO2 Emissions

9
Poor Renewable Usage by Datacenters Today
Sources: Greenpeace International 2012

10
• Power demand reduction– Numerous endeavors on energy-proportional computing
technologies– Smart cooling system control
• Renewable energy penetration– Oklahoma Wind to Power Google Data Center– On-site solar based renewable generation at Google’s
headquarter
Ways to Reduce Datacenter CO2 Emissions
Smarter electricity sourcing strategies

11
Datacenter Power Sourcing
Datacenter
UtilityEnergy
On-site
Off-site
Grid

12
Datacenter Power Sourcing
Datacenter
Diesel Generator
UtilityEnergy
On-site
Off-site
Grid
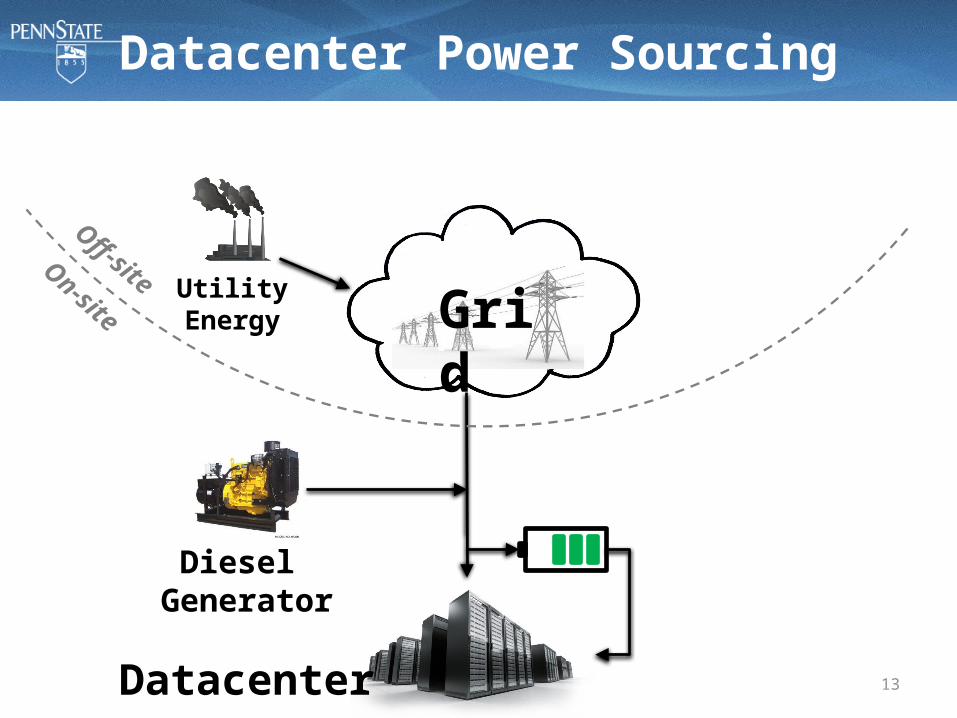
13
Datacenter Power Sourcing
Datacenter
Diesel Generator
UtilityEnergy
On-site
Off-site
Grid
14
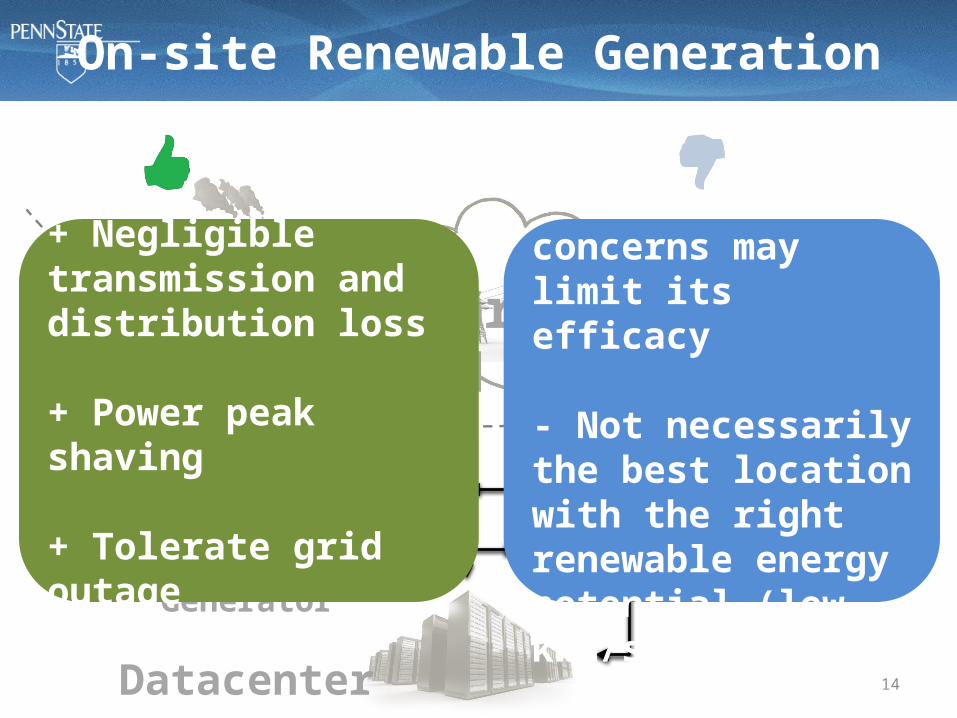
On-site Renewable Generation
Datacenter
Diesel Generator
UtilityEnergy
On-site
Off-site
On-site Renewable
Grid+ Negligible transmission and distribution loss
+ Power peak shaving
+ Tolerate grid outage
- Real-estate concerns may limit its efficacy
- Not necessarily the best location with the right renewable energy potential (low kWh/sq)

15
Off-site Renewable Generation
Datacenter
Diesel Generator
UtilityEnergy
On-site
Off-site
On-site Renewable
Grid
Off-site Renewable
$ Wheeling Fee
$ Banking Fee

16
Off-site Renewable Generation
Datacenter
Diesel Generator
UtilityEnergy
On-site
Off-site
On-site Renewable
Grid
Off-site Renewable
$ Wheeling Fee
$ Banking Fee
+ Good renewable energy potential (higher kWh/sq)
+ Grid reduces intermittency of renewable energy
- Transmission losses
- Wheeling and banking charges

17
Renewable Energy Products
Datacenter
Diesel Generator
UtilityEnergy
On-site
Off-site
On-site Renewable
Grid
Off-site Renewable
RenewableEnergy Products
18
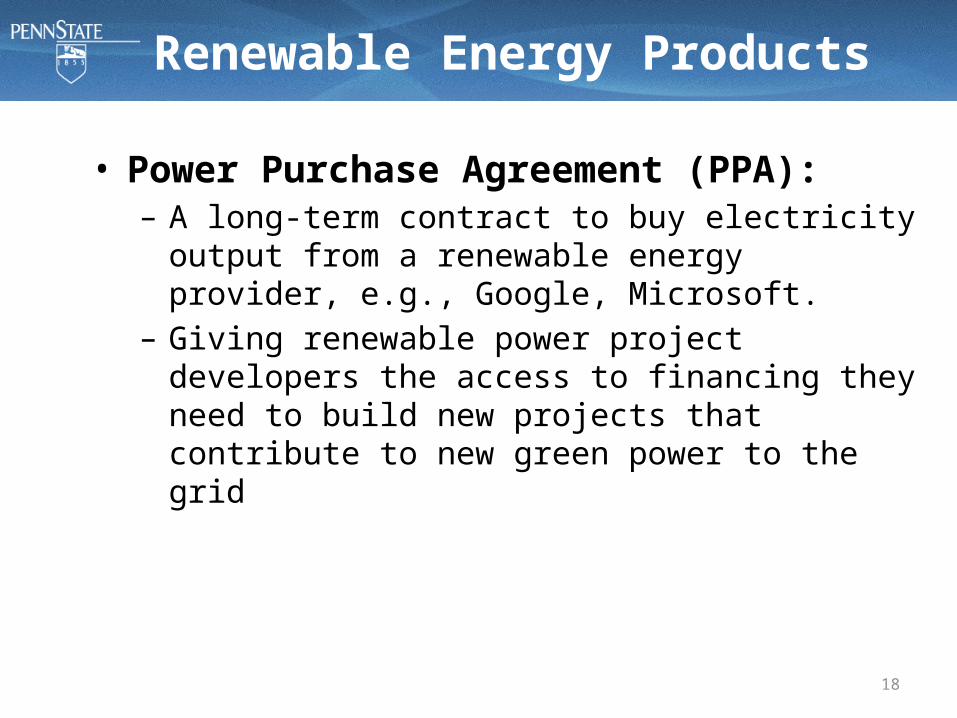
Renewable Energy Products
• Power Purchase Agreement (PPA): – A long-term contract to buy electricity output from a
renewable energy provider, e.g., Google, Microsoft.– Giving renewable power project developers the access to
financing they need to build new projects that contribute to new green power to the grid

19
Renewable Energy Products
Datacenter
Diesel Generator
UtilityEnergy
On-site
Off-site
On-site Renewable
Grid
Off-site Renewable Renewable
Energy ProductsCarbon Offsetting
Market

20
• A REC is a certificate that represents 1 MWh of electricity generated from renewable energy
• Two products: commodity electricity and REC– REC can be sold or traded separately from commodity
electricity
Renewable Energy Certificate (REC)
+ REC

21
Datacenter Power Sourcing
Grid
Datacenter
Diesel Generator
UtilityEnergy
Carbon OffsettingMarket
On-site
Off-site
RenewableEnergy Products
Off-site Renewable
On-site Renewable
+ Eliminate the need of capex and opex investment
+ Immunity to the renewable intermittency
- Expensive

22
Question
Given all renewable energy
options, how to achieve a target
carbon footprint at minimal cost?

23
Talk Outline
1 Motivation
2 Renewable Power Sources
3 Framework for Provisioning
4 Evaluation
5 Conclusions

24
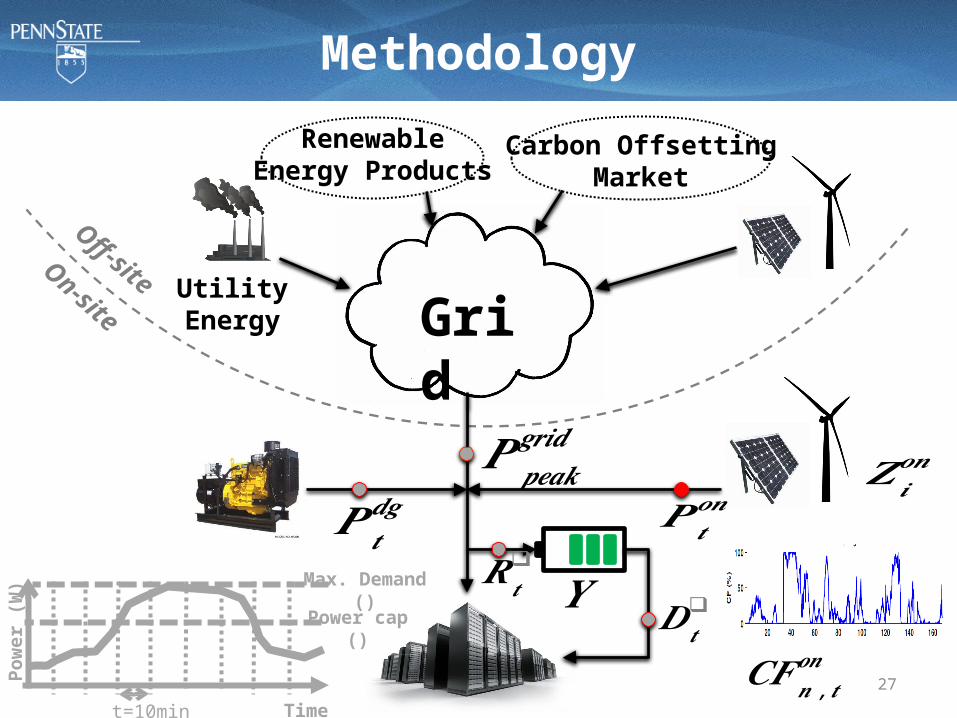
Methodology
GridUtilityEnergy
Carbon OffsettingMarket
On-site
Off-site
RenewableEnergy Products
𝑷 𝒑𝒆𝒂𝒌𝒈𝒓𝒊𝒅
Pow
er (W
)
Time
Power cap()
t=10min
Max. Demand()
𝑷 𝒕❑

25
Peak Power Impact on Utility Bill
5 c/KWh
Pow
er d
raw
(W)
Energy consumption(area under this curve)
Month
Duke Utility Tariffs(12 $/KW, 5 c/KWh)
15-min
Average draw
Peak power draw
Peak toAverage
ratio
3:1
12 $/KW
$ Peak 50%
$ Energy 50%
Note: Tariff rates collected from Duke Energy Utility.

26
Methodology
GridUtilityEnergy
Carbon OffsettingMarket
On-site
Off-site
RenewableEnergy Products
𝑷 𝒑𝒆𝒂𝒌𝒈𝒓𝒊𝒅
Pow
er (W
)
Time
Power cap()
t=10min
Max. Demand()
𝑷 𝒕𝒅𝒈
𝒀𝑫𝒕
❑𝑹𝒕
❑𝑷 𝒕❑
Methodology
GridUtilityEnergy
Carbon OffsettingMarket
On-site
Off-site
RenewableEnergy Products
𝑷 𝒕𝒐𝒏
𝑷 𝒕𝒅𝒈
𝒀
𝒁 𝒊𝒐𝒏𝑷 𝒑𝒆𝒂𝒌
𝒈𝒓𝒊𝒅
𝑫𝒕❑
𝑹𝒕❑
27
Pow
er (W
)
Time
Power cap()
t=10min
Max. Demand()
𝑪𝑭𝒏 ,𝒕𝒐𝒏
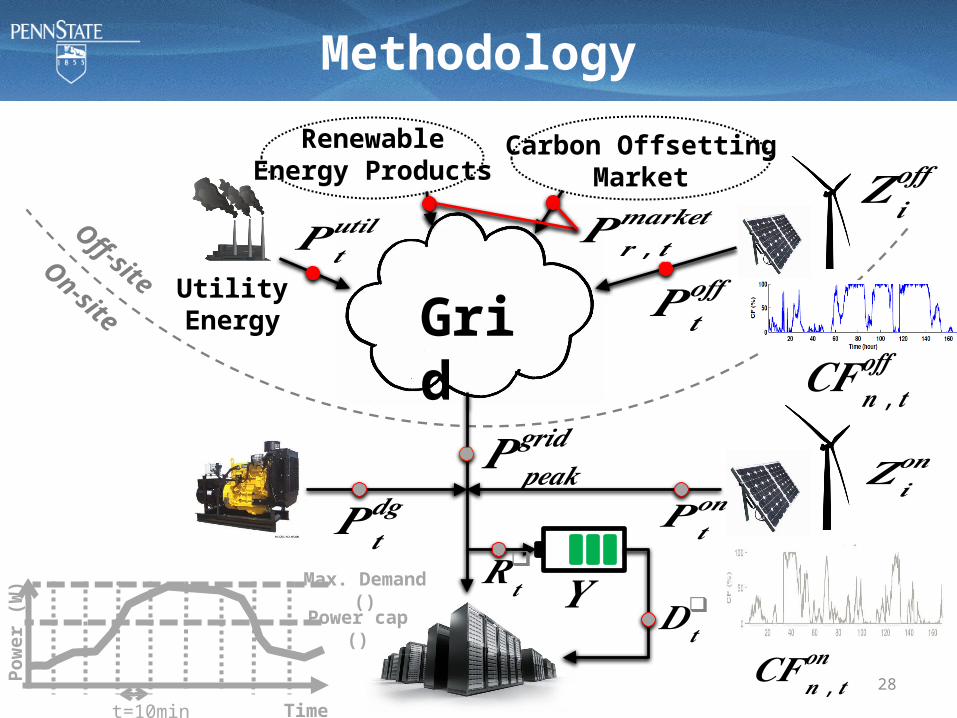
Methodology
GridUtilityEnergy
Carbon OffsettingMarket
On-site
Off-site
RenewableEnergy Products
𝑷 𝒕𝒐𝒏
𝑷 𝒕𝒐𝒇𝒇
𝑷 𝒓 ,𝒕𝒎𝒂𝒓𝒌𝒆𝒕
𝑷 𝒕𝒖𝒕𝒊𝒍
𝑷 𝒕𝒅𝒈
𝒀
𝒁 𝒊𝒐𝒏
𝒁 𝒊𝒐𝒇𝒇
𝑷 𝒑𝒆𝒂𝒌𝒈𝒓𝒊𝒅
𝑫𝒕❑
𝑹𝒕❑
28
Pow
er (W
)
Time
Power cap()
t=10min
Max. Demand()
𝑪𝑭𝒏 ,𝒕𝒐𝒏
𝑪𝑭𝒏 ,𝒕𝒐𝒇𝒇

29
Minimize: UtilityBill + OnSiteCost + OffSiteCost + MarketCost + ESD Cost + DGOpEx
Optimization Problem: Objective

30
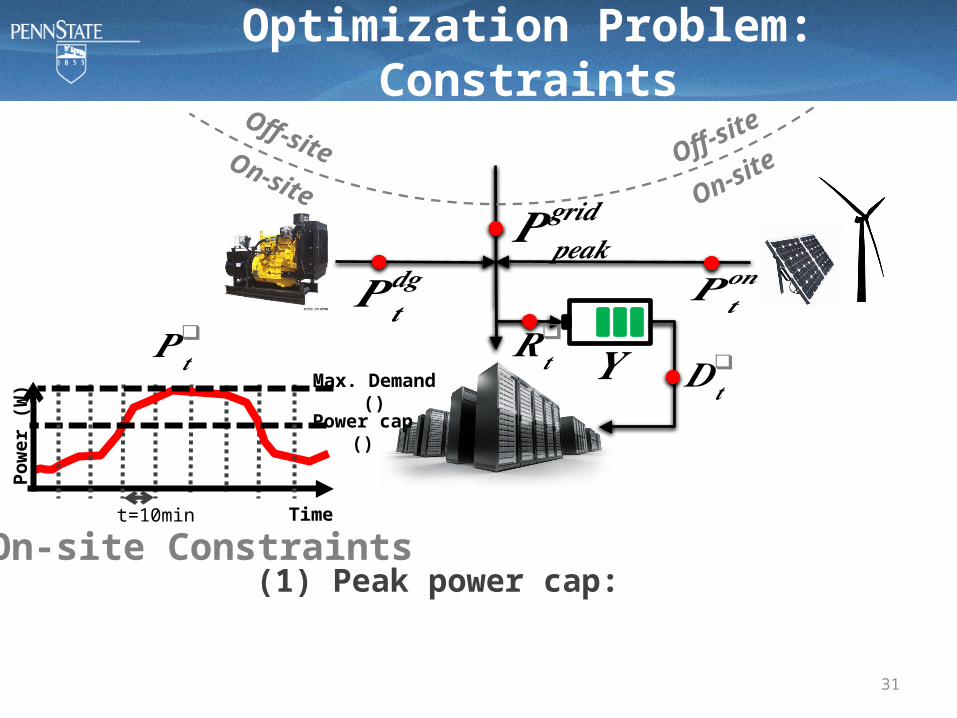
Optimization Problem: Constraints
GridUtilityEnergy
Carbon OffsettingMarket
On-site
Off-site
RenewableEnergy Products
𝑷 𝒕𝒐𝒏
𝑷 𝒕𝒐𝒇𝒇
𝑷 𝒓 ,𝒕𝒎𝒂𝒓𝒌𝒆𝒕
𝑷 𝒕𝒖𝒕𝒊𝒍
𝑷 𝒕𝒅𝒈
𝒀
𝒁 𝒊𝒐𝒏
𝒁 𝒊𝒐𝒇𝒇
𝑷 𝒑𝒆𝒂𝒌𝒈𝒓𝒊𝒅
𝑫𝒕❑
𝑹𝒕❑
Power sourcing:
𝑷 𝒕❑
31
Optimization Problem: Constraints
On-site
Off-site
On-siteOff-site
𝑷 𝒑𝒆𝒂𝒌𝒈𝒓𝒊𝒅
𝑷 𝒕𝒐𝒏𝑷 𝒕
𝒅𝒈
𝒀 𝑫𝒕❑𝑹𝒕
❑
(1) Peak power cap:
𝑷 𝒕❑
On-site Constraints
Pow
er (W
)
Time
Power cap()
t=10min
Max. Demand()

32
Optimization Problem: Constraints
On-site
Off-site
On-siteOff-site
𝑷 𝒑𝒆𝒂𝒌𝒈𝒓𝒊𝒅
𝑷 𝒕𝒐𝒏𝑷 𝒕
𝒅𝒈
𝒀 𝑫𝒕❑𝑹𝒕
❑
(1) Peak power cap:
𝑷 𝒕❑
(2) On-site renewable availability:
On-site Constraints
𝑪𝑭𝒏 ,𝒕𝒐𝒏

33
Optimization Problem: Constraints
Grid
Carbon OffsettingMarket
On-site
Off-site
RenewableEnergy Products
𝑷 𝒕𝒐𝒇𝒇
Off-site renewable availability:
𝒁 𝒊𝒐𝒇𝒇
𝑪𝑭𝒏 ,𝒕𝒐𝒇𝒇

34
Optimization Problem: Constraints
Carbon Constraint
0% 50% 90%𝑪𝑹

35
Talk Outline
1 Motivation
2 Renewable Power Sources
3 Framework for Provisioning
4 Evaluation
5 Conclusions

36
Realistic Power Profiles
50 100 1500
1
2
3
Time (hour)
Po
wer
(M
W)
(a) Facebook
50 100 1500
1
2
3
Time (hour)
Po
wer
(M
W)
(b) MSN
50 100 1500
1
2
3
Time (hour)
Po
wer
(M
W)
(c) Flash
50 100 1500
1
2
3
Time (hour)
Po
wer
(M
W)
(d) TCS

37
Realistic Power Profiles

38
Renewable Trace Profiles
Source: NREL, Western Wind and Solar Integration Study
On-site
Off-site
On/Off-site

39
Datacenter Configuration: Baseline
Datacenter
UtilityEnergy
On-site
Off-site
Grid

40
Datacenter Configuration: Base-DG
Datacenter
Diesel Generator
UtilityEnergy
On-site
Off-site
Grid

41
Datacenter Configuration: Base-DG-ESD
Datacenter
Diesel Generator
UtilityEnergy
On-site
Off-site
Grid
ESD

42
Datacenter Configuration: All
Grid
Datacenter
Diesel Generator
UtilityEnergy
Carbon OffsettingMarket
On-site
Off-site
On-site Renewable
RenewableEnergy Products
Off-site Renewable
43
Datacenter Cost Optimization
Baseline Base-DGBase-DG-ESD All2700
2900
3100
3300
3500
3700
3900
On-siteDGESDUtility Bill
3761 3700 3678 3669
Facebook Datacenter Power Cost (No Carbon Requirement)
Tota
l Cos
t per
Day
($)
• On-site renewables help reduce peak power drawn, hence lower cost• On-site renewables can supplement
ESD and DG in their role in peak reduction at a lower cost

44
Impact of Carbon Target
Base-line
0% 20% 40% 60% 80% 98%1000
1500
2000
2500
3000
3500
4000
BaselineMarketOff-siteOn-siteDGESDUtility Bill
3669
Facebook Datacenter Power Cost
Tota
l Cos
t per
Day
($)
Carbon Reduction Goal (%) add baseline here
3761 3669 3682 3700 3717 3841
$

45
0 10 20 30 40 50 60 70 80 90 98 1003600
3700
3800
3900
4000
4100
On-site Only
Off-site Only
Market Only
Impact of Carbon Target (cont.)
• On-site only: Base-DG-ESD + on-site renewable generation• Off-site only: Base-DG-ESD + off-site renewable generation• Market only: Base-DG-ESD + REC/PPA
1 2 3
Carbon Reduction Goal (%)
Tota
l Cos
t per
Day
($)

46
Impact of Carbon Target (cont.)
• On-site only: Base-DG-ESD + on-site renewable generation• Off-site only: Base-DG-ESD + off-site renewable generation• Market only: Base-DG-ESD + REC/PPA
1 2 3
• Hybrid solution as high carbon reduction increases• Renewable penetration goes beyond
carbon offsetting, even lower cost

47
Concluding Remarks
• Framework for energy capacity planning to achieve carbon footprints target at minimal cost
• Key findings:– Renewable penetration lower carbon footprints and costs– On-site renewables helpful for peak power reduction– Hybrid solution depending on carbon footprint targets

48Penn State University
Thank you!
http://csl.cse.psu.edu/

49
Backup Slides

50
Electricity Cost of Datacenters
Sources: Koomey 2011 and IDC 2009
Series12000 2005 2010
44
26
15
Year
Power and Cooling Cost forDatacenters (billion US $)
$921,172
$1,137,615
$730,000
$249,720
Servers
Power Infrastructure
Utility BillOther
8%
30.5%
24%
37.5%Chart:
Source: Book by Barroso et al., Assumption: 20,000 servers, 1.5 PUE,
15$/W Cap-ex, Duke Energy Op-ex,4yr server & 12 yr infrastructure
amortization (Tier-2)

51
Renewable Energy
Renewable energy provides 16% of global energy consumptionWind energy grew by 11% per yearSolar energy grew by 28% between 2000 and 2010
Sources: REN21
Worldwide Renewable Power Capacity (%)
Wind: 61%Solar PV: 13%Biomass: 22%Geothermal: 3%Other: 1%
Renewable Energy in Data Center• Wind: Google, Microsoft …• Solar: Facebook, Apple …

52
Datacenter Power Sourcing
Grid
Datacenter
Diesel Generator
UtilityEnergy
Carbon OffsettingMarket
On-site
Off-site
On-site Renewable
RenewableEnergy Products
Off-site Renewable
Typical Datacenter Power Sourcing

53
On-site Renewable Energy
Power Plant UtilityPower Grid
$POWER POWER
POWERDatacenter
POW
ER
Off-site On-site
No transmission and distribution loss Helpful for power peak shaving
Power supply intermittency Not the right location for renewable energy Other constraints, e.g. real estate
No
Win
d

54Off-site On-site
Good renewable energy potentials Wheeling and Banking effectively eliminate the
intermittency of renewable energy
Wheeling charge is sometimes expensive, depending on the location of off-site facility (e.g. avg. 15$/MWh for wind)
Off-site Renewable Energy
Power Plant UtilityPower Grid
$POWER POWER
POWERDatacenter
POW
ER
No
Win
d
Good WindBeautiful sunlight
POW
ER
$Wheeling Fee

55
Renewable Energy Certificate (REC)
Third-partyRenewable
Energy Producer
Power Plant Utility
REC Supplier
Power Grid
GreenDatacenter
$
$
POWER POWERPO
WER POWER
REC
Datacenter

56
Methodology
GridUtilityEnergy
Carbon OffsettingMarket
On-site
Off-site
RenewableEnergy Products
𝑷 𝒕𝒐𝒏
𝑷 𝒕𝒐𝒇𝒇
𝑷 𝒓 ,𝒕𝒎𝒂𝒓𝒌𝒆𝒕
𝑷 𝒕𝒖𝒕𝒊𝒍
𝑷 𝒕𝒅𝒈
𝒀
𝒁 𝒊𝒐𝒏
𝒁 𝒊𝒐𝒇𝒇
𝑷 𝒑𝒆𝒂𝒌𝒈𝒓𝒊𝒅
𝑫𝒕❑
𝑹𝒕❑

57
Impact of Carbon Target
Facebook Datacenter Power Cost
0 10 20 30 40 50 60 70 80 90 98 1003600
3700
3800
3900
4000
4100
On-site Only
Off-site Only
Market Only
Carbon Reduction Goal (%)
Tota
l Cos
t per
Day
($)

58
Impact of Renewable Capacity Factor
• Capacity factor plays a crucial role in selecting renewable sources/locations• On-site becomes less cost-effective than
off-site when CF is less than 24%

59
Impact of Renewable Energy Price
• Wheeling charge plays a crucial role in selecting renewable sources• Off-site wind penetration can go beyond
carbon reduction, even lower costs if CF and wheeling charge is friendly

60
Wind and Solar Sources
• Most prominent sources of renewable energy today– Wind (google, microsoft, etc): 62%; Solar (Facebook, Apple, etc): 13%
• Highly time-varying power output– Wind speed, solar irradiance
• Lower Capacity factor than conventional power plants– Wind: 20-45%; Solar photovoltaic: 14-24%
• Much lower carbon emission– Occur during manufacturing, transportation, installation, recycling

61
ESD for peak shaving
Time
Pow
er c
onsu
mp
tion
(W
)
Peak
Energy Storage Device (ESD)
Power Cap
Newdraw
Originaldraw