Embed Size (px)
Citation preview

U.S. International Trade Commission
Publication 4693 May 2017
Washington, DC 20436
Carbon and Certain Alloy Steel Wire Rodfrom Belarus, Italy, Korea, Russia,
South Africa, Spain, Turkey, Ukraine,United Arab Emirates, and the United
Kingdom
Investigation Nos. 701-TA-573-574 and 731-TA-1349-1358 (Preliminary)

U.S. International Trade Commission
COMMISSIONERS
Rhonda K. Schmidtlein, ChairmanDavid S. Johanson, Vice Chairman
Irving A. WilliamsonMeredith M. Broadbent
F. Scott Kieff
Catherine DeFilippo
Staff assigned
Address all communications toSecretary to the Commission
United States International Trade CommissionWashington, DC 20436
Director of Operations
Michael Szustakowski, InvestigatorGregory LaRocca, Industry AnalystJennifer Powell, Industry Analyst
Andrew Knipe, EconomistCaroline Peters, Economist
Joanna Lo, AccountantRussell Duncan, Senior StatisticianDarlene Smith, Statistical Assistant
Jane Dempsey, AttorneyFred Ruggles, Supervisory Investigator

U.S. International Trade Commission
Washington, DC 20436www.usitc.gov
Publication 4693 May 2017
Carbon and Certain Alloy Steel Wire Rodfrom Belarus, Italy, Korea, Russia,
South Africa, Spain, Turkey, Ukraine,United Arab Emirates, and the United
Kingdom
Investigation Nos. 701-TA-573-574 and 731-TA-1349-1358 (Preliminary)


CONTENTSPage
i
Determinations ............................................................................................................................... 1Views of the Commission ............................................................................................................... 3
Part I: Introduction .............................................................................................................. I-1
Background................................................................................................................................ I-1
Statutory criteria and organization of the report ..................................................................... I-2
Statutory criteria ................................................................................................................... I-2
Organization of report........................................................................................................... I-3
Market summary....................................................................................................................... I-3
Summary data and data sources............................................................................................... I-4
Previous and related investigations.......................................................................................... I-4
Safeguard investigation......................................................................................................... I-7
Nature and extent of alleged subsidies and sales at LTFV........................................................ I-7
Alleged subsidies ................................................................................................................... I-7
Alleged sales at LTFV ............................................................................................................. I-9
The subject merchandise .......................................................................................................... I-9
Commerce’s scope ................................................................................................................ I-9
Tariff treatment ................................................................................................................... I-10
The product ............................................................................................................................. I-11
Description and applications............................................................................................... I-11
Manufacturing processes .................................................................................................... I-12
Domestic like product issues................................................................................................... I-16
Physical characteristics and uses......................................................................................... I-17
Manufacturing facilities and production employees .......................................................... I-18
Interchangeability................................................................................................................ I-19
Customer and producer perceptions .................................................................................. I-19
Channels of distribution ...................................................................................................... I-20
Price ..................................................................................................................................... I-21
Part II: Conditions of competition in the U.S. market........................................................... II-1
U.S. market characteristics....................................................................................................... II-1
Channels of distribution........................................................................................................... II-1
Geographic distribution ........................................................................................................... II-1
CONTENTSPage
ii
Supply and demand considerations......................................................................................... II-2
U.S. supply ............................................................................................................................ II-2
U.S. demand ......................................................................................................................... II-5
Substitutability issues............................................................................................................... II-8
Lead times ............................................................................................................................ II-9
Factors affecting purchasing decisions................................................................................. II-9
Supplier certification .......................................................................................................... II-10
Comparison of U.S.-produced and imported wire rod....................................................... II-10
Part III: U.S. producers’ production, shipments, and employment ...................................... III-1
U.S. producers ......................................................................................................................... III-1
U.S. production, capacity, and capacity utilization................................................................. III-2
Overall capacity and production ......................................................................................... III-3
U.S. producers’ U.S. shipments and exports........................................................................... III-4
Captive consumption .............................................................................................................. III-7
Transfers and sales .............................................................................................................. III-7
First statutory criterion in captive consumption................................................................. III-7
Second statutory criterion in captive consumption............................................................ III-8
U.S. producers’ inventories ..................................................................................................... III-8
U.S. producers’ imports and purchases .................................................................................. III-8
U.S. employment, wages, and productivity ............................................................................ III-9
Part IV: U.S. imports, apparent U.S. consumption, and market shares ............................... IV-1
U.S. importers.......................................................................................................................... IV-1
U.S. imports............................................................................................................................. IV-3
Negligibility.............................................................................................................................. IV-6
Cumulation considerations ..................................................................................................... IV-9
Fungibility ............................................................................................................................ IV-9
Presence in the market .....................................................................................................IV-10
Geographical markets .......................................................................................................IV-13
Apparent U.S. consumption ..................................................................................................IV-14
U.S. market shares ................................................................................................................IV-16

CONTENTSPage
iii
Part V: Pricing data.............................................................................................................V-1
Factors affecting prices ............................................................................................................V-1
Raw material costs ...............................................................................................................V-1
Transportation costs to the U.S. market ..............................................................................V-3
U.S. inland transportation costs ...........................................................................................V-3
Pricing practices .......................................................................................................................V-3
Pricing methods....................................................................................................................V-3
Sales terms and discounts ....................................................................................................V-5
Price data..................................................................................................................................V-5
Price trends...........................................................................................................................V-7
Price comparisons ................................................................................................................V-8
Lost sales and lost revenue ....................................................................................................V-10
Part VI: Financial experience of U.S. producers ..................................................................VI-1
Background..............................................................................................................................VI-1
Operations on wire rod ...........................................................................................................VI-2
Total net sales quantity and value ....................................................................................VI-13
Operating costs and expenses...........................................................................................VI-13
Profitability ........................................................................................................................VI-14
Variance analysis ...................................................................................................................VI-14
Capital expenditures and research and development expenses..........................................VI-15
Assets and return on assets ..................................................................................................VI-17
Capital and investment .........................................................................................................VI-18
Part VII: Threat considerations and information on nonsubject countries..........................VII-1
The industry in Belarus...........................................................................................................VII-3
Changes in operations ........................................................................................................VII-3
Operations on Wire Rod.....................................................................................................VII-3
Alternative products...........................................................................................................VII-4
Exports................................................................................................................................VII-4

CONTENTSPage
iv
The industry in Italy................................................................................................................VII-7
Operations on wire rod ......................................................................................................VII-7
Alternative products...........................................................................................................VII-8
Exports................................................................................................................................VII-8
The industry in Korea ...........................................................................................................VII-10
Changes in operations ......................................................................................................VII-10
Operations on wire rod ....................................................................................................VII-10
Alternative products.........................................................................................................VII-11
Exports..............................................................................................................................VII-11
The industry in Russia ..........................................................................................................VII-13
Exports..............................................................................................................................VII-13
The industry in South Africa.................................................................................................VII-15
Changes in operations ......................................................................................................VII-15
Operations on wire rod ....................................................................................................VII-15
Alternative products.........................................................................................................VII-16
Exports..............................................................................................................................VII-16
The industry in Spain............................................................................................................VII-18
Changes in operations ......................................................................................................VII-19
Operations on wire rod ....................................................................................................VII-19
Alternative products.........................................................................................................VII-20
Exports..............................................................................................................................VII-20
The industry in Turkey..........................................................................................................VII-22
Changes in operations ......................................................................................................VII-23
Operations on wire rod ....................................................................................................VII-23
Alternative products.........................................................................................................VII-23
Exports..............................................................................................................................VII-24
The industry in Ukraine ........................................................................................................VII-26
Changes in operations ......................................................................................................VII-26
Operations on wire rod ....................................................................................................VII-26
Alternative products.........................................................................................................VII-27
Exports..............................................................................................................................VII-27

CONTENTSPage
v
The industry in the United Arab Emirates............................................................................VII-30
Changes in operations ......................................................................................................VII-30
Operations on wire rod ....................................................................................................VII-30
Alternative products.........................................................................................................VII-31
Exports..............................................................................................................................VII-31
The industry in the United Kingdom ....................................................................................VII-33
Changes in operations ......................................................................................................VII-34
Operations on wire rod ....................................................................................................VII-34
Alternative products.........................................................................................................VII-35
Exports..............................................................................................................................VII-35
Subject countries combined.................................................................................................VII-38
U.S. inventories of imported merchandise ..........................................................................VII-39
U.S. importers’ outstanding orders......................................................................................VII-39
Antidumping or countervailing duty orders in third-country markets ................................VII-40
Information on nonsubject countries ..................................................................................VII-41
General information .........................................................................................................VII-41
Canada..............................................................................................................................VII-45
Appendixes
A. Federal Register notices ................................................................................................. A-1
B. List of hearing witnesses ................................................................................................ B-1
C. Summary data ................................................................................................................ C-1
D. Monthly U.S. shipments, imports, and market shares................................................... D-1
E. Nonsubject country price data....................................................................................... E-1
Note.—Information that would reveal confidential operations of individual concerns may notbe published and therefore has been deleted. Such deletions are indicated by asterisks.


UNITED STATES INTERNATIONAL TRADE COMMISSION
Investigation Nos. 701-TA-573-574 and 731-TA-1349-1358 (Preliminary)
Carbon and Certain Alloy Steel Wire Rod from Belarus, Italy, Korea, Russia,South Africa, Spain, Turkey, Ukraine, United Arab Emirates, and the United Kingdom
DETERMINATIONSOn the basis of the record1 developed in the subject investigations, the United States
International Trade Commission (“Commission”) determines, pursuant to the Tariff Act of 1930(“the Act”), that there is a reasonable indication that an industry in the United States ismaterially injured by reason of imports of wire rod from Belarus, Italy, Korea, Russia, SouthAfrica, Spain, Turkey, Ukraine, United Arab Emirates, and United Kingdom, provided for insubheadings 7213.91.30, 7213.91.45, 7213.99.00, 7227.20.00, and 7227.90.60 of theHarmonized Tariff Schedule of the United States, that are alleged to be sold in the United Statesat less than fair value (“LTFV”) and imports of wire rod that are alleged to be subsidized by thegovernment of Turkey.2 The Commission also determines that an industry in the United Statesis threatened with material injury by reason of imports of wire rod that are alleged to besubsidized by the government of Italy.
COMMENCEMENT OF FINAL PHASE INVESTIGATIONSPursuant to section 207.18 of the Commission’s rules, the Commission also gives notice
of the commencement of the final phase of its investigations. The Commission will issue a finalphase notice of scheduling, which will be published in the Federal Register as provided insection 207.21 of the Commission’s rules, upon notice from the Department of Commerce(“Commerce”) of affirmative preliminary determinations in the investigations under sections703(b) or 733(b) of the Act, or, if the preliminary determinations are negative, upon notice ofaffirmative final determinations in those investigations under sections 705(a) or 735(a) of theAct. Parties that filed entries of appearance in the preliminary phase of the investigations neednot enter a separate appearance for the final phase of the investigations. Industrial users, and,if the merchandise under investigation is sold at the retail level, representative consumerorganizations have the right to appear as parties in Commission antidumping and countervailingduty investigations. The Secretary will prepare a public service list containing the names andaddresses of all persons, or their representatives, who are parties to the investigations.
BACKGROUNDOn March 28, 2017, Charter Steel, Saukville, Wisconsin; Gerdau Ameristeel US Inc.,
Tampa, Florida; Keystone Consolidated Industries, Inc., Peoria, Illinois; and Nucor Corporation,Charlotte, North Carolina filed petitions with the Commission and Commerce, alleging that anindustry in the United States is materially injured or threatened with material injury by reasonof LTFV and subsidized imports of wire rod from Italy and Turkey and LTFV imports of wire rod
1 The record is defined in sec. 207.2(f) of the Commission’s Rules of Practice and Procedure(19 CFR § 207.2(f)).
2 Commissioner F. Scott Kieff not participating.

from Belarus, Italy, Korea, Russia, South Africa, Spain, Turkey, Ukraine, United Arab Emirates,and United Kingdom. Accordingly, effective March 28, 2017, the Commission, pursuant tosections 703(a) and 733(a) of the Act (19 U.S.C. 1671b(a) and 1673b(a)), institutedcountervailing duty investigation Nos. 701-TA-573-574 and antidumping duty investigation Nos.731-TA-1349-1358 (Preliminary).
Notice of the institution of the Commission’s investigations and of a public conferenceto be held in connection therewith was given by posting copies of the notice in the Office of theSecretary, U.S. International Trade Commission, Washington, DC, and by publishing the noticein the Federal Register of April 3, 2017 (82 FR 16232). The conference was held in Washington,DC, on April 18, 2017, and all persons who requested the opportunity were permitted to appearin person or by counsel.

Bthere is areason oKorea, RuKingdomrod thatindustrythat are a
TI.
Trequirespreliminamateriallmateriallstandardrecord asthreat ofinvestiga
BII.
P(�Gerdauand Charthese invsubmitte
Seproducerand subm(�KoreanMinistry
1
2
994, 1001argues thaunfairly tr
3 A1535, 154
ased on thea reasonablef imports ofussia, Souththat are alleare allegedlyin the Uniteallegedly sub
The Legal S
he legal stanthe Commisary determinly injured orly retarded,d, the Comms a whole cof such injury;ation.�3
Background
arties to theu�); Nucor Corter Steel (covestigations.ed a postconeveral respor and exportmitted a posn respondentof Industry a
Commissione19 U.S.C. §§ 11 04 (Fed. Cir.at the establiraded importAmerican Lam43 (Fed. Cir. 1
record in the indication tcarbon andAfrica, Spaiegedly soldy subsidizedd States is tbsidized by t
Standard fo
ndard for pression to detenations, whethreatenedby reason oission weighontains clear; and (2) no
d
e investigatiorporation (ollectively �pPetitionersference brieondent entitter of wire rotconferencet�), appeareand Trade o
er F. Scott Kie1671b(a), 167. 1986); Aristeshment of ans.mb, 785 F.2d994).
Views of t
he preliminathat an inducertain allon, Turkey, Uin the United by the govehreatened wthe governm
or Prelimin
eliminary anermine, baseether there iwith materf the allegedhs the evidenand convinclikelihood ex
ions. On Ma�Nucor�); Kepetitioners�)s appeared aef, as did theies participaod in Italy (�e brief. POSCd at the conf the Russian
eff did not par73b(a) (2000)ech Chem. Con industry in t
at 1001; see
3
the Comm
ry phase of tstry in the Uy steel wirekraine, the Ud States at leernment of Twith materiament of Italy
nary Deter
ntidumping aed upon theis a reasonabial injury, ordly unfairly tnce before itcing evidencxists that co
arch 28, 201eystone Con), domestic pat the staff ce other threeated in theseItalian respoCO, a producnference andn Federation
rticipate in th; see also Amorp. v. Unitedthe United Sta
also Texas Cr
mission
these investUnited Staterod (�wire rUnited Arabess than fairTurkey. Weal injury by re.1
rminations
and counterinformationble indicatior that the esttraded impot and determce that thereontrary evide
7, Gerdau Ansolidated Inproducers ofconference we petitionerse investigatioondent�), apcer and expod submittedn submitted
he vote in themerican LambStates, 20 CITates is mater
rushed Stone
tigations, wes is materialrod�) from Bb Emirates, ar value and ifurther deteeason of imp
s
vailing dutyn available aon that a domtablishmentrts.2 In applmines whethe is no mateence will aris
Ameristeel Undustries, Incf wire rod, fiwith counsels jointly.ons. Ferrierppeared at thorter of wirea postconfea postconfe
ese investigatiCo. v. UnitedT 353, 354 55ially retarded
Co. v. United
e determinelly injured byBelarus, Italynd the Unitemports of wermine thatports of wire
determinatt the time omestic indust of an industlying thisher �(1) therial injury orse in a final
.S. Inc.c. (�Keystoniled petitionl. Nucor
e Nord S.p.Ahe conferene rod in Koreerence brief.erence brief.
ions.d States, 785 F5 (1996). Nod by the allege
d States, 35 F.
thaty,edwireane rod
ionsf thestry istry is
r
e�);s in
A, aceeaThe
.
F.2dpartyedly
3d

4
ArcelorMittal South Africa, a producer and exporter of wire rod in South Africa (�South Africanrespondent�) appeared at the conference and submitted a postconference brief. CELSA Group,CELSA Atlantic SA, and Compania Espanola de Laminacion, producers and exporters of wire rodin Spain, and Global Steel Wire S.A., a U.S. importer of wire rod from Spain (collectively�Spanish respondents�), appeared at the conference and submitted a joint postconferencebrief. Icdas Celik Enerji Tersane ve Ulasim Sanayi A.S., a producer and exporter of wire rod inTurkey, and The Istanbul Minerals and Metals Association and the Turkish Steel Exporters�Association, associations for producers and exporters of subject merchandise in Turkey(�Turkish respondents�), appeared at the conference and submitted a joint postconferencebrief. Public Joint Stock Company Yenakiieve Iron and Steel Works and Metinvest InternationalS.A., producers and exporters of wire rod in Ukraine (collectively �Ukrainian respondents�),appeared at the conference and submitted a joint postconference brief. British Steel Limited, aproducer and exporter of wire rod in the United Kingdom (�British respondent�), appeared atthe conference and submitted a postconference brief. Kiswire Ltd. and Kiswire America Inc.,U.S. purchasers of wire rod (collectively �Kiswire�), appeared at the conference and submitted ajoint postconference brief. Finally, the American Wire Producers Association, an association forU.S. purchasers of wire rod (�AWPA�), appeared at the conference and submitted apostconference brief.
Data Coverage. U.S. industry data are based on the questionnaire responses of ***firms that accounted for the vast majority of U.S. wire rod production in 2014 2016 (�period ofinvestigation�).4 U.S. import data are based on official Commerce import statistics as adjustedby questionnaire data.5 The Commission received usable questionnaire data from 28 importersaccounting for all imports from Belarus, all imports from Italy, all imports from Korea, 88.5percent of imports from Russia, 96.2 percent of imports from South Africa, 69.9 percent ofimports from Spain, 45.1 percent of imports from Turkey, 95.8 percent of imports from Ukraine,all imports from the United Arab Emirates, and all imports from the United Kingdom.6 TheCommission received usable responses to its foreign producer questionnaires from oneproducer of subject merchandise in Belarus whose reported exports accounted for *** percentof U.S. imports of wire rod from Belarus over the period of investigation,7 four producers ofsubject merchandise in Italy whose reported exports accounted for all U.S. imports from Italy in2016,8 one producer of subject merchandise in Korea whose reported exports accounted for*** percent of all U.S. imports from Korea over the period of investigation,9 one producer ofsubject merchandise in South Africa whose reported exports accounted for *** percent of all
4 Confidential Staff Report, Memorandum INV PP 059 (May 5, 2017) (�CR�) at I 5, Public Report(�PR�) at I 4.
5 CR at I 5, IV 1 n.2, PR at I 4, IV 1 n.2.6 CR at IV 1, PR at IV 1.7 CR at VII 3, PR at VII 3.8 CR at VII 10, PR at VII 7.9 CR at VII 17, PR at VII 10.

U.S. impomerchanfrom Spawhose reproducerpercent osubject mall U.S. improducerpercent oCommissin Russia
DIII.
InStates issubject m�industrythe relevthose proproportio�domestcharacte
Tfactual d�most sim
10
11
12
13
14
15
16
17
18
19
20
DepartmeStates, 191990), affparticularnumber o(Continue
orts from Sodise in Spainain over theeported expors of subjectof all U.S. immerchandisemports fromrs of subjectof all U.S. imsion did not.16
Domestic L
n determininmaterially inmerchandisey.�17 Sectionvant domestoducers whoon of the totic like produristics and uhe decisioneterminatiomilar in char
0 CR at VII 26,1 CR at VII 32,2 CR at VII 40,3 CR at VII 47,4 CR at VII 55,5 CR at VII 63,6 CR at VII 23,7 19 U.S.C. § 18 19 U.S.C. § 19 19 U.S.C. § 10 See, e.g., Cleent of Comme9 CIT 450, 455f�d, 938 F.2d 1r record at issof factors inclued�)
outh Africa on, whose repperiod of invorts accountmerchandis
mports frome in the Unitethe Unitedmerchandis
mports from treceive any
ike Produc
ng whether tnjured or thre, the Commn 771(4)(A) oic industry aose collectivtal domesticuct� as �a proses with, theregarding thn, and the Cracteristics a
PR at VII 15.PR at VII 18.PR at VII 23.PR at VII 26.PR at VII 30.PR at VII 33PR at VII 13.
1677(4)(A).1677(4)(A).1677(10).eo Inc. v. Uniterce, 36 F. Sup5 (1995); Torr1278 (Fed. Cirue� and the �uuding the foll
over the periported expovestigation,1
ted for *** pse in UkraineUkraine oveed Arab EmiArab Emiratse in the Unithe United Kcompleted r
ct
there is a reareatened wiission first dof the Tariffas the �produe output ofc productionoduct whiche article subhe appropriaCommissionand uses� on
34.
ted States, 50pp. 2d 380, 3rington Co. v.r. 1991) (�eveunique facts oowing: (1) ph
5
od of investrts accounte11 four produpercent of Ue whose repr the periodrates whosetes over theited KingdomKingdom overesponses fr
asonable indth material idefines the �Act of 1930,ucers as a wa domestic lof the prod
h is like, or inbject to an inate domestichas appliedn a case by c
1 F.3d 1291,83 (Ct. Int�l TUnited Statesery like produof each case��hysical charac
igation,10 foed for *** peucers of subjU.S. imports fported expord of investigae exports accperiod of inm whose exper the periodrom produce
dication thatinjury by rea�domestic lik, as amende
whole of a dolike productduct.�18 In tun the absencnvestigation.c like producthe statutorcase basis.20
1299 (Fed. Cirade 1998); Ns, 747 F. Suppuct determina�). The Commcteristics and
our producerercent of allject merchafrom Turkeyrts accounteation,13 onecounted fornvestigation,ports accound of investigers of subjec
t an industryason of impoke product�ed (�the Tarifomestic like pconstitutes
urn, the Tarice of like, mo.�19
ct(s) in an invry standardNo single fa
ir. 2007); NECNippon Steel Cp. 744, 749 nation �must bemission gened uses; (2) inte
rs of subjectU.S. importndise in Tury in 2016,12 ted for ***producer of*** percent14 and twonted for ***ation.15 Thect merchand
y in the Unitorts of theand theff Act�), defiproduct, ora majorff Act defineost similar in
vestigation iof �like� oractor is
C Corp. v.Corp. v. Unite.3 (Ct. Int�l Tre made on thrally considererchangeabili
tsrkeytwo
ft of
*edise
ed
nes
esn
is a
edradehers aity;

6
dispositive, and the Commission may consider other factors it deems relevant based on thefacts of a particular investigation.21 The Commission looks for clear dividing lines amongpossible like products and disregards minor variations.22 Although the Commission must acceptCommerce�s determination as to the scope of the imported merchandise that is subsidizedand/or sold at less than fair value,23 the Commission determines what domestic product is likethe imported articles Commerce has identified.24
In its notices of initiation, Commerce defined the imported merchandise within thescope of these investigations as:
. . . certain hot rolled products of carbon steel and alloy steel, incoils, of approximately round cross section, less than 19.00 mm inactual solid cross sectional diameter. Specifically excluded aresteel products possessing the above noted physical characteristicsand meeting the Harmonized Tariff Schedule of the United States(HTSUS) definitions for (a) stainless steel; (b) tool steel; (c) highnickel steel; (d) ball bearing steel; or (e) concrete reinforcing barsand rods. Also excluded are free cutting steel (also known as freemachining steel) products (i.e., products that contain by weightone or more of the following elements: 0.1 percent or more oflead, 0.05 percent or more of bismuth, 0.08 percent or more ofsulfur, more than 0.04 percent of phosphorous, more than 0.05percent of selenium, or more than 0.01 percent of tellurium). All
(�Continued)(3) channels of distribution; (4) customer and producer perceptions of the products; (5) commonmanufacturing facilities, production processes, and production employees; and, where appropriate,(6) price. See Nippon, 19 CIT at 455 n.4; Timken Co. v. United States, 913 F. Supp. 580, 584 (Ct. Int�lTrade 1996).
21 See, e.g., S. Rep. No. 96 249 at 90 91 (1979).22 See, e.g., Nippon, 19 CIT at 455; Torrington, 747 F. Supp. at 748 49; see also S. Rep. No. 96 249
at 90 91 (Congress has indicated that the like product standard should not be interpreted in �such anarrow fashion as to permit minor differences in physical characteristics or uses to lead to theconclusion that the product and article are not �like� each other, nor should the definition of �likeproduct� be interpreted in such a fashion as to prevent consideration of an industry adversely affectedby the imports under consideration.�).
23 See, e.g., USEC, Inc. v. United States, 34 Fed. App�x 725, 730 (Fed. Cir. 2002) (�The ITC may notmodify the class or kind of imported merchandise examined by Commerce.�); Algoma Steel Corp. v.United States, 688 F. Supp. 639, 644 (Ct. Int�l Trade 1988), aff�d, 865 F.3d 240 (Fed. Cir.), cert. denied,492 U.S. 919 (1989).
24 Hosiden Corp. v. Advanced Display Mfrs., 85 F.3d 1561, 1568 (Fed. Cir. 1996) (the Commissionmay find a single like product corresponding to several different classes or kinds defined by Commerce);Cleo, 501 F.3d at 1298 n.1 (�Commerce�s {scope} finding does not control the Commission�s {likeproduct} determination.�); Torrington, 747 F. Supp. at 748 52 (affirming the Commission�sdetermination defining six like products in investigations where Commerce found five classes or kinds).

7
products meeting the physical description of subject merchandisethat are not specifically excluded are included in this scope.
Wire rod is currently imported under statistical reporting numbers7213.91.3011, 7213.91.3015, 7213.91.3020, 7213.91.3093;7213.91.4500, 7213.91.6000, 7213.99.0030, 7227.20.0030,7227.20.0080, 7227.90.6010, 7227.90.6020, 7227.90.6030, and7227.90.6035 of the Harmonized Tariff Schedule of the UnitedStates (HTSUS). Products entered under subheadings7213.99.0090 and 7227.90.6090 of the HTSUS also may beincluded in this scope if they meet the physical description ofsubject merchandise above. The HTSUS provisions are forconvenience and customs purposes; the written description of thescope is dispositive.25
Wire rod is a hot rolled intermediate steel product of circular or approximately circularcross section that typically is produced in nominal fractional diameters up to 47/64 inch (18.7mm) and sold in irregularly wound coils, primarily for subsequent drawing and finishing by wiredrawers.26 Wire rod sold in the United States is categorized by quality according to end use.27
Arguments of the Parties
Petitioners argue that the Commission should find a single domestic like productconsisting of all wire rod, coextensive with the scope of the investigations. They assert that thiswould be consistent with the Commission�s treatment of wire rod in prior investigations andreviews in which the Commission found all wire rod to comprise a single continuum domesticlike product with no clear demarcations by type, grade, size, or use.28
Kiswire, the AWPA, and the British and Korean respondents, supported by the Turkishrespondents, argue that grade 1080 and higher (�grade 1080�) tire cord and tire bead wire rodshould be defined as a domestic like product separate from other wire rod covered by the
25 Carbon and Alloy Steel Wire Rod from Belarus, Italy, the Republic of Korea, the RussianFederation, the Republic of South Africa, Spain, Turkey, Ukraine, the United Arab Emirates, and theUnited Kingdom, 82 Fed. Reg. 19207, 19213 (Apr. 26, 2017) (initiation of less than fair valueinvestigations) (�Commerce Antidumping Duty Investigations�); Carbon and Alloy Steel Wire Rod fromItaly and Turkey, 82 Fed. Reg. 19213, 19217 (Apr. 26, 2017) (initiation of countervailing dutyinvestigations) (�Commerce Countervailing Duty Investigations�).
26 CR at I 12 13, PR at I 10 11.27 CR at I 13, PR at I 11.28 Petitions, Vol. I at 12 14; Gerdau, Keystone, and Charter Steel Postconf. Br. at 4 6; Nucor
Postconf. Br. at 5 (incorporating by reference the postconference brief of Gerdau, Keystone, and CharterSteel).

8
scope.29 They assert that the specifications for grade 1080 tire cord and tire bead wire rod havebecome more demanding since the Commission�s prior wire rod investigations, which wouldsupport now defining this specialized wire rod as a separate like product.30 Kiswire and theBritish and Korean respondents further assert that grade 1080 tire cord and tire bead wire rodis not interchangeable with, and has different channels of distribution and manufacturingfacilities than, other types of wire rod.31 They claim that customers and producers clearlyperceive grade 1080 tire cord and tire bead wire rod to be a distinct product from other wirerod and that it commands a price premium due to its specialized chemistry and productionprocess.32
Petitioners disagree. They assert that as was the case in the prior investigations, there isno clear dividing line between grade 1080 tire cord and tire bead wire rod and other wire rodproducts.33
Analysis and Conclusion
Based on the record, we define a single domestic like product consisting of all wire rodcorresponding to the scope of the investigations.
Physical Characteristics and Uses. The record indicates that there is some overlapbetween grade 1080 tire cord and tire bead wire rod and all other wire rod with respect tophysical characteristics and uses. All wire rod products within the scope, including grade 1080tire cord and tire bead wire rod, are intermediate circular, hot rolled steel products that aresold in irregularly wound coils and used for drawing and finishing into wire and wire products.34
The scope definition encompasses at least 11 major categories of wire rod, defined by end use,ranging from low carbon wire rod such as industrial wire rod used for nails and chain link fence,to medium to high carbon wire rod used for tire bead and prestressed concrete strand (�PCstrand�), to the highest end products, including tire cord wire rod.35
Kiswire and the British and Korean respondents argue that grade 1080 tire cord and tirebead wire rod is physically distinct from other wire rod because it is produced through a tightlymanaged manufacturing process to stringent specifications requiring high carbon levels of at
29 Kiswire Postconf. Br. at 2 10; AWPA Postconf. Br. at 25; British Respondent Postconf. Br. at 2229; Korean Respondent Postconf. Br. at 5 16; Turkish Respondents Postconf. Br. at 9. The AWPA basesits argument that grade 1080 tire cord and tire bead wire rod is a separate domestic like productargument solely upon the lack of domestic industry production of the product. AWPA Postconf. Br. at25.
30 Kiswire Postconf. Br. at 2 3; British Respondent Postconf. Br. at 22 23; Korean RespondentPostconf. Br. at 15 16.
31 Kiswire Postconf. Br. at 5 7; British Respondent Postconf. Br. at 22, 25 28; Korean RespondentPostconf. Br. at 9 13.
32 Kiswire Postconf. Br. at 7 8; British Respondent Postconf. Br. at 27 28; Korean RespondentPostconf. Br. at 11, 13 14.
33 Gerdau, Keystone, and Charter Steel Postconf. Br. at Ex. 1 pp. 4 11; Nucor Postconf. Br. at 5.34 CR at I 12 13, PR at I 10 11.35 CR at I 13 14, PR at I 11 12.
9
least 0.8 percent.36 However, the evidence indicates that the domestic industry produces anumber of different wire rod products in addition to grade 1080 tire cord and tire bead wirerod, including wire rod for ***, that require carbon levels at 0.8 percent or more.37 Moreover,like grade 1080 tire cord and tire bead wire rod, suspension spring wire rod is a highlyspecialized wire rod product used in critical automotive safety applications, and has exactingmetallurgical and mechanical standards.38 Additionally, its production process must becarefully controlled to ensure the surface quality and cleanliness of the steel.39 Thus, althoughKiswire and the British and Korean respondents demonstrate distinguishing characteristicsbetween grade 1080 tire cord and tire bead wire rod, on the one hand, and industrial qualityproducts, on the other, they fail to show any clear demarcations between grade 1080 tire cordand tire bead wire rod and other specialized products that they advocate should be in the samelike product as industrial quality wire rod. Rather, the record indicates that certain high endwire rod products, including grade 1080 tire cord and tire bead wire rod, share stringentmetallurgical and quality requirements.
Manufacturing Facilities, Production Processes and Employees. All wire rod, includinggrade 1080 tire cord and tire bead wire rod, shares a basic manufacturing process consisting ofsteelmaking, casting, hot rolling, and coiling and cooling.40 While chemical composition,alloying elements and other raw materials, stand fittings, and cooling speed determine thequality of the wire rod produced, the basic equipment, machinery, and facilities remain thesame for the production of all wire rod.41
Kiswire and the British and Korean respondents argue that grade 1080 tire cord and tirebead wire rod must be produced using the basic oxygen furnace (�BOF�) process, which utilizespure iron rather than scrap as the primary input and is currently used only by foreignproducers.42 However, whether grade 1080 tire cord and tire bead wire rod meeting certain
36 Kiswire Postconf. Br. at 2 3; British Respondent Postconf. Br. at 22, 25; Korean RespondentPostconf. Br. at 7 8.
37 Gerdau, Keystone, and Charter Steel Postconf. Br. at Ex. 1 p. 6, Ex. 9, Ex. 10; Nucor Postconf.Br. at Ex. 1 1.
38 Gerdau, Keystone, and Charter Steel Postconf. Br. at Ex. 9; Spanish Respondents Postconf. Br.at 4 5. The Spanish respondents do not argue that suspension spring wire rod is a separate domesticlike product. Conf. Tr. at 76 (Bond).
39 Spanish Respondents Postconf. Br. at 5.40 CR at I 15 20, PR at I 12 16. During the period of investigation Evraz Rocky Mountain Steel
(�Evraz�) produced and shipped grade 1080 tire cord and tire bead wire rod. Gerdau, Keystone, andCharter Steel Postconf. Br. at Ex. 8; Email from ***, EDIS Doc. No. 610953; Evraz U.S. ProducerQuestionnaire Response at II 10 (Apr. 11, 2017). Keystone produced and shipped tire bead. KeystoneU.S. Producer Questionnaire Response at II 10 (Apr. 5, 2017); Gerdau, Keystone, and Charter SteelPostconf. Br. at Ex. 11.
41 CR at I 16 n.26, I 20, PR at I 14 n.26; Conf. Tr. at 156 57 (Nystrom); Gerdau, Keystone, andCharter Steel Postconf. Br. at Ex. 1 p. 9. ***. Email from M. Carroll (Apr. 24, 2017), EDIS Doc. No.610953.
42 Kiswire Postconf. Br. at 4 7; British Respondent Postconf. Br. at 22 23; Korean RespondentPostconf. Br. at 13. Kiswire and the British respondent state that before its closure, ArcelorMittal USA�s(Continued�)

10
performance specifications can only be manufactured using the BOF process, which is the cruxof respondents� arguments, is not probative to a like product analysis in these investigations.This is because the domestic like product analysis compares different domestically producedproducts43 and as respondents recognize, no domestic wire rod producer uses the BOF process.Rather, domestic wire rod mills use the electric arc furnace (�EAF�) production process toproduce wire rod.44 Consequently, there is no distinction in production facilities andmanufacturing processes between domestically produced grade 1080 tire cord and tire beadwire rod and other domestically produced wire products.
Channels of Distribution. The majority of all domestically produced wire rod is sold toend users.45 Petitioners and respondents agree that grade 1080 tire cord and tire bead wirerod is sold directly to end users.46
Interchangeability. Wire rod used for industrial applications may not meet the qualityspecifications required for grade 1080 tire cord and tire bead wire rod.47 Additionally, Kiswireand the British and Korean respondents assert that grade 1080 tire cord and tire bead wire rodwould not be used in low end applications, either for cost reasons or because it would entailprocess adjustments.48 As previously stated, however, the scope definition encompasses 11broad end use categories within which there is an overlap of metallurgical qualities,chemistries, and physical characteristics. Products in the various end use categories are notnecessarily interchangeable, but this does not distinguish grade 1080 tire cord and tire beadwire rod from other types of wire rod within the scope.
Producer and Customer Perceptions. Kiswire, a purchaser of grade 1080 tire cord andtire bead wire rod, asserts that customers and producers clearly perceive grade 1080 tire cordand tire bead wire rod to be a distinct product that must be produced to stringent
(�Continued)(�ArcelorMittal�) Georgetown, South Carolina facility, which used the EAF process, was able to producelower grade tire cord and tire bead wire rod used on small tires but was unable to pass the qualificationprocess for grade 1080 tire cord and tire bead wire rod. Kiswire Postconf. Br. at 6 7; British RespondentBr. at 23. Additionally, Kiswire states that it attempted to qualify ***. Kiswire Postconf. Br. at 6 7.
43 See, e.g., Large Residential Washers from China, Inv. No. 731 TA 1306 (Preliminary), USITCPub. 4591 at 10 (Feb. 2016).
44 Kiswire Postconf. Br. at 6; Korean Respondent Postconf. Br. at 9 10, 13; British RespondentPostconf. Br. at 22. Petitioners state that a wire rod producer can purchase billets from a BOF producerand that the production processes beginning from the rolling stage are largely identical for all wire rod.Gerdau, Keystone, and Charter Steel Postconf. Br. at Ex. 1 p. 8; see also AWPA Postconf. Br. at 21 (emailfrom Bekaert employee stating that Evraz supplied the company with grade 1080 tire cord wire rodmanufactured with billets from a BOF producer in Canada).
45 CR/PR at Table II 1.46 Gerdau, Keystone, and Charter Steel Postconf. Br. at Ex. 1 pp. 7 8; Nucor Postconf. Br. at 5;
Kiswire Postconf. Br. at 6; British Respondent Postconf. Br. at 28; Korean Respondent Postconf. Br. at 1011.
47 CR at II 14, PR at II 8; Gerdau, Keystone, and Charter Steel Postconf. Br. at Ex. 1 p. 7; NucorPostconf. Br. at 5.
48 Kiswire Postconf. Br. at 5; British Respondent Postconf. Br. at 27; Korean RespondentPostconf. Br. at 9.

11
specifications.49 This is true not only for grade 1080 tire cord and tire bead wire rod, but forother types of specialized wire rod products as well.50 Domestic producers generally produceboth specialty and lower end types of wire rod, and do not make bright line distinctions amongthe various types, but rather view the various types as comprising a range of wire rodproducts.51
Price. Prices are lower for industrial quality wire rod and higher for higher quality andmore specialized wire rod.52 Kiswire and the British and Korean respondents argue that grade1080 tire cord and tire bead wire rod is priced higher than other wire rod products.53 Thepetitioners agree that tire cord wire rod commands a price premium over lower end products,but assert that this is true for other high end wire rod products as well.54
Conclusion. In investigations such as these in which domestically manufacturedmerchandise is made up of a grouping of similar products or involves niche products, theCommission does not consider each item of merchandise to be a separate domestic likeproduct that is only �like� its identical counterpart in the scope, but considers the groupingitself to constitute the domestic like product55 and �disregardsminor variations,�56 absent a�clear dividing line� between particular products in the group. In prior investigations involvingwire rod, the Commission has found that distinctions between different types of wire rod donot constitute �clear dividing lines� warranting the definition of separate domestic likeproducts.57 Notwithstanding respondents� contention that product characteristics havechanged since these prior proceedings, we conclude that the record here warrants the sameresult. While grade 1080 tire cord and tire bead wire rod are high end specialized products thatmay have certain distinct characteristics and are made using specialized processes to specific
49 Kiswire Postconf. Br. at 7 8.50 Gerdau, Keystone, and Charter Steel Postconf. Br. at Ex. 9 & Ex. 10; AWPA Postconf. Br. at Ex.
20 (excerpt from Evraz�s website describing the demanding nature of the requirements for wire ropeand PC strand as well as tire bead and tire cord).
51 Gerdau, Keystone, and Charter Steel Postconf. Br. at Ex. 1 p. 10, Ex. 9.52 Gerdau, Keystone, and Charter Steel Postconf. Br. at Ex. 1 p. 10.53 Kiswire Postconf. Br. at 8 9; British Respondent Postconf. Br. at 28; Korean Respondent
Postconf. Br. at 13 14.54 Gerdau, Keystone, and Charter Steel Postconf. Br. at Ex. 1 p. 10; Nucor Postconf. Br. at 5.55 See, e.g., Certain Hot Rolled Steel Flat Products from Australia, Brazil, Japan, Korea, the
Netherlands, Turkey, and the United Kingdom, Inv. Nos. 701 TA 545 547, 731 TA 1291 1297(Preliminary), USITC Pub. 4570 at 10 (Oct. 2015); Certain Seamless Carbon and Alloy Steel Standard, Line,and Pressure Pipe from China, Inv. Nos. 701 TA 469 and 731 TA 1168 (Final), USITC Pub. 4190(November 2010) at 8, n. 45.; Stainless Steel Bar from France, Germany, Italy, Korea, and the UnitedKingdom, Inv. Nos. 701 TA 413 (Final) and 731 TA 913 916 and 918 (Final), USITC Pub. 3488 (February2002) at 6 7.
56 See S. Rep. No. 96 249 at 90 91 (1979).57 E.g., Carbon and Certain Alloy Steel Wire Rod from China, Germany, and Turkey, Inv. Nos. 731
TA 1099 1101 (Preliminary), USITC Pub. 3832 at 10 (Jan. 2006); Carbon and Certain Alloy Steel Wire Rodfrom Brazil, Canada, Germany, Indonesia, Mexico, Moldova, Trinidad and Tobago, Turkey, and Ukraine,Inv. Nos. 701 TA 417 421 and 731 TA 953, 954, 956 959, 961, and 962 (Final), USITC Pub. 3546 at 9(Oct. 2002).

customespecializegenerallyprimarilyconsistendomesticwire rod,
DIV.
Tlike proda major pindustry,domesticor sold in
Wexcludedprovisiondomesticor whichdiscretio
*same par***.62 **
58
59
991 F.2d 81989), aff1352 (Ct.
60
circumstaproductioimport thor subsidiin the U.Sof the ind(5) whethChangzhoTorrington
61
domesticCommissi
62
r requiremeed wire rod.y manufactuy to end usernt with a groc like produc, correspond
Domestic In
he domesticuct, or thoseproportion othe Commic productionn the domesWe must deted from the don allows thec industry prare themsen based upo** U.S. prodrent compan** imported
8 19 U.S.C. § 19 See Torringt809 (Fed. Cir.f�dmem., 904Int�l Trade 190 The primaryances exist toon attributable product subies or whetheS. market); (3)ustry; (4) the
her the primarou Trina Solarn, 790 F. Supp1 Petitioners aproducers ofon should de2 CR/PR at Tab
nts and stanMoreover,red in the sars. Limited iouping of a rct consistingding to the s
ndustry
c industry ise producersof the total dssion�s genen of the domtic merchanermine wheomestic induCommissionroducers thalves importeon the facts pducer, ***, mny, ***, as esubject wir
1677(4)(A).ton Co. v. Unit1993); Sandv
4 F.2d 46 (Fed987).factors the Cexclude a rele to the impobject to inveser the firm mu) whether ince ratio of impory interest ofr Energy Co. vp. at 1168.argue that thef wire rod. Peefine the domble III 2 n.1,
ndards, the sall types ofame domestnterchangearange of simof all wire rcope of the
defined as twhose colle
domestic proeral practicemestic like prot market.ther any proustry pursuan, if approprat are relateders.59 Excluspresented inmeets the staxporters of se rod from S
ted States, 79vik AB v. Unitd. Cir. 1990); E
Commission hlated party inorting producstigation (wheust import inlusion or excort shipmentsthe importin
v. USITC, 100 F
e Commissionetitions, Vol. Imestic industry3.
12
same is truewire rod shatic facilities uability in somilar productsrod, includininvestigatio
he domesticective outpuoduction of thas been tooduct, whet
oducer of thant to Sectioiate circumsd to an exposion of suchn each investatutory defisubject merSpain and Uk
90 F. Supp. 11ted States, 72Empire Plow C
has examinedclude the folcer; (2) the reether the firmorder to enalusion of thes to U.S. prodng producer liF. Supp. 3d 13
n should definI at 15. Noney.
for many otare certain busing the samme end usess. We accorg grade 108ns.
c �producersut of a domethe product.o include in tther toll prod
e domestic lon 771(4)(B)stances existorter or impoa producertigation.60
nition of a rerchandise frokraine durin
161, 1168 (Ct21 F. Supp. 13Co. v. United
in deciding wlowing: (1) thason the U.S.m benefits froble it to contrelated partyduction for thes in domest314, 1326 31
ne the domese of the respo
ther types obasic physicame processes and price drdingly defin80 tire cord a
s as a wholestic like prod.�58 In definthe industryduced, capt
like productof the Tarifft, to excludeorter of subjis within the
elated partyom *** andg the period
. Int�l Trade 1322, 1331 32States, 675 F
whether apprhe percentag. producer haom the less thinue producty will skew thhe imported pic production1 (Ct. Int�l. Tra
stic industry tondents addre
f high endal propertieses, and are sdifferences ane a singleand tire bead
of a domesduct constituing the domproducers oively consum
should bef Act. Thise from theject merchane Commissio
y.61 It sharesas U.S. impod of
1992), aff�dm(Ct. Int�l TradF. Supp. 1348
ropriatege of domesticas decided tohan fair valueion and compe data for theproduct; andn or importatiade 2015); see
to include alless how the
s, aresoldre
d
ticutes
mesticof allmed,
ndiseon�s
s theorter
mem.,e,
c
salespetee rest
ion.e also

investigaa commo
Bappropri***,65 itsimports fSpecificaimporteddomestic*** percrecord prmerchan
Cproduct.
NV.
Pmerchanaccount fcountervduring thpetition.6
Tless thanthere areimports fall such minvestigaRepresenpercent,
Amaterial
63
64
65
66
67
68
69
(developi70
71
ation.63 Becaon parent, **ased on theate circumsts U.S. producfor those yeally, *** U.S.d *** short tc productionent of *** drovides no indise were bonsequently
Negligible I
ursuant to Sdise correspfor less thanvailing duty ihe most rece69
he statute fu3 percent o
e several coufrom all thosmerchandiseations involvntative (USTrather thanAdditionally,injury, they
3 *** U.S. Pro4 19 U.S.C. § 15 CR/PR at Tab6 CR/PR at Tab7 *** U.S. Imp8 CR/PR at Tab9 19 U.S.C. §§ng countries0 19 U.S.C. § 11 19 U.S.C. § 1
ause both **** is a relaterecord andtances do noction in 2014ars, underscproductiontons from **n in 2014), andomestic prondication thaenefitting thy, we define
Imports
Section 771(2ponding to an three percenvestigationent 12 month
urther proviof such totaluntries subjese countriese imported ining developiR)), the stat3 percent aeven if subjshall not be
ducer Questi1677(7)(4)(B)(ble III 1 n.1ble III 8.porter Questioble III 1.1671b(a), 16for purposes1677(24)(A)(ii1677(24)(B).
** and an imed party.64
the lack of aot exist to ex4 and 2015 wcoring that itwas *** sho** combinednd *** shortoduction in 2at *** affiliahe firm. ***the domest
24) of the Tadomestic lient (or fourn) of all suchhs for which
des that subimports of tect to investcollectivelynto the Uniting countrieute indicatend 7 percenject importse treated as n
onnaire Resp(ii)(III).
onnaire at II 4
673b(a), 1677of 19 U.S.C. §).
13
mporter and
any contraryxclude *** fwas still consts principal iort tons in 2d in 2014 (tht tons from *2015).66 ***ations with e.68
tic industry a
ariff Act, impke product spercent in th merchandish data are av
bject importsthe productigation withaccounts foted States.70
s (as designas that the net.71
are found tnegligible fo
ponse at II 10
4 (Apr. 7, 201
(24)(A)(i), 167§ 1677(36)).
exporters of
y party argumrom the domsiderably larnterest was014 and ***he equivalen*** combine* states thatexporters or
as all U.S. pr
ports from ashall be deemhe case of ase importedvailable prec
s from a singmay not benegligible im
or more thanIn the case
ated by theegligibility li
o be negligibor purposes o
(a) (Apr. 11, 2
17).
77(24)(B); see
f subject me
ments, we fimestic indusrger than itsin domestic* short tonst of *** pered in 2015 (tit *** and tan importe
roducers of t
a subject coumed negligibdeveloping
d into the Unceding the fil
gle country wconsideredmports andn 7 percent oe of countervUnited Statemits are 4 p
ble for purpof a threat a
2017).
e also 15 C.F.
erchandise h
ind that thestry. Althougaffiliated fir
c productionin 2015. **cent of ***the equivalehat ***.67 Tr of subject
the domestic
untry ofble if theycountry in a
nited Statesling of the
which compnegligible ifthe sum of sof the volumvailing dutyes Tradeercent and 9
oses of presanalysis shou
R. § 2013.1
have
ghrm�sn.*
ent ofThe
c like
a
prisefsuchme of
9
sentuld

14
the Commission determine that there is a potential that subject imports from the countryconcerned will imminently account for more than 3 percent (4 percent for countervailing dutyinvestigations of developing countries) of all such merchandise imported into the UnitedStates.72 The Commission also assesses whether there is a potential that the aggregate volumesof subject imports from all countries with currently negligible imports will imminently exceed 7percent of all such merchandise imported into the United States.73 The threshold is 9 percentfor developing countries.
Arguments of the Parties
Petitioners� Arguments. Petitioners argue that according to official import statistics forthe most recent 12 month period prior to the filing of the petitions (March 2016 throughFebruary 2017), subject imports from Korea, Russia, Spain, Turkey, and Ukraine each exceededthe 3 percent negligibility threshold applicable in antidumping duty investigations.74
Additionally, they assert that although subject imports from Belarus, Italy, South Africa, theUnited Arab Emirates, and the United Kingdom individually fell below the 3 percent negligibilitythreshold, the volume of imports from these countries collectively exceeded the 7 percentthreshold set forth in 19 U.S.C. § 1677(24)(A)(ii).75
With respect to the countervailing duty investigation covering allegedly subsidizedimports from Italy, petitioners argue that the Commission should not make a distinctionbetween dumped or subsidized imports and that it should combine allegedly subsidized importsfrom Italy with imports from other subject countries that are individually negligible in theantidumping duty investigations.76 Petitioners maintain that the collective volume of importsduring the relevant period exceeded the 7 percent aggregate threshold.77 Petitioners furtherargue that even if the Commission decides separately to assess the negligibility of allegedlysubsidized imports from Italy, these imports would not be negligible in the context of theCommission�s threat analysis because �there is a potential� that imports from Italy willimminently exceed the individual country negligibility threshold based on import license andquestionnaire data.78 Additionally, petitioners assert that production capacity in Italy is massiveand that *** and ***.79
Respondents� Arguments. The Italian respondent argues that imports from Italy subjectto the countervailing duty investigation are negligible because they accounted for only 2.5percent of total wire rod imports from March 2016 through February 2017. Additionally, noother individually negligible sources subject to a countervailing duty investigation can be
72 19 U.S.C. § 1677(24)(A)(iv).73 19 U.S.C. § 1677(24)(A)(iv).74 Nucor Postconf. Br. at 7; Gerdau, Keystone, and Charter Steel Postconf. Br. at 7 8
(incorporating by reference discussion of negligibility in Nucor�s postconference brief).75 Nucor Postconf. Br. at 7 8; Gerdau, Keystone, and Charter Steel Postconf. Br. at 7 8.76 Nucor Postconf. Br. at 9; Gerdau, Keystone, and Charter Steel Postconf. Br. at 7 8.77 Nucor Postconf. Br. at 9; Gerdau, Keystone, and Charter Steel Postconf. Br. at 7 8.78 Nucor Postconf. Br. at 10; Gerdau, Keystone, and Charter Steel Postconf. Br. at 7 8, 12 13.79 Nucor Postconf. Br. at 13 15; Gerdau, Keystone, and Charter Steel Postconf. Br. at 7 8.

15
combined with imports from Italy, rendering the aggregated exception to the statuteinapplicable.80
The Italian respondent maintains that imports from Italy are also negligible in thecontext of the Commission�s threat analysis because there is no potential that subject importsfrom Italy will imminently account for more than 3 percent of the volume of imports over asustained 12 month period.81 It maintains that imports from Italy did not reach 3 percent oftotal imports during any 12 month period during the period of investigation. Additionally,imports from Italy did not exceed this threshold in any six month period of the period ofinvestigation except for September 2016 through February 2017 in which imports from Italyreached 3.9 percent.82 Moreover, it maintains that the Italian wire rod industry has stablecapacity, *** capacity utilization, produces a *** of its production for internal consumption ortransfers, and has never had a significant presence in the U.S. market.83
The South African respondent argues that wire rod imports from South Africa arenegligible.84 The South African respondent argues that in conducting its negligibility analysis,the Commission should use the questionnaire response data for all subject countries except for***. The South African respondent asserts that in using import statistics for *** andquestionnaire response data for the remaining subject countries, imports from only twocountries, ***, fall below the 3 percent negligibility threshold. Moreover the two countriescollectively account for only *** percent of total imports, which is less than the 7 percentthreshold pertinent to aggregated imports from individually negligible sources.85
Analysis and Conclusion
Subject imports from five of the ten subject countries are clearly above the statutorynegligibility threshold. Specifically, official import data86 indicate that fromMarch 2016through February 2017, the 12 month period preceding the filing of the petition, subjectimports from Korea accounted for 4.9 percent of total imports, subject imports from Russiaaccounted for 6.0 percent, subject imports from Spain accounted for 4.5 percent, subjectimports from Turkey accounted for 4.5 percent, and subject imports from Ukraine accounted
80 Italian Respondent Postconf. Br. at 4.81 Italian Respondent Postconf. Br. at 5.82 Italian Respondent Postconf. Br. at 6. The Italian respondent asserts that during the six
month period from September 2016 through February 2017, subject imports from Italy fluctuated frommonth to month, entering in four of the six months and that they have decreased since November 2016.See id.
83 Italian Respondent Postconf. Br. at 6 10.84 South African Respondent Postconf. Br. at 1 6.85 South African Respondent Postconf. Br. at 4 5.86 We do not agree with the South African respondent that the Commission should rely on
official import data for only *** and questionnaire data for all other subject countries in its negligibilityanalysis. Importer coverage for subject imports, as well as for imports from nonsubject sources, isincomplete. CR at IV 1, PR at IV 1. Moreover, there is nothing in the record that leads us to believe theofficial import statistics are inaccurate or overstate the subject imports.

16
for 9.3 percent.87 Consequently, we find that subject imports from these five countries are notnegligible for purposes of the antidumping duty investigations and that subject imports fromTurkey are not negligible for purposes of the countervailing duty investigation.88
Subject imports from the remaining five subject countries are below the 3 percentindividual subject country statutory negligibility threshold. Official import data indicate thatsubject imports from Belarus accounted for 2.6 percent of total imports during the relevantperiod, subject imports from Italy accounted for 2.5 percent, subject imports from South Africaaccounted for 1.2 percent, subject imports from the United Arab Emirates accounted for1.3 percent, and subject imports from the United Kingdom accounted for 2.6 percent.89 Theaggregate percentage of total imports from these five countries is 10.2 percent. Because thisexceeds the 7 percent statutory threshold pertinent to aggregated imports from individuallynegligible sources, we find that subject imports are not negligible for purposes of theantidumping duty investigations on wire rod from Belarus, Italy, South Africa, Ukraine, and theUnited Kingdom.
The remaining question is whether subject imports from Italy are negligible for purposesof the countervailing duty investigation. As previously stated, subject imports from Italyaccounted for 2.5 percent of total imports over the relevant period, which is below theapplicable 3 percent negligibility threshold. There are no subject imports from any countrysubject to a countervailing duty investigation that are eligible to be aggregated with those fromItaly for purposes of the 7 percent statutory threshold. Subject imports from Turkey, the onlyother country subject to a countervailing duty investigation, exceed the 3 percent negligibilitythreshold.
We reject petitioners� request to aggregate imports from Italy subject to thecountervailing duty investigation with imports from other subject countries that are individuallynegligible in the antidumping duty investigations. The Commission has consistently declined tofollow such a practice.90 We consequently determine that subject imports from Italy arenegligible for our present injury analysis in the countervailing duty investigation.
87 CR/PR at Table IV 3.88 USTR has not designated Italy or Turkey to be a developing country. 15 C.F.R. § 2013.1 (1 1 16
edition); 19 U.S.C. § 1677(24)(B).89 CR/PR at Table IV 3.90 In the 1999 Cold Rolled Steel investigations, the Commission referred to a statement in the
Uruguay Round Agreements Act Statement of Administrative Action (the substance of which is also clearon the face of the underlying statutory provision) that the special alternative 4 and 9 percent thresholdsapply only to subject imports from developing countries in countervailing duty investigations, and it readthis limitation as precluding it from cross aggregating dumped imports with subsidized imports forpurposes of assessing developing country negligibility. Certain Cold Rolled Steel Products fromArgentina, Brazil, China, Indonesia, Japan, Russia, Slovakia, South Africa, Taiwan, Thailand, Turkey, andVenezuela, Inv. Nos. 701 TA 393 396 and 731 TA 829 840 (Preliminary), USITC Pub. 3214 at 16 & n.105(July 1999). The Commission has recently reaffirmed that it does not aggregate dumped and subsidizedimports for purposes of determining negligibility. Cold Rolled Steel Flat Products from Brazil, India,Korea, Russia, and the United Kingdom, Inv. Nos. 701 TA 540, 542 544 and 731 TA 1283, 1285, 1287,and 1289 1290 (Final), USITC Pub. 4637 at 13 n.69 (Sept. 2016) (�2016 Cold Rolled Final�); Certain(Continued�)

17
We find that it is not likely that evidence leading to a contrary result will arise in anyfinal phase of these investigations notwithstanding that subject imports from Italy wereapproaching the 3 percent threshold. Questionnaire data in the preliminary phaseencompassed all subject imports from Italy.91 Staff calculated import data based on bothadjusted and unadjusted import statistics, and there is no material difference between thetwo.92 Consequently, any further adjustments to data for subject imports from Italy or totalimports in any final phase of the investigations would be minor. Accordingly, we find that it isnot likely that contrary evidence concerning the level of subject imports from Italy will arise inany final phase of these investigations that would make them non negligible for purposes ofmaterial injury analysis in the countervailing duty investigation.
On the other hand, we find subject imports from Italy in the countervailing dutyinvestigation are not negligible for purposes of our analysis of reasonable indication of threat ofmaterial injury.93 The record indicates that imports from Italy accounted for less than 0.5percent of total imports until August 2016 when the volume of imports from Italy began toincrease.94 For the seven month period beginning in August 2016 through February 2017,imports from Italy accounted for 4.4 percent of total imports; these subject imports from Italyincreased on a monthly basis throughout the negligibility period.95 We also observe thatsubject imports from Italy account for *** percent of all reported arranged imports for thesecond quarter of 2017.96 In light of the recent upward trend of subject imports from Italy as apercentage of total imports, we find that subject imports from Italy have the potentialimminently to exceed the 3 percent negligibility threshold for purposes of determining threat ofmaterial injury. Therefore, for purposes of our consideration of whether there is a reasonableindication of threat of material injury in the countervailing duty investigation, we considersubject imports from Italy.
(�Continued)Carbon and Alloy Steel Cut to Length Plate from Austria, Belgium, Brazil, China, France, Germany, Italy,Japan, Korea, South Africa, Taiwan, and Turkey, Inv. Nos. 701 TA 559 561 and 731 TA 1317 1328(Preliminary), USITC Pub. 4615 at 22 23 (May 2016).
91 CR/PR at IV 1.92 Official import statistics for wire rod were based on thirteen HTS statistical reporting numbers
under which wire rod imports typically entered the United States. Importers were asked to report datafor imports of wire rod under these HTS numbers and to report separately imports of wire rod thatentered under other HTS numbers. Few imports were reported under other HTS numbers, and suchimports did not materially impact each individual subject country�s share of imports. CR at IV 6 n.6, PRat IV 6 n.6.
93 See 19 U.S.C. § 1677(24)(A)(iv).94 CR/PR at Table IV 4.95 CR/PR at Table IV 4.96 CR/PR at Table VII 37.

CVI.
Foindicatiorequireswere filecompetewhetherCommiss
(1
(2
(3
(4
Wexclusivedeterminproduct.9
97
731 TA 27Supp. 898
98
99
(�URAA�),which theNo. 103 3v. Unitedproducts tare not re
Cumulation
or purposesn of materiathe Commisd and/or inve with each osubject impsion general
1) the decountincludqualit
2) the prsubjec
3) the eximpor
4) wheth
While no singe, these factoning whethe98 Only a �re
7 See Certain C78 80 (Final),8 (Ct. Int�l Tra8 See, e.g.,Wi9 The Stateme, expressly stae statutory re316, Vol. I at 8States, 33 F.to be highly fequired.�).
n
of evaluatinal injury by rssion to cumvestigationsother and wiports competly has consid
egree of funries and betding considey related qu
resence of sact imports fr
xistence of crts from diffe
her the subje
gle factor is nors are intenr the subjeceasonable o
Cast Iron PipeUSITC Pub. 1de), aff�d, 859ieland Werke,ent of Adminiates that �thequirement is848 (1994) (ciSupp. 2d 108fungible�);W
ng the volumeason of sub
mulate subjecself initiatedith the domete with eachdered four fa
gibility betwtween subjecration of speuestions;
ales or offerrom differen
common or serent countr
ect imports a
necessarily dnded to provt imports coverlap� of co
e Fittings from1845 (May 199 F.2d 915 (Fe, AG v. Unitedstrative Actioe new sectionsatisfied if thiting Fundicao2, 1087 (Ct. I
Wieland Werke
18
me and effecbject importct imports frd by Commeestic like proh other and wactors:
ween subjectct imports aecific custom
rs to sell in thnt countries
similar channries and the
are simultan
determinativvide the Comompete withompetition i
m Brazil, the R86), aff�d, Funed. Cir. 1988)d States, 718on (�SAA�) ton will not affehere is a reasoo Tupy, 678 Fnt�l Trade 199e, 718 F. Supp
cts for a detets, section 77rom all counerce on the soduct in thewith the dom
t imports frond the dommer requirem
he same geoand the dom
nels of distridomestic lik
neously pres
ve, and the lmmission witeach otheris required.9
Republic of Kondicao Tupy,).F. Supp. 50 (Cthe Uruguay
ect current Coonable overlaF. Supp. at 90298) (�cumulap. at 52 (�Com
ermination o71(7)(G)(i) ontries as to wsame day, ifU.S. marketmestic like p
om differentestic like proments and o
ographic mamestic like p
ibution for ske product;
sent in the m
list of factorth a framewand with th
99
orea, and TaiS.A. v. United
Ct. Int�l Tradey Round Agreeommission prap of competi2); see Goss Gtion does not
mpletely over
of reasonablof the Tariff Awhich petitiosuch importt. In assessinproduct, the
toduct,ther
rkets ofroduct;
subjectand
market.97
s is notwork fore domestic
iwan, Inv. Nosd States, 678
e 1989).ements Actactice underition.� H.R. RGraphic Sys.,t require twolapping mark
eActonstsng
like
s.F.
Rep.Inc.
kets

19
Arguments of the Parties
Petitioners argue that the Commission should cumulatively assess imports from allsubject countries as it did in the prior investigations and reviews involving wire rod.100 Theycontend that the petitions against all ten countries were filed simultaneously on the same dayand the record demonstrates a reasonable overlap in competition, and that cumulation for allten subject countries is therefore mandatory.101 Petitioners discount respondents� contentionthat there is limited competition between the domestic like product and imports of high carbontire cord and tire bead wire rod from Korea, the United Kingdom, and Spain and suspensionspring wire rod from Spain, arguing that the domestic industry also produces these products.102
They observe that, in any event, subject imports from each subject country and the domesticlike product competed ***.103
The Spanish respondents argue that the Commission should not cumulate subjectimports from Spain with other subject imports because they consisted primarily of specializedproducts requiring qualification and certification.104 Specifically, *** percent of imports fromSpain were of suspension spring wire rod and over *** percent of such imports were of tirecord and tire bead wire rod, products which Spanish respondents assert �virtually no� U.S. wirerod producers are qualified to supply.105 They maintain that the vast majority of domesticallyproduced wire rod and wire rod imported from other subject countries consist of standardquality industrial wire rod, which is not interchangeable with specialty wire rod.106 The Spanishrespondents also argue that subject imports from Spain were sold to limited geographicmarkets *** using different channels of distribution (exclusively to end users).107
Analysis and Conclusion
We consider subject imports from Belarus, Italy, Korea, Russia, South Africa, Spain,Turkey, Ukraine, the United Arab Emirates, and the United Kingdom on a cumulated basis
100 Petitions, Vol. I at 19 23; Gerdau, Keystone, and Charter Steel Postconf. Br. at 8 12; NucorPostconf. Br. at 5.
101 Gerdau, Keystone, and Charter Steel Postconf. Br. at 8 10; Nucor Postconf. Br. at 5.102 Gerdau, Keystone, and Charter Steel Postconf. Br. at 12 14; Nucor Postconf. Br. at 5.103 Gerdau, Keystone, and Charter Steel Postconf. Br. at 13; Nucor Postconf. Br. at 5.104 Spanish Respondents Postconf. Br. at 9 13, 18 23. The Spanish respondents state that the
qualification process is a rigorous and lengthy process which entails providing samples, undergoing anaudit with the original equipment manufacturer (�OEM�), a trial evaluation with the OEM, productvalidation, and multiple follow up steps. Spanish Respondents Postconf. Br. at 6 7. After the wire rodmill qualifies as a supplier to the OEM, the OEM, in turn, must go through the Automotive IndustryAction Group Production Part Approval Process. See id. at 7.
105 Spanish Respondents Postconf. Br. at 7 11. The Spanish respondents acknowledge, however,that *** are qualified suppliers of wire rod to *** of suspension spring coils, and that ***. See id. at 7.They further acknowledge that *** domestic producers reported shipments of tire cord or tire beadwire rod in 2016. See id. at 23 24.
106 Spanish Respondents Postconf. Br. at 11 12.107 Spanish Respondents Postconf. Br. at 14 17.

20
because the statutory criteria for cumulation are satisfied. As an initial matter, petitioners filedthe antidumping/countervailing duty petitions with respect to all sources of subject imports onthe same day, March 28, 2017.108 Additionally, as discussed below, the record supports findinga reasonable overlap of competition among wire rod produced in Belarus, Italy, Korea, Russia,South Africa, Spain, Turkey, Ukraine, the United Arab Emirates, the United Kingdom, and theUnited States.
Fungibility. Subject imports from each subject country are generally interchangeablewith the domestically produced product. All domestic producers and at least half of respondingimporters reported that imports from the individual subject countries are always or frequentlyinterchangeable with each other and the domestic like product.109 In particular, a majority ofboth domestic producers and importers found subject imports from Spain always or frequentlyinterchangeable with the domestic like product,110 and majorities of domestic producers and atleast half of importers found subject imports from Spain always or frequently interchangeablewith imports from each other subject country.111 Although the types and qualities of importedwire rod vary to some extent among subject sources, generally, wire rod is imported within thesame range of grades.112 There is substantial product overlap of shipments of the domestic likeproduct and subject imports, and between subject imports from each subject country. In 2016,low carbon industrial wire rod accounted for 56.2 percent of total U.S. shipments of thedomestic like product and at least *** percent of total U.S. shipments of wire rod from nine ofthe ten subject countries.113 Each subject country shipped some volume of this product.114
The Spanish respondents argue that subject imports from Spain, which consist primarilyof suspension spring wire rod and tire cord and tire bead wire rod, are not fungible with thedomestic like product and have limited fungibility with imports from other subject countries.We acknowledge that there are some differences in product mix imported from Spain and thatlow carbon industrial wire rod accounted for a lower percentage of U.S. shipments of subjectimports from Spain (*** percent) in 2016 than it did for any other subject country.115
Nevertheless, there is sufficient overlap with the domestic like product and imports from othersubject countries to support a finding of fungibility. The record indicates that the domesticindustry produced and shipped appreciable quantities of tire cord and tire bead wire rod andsuspension spring wire rod during the period of investigation.116 There were also appreciable
108 None of the statutory exceptions to cumulation applies. We observe that while allegedlysubsidized subject imports from Italy are not eligible for cumulation for the material injury analysisbecause of our negligibility finding, allegedly dumped subject imports from Italy are eligible forcumulation.
109 CR/PR at Tables II 4(a) 4(b).110 CR/PR at Table II 4(a).111 CR/PR at Table II 4(b).112 CR/PR at Table IV 5.113 CR/PR at Tables III 6 & IV 5.114 CR at IV 9, PR at IV 9.115 CR/PR at Table IV 5.116 In 2016, Evraz and Keystone shipped *** short tons of tire cord and tire bead wire rod.
CR/PR at Table III 6; Evraz U.S. Producer Questionnaire Response at II 10 (Apr. 11, 2017); Keystone U.S.(Continued�)

21
quantities of tire cord and tire bead wire rod imported from Korea and the United Kingdom thatcompeted with the product imported from Spain.117 Moreover, there were modest quantitiesof low carbon industrial wire rod being imported from Spain into the U.S. market.118 Indeed,the record permits some comparisons of pricing product 3 from Spain (an industrial qualitymesh product) with both the domestic like product and imports from eight other subjectcountries.119
Although the record indicates varying degrees of overlap in product mix, on balance, therecord indicates a reasonable level of fungibility between and among the domestic like productand wire rod from each subject source.
Channels of Distribution. Domestic producers and importers sold wire rod todistributors and end users. In 2016, the majority of domestic producers� U.S. shipments of wirerod ***, as well as substantial portions of U.S. shipments of imports of wire rod from Belarus***, Korea ***, Russia ***, Spain ***, Turkey ***, and Ukraine *** were sold to end users.120
Appreciable proportions of shipments of the domestic like product *** and of imports fromBelarus ***, Korea ***, and Turkey ***, and the great majority of shipments of imports fromItaly ***, South Africa ***, the United Arab Emirates ***, and the United Kingdom *** weresold to distributors.
Geographic Overlap. Domestically produced wire rod is sold in all six regions in thecontiguous United States.121 Subject imports are also sold to all six regions, but areconcentrated in the Southeast, Midwest, and Central Southwest regions.122
Simultaneous Presence in Market. Import data show that the domestic like product andwire rod imported from all subject countries have been present in the U.S. market during both2015 and 2016.123
Conclusion. The record supports finding that subject imports from each subject countryare fungible with the domestic like product and each other, that subject imports from eachsubject country and the domestic like product are sold in similar channels of distribution and insimilar geographic markets, and have been simultaneously present in the U.S. market. In light
(�Continued)Producer Questionnaire Response at II 10 (Apr. 5, 2017); Gerdau, Keystone, and Charter Steel Postconf.Br. at Ex. 8., Ex. 11.
Also during this period, Charter Steel produced and shipped suspension spring wire rod. CharterSteel U.S. Producer Questionnaire Response at II 10 (Apr. 6, 2017); Gerdau, Keystone, and Charter SteelPostconf. Br. at Ex. 11.
117 CR/PR at Table IV 5. In 2016, there were *** short tons of U.S. shipments of tire cord andtire bead wire rod imported from Spain compared to *** short tons of U.S. shipments of tire cord andtire bead wire rod imported from Korea and *** short tons of U.S. shipments of this product importedfrom the United Kingdom. See id.
118 CR/PR at Table IV 5.119 CR at Table V 5.120 CR/PR at Table II 1.121 CR/PR at Table II 2.122 CR/PR at Table II 2.123 CR/PR at Table IV 2.

of the fodomesticsubject c
RVII.
Le
InCommissStates isinvestigasubject imdomesticoperatioimmaterdomesticeconomiis disposiand cond
Areasonabtraded iminjury ana causalCommisseffects oindustry.
12
27, amendindicationrespects.
12
relevant tto the det
12
12
12
12
13
does not951 (Ct. In
regoing, wec like produccountry.
Reasonable
egal Standa
n the prelimision determimaterially ination.124 In mmports, theic producersns.125 The stial, or unimpc industry isc factors thaitive, and allditions of coAlthough theble indicatiomports,129 italysis is leftlink, if any, bsion examinef the subjectThis evalua
24 19 U.S.C. §§ded the provn of material iWe have app
25 19 U.S.C. §to the determtermination.�26 19 U.S.C. §27 19 U.S.C. §28 19 U.S.C. §29 19 U.S.C. §§30 Angus Chem�compel the cnt�l Trade 199
find that thct and impor
e Indicatio
rd
inary phaseines whethenjured or thrmaking this dir effect on pof the dometatute definportant.�126
materially inat bear on threlevant facmpetition thstatute reqn that the dodoes not deto the Commbetween subes the facts ot imports anation under t
§ 1671b(a), 16isions of the Tinjury and thrplied these am1677(7)(B). T
mination� but� 19 U.S.C. §1677(7)(A).1677(7)(C)(iii1677(7)(C)(iii§ 1671b(a), 16mical Co. v. Uncommissioner96).
ere is a reasrts from eac
n of Mate
of antidumper there is a rreatened wideterminatioprices for theestic like proes �materialIn assessingnjured by rehe state of thctors are conhat are distinuires the Coomestic induefine the phrmission�s reabject importof record thnd any impacthe �by reas
673b(a). TheTariff Act perreat of matermendments hThe Commissshall �identif1677(7)(B).
).).673b(a).nited States,rs� to employ
22
onable overh subject co
rial Injury
ping and coureasonable ith material ion, the Come domestic loduct, but onl injury� as �g whether thason of subjhe industry insidered �wnctive to themmission toustry is �matrase �by reasasonable exes and materat relate to tct of those imson of� stand
Trade Prefertaining to Corial injury by rhere.ion �may confy each {such}
140 F.3d 147y {a particular
rlap of compountry and b
by Reason
untervailingindication thinjury by reamission musike product,nly in the co�harm whichhere is a reasject importsin the Uniteithin the cone affected ino determineterially injurson of,� indiercise of itsrial injury tothe significamports on thdard must e
rences Extensmmission detreason of sub
nsider such ot} factor ... {a}
78, 1484 85 (Fr methodolog
petition betwetween imp
n of Subjec
duty investihat an industason of the ist consider t, and their imntext of U.Sh is not inconsonable indi, we consided States.127
ntext of thedustry.�128
whether thred by reasocating that tdiscretion.13
the domestance of the vhe conditionnsure that s
sion Act of 20terminationsbject imports
ther economind explain in
Fed. Cir. 1998gy}.�), aff�g 94
ween theports from ea
ct Imports
gations, thetry in the Unmports undthe volume ompact on. productionnsequential,ication that ter all relevanNo single fabusiness cyc
ere is an of� unfairlthis aspect o30 In identifyic industry, tvolume and pn of the domsubject impo
015, Pub. L. 1of reasonablin certain
ic factors as afull its releva
8) (�{T}he stat44 F. Supp. 94
ach
s
nitederof
n
thentactorcle
lyof theyingtheprice
mesticorts
14le
areance
tute43,

23
are more than a minimal or tangential cause of injury and that there is a sufficient causal, notmerely a temporal, nexus between subject imports and material injury.131
In many investigations, there are other economic factors at work, some or all of whichmay also be having adverse effects on the domestic industry. Such economic factors mightinclude nonsubject imports; changes in technology, demand, or consumer tastes; competitionamong domestic producers; or management decisions by domestic producers. The legislativehistory explains that the Commission must examine factors other than subject imports toensure that it is not attributing injury from other factors to the subject imports, therebyinflating an otherwise tangential cause of injury into one that satisfies the statutory materialinjury threshold.132 In performing its examination, however, the Commission need not isolatethe injury caused by other factors from injury caused by unfairly traded imports.133 Nor does
131 The Federal Circuit, in addressing the causation standard of the statute, has observed that�{a}s long as its effects are not merely incidental, tangential, or trivial, the foreign product sold at lessthan fair value meets the causation requirement.� Nippon Steel Corp. v. USITC, 345 F.3d 1379, 1384(Fed. Cir. 2003). This was re affirmed inMittal Steel Point Lisas Ltd. v. United States, 542 F.3d 867, 873(Fed. Cir. 2008), in which the Federal Circuit, quoting Gerald Metals, Inc. v. United States, 132 F.3d 716,722 (Fed. Cir. 1997), stated that �this court requires evidence in the record �to show that the harmoccurred �by reason of� the LTFV imports, not by reason of a minimal or tangential contribution tomaterial harm caused by LTFV goods.�� See also Nippon Steel Corp. v. United States, 458 F.3d 1345,1357 (Fed. Cir. 2006); Taiwan Semiconductor Industry Ass�n v. USITC, 266 F.3d 1339, 1345 (Fed. Cir.2001).
132 SAA, H.R. Rep. 103 316, Vol. I at 851 52 (1994) (�{T}he Commission must examine otherfactors to ensure that it is not attributing injury from other sources to the subject imports.�); S. Rep.96 249 at 75 (1979) (the Commission �will consider information which indicates that harm is caused byfactors other than less than fair value imports.�); H.R. Rep. 96 317 at 47 (1979) (�in examining theoverall injury being experienced by a domestic industry, the ITC will take into account evidencepresented to it which demonstrates that the harm attributed by the petitioner to the subsidized ordumped imports is attributable to such other factors;� those factors include �the volume and prices ofnonsubsidized imports or imports sold at fair value, contraction in demand or changes in patterns ofconsumption, trade restrictive practices of and competition between the foreign and domesticproducers, developments in technology and the export performance and productivity of the domesticindustry�); accord Mittal, 542 F.3d at 877.
133 SAA at 851 52 (�{T}he Commission need not isolate the injury caused by other factors frominjury caused by unfair imports.�); Taiwan Semiconductor , 266 F.3d at 1345. (�{T}he Commission neednot isolate the injury caused by other factors from injury caused by unfair imports ... . Rather, theCommission must examine other factors to ensure that it is not attributing injury from other sources tothe subject imports.� (emphasis in original)); Asociacion de Productores de Salmon y Trucha de Chile AGv. United States, 180 F. Supp. 2d 1360, 1375 (Ct. Int�l Trade 2002) (�{t}he Commission is not required toisolate the effects of subject imports from other factors contributing to injury� or make �bright linedistinctions� between the effects of subject imports and other causes.); see also Softwood Lumber fromCanada, Inv. Nos. 701 TA 414 and 731 TA 928 (Remand), USITC Pub. 3658 at 100 01 (Dec. 2003)(Commission recognized that �{i}f an alleged other factor is found not to have or threaten to haveinjurious effects to the domestic industry, i.e., it is not an �other causal factor,� then there is nothing tofurther examine regarding attribution to injury�), citing Gerald Metals, 132 F.3d at 722 (the statute�does not suggest that an importer of LTFV goods can escape countervailing duties by finding some(Continued�)

24
the �by reason of� standard require that unfairly traded imports be the �principal� cause ofinjury or contemplate that injury from unfairly traded imports be weighed against other factors,such as nonsubject imports, which may be contributing to overall injury to an industry.134 It isclear that the existence of injury caused by other factors does not compel a negativedetermination.135
Assessment of whether material injury to the domestic industry is �by reason of� subjectimports �does not require the Commission to address the causation issue in any particular way�as long as �the injury to the domestic industry can reasonably be attributed to the subjectimports� and the Commission �ensure{s} that it is not attributing injury from other sources tothe subject imports.�136 Indeed, the Federal Circuit has examined and affirmed variousCommission methodologies and has disavowed �rigid adherence to a specific formula.�137
The Federal Circuit�s decisions in Gerald Metals, Bratsk, andMittal all involved cases inwhich the relevant �other factor� was the presence in the market of significant volumes ofprice competitive nonsubject imports. The Commission interpreted the Federal Circuit�sguidance in Bratsk as requiring it to apply a particular additional methodology following itsfinding of material injury in cases involving commodity products and a significant marketpresence of price competitive nonsubject imports.138 The additional �replacement/benefit�test looked at whether nonsubject imports might have replaced subject imports without anybenefit to the U.S. industry. The Commission applied that specific additional test in subsequentcases, including the Carbon and Certain Alloy Steel Wire Rod from Trinidad and Tobagodetermination that underlies theMittal litigation.
Mittal clarifies that the Commission�s interpretation of Bratsk was too rigid and makesclear that the Federal Circuit does not require the Commission to apply an additional test norany one specific methodology; instead, the court requires the Commission to have �evidence inthe record �to show that the harm occurred �by reason of� the LTFV imports,�� and requires that
(�Continued)tangential or minor cause unrelated to the LTFV goods that contributed to the harmful effects ondomestic market prices.�).
134 S. Rep. 96 249 at 74 75; H.R. Rep. 96 317 at 47.135 See Nippon, 345 F.3d at 1381 (�an affirmative material injury determination under the
statute requires no more than a substantial factor showing. That is, the �dumping� need not be the soleor principal cause of injury.�).
136 Mittal, 542 F.3d at 877 78; see also id. at 873 (�While the Commission may not enter anaffirmative determination unless it finds that a domestic industry is materially injured �by reason of�subject imports, the Commission is not required to follow a single methodology for making thatdetermination ... {and has} broad discretion with respect to its choice ofmethodology.�) citing UnitedStates Steel Group v. United States, 96 F.3d 1352, 1362 (Fed. Cir. 1996) and S. Rep. 96 249 at 75. In itsdecision in Swiff Train v. United States, 792 F.3d 1355 (Fed. Cir. 2015), the Federal Circuit affirmed theCommission�s causation analysis as comporting with the Court�s guidance inMittal.
137 Nucor Corp. v. United States, 414 F.3d 1331, 1336, 1341 (Fed. Cir. 2005); see also Mittal, 542F.3d at 879 (�Bratsk did not read into the antidumping statute a Procrustean formula for determiningwhether a domestic injury was �by reason� of subject imports.�).
138 Mittal, 542 F.3d at 875 79.

25
the Commission not attribute injury from nonsubject imports or other factors to subjectimports.139 Accordingly, we do not consider ourselves required to apply thereplacement/benefit test that was included in Commission opinions subsequent to Bratsk.
The progression of Gerald Metals, Bratsk, andMittal clarifies that, in cases involvingcommodity products where price competitive nonsubject imports are a significant factor in theU.S. market, the Court will require the Commission to give full consideration, with adequateexplanation, to non attribution issues when it performs its causation analysis.140
The question of whether the material injury threshold for subject imports is satisfiednotwithstanding any injury from other factors is factual, subject to review under the substantialevidence standard.141 Congress has delegated this factual finding to the Commission becauseof the agency�s institutional expertise in resolving injury issues.142
Conditions of Competition and the Business Cycle
The following conditions of competition inform our analysis of whether there is areasonable indication of material injury by reason of subject imports.
1. Captive Production Provision
The domestic industry captively consumes a portion of its production of the domesticlike product in the manufacture of downstream articles. Accordingly, we have consideredwhether the statutory captive production provision requires us to focus our analysis primarily
139 Mittal, 542 F.3d at 873 (quoting from Gerald Metals, 132 F.3d at 722), 875 79 & n.2(recognizing the Commission�s alternative interpretation of Bratsk as a reminder to conduct a nonattribution analysis).
140 To that end, after the Federal Circuit issued its decision in Bratsk, the Commission began topresent published information or send out information requests in the final phase of investigations toproducers in nonsubject countries that accounted for substantial shares of U.S. imports of subjectmerchandise (if, in fact, there were large nonsubject import suppliers). In order to provide a morecomplete record for the Commission�s causation analysis, these requests typically seek information oncapacity, production, and shipments of the product under investigation in the major source countriesthat export to the United States. The Commission plans to continue utilizing published or requestedinformation in the final phase of investigations in which there are substantial levels of nonsubjectimports.
141 We provide in our respective discussions of volume, price effects, and impact a full analysis ofother factors alleged to have caused any material injury experienced by the domestic industry.
142 Mittal, 542 F.3d at 873; Nippon, 458 F.3d at 1350, citing U.S. Steel, 96 F.3d at 1357; S. Rep.96 249 at 75 (�The determination of the ITC with respect to causation is ... complex and difficult, and is amatter for the judgment of the ITC.�).

26
on the merchant market when assessing market share and the factors affecting the financialperformance of the domestic industry.143 144
Petitioners maintain that the criteria for applying the captive production provision areclearly satisfied, and that therefore the Commission should focus primarily on the merchantmarket in analyzing the market share and financial performance of the U.S. industry.145 Noneof the respondents directly address the applicability of the captive production provision.146
Threshold Criterion. The captive production provision can be applied only if, as athreshold matter, significant production of the domestic like product is internally transferredand significant production is sold in the merchant market. In these investigations, internalconsumption accounted for between 27.6 percent and 30.0 percent of U.S. producers� U.S.shipments of wire rod between 2014 and 2016.147 Commercial shipments accounted forbetween 69.0 percent and 71.2 percent of the domestic industry�s U.S. shipments in thisperiod.148 We find that both the internal consumption and merchant market segmentsconstitute significant portions of the market.
First Statutory Criterion. The first criterion tests whether the domestic like productproduced that is internally transferred for processing into downstream articles does not enterthe merchant market for the domestic like product.149 No domestic producers in these
143The captive production provision, 19 U.S.C. § 1677(7)(C)(iv), provides:
(iv) CAPTIVE PRODUCTION �If domestic producers internally transfer significant
production of the domestic like product for the production of a downstream article andsell significant production of the domestic like product in the merchant market, and the
Commission finds that �
(I) the domestic like product produced that is internally transferred forprocessing into that downstream article does not enter the merchant market forthe domestic like product, and(II) the domestic like product is the predominant material input in theproduction of that downstream article;
then the Commission, in determining market share and the factors affecting financialperformance set forth in clause (iii), shall focus primarily on the merchant market forthe domestic like product.
144 The Trade Preferences Extension Act of 2015 eliminated what had been the third statutorycriterion of the captive production provision. Pub. L. 114 27, § 503(c).
145 Gerdau, Keystone, and Charter Steel Postconf. Br. at 21 23; Nucor Postconf. Br. at 5.146 The Turkish respondents acknowledge that petitioners are vertically integrated and that their
wire rod mills produce wire rod that is used to feed their downstream wire operations. TurkishRespondents Postconf. Br. at 3.
147 CR/PR at Table III 5.148 CR/PR at Table III 5.149 See Raw Flexible Magnets from China and Taiwan, Inv. Nos. 701 TA 452 and 731 TA 1129
1130 (Preliminary), USITC Pub. 3961 at 13 (Nov. 2007) (�No producer reported diverting raw flexiblemagnets intended for internal consumption to the merchantmarket.�).

27
investigations reported diverting wire rod that was to be internally consumed or transferred tothe merchant market.150 This criterion is therefore satisfied.
Second Statutory Criterion. In applying the second statutory criterion, the Commissiongenerally considers whether the domestic like product is the predominant material input into adownstream product by referring to its share of the raw material cost of the downstreamproduct.151 In these investigations, reporting domestic producers indicated that wire rodaccounted for between 60 percent and 87 percent of the finished cost of the downstreamproducts produced from wire rod.152 Because wire rod is the predominant material input intodownstream products, this criterion is also satisfied in these investigations.
Conclusion. We conclude that the criteria for application of the captive productionprovision are satisfied in these investigations and, accordingly, we focus primarily on themerchant market in analyzing the market share and financial performance of the domesticindustry.153 We also have considered the market as a whole and the captive portion of themarket.
2. Demand Conditions
Wire rod is a hot rolled intermediate steel product that is used in a variety ofdownstream products in the construction, automotive, energy, and agriculture industries.154
Consequently, demand for wire rod depends on demand for these downstream products. MostU.S. producers reported that overall demand for wire rod has decreased since January 2014while a plurality of importers reported that demand has increased.155
Apparent U.S. consumption of wire rod decreased by 4.0 percent in the merchantmarket during the period of investigation, falling from 4.44 million short tons in 2014 to 4.39million short tons in 2015 and 4.26 million short tons in 2016.156
150 CR at III 13, PR at III 7.151 See 19 U.S.C. § 1677(7)(C)(iv)(II).152 CR at III 14, PR at III 8.153 In the 2014 15 investigations of wire rod from China, which involved the same domestic like
product and essentially the same domestic industry as these investigations, the Commission found thethreshold criterion, as well as the first and second statutory criteria, were satisfied. However, theCommission did not apply the captive production provision because it concluded that the third statutorycriterion was not satisfied. Carbon and Certain Alloy Steel Wire Rod from China, Inv. Nos. 701 TA 512and 731 TA 1248 (Final), USITC Pub. 4509 at 11 12 (Jan. 2015). As previously discussed, the TradePreferences Extension Act of 2015 subsequently eliminated the third statutory criterion.
154 CR at II 1, PR at II 1.155 CR at II 12, PR at II 8.156 CR/PR at Table IV 8. Apparent U.S. consumption in the overall market decreased by 2.2
percent, falling from 5.45 million short tons in 2014 to 5.44 million short tons in 2015 and 5.33 millionshort tons in 2016. CR/PR at Table IV 8.

28
3. Supply Conditions
The domestic industry was the largest supplier of wire rod to the U.S. market during theperiod of investigation, although its share of apparent U.S. consumption in the merchantmarket decreased from 59.2 percent in 2014 to 59.0 percent in 2015 and 58.0 percent in2016.157
In 2014, there were ten U.S. producers of wire rod, with seven of these firms internallytransferring some wire rod to produce downstream products.158 During the course of theperiod of investigation, two domestic producers ceased production; in August 2015,ArcelorMittal closed its mill in Georgetown, South Carolina, and in March 2016, Republic Steelshuttered its wire rod operations in Lorain, Ohio.159 Although ArcelorMittal�s closure reduceddomestic industry capacity by *** short tons, two domestic producers, ***, expanded theiroperations adding *** short tons and *** short tons of capacity, respectively.160 Overall, thedomestic industry�s capacity declined by 5.2 percent between 2014 and 2016.161 Petitionersmaintain that the domestic industry has ample capacity to meet demand for wire rod in theU.S. market and that it produces the entire product line of wire rod.162
Nonsubject imports were the next largest source of supply in the U.S. market after thedomestic industry. Nonsubject imports declined from 30.6 percent of apparent U.S.consumption in the merchant market in 2014 to 25.6 percent in 2015 and 25.3 percent in2016.163 During the period of investigation, wire rod imports from China were the subject ofantidumping and countervailing duty investigations and in January 2015, antidumping andcountervailing duty orders were imposed covering these imports.164 Consequently, wire rodimports from China decreased from 374,785 short tons in 2014 to 1,672 short tons in 2015 and44 short tons in 2016.165 Antidumping duty orders have also been in place since 2002 on wirerod imports from Brazil, Indonesia, Mexico, Moldova, and Trinidad and Tobago, as well as acountervailing duty order on wire rod imports from Brazil.166 In 2016, the largest source of
157 CR/PR at Table IV 9. The domestic industry supplied 66.9 percent of apparent U.S.consumption in the overall market in 2014 and 2015 and 66.4 percent in 2016. See id.
158 CR/PR at Table III 1; CR at III 13, PR at III 7.159 Gerdau, Keystone, and Charter Steel Postconf. Br. at 35 36; Nucor Postconf. Br. at 5.
Republic Steel provided a questionnaire response but it was not usable. CR at III 1 n.1, PR at III 1 n.1.160 CR at II 4 n.2; PR at II 2 n.2.161 CR at III 5, PR at III 2 3. Capacity declined from 4.9 million short tons in 2014 and 2015 to 4.6
million short tons in 2016. CR/PR at Table III 3.162 Gerdau, Keystone, and Charter Steel Postconf. Br. at 19; Nucor Postconf. Br. at 5.163 CR/PR at Table IV 9. In the market as a whole, nonsubject imports� share of apparent U.S.
consumption was 24.9 percent in 2014, 20.7 percent in 2015, and 20.2 percent in 2016. See id.164 Carbon and Certain Alloy Steel Wire Rod from China, 80 Fed. Reg. 1015 (Jan. 8, 2015)
(antidumping duty order); Carbon and Certain Alloy Steel Wire Rod from China, 80 Fed. Reg. 1018 (Jan. 8,2015) (countervailing duty order).
165 Working Table 1, EDIS Doc. No. 611872.166 CR/PR at Table I 1.

29
nonsubject imports was Canada, which accounted for 51.3 percent of nonsubject imports and30.9 percent of all wire rod imports in that year.167
Cumulated subject imports were the third largest source of supply to the U.S. marketafter the domestic industry and nonsubject imports. Cumulated subject imports� share ofapparent U.S. consumption in the merchant market increased from 10.2 percent in 2014 to15.4 percent in 2015 and 16.7 percent in 2016.168
4. Substitutability
As previously stated, all domestic producers and the majority of responding importersreported that imports from the subject countries are always or frequently interchangeable withthe domestic like product.169 The domestic like product and cumulated subject importscompete with one another in a range of products, but particularly in the industrial/standardquality wire rod category, which in 2016 accounted for *** percent of the domestic industry�scommercial U.S. shipments and 76.7 percent of U.S. shipments of cumulated subject imports.170
The record also indicates that price is an important consideration for purchasers of wirerod. Most U.S. producers reported that differences other than price were never important inpurchasing decisions.171 Although some importers reported that factors other than price areimportant in purchasing decisions, at least half reported that such factors are only sometimesor never important.172 Purchasers responding to the lost sales lost revenue survey listedprice/total cost second most frequently when identifying the three most important factors inpurchasing decisions.173
We consequently find that subject imports and the domestically produced product ofthe same type are highly substitutable and that price plays an important role in purchasingdecisions.174
5. Other Conditions
Raw material costs accounted for a substantial portion of the domestic industry�s cost ofgoods sold (�COGS�) in the merchant market during the period of investigation, ranging from a
167 CR at II 8, PR at II 5.168 CR/PR at IV 9. In the total market, cumulated subject imports� share of apparent U.S.
consumption increased from 8.3 percent in 2014 to 12.4 percent in 2015 and 13.4 percent in 2016. Seeid.
169 CR/PR at Table II 4(a).170 CR/PR at Tables III 6 & IV 5.171 CR/PR at Table II 5a.172 CR/PR at Table II 5a.173 CR at II 15, PR at II 9.174 CR at II 13, PR at II 8. Substitutability between industrial quality wire rod and higher end
wire rod products is more limited. See id.

30
high of 64.1 percent in 2014 to a low of 54.1 percent in 2016.175 Steel scrap is the primary rawmaterial input to manufacture wire rod.176 Different types and quantities of steel scrap areused depending on the type and quality of wire rod being produced; a larger amount of heavymelt scrap is used to produce industrial grade wire rod while more busheling scrap is used toproduce higher end grades of wire rod.177 Between January 2014 and December 2016, theaverage prices of heavy melt scrap, busheling scrap, and shredded auto scrap reported inAmerican Metal Market declined by 43.3 percent, 39.3 percent, and 39.8 percent,respectively.178
Most domestic producers and most importers report that they include scrap costs intheir wire rod prices.179 One domestic producer and some importers report adding a separateraw material surcharge for scrap costs.180 Purchasers state that price negotiations for wire rodbegin with references to steel scrap prices published in indices such as the American MetalMarket.181
Volume of Subject Imports
Section 771(7)(C)(i) of the Tariff Act provides that the �Commission shall considerwhether the volume of imports of the merchandise, or any increase in that volume, either inabsolute terms or relative to production or consumption in the United States, is significant.�182
Cumulated subject imports had a significant and increasing presence in the U.S. marketduring the period of investigation. Cumulated subject import volume increased from 450,414short tons in 2014 to 677,254 short tons in 2015 and 712,279 short tons in 2016, a level 58.1percent higher than in 2014.183 Cumulated subject imports increased their share of apparentU.S. consumption in the merchant market from 10.2 percent in 2014 to 15.4 percent in 2015and 16.7 percent in 2016.184 This market share gain occurred while nonsubject imports werelosing market share. As discussed above, wire rod imports from China, which became subjectto antidumping and countervailing duty orders in January 2015, decreased precipitously, from374,785 short tons in 2014 to 1,672 short tons in 2015 and 44 short tons in 2016.185 Althoughnonsubject imports from Canada, the largest supplier of nonsubject imports to the United
175 CR/PR at VI 1. In the total market, raw material costs accounted for between 64.6 percentand 54.7 percent of the domestic industry�s COGS during the period of investigation. See id.
176 CR at V 1, PR at V 1.177 CR at V 1, PR at V 1.178 CR at V 2, PR at V 1.179 CR at V 4, PR at V 2.180 CR at V 4, PR at V 2.181 AWPA Postconf. Br. at 10; Hearing Tr. at 105 (Stuaffer), 107 (Moffitt), 108 (Johnson).182 19 U.S.C. § 1677(7)(C)(i).183 CR/PR at Table IV 8, Table C 1.184 CR/PR at Table IV 9. Cumulated subject imports also increased as a share of apparent U.S
consumption in the overall market, increasing from 8.3 percent in 2014 to 12.4 percent in 2015 and 13.4percent in 2016. See id.
185 Working Table 1, EDIS Doc. No. 611872.

31
States during the period of investigation,186 increased, the market share held by nonsubjectimports in the merchant market decreased from 30.6 percent in 2014 to 25.6 percent in 2015and 25.3 percent in 2016.187 The domestic industry�s share of apparent U.S. consumption in themerchant market also fell from 59.2 percent in 2014 to 59.0 percent in 2015 and 58.0 percentin 2016.188
The Turkish respondents argue that the increase in volume of cumulated subjectimports was not significant because they merely replaced imports from China and the Britishrespondent argues that the increase in the volume of subject imports during the period ofinvestigation represented a return to their prevailing level of U.S. shipments prior before wirerod from China surged into the U.S. market. 189 As an initial matter, this argument is notrelevant in the context of our statutory inquiry, which concerns whether subject import volumeor the increase in that volume � and not total import volume � is significant.190 Moreover, asdiscussed above in section VII.B.4, cumulated subject imports competed directly withdomestically produced wire rod during the period of investigation. Indeed, subject imports didnot merely replace nonsubject imports from China, they also took market share from thedomestic industry in the merchant market where the products competed.
Based on the current record, for purposes of these preliminary determinations, we findthat the volume of cumulated subject imports from Belarus, Italy, Korea, South Africa, Spain,Turkey, Ukraine, United Arab Emirates, and the United Kingdom and the increase in thatvolume are significant both in absolute terms and relative to consumption in the United States.
Price Effects of the Subject Imports
Section 771(7)(C)(ii) of the Tariff Act provides that, in evaluating the price effects ofsubject imports, the Commission shall consider whether �
(I) there has been significant price underselling by the imported merchandise ascompared with the price of domestic like products of the United States, and
(II) the effect of imports of such merchandise otherwise depresses prices to asignificant degree or prevents price increases, which otherwise would haveoccurred, to a significant degree.191
186 In 2016, nonsubject imports from Canada accounted for 51.3 percent of nonsubject importsand 30.9 percent of all imports. CR at II 8, PR at II 5.
187 CR/PR at Table IV 9. Nonsubject imports�market share in the overall market decreased from24.9 percent in 2014 to 20.7 percent in 2015 and 20.2 percent in 2016. See id.
188 CR/PR at Table IV 9. The domestic industry�s share of the overall market decreased from66.9 percent in 2014 and 2015 to 66.4 percent in 2016. See id.
189 British Respondent Postconf. Br. at 15; Turkish Respondents Postconf. Br. at 11 12.190 19 U.S.C. § 1677(7)(C)(i).191 19 U.S.C. § 1677(7)(C)(ii).
32
As stated above, the current record indicates a high degree of substitutability amongsubject imports and the domestically produced product produced to the same specificationsand that price is an important consideration in purchasing decisions. Moreover, both thedomestic like product and the cumulated subject imports are concentrated in the industrialquality grades.
In the preliminary phase of these investigations, the Commission requested that U.S.producers and importers provide quarterly weighted average sales price data for five wire rodproducts shipped to unrelated U.S. customers between January 2014 and December 2016.192
Eight U.S. producers and 13 importers submitted usable pricing data on sales of the requestedproducts,193 although not all firms reported pricing for all products for all quarters.194
The pricing data show that cumulated subject imports undersold the domestic likeproduct in 132 of 175 price comparisons (involving 892,749 short tons of subject imports) atunderselling margins that ranged from 0.1 percent to 44.5 percent and oversold the domesticindustry�s price in the remaining 43 price comparisons (involving 251,716 short tons of subjectimports) by 0.5 to 51.4 percent.195 We find this underselling to be significant.196
We also examined changes in prices for the domestic like product and cumulatedsubject imports. Prices for the five domestically produced pricing products declined between30.8 percent and 32.7 percent over the period of investigation.197 The Commission did not
192 The pricing products are: (1) industrial quality wire rod, grade 1006, 5.5 mm (7/32 inch)through 12 mm (15/32 inch) thick in diameter; (2) industrial quality wire rod, grades C1008 throughC1010, 5.5 mm (7/32 inch) through 12 mm (15/32 inch) thick in diameter; (3) mesh quality wire rod,grades 1006 through C1015, 5.5 mm (7/32 inch) through 14 mm (9/16 inch) thick in diameter; (4) gradesC1050 through C1070, 5.5 mm (7/32 inch) through 6.5 mm (1/4 inch) diameter for spring applications;and (5) industrial quality wire rod, grades C1060 through C1065, 5.5 mm (7/32 inch) through 17.5 mm(11/16 inch) thick in diameter CR at V 7 8, PR at V 5.
193 CR at V 8, PR at V 6.194 CR at V 8, PR at V 6. The pricing data accounted for approximately 42.9 percent of the
domestic industry�s U.S. shipments, *** percent of subject imports from Belarus, *** percent of subjectimports from Italy, *** percent of subject imports from Korea, *** percent of subject imports fromRussia, *** percent of subject imports from South Africa, *** percent of subject imports from Spain, ***percent of subject imports from Turkey, *** percent of subject imports from Ukraine, *** percent ofsubject imports from the United Arab Emirates, and *** percent of subject imports from the UnitedKingdom in 2016. CR at V 8, PR at V 6.
195 CR at V 26, PR at V 8; CR/PR at Table V 9a.196 We have also considered the results of the lost sales lost revenue survey. The domestic
producers identified 29 firms to which they lost sales or revenue (eight consisted of lost salesallegations, two consisted of lost revenue allegations, and 18 consisted of both types of allegations). CRat V 29, PR at V 10 Of the 22 responding purchasers, 17 reported that they had purchased importedwire rod from the subject countries instead of the domestic like product since 2014 with 11 purchasersstating that price was primary reason for the decision to purchase subject imports instead of thedomestic like product. CR at V 30 31, PR at V 11. Additionally, seven purchasers reported that domesticproducers had reduced prices in order to compete with lower priced imports from the subject countries.CR at V 31, PR at V 11.
197 CR at V 24, PR at V 7; CR/PR at Table V 8.

33
receive enough quarterly instances of price data to show price trends for all countries for allproducts, but for instances in which price data were available for all 12 quarters, subject importprices decreased.198
Respondents argue that declines in steel scrap costs explain the price declines.199 Asdiscussed above, raw material prices fell over the period of investigation.200 While declines inraw material costs certainly contributed to the observed wire rod price declines, on the currentrecord, it is unclear whether they can explain the magnitude of the declines, and the recordsuggests that the increasing volume of low priced subject imports may have also played a rolein these declines. In particular, the declines in U.S. producers� sales AUVs were larger than thedecrease in their raw material costs, but similar to their overall cost declines.201 In any finalphase of these investigations, we will consider the extent to which both the cumulated subjectimports and factors other than cumulated subject imports, such as changes in steel scrap costsand demand, played a role in price declines for wire rod in the U.S. market.
We also considered whether cumulated subject imports prevented increases in prices ofthe domestic like product that otherwise would have occurred to a significant degree. Asdiscussed above, apparent U.S. consumption and raw material costs decreased from 2014 to2016.202 During that time, the domestic industry�s COGS to net sales ratio in the merchantmarket declined from 60.6 percent in 2014 to 55.3 percent in 2015 and 50.3 percent in 2016.203
Unit costs in the merchant market decreased from $678 in 2014 to $559 in 2015 and $493 in2016.204 Because price increases were unlikely in light of apparent consumption trends andfalling costs, we do not find that cumulated subject imports prevented price increases thatotherwise would have occurred to a significant degree.
198 CR at V 24, PR at V 7 8; CR/PR at Table V 8. Specifically, prices of product 1 from Turkeydecreased by *** percent, and prices for product 3 from Spain decreased by *** percent. See id.
199 AWPA Postconf. Br. at 10 13; British Respondent Postconf. Br. at 8 10; Korean RespondentPostconf. Br. at 26 27; Turkish Respondents Postconf. Br. at 13; Ukrainian Respondents Postconf. Br. at2 3, 6 7.
200 CR/PR at Table VI 1.201 CR/PR at Table VI 2. The AUV of the industry�s commercial sales declined by $187 per ton
from 2014 to 2016, while the industry�s raw material costs declined by $168 per ton over the sameperiod; in the overall market, the AUV of the industry�s total net sales declined by $177 per ton, whilethe industry�s raw material costs declined by $165 per ton. See id. However, the industry�s averageCOGS in the merchant market declined by $185 per ton, similar to the AUV decline of $187 per ton forcommercial sales from 2014 to 2016; in the overall market, the industry�s average COGS declined by$181 per ton, slightly more than the $177 per ton decline in total net sales AUV. See id. We also notethat the percentage declines in U.S. prices for pricing products were less severe than the declines in rawmaterial prices. CR/PR at Figure V 1 and Table V 8.
202 CR/PR at Table IV 9, Table VI 1.203 CR/PR at Table VI 1. In the total market, the domestic industry�s COGS to net sales ratio
decreased from 61.2 percent in 2014 to 55.6 percent in 2015 and 50.3 percent in 2016. See id.204 CR/PR at Table VI 1. In the total market, the domestic industry�s unit costs decreased from
$660 in 2014 to $539 in 2015 and $479 in 2016. See id.

34
On the basis of the record in the preliminary phase of these investigations, we find thatthere was significant underselling of the domestic like product by cumulated subject imports.Prices of the domestic like product declined while low priced cumulated subject importsincreased in volume and gained market share, particularly in the merchant market, at theexpense of the domestic industry.205
Impact of the Subject Imports206
Section 771(7)(C)(iii) of the Tariff Act provides that the Commission, in examining theimpact of the subject imports on the domestic industry, �shall evaluate all relevant economicfactors which have a bearing on the state of the industry.� These factors include output, sales,inventories, capacity utilization, market share, employment, wages, productivity, gross profits,net profits, operating profits, cash flow, return on investment, return on capital, ability to raisecapital, ability to service debt, research and development, and factors affecting domestic prices.No single factor is dispositive and all relevant factors are considered �within the context of thebusiness cycle and conditions of competition that are distinctive to the affected industry.�207
As discussed above, the domestic industry�smarket share in the merchant marketdeclined from 59.2 percent in 2014 to 59.0 percent in 2015 and 58.0 percent in 2016.208 Thedomestic industry�s capacity,209 production,210 and U.S. shipments211 also declined from 2014 to
205 CR/PR at Table IV 9.206 Commerce initiated antidumping duty investigations on imports from Belarus, Italy, Korea,
Russia, South Africa, Spain, Turkey, Ukraine, the United Arab Emirates, and the United Kingdom basedon estimated antidumping duty margins of 161.75 to 280.02 percent for imports from Belarus, 18.89percent for imports from Italy, 33.96 to 43.25 percent for imports from Korea, 214.06 to 756.93 percentfor imports from Russia, 128.66 to 142.26 percent for imports from South Africa, 32.70 percent forimports from Spain, 37.67 percent for imports from Turkey, 21.23 to 44.03 percent for imports fromUkraine, 84.10 percent for imports from the United Arab Emirates, and 147.63 percent for imports fromthe United Kingdom. Commerce Antidumping Duty Investigations, 82 Fed. Reg. at 19211.
207 19 U.S.C. § 1677(7)(C)(iii). This provision was amended by the Trade Preferences ExtensionAct of 2015, Pub. L. 114 27.
208 CR/PR at Table IV 9. In the overall market, the domestic industry�smarket share was 66.9percent in 2014 and 2015, which decreased to 66.4 percent in 2016. See id.
209 The domestic industry�s capacity declined from 4.9 million short tons in 2014 and 2015 to 4.6million short tons in 2016. CR/PR at Table III 3. As previously discussed, ArcelorMittal and RepublicSteel ceased operations during the period of investigation. Petitioners claim that subject imports causedthe companies to shutter their facilities. Gerdau, Keystone, and Charter Steel Postconf. Br. at 35 36.Respondents contend that factors other than subject imports led to the closures. AWPA Postconf. Br. at26 29; Turkish Respondents Postconf. Br. at 17 19; Ukrainian Respondents Postconf. Br. at 7. We willexamine further the causes of these closures in any final phase of these investigations.
210 The domestic industry�s production decreased from 3.71 million short tons in 2014 to 3.68million short tons in 2015 and 3.58 million short tons in 2016. CR/PR at Table III 4.
211 The domestic industry�s commercial shipments totaled 2.6 million short tons in 2014 and2015 and 2.5 million short tons in 2016. CR/PR at Table III 5. The domestic industry�s total U.S.shipments were 3.6 million short tons in 2014 and 2015 and 3.5 million short tons in 2016. See id.(Continued�)

35
2016. The domestic industry�s capacity utilization212 and ratio of end of period inventories tototal shipments increased from 2014 to 2016.213
Employment related indicators for the domestic industry largely showed overalldeclines from 2014 to 2016. The number of production related workers (�PRWs�), total hoursworked, and productivity declined overall during this period at the same time hourly wages andunit labor costs increased.214
The domestic industry�s financial indicators in the merchant market generally declinedfrom 2014 to 2016. Net sales,215 unit net sales value,216 gross profit,217 operating income,218
and net income219 declined from 2014 to 2016. Operating income and net income as a share of
(�Continued)Internal consumption and transfers to related firms were 1.02 million short tons in 2014, 1.05 millionshort tons in 2015, and 1.07 million tons in 2016. Calculated from CR/PR at Table VI 1.
212 The domestic industry�s capacity utilization was 75.8 percent in 2014, 74.6 percent in 2015,and 77.3 percent in 2016. CR/PR at Table III 3.
213 The ratio of end of period inventories to total shipments was 7.1 percent in 2014 and 2015and 7.3 percent in 2016. CR/PR at Table III 7.
214 The domestic industry�s PRWs increased from 2,269 in 2014 to 2,411 in 2015, beforedeclining to 2,222 in 2016. Total hours worked, after increasing from 4,835 in 2014 to 4,945 in 2015,declined to 4,754 in 2016. Hourly wages decreased from $35.28 in 2014 to $34.84 in 2015, beforeincreasing to $35.40 in 2016. Productivity decreased from 766.7 short tons per 1,000 hours in 2014 to743.2 short tons per 1,000 hours in 2015, before increasing to 753.3 short tons per 1,000 hours. Unitlabor costs, after increasing from $46.02 in 2014 to $46.87 in 2015, decreased to $47.00 in 2016. CR/PRat Table III 19.
215 The domestic industry�s net sales revenues in the merchant market declined from $1.9 billionin 2014 to $1.5 billion in 2015 and $1.3 billion in 2016. CR/PR at Table IV 1. In the market as a whole,the domestic industry�s net sales decreased from $2.6 billion in 2014 to $2.1 billion in 2015 and $1.9billion in 2016. See id. The net sales of internal consumption and transfers to related firms declinedfrom $656.8 million in 2014 to $560.2 million in 2015 and $533.6 million in 2016. Calculated from CR/PRat Table VI 1.
216 The domestic industry�s unit net sales value in the merchant market declined from $717 pershort ton in 2014 to $585 per short ton in 2015 and $530 per short ton in 2016. CR/PR at Table VI 1. Inthe market as a whole, the domestic industry�s unit net sales value declined from $697 per short ton in2014 to $570 per short ton in 2015 and $520 per short ton in 2016. See id.
217 The domestic industry�s gross profit in the merchant market declined from $103.2 million in2014 to $66.5 million in 2015, before increasing to $93.6 million in 2016. CR/PR at Table VI 1. In theoverall market, the domestic industry�s gross profit declined from $136.6 million in 2014 to $114.4million in 2015, before increasing to $147.2 million in 2016. See id.
218 The domestic industry�s operating income in the merchant market decreased from $38.8million in 2014 to $8.9 million in 2015, before increasing to $30.6 million in 2016. CR/PR at Table VI 1.In the overall market, the domestic industry�s operating income decreased from $52.5 million in 2014$37.4 million in 2015, before increasing to $63.5 million in 2016. See id. The domestic industry�soperating income in the captive market increased from $13.7 million in 2014 to $28.5 million in 2015and $32.9 million in 2016. Calculated from CR/PR at Table VI 1.
219 The domestic industry�s net income in the merchant market decreased from $32.4 million in2014 to $1.6 million in 2015, before increasing to $26.3 million in 2016. CR/PR at Table VI 1. In the(Continued�)

36
net sales improved from 2014 to 2016, but remained low throughout the period ofinvestigation.220
Domestic producers� capital expenditures declined from 2014 to 2016.221 Domesticproducers also reported negative effects on investment and on growth and development dueto subject imports.222
As discussed above, significant volumes of low priced cumulated subject imports thatwere generally highly substitutable with the domestic like product entered the U.S. market andsignificantly undersold the domestic like product. Although wire rod imports from Chinaretreated from the market following imposition of antidumping and countervailing duty orderscovering those imports and nonsubject imports decreased their presence in the U.S. market,the domestic industry lost further market share to the cumulated subject imports, particularlyin the merchant market. As a result, the domestic industry�s production, capacity utilization,and U.S. shipments declined from 2014 to 2016. Its revenues and financial performanceremained at poor levels. We therefore find that the significant volume of cumulated subjectimports, which gained market share through significant underselling, had a significant impacton the domestic industry.
We have considered whether there are other factors that may have had an impact onthe domestic industry during the period of investigation to ensure that we are not attributinginjury from such other factor to subject imports. The Turkish respondents blame declines inapparent U.S. consumption as contributing to the domestic industry�s weakenedperformance.223 The modest decline in apparent U.S. consumption, however, fails to explaineither the significant increase in the volume (and therefore market share) of cumulated subjectimports or the domestic industry�s inability to increase, or even maintain, its market share afterwire rod imports from China largely departed the U.S. market.
(�Continued)overall market, net income decreased from $39.1 million in 2014 to $24.1 million in 2015, beforeincreasing to $54.6 million in 2016. See id.
220 In the merchant market, the domestic industry�s operating income as a share of net salesinitially decreased from 2.0 percent in 2014 to 0.6 percent in 2015, before increasing to 2.3 percent in2016. CR/PR at Table VI 1. In the overall market, the domestic industry�s operating income as a share ofnet sales initially decreased from 2.0 percent in 2014 to 1.8 percent in 2015, before increasing to 3.4percent in 2016. See id.
The domestic industry�s net income as a share of net sales in the merchant market decreasedfrom 1.7 percent in 2014 to 0.1 percent in 2015, before increasing to 2.0 percent in 2016. CR/PR atTable VI 1. In the overall market, the domestic industry�s net income as a share of net sales decreasedfrom 1.5 percent in 2014 to 1.2 percent in 2015, before increasing to 2.9 percent in 2016. See id.
Part of the improvement in the domestic industry�s performance from 2015 to 2016 ***. CR atVI 3 n.8, PR at VI 2 n.8.
221 Capital expenditures declined from $97.7 million in 2014 to $86.3 million in 2015 and $66.4million in 2016. CR/PR at Table VI 5.
222 CR/PR at Table VI 7.223 Turkish Respondents Postconf. Br. at 14.
WNonsubje30.6 percimports fdata showdomesticto antiduorders. Adeteriora
Wcumulate
RVIII.S
AimminenUnited Sthat thesubject i
Le
Sea reasonasubject imwhethersuspensio�on the bin makingmaterial
22
market de22
percent oshow thatquarterlyhigher thaimports in
22
22
We have alsoect imports�cent in 2014from Canadaw that theyc like producumping dutyAccordingly,ating conditiWe thereforeed subject im
Reasonableubsidized
As discussedntly accounttates. ThereU.S. industrmports from
egal Standa
ection 771(7able indicatimports by amaterial injon agreemebasis of mereg its determinjury by rea
24 CR/PR at Taeclined from25 One importof U.S. commet prices for nocomparisonsan cumulatedn nine quarte26 19 U.S.C. §27 19 U.S.C. §
o consideredshare of ap
4 to 25.6 pera, the largeswere predoct.225 Moreoorders andwe find thaon over thee conclude, fmports have
e IndicatioSubject Im
earlier, wefor more thefore we prory is threatem Italy.
rd
7)(F) of the Tion that thenalyzing wheury by reasont is acceptee conjectureination wheason of subj
able IV 9. No24.9 percentter reported percial shipmeonsubject imps and lower thd subject imporly compariso1677(7)(F)(ii)1677(7)(F)(ii)
the role ofparent U.S. ccent in 2015t source of nminantly priover, wire rowire rod frot nonsubjecperiod of infor purposeshad a signif
n of Threamports from
have determhan 3 percenoceed to dened with ma
Tariff Act dirU.S. industrether �furthon of imported.�226 Thee or suppositether dumpeect imports
nsubject impin 2014 to 20pricing data fonts of wire roports from Cahan the domeorts in 23 quaons. CR/PR at..
37
nonsubjectconsumptio5 and 25.3 pnonsubject iiced higher tod imports from two count imports canvestigation.s of these prficant impact
at of Matem Italy
mined that snt of all subjetermine whaterial injur
ects the Comry is threatener dumpeds would occCommissiontion,� and coed or subsidiwould occu
orts� share of0.7 percent inor nonsubjectod from Canadanada were hestic like prodarterly compat Table E 4.
imports in thn in the merercent in 20mports in 20than both surom six counntries are suannot explain.reliminary det on the dom
rial Injury
subject impoject merchahether therery by reason
mmission toned with maor subsidizeur unless ann may not monsiders thezed importsr unless an o
f apparent U.n 2015 and 20t imports froda in 2016. Chigher than thduct in 15 quaarisons and lo
hese investirchant mark016.224 Altho016, increasubject imporntries are cubject to coun the domes
eterminationmestic indus
by Reason
orts from Itandise impore is a reasonn of allegedly
determine waterial injuryed imports arn order is issake such a de threat factos are immineorder is issu
S. consumpti0.2 percent inm Canada, acCR at E 3, PRhe domestic liarterly compaower than cu
gations.ket declinedough wire rosed, the pricirts and therrently subjentervailing dstic industry
ns, that thestry.
n of Allege
aly wouldrted into theable indicaty subsidized
whether they by reason ore imminentued or adeterminatioors �as a whent and wheed.227 In ma
ion in the oven 2016. See idccounting forat E 3. Theseike product inarisons; theymulated subj
fromoding
ectdutyy�s
edly
etiond
ere isoft and
onole�theraking
eralld.5.3e datan 21wereect

38
our determinations, we consider all statutory threat factors that are relevant to theseinvestigations.228
B. Cumulation for Threat
Because our determinations involve the issue of reasonable indication of threat ofmaterial injury by reason of subject imports, we must consider whether to cumulate allegedlysubsidized subject imports from Italy with those from other sources eligible for cumulation. Incontrast to cumulation for material injury, cumulation for a threat analysis is discretionary.Under Section 771(7)(H) of the Tariff Act, the Commission may �to the extent practicable�cumulatively assess the volume and price effects of subject imports from all countries as towhich petitions were filed on the same day if the requirements for cumulation in the materialinjury context are satisfied.229 Imports from all other sources subject to investigation are
228 These factors are as follows:
(I) if a countervailable subsidy is involved, such information as may be presented to it by theadministering authority as to the nature of the subsidy (particularly as to whether the countervailablesubsidy is a subsidy described in Article 3 or 6.1 of the Subsidies Agreement) and whether imports of thesubject merchandise are likely to increase,
(II) any existing unused production capacity or imminent, substantial increase in productioncapacity in the exporting country indicating the likelihood of substantially increased imports of thesubject merchandise into the United States, taking into account the availability of other export marketsto absorb any additional exports,
(III) a significant rate of increase of the volume or market penetration of imports of the subjectmerchandise indicating the likelihood of substantially increased imports,
(IV) whether imports of the subject merchandise are entering at prices that are likely to have asignificant depressing or suppressing effect on domestic prices and are likely to increase demand forfurther imports,
(V) inventories of the subject merchandise,(VI) the potential for product shifting if production facilities in the foreign country, which can be
used to produce the subject merchandise, are currently being used to produce other products,(VIII) the actual and potential negative effects on the existing development and production
efforts of the domestic industry, including efforts to develop a derivative or more advanced version ofthe domestic like product, and
(IX) any other demonstrable adverse trends that indicate the probability that there is likely to bematerial injury by reason of imports (or sale for importation) of the subject merchandise (whether ornot it is actually being imported at the time).
19 U.S.C. § 1677(7)(F)(i). To organize our analysis, we discuss the applicable statutory threatfactors using the same volume/price/impact framework that applies to our material injury analysis.Statutory threat factors (I), (II), (III), (V), and (VI) are discussed in the analysis of subject import volume.Statutory threat factor (IV) is discussed in the analysis of subject import price effects. Statutory factors(VIII) and (IX) are discussed in the analysis of impact. Statutory factor (VII) concerning agriculturalproducts is inapplicable to these investigations.
229 19 U.S.C. § 1677(7)(H).

39
eligible for cumulation with allegedly subsidized subject imports from Italy for purposes of thethreat analysis.230
Petitioners contend that the Commission should cumulate all subject imports forpurposes of the threat analysis.231 With respect to subject imports from Italy, Korea, Spain,Turkey, and Ukraine, respondents argue that the Commission should not cumulate subjectimports from their individual subject countries with any other subject imports for the purposesof its threat analysis.232
We found above that there is a reasonable overlap of competition between subjectimports from all subject countries and between imports from each of these subject countriesand the domestic like product.233 There is no information on the record to suggest that thereasonable overlap of competition between and among subject imports and the domestic likeproduct that now exists will not continue into the imminent future. We recognize that thereare some differences in volume trends and product mix of imports from each subject country.We also recognize the potential for some differences in conditions of competition amongsubject imports from the ten countries but find that they are not significant enough to warrantnot cumulating allegedly subsidized subject imports from Italy with subject imports from allother subject countries. For these reasons, we conclude that it is appropriate to exercise ourdiscretion to cumulate allegedly subsidized subject imports from Italy with the other subjectimports subject to investigation in the preliminary phase of these investigations for our analysisof whether there is a reasonable indication of a threat of material injury to the domesticindustry.
Analysis of Threat of Material Injury Factors
1. Likely Volume
We found in Section VII.C. above that the volume of cumulated subject imports and theincrease in the volume of these imports over the period of investigation was significant inabsolute terms and relative to consumption. Cumulated subject imports are likely to maintain a
230 See 19 U.S.C. § 1677(7)(G)(ii), (7)(H); see generally Oil Country Tubular Goods from India,Korea, the Philippines, Taiwan, Turkey, Ukraine, and Vietnam, Inv. Nos. 701 TA 499 500, 731 TA 12151217, 1219 1123 (Final), USITC Pub. 4489 at 50 (Sept. 2014).
231 Gerdau, Keystone, and Charter Steel Postconf. Br. at 45 46; Nucor Postconf. Br. at 16.232 Italian Respondent Postconf. Br. at 11 12; Korean Respondent Postconf. Br. at 27 28; Spanish
Respondents Postconf. Br. at 25; Turkish Respondents Postconf. Br. at 21 23. To the extent that theItalian respondent argues that the Commission is barred from cumulating in the threat analysis subjectimports that are negligible for purposes of current injury but not for threat, it provides no statutorysupport for such a proposition. There is no exception in 19 U.S.C. § 1677(7)(G)(ii) for cumulatingnegligible imports for the threat analysis unless negligibility leads to termination of the investigation,which is not the case here.
233 As explained above, this analysis included allegedly dumped imports from Italy (which areidentical to the allegedly subsidized imports from Italy), as well as subject imports from Belarus, Korea,Russia, South Africa, Spain, Turkey, Ukraine, the United Arab Emirates, and the United Kingdom.

40
significant presence in the U.S. market, and the significant level and increase in cumulatedsubject import volume observed during the period of investigation are likely to persist in theimminent future. The producers in the subject countries have substantial capacity and excesscapacity, export in appreciable quantities, and have demonstrated the ability, on a cumulatedbasis, to increase exports to the U.S. market. The combined capacity for the industries inBelarus, Italy, Korea, South Africa, Spain, Turkey, Ukraine, the United Arab Emirates, and theUnited Kingdom was over 15 million short tons in each year of the period of investigation.234
The combined excess capacity for the industries in these countries amounted to 2.2 millionshort tons in 2016.235 This figure is equivalent to nearly half of total apparent U.S. consumptionin 2016.236 Total export shipments of the industries in these countries increased from 4.9million short tons in 2014 to 5.3 million short tons in 2016; their exports to the United States, asshare of total shipments, increased from 3.2 percent in 2014 to 4.9 percent in 2016.237 Thesedata on subject producers� aggregate excess capacity and exports do not include data for theindustry in Russia because no subject producers in Russia responded to the Commission�squestionnaire.238 According to Nucor, however, the industry in Russia expanded its capacityduring the period of investigation. In 2014, ***.239 Official import statistics indicate thatRussia�s total export shipments of bar and rod, as well as Russia�s exports to the United States,as a share of total shipments, were higher in 2016 than in 2014.240
Moreover, wire rod from the subject countries is subject to antidumping duties,countervailing duties, or safeguard measures in third countries, providing additional incentivefor producers in the subject countries to export wire rod to the U.S. market.241
In light of the increases in cumulated subject import volume and market penetrationobserved during the period of investigation, the substantial cumulated capacity and excesscapacity of the subject industries, and the subject industries� demonstrated ability to supplyexport markets generally and the United States in particular, we find that the significantincrease in cumulated subject import volume that occurred during the period of investigationwill likely continue in the imminent future.242
234 CR/PR at Table VII 34.235 Derived from CR/PR at Table VII 34.236 Derived from CR/PR at Table IV 9.237 CR/PR at Table VII 34.238 CR at VII 9, PR at VII 7; CR/PR at Table VII 41.239 Nucor Postconf. Br. at 27 28.240 CR/PR at Table VII 11. These export statistics include out of scope merchandise.241 CR/PR at VII 38.242 We have considered several other factors in our analysis of likely volume. Commerce has
initiated countervailing duty investigations on 14 alleged subsidy programs in Italy and 21 allegedsubsidy programs in Turkey. The alleged subsidy programs from Italy and Turkey include export creditprograms. CR at I 9 10, PR at I 7 9. Additionally, the evidence in the record with respect to existinginventories of subject merchandise show that end of period inventories held by responding producers inthe subject countries declined on both an absolute and relative basis during the period of investigation.CR/PR at Table VII 34. Inventories of subject merchandise held by importers in the United States also(Continued�)

41
2. Likely Price Effects
As explained in Section VII.D. above, the domestic like product and subject imports ofthe same type are highly substitutable, and price is an important consideration in purchasingdecisions. We found significant underselling by cumulated subject imports, which caused thedomestic industry to lose market share. The significant and increasing volumes of cumulatedsubject imports that will likely enter the U.S. market in the imminent future will likely continuepredominantly to undersell the domestic like product as they did during the period ofinvestigation, absent the issuance of any orders. The likely low prices of the cumulated subjectimports, in turn, are likely to increase demand for the subject imports, displace sales of thedomestic like product, and cause reduction in the domestic industry�smarket share in theimminent future, as they did during the period of investigation. Accordingly, we find thatsubject imports are likely in the imminent future to enter the U.S. market at prices that arelikely to increase demand for further imports.
3. Likely Impact
We found in Section VII.E. above that the subject imports had a significant impact on thedomestic industry during the period of investigation. Due to the domestic industry�s decline inmarket share, production, U.S. shipments, capacity utilization, and profitability, we find that thedomestic industry is in a vulnerable condition. We further find that cumulated subject importsare likely to continue both to enter the U.S. market in significant and increasing volumes and toengage in significant underselling of the domestic like product in the imminent future. Weconclude that cumulated subject imports will likely have the same type of adverse impact onthe domestic industry in the imminent future that they did during the period of investigation.The significant volumes of low priced subject imports will likely continue to displace sales of thedomestic like product and cause the domestic industry to lose market share, which will lead toadverse effects on the domestic industry�s revenues and financial performance.
In Section VII.E., we have already considered other factors, including nonsubjectimports, and concluded that any injury that may be attributable to these factors is distinct fromthe injury attributable to the subject imports. This analysis is equally pertinent to likelyconditions in the imminent future. We accordingly find that further subject imports areimminent and that material injury by reason of subject imports will occur unless acountervailing duty order is issued on subject imports from Italy.
(�Continued)declined during the period of investigation. CR/PR at Table VII 36. With respect to the potential forproduct shifting, wire rod producers in the aggregate produce a substantial quantity of other products atthe same facilities. The record, however, is unclear regarding wire producers� incentives to switchproduction from these other products to wire rod. CR/PR at Table VII 35.

42
IX. Conclusion
For the foregoing reasons, we conclude that there is a reasonable indication that anindustry in the United States is materially injured by reason of imports of wire rod from Belarus,Italy, Korea, Russia, South Africa, Spain, Turkey, Ukraine, the United Arab Emirates, and theUnited Kingdom that are allegedly sold at less than fair value and by reason of imports of wirerod that are allegedly subsidized by the government of Turkey, and a reasonable indication thatan industry in the United States is threatened with material injury by reason of allegedlysubsidized imports of wire rod from Italy.

I 1
PART I: INTRODUCTION
BACKGROUND
These investigations result from petitions filed with the U.S. Department of Commerce(�Commerce�) and the U.S. International Trade Commission (�USITC� or �Commission�) byCharter Steel (�Charter�), Saukville, Wisconsin; Gerdau Ameristeel US Inc. (�Gerdau�), Tampa,Florida; Keystone Consolidated Industries, Inc. (�Keystone�), Peoria, Illinois; and NucorCorporation (�Nucor�), Charlotte, North Carolina on March 28, 2017, alleging that an industry inthe United States is materially injured and threatened with material injury by reason ofsubsidized imports of carbon and certain alloy steel wire rod (�wire rod�)1 from Italy andTurkey, and less than fair value (�LTFV�) imports of wire rod from Belarus, Italy, Korea, Russia,South Africa, Spain, Turkey, Ukraine, United Arab Emirates, and the United Kingdom. Thefollowing tabulation provides information relating to the background of these investigations.2 3
Effective date Action
March 28, 2017 Petition filed with Commerce and the Commission;institution of Commission investigation (82 FR 16232,April 3, 2017)
April 17, 2017 Commerce’s notice of initiation of countervailing duty andantidumping duty investigations (82 FR 19213 and 82 FR19207, April 26, 2017)
April 18, 2017 Commission’s conference
May 11, 2017 Commission’s vote
May 12, 2017 Commission’s determination
May 19, 2017 Commission’s views
1 See the section entitled �The SubjectMerchandise� in Part I of this report for a completedescription of the merchandise subject in this proceeding.
2 Pertinent Federal Register notices are referenced in appendix A, and may be found at theCommission�s website (www.usitc.gov).
3 A list of witnesses appearing at the conference is presented in appendix B of this report.

I 2
STATUTORY CRITERIA AND ORGANIZATION OF THE REPORT
Statutory criteria
Section 771(7)(B) of the Tariff Act of 1930 (the �Act�) (19 U.S.C. § 1677(7)(B)) providesthat in making its determinations of injury to an industry in the United States, the Commission
shall consider (I) the volume of imports of the subject merchandise, (II) theeffect of imports of that merchandise on prices in the United States fordomestic like products, and (III) the impact of imports of suchmerchandise on domestic producers of domestic like products, but only inthe context of production operations within the United States; and. . .may consider such other economic factors as are relevant to thedetermination regarding whether there is material injury by reason ofimports.
Section 771(7)(C) of the Act (19 U.S.C. § 1677(7)(C)) further provides that 4
In evaluating the volume of imports of merchandise, the Commission shallconsider whether the volume of imports of the merchandise, or anyincrease in that volume, either in absolute terms or relative to productionor consumption in the United States is significant.. . .In evaluating theeffect of imports of such merchandise on prices, the Commission shallconsider whether. . .(I) there has been significant price underselling by theimported merchandise as compared with the price of domestic likeproducts of the United States, and (II) the effect of imports of suchmerchandise otherwise depresses prices to a significant degree orprevents price increases, which otherwise would have occurred, to asignificant degree.. . . In examining the impact required to be consideredunder subparagraph (B)(i)(III), the Commission shall evaluate (within thecontext of the business cycle and conditions of competition that aredistinctive to the affected industry) all relevant economic factors whichhave a bearing on the state of the industry in the United States, including,but not limited to. . . (I) actual and potential decline in output, sales,market share, gross profits, operating profits, net profits, ability to servicedebt, productivity, return on investments, return on assets, and utilizationof capacity, (II) factors affecting domestic prices, (III) actual and potentialnegative effects on cash flow, inventories, employment, wages, growth,ability to raise capital, and investment, (IV) actual and potential negativeeffects on the existing development and production efforts of thedomestic industry, including efforts to develop a derivative or more
4 Amended by PL 114 27 (as signed, June 29, 2015), Trade Preferences Extension Act of 2015.

I 3
advanced version of the domestic like product, and (V) in {an antidumpinginvestigation}, the magnitude of the margin of dumping.
In addition, Section 771(7)(J) of the Act (19 U.S.C. § 1677(7)(J)) provides that�5
(J) EFFECT OF PROFITABILITY.�The Commission may not determine thatthere is no material injury or threat of material injury to an industry in theUnited States merely because that industry is profitable or because theperformance of that industry has recently improved.
Organization of report
Part I of this report presents information on the subject merchandise, allegedsubsidy/dumping margins, and domestic like product. Part II of this report presents informationon conditions of competition and other relevant economic factors. Part III presents informationon the condition of the U.S. industry, including data on capacity, production, shipments,inventories, and employment. Parts IV and V present the volume of subject imports and pricingof domestic and imported products, respectively. Part VI presents information on the financialexperience of U.S. producers. Part VII presents the statutory requirements and informationobtained for use in the Commission�s consideration of the question of threat of material injuryas well as information regarding nonsubject countries.
MARKET SUMMARY
Wire rod is generally used as an intermediate product for drawing into wire. The leadingU.S. producers of wire rod are Charter, Gerdau, Keystone, Nucor, and Sterling. Leadingproducers of wire rod in subject countries are Byelorussian Steel Works (�Byelorussion�) ofBelarus; Ferriere Nord S.p.a. (�Ferriere Nord�) of Italy; POSCO of Korea; Abinsk Electric SteelWorks Ltd. (�Abinsk�) of Russia; ArcelorMittal South Africa of South Africa; ArcelorMittal Espana(�ArcelorMittal Spain�) and Global Steel Wire, S.A. (�Global SteelWire�) of Spain; Icdas CelikEnerji Tersane ve Ulasim Sanayi A.S. (�Icdas�) and Iskenderun Demir ve Celik A.S. (Isdemir)(�Isdemir�) of Turkey; ArelorMittal Kryvyi Rih (�ArcelorMittal Ukraine�) and Yenaliieve Steel(�Yenakiieve�) of Ukraine; Emirates Steel Industries PJSC (�Emirates Steel�) of United ArabEmirates (�UAE�); and British Steel Limited (�British Steel�) of the United Kingdom. The leadingU.S. importers of wire rod from subject countries in 2016 are ***. U.S. purchasers of wire rodare primarily firms that draw wire and use wire for a large variety of end use products. U.S.producers of wire rod are related to firms that draw wire, to which they transfer wire rod.
Apparent U.S. consumption of wire rod totaled approximately 5.3 million short tons($2.8 billion) in 2016. *** firms were known to produce wire rod in the United States in 2016.U.S. producers� U.S. shipments of wire rod totaled 3.5 million short tons ($1.8 billion) in 2016,
5 Amended by PL 114 27 (as signed, June 29, 2015), Trade Preferences Extension Act of 2015.

I 4
and accounted for 66.4 percent of apparent U.S. consumption by quantity and 64.5 percent byvalue. U.S. imports from subject sources totaled 712 thousand short tons ($303 million) in 2016and accounted for 13.4 percent of apparent U.S. consumption by quantity and 10.6 percent byvalue. U.S. imports from nonsubject sources totaled 1.1 million short tons ($708 million) in2016 and accounted for 20.2 percent of apparent U.S. consumption by quantity and 24.8percent by value.
SUMMARY DATA AND DATA SOURCES
A summary of data collected in these investigations is presented in appendix C, tableC 1.6 Except as noted, U.S. industry data are based on questionnaire responses of *** firms thataccounted for essentially all U.S. production of wire rod during 2014 16. U.S. imports are basedon official Commerce statistics except as noted. Additional data concerning nonsubject pricedata appears in appendix E.
PREVIOUS AND RELATED INVESTIGATIONS
The Commission has conducted a number of previous import relief investigations onwire rod products or similar merchandise. There are currently antidumping orders in effectcovering wire rod from Brazil, China, Indonesia, Mexico, Moldova, and Trinidad and Tobago, aswell as countervailing duty orders in effect covering wire rod from Brazil and China. Table I 1presents the Commission�s countervailing and antidumping duty investigations concerning wirerod since 1982.
6 Table C 1 presents summary data for the entire wire rod market and table C 2 presents summarydata for the wire rod merchant market. Appendix D presents monthly U.S. producers� U.S. shipmentdata, import data, apparent consumption, and market shares. Appendix E presents nonsubject countryprice data.

I 5
Table I-1
Wire rod: Previous and related title VII investigations
Original investigation First review Second review
Current statusDate1 Number Country Outcome Date1 Outcome Date1 Outcome
1982 731-TA-88 Venezuela Negative - - - - -
1982 731-TA-113 Brazil Affirmative - - - - ITA revoked 9/20/85
1982 731-TA-114 Trinidad & Tobago Affirmative - - - - ITA revoked 12/14/87
1982 701-TA-148 Brazil Affirmative2 - - - - Investigation terminated 8/21/85
1982 701-TA-149 Belgium Affirmative2 - - - - Petition withdrawn11/9/82
1982 701-TA-150 France Affirmative2 - - - - Petition withdrawn 11/9/82
1983 701-TA-209 Spain Affirmative - - - - ITA revoked 9/11/85
1983 731-TA-157 Argentina Affirmative 1998 Negative - - Order revoked
1983 731-TA-158 Mexico Negative2 - - - - -
1983 731-TA-159 Poland Negative - - - - -
1983 731-TA-160 Spain Affirmative - - - - ITA revoked 9/16/85
1984 731-TA-205 E. Germany Affirmative2 - - - - Petition withdrawn 8/1/85
1985 701-TA-243 Portugal Negative2 - - - - -
1985 701-TA-244 Venezuela Affirmative2 - - - - Petition withdrawn 7/24/85
1985 731-TA-256 Poland Affirmative2 - - - - Petition withdrawn 9/10/85
1985 731-TA-257 Portugal Affirmative2 - - - - Petition withdrawn 11/20/85
1985 731-TA-258 Venezuela Affirmative2 - - - - Petition withdrawn 8/30/85
1992 701-TA-314 Brazil Affirmative 1999 - - - ITA revoked 11/15/99
1992 701-TA-315 France Affirmative 1999 - - - ITA revoked 11/15/99
1992 701-TA-316 Germany Affirmative 1999 - - - ITA revoked 11/15/99
1992 701-TA-317 United Kingdom Affirmative 1999 - - - ITA revoked 11/15/99
1992 731-TA-552 Brazil Affirmative 1999 - - - ITA revoked 11/15/99
1992 731-TA-553 France Affirmative 1999 - - - ITA revoked 11/15/99
1992 731-TA-554 Germany Affirmative 1999 - - - ITA revoked 11/15/99
1992 731-TA-555 United Kingdom Affirmative 1999 - - - ITA revoked 11/15/99
1992 731-TA-572 Brazil Negative - - - - -
1993 731-TA-646 Brazil Negative - - - - -
1993 731-TA-647 Canada Affirmative2 - - - - Petition withdrawn 4/18/94
1993 731-TA-648 Japan Negative - - - - -
1993 731-TA-649 Trinidad & Tobago Negative2 - - - - -
1994 701-TA-359 Germany Negative2 - - - - -
1994 731-TA-686 Belgium Affirmative2 - - - - Petition withdrawn 7/7/94
1994 731-TA-687 Germany Negative2 - - - - -
Table continued on next page.

I 6
Table I-1--ContinuedWire rod: Previous and related title VII investigations
Original investigation First review Second review
Current statusDate1 Number Country Outcome Date1 Outcome Date1 Outcome
1997 701-TA-368 Canada Negative - - - - -
1997 701-TA-369 Germany Negligible3
- - - - -
1997 701-TA-370 Trinidad & Tobago Negative - - - - -
1997 701-TA-371 Venezuela Negative - - - - -
1997 731-TA-763 Canada Negative - - - - -
1997 731-TA-764 Germany Negative - - - - -
1997 731-TA-765 Trinidad & Tobago Negative - - - - -
1997 731-TA-766 Venezuela Negative - - - - -
2001 701-TA-417 Brazil Affirmative 2007 Affirmative 2013 Affirmative Order in effect
2001 701-TA-418 Canada Affirmative - - - - ITA revoked 1/23/04
2001 701-TA-419 Germany Negative - - - - -
2001 701-TA-420 Trinidad & Tobago Negative4 - - - - -
2001 701-TA-421 Turkey Negative4 - - - - -
2001 731-TA-953 Brazil Affirmative 2007 Affirmative 2013 Affirmative Order in effect
2001 731-TA-954 Canada Affirmative 2007 Negative - - Order revoked
2001 731-TA-955 Egypt Negligible3
- - - - -
2001 731-TA-956 Germany Negligible3 - - - - -
2001 731-TA-957 Indonesia Affirmative 2007 Affirmative 2013 Affirmative Order in effect
2001 731-TA-958 Mexico Affirmative 2007 Affirmative 2013 Affirmative Order in effect
2001 731-TA-959 Moldova Affirmative 2007 Affirmative 2013 Affirmative Order in effect
2001 731-TA-960 South Africa Negligible3
- - - - -
2001 731-TA-961 Trinidad & Tobago Affirmative 2007 Affirmative 2013 Affirmative Order in effect
2001 731-TA-962 Ukraine Affirmative 2007 Affirmative 2013 Negative Order revoked
2001 731-TA-963 Venezuela Negligible3 - - - - -
2005 731-TA-1099 China Negative2
- - - - -
2005 731-TA-1100 Germany Negative2
- - - - -
2005 731-TA-1101 Turkey Negative2 - - - - -
2014 701-TA-512 China Affirmative - - - - Order in effect
2014 731-TA-1248 China Affirmative - - - - Order in effect1
“Date” refers to the year in which the investigation or review was instituted by the Commission.2
Preliminary determination.3 The Commission found subject imports to be negligible, and its investigation was thereby terminated.4 The Department of Commerce made a negative determination.
Source: Carbon and Certain Alloy Steel Wire Rod from Brazil, Canada, Indonesia, Mexico, Moldova, Trinidad andTobago, and Ukraine, Investigation Nos. 701-TA-417 and 731-TA-953, 954, 957-959, 961, and 962 (Review), USITCPublication 4014, June 2008; Carbon and Certain Alloy Steel Wire Rod from China, Germany, and Turkey, InvestigationNos. 731-TA-1099-1101 (Preliminary), USITC Publication 3832, January 2006; Carbon and Certain Alloy Steel Wire Rodfrom Brazil, Indonesia, Mexico, Moldova, Trinidad and Tobago, and Ukraine, 78 FR 33103, June 3, 2013; and Carbon andCertain Alloy Steel Wire Rod from China, Investigation Nos. 701-TA-512 and 731-TA-1248 (Final), USITC Publication4509, January 2015.

I 7
Safeguard investigation
In 1999, the Commission conducted a safeguard investigation under section 202 of theTrade Act of 1974 to determine whether steel wire rod was being imported into the UnitedStates in such increased quantities as to be a substantial cause of serious injury, or the threatthereof, to the domestic industry producing an article like or directly competitive with theimported article. The Commission was equally divided in its injury determination.7 ThePresident considered the determination of the Commissioners voting in the affirmative andissued Proclamation 7273 imposing relief in the form of a Tariff Rate Quota (�TRQ�) on importsof steel wire rod for a period of three years and one day, effective March 1, 2000.
Imports of subject products in excess of the quarterly or the annual quota amountswere assessed duties in addition to the column 1 general rates of duty in the amounts of 10percent ad valorem in the first year of relief (in quota quantity of 1,580,000 short tons); 7.5percent ad valorem in the second year of relief (in quota quantity of 1,611,600 short tons); and5 percent ad valorem in the third year of relief (in quota quantity of 1,643,832 short tons). ThePresident subsequently issued Proclamation 7505 effective November 24, 2001, modifying theTRQ, by providing that the in quota quantity of the TRQ be allocated among these four suppliercountry groupings: European Community; Commonwealth of Independent States; Trinidad andTobago; and all other countries.8
NATURE AND EXTENT OF ALLEGED SUBSIDIES AND SALES AT LTFV
Alleged subsidies
On April 26, 2017, Commerce published a notice in the Federal Register of the initiationof its countervailing duty investigations on wire rod from Italy and Turkey.9 The followingprograms in Italy are included:10
A. Electricity subsidies1. Exemptions from general electricity network costs2. Energy interruptibility contracts
7 Pursuant to section 311(a) of the North American Free Trade Agreement (�NAFTA�) ImplementationAct, the Commission made negative findings with respect to imports of wire rod from Canada andMexico.
8 Carbon and Certain Alloy Steel Wire Rod from Brazil, Canada, Indonesia, Mexico, Moldova, Trinidadand Tobago, and Ukraine, Investigation Nos. 701 TA 417 and 731 TA 953, 954, 957 959, 961, and 962(Review), USITC Publication 4014, June 2008, pp. I 11 I 12.
9 Carbon and Alloy Steel Wire Rod from Italy and Turkey: Initiation of Countervailing DutyInvestigations, 82 FR 19213, April 26, 2017.
10 Carbon and Alloy Steel Wire Rod from Italy, Enforcement and Compliance Office of AD/CVDOperations Countervailing Duty Investigation Initiation Checklist, April 17, 2017.

I 8
B. Grant and preferential loan programs1. Industrial development grants under law 488/922. Technological innovation fund grants under law 46/823. Technological innovation fund loans under law 46/824. Preferential financing under law 266/975. Grants to revive industrial areas under law 181/896. Preferential loans to revive industrial areas under law 181/897. Patti Territoriali grants under law 662/96
C. Income tax programs1. Income tax deferral under article 42 of law 78/20102. Tax credits under article 1 of law 296/063. Tax credits under article 62 of law 289/024. Certain social security reductions and exemptions (�Sgravi� benefits)
D. Export subsidies1. Export credit subsidies
The following programs in Turkey are included:11
A. Provision of goods for less/more than adequate remuneration1. Natural gas for less than adequate remuneration2. Electricity for more than adequate remuneration3. Provision of funds for electricity for less than adequate remuneration4. Steam coal for less than adequate remuneration5. Land for less than adequate remuneration
B. Government Loans and Assistance1. Turkish development bank loans
C. Export credits, loans and insurance by Turkish ExIm bank1. Pre shipment export credits2. Foreign trade company export loans3. Pre export credits4. Short term export credit discount program
D. Investment incentives1. Regional investment scheme2. Large scale investment scheme
11 Carbon and Alloy Steel Wire Rod from the Republic of Turkey, Enforcement and Compliance Officeof AD/CVD Operations Countervailing Duty Investigation Initiation Checklist, April 17, 2017.

I 9
E. Tax benefit programs1. Deductions from taxable income for export revenue2. Incentives provided under Turkish law no. 57463. Withholding of income tax on wages and salaries4. Exemption from property tax5. Tax, duty, and land benefits for wire rod producers located in free zones
F. Other financial assistance1. Employers� share in insurance premiums program2. Assistance to offset costs related to AD/CVD investigations3. Industrial R&D projects grant program4. Other government loans and grants
Alleged sales at LTFV
On April 26, 2017, Commerce published a notice in the Federal Register of the initiationof its antidumping duty investigations on wire rod from Belarus, Italy, Korea, Russia, SouthAfrica, Spain, Turkey, Ukraine, United Arab Emirates, and the United Kingdom.12 Commerce hasinitiated antidumping duty investigations based on estimated dumping margins of 161.75 to280.02 percent for wire rod from Belarus, 18.89 percent for imports from Italy, 33.96 to 43.25percent for imports from Korea, 214.06 to 756.93 percent for imports from Russia, 128.66percent to 142.26 percent for imports from South Africa, 32.70 percent for imports from Spain,37.67 percent for imports from Turkey, 21.23 to 44.03 percent for imports from Ukraine, 84.10percent for imports from United Arab Emirates, and 147.63 percent for imports from theUnited Kingdom.13
THE SUBJECT MERCHANDISE
Commerce�s scope
Commerce has defined the scope of this investigation as follows:
The merchandise covered by these investigations are certain hot rolledproducts of carbon steel and alloy steel, in coils, of approximately roundcross section, less than 19.00 mm in actual solid cross sectional diameter.Specifically excluded are steel products possessing the above noted
12 Carbon and Alloy Steel Wire Rod From Belarus, Italy, the Republic of Korea, the Russian Federation,South Africa, Spain, the Republic of Turkey, Ukraine, United Arab Emirates, and United Kingdom:Initiation of Less Than Fair Value Investigations, 82 FR 19207, April 26, 2017.
13 Carbon and Alloy Steel Wire Rod From Belarus, Italy, the Republic of Korea, the Russian Federation,South Africa, Spain, the Republic of Turkey, Ukraine, United Arab Emirates, and United Kingdom:Initiation of Less Than Fair Value Investigations, 82 FR 19207, April 26, 2017.

I 10
physical characteristics and meeting the Harmonized Tariff Schedule ofthe United States (HTSUS) definitions for (a) stainless steel; (b) tool steel;(c) high nickel steel; (d) ball bearing steel; or (e) concrete reinforcing barsand rods. Also excluded are free cutting steel (also known as freemachining steel) products (i.e., products that contain by weight oneor more of the following elements: 0.1 percent of more of lead, 0.05percent or more of bismuth, 0.08 percent or more of sulfur, more than0.04 percent of phosphorous, more than 0.05 percent of selenium, ormore than 0.01 percent of tellurium). All products meeting the physicaldescription of subject merchandise that are not specifically excluded areincluded in this scope.
The products under investigation are currently classifiable undersubheadings 7213.91.3011, 7213.91.3015, 7213.91.3020, 7213.91.3093,7213.91.4500, 7213.91.6000, 7213.99.0030, 7227.20.0030,7227.20.0080, 7227.90.6010, 7227.90.6020, 7227.90.6030, and7227.90.6035 of the HTSUS. Products entered under subheadings7213.99.0090 and 7227.90.6090 of the HTSUS may also be included in thisscope if they meet the physical description of subject merchandise above.Although the HTSUS subheadings are provided for convenience andcustoms purposes, the written description of the scope of theseproceedings is dispositive.14
Tariff treatment
Based upon the scope set forth by Commerce, information available to the Commissionindicates that the merchandise subject to these investigations is currently imported under thefollowing provisions of the 2017 Harmonized Tariff Schedule (�HTS�) of the United States:7213.91.3011, 7213.91.3015, 7213.91.3020, 7213.91.3093; 7213.91.4500, 7213.91.6000,7213.99.0030, 7227.20.0030, 7227.20.0080, 7227.90.6010, 7227.90.6020, 7227.90.6030, and7227.90.6035. The column 1 General duty rate for imports of wire rod under all of theseprovisions is �free.�
14 Carbon and Alloy Steel Wire Rod from Italy and Turkey: Initiation of Countervailing DutyInvestigations, 82 FR 19213, April 26, 2017 and Carbon and Alloy Steel Wire Rod From Belarus, Italy, theRepublic of Korea, the Russian Federation, South Africa, Spain, the Republic of Turkey, Ukraine, UnitedArab Emirates, and United Kingdom: Initiation of Less Than Fair Value Investigations, 82 FR 19207, April26, 2017.

I 11
THE PRODUCT
Description and applications15
Wire rod is a hot rolled intermediate steel product of circular or approximately circularcross section that typically is produced in nominal fractional diameters up to 47/64 inch (18.7mm) and sold in irregularly wound coils, primarily for subsequent drawing and finishing by wiredrawers.16Wire rod sold in the United States is categorized by quality according to end use.End use categories are broad descriptions with overlapping metallurgical qualities,chemistries,17 and physical characteristics.18
Table I 2 presents quality and commodity descriptions for 11 major types of wire rod, asindicated by the Iron and Steel Society. Industrial quality wire rod currently accounts for themajority of wire rod consumed in the United States. It is primarily intended for drawing intoindustrial (or standard) quality wire that, in turn, is used to manufacture such products as nails,reinforcing wire mesh, and chain link fence. Most of the industrial quality wire rod is producedand sold in the smallest cross sectional diameter that is hot rolled in substantial commercialquantities (7/32 inch or 5.6 mm).19 Industrial quality wire rod generally is manufactured fromlow or medium low carbon steel.20
Other relatively large volume qualities of wire rod consumed in the United Statesinclude high and medium high carbon and cold heading quality. High and medium high carbonwire rod are intended for drawing into wire for such products as strand, upholstery spring,mechanical spring, rope, screens, and pre stressed concrete wire.21
15 Except as noted, information presented in the �Description and Applications� and �ManufacturingProcesses� is drawn from Carbon and Certain Alloy Steel Wire Rod from China, Inv. Nos. 701 TA 512 and731 TA 1248 (Final), USITC Publication 4509, January 2015.
16 Wire drawers (also referred to as redrawers) manufacture wire and wire products and may beindependent of the wire rodmanufacturers or may be affiliated parties.
17 Steel chemistries are designated as �grades� of standardized composition ranges for carbon,nonferrous metals, and nonmetallic elements. See e.g., table 2 1, Standard Steels for Wire Rods andWire Nonresulfurized Carbon Steels, Manganese Maximum Not Exceeding 1.00 Percent. Iron and SteelSociety (�I&SS�), Steel Products Manual: Carbon Steel Wire and Rods, August 1993, p. 36.
18 Steel ductility, hardness, and tensile strength are positively correlated with carbon content.Alloying elements can be added at the steel melting stage of the manufacturing process to impart variouscharacteristics to the wire rod.
19 Wire rod with a nominal diameter of less than from 7/32 inch (5.6 mm) has become commerciallyavailable in the United States since the 2005 investigations. Carbon and Certain Alloy Steel Wire Rod fromChina, Inv. Nos. 701 TA 512 and 731 TA 1248 (Final), USITC Publication 4509, January 2015, p. I 15 17.
20 I&SS, Steel Products Manual: Carbon Steel Wire and Rods, August 1993, p. 36.21 The end uses of very high quality wire rod are those where the manufacturing processes involve
large amounts of cold deformation of the steel such as in recessed quality cold heading; those that aresafety critical, such as automotive wheel bolts and tire reinforcing wire; those that have very demandingconsistency requirements or unusual steel chemistry requirements, such as certain welding grades; andother applications that put unusual and demanding requirements on the steel.

I 12
Table I-2
Wire rod: Quality, end uses, and important characteristics
Quality End uses Important characteristics
Chain quality Electric welded chain Butt-welding properties anduniform internal soundness
Cold-finishing quality Cold-drawn bars Surface quality
Cold-heading quality Cold-heading, cold-forging, cold- extrusionproducts
Internal soundness, good surfacequality, may require thermaltreatments
Concrete reinforcement Nondeformed rods for reinforcing concrete(plain round or smooth surface rounds)
Chemical composition important onlyinsofar as it affects mechanical property
Fine wire Insect screen, weaving wire, florist wire Rods must be suitable for drawing intowire sizes as small as 0.035 inch(0.889 mm) without intermediateannealing; internal quality important
High carbon and medium-high carbon
Strand and rope, tire bead, upholstery spring,mechanical spring, screens, aluminumconductors steel reinforced core, pre-stressedconcrete strand; pipe wrap wire is a subset
Requires thermal treatment prior todrawing; however, it is not intended tobe used for music wire or valve springwire
Industrial (standard) quality Nails, coat hangers, mesh for concretereinforcement, fencing
Can only be drawn a limited number oftimes before requiring thermal treatment
Music spring wire Springs subject to high stress; valve springsare a subset
Restrictive requirements forchemistry, cleanliness, segregation,decarburization, surfaceimperfections
Scrapless nut Fasteners produced by cold heading, coldexpanding, cold punching, thread tapping
Internal soundness, goodsurface quality
Tire cord Tread reinforcement in pneumatic tires Restrictive requirements forcleanliness, segregation,decarburization, chemistry,surface imperfections
Welding quality Wire for gas welding, electric arc welding,submerged arc welding, metal inert gaswelding
Restrictive requirements foruniform chemistry
Source: Iron and Steel Society, Steel Products Manual: Carbon Steel Wire and Rods, August 1993, pp. 35-37.
Manufacturing processes
The manufacturing process for wire rod consists of several stages: (1) melting andrefining to set the steel�s chemical and metallurgical properties; (2) casting the steel into asemifinished shape (billet); (3) hot rolling the billet into rod on a multistand, high speed rollingmill; and (4) coiling and controlled cooling of the wire rod as it passes along a Stelmor deck, aspecialized conveyor unique to the wire rod industry. The equipment used to produce wire rodis much the same throughout the world and without significant differences in productiontechnology.
U.S. and foreign wire rod manufacturers have made capital investments in theirproduction facilities to improve processing efficiencies and product quality. Higher standardsfor product quality (e.g., dimensional tolerances, control over residual or trace elements, andcoil weights) have been applied across the entire range of wire rod products largely in responseto customer demands for improved performance on the customer's equipment. Theseimprovements have tended to blur the distinctions among quality terms over time.

I 13
Melting stageThere are two primary process routes by which steel for rod has been made in the
United States and in foreign countries: the integrated process, which employs blast furnacesand basic oxygen furnaces (�BOFs�), and the nonintegrated (or �minimill�) production processeswhich utilize an electric arc furnace (�EAF�) to produce raw steel. In both processes, pig iron,ferrous scrap, and/or direct reduced iron (�DRI�) are charged into BOFs or EAFs. In the UnitedStates, all steel22 for rod production is melted from ferrous scrap in an EAF, along with otherraw materials that may also be added as part of the EAF charge.23 Alloy agents are added to theliquid steel to impart specific properties to finished steel products. The molten steel is pouredor tapped from the furnace to a ladle, which is an open topped, refractory lined vessel that hasan off center opening in its bottom and is equipped with a nozzle. Meanwhile, the primarysteelmaking vessel (either EAF or BOF) may be charged with new materials to begin anotherrefining cycle.
Molten steel typically is further treated in a ladle metallurgy station, where its chemistryis refined to give the steel those properties required for specific applications. At the ladlemetallurgy, or secondary steel making, station the chemical content (particularly that of carbonand sulfur) is adjusted and alloying agents may be added.24 The steel may be degassed(eliminating oxygen and hydrogen) at low pressures.25 Ladle metallurgy stations are equipped
22 Petitioning three firm�s postconference brief, exhibit 1, p. 8 and conference transcript, p. 66(Cameron).
23 Minimills use ferrous scrap as their primary rawmaterial but may add DRI or hot briquetted ironand/or pig iron, with themix� which may vary over time and locations� depending on the relative costsof the raw materials, specifications for the end product, and individual furnace configurations. Minimillsthat produce high quality rod products, such as high carbon, cold heading quality, tire cord quality,and/or other special quality wire rod may use less ferrous scrap and more DRI than other steelmakers,however the production process in general does not change. Petitioners� Gerdau, Keystone, andCharter�s (�Petitioning three firm�s�) postconference brief, exhibit 1, pp. 7 10. EAF operators add DRI asa premium rawmaterial to attain the same effects as BOF steel. Conference transcript, pp. 156 157(Nystrom).
24 Boron can be added as ferroboron to molten steel (in concentrations of 0.0015�0.0030 percent or15�30 parts per million (ppm)) to increase the hardenability of the steel. However, because of boron�shigh reactivity with any dissolved oxygen and nitrogen in the molten steel, ferroboron is the last additionat the ladle metallurgy station, under controlled conditions, and only after the molten steel is �killed�(deoxidized or degassed). Shieldalloy Metallurgical Corp., �Boron,� Ferroalloys & Alloying Additives OnlineHandbook, November 23, 2000.
According to the Iron & Steel Society, fine grained, standard killed carbon steels may include 0.0005�0.003 percent (5�30 ppm) boron to enhance the steel�s hardenability. Standard boron alloy steels cancontain 0.0005�0.003 percent (5�30 ppm) boron. Iron & Steel Society, Note 4 to �Table 1 StandardCarbon Steels, Cast or Heat Chemical Ranges and Limits, Bars, Wire Rods, Blooms, Billets and Slabs� andfootnote �a� to Standard Boron Alloy Steels in �Table 7 Standard Alloy Steels, Cast or Heat ChemicalRanges and Limits, Bars, Wire Rods, Blooms, Billets and Slabs,� Pocketbook of Standard Steels, July 1996.
25 Liquid steel absorbs gasses from the atmosphere and from the materials used in the steelmaking(continued...)

I 14
with electric arc power to adjust the temperature of the molten steel for optimum casting andto allow it to serve as a holding reservoir for the tundish.
Casting stageOnce molten steel with the requisite properties has been produced, it is cast into a form
that can enter the rolling process. Continuous (strand) casting is the method primarily used inthe United States. In strand casting, the ladle containing molten steel is transferred from theladle metallurgy station to the caster and the molten steel is poured at a controlled rate into arefractory lined tundish (reservoir dam), which in turn controls the rate of flow of the moltensteel into the molds at the top of the caster. The tundish may have a special design or employelectromagnetic stirring to ensure homogeneity of the steel. The strand caster is designed toproduce billets in the desired cross sectional dimensions, based on the dimensions of the rodand the design of the rolling mill. Billets may be sent directly (�hot charged�) into the rollingmill or, depending upon the rolling mill's schedule, sent to a storage yard. While in storage,billets may be inspected and subjected to one or more conditioning operations (e.g., grinding orturning) to prepare them for hot rolling. This preparation is more common with cold headingquality rods intended to be made into fasteners.26
Rolling stageThe wire rod rolling process determines the rod�s size (diameter) and dimensional
precision, depth of decarburization, surface defects and seams, amount of mill scale, structuralgrain size, and within limits set by the chemistry, tensile strength and other physical properties.There is little or no difference among the wire rod rolling mills in the United States, or betweenU.S. mills and their foreign competitors.27 A larger billet will produce a heavier coil. Also, usablecoil size may be limited by the capabilities of the wire drawer's equipment and machinery.
Modern rod rolling mills consist of five parts: a roughing mill, an intermediate mill, apre finishing mill, a no twist finishing mill, and a coiler combined with a conveyor cooling bed
(�continued)process. These gasses, chiefly oxygen and hydrogen, cause embrittlement, voids, and nonmetallicinclusions. Low pressures, such as in a vacuum, aid the release of oxygen in gas form without the need foradditions of deoxidizers such as silicon, aluminum, or titanium, which form nonmetallic inclusions in steel.Additionally, the carbon content may be reducedmore readily at low pressure (because it combines withoxygen to form carbon monoxide and is released in gaseous form), resulting in a more ductile steel.
Moreover, hydrogen gas causes embrittlement, low ductility, and blow holes in steel; vacuumtreatment more readily removes hydrogen from the steel. Hence the use of deoxidizing processes resultin more efficient processing and cleaner steel.
26 The purpose of these surface treatments is to make the steel billet softer and more ductile(annealing); in the case of surface grinding, seam and folds are removed.
27 The rolling process, however, can be optimized for various quality levels. The rolling process forhigher quality steel, such as for cold heading quality and other surface sensitive products, must bedesigned to maximize surface integrity. This is managed by the number of rolling stands used to get to aspecific end diameter, the design of the reductions taken at each step, and the design of the guidingequipment used to keep the steel moving on the proper path through the mill.

I 15
along which the coiled rod travels prior to being collected, tied, compacted, and readied forshipment. Wire rod mills typically consist of 22 to 29 rolling stands and the specialized Stelmorconveyor deck;28 the need for uniform metallurgical properties requires close temperaturecontrol accomplished by accelerating or retarding the rod's cooling as it is rolled and conveyedalong the Stelmor deck. This is accomplished by water quench, forced air drafts, or by loweringremovable hoods overtop the deck. Metallurgical quality, temperature, and dimensionaltolerance usually are inspected in line.
Exiting the reheat furnace, the billet is initially reduced on a roughing mill (which usuallyconsists of approximately five stands). It then is passed through and successively reduced in sizeon several more stands, termed intermediate rolling. After the last intermediate rolling stand,the rolling mill usually splits into dual lines and the product is passed along to a pre finishing millwhich reduces it further in diameter. Rod mills often employ a �twist�mill for primary andintermediate rolling, but the final rolling is nearly always on a no twist Morgan vee mill (the rollsin each of approximately five stands are set a 90 degree angles to allow the rod to be rolledwithout twisting). This produces a nearly uniform non oriented grain structure in the steel.
Cooling stageAfter exiting the last finishing stand, the rod is coiled into concentric loops and placed
on a conveyor which moves the hot wire rod along while it cools. During rolling, the rod iswater cooled as it travels along the Stelmor deck; cooling practices are varied depending on thedesignated end use of the rod and the customer's preferences. The speed at which the rod iscooled affects the consistency and formation of its metallurgical structure (grain structure andphysical properties such as tensile strength). It also affects scale buildup, which determinesyield losses at the wire drawer. The cooling rate may be varied through the use of removablecovers (insulating hoods which may be independently raised or lowered) over the deck orblown air cooling, or a combination of the two, or through varying the speed of the roller table.The end user often specifies the cooling practice of the rod purchased.
At the end of the cooling deck, workers crop the ends of each rod to remove the part ofthe rod which may be of lower quality due to uneven temperature control; the cropped endsare also used for testing and inspection. The rod is then collected onto a carrier, transferred to a�c� hook, compacted, tied, and readied for shipment, or for further finishing or in housefabrication. Figure I 1 illustrates the reheat through cooling stages of the wire rod productionprocess.
Domestic producers manufacture various types of wire rod on essentially the sameequipment, in the same facilities, and with the same production personnel. While changes toproduction processes are limited, changes in chemical composition, alloying elements and otherrawmaterials, stand fittings, and cooling speed determine the quality of the wire rod produced.
28 The Stelmor conveyor deck allows for controlled cooling of the wire rod. The cooling speed impartscertain physical characteristics, thereby enabling producers to produce a wider range of wire rodqualities. Likewise, the Stelmor deck may be optimized for specific end products. For example, ***. Most,if not all, U.S. wire rod producers have installed controlled cooling capacities.
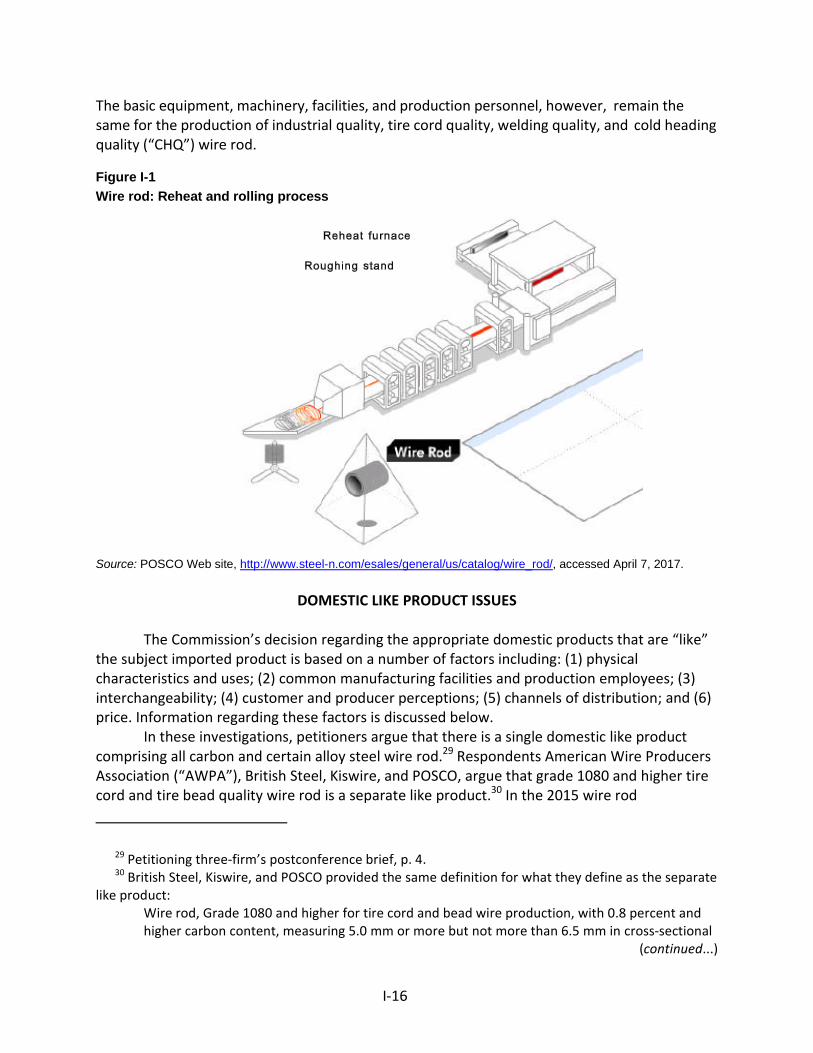
I 16
The basic equipment, machinery, facilities, and production personnel, however, remain thesame for the production of industrial quality, tire cord quality, welding quality, and cold headingquality (�CHQ�) wire rod.
Figure I-1
Wire rod: Reheat and rolling process
Source: POSCO Web site, http://www.steel-n.com/esales/general/us/catalog/wire_rod/, accessed April 7, 2017.
DOMESTIC LIKE PRODUCT ISSUES
The Commission�s decision regarding the appropriate domestic products that are �like�the subject imported product is based on a number of factors including: (1) physicalcharacteristics and uses; (2) common manufacturing facilities and production employees; (3)interchangeability; (4) customer and producer perceptions; (5) channels of distribution; and (6)price. Information regarding these factors is discussed below.
In these investigations, petitioners argue that there is a single domestic like productcomprising all carbon and certain alloy steel wire rod.29 Respondents American Wire ProducersAssociation (�AWPA�), British Steel, Kiswire, and POSCO, argue that grade 1080 and higher tirecord and tire bead quality wire rod is a separate like product.30 In the 2015 wire rod
29 Petitioning three firm�s postconference brief, p. 4.30 British Steel, Kiswire, and POSCO provided the same definition for what they define as the separate
like product:Wire rod, Grade 1080 and higher for tire cord and bead wire production, with 0.8 percent andhigher carbon content, measuring 5.0 mm or more but not more than 6.5 mm in cross sectional
(continued...)

I 17
investigations, which had the same scope as these investigations, the Commission defined asingle domestic like product that was coextensive with the scope of the investigations.31 In the2002 wire rod investigations, the Commission considered arguments regarding certain tire cord,tire bead, CHQ, and clean steel precision bar in coils wire rod and found a single domestic likeproduct.32
Physical characteristics and uses
Tire cord and tire bead quality wire rod is used to manufacture tire reinforcementproducts.33 Grade 1080 and higher tire cord and tire bead quality wire rod is a high carbon wirerod,34 at or above 0.8 percent,35 is between 5.0 mm and 6.5 mm in cross sectional diameter,and free of impurities and defects.36 Key technical parameters for tire cord and tire beadinclude steel cleanliness, segregation, surface quality, decarburization and dimensionaltolerances.37 Low magnesium content of 0.3 to 0.6 percent is necessary to establish sufficientductility to produce the thin strands required for tire cord and tire bead.38
(�continued)diameter, low manganese content in the range of 0.25 0.6 percent, and having no inclusionsgreater than 20 microns.
Respondent British Steel�s postconference brief, p. 1; respondent Kiswire�s postconference brief, p. 22;and respondent POSCO�s postconference brief, p. 7.
31 Carbon and Alloys Steel Wire Rod from China, Inv. Nos 701 TA 512 and 731 TA 1248 (Final), USITCPublication 4509, January 2015, p. 6. In the 2015 investigations, no party, however, argued that theCommission should adopt a definition of the domestic like product different from that in the preliminarydeterminations, in which the Commission found that all wire rod products of the type described in thescope of the investigations comprised a single domestic like product. Ibid.
32 Carbon and Certain Alloy Steel Wire Rod from Brazil, Canada, Germany, Indonesia, Mexico,Moldova, Trinidad and Tobago, Turkey, and Ukraine, Inv. Nos. 701 TA 417 421 and 731 TA 953, 954,956 959, 961, and 962 (Final), USITC Publication 3546 (October 2002), pp. 7 12.
33 Respondent British Steel�s postconference brief, p. 24.34 Respondent POSCO�s postconference brief, p. 735 Respondent POSCO�s postconference brief, p. 7 and respondent Kiswire�s postconference brief, p.
2. Kiswire notes that the standard carbon content for tire cord and tire bead quality wire rod haschanged from 0.72 0.82 percent in 2001 to 0.8 percent and above, with some tire producers requiring0.95 and 1.0 percent carbon content. Respondent Kiswire�s postconference brief, p. 3.
36 Respondent POSCO�s postconference brief, pp. 7 8. POSCO notes that the same stringentspecifications do not typically exist for other qualities of wire rod.
37 Respondent British Steel�s postconference brief, p. 24. British Steel argues that the levels andtesting requirements for these parameters are significantly more demanding and extensive than for thecommercial carbon counterparts. Cleanliness testing requires ***. Respondent British Steel�spostconference brief, p. 25.
38 Respondent Kiswire�s postconference brief, p. 4.

I 18
Wire rod manufacturers must undergo an exacting approval process in order to sell totire cord manufacturers.39 The tire cord manufacturing process is highly demanding, convertinga 5.5 mm diameter wire rod into a twisted, multi filament cord, with wire diameters that can beless than 0.20 mm, via multiple drawing, patenting and stranding operations.40 Tire bead isdirectly drawn, without any intermediate heat treatment operation to restore ductility, from5.5 mm to wire dimensions approaching 1.0 mm.41
Petitioners argue that carbon content is one characteristic that demonstrates thecontinuum nature of the product, not a distinguishing factor. They note that other wire rodproducts than tire cord and tire bead quality wire rod have carbon levels at 0.8 percent ormore.42
Manufacturing facilities and production employees
For tire cord and tire bead quality wire rod, the steelmaking process is tightly managedto control the cleanliness of the steel and to engineer the inclusion species for both bead andcord products. This is done through the restrictions in the use of alloy materials,43 andminimization of impurities which, according to respondents, can only be sufficiently controlledfor by using the BOF production process.44 Wire rod produced through the EAF processallegedly results in end products containing impurities.45 According to respondents, theinclusion of these impurities leads to wire rod with a greater likelihood of surface cracking and ahigher failure rate (breakage) because of deterioration to its drawability and mechanicaldescaling, attributes that are unacceptable for auto and tiremanufacturers� specifications forthe steel cord used in tires.46
Petitioners, however, note that the production of billet at the melt stage may be doneusing either the EAF47 or BOF process, and the wire rod producers may produce their own
39 Respondent POSCO�s postconference brief, p. 9. As tire cord and tire bead quality wire rod isultimately incorporated into tires, no auto manufacturer would accept tires that have not been madewith certified tire cord or tire bead quality wire rod and no tire manufacturer would take that risk.
40 Respondent British Steel�s postconference brief, p. 24. and respondent Kiswire�s postconferencebrief, p. 3.
41 Respondent British Steel�s postconference brief, p. 24.42 Petitioning three firm�s postconference brief, exhibit 1, p. 5, also noting that ***. Petitioner Nucor
included ***. Petitioner Nucor�s postconference brief, exhibit 1 1.43 Respondent British Steel�s postconference brief, pp. 25 26.44 Respondent POSCO�s postconference brief, p. 12. Respondents also note that controlled casting
speeds and *** are needed to produce grade 1080 and higher tire cord and tire bead quality wire rod.Respondent British Steel�s postconference brief, p. 26.
45 Respondent POSCO�s postconference brief, p. 12 and respondent Kiswire�s postconference brief, p.7. ***. Petitioning three firms� postconference brief, exhibit 8.
46 Respondent POSCO�s postconference brief, p. 12.47 ***. Nucor�s postconference brief, exhibit 1.

I 19
billets or may purchase billets from either an EAF or BOF producer.48 Accordingly, petitionersargue, similarities and differences in production processes are more appropriately addressedstarting with the wire rod rolling stage, where the processes for making grade 1080 tire cordand tire bead wire rod are largely identical to the processes for making other wire rod.49
Interchangeability
Respondents state that grade 1080 tire cord and tire bead wire rod is notinterchangeable with any standard wire rod. Tire cord and tire bead wire rod are designed tostringent specifications for the automotive sector.50 Standard wire rod cannot be used for thehigh strength, low weight applications for which grade 1080 tire cord and tire bead wire rod isdesigned and produced.51 Tire cord is often required to be drawn to filaments 0.15 0.3 mmrequiring very clean steel, whereas it is rare for a high carbon grade to be drawn below 1.0mm.52
Respondents further state that tire cord and tire bead quality wire rod are solely used toproduce tire cord and tire bead for the automotive sector. In contrast, other wire rod can beused in a multitude of other applications.53 Because of its higher carbon content, higher quality,and higher cost, it is not economically feasible to purchase tire cord or tire bead quality wirerod to use in an industrial application.54
Petitioners argue that different products positioned along the wire rod continuum aregenerally not interchangeable with one another because they would not meet the specificationrequired for the end use.55
Customer and producer perceptions
According to respondents, tire cord and bead wire rod producers and their downstreamsupply chains consider the product to be distinct from other types of wire rod. Consumers havedifferent product specifications that require producers to employ different manufacturing
48 ***. Respondent AWPA�s postconference brief, p. 25 and exhibit 21. ***. ***, April 26, 2017.49 Petitioning three firm�s postconference brief, exhibit 1, n. 4, p. 8.50 Respondent POSCO�s postconference brief, p. 9.51 Respondent Kiswire�s postconference brief, p. 5.52 British Steel also notes that in the instances when tire wire manufacturers utilize �high carbon�
grades for bead applications, these products have specific product applications that make themdissimilar to the industrial high carbon grades utilized in the making of such products as bedding andseating wire. Respondent British Steel�s postconference brief, p. 27.
53 Respondent POSCO�s postconference brief, p. 8.54 Respondent POSCO�s postconference brief, p. 9 and respondent Kiswire�s postconference brief, p.
5.55 Petitioning three firm�s postconference brief, exhibit 1, p. 7.

I 20
process routes and controls.56 POSCO argues that none of the petitioners actively marketthemselves as producing grade 1080 tire cord or tire bead quality wire rod.57
Petitioners argue that domestic producers make a large variety of specialized wire rodproducts, all of which are distinctly different from one another yet appear along the samecontinuum of wire rod products.58 Other wire rod products than grade 1080 tire cord and tirebead quality wire rod must also be produced to exacting standard, petitioners argue.59
Channels of distribution
Although the Commission did not collect separate data specific to U.S. producers�shipments of tire cord and tire bead quality wire rod, U.S. producers� shipments to end usersaccounted for 85.4 to 92.4 percent of total U.S. shipments during 2014 16. U.S. producer ***,which accounted for *** percent of U.S. producers� U.S. shipments of tire cord and tire beadquality wire rod in 2016, shipped no less than *** percent of its wire rod to end users from2014 to 2016.
Respondents state that tire cord and tire bead quality wire rod is sold exclusively to theautomotive sector,60 namely producers of grade 1080 and higher tire cord and tire bead.61
Respondents claimed that producers of 1080 tire wire products typically engage directly withmanufacturers of wire rod whereas buyers of commodity high carbon grades will also buy fromtraders. Tire wire product specifications are more technically complex and subject to moreformal trial and development programs (due in part to being much more quality/safetycritical).62 In comparison, respondents contend that standard wire rod is bought via a thirdparty, tends to be commodity grade product, and price tends to be a more important factor.63
Petitioners argue that all wire rod is sold overwhelmingly to end users. They contendthat all wire rod travels through similar channels of distribution, highlighting that Heico�switness testified that his company purchases low carbon, high carbon, tire bead, and weldingtire rod and that the witness for respondent Bekaert stated that one third of his company�swire rod purchases were of tire cord and tire bead wire rod.64
56 Respondent British Steel�s postconference brief, p. 27.57 Respondent POSCO�s postconference brief, p. 11.58 Petitioning three firm�s postconference brief, exhibit 1, p. 10.59 Petitioning three firm�s postconference brief, exhibits 9 and 10. Evraz notes that it produces wire
rod that must meet demanding requirements and rigorous standards athttps://www.evrazna.com/Products/WireRod/tabid/80/Default.asp, accessed April 24, 2017.
60 Respondent POSCO�s postconference brief, p. 10.61 Respondent Kiswire�s postconference brief, p. 6.62 Respondent British Steel�s postconference brief, p. 28. Tire cord and tire bead wire producers must
work closely with wire rod mills in relationships that stretch over years. Respondent Kiswire�spostconference brief, p. 6.
63 Respondent British Steel�s postconference brief, p. 28.64 Petitioning three firm�s postconference brief, exhibit 1, p. 7.

I 21
Price
Respondents argue that tire cord and tire bead quality wire rod sell at �substantially�higher prices than do standard wire rod products.65 POSCO stated that its tire cord wire rod ispriced approximately 70 percent higher than other wire rod products.66 Petitioners, however,state that there is a continuum of prices for all wire rod products, with industrial grades at thelow end and high carbon, specialty grades at the high end.67
65 Respondent British Steel�s postconference brief, p. 28.66 Respondent POSCO�s postconference brief, p. 13. POSCO�s average selling prices, on an ex works
basis, were $*** per short ton for tire cord quality wire rod and *** per short ton for low carbon wirerod. Kiswire reported that it paid $***.
67 Petitioning three firm�s postconference brief, exhibit 1, p. 10.


II-1
PART II: CONDITIONS OF COMPETITION IN THE U.S. MARKET
U.S. MARKET CHARACTERISTICS
Wire rod is a hot-rolled intermediate steel product used in downstream products for theconstruction, automotive, energy, and agriculture industries. These industries account for thevast majority of U.S. demand for wire rod. Most wire rod in the United States is soldcommercially to wire drawers, who use it to produce a wide array of downstream wireproducts. U.S. producers also draw wire rod internally; U.S.-produced wire rod that wasinternally consumed or transferred to related firms increased from *** percent of U.S.producers’ U.S. commercial shipments in 2014 to *** percent in 2016. No importer of subjectwire rod reported internally consuming and/or transferring the product to related firms.
Apparent U.S. consumption of wire rod decreased during 2014-16. Overall, apparentU.S. consumption in 2016 was *** percent lower than in 2014.
CHANNELS OF DISTRIBUTION
During 2014-16, U.S. producers and importers of wire rod from *** sold mostly to endusers, while importers of wire rod from *** sold mostly to distributors (table II-1). Importers ofwire rod from *** sold varying but roughly equivalent amounts to both distributors and endusers.
Table II-1Wire rod: U.S. producers’ and importers’ U.S. shipments, by sources and channels of distribution,2014-16
* * * * * * *
GEOGRAPHIC DISTRIBUTION
U.S. producers reported selling wire rod to all regions in the contiguous United States(table II-2). Importers also reported selling to all regions, but a greater number reported sellingto the Central Southwest, Midwest, and Southeast regions. For U.S. producers, 16.6 percent ofsales were within 100 miles of their production facilities, 72.5 percent were between 101 and1,000 miles, and 10.9 percent were over 1,000 miles. Importers sold 50.3 percent within 100miles of their U.S. points of shipment, 42.8 percent between 101 and 1,000 miles, and6.9 percent over 1,000 miles.

II-2
Table II-2Wire rod: Geographic market areas in the United States served by U.S. producers and importers
Region U.S. producers Importers
Northeast 6 7
Midwest 7 11
Southeast 6 13
Central Southwest 6 11
Mountain 5 3
Pacific Coast 6 2
Other (All other markets, including AK, HI, PR, and VI) 1 0
All regions (except Other) 4 2
Reporting firms 8 16Source: Compiled from data submitted in response to Commission questionnaires.
SUPPLY AND DEMAND CONSIDERATIONS
U.S. supply
Domestic production
Based on available information, U.S. producers of wire rod have the ability to respond tochanges in demand with moderate changes in the quantity of shipments of U.S.-produced wirerod to the U.S. market. The main contributing factors to this degree of responsiveness of supplyare the availability of some unused capacity and the ability to produce alternate products. Thissupply responsiveness is mitigated by a limited ability to shift shipments to other markets andrelatively low inventory levels, however.
Industry capacity
Domestic capacity utilization increased from 2014 to 2016, from 75.8 percent in 2014 to77.3 percent in 2016. Overall capacity and production both decreased during this time, by5.2 percent and 3.4 percent, respectively. Capacity decreased from 4.9 million short tons in2014 to 4.6 million short tons in 2016, due largely to the shutdown of U.S. producerArcelorMittal’s Georgetown plant,1 and production decreased from 3.7 million short tons in2014 to 3.6 million short tons in 2016.2 This relatively moderate level of capacity utilizationsuggests that U.S. producers may have some ability to increase production of wire rod inresponse to an increase in prices.
1 ArcelorMittal press release, http://usa.arcelormittal.com/news-and-media/announcements/2015/may/05-14-2015, May 14, 2015.
2 While two U.S. producers, ***, reported adding *** short tons and *** short tons of capacity,respectively, during 2014-16, the shutdown of ArcelorMittal’s plant reduced domestic capacity by ***short tons.

II-3
Respondents argue that the domestic industry’s ability to produce certain high-carbonproducts such as 1080 grade tire cord and tire bead is either limited or non-existent, and thatthe production method used by domestic producers (electric arc furnace, or “EAF”) does notproduce the same quality of product as the basic oxygen furnace (“BOF”) method used by someforeign producers.3 Petitioners argue that the domestic industry is capable of producing theentire range of wire rod products, including low/medium-low carbon industrial/standard wirerod, high/medium-high carbon industrial/standard quality wire rod, tire cord quality and tirebead quality wire rod, welding quality wire rod, cold heading quality wire rod, and otherspecialty carbon and alloy quality wire rod.4
Alternative markets
As a percentage of total shipments, U.S. producers’ exports decreased irregularly, from1.2 percent in 2014 to 1.1 percent in 2016. U.S. producers’ total export shipments declinedfrom *** short tons in 2014 to *** short tons in 2015 before rising to *** short tons in 2016.*** were reportedly their principal export markets. These export levels indicate that U.S.producers have a limited ability to shift shipments between the U.S. market and other marketsin response to price changes.
Inventory levels
U.S. producers’ inventory levels remained relatively unchanged during 2014-16,increasing slightly from *** short tons in 2014 to *** short tons in 2016. Relative to totalshipments, U.S. producers’ inventories increased from 7.1 percent in 2014 to7.3 percent in 2016. These inventory levels suggest that U.S. producers may have a limitedability to respond to changes in demand with changes in the quantity shipped from inventories.
Production alternatives
Six of 8 responding U.S. producers stated that they could switch production from wirerod to other products, and seven reported production of other products on the sameequipment as wire rod. Six firms reported producing concrete reinforcing bars and rods on thesame equipment as wire rod, two reported producing tool steel and high nickel steel, tworeported producing ball bearing steel, and three reported producing other products, includingcoiled rebar, round bar, and merchant bar. With the exception of ball bearing steel, which saw
3 Conference transcript, pp. 25 (Johnson), 39 (Hughes), 42-44, 67-68 (Minnick), 45-46 (Ryoo), 47, 86(Hwang); British Steel’s postconference brief, pp. 22-23, and 25; AWPA’s postconference brief, pp. 22-25; Kiswire’s postconference brief, p. 1-4, and exhibit 1 pp. 5-9; POSCO’s postconference brief, pp. 25-26.
4 Conference transcript, pp. 121 (Armstrong), 128-129 (Nystrom), 133-134 (Canosa), 155-158 (Ashby,Nystrom); Petitioning three-firms’ postconference brief, pp. 19-20 and exhibits 7-8; Petitioner Nucor’spostconference brief, exhibits 1-1–1-3, and 1-9.

II-4
an increase in production of *** percent between 2014 and 2016, U.S. producers’ productionof these alternate products decreased by ***, *** from 2014 to 2016. In general, U.S.producers reported that the only factor affecting their ability to shift production was thechangeover time needed to switch between product lines.
Supply constraints
None of the eight responding U.S. producers reported refusing, declining, or beingunable to supply wire rod since January 2014. *** reported that it had turned down orders dueto an inability to meet competitors’ prices, but not due to a supply shortage.
Subject imports from subject countries5
The tabulation below provides a summary of the supply of wire rod from reportingsubject countries;6 additional data are provided in Part VII. Reported production capacity inBelarus, Italy, and the United Kingdom increased, whereas production capacity in Korea,Turkey, and Ukraine declined. Reported capacity utilization increased for five of the subjectcountries (Korea, South Africa, Turkey, Ukraine, and the United Arab Emirates) and declined forfour (Belarus, Italy, Spain, and the United Kingdom). All reporting subject countries had capacityutilization rates over *** percent in 2016, and Italy, Korea, Turkey, and the United ArabEmirates had capacity utilization rates of above *** percent. Aside from South Africa, mostcountries reported small inventories-to-total shipments ratios (*** percent); South Africareported inventory-to-total shipment ratios of *** percent in 2014 and *** percent in 2016.These ratios decreased between 2014 and 2016 for five of the nine reporting subject countries.In 2016, foreign producers’ home market shipments accounted for more than *** percent oftheir total shipments for Belarus, Italy, Korea, South Africa, Spain, and Turkey, while exports tothird-country markets accounted for more than *** percent of their total shipments forUkraine, the United Arab Emirates, and the United Kingdom.
Tabulation:Wire rod: Foreign industry factors that affect ability to increase shipments to the U.S. market
* * * * * * *
Nonsubject imports
Nonsubject imports accounted for 60.2 percent of total U.S. imports in 2016. The largestsource of nonsubject imports as well as the largest single import source overall during 2016 was
5 For data on the number of responding foreign firms and their share of U.S. imports from each of thesubject countries, please refer to Part I, “Summary Data and Data Sources.”
6 No questionnaire responses were submitted by Russian producers.

II-5
Canada. Canada alone accounted for *** percent of nonsubject imports and *** percent of allimports in 2016.
U.S. demand
Based on available information, the overall demand for wire rod is likely to experiencemoderate changes in response to changes in price. Most firms reported that there are no viablesubstitutes for the majority of end uses of wire rod, which decreases responsiveness. However,as an intermediate product that represents a large share of the cost of its downstreamproducts, increases in the price of wire rod increases the demand for imported downstreamproducts.
End uses and cost share
Demand for wire rod in the United States depends on the demand for the downstreamproducts that utilize it. The most commonly reported end uses of wire rod across all firms werevarious forms of wire, including wire mesh, welded wire mesh, industrial wire, rail tie wire, wirerope, wire panels, and shaped wire. Other products included nails, display racks, shelving,concrete reinforcement, chain-link fencing, floor grating, garment hangers, fan grills, staplesand fasteners, PC strand, suspension springs, various other springs, cold finished bar, coldheaded parts, tire cord, and tire bead. U.S. producers were also asked to list separately the enduses for the wire rod they consumed internally and/or transferred to related firms. Most of theend uses for these products were the same as those they commercially sold. While no U.S.producers listed products that they consumed internally and/or transferred to a related partythat they did not sell commercially, some listed products that they sold commercially but didnot internally consume and/or transfer to related firms; those products were wire rope,shelving, cold finished bar, and tire bead. The end use products that were listed by importers ofsubject product but not by U.S. producers were suspension springs, other springs, shaped wiresfor the oil and gas and automotive industries, and “brake piston cup(s).”7
Wire rod accounts for a large share of the cost of the majority of end-use products inwhich it is used. Reported cost shares for various forms of most downstream wire productsranged from 55 to 87 percent. Several importers reported cost shares of 100 percent. Reportedcost shares for products in which wire rod is less of a cost component included cold drawn bar(50 percent), tire cord/bead (40-50 percent),8 fabricated wire products (40 percent), coldheaded parts (30-35 percent), and shaped wires for the oil and gas and automotive industries(20 percent).
7 A brake piston cup is a stopper mechanism used in master cylinders of vehicles. These mechanismstypically contain a return (adjusting) spring. See https://www.cardone.com/tech-help/brakes/how-it-works-and-best-practices/what-is-the-master-cylinder.
8 In total, four firms (***) listed tire cord and/or tire bead as an end-use product for the wire rod theysell. ***

II-6
Business cycles
Most responding U.S. producers (6 of 8) reported that the wire rod market was subjectto business cycles, while most importers (18 of 25) reported that it was not. Among the U.S.producers reporting the existence of business cycles, most stated that construction demandwas seasonal and/or driven by changes in weather. *** also stated that the end-use productsmade from wire rod are used mainly in construction and automotive markets, and *** reportedthat the wire rod market was subject to seasonal cycles in manufacturing. Among the sevenimporters reporting the existence of business cycles, most highlighted seasonal cycles inconstruction activity. One importer also noted seasonal changes in the mining industry, and onereported seasonal changes in agriculture as affecting the wire rod market. Additionally, threementioned the automotive industry, with one firm (***) stating that sales of lower value wirerod products fluctuate with the construction industry, and sales of higher value productsfluctuate with the automotive and oil and gas industries.
Four of eight responding U.S. producers reported distinct conditions of competition inthe wire rod market, with three highlighting an increase in imports and global overcapacity andoversupply, and one (***) reporting “cheaper foreign rod,” better quality wire rod, and moresources. Two of 25 importers also reported distinct conditions of competition, with *** statingthat sales to the automotive sector can be impacted by differences between real and apparentdemand, and *** reporting that “low prices from subject countries depress the market.”9
Demand trends
U.S. demand for wire rod is driven primarily by the construction and automotivemarkets. In general, demand for tire cord and tire bead is driven by advances and changes inthe automotive industry, while demand for industrial grade products is driven by theconstruction industry.10 Between 2014 and 2016, overall construction spending and vehiclesales both increased. The total value of construction put in place (seasonally adjusted)increased by 21.7 percent between January 2014 and December 2016 (figure II-1). Total vehiclesales increased by 18.4 percent between January 2014 and December 2016 (figure II-2).
9 *** reported importing only from nonsubject country Canada during 2014-16.10 Conference transcript, pp. 104-105 (Cameron, Stauffer); ***’s postconference brief, exhibit 1 p. 10.

II-7
Figure II-1Construction spending: Total value of construction put in place in the United States, notseasonally adjusted and seasonally adjusted annual rate, monthly, January 2014-February 2017
Source: U.S. Census Bureau, retrieved April 19, 2017.
Figure II-2Vehicle sales: Total vehicle sales, millions of units, seasonally adjusted annual rate, monthly,January 2014-March 2017
Source: St. Louis FRED, retrieved April 19, 2017.
0
200
400
600
800
1,000
1,200
1,400
0
20
40
60
80
100
120
2014 2015 2016 2017
Seasonally
adju
ste
dannualra
te(b
illio
ns
of
dolla
rs)
Bill
ions
of
dolla
rs(n
ot
seasonally
adju
ste
d)
Total construction(not seasonally adjusted)
Total construction(seasonally adjusted annual rate)
14.0
14.5
15.0
15.5
16.0
16.5
17.0
17.5
18.0
18.5
19.0
2014 2015 2016 2017
Mill
ions
of
vehic
les
Vehicle Sales

II-8
Most U.S. producers reported that overall U.S. demand for wire rod had decreased sinceJanuary 2014 (table II-3). Four of these firms cited increased wire rod imports as a reason. OneU.S. producer reported that overall demand for wire rod had decreased due to an increase inimports of downstream wire products. Importer responses were more mixed; a plurality (8firms) reported that U.S. demand had increased since January 2014, while 6 reported thatdemand had not changed, 5 reported that it had decreased, and 4 reported that it hadfluctuated.
At the staff conference, representatives from the domestic industry generally statedthat domestic demand for wire rod had been flat to weak in recent years.11
Table II-3Wire rod: Firms’ responses regarding U.S. demand and demand outside the United States
Item Increase No change Decrease Fluctuate
Demand in the United States
U.S. producers 0 1 7 0
Importers 8 6 5 4
Demand outside the United States
U.S. producers 0 0 5 1
Importers 4 3 4 7Source: Compiled from data submitted in response to Commission questionnaires.
Substitute products
Only two U.S. producers (***) reported that there are substitutes for wire rod. ***reported that rebar, fibers, and wood are substitutes in construction applications, and ***reported that galvanized wire was a substitute for wire rod in fencing products. All of the 24responding importers reported that there are no substitutes for wire rod.
SUBSTITUTABILITY ISSUES
The degree of substitution between domestic and imported wire rod depends uponsuch factors as relative prices, quality (e.g., grade standards, reliability of supply, defect rates,etc.), and conditions of sale (e.g., price discounts/rebates, lead times between order anddelivery dates, payment terms, product services, etc.). Based on available data, staff believesthat for products of the same quality there is high degree of substitutability betweendomestically produced wire rod and wire rod imported from subject sources.Substitutability between industrial quality (i.e. low- or medium-low-carbon) wire rod andhigher-end (i.e. high- or medium-high carbon) wire rod products is more limited, however, andto the extent that one source specializes in one quality over another, substitutability betweensources may be more limited.
11 Conference transcript, pp. 143 (Armstrong, Nystrom), 165 (Canosa); Petitioning three-firms’postconference brief, p. 18.

II-9
Lead times
Wire rod is primarily produced-to-order. U.S. producers reported that 97.1 percent oftheir commercial shipments were sold on a produced-to-order basis, with lead times averaging27.6 days. The remaining 2.9 percent of their commercial shipments came from inventories,with lead times averaging 4.8 days. Importers reported that 93.8 percent of their commercialshipments were sold on a produced-to-order basis, with lead times averaging 109.2 days. Theremaining 6.1 percent of their commercial shipments came from inventories, with lead timesaveraging 10.7 days.
At the staff conference, some respondents testified that lead times from domesticproducers had increased. Heico stated that domestic lead times had increased from 4-6 weeksto 6-8 weeks.12 Bekaert stated that one domestic mill had placed them on monthly allocations,and that lead times by the four petitioning firms had been extended.13 Mid-South Wire statedthat domestic delivery times had been irregular and unpredictable, and that they had beenplaced on “controlled order entry.”14 Insteel stated that during 2016 two U.S. producersindicated that they could either not fulfill Insteel’s entire order or that they could only deliver ata later date.15
Factors affecting purchasing decisions
Purchasers responding to lost sales lost revenue allegations16 were asked to identify themain purchasing factors their firm considered in their purchasing decisions for wire rod. Themost commonly listed first-most important purchasing factor was quality or the ability to meetfirms’ specifications (mentioned by 8 firms), followed by price/total cost (6 firms). Other first-most important factors included delivery, vendor relationship, and availability (mentioned by2 firms apiece), and that the supplier was an approved source (1 firm). The most commonlylisted second-most important factor was quality (mentioned by 10 firms), followed byprice/total cost (6 firms). The most commonly listed third-most important factor wasdelivery/lead time (mentioned by 10 firms), followed by price/total cost (7 firms). Two firms(***) specifically noted a preference for wire rod produced by the BOF method due to the low-residual products this method is capable of producing.17 Another noted that only one domesticmill had been qualified to produce its *** rod.
12 Conference transcript, p. 35 (Moffitt).13 Conference transcript, p. 40 (Hughes).14 Conference transcript, pp. 24-25 (Johnson).15 Conference transcript, pp. 31-32 (Stauffer).16 This information is compiled from responses by purchasers identified by Petitioners or other U.S.
producers in their lost sales lost revenue allegations. See Part V for additional information.17 “Low-residual” refers to the level of trace element contamination. High levels residual trace
elements impact the chemical properties of the steel products being produced.

II-10
Supplier certification
A number of firms reported that the qualification and certification process for somespecialty products – including tire cord and tire bead as well as suspension spring wire rod – arelengthier and more stringent than industrial grade products. Bekaert stated that it takesapproximately two years to qualify a new supplier of tire cord, and Kiswire stated that it takesroughly six months to a year to approve a supplier of wire bead and two years or more toapprove a steel tire cord supplier.18 *** reported that it took three to four years for it tocomplete the qualification process to provide suspension spring wire to one purchaser.19 Anumber of respondents stated that either no or few domestic producers were qualified tosupply 1080 grade tire cord or tire bead and/or suspension spring wire rod, and/or that theyhad attempted to qualify domestically produced 1080 grade tire cord but it did not always passquality standards.20
Comparison of U.S.-produced and imported wire rod
In order to determine whether U.S.-produced wire rod can generally be used in thesame applications as imports from Belarus, Italy, Korea, Russia, South Africa, Spain, Turkey,Ukraine, the United Arab Emirates, and the United Kingdom, U.S. producers and importerswere asked whether the products can always, frequently, sometimes, or never be usedinterchangeably. As shown in table II-4a, seven of eight U.S. producers reported that wire rodfrom the United States and each subject country is “always” interchangeable, and one U.S.producer, ***, reported that wire rod from these sources is “frequently” interchangeable. Asshown in tables II-4b and II-4c, seven of eight U.S. producers reported that wire rod from eachsubject country and nonsubject country is “always” interchangeable with one another.
Among importers, a plurality reported that wire rod from Belarus, Korea, South Africa,Spain, the United Arab Emirates, Ukraine, and the United Kingdom was “frequently”interchangeable with wire rod from the United States. Four of 11 responding importersreported that product from the United Kingdom was “sometimes” interchangeable withproduct from the United States. In additional comments, importers generally noted that thefactor most limiting interchangeability was quality. Several importers stated that domesticcapacity to produce higher-carbon grades (such as 1080 tire cord, tire bead, PC strand,suspension spring, and/or cold-heading quality wire rod) was limited. Three importers reported
18 Conference transcript, pp. 39-40 (Hughes), 41-43 (Minnick); AWPA’s postconference brief, exhibit19.
19 ***’s postconference brief, pp. 6-8, and exhibit A.20 Conference transcript, pp. 47-48 (Hwang), 49-50 (Bond), 109 (Minnick); Kiswire’s postconference
brief, exhibit 1 pp. 11-13.

II-11
that the type of furnace used by domestic producers (EAF) was less capable of producing thesehigher quality products than the BOF furnace that is used in some other countries.21
Table II-4aWire rod: Interchangeability between wire rod produced in the United States and in subjectcountries, by country pair
Country pairNumber of U.S. producers
reportingNumber of U.S. importers
reporting
A F S N A F S N
U.S. vs. subject countries:
U.S. vs. Belarus 7 1 0 0 2 5 2 0
U.S. vs. Italy 7 1 0 0 3 3 2 0
U.S. vs. Korea 7 1 0 0 3 5 2 1
U.S. vs. Russia 7 1 0 0 3 3 1 1
U.S. vs. South Africa 7 1 0 0 3 4 1 0
U.S. vs. Spain 7 1 0 0 2 5 2 1
U.S. vs. Turkey 7 1 0 0 4 4 2 1
U.S. vs. UAE 7 1 0 0 1 4 1 0
U.S. vs. Ukraine 7 1 0 0 3 4 2 0
U.S. vs. United Kingdom 7 1 0 0 2 5 4 0Note.--A=Always, F=Frequently, S=Sometimes, N=Never.
Source: Compiled from data submitted in response to Commission questionnaires.
Table II-4bWire rod: Interchangeability between wire rod produced in subject countries, by country pair
Country pair
Number of U.S. producersreporting
Number of U.S. importersreporting
A F S N A F S N
Subject country comparisons:
Belarus. vs. Italy 7 1 0 0 1 2 2 0
Belarus vs. Korea 7 1 0 0 2 2 1 0
Belarus vs. Russia 7 1 0 0 1 2 2 0
Belarus vs. South Africa 7 1 0 0 1 2 2 0
Belarus vs. Spain 7 1 0 0 1 2 3 0
Belarus vs. Turkey 7 1 0 0 2 3 2 0
Belarus vs. UAE 7 1 0 0 1 2 2 0
Belarus vs. Ukraine 7 1 0 0 1 3 2 0
Belarus vs. United Kingdom 7 1 0 0 1 3 2 0
Italy vs. Korea 7 1 0 0 1 2 2 0
Italy vs. Russia 7 1 0 0 2 2 1 0
Italy vs. South Africa 7 1 0 0 1 2 2 0
Italy vs. Spain 7 1 0 0 1 2 3 0Table continued on next page.
21 Mid-South Wire stated that mills in Korea, South Africa, Ukraine, and the United Kingdom supplyrod produced by the BOF method, and Bekaert stated that Turkey and Spain also supply BOF-producedwire rod. Conference transcript, pp. 25 (Johnson), 39 (Hughes).

II-12
Table II-4b--ContinuedWire rod: Interchangeability between wire rod produced in subject countries, by country pair
Country pair
Number of U.S. producersreporting
Number of U.S. importersreporting
A F S N A F S N
Subject country comparisons:
Italy vs. Turkey 7 1 0 0 3 2 1 0
Italy vs. UAE 7 1 0 0 1 2 2 0
Italy vs. Ukraine 7 1 0 0 1 2 2 0
Italy vs. United Kingdom 7 1 0 0 1 3 3 0
Korea vs. Russia 7 1 0 0 1 2 2 0
Korea vs. South Africa 7 1 0 0 1 4 0 0
Korea vs. Spain 7 1 0 0 1 3 2 0
Korea vs. Turkey 7 1 0 0 2 2 2 0
Korea vs. UAE 7 1 0 0 1 2 2 0
Korea vs. Ukraine 7 1 0 0 1 2 2 0
Korea vs. United Kingdom 7 1 0 0 2 4 1 0
Russia vs. South Africa 7 1 0 0 1 2 2 0
Russia vs. Spain 7 1 0 0 1 2 3 0
Russia vs. Turkey 7 1 0 0 3 2 1 0
Russia vs. UAE 7 1 0 0 1 2 1 1
Russia vs. Ukraine 7 1 0 0 1 2 2 0
Russia vs. United Kingdom 7 1 0 0 1 3 2 0
South Africa vs. Spain 7 1 0 0 1 2 3 0
South Africa vs. Turkey 7 1 0 0 2 2 2 0
South Africa vs. UAE 7 1 0 0 1 2 2 0
South Africa vs. Ukraine 7 1 0 0 1 2 2 0
South Africa vs. United Kingdom 7 1 0 0 1 3 2 0
Spain vs. Turkey 7 1 0 0 2 2 2 0
Spain vs. UAE 7 1 0 0 1 2 2 0
Spain vs. Ukraine 7 1 0 0 1 2 2 0
Spain vs. United Kingdom 7 1 0 0 1 4 2 0
Turkey vs. UAE 7 1 0 0 1 2 1 1
Turkey vs. Ukraine 7 1 0 0 1 3 2 0
Turkey vs. United Kingdom 7 1 0 0 1 3 2 0
UAE vs. Ukraine 7 1 0 0 1 2 2 0
UAE vs. United Kingdom 7 1 0 0 1 3 2 0
Ukraine vs. United Kingdom 7 1 0 0 1 3 2 0Note.--A=Always, F=Frequently, S=Sometimes, N=Never.
Source: Compiled from data submitted in response to Commission questionnaires.

II-13
Table II-4cWire rod: Interchangeability between wire rod produced in nonsubject countries and in the UnitedStates and subject countries, by country pair
Country pairNumber of U.S. producers
reportingNumber of U.S. importers
reporting
A F S N A F S N
Nonsubject country comparisons:
U.S. vs. Canada 7 1 0 0 2 4 3 0
U.S. vs. all other countries 7 1 0 0 1 3 6 2
Belarus vs. Canada 7 1 0 0 3 1 1 1
Belarus vs. all other countries 7 1 0 0 1 3 0 1
Italy vs. Canada 7 1 0 0 3 1 1 0
Italy vs. all other countries 7 1 0 0 1 2 1 1
Korea vs. Canada 7 1 0 0 3 2 1 0
Korea vs. all other countries 7 1 0 0 1 2 2 1
Russia vs. Canada 7 1 0 0 3 1 1 1
Russia vs. all other countries 7 1 0 0 1 2 0 1
South Africa vs. Canada 7 1 0 0 3 1 1 0
South Africa vs. all other countries 7 1 0 0 1 2 0 1
Spain vs. Canada 7 1 0 0 3 1 1 0
Spain vs. all other countries 7 1 0 0 1 2 0 1
Turkey vs. Canada 7 1 0 0 3 1 1 0
Turkey vs. all other countries 7 1 0 0 2 2 0 1
UAE vs. Canada 7 1 0 0 2 1 1 0
UAE vs. all other countries 7 1 0 0 1 2 0 1
Ukraine vs. Canada 7 1 0 0 3 1 1 0
Ukraine vs. all other countries 7 1 0 0 1 3 0 1
UK vs. Canada 7 1 0 0 3 1 2 0
UK vs. all other countries 7 1 0 0 1 2 1 1Note.--A=Always, F=Frequently, S=Sometimes, N=Never.
Source: Compiled from data submitted in response to Commission questionnaires.
In addition, U.S. producers and importers were asked to assess how often differencesother than price were significant in sales of wire rod from the United States, subject, ornonsubject countries. As seen in tables II-5a through II-5c, seven of eight U.S. producersreported that differences other than price were “never” significant for each countrycomparison. One U.S. producer, ***, reported that differences other than price were“sometimes” significant for each country comparison.
Among importers, responses were more varied. When comparing U.S. wire rod withwire rod from subject countries, a plurality of importers reported that differences other thanprice were “never” significant for most country comparisons. When comparing U.S. productwith product from Turkey, a plurality reported that differences other than price were“frequently” significant. When comparing U.S. product with product from Spain, an equalnumber of importers reported that differences other than price were “always” significant and

II-14
“never” significant (three firms apiece). In additional comments, a number of importers pointedto quality as being a significant factor other than price. One importer stated that its importsfrom Spain were of a higher grade tire cord quality; one stated that its imports from Korea didnot have the surface defects that wire rod from domestic mills do; one stated that domesticmills could not produce the tire cord or cold-heading quality product that the United Kingdomdoes; and two stated that its imports from Japan are of higher quality than domestic wire rod.Product availability/lead times were also noted as significant non-price factors by three firms,and three firms again reported that the BOF production process is capable of producing higherquality products than the EAF process.
Table II-5aWire rod: Significance of differences other than price between wire rod produced in the UnitedStates and in subject countries, by country pair
Country pairNumber of U.S. producers
reportingNumber of U.S. importers
reporting
A F S N A F S N
U.S. vs. subject countries:
U.S. vs. Belarus 0 0 1 7 2 1 2 3
U.S. vs. Italy 0 0 1 7 1 1 2 3
U.S. vs. Korea 0 0 1 7 2 2 3 3
U.S. vs. Russia 0 0 1 7 1 2 0 3
U.S. vs. South Africa 0 0 1 7 1 1 1 3
U.S. vs. Spain 0 0 1 7 3 1 1 3
U.S. vs. Turkey 0 0 1 7 1 4 3 3
U.S. vs. UAE 0 0 1 7 1 1 0 2
U.S. vs. Ukraine 0 0 1 7 1 2 0 3
U.S. vs. United Kingdom 0 0 1 7 2 1 1 3Note.--A = Always, F = Frequently, S = Sometimes, N = Never.
Source: Compiled from data submitted in response to Commission questionnaires.
Table II-5bWire rod: Significance of differences other than price between wire rod produced in subjectcountries, by country pair
Country pairNumber of U.S. producers
reportingNumber of U.S. importers
reporting
A F S N A F S N
Subject country comparisons:
Belarus. vs. Italy 0 0 1 7 1 1 0 1
Belarus vs. Korea 0 0 1 7 2 1 0 1
Belarus vs. Russia 0 0 1 7 1 1 0 1
Belarus vs. South Africa 0 0 1 7 1 1 0 1
Belarus vs. Spain 0 0 1 7 2 1 0 1
Belarus vs. Turkey 0 0 1 7 1 3 1 1
Belarus vs. UAE 0 0 1 7 1 1 0 1
Belarus vs. Ukraine 0 0 1 7 1 1 0 1
Belarus vs. United Kingdom 0 0 1 7 1 0 1 1Table continued on next page.
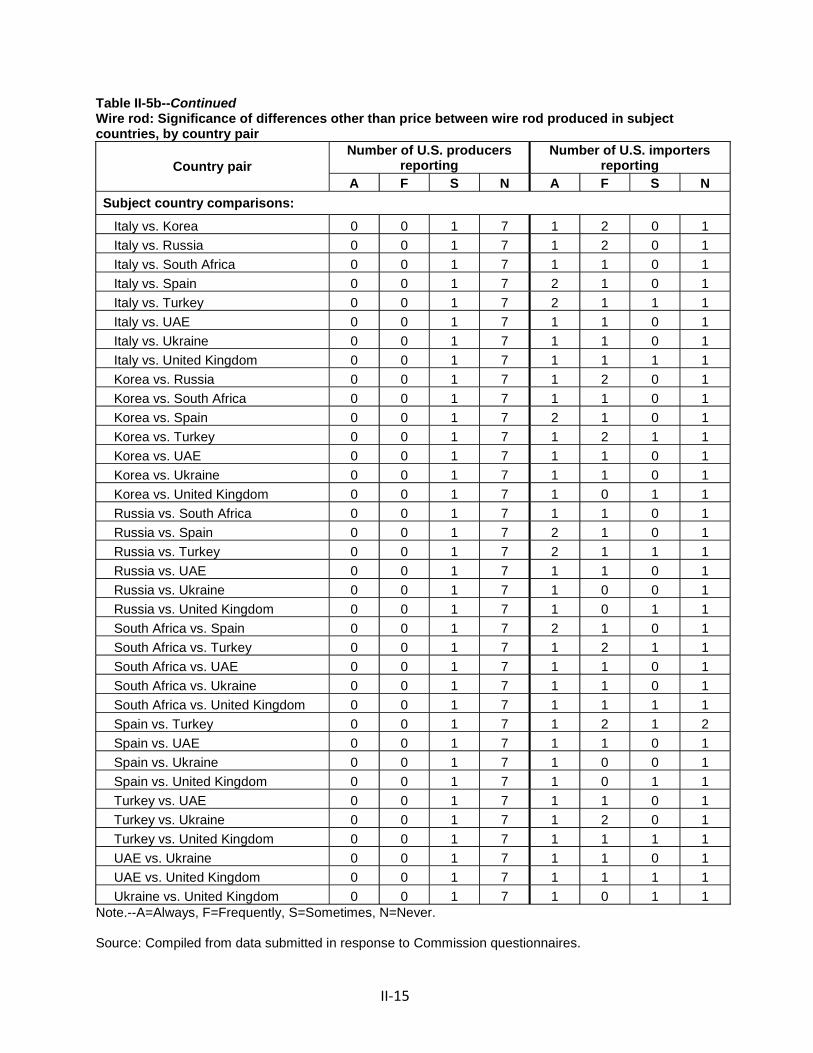
II-15
Table II-5b--ContinuedWire rod: Significance of differences other than price between wire rod produced in subjectcountries, by country pair
Country pairNumber of U.S. producers
reportingNumber of U.S. importers
reporting
A F S N A F S N
Subject country comparisons:
Italy vs. Korea 0 0 1 7 1 2 0 1
Italy vs. Russia 0 0 1 7 1 2 0 1
Italy vs. South Africa 0 0 1 7 1 1 0 1
Italy vs. Spain 0 0 1 7 2 1 0 1
Italy vs. Turkey 0 0 1 7 2 1 1 1
Italy vs. UAE 0 0 1 7 1 1 0 1
Italy vs. Ukraine 0 0 1 7 1 1 0 1
Italy vs. United Kingdom 0 0 1 7 1 1 1 1
Korea vs. Russia 0 0 1 7 1 2 0 1
Korea vs. South Africa 0 0 1 7 1 1 0 1
Korea vs. Spain 0 0 1 7 2 1 0 1
Korea vs. Turkey 0 0 1 7 1 2 1 1
Korea vs. UAE 0 0 1 7 1 1 0 1
Korea vs. Ukraine 0 0 1 7 1 1 0 1
Korea vs. United Kingdom 0 0 1 7 1 0 1 1
Russia vs. South Africa 0 0 1 7 1 1 0 1
Russia vs. Spain 0 0 1 7 2 1 0 1
Russia vs. Turkey 0 0 1 7 2 1 1 1
Russia vs. UAE 0 0 1 7 1 1 0 1
Russia vs. Ukraine 0 0 1 7 1 0 0 1
Russia vs. United Kingdom 0 0 1 7 1 0 1 1
South Africa vs. Spain 0 0 1 7 2 1 0 1
South Africa vs. Turkey 0 0 1 7 1 2 1 1
South Africa vs. UAE 0 0 1 7 1 1 0 1
South Africa vs. Ukraine 0 0 1 7 1 1 0 1
South Africa vs. United Kingdom 0 0 1 7 1 1 1 1
Spain vs. Turkey 0 0 1 7 1 2 1 2
Spain vs. UAE 0 0 1 7 1 1 0 1
Spain vs. Ukraine 0 0 1 7 1 0 0 1
Spain vs. United Kingdom 0 0 1 7 1 0 1 1
Turkey vs. UAE 0 0 1 7 1 1 0 1
Turkey vs. Ukraine 0 0 1 7 1 2 0 1
Turkey vs. United Kingdom 0 0 1 7 1 1 1 1
UAE vs. Ukraine 0 0 1 7 1 1 0 1
UAE vs. United Kingdom 0 0 1 7 1 1 1 1
Ukraine vs. United Kingdom 0 0 1 7 1 0 1 1Note.--A=Always, F=Frequently, S=Sometimes, N=Never.
Source: Compiled from data submitted in response to Commission questionnaires.

II-16
Table II-5cWire rod: Significance of differences other than price between wire rod produced in nonsubjectcountries and in the United States and in subject countries, by country pair
Country pairNumber of U.S. producers
reportingNumber of U.S. importers
reporting
A F S N A F S N
Nonsubject country comparisons:
U.S. vs. Canada 0 0 1 7 2 0 2 2
U.S. vs. all other countries 0 0 1 7 3 3 3 2
Belarus vs. Canada 0 0 1 7 1 0 0 2
Belarus vs. all other countries 0 0 1 7 2 1 0 1
Italy vs. Canada 0 0 1 7 1 1 0 2
Italy vs. all other countries 0 0 1 7 2 0 0 1
Korea vs. Canada 0 0 1 7 1 0 1 2
Korea vs. all other countries 0 0 1 7 2 0 1 1
Russia vs. Canada 0 0 1 7 1 0 0 2
Russia vs. all other countries 0 0 1 7 2 0 0 1
South Africa vs. Canada 0 0 1 7 1 1 0 2
South Africa vs. all other countries 0 0 1 7 2 0 0 1
Spain vs. Canada 0 0 1 7 1 0 0 2
Spain vs. all other countries 0 0 1 7 2 0 0 1
Turkey vs. Canada 0 0 1 7 1 1 0 2
Turkey vs. all other countries 0 0 1 7 2 1 0 1
UAE vs. Canada 0 0 1 7 1 1 0 1
UAE vs. all other countries 0 0 1 7 2 0 0 1
Ukraine vs. Canada 0 0 1 7 1 0 0 2
Ukraine vs. all other countries 0 0 1 7 2 1 0 1
UK vs. Canada 0 0 1 7 1 0 0 2
UK vs. all other countries 0 0 1 7 2 0 0 1Note.--A=Always, F=Frequently, S=Sometimes, N=Never.
Source: Compiled from data submitted in response to Commission questionnaires.

III-1
PART III: U.S. PRODUCERS’ PRODUCTION, SHIPMENTS, ANDEMPLOYMENT
The Commission analyzes a number of factors in making injury determinations (see 19U.S.C. §§ 1677(7)(B) and 1677(7)(C)). Information on the subsidies and dumping margins waspresented in Part I of this report and information on the volume and pricing of imports of thesubject merchandise is presented in Part IV and Part V. Information on the other factorsspecified is presented in this section and/or Part VI and (except as noted) is based on thequestionnaire responses of *** firms that accounted for virtually all U.S. production of wire rodduring 2014-16.
U.S. PRODUCERS
The Commission issued a U.S. producer questionnaire to ten firms based on informationcontained in the petition. *** firms provided usable data on their productive operations.1 Staffbelieves that these responses represent virtually all U.S. production of wire rod.
Table III-1 lists U.S. producers of wire rod, their production locations, positions on thepetition, and shares of total production.
As indicated in the notes to table III-1, ***, through its parent company ***, is relatedto foreign producers of the subject merchandise and to a U.S. importer of subject merchandise,***. Related party analysis is provided below. No U.S. producer directly imports the subjectmerchandise and none purchase the subject merchandise from U.S. importers.
1 ***.

III-2
Table III-1Wire rod: U.S. producers of wire rod, their positions on the petition, production locations, andshares of reported production, 2016
FirmPosition on
petition Production location(s)Share of production
(percent)
ArcelorMittal1
*** Georgetown, SC ***
Cascade2
***McMinnville, ORCity of Industry, CA ***
Charter3
Support
Saukville, WICuyahoga Heights, OHFostoria, OH ***
Evraz4
*** Pueblo, Colorado ***
Gerdau5
SupportBaldwin, FLWest Vidor, TX ***
Keystone6
Support Peoria, Illinois ***
Mid American *** Madill, OK ***
Nucor Support
Charlotte, NCWallingford, CTNorfolk, NEKingman, AZDarlington, SC ***
Republic7
***Canton, OHLorain, OH ***
Sterling8
*** Sterling, Illinois ***
Total 100.0
Footnotes 1 through 8 have been redacted.
Source: Compiled from data submitted in response to Commission questionnaires.
Table III-2 presents U.S. producers’ reported changes in operations since January 1,2014.
Table III-2Wire rod: Selected U.S. industry events since January 1, 2014
* * * * * * *
U.S. PRODUCTION, CAPACITY, AND CAPACITY UTILIZATION
Table III-3 and figure III-1 present U.S. producers’ production, capacity, and capacityutilization. Total annual capacity to produce wire rod in the United States decreased by 5.2percent from 2014 to 2016. ***.
Total production of wire rod was 3.4 percent lower in 2016 compared to 2014. *** U.S.producers had lower production volumes in 2016 compared to 2014; *** experiencedcollectively a decrease in production of *** short tons. *** U.S. producers (***) reportedgreater production volumes in 2016 compared to 2014. Combined, their production increasedby *** short tons from 2014 to 2016.

III-3
After decreasing by 1.2 percentage points from 2014 to 2015, capacity utilizationincreased by 2.7 percentage points from 2015 to 2016 for an overall increase of 1.5 percentagepoints from 2014 to 2016. ***. *** capacity utilization rates in *** were amongst the lowest ofany U.S. producer.
Table III-3Wire rod: U.S. producers’ production, capacity, and capacity utilization, 2014-16
Item
Calendar year
2014 2015 2016
Quantity (short tons)
Capacity 4,890,994 4,928,590 4,635,509
Production 3,706,939 3,675,269 3,580,955
Ration (percent)
Capacity utilization 75.8 74.6 77.3
Source: Compiled from data submitted in response to Commission questionnaires.
Figure III-1Wire rod: U.S. producers’ production, capacity, and capacity utilization, 2014-16
Source: Compiled from data submitted in response to Commission questionnaires.
Overall capacity and production
Seven firms reported producing products other than wire rod on the same equipmentand machinery used to make wire rod. As shown in table IIIóì, during 2014-16, wire roundaccounted for between 60.3 and 63.0 percent of U.S. producers’ production on this sharedequipment. Combined, concrete reinforcing bar and rods and the “other products”2 categoryaccounted for the bulk of the non-wire production.
2 Other products include free machining steel, coiled bar, SBQ bar, merchant bar, rounds, and flats.

III-4
Table III-4Wire rod: U.S. producers’ overall plant capacity and production on the same equipment as subjectproduction, 2014-16
Item
Calendar year
2014 2015 2016
Quantity (short tons)
Overall capacity 8,105,700 7,851,700 7,539,697
Production:Wire rod 3,706,939 3,675,269 3,580,955
Stainless steel bars and rods *** *** ***
Tool steel and high-nickel steel *** *** ***
Ball bearing steel *** *** ***
Concrete reinforcing bars and rods *** *** ***
Other products *** *** ***
Out-of-scope production 2,437,832 2,251,259 2,100,573
Total production on same machinery 6,144,771 5,926,528 5,681,528
Ratios and shares (percent)
Overall capacity utilization 75.8 75.5 75.4
Share of production:Wire rod 60.3 62.0 63.0
Stainless steel bars and rods *** *** ***
Tool steel and high-nickel steel *** *** ***
Ball bearing steel *** *** ***
Concrete reinforcing bars and rods *** *** ***
Other products *** *** ***
Out-of-scope production 39.7 38.0 37.0
Total production on same machinery 100.0 100.0 100.0
Source: Compiled from data submitted in response to Commission questionnaires.
Producers were asked to describe the constraint(s) that set the limit(s) of theirproduction capacity. Reported constraints include underutilization due to allegedly unfairlytraded imports, market demand and considerations, operating hours in a week and equipmentspeed, rod rolling mill production and customer demand, melting capacity (affected byenvironmental air permits and certain products requiring more time to produce), balance ofmarket demand between coiled reinforcing bar and wire rod, and financial considerations.
Producers were also asked about their ability to switch production capacity betweenproducts. ***. ***. ***. ***. ***.
U.S. PRODUCERS’ U.S. SHIPMENTS AND EXPORTS
Table III-5 presents U.S. producers’ U.S. shipments, export shipments, and totalshipments. U.S. producers’ U.S. shipments accounted for no less than 98.8 percent of their totalshipments during any year from 2014 to 2016. Based on quantity, commercial U.S. shipmentsaccounted for the largest share of U.S. producers’ U.S. shipments, but internal consumptionand transfers combined accounted for no less than 27.6 percent of U.S. producers’ total

III-5
shipments in any year for which data were collected. U.S. producers’ commercial U.S.shipments decreased by 6.0 percent from 2014 to 2016, while their average unit valuesdecreased by 26.1 percent. The quantity of U.S. producers’ internal consumption increased by17.3 percent from 2014 to 2016, whereas its unit values decreased by 28.1 percent. Likewise,the quantity of transfers to related firms increased by 2.4 percent from 2014 to 2016, whiletheir unit values decreased by 21.4 percent.
Table III-5Wire rod: U.S. producers’ U.S. shipments, exports shipments, and total shipments, 2014-16
Item
Calendar year
2014 2015 2016
Quantity (short tons)
Commercial U.S. shipments 2,627,361 2,592,543 2,469,373
Internal consumption *** *** ***
Transfers to related firms *** *** ***
Subtotal, U.S. shipments 3,646,379 3,640,823 3,542,689
Export shipments 42,744 33,585 38,667
Total shipments 3,689,123 3,674,408 3,581,356
Value (1,000 dollars)
Commercial U.S. shipments 1,878,975 1,512,393 1,305,732
Internal consumption *** *** ***
Transfers to related firms *** *** ***
Subtotal, U.S. shipments 2,535,270 2,072,137 1,838,683
Export shipments 34,544 22,977 23,452
Total shipments 2,569,814 2,095,114 1,862,135
Unit value (dollars per short ton)
Commercial U.S. shipments 715 583 529
Internal consumption *** *** ***
Transfers to related firms *** *** ***
Subtotal, U.S. shipments 695 569 519
Export shipments 808 684 607
Total shipments 697 570 520
Share of quantity (percent)
Commercial U.S. shipments 71.2 70.6 69.0
Internal consumption *** *** ***
Transfers to related firms *** *** ***
Subtotal, U.S. shipments 98.8 99.1 98.9
Export shipments 1.2 0.9 1.1
Total shipments 100.0 100.0 100.0
Share of value (percent)
Commercial U.S. shipments 73.1 72.2 70.1
Internal consumption *** *** ***
Transfers to related firms *** *** ***
Subtotal, U.S. shipments 98.7 98.9 98.7
Export shipments 1.3 1.1 1.3
Total shipments 100.0 100.0 100.0
Source: Compiled from data submitted in response to Commission questionnaires.

III-6
Table III-6 presents U.S. producers’ U.S. shipments by type of wire rod and type of U.S.shipment in 2016. Low quality standard wire rod and high quality standard wire rod combinedaccounted for 86.1 percent of U.S. producers’ total U.S. shipments. CHQ wire rod accountedfor percent, and none of the other four remaining types of wire rod for which data werecollected accounted for more than percent of U.S. producers’ total shipments.
*** firms that reported 2016 shipment data by product type shipped both low/medium-low carbon industrial/standard quality wire rod and high/medium-high carbonindustrial/standard quality wire rod. Tire cord and tire bead quality wire rod was the only typeof wire rod shipped exclusively as a commercial U.S. shipment; all other wire rod types wereeither also internally consumed or transferred to related firms. ***. *** reported shipments ofCHQ wire rod but *** accounted for *** percent of the shipments of this type of wire rod in2016.
Table III-6Wire rod: U.S. producers’ U.S. shipments, by product type and shipment type, 2016
Item
Product type
Lowquality
standard
Highquality
standard
Tire cordand tire
beadquality
Weldingquality
Coldheadingquality
Specialtyalloy Other Total
Quantity (short tons)
U.S. producers:Commercial U.S. shipments *** *** *** *** *** *** *** ***
Internal consumption *** *** *** *** *** *** *** ***
Transfers to related firms *** *** *** *** *** *** *** ***
U.S. shipments 1,989,229 1,060,945 *** *** *** *** *** 3,542,689
Share of quantity across (percent)
U.S. producers:Commercial U.S. shipments *** *** *** *** *** *** *** 100.0
Internal consumption *** *** *** *** *** *** *** 100.0
Transfers to related firms *** *** *** *** *** *** *** 100.0
U.S. shipments 56.2 29.9 *** *** *** *** *** 100.0
Share of quantity down (percent)
U.S. producers:Commercial U.S. shipments *** *** *** *** *** *** *** ***
Internal consumption *** *** *** *** *** *** *** ***
Transfers to related firms *** *** *** *** *** *** *** ***
U.S. shipments 100.0 100.0 100.0 100.0 100.0 100.0 100.0 100.0
Source: Compiled from data submitted in response to Commission questionnaires.

III-7
CAPTIVE CONSUMPTION
Section 771(7)(C)(iv) of the Act states that–3
If domestic producers internally transfer significant production of thedomestic like product for the production of a downstream article and sellsignificant production of the domestic like product in the merchantmarket, and the Commission finds that–
(I) the domestic like product produced that is internally transferredfor processing into that downstream article does not enter themerchant market for the domestic like product,
(II) the domestic like product is the predominant material input in theproduction of that downstream article, and
then the Commission, in determining market share and the factorsaffecting financial performance . . ., shall focus primarily on the merchantmarket for the domestic like product.
Transfers and sales
As reported in table III-5 above, from 2014 to 2016, internal consumption accounted forbetween *** and *** percent of U.S. producers’ U.S. shipments of wire rod; transfers to relatedfirms accounted for between *** and *** percent. Seven firms, ***4 reported internallyconsuming or transferring wire rod to a related firm to produce downstream products.Petitioners argue that the captive consumption provisions are met and that accordingly theCommission should focus its analysis on the merchant market.5
First statutory criterion in captive consumption
The first requirement for application of the captive consumption provision is that thedomestic like product that is internally transferred for processing into that downstream articlenot enter the merchant market for the domestic like product. U.S. producers reported that allinternally consumed and transferred wired rod was processed into other products; none of itwas sold as wire rod. U.S. producers reported internal consumption of wire rod for theproduction of drawn and galvanized wire and agricultural fencing products, barbed wire, fieldfence, wire panels, wire, wire mesh, fasteners, concrete reinforcing wire (wire mesh), minemesh, wire reinforcement sheets, wire reinforcement mesh, display racks, floor grating, mesh,
3 Amended by PL 114-27 (as signed, June 29, 2015), Trade Preferences Extension Act of 2015.4 ***.5 Petitioning three-firms’ postconference brief, pp. 21-23.

III-8
PC strand, welded wire reinforcement rolls, welded wire reinforcement sheets, and cold rolledprofiles.
Second statutory criterion in captive consumption
The second criterion of the captive consumption provision concerns whether thedomestic like product is the predominant material input in the production of the downstreamarticle that is captively produced. With respect to the downstream articles resulting fromcaptive production, wire rod reportedly comprises 60-87 percent of the finished cost of coldrolled shapes, industrial wire, welded wire reinforcement, wire mesh, reinforced concreteconstruction, display racks, fencing products, wire, floor grating, fabricated wire products,staples/fasteners/nails, and wire panels.
U.S. PRODUCERS’ INVENTORIES
Table III-7 presents U.S. producers’ end-of-period inventories and the ratio of theseinventories to U.S. producers’ production, U.S. shipments, and total shipments. U.S. producers’inventories of wire rod increased by 0.2 percent from 2014 to 2016. The ratios of inventories toproduction, inventories to U.S. shipments, and inventories to total shipments each increasedfrom 2014 to 2016 but by no more than 0.3 percentage points.
Table III-7Wire rod: U.S. producers’ inventories, 2014-16
Item
Calendar year
2014 2015 2016
Quantity (short tons)
U.S. producers' end-of-period inventories 261,268 262,130 261,730
Ratio (percent)
Ratio of inventories to.--U.S. Production 7.0 7.1 7.3
U.S. shipments 7.2 7.2 7.4
Total shipments 7.1 7.1 7.3
Source: Compiled from data submitted in response to Commission questionnaires.
U.S. PRODUCERS’ IMPORTS AND PURCHASES
No U.S. producer reported directly importing wire rod from any subject country. ***,however, is related through common ownership by *** to ***. ***. Table III-8 presents U.S.production data for *** along with *** data for imports from subject countries.
Table III-8Wire rod: *** U.S. production and *** imports, 2014-16
* * * * * * *

III-9
U.S. EMPLOYMENT, WAGES, AND PRODUCTIVITY
Table III-9 shows U.S. producers’ employment-related data. The level of production andrelated workers (“PRWs”), their hours worked and wages all decreased from 2014 to 2016.Annual hours worked per PRW increased slightly, by 1.7 percent, from 2014 to 2016 whileproductivity, measured by short tons per 1,000 hours worked, decreased 1.8 percent. Unitlabor costs increased by 2.1 percent from 2014 to 2016. *** U.S. producers reported morePRWs in 2016 compared to 2014. *** reported the largest increase in PRWs (a gain of ***),which coincided with ***. *** U.S. producers reported fewer PRWs in 2016 compared to 2014,with *** accounting for the bulk of the decrease after ***.
Table III-9Wire rod: Average number of production and related workers, hours worked, wages paid to suchemployees, hourly wages, productivity, and unit labor costs, 2014-16
Item
Calendar year
2014 2015 2016
Production and related workers (PRWs) (number) 2,269 2,411 2,222
Total hours worked (1,000 hours) 4,835 4,945 4,754
Hours worked per PRW (hours) 2,131 2,051 2,140
Wages paid ($1,000) 170,593 172,268 168,288
Hourly wages (dollars per hour) $35.28 $34.84 $35.40
Productivity (short tons per 1,000 hours) 766.7 743.2 753.3
Unit labor costs (dollars per short ton) $46.02 $46.87 $47.00
Source: Compiled from data submitted in response to Commission questionnaires.


IV-1
PART IV: U.S. IMPORTS, APPARENT U.S. CONSUMPTION,AND MARKET SHARES
U.S. IMPORTERS
The Commission issued importer questionnaires to 53 firms believed to be importers ofsubject wire rod, as well as to all U.S. producers of wire rod.1 Usable questionnaire responseswere received from 28 companies, representing all imports from Belarus, all imports from Italy,all imports from Korea, 88.5 percent of imports from Russia, 96.2 percent of imports fromSouth Africa, 69.9 percent of imports from Spain, 45.1 percent of imports from Turkey, 95.8percent of imports from Ukraine, all imports from United Arab Emirates, all imports from theUnited Kingdom, and for imports from nonsubject sources, 49.1 percent from Canada and 49.6percent from all other import sources, under relevant HTS statistical reporting numbers, asadjusted.2 Table IV-1 lists all responding U.S. importers of wire rod from the ten subjectcountries and other sources, their locations, and their shares of U.S. imports from subjectsources, nonsubject sources, and total imports in 2016.
1 The Commission issued questionnaires to those firms identified in the petition, along with firmsthat, based on a review of data provided by U.S. Customs and Border Protection (“Customs”), may haveaccounted for more than one percent of total imports under HTS statistical reporting numbers7213.91.3011, 7213.91.3015, 7213.91.3020, 7213.91.3093, 7213.91.4500, 7213.91.6000, 7213.99.0030,7227.20.0030, 7227.20.0080, 7227.90.6010, 7227.90.6020, 7227.90.6030, and 7227.90.6035 in 2016.
2 The relevant statistical reporting numbers appear in Part I of this report. Official Commercestatistics were adjusted using questionnaire response data to include imports of wire rod under HTSstatistical reporting numbers other than those listed in Part I.

IV-2
Table IV-1Wire rod: U.S. importers by source, 2014-16
Firm Headquarters
Share of imports by source (percent)
Subject Nonsubject All import sources
ArcelorMittal Chicago, IL *** *** ***
Braeburn Sudbury, MA *** *** ***
British Steel North Lincolnshire, United Kingdom *** *** ***
Byram Pompton Plains, NJ *** *** ***
C&F International Houston, TX *** *** ***
Duferco Matawan, NJ *** *** ***
Global Steel Santander, Spain *** *** ***
Heico L'Orignal, ON *** *** ***
Kanematsu Arlington Heights, IL *** *** ***
Krueger Elmhurst, IL *** *** ***
Kurt Orban Burlingame, CA *** *** ***
Macsteel White Plains, NY *** *** ***
Marubeni-Itochu New York, NY *** *** ***
Metal One Rosemont, IL *** *** ***
Mitsui New York, NY *** *** ***
O&K American Chicago, IL *** *** ***
Okaya USA Arlington Heights, IL *** *** ***
POSCO America Johns Creek, GA *** *** ***
POSCO Daewoo Teaneck, NJ *** *** ***
SEBA InternationalInc Houston, TX *** *** ***
Shinsho Novi, MI *** *** ***
Stemcor New York, NY *** *** ***
Stena Southport, CT *** *** ***
Tata Schaumburg, IL *** *** ***
Tata Steel Schaumburg, IL *** *** ***
Ternium Houston, TX *** *** ***
Toyota Tsusho Georgetown, KY *** *** ***
Uniwire New York, NY *** *** ***
Total *** *** ***
Source: Compiled from data submitted in response to Commission questionnaires.

IV 3
U.S. IMPORTS
Table IV 2 presents data for U.S. imports of wire rod from subject sources, Canada, andall other sources, and the ratio of U.S. imports of wire rod to U.S. production of wire rod.
Table IV-2Wire rod: U.S. imports by source, 2014-16
Item
Calendar year
2014 2015 2016
Quantity (short tons)
U.S. imports from--Belarus 0 9,059 38,267
Italy 346 246 33,163
Korea 109,026 128,862 101,970
Russia 12,329 6,857 103,322
South Africa 0 45,451 22,049
Spain 31,778 79,976 78,665
Turkey 210,901 264,469 98,497
Ukraine 14,625 79,053 161,451
United Arab Emirates 28 17,673 22,159
United Kingdom 71,379 45,609 52,736
Subject sources 450,414 677,254 712,279
Canada 524,324 561,752 552,362
All other sources 833,059 562,237 524,687
Nonsubject sources 1,357,383 1,123,989 1,077,050
All import sources 1,807,797 1,801,243 1,789,328
Value (1,000 dollars)
U.S. imports from--Belarus 0 3,131 12,434
Italy 543 291 12,697
Korea 69,377 67,290 51,873
Russia 7,552 2,230 35,215
South Africa 0 18,830 8,000
Spain 22,392 52,358 47,007
Turkey 125,108 128,556 44,005
Ukraine 8,684 35,022 59,507
United Arab Emirates 18 6,952 7,631
United Kingdom 46,428 24,859 25,035
Subject sources 280,103 339,520 303,403
Canada 405,564 358,637 326,185
All other sources 566,556 426,591 381,719
Nonsubject sources 972,120 785,228 707,904
All import sources 1,252,223 1,124,748 1,011,307
Table continued on next page.

IV-4
Table IV-2--ContinuedWire rod: U.S. imports by source, 2014-16
Item
Calendar year
2014 2015 2016
Unit value (dollars per short ton)
U.S. imports from--Belarus --- 346 325
Italy 1,569 1,183 383
Korea 636 522 509
Russia 613 325 341
South Africa --- 414 363
Spain 705 655 598
Turkey 593 486 447
Ukraine 594 443 369
United Arab Emirates 633 393 344
United Kingdom 650 545 475
Subject sources 622 501 426
Canada 774 638 591
All other sources 680 759 728
Nonsubject sources 716 699 657
All import sources 693 624 565
Share of quantity (percent)
U.S. imports from--Belarus --- 0.5 2.1
Italy 0.0 0.0 1.9
Korea 6.0 7.2 5.7
Russia 0.7 0.4 5.8
South Africa --- 2.5 1.2
Spain 1.8 4.4 4.4
Turkey 11.7 14.7 5.5
Ukraine 0.8 4.4 9.0
United Arab Emirates 0.0 1.0 1.2
United Kingdom 3.9 2.5 2.9
Subject sources 24.9 37.6 39.8
Canada 29.0 31.2 30.9
All other sources 46.1 31.2 29.3
Nonsubject sources 75.1 62.4 60.2
All import sources 100.0 100.0 100.0
Table continued on next page.

IV-5
Table IV-2--ContinuedWire rod: U.S. imports by source, 2014-16
Item
Calendar year
2014 2015 2016
Share of value (percent)
U.S. imports from--Belarus --- 0.3 1.2
Italy 0.0 0.0 1.3
Korea 5.5 6.0 5.1
Russia 0.6 0.2 3.5
South Africa --- 1.7 0.8
Spain 1.8 4.7 4.6
Turkey 10.0 11.4 4.4
Ukraine 0.7 3.1 5.9
United Arab Emirates 0.0 0.6 0.8
United Kingdom 3.7 2.2 2.5
Subject sources 22.4 30.2 30.0
Canada 32.4 31.9 32.3
All other sources 45.2 37.9 37.7
Nonsubject sources 77.6 69.8 70.0
All import sources 100.0 100.0 100.0
Ratio to U.S. production
U.S. imports from--Belarus --- 0.2 1.1
Italy 0.0 0.0 0.9
Korea 2.9 3.5 2.8
Russia 0.3 0.2 2.9
South Africa --- 1.2 0.6
Spain 0.9 2.2 2.2
Turkey 5.7 7.2 2.8
Ukraine 0.4 2.2 4.5
United Arab Emirates 0.0 0.5 0.6
United Kingdom 1.9 1.2 1.5
Subject sources 12.2 18.4 19.9
Canada 14.1 15.3 15.4
All other sources 22.5 15.3 14.7
Nonsubject sources 36.6 30.6 30.1
All import sources 48.8 49.0 50.0
Source: Compiled from data submitted in response to Commission questionnaires and official U.S. import statisticsusing HTS statistical reporting numbers 7213.91.3011, 7213.91.3015, 7213.91.3020, 7213.91.3093, 7213.91.4500,7213.91.6000, 7213.99.0030, 7227.20.0030, 7227.20.0080, 7227.90.6010, 7227.90.6020, 7227.90.6030, and7227.90.6035, accessed April 5, 2017.statistics.
IV-6
NEGLIGIBILITY
The statute requires that an investigation be terminated without an injurydetermination if imports of the subject merchandise are found to be negligible.3 Negligibleimports are generally defined in the Tariff Act of 1930, as amended, as imports from a countryof merchandise corresponding to a domestic like product where such imports account for lessthan 3 percent of the volume of all such merchandise imported into the United States in themost recent 12-month period for which data are available that precedes the filing of thepetition or the initiation of the investigation. However, if there are imports of such merchandisefrom a number of countries subject to investigations initiated on the same day that individuallyaccount for less than 3 percent of the total volume of the subject merchandise, and if theimports from those countries collectively account for more than 7 percent of the volume of allsuch merchandise imported into the United States during the applicable 12-month period, thenimports from such countries are deemed not to be negligible.4 The statute further providesthat, in the case of countervailing duty investigations involving developing countries, thenegligibility limits are 4 percent and 9 percent, rather than 3 percent and 7 percent.5 Table IV-3presents data for imports during March 2016-February 2017 for each subject country and itsshare of total imports. Data are presented using official Commerce data for U.S. imports of wirerod and the same Commerce data adjusted using questionnaire response data.6 Based onofficial Commerce data, five sources of wire rod individually accounted for less than 3 percentof the volume of U.S. imports of wire rod in 2016. Imports from Belarus accounted for 2.6percent, imports from Italy accounted for 2.5 percent, imports from South Africa accounted for1.2 percent, imports from UAE accounted for 1.3 percent, and imports from United Kingdomaccounted for 2.6 percent. Collectively, these five sources accounted for 10.2 percent of totalimports. Table IV-4 presents data to address negligibility considerations for the CVDinvestigation on imports of wire rod from Italy.
3 Sections 703(a)(1), 705(b)(1), 733(a)(1), and 735(b)(1) of the Act (19 U.S.C. §§ 1671b(a)(1),1671d(b)(1), 1673b(a)(1), and 1673d(b)(1)).
4 Section 771 (24) of the Act (19 U.S.C § 1677(24)).5 Section 771 (24)(B) of the Act (19 U.S.C § 1677(24)(B)).6 The importers’ questionnaire identified the thirteen HTS statistical reporting numbers under which
wire rod imports typically enter the United States as “primary HTS numbers”. Importers were asked toreport data for imports of wire rod under these HTS statistical reporting numbers and to reportseparately imports of wire rod entered under other HTS statistical reporting numbers. Data reported forentries under the other HTS statistical reporting numbers were added to official import statistics. A smallvolume of imports were reported under the “other” HTS numbers, which only had a small effect onimports from individual subject country’s shares of total imports. Accordingly the negligibility discussionreferences only official Commerce statistics.

IV-7
Table IV-3Wire rod: U.S. imports by source and share of imports, March 2016 through February 2017
Item
March 2016 through February 2017
Straight official statistics Adjusted official statistics
Quantity(short tons)
Share of quantity(percent)
Quantity (shorttons)
Share of quantity(percent)
U.S. imports from--Belarus 46,145 2.6 49,031 2.8
Italy 44,558 2.5 44,558 2.5
Korea 86,737 4.9 86,737 4.9
Russia 106,227 6.0 106,227 6.0
South Africa 20,511 1.2 20,511 1.2
Spain 78,836 4.5 78,836 4.4
Turkey 79,775 4.5 79,775 4.5
Ukraine 164,775 9.3 164,775 9.3
United Arab Emirates 22,159 1.3 22,159 1.2
United Kingdom 46,601 2.6 47,715 2.7
Subject sources 696,324 39.5 700,324 39.5
Individually negligible subject sources 179,973 10.2 183,973 10.4
Canada 545,853 31.0 545,853 30.8
All other sources 520,588 29.5 527,178 29.7
Nonsubject sources 1,066,441 60.5 1,073,031 60.5
All import sources 1,762,765 100.0 1,773,355 100.0
Source: Compiled from data submitted in response to Commission questionnaires and official U.S. import statistics(see table IV-2 source note for the list of relevant HTS statistical reporting numbers).

IV-8
Table IV-4Wire rod: U.S. imports from Italy and all sources, January 2014 through February 2017
12 month period ending
Source
ItalyAll importsources Italy
All importsources Italy
All importsources
Quantity (short tons)Share of total imports
(percent)
Percent change overcomparable period oneyear earlier (percent)
2014:December 346 1,800,307 0.0 100.0
2015:January 346 1,786,519 0.0 100.0
February 521 1,846,262 0.0 100.0
March 521 1,850,331 0.0 100.0
April 438 1,737,444 0.0 100.0
May 438 1,671,176 0.0 100.0
June 178 1,650,836 0.0 100.0
July 178 1,666,178 0.0 100.0
August 174 1,709,781 0.0 100.0
September 174 1,705,569 0.0 100.0
October 220 1,725,524 0.0 100.0
November 246 1,731,680 0.0 100.0
December 246 1,789,080 0.0 100.0 (29.0) (0.6)
2016:January 246 1,789,878 0.0 100.0 (29.0) 0.2
February 72 1,774,130 0.0 100.0 (86.2) (3.9)
March 72 1,778,103 0.0 100.0 (86.2) (3.9)
April 81 1,797,622 0.0 100.0 (81.6) 3.5
May 81 1,838,049 0.0 100.0 (81.6) 10.0
June 81 1,847,540 0.0 100.0 (54.7) 11.9
July 81 1,870,770 0.0 100.0 (54.7) 12.3
August 12,079 1,878,615 0.6 100.0 6,824.7 9.9
September 12,079 1,866,000 0.6 100.0 6,824.7 9.4
October 21,228 1,842,990 1.2 100.0 9,528.3 6.8
November 33,108 1,854,474 1.8 100.0 13,351.0 7.1
December 33,163 1,779,156 1.9 100.0 13,373.4 (0.6)
2017:January 44,558 1,761,179 2.5 100.0 18,003.0 (1.6)
February 44,558 1,762,765 2.5 100.0 62,040.3 (0.6)
Note.—U.S. imports of wire rod from Italy accounted for 4.4 percent of total U.S. imports of wire rod fromAugust 2016 to February 2017.
Source: Compiled from data submitted in response to Commission questionnaires and official U.S. importstatistics (see table IV-2 source note for the list of relevant HTS statistical reporting numbers).
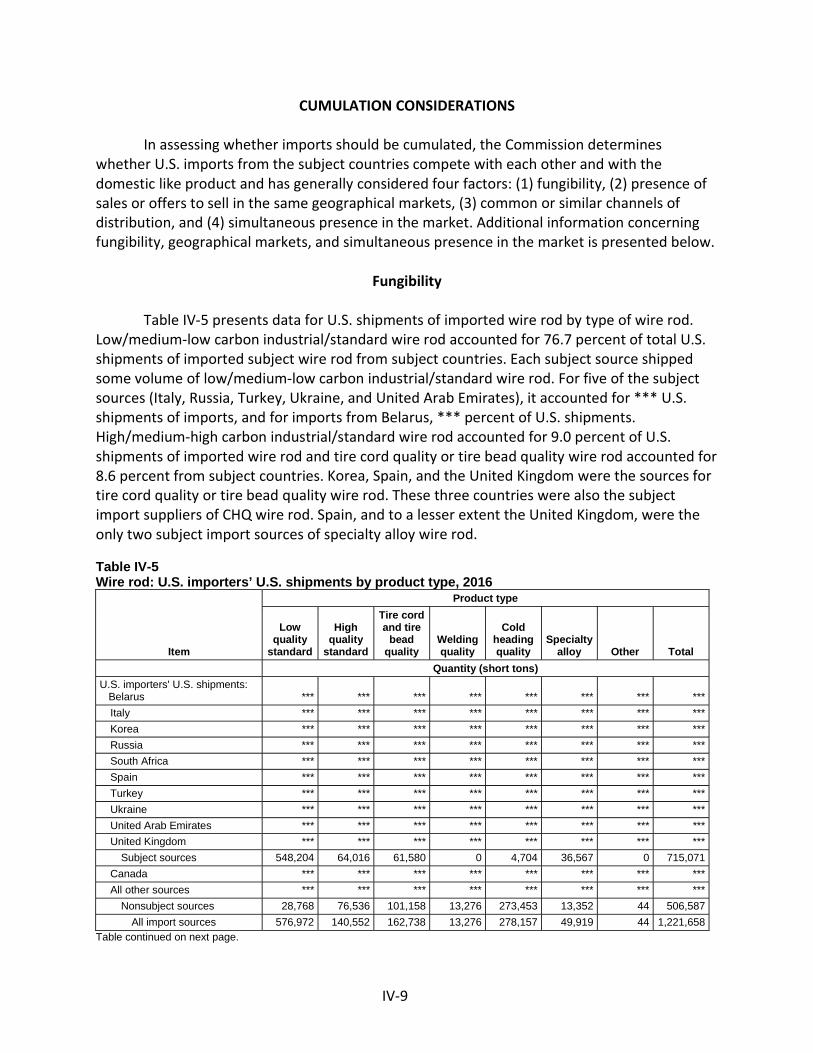
IV 9
CUMULATION CONSIDERATIONS
In assessing whether imports should be cumulated, the Commission determineswhether U.S. imports from the subject countries compete with each other and with thedomestic like product and has generally considered four factors: (1) fungibility, (2) presence ofsales or offers to sell in the same geographical markets, (3) common or similar channels ofdistribution, and (4) simultaneous presence in the market. Additional information concerningfungibility, geographical markets, and simultaneous presence in the market is presented below.
Fungibility
Table IV 5 presents data for U.S. shipments of imported wire rod by type of wire rod.Low/medium low carbon industrial/standard wire rod accounted for 76.7 percent of total U.S.shipments of imported subject wire rod from subject countries. Each subject source shippedsome volume of low/medium low carbon industrial/standard wire rod. For five of the subjectsources (Italy, Russia, Turkey, Ukraine, and United Arab Emirates), it accounted for *** U.S.shipments of imports, and for imports from Belarus, *** percent of U.S. shipments.High/medium high carbon industrial/standard wire rod accounted for 9.0 percent of U.S.shipments of imported wire rod and tire cord quality or tire bead quality wire rod accounted for8.6 percent from subject countries. Korea, Spain, and the United Kingdom were the sources fortire cord quality or tire bead quality wire rod. These three countries were also the subjectimport suppliers of CHQ wire rod. Spain, and to a lesser extent the United Kingdom, were theonly two subject import sources of specialty alloy wire rod.
Table IV-5Wire rod: U.S. importers’ U.S. shipments by product type, 2016
Item
Product type
Lowquality
standard
Highquality
standard
Tire cordand tire
beadquality
Weldingquality
Coldheadingquality
Specialtyalloy Other Total
Quantity (short tons)
U.S. importers' U.S. shipments:Belarus *** *** *** *** *** *** *** ***
Italy *** *** *** *** *** *** *** ***
Korea *** *** *** *** *** *** *** ***
Russia *** *** *** *** *** *** *** ***
South Africa *** *** *** *** *** *** *** ***
Spain *** *** *** *** *** *** *** ***
Turkey *** *** *** *** *** *** *** ***
Ukraine *** *** *** *** *** *** *** ***
United Arab Emirates *** *** *** *** *** *** *** ***
United Kingdom *** *** *** *** *** *** *** ***
Subject sources 548,204 64,016 61,580 0 4,704 36,567 0 715,071
Canada *** *** *** *** *** *** *** ***
All other sources *** *** *** *** *** *** *** ***
Nonsubject sources 28,768 76,536 101,158 13,276 273,453 13,352 44 506,587
All import sources 576,972 140,552 162,738 13,276 278,157 49,919 44 1,221,658
Table continued on next page.
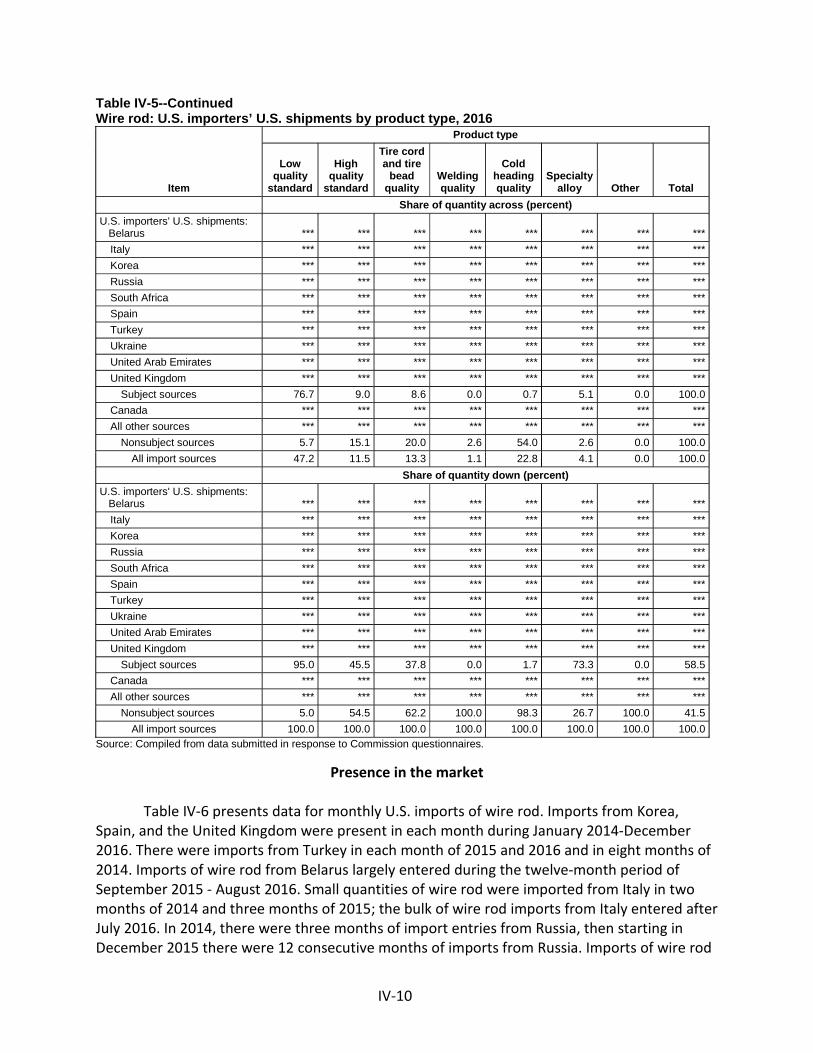
IV-10
Table IV-5--ContinuedWire rod: U.S. importers’ U.S. shipments by product type, 2016
Item
Product type
Lowquality
standard
Highquality
standard
Tire cordand tire
beadquality
Weldingquality
Coldheadingquality
Specialtyalloy Other Total
Share of quantity across (percent)
U.S. importers' U.S. shipments:Belarus *** *** *** *** *** *** *** ***
Italy *** *** *** *** *** *** *** ***
Korea *** *** *** *** *** *** *** ***
Russia *** *** *** *** *** *** *** ***
South Africa *** *** *** *** *** *** *** ***
Spain *** *** *** *** *** *** *** ***
Turkey *** *** *** *** *** *** *** ***
Ukraine *** *** *** *** *** *** *** ***
United Arab Emirates *** *** *** *** *** *** *** ***
United Kingdom *** *** *** *** *** *** *** ***
Subject sources 76.7 9.0 8.6 0.0 0.7 5.1 0.0 100.0
Canada *** *** *** *** *** *** *** ***
All other sources *** *** *** *** *** *** *** ***
Nonsubject sources 5.7 15.1 20.0 2.6 54.0 2.6 0.0 100.0
All import sources 47.2 11.5 13.3 1.1 22.8 4.1 0.0 100.0
Share of quantity down (percent)
U.S. importers' U.S. shipments:Belarus *** *** *** *** *** *** *** ***
Italy *** *** *** *** *** *** *** ***
Korea *** *** *** *** *** *** *** ***
Russia *** *** *** *** *** *** *** ***
South Africa *** *** *** *** *** *** *** ***
Spain *** *** *** *** *** *** *** ***
Turkey *** *** *** *** *** *** *** ***
Ukraine *** *** *** *** *** *** *** ***
United Arab Emirates *** *** *** *** *** *** *** ***
United Kingdom *** *** *** *** *** *** *** ***
Subject sources 95.0 45.5 37.8 0.0 1.7 73.3 0.0 58.5
Canada *** *** *** *** *** *** *** ***
All other sources *** *** *** *** *** *** *** ***
Nonsubject sources 5.0 54.5 62.2 100.0 98.3 26.7 100.0 41.5
All import sources 100.0 100.0 100.0 100.0 100.0 100.0 100.0 100.0
Source: Compiled from data submitted in response to Commission questionnaires.
Presence in the market
Table IV-6 presents data for monthly U.S. imports of wire rod. Imports from Korea,Spain, and the United Kingdom were present in each month during January 2014-December2016. There were imports from Turkey in each month of 2015 and 2016 and in eight months of2014. Imports of wire rod from Belarus largely entered during the twelve-month period ofSeptember 2015 - August 2016. Small quantities of wire rod were imported from Italy in twomonths of 2014 and three months of 2015; the bulk of wire rod imports from Italy entered afterJuly 2016. In 2014, there were three months of import entries from Russia, then starting inDecember 2015 there were 12 consecutive months of imports from Russia. Imports of wire rod

IV-11
from South Africa entered during 9 of the 11 months from August 2015 through June 2016.Imports of wire rod from Ukraine were present in two months of the last quarter of 2014, eightmonths of 2015, and twelve months of 2016. Imports of wire rod from UAE were present in onemonth of 2014, two months in 2015, and seven months of 2016.Table IV-6Wire rod: Monthly U.S. imports by source, January 2014-February 2017
Items
Source
Belarus Italy Korea RussiaSouthAfrica Spain Turkey Ukraine
Quantity (short tons)
2014:January 0 0 6,031 0 0 838 0 0
February 0 0 2,645 0 0 557 0 0
March 0 0 4,599 2,843 0 1,590 0 0
April 0 83 6,166 3,136 0 1,702 895 0
May 0 0 12,253 6,350 0 539 3,391 0
June 0 260 28,328 0 0 1,051 48,628 0
July 0 0 4,821 0 0 209 0 0
August 0 3 6,515 0 0 7,709 19,589 0
September 0 0 9,905 0 0 4,880 33,597 0
October 0 0 9,580 0 0 921 66,639 2,089
November 0 0 10,121 0 0 8,377 9,181 12,537
December 0 0 8,062 0 0 3,405 28,176 0
2015:January 0 0 14,499 0 0 13,082 18,310 0
February 0 174 11,886 0 0 4,007 63,060 5,438
March 0 0 9,811 0 0 8,823 31,432 18,588
April 0 0 6,987 0 0 908 9,677 7,131
May 0 0 2,823 0 0 11,268 11,425 0
June 0 0 8,134 0 0 5,969 12,949 10,896
July 0 0 15,496 0 0 22 18,720 0
August 0 0 32,129 0 11,025 3,246 8,720 0
September 3,377 0 317 0 11,128 11,093 35,173 12,470
October 0 46 15,816 0 7,665 7,899 29,475 9,882
November 0 26 2,344 0 0 1,994 845 6,265
December 5,682 0 8,620 6,857 15,634 11,665 19,396 8,382
2016:January 4,622 0 7,692 1,968 0 9,454 22,769 14,947
February 1,376 0 11,122 14,594 4,769 1,063 9,252 20,259
March 4,649 0 12,608 13,808 124 1,001 12,521 13,707
April 6,941 9 14,504 3,619 9,286 2,581 568 16,953
May 2,644 0 4,084 17,145 4,528 7,507 3,756 14,996
June 0 0 11,721 1,902 3,342 9,891 9,967 9,674
July 0 0 6,390 7,411 0 4,810 7,019 6,700
August 15,127 11,998 12,147 17,207 0 1,838 4,089 19,759
September 0 0 6,214 12,500 0 16,987 547 13,930
October 22 9,195 13,704 4,578 0 10,286 16,789 18,190
November 0 11,906 929 8,590 0 8,751 6,317 4,276
December 0 55 853 0 0 4,496 4,902 8,060
2017:January 0 11,395 3,382 1,979 0 9,267 10,143 7,705
February 16,762 0 201 17,489 3,231 1,422 3,156 30,825
Table continued on next page.

IV-12
Table IV-6--ContinuedWire rod: Monthly U.S. imports by source, January 2014-February 2017
Items
Source
UnitedArab
EmiratesUnited
KingdomSubjectsources Canada
All othersources
Nonsubjectsources
All importsources
Quantity (short tons)
2014:January 0 7,217 14,085 43,176 101,314 144,490 158,576
February 0 4,999 8,201 33,548 66,638 100,186 108,386
March 0 6,272 15,304 40,548 91,490 132,038 147,342
April 0 10,300 22,283 46,234 171,339 217,573 239,856
May 0 5,010 27,543 44,023 116,822 160,845 188,388
June 0 7,380 85,647 47,138 32,164 79,302 164,949
July 0 351 5,381 47,947 48,053 95,999 101,380
August 0 4,585 38,400 43,082 39,665 82,747 121,148
September 28 625 49,036 55,326 58,626 113,952 162,989
October 0 13,722 92,951 42,106 35,709 77,815 170,766
November 0 817 41,032 35,554 23,834 59,388 100,420
December 0 10,104 49,747 45,641 40,722 86,363 136,110
2015:January 0 264 46,156 41,035 57,597 98,632 144,787
February 0 94 84,659 47,314 36,156 83,471 168,130
March 0 777 69,430 46,372 35,607 81,980 151,410
April 1,101 6,849 32,653 48,282 46,035 94,317 126,969
May 0 1,230 26,747 45,377 49,996 95,373 122,120
June 0 610 38,558 52,975 53,075 106,050 144,608
July 0 3,875 38,113 46,490 32,119 78,608 116,722
August 0 10,062 65,182 45,668 53,901 99,569 164,751
September 0 176 73,734 47,935 37,107 85,042 158,776
October 0 389 71,172 53,448 66,101 119,549 190,721
November 0 3,751 15,225 48,337 43,014 91,351 106,576
December 16,572 17,429 110,238 38,518 44,754 83,272 193,509
2016:January 0 360 61,812 42,726 41,047 83,773 145,585
February 0 7,789 70,224 47,374 34,784 82,158 152,382
March 27 4,368 62,813 51,547 41,023 92,570 155,383
April 3,349 7,359 65,170 49,016 32,302 81,318 146,488
May 54 7,773 62,488 52,744 47,316 100,060 162,548
June 8,065 9,121 63,682 45,283 45,133 90,416 154,099
July 5,189 4,346 41,865 39,603 58,485 98,087 139,952
August 0 3,989 86,154 46,212 40,231 86,443 172,596
September 5,447 388 56,014 47,361 42,786 90,147 146,161
October 0 5,117 77,881 43,395 46,436 89,831 167,711
November 27 747 41,545 47,874 28,641 76,515 118,060
December 0 263 18,629 39,228 60,335 99,563 118,192
2017:January 0 2,902 46,773 38,939 41,896 80,835 127,608
February 0 226 73,311 44,652 36,005 80,657 153,968
Source: Official U.S. import statistics (see table IV-2 source note for the list of relevant HTS statistical reporting numbers).

IV-13
Geographical markets
Table IV-7 presents data for U.S. imports of wire rod by border of entry. U.S. importsfrom all ten subject sources entered through the South in 2016. Imports from eight subjectsources entered through the East, from three in the North, and from one in the West.
Table IV-7Wire rod: U.S. imports by border of entry, 2016
Item
Border of entry
East North South West Total
Quantity (short tons)
U.S. imports:Belarus 22 0 35,359 0 35,381
Italy 0 4 33,159 0 33,163
Korea 24,391 0 64,183 13,393 101,968
Russia 11,667 0 91,655 0 103,322
South Africa 0 0 22,049 0 22,049
Spain 9,161 142 69,362 0 78,665
Turkey 8,989 0 89,508 0 98,497
Ukraine 31,059 0 130,391 0 161,451
United Arab Emirates 670 0 21,489 0 22,159
United Kingdom 20,620 14,499 16,502 0 51,622
Subject sources 106,580 14,645 573,658 13,393 708,277
Canada 160,342 392,020 0 0 552,362
All other sources 154,467 28,079 329,343 6,628 518,517
Nonsubject sources 314,810 420,099 329,343 6,628 1,070,880
All import sources 421,390 434,744 903,001 20,021 1,779,156
Share of quantity across (percent)
U.S. imports:Belarus 0.1 --- 99.9 --- 100.0
Italy --- 0.0 100.0 --- 100.0
Korea 23.9 --- 62.9 13.1 100.0
Russia 11.3 --- 88.7 --- 100.0
South Africa --- --- 100.0 --- 100.0
Spain 11.6 0.2 88.2 --- 100.0
Turkey 9.1 --- 90.9 --- 100.0
Ukraine 19.2 --- 80.8 --- 100.0
United Arab Emirates 3.0 --- 97.0 --- 100.0
United Kingdom 39.9 28.1 32.0 --- 100.0
Subject sources 15.0 2.1 81.0 1.9 100.0
Canada 29.0 71.0 --- --- 100.0
All other sources 29.8 5.4 63.5 1.3 100.0
Nonsubject sources 29.4 39.2 30.8 0.6 100.0
All import sources 23.7 24.4 50.8 1.1 100.0
Table continued on next page.

IV-14
Table IV-7--ContinuedWire rod: U.S. imports by border of entry, 2016
Item
Border of entry
East North South West Total
Share of quantity down (percent)
U.S. imports:Belarus 0.0 --- 3.9 --- 2.0
Italy --- 0.0 3.7 --- 1.9
Korea 5.8 --- 7.1 66.9 5.7
Russia 2.8 --- 10.2 --- 5.8
South Africa --- --- 2.4 --- 1.2
Spain 2.2 0.0 7.7 --- 4.4
Turkey 2.1 --- 9.9 --- 5.5
Ukraine 7.4 --- 14.4 --- 9.1
United Arab Emirates 0.2 --- 2.4 --- 1.2
United Kingdom 4.9 3.3 1.8 --- 2.9
Subject sources 25.3 3.4 63.5 66.9 39.8
Canada 38.1 90.2 --- --- 31.0
All other sources 36.7 6.5 36.5 33.1 29.1
Nonsubject sources 74.7 96.6 36.5 33.1 60.2
All import sources 100.0 100.0 100.0 100.0 100.0
Source: Official U.S. import statistics (see table IV-2 source note for the list of relevant HTS statisticalreporting numbers).
APPARENT U.S. CONSUMPTION
Table IV-8 presents data on apparent U.S. consumption and U.S. market shares for wirerod; data are presented both for total market apparent U.S. consumption and merchant marketapparent U.S. consumption. These data show that total market apparent U.S. consumption,based on quantity, decreased by 2.2 percent from 2014 to 2016. U.S. producers’ total U.S.shipments decreased by 2.8 percent and total imports decreased during this period by 1.0percent. Total subject imports increased from 2014 to 2016 by 58.1 percent, but imports fromindividual subject sources showed different trends. From 2014 to 2016, imports from Belarus,Italy , Russia, Spain, South Africa, Ukraine, and United Arab Emirates increased, whereasimports from Korea, Turkey, and the United Kingdom decreased. Nonsubject imports fromCanada, which had a sizable presence in each year during 2014-16, increased by 5.3 percent,whereas imports from all other sources decreased by almost 308 thousand short tons (37.0percent). Apparent consumption, based on value, decreased by 24.8 percent from 2014 to2016.
Merchant market apparent U.S. consumption of wire rod, based on quantity, decreasedby 4.0 percent from 2014 to 2016. The quantity of U.S. producers’ commercial U.S. shipmentsof wire rod decreased by 2.8 percent during this period. Merchant market apparent U.S.consumption of wire rod, based on value, decreased by 26.0 percent. The quantity of U.S.producers’ commercial U.S. shipments of wire rod decreased by 6.0 percent from 2014 to 2016and their value decreased by 30.5 percent.

IV-15
Table IV-8Wire rod: U.S. shipments of domestic product, U.S. imports, and apparent U.S. consumption,2014-16
Item
Calendar year Calendar year
2014 2015 2016 2014 2015 2016
TOTAL MARKET MERCHANT MARKET
Quantity (short tons) Quantity (short tons)
U.S. producers 3,646,379 3,640,823 3,542,689 2,627,361 2,592,543 2,469,373
U.S. imports from--Belarus 0 9,059 38,267 0 9,059 38,267
Italy 346 246 33,163 346 246 33,163
Korea 109,026 128,862 101,970 109,026 128,862 101,970
Russia 12,329 6,857 103,322 12,329 6,857 103,322
South Africa 0 45,451 22,049 0 45,451 22,049
Spain 31,778 79,976 78,665 31,778 79,976 78,665
Turkey 210,901 264,469 98,497 210,901 264,469 98,497
Ukraine 14,625 79,053 161,451 14,625 79,053 161,451
United Arab Emirates 28 17,673 22,159 28 17,673 22,159
United Kingdom 71,379 45,609 52,736 71,379 45,609 52,736
Subject sources 450,414 677,254 712,279 450,414 677,254 712,279
Canada 524,324 561,752 552,362 524,324 561,752 552,362
All other sources 833,059 562,237 524,687 833,059 562,237 524,687
Nonsubject sources 1,357,383 1,123,989 1,077,050 1,357,383 1,123,989 1,077,050
All import sources 1,807,797 1,801,243 1,789,328 1,807,797 1,801,243 1,789,328
Apparent U.S. consumption 5,454,176 5,442,066 5,332,017 4,435,158 4,393,786 4,258,701
Value (1,000 dollars) Value (1,000 dollars
U.S. producers 2,535,270 2,072,137 1,838,683 1,878,975 1,512,393 1,305,732
U.S. imports from--Belarus 0 3,131 12,434 0 3,131 12,434
Italy 543 291 12,697 543 291 12,697
Korea 69,377 67,290 51,873 69,377 67,290 51,873
Russia 7,552 2,230 35,215 7,552 2,230 35,215
South Africa 0 18,830 8,000 0 18,830 8,000
Spain 22,392 52,358 47,007 22,392 52,358 47,007
Turkey 125,108 128,556 44,005 125,108 128,556 44,005
Ukraine 8,684 35,022 59,507 8,684 35,022 59,507
United Arab Emirates 18 6,952 7,631 18 6,952 7,631
United Kingdom 46,428 24,859 25,035 46,428 24,859 25,035
Subject sources 280,103 339,520 303,403 280,103 339,520 303,403
Canada 405,564 358,637 326,185 405,564 358,637 326,185
All other sources 566,556 426,591 381,719 566,556 426,591 381,719
Nonsubject sources 972,120 785,228 707,904 972,120 785,228 707,904
All import sources 1,252,223 1,124,748 1,011,307 1,252,223 1,124,748 1,011,307
Apparent U.S. consumption 3,787,493 3,196,885 2,849,990 3,131,198 2,637,141 2,317,039
Source: Compiled from data submitted in response to Commission questionnaires and official U.S. import statistics(see table IV-2 source note for the list of relevant HTS statistical reporting numbers).

IV-16
U.S. MARKET SHARES
U.S. market share data are presented in table IV-9, showing separately market sharetotal for total apparent consumption of wire rod and merchant market consumption of wirerod. U.S. producers’ share of total market apparent U.S. consumption of wire rod, based onquantity, decreased by 0.4 percentage points from 2014 to 2016 and, based on value,decreased by 2.4 percentage points. From 2014 to 2016, U.S. producers’ share of merchantmarket apparent U.S. consumption of wire rod, based on quantity, decreased by 1.3 percentagepoints and, based on value, decreased by 3.7 percentage points.
Table IV-9Wire rod: U.S. market shares, 2014-16
Item
Calendar year Calendar year
2014 2015 2016 2014 2015 2016
TOTAL MARKET MERCHANT MARKET
Quantity (short tons) Quantity (short tons)
Apparent U.S. consumption 5,454,176 5,442,066 5,332,017 4,435,158 4,393,786 4,258,701
Share of quantity (percent) Share of quantity (percent)
U.S. producers' U.S. shipments 66.9 66.9 66.4 59.2 59.0 58.0
U.S. imports from--Belarus --- 0.2 0.7 --- 0.2 0.9
Italy 0.0 0.0 0.6 0.0 0.0 0.8
Korea 2.0 2.4 1.9 2.5 2.9 2.4
Russia 0.2 0.1 1.9 0.3 0.2 2.4
South Africa --- 0.8 0.4 --- 1.0 0.5
Spain 0.6 1.5 1.5 0.7 1.8 1.8
Turkey 3.9 4.9 1.8 4.8 6.0 2.3
Ukraine 0.3 1.5 3.0 0.3 1.8 3.8
United Arab Emirates 0.0 0.3 0.4 0.0 0.4 0.5
United Kingdom 1.3 0.8 1.0 1.6 1.0 1.2
Subject sources 8.3 12.4 13.4 10.2 15.4 16.7
Canada 9.6 10.3 10.4 11.8 12.8 13.0
All other sources 15.3 10.3 9.8 18.8 12.8 12.3
Nonsubject sources 24.9 20.7 20.2 30.6 25.6 25.3
All import sources 33.1 33.1 33.6 40.8 41.0 42.0
Table continued on next page.

IV-17
Table IV-9--ContinuedWire rod: U.S. market shares, 2014-16
Item
Calendar year Calendar year
2014 2015 2016 2014 2015 2016
TOTAL MARKET MERCHANT MARKET
Value (1,000 dollars) Value (1,000 dollars)
Apparent U.S. consumption 3,787,493 3,196,885 2,849,990 3,131,198 2,637,141 2,317,039
Share of value (percent) Share of value (percent)
U.S. producers' U.S. shipments 66.9 64.8 64.5 60.0 57.3 56.4
U.S. imports from.--Belarus --- 0.1 0.4 --- 0.1 0.5
Italy 0.0 0.0 0.4 0.0 0.0 0.5
Korea 1.8 2.1 1.8 2.2 2.6 2.2
Russia 0.2 0.1 1.2 0.2 0.1 1.5
South Africa --- 0.6 0.3 --- 0.7 0.3
Spain 0.6 1.6 1.6 0.7 2.0 2.0
Turkey 3.3 4.0 1.5 4.0 4.9 1.9
Ukraine 0.2 1.1 2.1 0.3 1.3 2.6
United Arab Emirates 0.0 0.2 0.3 0.0 0.3 0.3
United Kingdom 1.2 0.8 0.9 1.5 0.9 1.1
Subject sources 7.4 10.6 10.6 8.9 12.9 13.1
Canada 10.7 11.2 11.4 13.0 13.6 14.1
All other sources 15.0 13.3 13.4 18.1 16.2 16.5
Nonsubject sources 25.7 24.6 24.8 31.0 29.8 30.6
All import sources 33.1 35.2 35.5 40.0 42.7 43.6
Source: Compiled from data submitted in response to Commission questionnaires and official U.S. import statistics(see table IV-2 source note for the list of relevant HTS statistical reporting numbers).

V-1
PART V: PRICING DATA
FACTORS AFFECTING PRICES
Raw material costs
The primary raw material input used to produce wire rod using the electric arc furnace(“EAF”) production method is steel scrap. Different types of steel scrap are used in differingamounts depending on the type and quality of wire rod being produced; a larger amount ofheavy melt scrap is used to produce industrial grade wire rod, while more busheling scrap isused to produce higher-end grades of wire rod.1 2 The primary raw materials used in the basicoxygen (or blast oxygen) furnace (“BOF”) production method are coking coal and iron ore.3
Electricity and natural gas costs are also a factor, with electricity being consumed insubstantially larger quantities by electric arc furnaces than basic oxygen furnaces.4 Between2014 and 2016, U.S. producers’ raw material costs as a share of the cost of goods solddecreased from *** percent to *** percent.
Overall, steel scrap prices decreased between January 2014 and December 2016 (figureV-1). The average prices of no. 1 busheling scrap, no. 1 heavy melt scrap, and shredded autoscrap decreased by 39.3 percent, 43.3 percent, and 39.8 percent, respectively.5
Figure V-1Ferrous scrap: Indexed monthly consumer prices, No. 1 busheling scrap, No. 1 heavy melt scrap,and shredded auto scrap, January 2014-December 2016
* * * * * * *
1 Heavy melt scrap is defined as recyclable wrought iron or steel scrap. Busheling scrap is defined asclean steel scrap. Most busheling scrap comes from factory sheet clippings, drops, and stampings. SeeScrap Definitions, https://www.steelmarketupdate.com/resources/terminology/scrap-definitions,accessed April 27, 2017.
2 Carbon and Certain Alloy Steel Wire Rod from Brazil, Canada, Germany, Indonesia, Mexico,Moldova, Trinidad and Tobago, Turkey, and Ukraine, Inv. Nos. 701-TA-417 and 731-TA-953, 954, 957-959, 961, and 962 (Review), USITC Publication 4014, June 2008, p. V-1.
3 Conference transcript, p. 45 (Ryoo); 102 (Cameron), 156 (Nystrom); Kiswire’s postconference brief,exhibit 1 p. 9.
4 Conference transcript, p. 188 (Nystrom). U.S. producer Nucor provided data showing that itselectricity costs accounted for *** percent of all other factory costs during 2014-16. Petitioner Nucor’spostconference brief, exhibit 1-4.
5 During this time, the prices for all three types of scrap were lowest toward the end of 2015, andthen increased with some fluctuation during 2016.

V-2
Between January 2014 and December 2016, the price of natural gas decreased by 24.1percent, while the price of electricity decreased by 5.0 percent (figure V-2).
Figure V-2Natural gas and electricity: Industrial prices, monthly, January 2014-December 2016
Source: Energy Information Administration, Short Term Energy Outlook, www.eia.gov, retrieved March30, 2017.
Most responding U.S. producers (5 of 8) and importers (13 of 22) reported that rawmaterial prices had fluctuated since January 2014. Two U.S. producers and six importersreported that they had decreased, one U.S. producer and one importer reported that they hadincreased, and two importers reported that they had not changed. In general, firms reportedthat scrap prices play a large role in the pricing of wire rod. *** added that while wire rodpricing generally move up and down with scrap prices, low-priced imports can put a ceiling onwire rod prices even when scrap prices continue to rise.
U.S. producers and importers were also asked whether scrap costs are included in theirwire rod prices, and if they are added as a separate raw material surcharge. Seven of 8 U.S.producers and 21 of 25 importers reported that raw material costs were included, while 1 U.S.producer (***) and 5 importers reported adding a separate surcharge.6 Two importers reportedusing American Metal Market (“AMM”) as an index for their scrap prices and one reported
6 Four importers reported using both methods, depending on the product.
0
1
2
3
4
5
6
7
8
0.00
1.00
2.00
3.00
4.00
5.00
6.00
7.00
8.00
2014 2015 2016
Cents
per
kilo
watt-h
our
(ele
ctr
icity
)
Dolla
rsper
thousand
cubic
feet(n
atu
ralgas)
Natural gas Electricity

V-3
using Platt’s as an index for alloy prices. Two importers of wire rod from ***, ***, reportedadding a surcharge only for their cold heading quality steel. U.S. producer *** reported that ithad previously implemented surcharges to account for fluctuations in the price of scrap, buthad not recently due to low-priced subject imports.
Transportation costs to the U.S. market
Transportation costs for wire rod shipped from subject countries to the United Statesduring 2016 averaged the following: Belarus, 10.9 percent; Italy, 4.1 percent; Korea,13.8 percent; Russia, 8.9 percent; South Africa, 13.4 percent; Spain, 15.4 percent; Turkey,6.2 percent; Ukraine, 8.2 percent; the United Arab Emirates, 9.1 percent; and the UnitedKingdom, 18.6 percent. These estimates were derived from official import data and representthe transportation and other charges on imports.7
U.S. inland transportation costs
All 8 responding U.S. producers and 9 of 17 importers reported that they typicallyarrange transportation to their customers. Most U.S. producers reported that their U.S. inlandtransportation costs ranged from 4 to 6 percent; *** reported inland transportation costs of 10percent, and *** reported transportation costs of 12 percent. Among responding importers,more than half (7 of 12) reported a cost of 5 percent or less; the remaining five respondingfirms reported costs ranging from 7 to 11 percent.
PRICING PRACTICES
Pricing methods
The majority of U.S. producers and importers reported using transaction-by-transactionnegotiations to set prices (table V-1). Two responding U.S. producers reported that their pricesare based on an index, one reported basing prices on market conditions, and two reported thattheir prices are individualized based on a number of factors, including raw material costs,import levels, and sales volume.
7 The estimated transportation costs were obtained by subtracting the customs value from the c.i.f.value of the imports for 2016 and then dividing by the customs value based on the following HTSsubheadings: 7213.91.3011, 7213.91.3015, 7213.91.3020, 7213.91.3093, 7213.91.4500, 7213.91.6000,7213.99.0030, 7227.20.0030, 7227.20.0080, 7227.90.6010, 7227.90.6020, 7227.90.6030, and7227.90.6035. Accessed April 7, 2017.

V-4
Table V-1Wire rod: U.S. producers’ and importers’ reported price setting methods, by number ofresponding firms
1
Method U.S. producers Importers
Transaction-by-transaction 8 22
Contract 2 8
Set price list 1 1
Other 4 1
Responding firms 8 251
The sum of responses down may not add up to the total number of responding firms as each firm wasinstructed to check all applicable price setting methods employed.
Source: Compiled from data submitted in response to Commission questionnaires.
U.S. producers and importers were asked to report their 2016 U.S. commercialshipments of wire rod by type of sale. As shown in table V-2, both U.S. producers and importersreported selling the majority of their product in the spot market. U.S. producers reportedselling ***. Importers reported selling ***.
Table V-2Wire rod: U.S. producers’ and importers’ shares of U.S. commercial shipments by type of sale,2016
Type of sale U.S. producers Importers
Long-term contracts *** ***
Annual contracts *** ***
Short-term contracts *** ***
Spot sales *** ***
Total 100.0 100.0Note.--Because of rounding, figures may not add to the totals shown.
Source: Compiled from data submitted in response to Commission questionnaires.
A number of U.S. producers indicated that their contract agreements were less reliablewhen spot prices were lower. Keystone stated that in August 2016 one of its contractcustomers indicated that it would not continue to purchase from Keystone unless Keystonegave it spot pricing.8 Nucor stated that its contracts were more akin to program pricing, andthat its contract agreements do not hold up when spot prices are very low.9 Gerdau stated thatit sold less product via contract compared to spot sales over the course of 2014-16 due to lowspot prices, noting that its contract prices are negotiated either monthly or quarterly.10
8 Conference transcript, p. 187 (Ashby).9 Conference transcript, p. 186 (Nystrom).10 Conference transcript, pp. 185-186 (Canosa).

V-5
Sales terms and discounts
Most U.S. producers (5 of 8) reported typically quoting prices on an f.o.b. basis, whilemost importers (11 of 17) typically quote prices on a delivered basis. Six U.S. producersreported offering sales terms of net 30 days, two offer 1 percent 10 net 30 days, and two offer½ percent 10 net 30 days. Fifteen importers reported offering sales terms of net 30 days, 9 ofnet 60 days, and one of net 45 days. Two importers of ***, ***, reported offering sales terms of30, 60, or 90 days depending on the customer and net 30 days for their cold-heading qualityproducts.
Most U.S. producers (5 of 8) and importers (22 of 25) reported that they do not havespecific discount policies, though a number reported offering discounts. Two U.S. producersreported offering quantity discounts, one reported offering total volume discounts, onereported offering monthly/quarterly volume discounts and cash discounts, one reportedoffering a net 10 day ½ percent discount for quick payment, and another reported offering“foreign fighter pricing” to compete with lower-cost imports.
PRICE DATA
The Commission requested U.S. producers and importers to provide quarterly data forthe total quantity and f.o.b. value of the following products shipped to unrelated U.S.customers during 2014-16.
Product 1.--Industrial quality wire rod, grade C1006, 5.5 mm (7/32 inch) through 12 mm(15/32 inch) in diameter, for hangers, chain link fencing, collated nails and staples,grates, and other formed products (in green condition, e.g., NOT cleaned, coated,etc.).
Product 2.--Industrial quality wire rod, grade C1008 through C1010, 5.5 mm (7/32 inch) through12 mm (15/32 inch) in diameter, for hangers, chain link fencing, collated nails andstaples, grates, and other formed products (in green condition, e.g., NOT cleaned,coated, etc.).
Product 3.--Mesh quality wire rod, grades C1006 through C1015, 5.5 mm (7/32 inch) through14 mm (9/16 inch) in diameter, for the manufacturing of concrete reinforcementproducts such as wire for A-82 applications (in green condition, e.g., NOT cleaned,coated, etc.).
Product 4.--Grades C1050 through C1070, 5.5 mm (7/32 inch) through 6.5 mm (1/4 inch) indiameter, for spring applications excluding valve spring (in green condition, e.g.,NOT cleaned, coated, etc.).
Product 5.--Industrial quality wire, grades C1060 through 1065, 5.5mm (7/32 inch) through17.5 mm (11/16 inch) in diameter, for spring wire rod used in upholstery andmechanical applications, as well as oil-tempered spring applications.

V-6
Eight U.S. producers and 13 importers provided usable pricing data for sales of therequested products, although not all firms reported pricing for all products for all quarters.11 12
Pricing data reported by these firms accounted for approximately 42.9 percent of U.S.producers’ shipments of wire rod and the following percentages of U.S. shipments of subjectimports from subject countries in 2016: Belarus, *** percent; Italy, *** percent; Korea, ***percent; Russia, *** percent; South Africa, *** percent; Spain, *** percent; Turkey, ***percent; Ukraine, *** percent; the United Arab Emirates, *** percent; and the United Kingdom,*** percent.
Price data for products 1-5 are presented in tables V-3 to V-7 and figures V-3 to V-7.Price data for nonsubject country Canada are presented in Appendix E.
Table V-3Wire Rod: Weighted-average f.o.b. prices and quantities of domestic and imported product 1 andmargins of underselling/(overselling), by quarters, January 2014-December 2016
* * * * * * *
Table V-4Wire Rod: Weighted-average f.o.b. prices and quantities of domestic and imported product 2 andmargins of underselling/(overselling), by quarters, January 2014-December 2016
* * * * * * *
Table V-5Wire Rod: Weighted-average f.o.b. prices and quantities of domestic and imported product 3 andmargins of underselling/(overselling), by quarters, January 2014-December 2016
* * * * * * *
Table V-6Wire Rod: Weighted-average f.o.b. prices and quantities of domestic and imported product 4 andmargins of underselling/(overselling), by quarters, January 2014-December 2016
* * * * * * *
11 Per-unit pricing data are calculated from total quantity and total value data provided by U.S.producers and importers. The precision and variation of these figures may be affected by rounding,limited quantities, and producer or importer estimates.
12 Importer *** initially reported anomalous average unit values for its imports from ***, stating thatit was “probably due to the ocean freight.” Commission staff requested revised price data with alltransport costs removed, but did not receive a response. Accordingly, this firm’s pricing data – *** –have not been included in this pricing analysis.

V-7
Table V-7Wire Rod: Weighted-average f.o.b. prices and quantities of domestic and imported product 5 andmargins of underselling/(overselling), by quarters, January 2014-December 2016
* * * * * * *
Figure V-3Wire rod: Weighted-average prices and quantities of domestic and imported product 1, byquarters, January 2014-December 2016
* * * * * * *
Figure V-4Wire rod: Weighted-average prices and quantities of domestic and imported product 2, byquarters, January 2014-December 2016
* * * * * * *
Figure V-5Wire rod: Weighted-average prices and quantities of domestic and imported product 3,
1by
quarters, January 2014-December 2016
* * * * * * *
Figure V-6Wire rod: Weighted-average prices and quantities of domestic and imported product 4,
1by
quarters, January 2014-December 2016
* * * * * * *
Figure V-7Wire rod: Weighted-average prices and quantities of domestic and imported product 5,
1by
quarters, January 2014-December 2016
* * * * * * *
Price trends
In general, prices decreased during 2014-16. Table V-8 summarizes the price trends, byproduct and by country. As shown in the table, domestic price decreases from January 2014 toDecember 2016 ranged from 30.8 percent (for product 5) to 32.7 percent (for product 4). TheCommission did not receive enough quarterly instances of price data to show price trends fromJanuary 2014-December 2016 for all countries for all products. For the instances in which pricedata was received for all 12 quarters, however, import prices also decreased; prices for product

V-8
1 from Turkey decreased by *** percent, and prices for product 3 from Spain decreased by ***percent. No price data were reported for product 1 from Belarus and Spain; product 2 fromSpain and the United Kingdom; product 3 from the United Kingdom; product 4 from Italy,Russia, and the United Arab Emirates; and product 5 from all subject countries except Korea,Spain, and the United Kingdom.
Table V-8Wire rod: Summary of weighted-average f.o.b. prices for products 1-5 from the United States andsubject countries
* * * * * * *
Price comparisons
Tables V-9a and V-9b show underselling/overselling by subject country (table V-9a) andby pricing product (table V-9b). As shown in table V-9a, prices for wire rod imported from allsubject countries combined were below those for U.S.-produced product in 132 of 175instances (892,749 short tons); margins of underselling ranged from 0.1 percent to 44.5percent. In the remaining 43 instances (251,716 short tons), prices for wire rod from subjectcountries were between 0.5 and 51.4 percent above prices for the domestic wire rod. Each ofthe ten subject countries showed larger volumes of underselling than overselling.
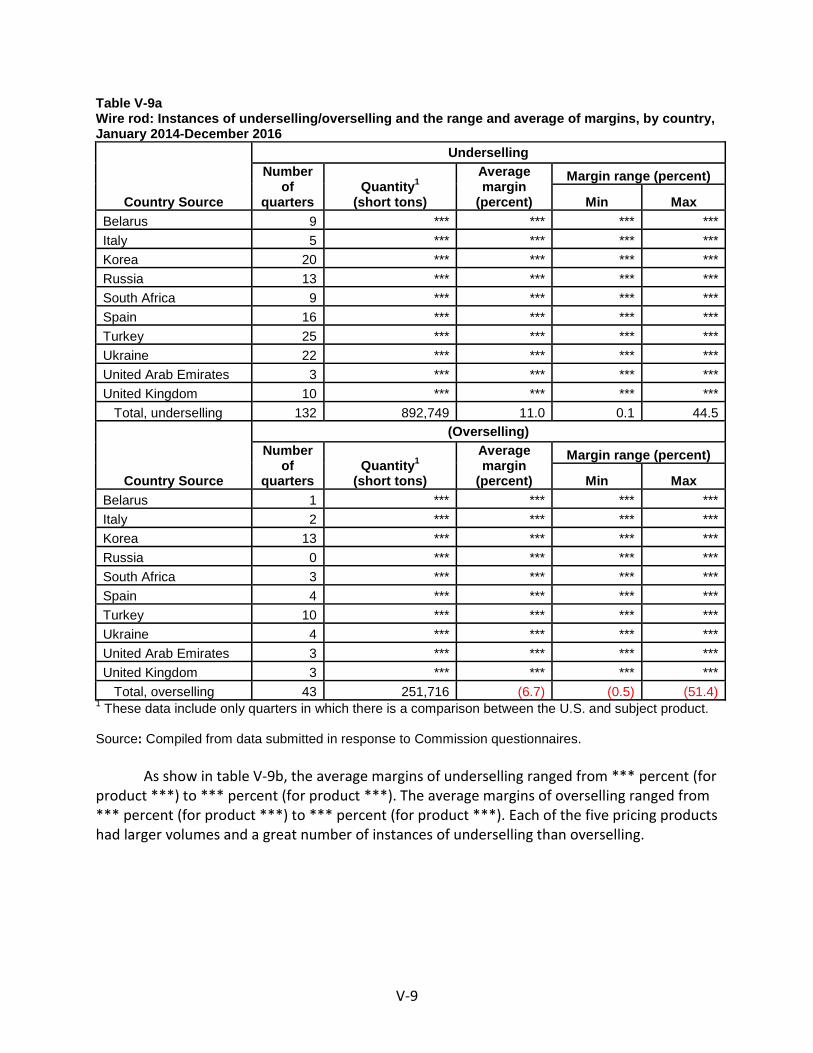
V-9
Table V-9aWire rod: Instances of underselling/overselling and the range and average of margins, by country,January 2014-December 2016
Country Source
Underselling
Numberof
quartersQuantity
1
(short tons)
Averagemargin
(percent)
Margin range (percent)
Min Max
Belarus 9 *** *** *** ***
Italy 5 *** *** *** ***
Korea 20 *** *** *** ***
Russia 13 *** *** *** ***
South Africa 9 *** *** *** ***
Spain 16 *** *** *** ***
Turkey 25 *** *** *** ***
Ukraine 22 *** *** *** ***
United Arab Emirates 3 *** *** *** ***
United Kingdom 10 *** *** *** ***
Total, underselling 132 892,749 11.0 0.1 44.5
Country Source
(Overselling)
Numberof
quartersQuantity
1
(short tons)
Averagemargin
(percent)
Margin range (percent)
Min Max
Belarus 1 *** *** *** ***
Italy 2 *** *** *** ***
Korea 13 *** *** *** ***
Russia 0 *** *** *** ***
South Africa 3 *** *** *** ***
Spain 4 *** *** *** ***
Turkey 10 *** *** *** ***
Ukraine 4 *** *** *** ***
United Arab Emirates 3 *** *** *** ***
United Kingdom 3 *** *** *** ***
Total, overselling 43 251,716 (6.7) (0.5) (51.4)1
These data include only quarters in which there is a comparison between the U.S. and subject product.
Source: Compiled from data submitted in response to Commission questionnaires.
As show in table V-9b, the average margins of underselling ranged from *** percent (forproduct ***) to *** percent (for product ***). The average margins of overselling ranged from*** percent (for product ***) to *** percent (for product ***). Each of the five pricing productshad larger volumes and a great number of instances of underselling than overselling.

V-10
Table V-9bWire rod: Instances of underselling/overselling and the range and average of margins, by pricingproduct, January 2014-December 2016
Product
Underselling
Number ofquarters
Quantity1
(short tons)
Averagemargin
(percent)
Margin range (percent)
Min Max
Product 1 23 *** *** *** ***
Product 2 42 *** *** *** ***
Product 3 43 *** *** *** ***
Product 4 16 *** *** *** ***
Product 5 8 *** *** *** ***
Total, underselling 132 892,749 11.0 0.1 44.5
Product
(Overselling)
Number ofquarters
Quantity1
(short tons)
Averagemargin
(percent)
Margin range (percent)
Min Max
Product 1 18 *** *** *** ***
Product 2 6 *** *** *** ***
Product 3 9 *** *** *** ***
Product 4 5 *** *** *** ***
Product 5 5 *** *** *** ***
Total, overselling 43 251,716 (6.7) (0.5) (51.4)1
These data include only quarters in which there is a comparison between the U.S. and subject product.
Source: Compiled from data submitted in response to Commission questionnaires.
LOST SALES AND LOST REVENUE
Of the 10 responding U.S. producers, 7 reported that they had to either reduce prices orroll back announced price increases, and 8 firms reported that they had lost sales. Four U.S.producers submitted lost sales and lost revenue allegations. These U.S. producers identified 29firms where they lost sales or revenue (8 consisting of lost sales allegations, two consisting oflost revenue allegations, and 18 consisting of both types of allegations). These allegationscovered all 10 subject countries during 2016 and 2017.
Staff contacted 28 purchasers and received responses from 22 purchasers. Respondingpurchasers reported purchasing approximately 1.9 million short tons of wire rod in 2016 (tablesV-10 and V-11). During 2016, these purchasers reported buying 59.8 percent of their wire rodfrom U.S. producers, 1.5 percent from Belarus, 1.4 percent from Italy, 4.4 percent from Korea,4.3 percent from Russia, 1.8 percent from South Africa, 1.6 percent from Spain, 2.6 percentfrom Turkey, 6.4 percent from Ukraine, 1.5 percent from the United Arab Emirates, 1.5 percentfrom the United Kingdom, 13.1 percent from nonsubject countries, and less than 0.1 percentfrom “unknown sources.” As a share of all purchases, the reported estimated share of wire rodthat responding purchasers purchased from subject sources increased 11.0 percentage pointsbetween 2014 and 2016, from 16.0 percent to 27.0 percent (table V-11).

V-11
Of the responding purchasers, 4 reported decreasing purchases from domesticproducers, 9 reported increasing purchases, 3 reported no change, and 6 reported fluctuatingpurchases.13 Explanations for increasing purchases of domestic product included increasingdemand for domestic product after the application of new duties on China and Mexico (***),increasing demand for product that only domestic mills can make (***), increasingcompetitiveness of domestic mills in 2016 (***) via the offering of “foreign fighter” prices (***),new product growth and the ability to produce to specification (***), and increasing domesticpurchases due to an acquisition (***). Explanations for decreasing purchases of domesticproduct included increased competition from imported wire and wire products (***), theshutdown of one major domestic plant (***), domestic mills being too full to produce long runs(***), and increased demand for higher carbon grade product which requires blast furnacetechnology not available in the United States (***). Four purchasers (***) stated that domesticproducers had a limited capacity to meet orders, particularly following domestic mill closings.
Of the 22 responding purchasers, 17 reported that they had purchased imported wirerod from subject countries instead of U.S.-produced wire rod since 2014; five purchasersreported purchasing imports of wire rod from Belarus instead of domestic product, 3 from Italy,8 from Korea, 3 from Russia, 7 from South Africa, 4 from Spain, 12 from Turkey, 6 from Ukraine,4 from the United Arab Emirates, and 1 from the United Kingdom. Fourteen of these purchasersreported that subject import prices were lower than U.S.-produced product, and 11 of thesepurchasers reported that price was a primary reason for the decision to purchase importedproduct rather than U.S.-produced product. The reported estimated quantity purchased fromsubject import sources rather than domestic sources since January 2014 was 361,204 short tons(tables V-12 and V-13). Purchasers identified the following as non-price reasons for purchasingimported rather than U.S.-produced wire rod: a lack of capacity at domestic mills (***); a lackof higher grade product available from domestic sources (***); a lack of qualified domestic millswith the ability to meet higher grade product requests (***); and the ability of foreignproducers to fill large volume product orders when U.S. producers could not (***) (table V-12).In additional comments, *** elaborated that it did not buy imported wire rod “instead” ofdomestic wire rod, but rather its purchases from both from domestic and foreign sources grewto meet the firm’s various product demands.
Of the 22 responding purchasers, 7 reported that U.S. producers had reduced prices inorder to compete with lower-priced imports from subject countries (tables V-14 and V-15); 12reported that they did not know. The reported estimated price reduction ranged from 6.0 to15.0 percent (averaging 9.2 percent) in response to competition from Belarus, Russia, SouthAfrica, Spain, Turkey, and Ukraine. In describing the price reductions, one purchaser (***)indicated that its domestic supplier provided discounts 15 percent lower than AMM LowCarbon Wire Rod index price in an effort to compete with foreign producers. Another purchaser(***) indicated that although the prices of imported wire rod might be lower than domestic
13 Of the 22 responding purchasers, two reported purchasing wire rod from “unknown source”countries.

V-12
prices at the time of booking, the lag between the time of order and delivery could result inimport prices being the same or higher at the time of product arrival.
Responding U.S. purchasers identified various methods they use in purchasing wire rod,including a mix of contract and spot purchases. Several purchasers (***) reported buying wirerod on a monthly basis, while one (***) reported buying on a weekly basis, and another (***)on a quarterly basis.
Table V-10Wire rod: Purchasers’ responses regarding purchasing patterns, by firm
Purchaser
Purchases in 2016(short tons)
Change in shares, 2014-16(percentage points)
3
Domestic Subject1
All other2
Domestic Subject
*** *** *** *** *** ***
*** *** *** *** *** ***
*** *** *** *** *** ***
*** *** *** *** *** ***
*** *** *** *** *** ***
*** *** *** *** *** ***
*** *** *** *** *** ***
*** *** *** *** *** ***
*** *** *** *** *** ***
*** *** *** *** *** ***
*** *** *** *** *** ***
*** *** *** *** *** ***
*** *** *** *** *** ***
*** *** *** *** *** ***
*** *** *** *** *** ***
*** *** *** *** *** ***
*** *** *** *** *** ***
*** *** *** *** *** ***
*** *** *** *** *** ***
*** *** *** *** *** ***
*** *** *** *** *** ***
*** *** *** *** *** ***
Total 1,136,847 514,474 251,313 (1.0) 11.11
Includes all subject countries.2
Includes all other sources and unknown sources.3
Percentage points (pp) change: Change in the share of the firm’s total purchases of domestic and/orsubject country imports between first and last years.
Source: Compiled from data submitted in response to Commission questionnaires.

V-13
Table V-11Wire rod: Purchasers’ responses regarding purchasing patterns, by subject country
Source
Numberof firms
reporting
Calendar year Comparison years
2014 2015 2016 2014-16
Quantity (short tons) Changes (percent)
United States 22 1,198,118 1,170,037 1,136,847 (5.1)
Belarus 9 --- 4,839 28,688 ---
Italy 5 --- 26 27,473 ---
Korea 13 100,020 97,708 84,262 (15.8)
Russia 8 --- 3,559 80,981 ---
South Africa 10 --- 33,453 34,250 ---
Spain 7 25,019 51,609 30,609 22.3
Turkey 16 121,885 119,332 50,407 (58.6)
Ukraine 7 30,933 46,576 122,165 294.9
United Arab Emirates 9 1,677 241 27,808 1,558.2
United Kingdom 3 *** *** *** (21.7)
All subject sources 21 315,072 371,007 514,474 63.3
Canada 7 35,999 60,155 46,580 29.4
All other countries 16 416,934 187,725 204,014 (51.1)
Unknown sources *** *** *** *** (90.2)
All sources 22 1,973,451 1,792,606 1,902,634 (3.6)
Source: Compiled from data submitted in response to Commission questionnaires.

V-14
Table V-12Wire rod: Purchasers’ responses to purchasing subject imports instead of domestic product, byfirm
Purchaser
Purchasedimports
instead ofdomestic
(Y/N)
Importspricedlower(Y/N)
If purchased imports instead of domestic,was price a primary reason
Y/N
If Yes,quantity
purchasedinstead ofdomestic
(short tons) If No, non-price reason
*** *** *** *** *** ***
*** *** *** *** *** ***
*** *** *** *** *** ***
*** *** *** *** *** ***
*** *** *** *** *** ***
*** *** *** *** *** ***
*** *** *** *** *** ***
*** *** *** *** *** ***
*** *** *** *** *** ***
*** *** *** *** *** ***
*** *** *** *** *** ***
*** *** *** *** *** ***
*** *** *** *** *** ***
*** *** *** *** *** ***
*** *** *** *** *** ***
*** *** *** *** *** ***
*** *** *** *** *** ***
*** *** *** *** *** ***
*** *** *** *** *** ***
*** *** *** *** *** ***
*** *** *** *** *** ***
*** *** *** *** *** ***
TotalYes-17 /
No-5Yes-14 /
No-3
Yes-11 /No-6 361,204
Source: Compiled from data submitted in response to Commission questionnaires.

V-15
Table V-13
Wire rod: Purchasers’ responses to purchasing imported product instead of domestic product, bysubject country
Source
Count ofpurchasersreportingsubject
instead ofdomestic
Count ofpurchasersreporting
that importswere priced
lower
Count ofpurchasers
reporting thatprice was a
primaryreason for
subjectinstead ofdomestic
Quantity(short tons)
Other reportedreasons forpurchasing
subjectinstead ofdomestic
Belarus 5 5 3 5,847 3
Italy 3 3 1 23,532 4
Korea 8 5 3 62,286 7
Russia 3 3 3 19,085 2
South Africa 7 6 6 11,727 3
Spain 4 2 2 3,022 3
Turkey 12 11 9 112,931 4
Ukraine 6 6 3 111,245 5
United ArabEmirates 4 4 2 11,529 3
United Kingdom 1 0 0 0 3
Any subjectsource 17 14 11 361,204 6Source: Compiled from data submitted in response to Commission questionnaires.

V-16
Table V-14Wire rod: Purchasers’ responses to U.S. producer price reductions, by firm
Purchaser
U.S. producersreduced pricedto compete withsubject imports
(Y/N)
If U.S. producers reduced prices
EstimatedU.S. pricereduction(percent) Additional information, if available
*** *** *** ***
*** *** *** ***
*** *** *** ***
*** *** *** ***
*** *** *** ***
*** *** *** ***
*** *** *** ***
*** *** *** ***
*** *** *** ***
*** *** *** ***
*** *** *** ***
*** *** *** ***
*** *** *** ***
*** *** *** ***
*** *** *** ***
*** *** *** ***
*** *** *** ***
*** *** *** ***
*** *** *** ***
*** *** *** ***
*** *** *** ***
*** *** *** ***
Total / averageYes-7 / No-3 /Don’t Know-12 9.2
Source: Compiled from data submitted in response to Commission questionnaires.

V-17
Table V-15Wire rod: Purchasers’ responses to U.S. producer price reductions, by subject country
Source
Count of purchasersreporting U.S. producers
reduced prices
Simple average ofestimated U.S. pricereduction (percent)
Range of estimated U.S.price reductions
(percent)
Belarus 4 11.0 7.0 to 15.0
Italy 1 --- ---
Korea 1 --- ---
Russia 2 15.0 15.0 to 15.0
South Africa 2 6.0 6.0 to 6.0
Spain 1 6.0 6.0 to 6.0
Turkey 6 10.0 7.0 to 15.0
Ukraine 2 15.0 15.0 to 15.0
United Arab Emirates 1 --- ---
United Kingdom 0 --- ---
All subject sources 7 9.2 6.0 to 15.0Source: Compiled from data submitted in response to Commission questionnaires.


VI 1
PART VI: FINANCIAL EXPERIENCE OF U.S. PRODUCERS
BACKGROUND
*** U.S. producers provided useable financial data for their total and merchant marketoperations on wire rod: ***.1 2 Each of the firms reported commercial sales (U.S. shipments andexports) that were the same as their merchant market sales. *** firms, ***, reported internalconsumption of wire rod which was used in house for the production of wire and wireproducts, and *** firms reported transfers of wire rod to affiliates for the production of wireand wire products. The reported data are believed to account for almost all known sales by U.S.producers of wire rod.3
With respect to their U.S. operations, five producers reported that they purchase inputsfrom related parties: ***.4 5 6
Three firms, *** accounted for approximately *** of merchant market sales value and*** of total market sales of wire rod by U.S. producers in 2016 (based on table VI 1). In samefacilities that produced other products, wire rod accounted for an average 64 percent of U.S.producers� net sales in 2016. Individually, wire rod�s share of net sales ranged from a low of ***percent (***) to a high of *** percent (***).
As noted previously, ArcelorMittal closed its Georgetown, South Carolina wire rodproduction plant in August 2015. As such, ArcelorMittal is largely excluded from narrativediscussions on company specific financial trends from 2014 to 2016; although ArcelorMittal�sreported data for 2014 and 2015 are included throughout this report and in the aggregateddiscussions of the U.S. industry, unless otherwise specified.7 Additionally, two U.S. producers,***, did not report any internal consumption or transfers to related firms from 2014 to 2016;therefore, these two firms� total market operations were the same as their merchant marketoperations.
1 ***. ***�s U.S. producer questionnaire, II 15.2 Financial results were reported on the basis of generally accepted accounting principles (GAAP).
U.S. producers reported their financial results for calendar year periods ***.3 *** submitted an incomplete U.S. producer questionnaire and its responses are not included in the
aggregated financial data. Republic reported in its partial response in these investigations that it ***.Total production of wire rod in 2016 was *** short tons, with $*** in net sales.
4 ***�s U.S. producer questionnaires, III 7.5 ***. U.S. producers� questionnaires, III 7, ***, email response to USITC staff, April 28, 2017, and
***, email response to USITC staff, April 28, 2017.6 The Commission�s current practice requires that relevant cost information associated with input
purchases from related suppliers correspond to the manner in which this information is reported in theU.S. producer�s own accounting books and records.
7 ArcelorMittal�s plant closure in August 2015 ***.

VI 2
OPERATIONS ON WIRE ROD
Table VI 1 presents aggregated data on U.S. producers� total operations side by sidewith their merchant market operations on wire rod during 2014 16. In terms of profitability, theU.S. wire rod industry�s experience diverged in their total market operations compared to theirmerchant market operations in absolute terms, with gross profit, operating income, and netincome increasing for the total market but falling for the merchant market from 2014 to 2016.In both total market and merchant market, total net sales and cost of goods sold (�COGS�) fellsteadily during this time. In the total market, operating income and net income irregularlyincreased during this time; conversely, operating income and net income irregularly decreasedin the merchant market. Cash flows irregularly increased in both markets from 2014 to 2016. Asa ratio to net sales, COGS decreased while gross profit, selling, general and administrative(�SG&A�) expenses, operating income, and net income increased from 2014 to 2016 in bothtotal market and merchant market operations.8 On a per unit basis, total net sales and COGSdeclined in both types of operations from 2014 to 2016.
8 Part of the increase in U.S. producers� profitability over the period ***.

VI 3
Table VI-1Wire Rod: Results of operations of U.S. producers, 2014-16
Item
Calendar year Calendar year
2014 2015 2016 2014 2015 2016
TOTAL MARKET MERCHANT MARKET
Quantity (short tons) Quantity (short tons)
Commercial sales 2,669,611 2,625,619 2,507,226 2,669,611 2,625,619 2,507,226
Internal consumption1 *** *** ***
Transfers to related firms2 *** *** ***
Total net sales 3,689,123 3,674,408 3,581,356 2,669,611 2,625,619 2,507,226
Value (1,000 dollars) Value (1,000 dollars)
Commercial sales 1,912,967 1,534,935 1,328,554 1,912,967 1,534,935 1,328,554
Internal consumption1
*** *** ***
Transfers to related firms2
*** *** ***
Total net sales 2,569,813 2,095,115 1,862,126 1,912,967 1,534,935 1,328,554
Cost of goods sold--Raw materials 1,572,354 1,165,000 937,193 1,160,050 849,427 668,585
Direct labor 127,253 130,593 132,053 109,158 111,824 113,939
Other factory costs 733,626 685,172 645,650 540,595 507,212 452,384
Total COGS 2,433,233 1,980,765 1,714,896 1,809,803 1,468,463 1,234,908
Gross profit 136,580 114,350 147,230 103,164 66,472 93,646
SG&A expense 84,072 76,932 83,693 64,366 57,556 63,050
Operating income or (loss) 52,508 37,418 63,537 38,798 8,916 30,596
Interest expense 7,543 6,640 (96) 5,511 5,129 (990)
All other expenses 12,352 12,318 16,670 7,016 7,198 12,637
All other income 6,444 5,682 7,653 6,123 5,057 7,338
Net income or (loss) 39,057 24,142 54,616 32,394 1,646 26,287
Depreciation/amortization 51,449 60,755 65,965 41,430 48,245 52,797
Cash flow 90,506 84,897 120,581 73,824 49,891 79,084
Ratio to net sales (percent) Ratio to net sales (percent)
Cost of goods sold--Raw materials 61.2 55.6 50.3 60.6 55.3 50.3
Direct labor 5.0 6.2 7.1 5.7 7.3 8.6
Other factory costs 28.5 32.7 34.7 28.3 33.0 34.1
Average COGS 94.7 94.5 92.1 94.6 95.7 93.0
Gross profit 5.3 5.5 7.9 5.4 4.3 7.0
SG&A expense 3.3 3.7 4.5 3.4 3.7 4.7
Operating income or (loss) 2.0 1.8 3.4 2.0 0.6 2.3
Net income or (loss) 1.5 1.2 2.9 1.7 0.1 2.0
Table continued on next page.

VI 4
Table VI-1--ContinuedWire Rod: Results of operations of U.S. producers, 2014-16
ItemCalendar year Calendar year
2014 2015 2016 2014 2015 2016
TOTAL MARKET MERCHANT MARKET
Ratio to total COGS (percent) Ratio to total COGS (percent)
Cost of goods sold--Raw materials 64.6 58.8 54.7 64.1 57.8 54.1
Direct labor 5.2 6.6 7.7 6.0 7.6 9.2
Other factory costs 30.2 34.6 37.6 29.9 34.5 36.6
Average COGS 100.0 100.0 100.0 100.0 100.0 100.0
Unit value (dollars per short ton) Unit value (dollars per short ton)
Commercial sales 717 585 530 717 585 530
Internal consumption 640 519 461
Transfers to related firms 645 539 507
Total net sales 697 570 520 717 585 530
Cost of goods sold--Raw materials 426 317 262 435 324 267
Direct labor 34 36 37 41 43 45
Other factory costs 199 186 180 202 193 180
Average COGS 660 539 479 678 559 493
Gross profit 37 31 41 39 25 37
SG&A expense 23 21 23 24 22 25
Operating income or (loss) 14 10 18 15 3 12
Net income or (loss) 11 7 15 12 1 10
Number of firms reporting Number of firms reporting
Operating losses 6 4 5 5 5 6
Net losses 6 5 4 5 5 5
Data 9 9 8 9 9 81 Internal consumption was reported by ***.2
Transfers to related firms were reported by ***.
Source: Compiled from data submitted in response to Commission questionnaires.

VI 5
Table VI 2 shows the change in average unit values for the total market and merchantmarket data presented in table VI 1 between yearly periods.
Table VI-2Wire rod: Changes in AUVs, between calendar years
ItemBetween Calendar years Between Calendar years
2014-16 2014-15 2015-16 2014-16 2014-15 2015-16
TOTAL MARKET MERCHANT MARKET
Commercial sales (187) (132) (55) (187) (132) (55)
Internal consumption *** *** ***
Transfers to related firms *** *** ***
Total net sales (177) (126) (50) (187) (132) (55)
Cost of goods sold--Raw materials (165) (109) (55) (168) (111) (57)
Direct labor 2 1 1 5 2 3
Other factory costs (19) (12) (6) (22) (9) (13)
Average COGS (181) (120) (60) (185) (119) (67)
Gross profit 4 (6) 10 (1) (13) 12
SG&A expense 1 (2) 2 1 (2) 3
Operating income or (loss) 4 (4) 8 (2) (11) 9
Net income or (loss) 5 (4) 9 (2) (12) 10
Source: Calculated from data in table VI-1.
Table VI 3 presents data for the wire rod operations of U.S. producers on a firm by firmbasis, with results of total operations of U.S. producers presented side by side with theirmerchant market operations.

VI 6
Table VI-3
Wire Rod: Results of operations of U.S. producers, by firm, 2014-16
Item
Calendar year Calendar year
2014 2015 2016 2014 2015 2016
TOTAL MARKET MERCHANT MARKET
Total net sales (short tons) Commercial sales (short tons)
ArcelorMittal *** *** N/A *** *** N/A
Cascade *** *** *** *** *** ***
Charter *** *** *** *** *** ***
Evraz *** *** *** *** *** ***
Gerdau *** *** *** *** *** ***
Keystone *** *** *** *** *** ***
Mid American *** *** *** *** *** ***
Nucor *** *** *** *** *** ***
Sterling *** *** *** *** *** ***
Total quantity 3,689,123 3,674,408 3,581,356 2,669,611 2,625,619 2,507,226
Total net sales (1,000 dollars) Commercial sales (1,000 dollars)
ArcelorMittal *** *** N/A *** *** N/A
Cascade *** *** *** *** *** ***
Charter *** *** *** *** *** ***
Evraz *** *** *** *** *** ***
Gerdau *** *** *** *** *** ***
Keystone *** *** *** *** *** ***
Mid American *** *** *** *** *** ***
Nucor *** *** *** *** *** ***
Sterling *** *** *** *** *** ***
Total value 2,569,813 2,095,115 1,862,126 1,912,967 1,534,935 1,328,554
Cost of goods sold (1,000 dollars) Cost of goods sold (1,000 dollars)
ArcelorMittal *** *** N/A *** *** N/A
Cascade *** *** *** *** *** ***
Charter *** *** *** *** *** ***
Evraz *** *** *** *** *** ***
Gerdau *** *** *** *** *** ***
Keystone *** *** *** *** *** ***
Mid American *** *** *** *** *** ***
Nucor *** *** *** *** *** ***
Sterling *** *** *** *** *** ***
Total COGS 2,433,233 1,980,765 1,714,896 1,809,803 1,468,463 1,234,908
Table continued on next page.

VI 7
Table VI-3--ContinuedWire Rod: Results of operations of U.S. producers, by firm, 2014-16
Item
Calendar year Calendar year
2014 2015 2016 2014 2015 2016
TOTAL MARKET MERCHANT MARKET
Gross income or (loss)(1,000 dollars)
Gross income or (loss)(1,000 dollars)
ArcelorMittal *** *** N/A *** *** N/A
Cascade *** *** *** *** *** ***
Charter *** *** *** *** *** ***
Evraz *** *** *** *** *** ***
Gerdau *** *** *** *** *** ***
Keystone *** *** *** *** *** ***
Mid American *** *** *** *** *** ***
Nucor *** *** *** *** *** ***
Sterling *** *** *** *** *** ***
Total gross income or (loss) 136,580 114,350 147,230 103,164 66,472 93,646
SG&A expenses (1,000 dollars) SG&A expenses (1,000 dollars)
ArcelorMittal *** *** N/A *** *** N/A
Cascade *** *** *** *** *** ***
Charter *** *** *** *** *** ***
Evraz *** *** *** *** *** ***
Gerdau *** *** *** *** *** ***
Keystone *** *** *** *** *** ***
Mid American *** *** *** *** *** ***
Nucor *** *** *** *** *** ***
Sterling *** *** *** *** *** ***
Total SG&A expenses 84,072 76,932 83,693 64,366 57,556 63,050
Operating income or (loss)(1,000 dollars)
Operating income or (loss)(1,000 dollars)
ArcelorMittal *** *** N/A *** *** N/A
Cascade *** *** *** *** *** ***
Charter *** *** *** *** *** ***
Evraz *** *** *** *** *** ***
Gerdau *** *** *** *** *** ***
Keystone *** *** *** *** *** ***
Mid American *** *** *** *** *** ***
Nucor *** *** *** *** *** ***
Sterling *** *** *** *** *** ***
Total operating income or (loss) 52,508 37,418 63,537 38,798 8,916 30,596
Table continued on next page.

VI 8
Table VI-3--ContinuedWire Rod: Results of operations of U.S. producers, by firm, 2014-16
Item
Calendar year Calendar year
2014 2015 2016 2014 2015 2016
TOTAL MARKET MERCHANT MARKET
Net income or (loss)(1,000 dollars)
Net income or (loss)(1,000 dollars)
ArcelorMittal *** *** N/A *** *** N/A
Cascade *** *** *** *** *** ***
Charter *** *** *** *** *** ***
Evraz *** *** *** *** *** ***
Gerdau *** *** *** *** *** ***
Keystone *** *** *** *** *** ***
Mid American *** *** *** *** *** ***
Nucor *** *** *** *** *** ***
Sterling *** *** *** *** *** ***
Total net income or (loss) 39,057 24,142 54,616 32,394 1,646 26,287
COGS to net sales ratio(percent)
COGS to net sales ratio(percent)
ArcelorMittal *** *** N/A *** *** N/A
Cascade *** *** *** *** *** ***
Charter *** *** *** *** *** ***
Evraz *** *** *** *** *** ***
Gerdau *** *** *** *** *** ***
Keystone *** *** *** *** *** ***
Mid American *** *** *** *** *** ***
Nucor *** *** *** *** *** ***
Sterling *** *** *** *** *** ***
Average COGS to net sales ratio 94.7 94.5 92.1 94.6 95.7 93.0
Gross income or (loss) tonet sales ratio (percent)
Gross income or (loss) tonet sales ratio (percent)
ArcelorMittal *** *** N/A *** *** N/A
Cascade *** *** *** *** *** ***
Charter *** *** *** *** *** ***
Evraz *** *** *** *** *** ***
Gerdau *** *** *** *** *** ***
Keystone *** *** *** *** *** ***
Mid American *** *** *** *** *** ***
Nucor *** *** *** *** *** ***
Sterling *** *** *** *** *** ***
Average gross income or (loss)to net sales ratio 5.3 5.5 7.9 5.4 4.3 7.0
Table continued on next page.

VI 9
Table VI-3--ContinuedWire Rod: Results of operations of U.S. producers, by firm, 2014-16
Item
Calendar year Calendar year
2014 2015 2016 2014 2015 2016
TOTAL MARKET MERCHANT MARKET
SG&A expense to net sales ratio(percent)
SG&A expense to net sales ratio(percent)
ArcelorMittal *** *** N/A *** *** N/A
Cascade *** *** *** *** *** ***
Charter *** *** *** *** *** ***
Evraz *** *** *** *** *** ***
Gerdau *** *** *** *** *** ***
Keystone *** *** *** *** *** ***
Mid American *** *** *** *** *** ***
Nucor *** *** *** *** *** ***
Sterling *** *** *** *** *** ***
Average SG&A expense tonet sales ratio 3.3 3.7 4.5 3.4 3.7 4.7
Operating income or (loss) tonet sales ratio (percent)
Operating income or (loss) tonet sales ratio (percent)
ArcelorMittal *** *** N/A *** *** N/A
Cascade *** *** *** *** *** ***
Charter *** *** *** *** *** ***
Evraz *** *** *** *** *** ***
Gerdau *** *** *** *** *** ***
Keystone *** *** *** *** *** ***
Mid American *** *** *** *** *** ***
Nucor *** *** *** *** *** ***
Sterling *** *** *** *** *** ***
Average operating income or(loss) to net sales ratio 2.0 1.8 3.4 2.0 0.6 2.3
Net income or (loss) tonet sales ratio (percent)
Net income or (loss) tonet sales ratio (percent)
ArcelorMittal *** *** N/A *** *** N/A
Cascade *** *** *** *** *** ***
Charter *** *** *** *** *** ***
Evraz *** *** *** *** *** ***
Gerdau *** *** *** *** *** ***
Keystone *** *** *** *** *** ***
Mid American *** *** *** *** *** ***
Nucor *** *** *** *** *** ***
Sterling *** *** *** *** *** ***
Average net income or (loss)to net sales ratio 1.5 1.2 2.9 1.7 0.1 2.0
Table continued on next page.
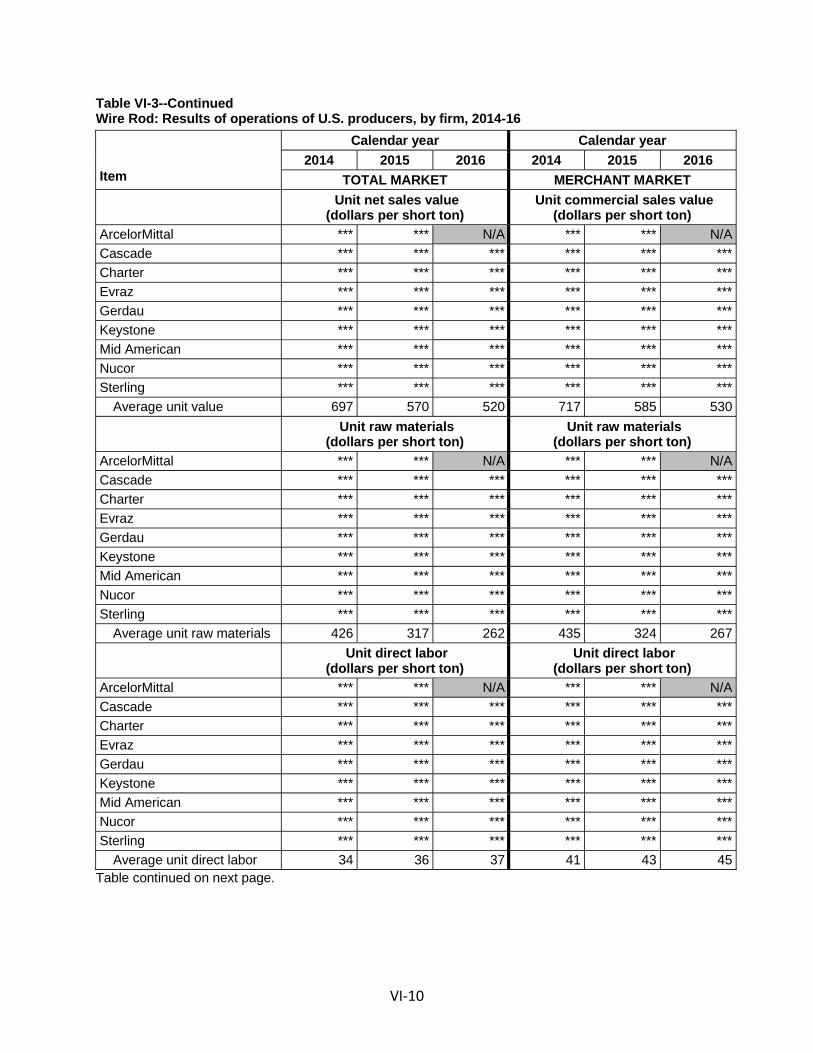
VI 10
Table VI-3--ContinuedWire Rod: Results of operations of U.S. producers, by firm, 2014-16
Item
Calendar year Calendar year
2014 2015 2016 2014 2015 2016
TOTAL MARKET MERCHANT MARKET
Unit net sales value(dollars per short ton)
Unit commercial sales value(dollars per short ton)
ArcelorMittal *** *** N/A *** *** N/A
Cascade *** *** *** *** *** ***
Charter *** *** *** *** *** ***
Evraz *** *** *** *** *** ***
Gerdau *** *** *** *** *** ***
Keystone *** *** *** *** *** ***
Mid American *** *** *** *** *** ***
Nucor *** *** *** *** *** ***
Sterling *** *** *** *** *** ***
Average unit value 697 570 520 717 585 530
Unit raw materials(dollars per short ton)
Unit raw materials(dollars per short ton)
ArcelorMittal *** *** N/A *** *** N/A
Cascade *** *** *** *** *** ***
Charter *** *** *** *** *** ***
Evraz *** *** *** *** *** ***
Gerdau *** *** *** *** *** ***
Keystone *** *** *** *** *** ***
Mid American *** *** *** *** *** ***
Nucor *** *** *** *** *** ***
Sterling *** *** *** *** *** ***
Average unit raw materials 426 317 262 435 324 267
Unit direct labor(dollars per short ton)
Unit direct labor(dollars per short ton)
ArcelorMittal *** *** N/A *** *** N/A
Cascade *** *** *** *** *** ***
Charter *** *** *** *** *** ***
Evraz *** *** *** *** *** ***
Gerdau *** *** *** *** *** ***
Keystone *** *** *** *** *** ***
Mid American *** *** *** *** *** ***
Nucor *** *** *** *** *** ***
Sterling *** *** *** *** *** ***
Average unit direct labor 34 36 37 41 43 45
Table continued on next page.

VI 11
Table VI-3--ContinuedWire Rod: Results of operations of U.S. producers, by firm, 2014-16
Item
Calendar year Calendar year
2014 2015 2016 2014 2015 2016
TOTAL MARKET MERCHANT MARKET
Unit other factory costs(dollars per short ton)
Unit other factory costs(dollars per short ton)
ArcelorMittal *** *** N/A *** *** N/A
Cascade *** *** *** *** *** ***
Charter *** *** *** *** *** ***
Evraz *** *** *** *** *** ***
Gerdau *** *** *** *** *** ***
Keystone *** *** *** *** *** ***
Mid American *** *** *** *** *** ***
Nucor *** *** *** *** *** ***
Sterling *** *** *** *** *** ***
Average unit other factory costs 199 186 180 202 193 180
Unit COGS(dollars per short ton)
Unit COGS(dollars per short ton)
ArcelorMittal *** *** N/A *** *** N/A
Cascade *** *** *** *** *** ***
Charter *** *** *** *** *** ***
Evraz *** *** *** *** *** ***
Gerdau *** *** *** *** *** ***
Keystone *** *** *** *** *** ***
Mid American *** *** *** *** *** ***
Nucor *** *** *** *** *** ***
Sterling *** *** *** *** *** ***
Average unit COGS 660 539 479 678 559 493
Unit gross income or (loss)(dollars per short ton)
Unit gross income or (loss)(dollars per short ton)
ArcelorMittal *** *** N/A *** *** N/A
Cascade *** *** *** *** *** ***
Charter *** *** *** *** *** ***
Evraz *** *** *** *** *** ***
Gerdau *** *** *** *** *** ***
Keystone *** *** *** *** *** ***
Mid American *** *** *** *** *** ***
Nucor *** *** *** *** *** ***
Sterling *** *** *** *** *** ***
Average unit gross incomeor (loss) 37 31 41 39 25 37
Table continued on next page.

VI 12
Table VI-3--ContinuedWire Rod: Results of operations of U.S. producers, by firm, 2014-16
Item
Calendar year Calendar year
2014 2015 2016 2014 2015 2016
TOTAL MARKET MERCHANT MARKET
Unit SG&A expenses(dollars per short ton)
Unit SG&A expenses(dollars per short ton)
ArcelorMittal *** *** N/A *** *** N/A
Cascade *** *** *** *** *** ***
Charter *** *** *** *** *** ***
Evraz *** *** *** *** *** ***
Gerdau *** *** *** *** *** ***
Keystone *** *** *** *** *** ***
Mid American *** *** *** *** *** ***
Nucor *** *** *** *** *** ***
Sterling *** *** *** *** *** ***
Average unit SG&A expense 23 21 23 24 22 25
Unit operating profit or (loss)(dollars per short ton)
Unit operating profit or (loss)(dollars per short ton)
ArcelorMittal *** *** N/A *** *** N/A
Cascade *** *** *** *** *** ***
Charter *** *** *** *** *** ***
Evraz *** *** *** *** *** ***
Gerdau *** *** *** *** *** ***
Keystone *** *** *** *** *** ***
Mid American *** *** *** *** *** ***
Nucor *** *** *** *** *** ***
Sterling *** *** *** *** *** ***
Average unit operatingincome or (loss) 14 10 18 15 3 12
Unit net profit or (loss)(dollars per short ton)
Unit net profit or (loss)(dollars per short ton)
ArcelorMittal *** *** N/A *** *** N/A
Cascade *** *** *** *** *** ***
Charter *** *** *** *** *** ***
Evraz *** *** *** *** *** ***
Gerdau *** *** *** *** *** ***
Keystone *** *** *** *** *** ***
Mid American *** *** *** *** *** ***
Nucor *** *** *** *** *** ***
Sterling *** *** *** *** *** ***
Average unit net income or(loss) 11 7 15 12 1 10
Source: Compiled from data submitted in response to Commission questionnaires.

VI 13
Total net sales quantity and value
As shown in table VI 1, total net sales include commercial sales (U.S. commercialshipments and exports), internal consumption, and transfers to related firms. Total net salesdeclined from 2014 to 2016 in terms of quantity, value, and average unit value. Unlikecommercials sales, the quantity reported for internal consumption and transfers9 increasedfrom 2014 to 2016, but the sales values in both categories were lower in 2016 than in 2014because of the lower average unit values. Total merchant market sales also fell on a quantity,value, and average unit value basis from 2014 to 2016.
Operating costs and expenses
As shown in table VI 1 for total operations, raw material costs represent the singlelargest component of overall COGS, at 64.6 percent in 2014, 58.8 percent in 2015, and54.7 percent in 2016 with similar ratios in the merchant market. As shown in table VI 3, averageraw material costs, direct labor, and other factory costs vary from company to company. Thesecost differences may reflect underlying differences in input costs such as types of scrap orconversion costs (labor and other factory costs). The sales mix may also account for some of thecost differences. Table VI 3 shows that all U.S. producers reported continuous declines in rawmaterial costs per unit from 2014 to 2016. In the merchant market, raw material costsparalleled the total market; declining as a share of overall COGS, net sales value, and on a perunit basis from 2014 to 2016.10
For the merchant market, the trend for direct labor and other factory costs were thesame as the total market, with direct labor costs rising and other factory costs declining from2014 to 2016. On a per unit basis, raw materials, direct labor, and other factory costs were allhigher in the merchant market than in the total market for wire rod. Company by companyreporting was slightly mixed, with several companies reporting the same per unit costs for rawmaterials (***) and direct labor (***) in total market and merchant market operations.11
As shown in table VI 1, the industry�s SG&A expense ratios (i.e., total SG&A expensesdivided by total revenue) increased during 2014 16, from 3.3 percent in 2014 to 4.5 percent in
9 All firms reported internal consumption and transfers to related firms at fair market value.10 One firm, ***, reported non recurring charges that were included in raw material costs. These
costs were $*** inventory write off in 2015 and a $*** in inventory adjustments in 2016. ***�s U.S.producer questionnaire, III 11.
11 Two firms, ***, reported non recurring charges that were included in other factory costs. ***reported other factory costs related to shutdown expenses of $*** in 2014, $*** in 2015, and $*** in2016. *** also reported accelerated depreciation expenses of $*** in 2014 and $*** in 2016. ***reported non recurring charges for an environmental project as other factory costs of ***. ***�s U.S.producer questionnaires, III 11.

VI 14
2016 for total market operations and 3.4 percent in 2014 to 4.7 percent in 2016 for merchantmarket operations.12 13
Profitability
Table VI 1 shows that total market operations for wire rod reported higher operatingprofits in 2016 than in 2014 largely as a result of *** and ***�s improving financialperformance. Individually, as shown in table VI 3, the majority of reporting firms experiencedoperating losses in 2014 and 2016. One firm, ***, reported the highest amount of operatinglosses in 2014 of $***, reduced its operating losses substantially in 2015 to $***, but still ended2016 with operating losses of $***. On the other hand, *** led the industry in profitability inabsolute dollars, with operating income ranging from $*** for *** and $*** for ***. Operatingmargins ranged from *** from 2014 to 2016. Net income showed a similar trend as operatingincome during 2014 16 for total market operations.
Contrary to total market operations, operating profit for the merchant market waslower in 2016 than in 2014. Individually, as show in table VI 3, the majority of firms alsoreported operating losses in 2016; although firms were split on those that reported operatingincome and those that reported operating losses in 2014 and 2015. *** also led the industry inprofitability for the merchant market. Operating margins were lower for the merchant marketthan for the total market. Net income showed a similar trend as operating income during2014 16 for merchant market operations.
VARIANCE ANALYSIS
A variance analysis for the operations of U.S. producers of wire rod is presented in tableVI 4.14 The information for this variance analysis is derived from table VI 1. This analysisillustrates that from 2014 to 2016, the increase in operating income for the total wire rod
12 Two firms, ***, reported non recurring charges that were included in SG&A expenses. ***reported SG&A expenses related to doubtful accounts of $*** in 2014 and $*** in 2016; software writeoff expenses of $*** in 2015; and management consulting fees of $*** in 2016. *** reported nonrecurring charges for natural gas payments of $*** in 2014 and $***. ***�s U.S. producerquestionnaires, III 11.
13 One firm, ***, reported non recurring charges that were included in depreciation e14 The Commission�s variance analysis is calculated in three parts: sales variance, cost of sales
variance (COGS variance), and SG&A expense variance. Each part consists of a price variance (in the caseof the sales variance) or a cost or expense variance (in the case of the COGS and SG&A expensevariance), and a volume variance. The sales or cost/expense variance is calculated as the change in unitprice or per unit cost/expense times the new volume, while the volume variance is calculated as thechange in volume times the old unit price or per unit cost/expense. Summarized at the bottom of thetable, the price variance is from sales; the cost/expense variance is the sum of those items from COGSand SG&A variances, respectively, and the volume variance is the sum of the volume components of thenet sales, COGS, and SG&A expense variances. The overall volume component of the variance analysis isgenerally small.

VI 15
market is primarily attributable to a higher favorable net cost/expense variance despite anunfavorable price variance (i.e., costs and expenses decreased more than prices). With respectto the merchant market, operating income decreased primarily because the favorable netcost/expense variance was not large enough to offset unfavorable price variances (i.e. pricesdecreased more than costs and expenses).
Table VI-4Wire Rod: Variance analysis on the operations of U.S. producers, 2014-16
Item
Between Calendar years Between Calendar years
2014-16 2014-15 2015-16 2014-16 2014-15 2015-16
TOTAL MARKET MERCHANT MARKET
Net sales // commercial sales:Price variance (632,617) (464,448) (179,932) (468,053) (346,509) (137,169)
Volume variance (75,070) (10,250) (53,057) (116,360) (31,523) (69,212)
Net sales variance (707,687) (474,698) (232,989) (584,413) (378,032) (206,381)
COGS:Cost variance 647,257 442,762 215,707 464,810 311,517 167,340
Volume variance 71,080 9,706 50,162 110,085 29,823 66,215
COGS variance 718,337 452,468 265,869 574,895 341,340 233,555
Gross profit variance 10,650 (22,230) 32,880 (9,518) (36,692) 27,174
SG&A expenses:Cost/expense variance (2,077) 6,805 (8,709) (2,599) 5,749 (8,089)
Volume variance 2,456 335 1,948 3,915 1,061 2,595
Total SG&A expense variance 379 7,140 (6,761) 1,316 6,810 (5,494)
Operating income variance 11,029 (15,090) 26,119 (8,202) (29,882) 21,680
Summarized (at the operatingincome level) as:
Price variance (632,617) (464,448) (179,932) (468,053) (346,509) (137,169)
Net cost/expense variance 645,180 449,567 206,998 462,211 317,266 159,251
Net volume variance (1,534) (209) (948) (2,360) (639) (402)
Source: Compiled from data submitted in response to Commission questionnaires.
CAPITAL EXPENDITURES AND RESEARCH AND DEVELOPMENT EXPENSES
Table VI 5 presents capital expenditures and research and development (�R&D�)expenses by firm. In 2016, *** accounted for the largest share of total capital expenditures(*** percent),15 followed by *** (*** percent),16 and *** (*** percent).17 The remaining U.S.
15 ***. ***�s U.S. producer questionnaire, III 14 (note 1).16 ***. ***�s U.S. producer questionnaire, II 2. Keystone testified at the staff conference that �the
investments we�ve already made do not achieve the return on capital employed, and that causes us tohave to delay the projects because we simply do not have the cash to actually invest in them.�Conference transcript, p. 158 (Armstrong).
17 ***. ***�s U.S. producer questionnaire, III 14 (note 1).

VI 16
producers accounted for the following shares: *** (*** percent),18 *** (*** percent),19 ***(*** percent), *** (*** percent),20 and *** (*** percent). While the U.S. industry�s total capitalexpenditures were at their highest level in 2014 and subsequently declined, table VI 5 showsthat the directional pattern of company specific capital expenditures were mixed; ***. ***.
Table VI-5Wire Rod: Capital expenditures and R&D expenses of U.S. producers, 2014-16
Item
Calendar year
2014 2015 2016
Capital expenditures (1,000 dollars)
ArcelorMittal *** ***1 N/A
Cascade *** *** ***
Charter *** *** ***
Evraz *** *** ***
Gerdau *** *** ***
Keystone *** *** ***
Mid American *** *** ***
Nucor *** *** ***
Sterling *** *** ***
Total capital expenditures 97,747 86,292 66,425
R&D expenses (1,000 dollars)
ArcelorMittal *** *** N/A
Cascade *** *** ***
Charter *** *** ***
Evraz *** *** ***
Gerdau *** *** ***
Keystone *** *** ***
Mid American *** *** ***
Nucor *** *** ***
Sterling *** *** ***
Total R&D expenses 6,846 6,206 6,7371 ***. ***, email response to USITC staff, April 20, 2017.
Source: Compiled from data submitted in response to Commission questionnaires.
18 ***. ***�s U.S. producer questionnaire, III 14 (note 1).19 ***. ***�s U.S. producer questionnaire, III 14 (note 1).20 ***. ***�s U.S. producer questionnaire, III 14 (note 1). ***. ***.

VI 17
ASSETS AND RETURN ON ASSETS
Table VI 6 presents data on the U.S. producers� total assets and their return on assets(�ROA�). ROA is calculated as the ratio of operating income (or loss) to total assets. Withoutincluding ArcelorMittal�s idle wire rod plant, ***. The remaining *** U.S. producers producedother products on the same equipment as wire rod. Aggregated for producers of wire rod, ROAfluctuated, falling from 2014 to 2015, but increasing in 2016 to the highest level for the period,reflecting the same trend as operating income.
Table VI-6Wire Rod: U.S. producers’ total assets and return on assets, 2014-16
Firm
Calendar years
2014 2015 2016
Total net assets (1,000 dollars)
ArcelorMittal1
*** *** ***1
Cascade *** *** ***
Charter *** *** ***
Evraz *** *** ***
Gerdau *** *** ***
Keystone *** *** ***
Mid American *** *** ***
Nucor *** *** ***
Sterling *** *** ***
Total net assets 1,478,658 1,337,844 1,434,971
Operating return on assets (percent)
ArcelorMittal1
*** *** N/A
Cascade *** *** ***
Charter *** *** ***
Evraz *** *** ***
Gerdau *** *** ***
Keystone *** *** ***
Mid American *** *** ***
Nucor *** *** ***
Sterling *** *** ***
Average operating return on assets 3.6 2.8 4.42
1***. ***. ***, email responses to USITC staff, April 20, 2017 and April 28, 2017.
2Average operating return on assets for 2016 does not include ArcelorMittal’s assets for its idle plant in
Georgetown, South Carolina.
Source: Compiled from data submitted in response to Commission questionnaires.

VI 18
CAPITAL AND INVESTMENT
The Commission requested U.S. producers of wire rod to describe any actual orpotential negative effects of imports of wire rod from Belarus, Italy, Korea, Russia, South Africa,Spain, Turkey, Ukraine, United Arab Emirates, and the United Kingdom on their firms� growth,investment, ability to raise capital, development and production efforts, or the scale of capitalinvestments. Table VI 7 tabulates the responses of *** current U.S. producers and table VI 8presents the detailed narrative responses regarding actual and anticipated negative effects ofsubject imports.
Table VI-7
Wire rod: Actual and anticipated negative effects of imports on investment and growth anddevelopment
Item No Yes
Negative effects on investment 1 7
Cancellation, postponement, or rejection of expansion projects 3
Denial or rejection of investment proposal 1
Reduction in the size of capital investments 4
Return on specific investments negatively impacted 4
Other 2
Negative effects on investment differ by country 8 0
Negative effects on growth and development 2 6
Rejection of bank loans 0
Lowering of credit rating 1
Problem related to the issue of stocks or bonds 1
Ability to service debt 1
Other 3
Negative effects on growth differ by country 8 0
Anticipated negative effects 0 8
Anticipated negative effects differ by country 8 0
Note.--ArcelorMittal is not a current U.S. producer of wire rod ***.
Source: Compiled from data submitted in response to Commission questionnaires.
Table VI-8
Wire rod: Narratives relating to actual and anticipated negative effects of imports on investmentand growth and development, since January 1, 2014
* * * * * * *

VII 1
PART VII: THREAT CONSIDERATIONS AND INFORMATION ONNONSUBJECT COUNTRIES
Section 771(7)(F)(i) of the Act (19 U.S.C. § 1677(7)(F)(i)) provides that�
In determining whether an industry in the United States is threatenedwith material injury by reason of imports (or sales for importation) of thesubject merchandise, the Commission shall consider, among otherrelevant economic factors1
(I) if a countervailable subsidy is involved, such information as maybe presented to it by the administering authority as to the natureof the subsidy (particularly as to whether the countervailablesubsidy is a subsidy described in Article 3 or 6.1 of the SubsidiesAgreement), and whether imports of the subject merchandise arelikely to increase,
(II) any existing unused production capacity or imminent, substantialincrease in production capacity in the exporting country indicatingthe likelihood of substantially increased imports of the subjectmerchandise into the United States, taking into account theavailability of other export markets to absorb any additionalexports,
(III) a significant rate of increase of the volume or market penetrationof imports of the subject merchandise indicating the likelihood ofsubstantially increased imports,
(IV) whether imports of the subject merchandise are entering at pricesthat are likely to have a significant depressing or suppressingeffect on domestic prices, and are likely to increase demand forfurther imports,
(V) inventories of the subject merchandise,
1 Section 771(7)(F)(ii) of the Act (19 U.S.C. § 1677(7)(F)(ii)) provides that �The Commission shallconsider {these factors} . . . as a whole in making a determination of whether further dumped orsubsidized imports are imminent and whether material injury by reason of imports would occur unlessan order is issued or a suspension agreement is accepted under this title. The presence or absence ofany factor which the Commission is required to consider . . . shall not necessarily give decisive guidancewith respect to the determination. Such a determination may not be made on the basis of mereconjecture or supposition.�

VII 2
(VI) the potential for product shifting if production facilities in theforeign country, which can be used to produce the subjectmerchandise, are currently being used to produce other products,
(VII) in any investigation under this title which involves imports of botha raw agricultural product (within the meaning of paragraph(4)(E)(iv)) and any product processed from such raw agriculturalproduct, the likelihood that there will be increased imports, byreason of product shifting, if there is an affirmative determinationby the Commission under section 705(b)(1) or 735(b)(1) withrespect to either the raw agricultural product or the processedagricultural product (but not both),
(VIII) the actual and potential negative effects on the existingdevelopment and production efforts of the domestic industry,including efforts to develop a derivative or more advanced versionof the domestic like product, and
(IX) any other demonstrable adverse trends that indicate theprobability that there is likely to be material injury by reason ofimports (or sale for importation) of the subject merchandise(whether or not it is actually being imported at the time).2
Information on the nature of the alleged subsidies was presented earlier in this report;information on the volume and pricing of imports of the subject merchandise is presented inParts IV and V; and information on the effects of imports of the subject merchandise on U.S.producers� existing development and production efforts is presented in Part VI. Information oninventories of the subject merchandise; foreign producers� operations, including the potentialfor �product shifting;� any other threat indicators, if applicable; and any dumping in thirdcountry markets, follows. Also presented in this section of the report is information obtainedfor consideration by the Commission on nonsubject countries.
2 Section 771(7)(F)(iii) of the Act (19 U.S.C. § 1677(7)(F)(iii)) further provides that, in antidumpinginvestigations, �. . . the Commission shall consider whether dumping in the markets of foreign countries(as evidenced by dumping findings or antidumping remedies in other WTO member markets against thesame class or kind of merchandise manufactured or exported by the same party as under investigation)suggests a threat of material injury to the domestic industry.�
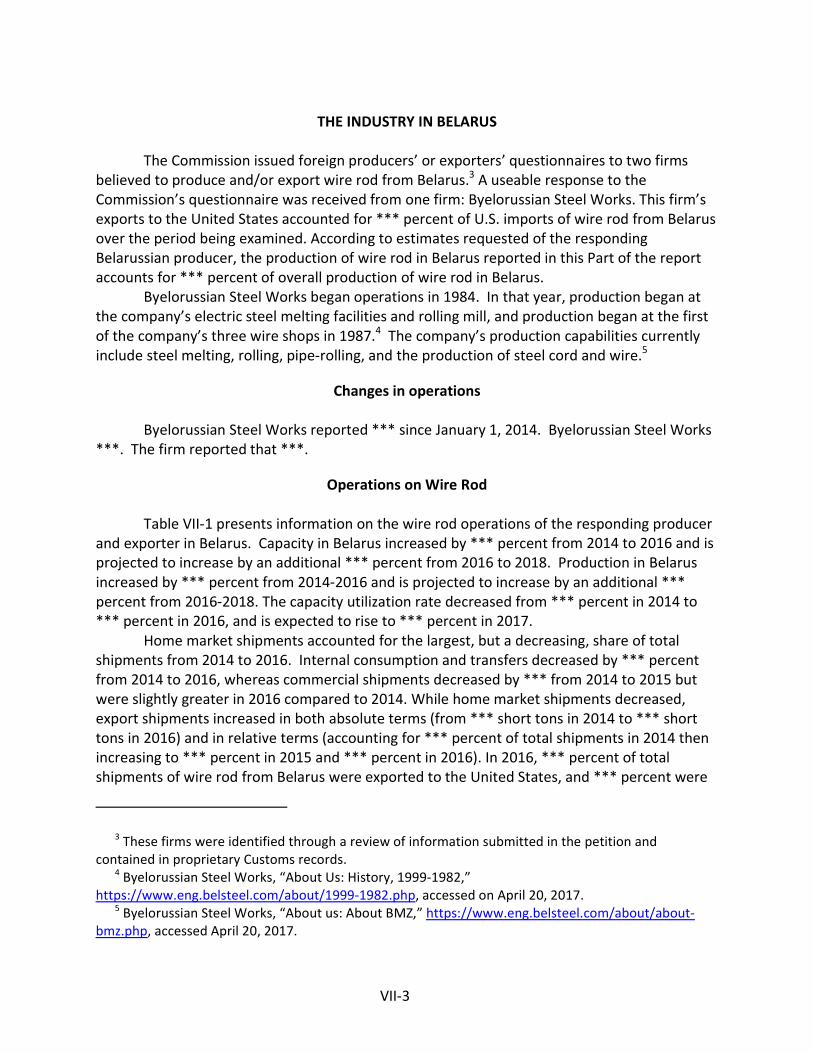
VII 3
THE INDUSTRY IN BELARUS
The Commission issued foreign producers� or exporters� questionnaires to two firmsbelieved to produce and/or export wire rod from Belarus.3 A useable response to theCommission�s questionnaire was received from one firm: Byelorussian Steel Works. This firm�sexports to the United States accounted for *** percent of U.S. imports of wire rod from Belarusover the period being examined. According to estimates requested of the respondingBelarussian producer, the production of wire rod in Belarus reported in this Part of the reportaccounts for *** percent of overall production of wire rod in Belarus.
Byelorussian Steel Works began operations in 1984. In that year, production began atthe company�s electric steel melting facilities and rolling mill, and production began at the firstof the company�s three wire shops in 1987.4 The company�s production capabilities currentlyinclude steel melting, rolling, pipe rolling, and the production of steel cord and wire.5
Changes in operations
Byelorussian Steel Works reported *** since January 1, 2014. Byelorussian Steel Works***. The firm reported that ***.
Operations on Wire Rod
Table VII 1 presents information on the wire rod operations of the responding producerand exporter in Belarus. Capacity in Belarus increased by *** percent from 2014 to 2016 and isprojected to increase by an additional *** percent from 2016 to 2018. Production in Belarusincreased by *** percent from 2014 2016 and is projected to increase by an additional ***percent from 2016 2018. The capacity utilization rate decreased from *** percent in 2014 to*** percent in 2016, and is expected to rise to *** percent in 2017.
Home market shipments accounted for the largest, but a decreasing, share of totalshipments from 2014 to 2016. Internal consumption and transfers decreased by *** percentfrom 2014 to 2016, whereas commercial shipments decreased by *** from 2014 to 2015 butwere slightly greater in 2016 compared to 2014. While home market shipments decreased,export shipments increased in both absolute terms (from *** short tons in 2014 to *** shorttons in 2016) and in relative terms (accounting for *** percent of total shipments in 2014 thenincreasing to *** percent in 2015 and *** percent in 2016). In 2016, *** percent of totalshipments of wire rod from Belarus were exported to the United States, and *** percent were
3 These firms were identified through a review of information submitted in the petition andcontained in proprietary Customs records.
4 Byelorussian Steel Works, �About Us: History, 1999 1982,�https://www.eng.belsteel.com/about/1999 1982.php, accessed on April 20, 2017.
5 Byelorussian Steel Works, �About us: About BMZ,� https://www.eng.belsteel.com/about/aboutbmz.php, accessed April 20, 2017.

VII 4
exported to other markets. Exports of wire rod from Belarus to the United States increased ***short tons from 2014 to 2016.
Table VII-1Wire rod: Data for producers in Belarus, 2014-16 and projections for calendar years 2017 and 2018
* * * * * * *
Alternative products
As shown in table VII 2, the responding frim from Belarus, Byelorussian Steel Works,produced other products on the same equipment and machinery used to produce wire rod.These products included ***.
Wire rod accounted for *** of overall production of product made on the sameequipment and machinery from 2014 to 2016. At the same time, overall capacity utilizationdecreased by *** percentage points. Byelorussian reported that ***.
Table VII-2Wire rod: Overall capacity and production on the same equipment as in-scope production byproducers in Belarus, 2014-16
* * * * * * *
Exports
As reported in Table VII 3, Belarus exports of bar and rod (including wire rod) productsincreased from 9 thousand short tons in 2014 to 256 thousand short tons in 2016. Exports tothe United States increased from zero short tons in 2014 to 49 thousand short tons in 2016. In2016, the largest export destination of Belarus steel bar and rod products was the Netherlandswhich comprised of 44.1 percent of exports. The United States was the second largest exportdestination with 19.3 percent of exports.

VII 5
Table VII-3Bars and rod (including wire rod): Exports from Belarus, 2014-16
Destination market
Calendar year
2014 2015 2016
Quantity (short tons)
Belarus exports to the UnitedStates 0 28,868 49,325
Belarus exports to other majordestination markets.--
Netherlands 0 45,335 112,617
Lithuania 5,442 26,846 22,902
Canada 0 0 15,321
Belgium 0 10,357 14,417
Poland 0 27,213 8,953
Hungary 0 5,249 8,624
Germany 43 5,792 6,719
Russia 844 1,283 5,641
All other destination markets 2,319 49,238 11,078
Total Belarus exports 8,648 200,181 255,596
Value (1,000 dollars)
Belarus exports to the UnitedStates 0 7,916 13,239
Belarus exports to other majordestination markets.--
Netherlands 0 12,290 29,181
Lithuania 2,815 9,496 6,096
Canada 0 0 4,172
Belgium 0 2,801 3,464
Poland 0 9,371 2,737
Hungary 0 1,590 2,506
Germany 25 1,748 1,954
Russia 522 487 2,093
All other destination markets 1,097 15,991 3,082
Total Belarus exports 4,459 61,689 68,523
Table continued on next page.

VII 6
Table VII-3--ContinuedBars and rod (including wire rod): Exports from Belarus, 2014-16
Destination market
Calendar year
2014 2015 2016
Unit value (dollars per short ton)
Belarus exports to the United States --- 274 268
Belarus exports to other majordestination markets.--
Netherlands --- 271 259
Lithuania 517 354 266
Canada --- --- 272
Belgium --- 270 240
Poland --- 344 306
Hungary --- 303 291
Germany 565 302 291
Russia 619 379 371
All other destination markets 473 325 278
Total Belarus exports 516 308 268
Share of quantity (percent)
Belarus exports to the United States --- 14.4 19.3
Belarus exports to other majordestination markets.--
Netherlands --- 22.6 44.1
Lithuania 62.9 13.4 9.0
Canada --- --- 6.0
Belgium --- 5.2 5.6
Poland --- 13.6 3.5
Hungary --- 2.6 3.4
Germany 0.5 2.9 2.6
Russia 9.8 0.6 2.2
All other destination markets 26.8 24.6 4.3
Total Belarus exports 100.0 100.0 100.0
Source: Export statistics of Belarus under HS subheading 7213.91, 7227.20, and 7227.90 as reported byUN Comtrade in the IHS/GTA database, accessed April 5, 2017.

VII 7
THE INDUSTRY IN ITALY
The Commission issued foreign producers� or exporters� questionnaires to thirteen firmsbelieved to produce and/or export wire rod from Italy.6 Useable responses to the Commission�squestionnaire were received from four firms: Acciaierie Bertoli Safau S.p.A. (�ABS�), AcciaierieDi Verona S.p.A. (�ADV�), Ferriere Nord S.p.A. (�Ferriere Nord�), and Ori Martin S.p.A. (�OriMartin�). These firms� exports to the United States accounted for all U.S. imports from Italy in2016.7 Responding firms estimate they accounted from 5 to 25 percent of all Italian productionof wire rod in 2016. Table VII 4 presents summary data on wire rod producers in Italy.
Table VII-4Wire rod: Summary data for producers in Italy, 2016
* * * * * * *
Operations on wire rod
Table VII 5 presents information on the wire rod operations of the respondingproducers in Italy. Wire rod production capacity was relatively stable during 2014 16, increasingby 1.1 percent during this period. Capacity is projected to increase by *** percent from 2016 to2017 and to not change from 2017 to 2018. Production of wire rod increased slightly from 2014to 2015 but then decreased from 2015 to 2016, resulting in an overall decrease of ***percentfrom 2014 to 2016. Production is projected to increase from 2016 to 2017 by ***percent andremain at the same level in 2018. Capacity utilization decreased from ***percent to ***percentfrom 2014 to 2016 and is projected to be ***percent in 2017 and 2018.
Table VII-5Wire rod: Data for producers in Italy, 2014-2016 and projections for calendar years 2017 and 2018
* * * * * * *
Total shipments of Italian wire rod decreased from 2014 to 2016 as the decreasedvolume in home market shipments was greater than the increased volume in export shipments.Total home market shipments accounted for between ***and ***percent of total shipments.Internal consumption held the largest share of shipments, followed by exports, and then homemarket commercial shipments. Exports of wire rod from Italy to the United States increasedfrom *** short tons in 2014 to ***short tons in 2016.
6 These firms were identified through a review of information submitted in the petition andcontained in proprietary Customs records.
7 ***, accounted for all *** short tons of reported wire rod exports from Italy to the United States in2016. According to official import statistics, U.S. imports of wire rod from Italy in 2016 were 33,163short tons. The export quantities to the United States reported by *** reflects a timing issue of producthaving been exported from Italy but not yet imported into the United States. ***.

VII 8
Alternative products
Table VII 6 presents data on Italian capacity and production of wire rod and otherproducts made on the same equipment and machinery used to produce wire rod. Wire rod wasthe predominant product made on the shared equipment, accounting for over *** percent oftotal production in any year during 2014 16. Overall capacity utilization reached ***percent in2015 and was at its lowest level, *** percent, in 2016.
Ori Martin reported that ***. ABS indicated that ***. ADV and Ferriere Nord indicatedthat ***.
Table VII-6Wire rod: Overall capacity and production on the same equipment as in-scope production byproducers in Italy, 2014-16
* * * * * * *
Exports
As reported in Table VII 7, Italian exports of bar and rod (including wire rod) increasedfrom 797 thousand short tons in 2014 to 812 thousand short tons in 2016. Italian exports to theUnited States increased from 343 short tons in 2014 to 48 thousand short tons in 2016. In 2016,the largest export destination for Italian exports of bar and rod products was Austria, whichcomprised 15.7 percent of exports. The United States was the sixth largest export destinationwith 5.9 percent of exports.
Table VII-7Bars and rod (including wire rod): Exports from Italy, 2014-2016
Destination market
Calendar year
2014 2015 2016
Quantity (short tons)
Italy exports to the United States 343 370 47,865
Italy exports to other majordestination markets.--
Austria 113,759 116,894 127,042
Algeria 397,334 373,946 118,951
Germany 70,185 62,692 101,049
Slovenia 54,865 60,550 58,917
France 28,831 25,955 51,817
Mexico 0 0 43,994
Slovakia 8,230 12,776 29,573
Czech Republic 16,316 14,885 26,761
All other destination markets 107,081 105,774 205,592
Total Italy exports 796,943 773,843 811,560
Table continued on next page.

VII 9
Table VII-7 --ContinuedBars and rod (including wire rod): Exports from Italy, 2014-2016
Destination market
Calendar year
2014 2015 2016
Value (1,000 dollars)
Italy exports to the United States 530 380 17,268
Italy exports to other major destinationmarkets.--
Netherlands 64,615 47,658 48,206
Lithuania 217,589 152,639 41,467
Belgium 54,056 35,409 47,693
Poland 30,418 25,696 23,321
Canada 25,015 18,334 27,797
Germany 0 0 15,889
Hungary 4,843 5,131 11,310
France 9,470 6,483 10,390
All other destination markets 75,479 57,850 93,293
Total Italy exports 482,016 349,581 336,634
Unit value (dollars per short ton)
Italy exports to the United States 1,546 1,025 361
Italy exports to other major destinationmarkets.--
Netherlands 568 408 379
Lithuania 548 408 349
Belgium 770 565 472
Poland 554 424 396
Canada 868 706 536
Germany --- --- 361
Hungary 589 402 382
France 580 436 388
All other destination markets 705 547 454
Total Italy exports 605 452 415
Share of quantity (percent)
Italy exports to the United States 0.0 0.0 5.9
Italy exports to other major destinationmarkets.--
Netherlands 14.3 15.1 15.7
Lithuania 49.9 48.3 14.7
Belgium 8.8 8.1 12.5
Poland 6.9 7.8 7.3
Canada 3.6 3.4 6.4
Germany --- --- 5.4
Hungary 1.0 1.7 3.6
France 2.0 1.9 3.3
All other destination markets 13.4 13.7 25.3
Total Italy exports 100.0 100.0 100.0
Source: Official export statistics under HS subheading 7213.91, 7227.20, and 7227.90 as reported by Eurostat in theIHS/GTA database, accessed April 5, 2017.
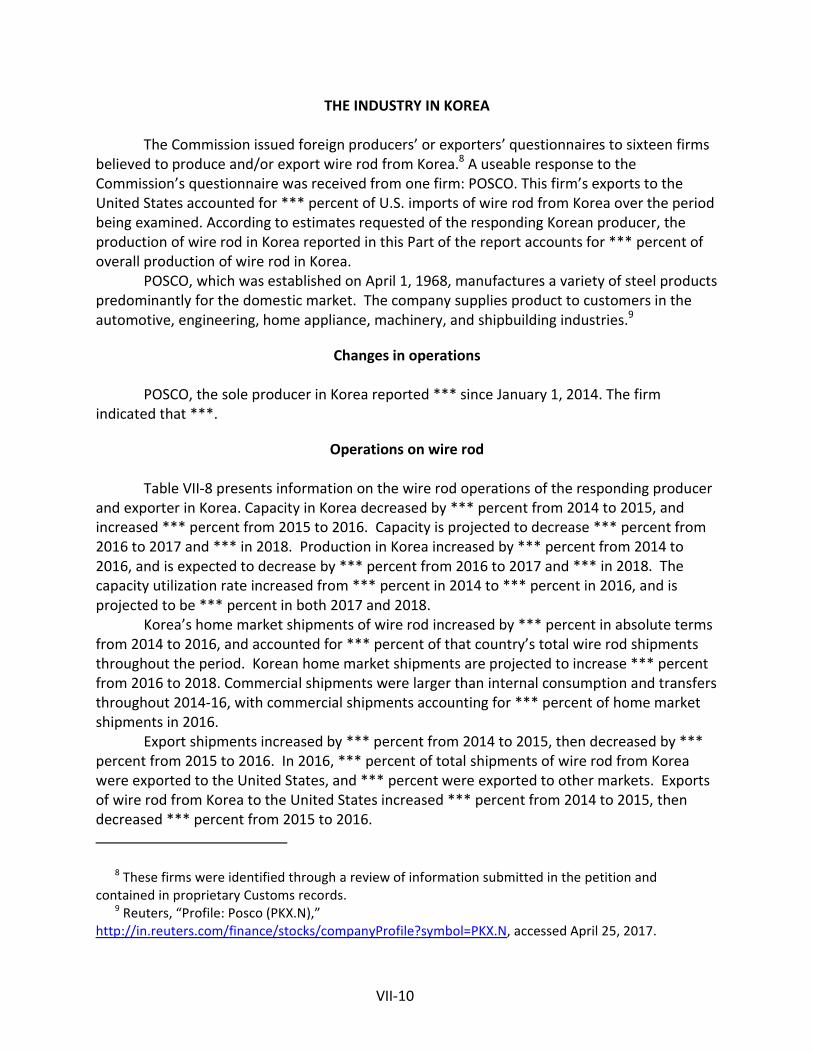
VII 10
THE INDUSTRY IN KOREA
The Commission issued foreign producers� or exporters� questionnaires to sixteen firmsbelieved to produce and/or export wire rod from Korea.8 A useable response to theCommission�s questionnaire was received from one firm: POSCO. This firm�s exports to theUnited States accounted for *** percent of U.S. imports of wire rod from Korea over the periodbeing examined. According to estimates requested of the responding Korean producer, theproduction of wire rod in Korea reported in this Part of the report accounts for *** percent ofoverall production of wire rod in Korea.
POSCO, which was established on April 1, 1968, manufactures a variety of steel productspredominantly for the domestic market. The company supplies product to customers in theautomotive, engineering, home appliance, machinery, and shipbuilding industries.9
Changes in operations
POSCO, the sole producer in Korea reported *** since January 1, 2014. The firmindicated that ***.
Operations on wire rod
Table VII 8 presents information on the wire rod operations of the responding producerand exporter in Korea. Capacity in Korea decreased by *** percent from 2014 to 2015, andincreased *** percent from 2015 to 2016. Capacity is projected to decrease *** percent from2016 to 2017 and *** in 2018. Production in Korea increased by *** percent from 2014 to2016, and is expected to decrease by *** percent from 2016 to 2017 and *** in 2018. Thecapacity utilization rate increased from *** percent in 2014 to *** percent in 2016, and isprojected to be *** percent in both 2017 and 2018.
Korea�s home market shipments of wire rod increased by *** percent in absolute termsfrom 2014 to 2016, and accounted for *** percent of that country�s total wire rod shipmentsthroughout the period. Korean home market shipments are projected to increase *** percentfrom 2016 to 2018. Commercial shipments were larger than internal consumption and transfersthroughout 2014 16, with commercial shipments accounting for *** percent of home marketshipments in 2016.
Export shipments increased by *** percent from 2014 to 2015, then decreased by ***percent from 2015 to 2016. In 2016, *** percent of total shipments of wire rod from Koreawere exported to the United States, and *** percent were exported to other markets. Exportsof wire rod from Korea to the United States increased *** percent from 2014 to 2015, thendecreased *** percent from 2015 to 2016.
8 These firms were identified through a review of information submitted in the petition andcontained in proprietary Customs records.
9 Reuters, �Profile: Posco (PKX.N),�http://in.reuters.com/finance/stocks/companyProfile?symbol=PKX.N, accessed April 25, 2017.

VII 11
Table VII-8Wire rod: Data for producers in Korea, 2014-16 and projections for calendar years 2017 and 2018
* * * * * * *
Alternative products
As shown in table VII 9, the responding Korean firm *** produce other products on thesame equipment and machinery used to produce wire rod. POSCO reports that ***.
Table VII-9Wire rod: Overall capacity and production on the same equipment as in-scope production byproducers in Korea, 2014-16
* * * * * * *
Exports
As reported in Table VII 10, Korean exports of bar and rod (including wire rod) increasedfrom 893 thousand short tons to 925 thousand short tons in 2016. Korean exports of steel barand rod products to the United States decreased from 120 thousand short tons in 2014 to 2015thousand short tons in 2016. In 2016, the largest export destination of Korean bar and rodexports was Vietnam which comprised 17.3 percent of exports. The United States was the thirdlargest export destination with 11.3 percent of exports.
Table VII-10Bars and rod (including wire rod): Exports from Korea, 2014-16
Destination market
Calendar year
2014 2015 2016
Quantity (short tons)
Korea exports to the United States 119,885 133,202 104,903
Korea exports to other majordestination markets.--
Vietnam 115,059 124,903 159,658
Malaysia 173,292 129,537 129,570
China 103,828 74,684 103,790
Taiwan 100,545 87,912 92,505
Japan 83,832 98,116 90,692
Thailand 35,506 67,507 80,224
Turkey 20,994 18,937 33,536
Slovenia 12,782 15,864 23,344
All other destination markets 126,794 187,928 107,177
Total Korea exports 892,517 938,588 925,397
Table continued on next page.

VII 12
Table VII-10--ContinuedBars and rod (including wire rod): Exports from Korea, 2014-16
Destination market
Calendar year
2014 2015 2016
Value (1,000 dollars)
Korea exports to the United States 66,819 56,448 41,166
Korea exports to other majordestination markets.--
Vietnam 70,984 64,262 72,010
Malaysia 100,089 62,411 52,965
China 75,925 53,688 69,017
Taiwan 52,952 36,761 35,479
Japan 51,720 47,114 43,046
Thailand 26,015 34,008 35,650
Turkey 12,831 9,024 15,225
Slovenia 9,402 8,951 12,473
All other destination markets 75,777 79,929 44,627
Total Korea exports 542,513 452,596 421,658
Unit value (dollars per short ton)
Korea exports to the United States 557 424 392
Korea exports to other majordestination markets.--
Vietnam 617 514 451
Malaysia 578 482 409
China 731 719 665
Taiwan 527 418 384
Japan 617 480 475
Thailand 733 504 444
Turkey 611 477 454
Slovenia 736 564 534
All other destination markets 598 425 416
Total Korea exports 608 482 456
Share of quantity (percent)
Korea exports to the United States 13.4 14.2 11.3
Korea exports to other majordestination markets.--
Vietnam 12.9 13.3 17.3
Malaysia 19.4 13.8 14.0
China 11.6 8.0 11.2
Taiwan 11.3 9.4 10.0
Japan 9.4 10.5 9.8
Thailand 4.0 7.2 8.7
Turkey 2.4 2.0 3.6
Slovenia 1.4 1.7 2.5
All other destination markets 14.2 20.0 11.6
Total Korea exports 100.0 100.0 100.0
Source: Official export statistics under HS subheading 7213.91, 7227.20, and 7227.90 as reported by KoreaCustoms and Trade Development Institution in the IHS/GTA database, accessed April 5, 2017.

VII 13
THE INDUSTRY IN RUSSIA
The Commission issued foreign producers� or exporters� questionnaires to 21 firmsbelieved to produce and/or export wire rod from Russia.10 No firm provided a completedquestionnaire response.11 Based on ***, Abinsk Electric Steel Works Ltd. (�Abinsk�) was the ***source of U.S. imports of wire rod from Russia during 2014 16.12
In 2014, Severstal commenced commercial production at its new wire rod and bar millwith a capacity of 771,618 short tons annually. Abinsk commissioned a 661,387 short ton wirerod and bar mill in 2015. The facility produces ***.13
Exports
As reported in Table VII 11, Russian exports of bar and rod (including wire rod)increased from 599 thousand short tons in 2014 to 1 million short tons in 2016. Russian exportsof steel bar and rod products to the United States increased from 13 thousand short tons in2014 to 95 thousand short tons in 2016. In 2016, the largest export destination for Russian steelbar and rod exports was Taiwan which comprised of 12.1 percent of total Russian bar and rodexports. The United States was the fifth largest export destination for Russian bar and rod.
Table VII-11Bars and rod (including wire rod): Exports from Russia, 2014-16
Destination market
Calendar year
2014 2015 2016
Quantity (short tons)
Russia exports to the United States 12,723 8,825 95,309
Russia exports to other majordestination markets.--
Taiwan 82,238 67,354 126,372
Belgium 47 5,417 105,155
Lithuania 85,136 100,233 102,409
Kazakhstan 109,150 112,906 98,853
Uzbekistan 67,160 65,879 58,822
Netherlands 0 0 55,708
Spain 0 13,399 34,386
Italy 20,326 39,008 33,261
All other destination markets 222,706 241,020 332,666
Total Russia exports 599,486 654,041 1,042,941
Table continued on next page.
10 These firms were identified through a review of information submitted in the petition andcontained in proprietary Customs records.
11 Severstal reported ***. Email correspondence from ***. Proprietary Customs records show thatthere ***. Severstal did not respond to staff�s request for a completed questionnaire response.
12 In 2016, AESW accounted for *** percent of total U.S. imports of wire rod from Russia.13 Petitioner Nucor�s postconference brief, pp. 27 28.

VII 14
Table VII-11--ContinuedBars and rod (including wire rod): Exports from Russia, 2014-16
Destination market
Calendar year
2014 2015 2016
Value (1,000 dollars)
Russia exports to the United States 6,085 2,520 28,663
Russia exports to other majordestination markets.--
Taiwan 37,312 21,474 35,627
Belgium 24 1,888 36,720
Lithuania 41,032 36,384 31,529
Kazakhstan 56,158 36,779 31,011
Uzbekistan 37,778 24,082 21,118
Netherlands 0 0 15,368
Spain 0 4,073 10,606
Italy 10,187 13,656 9,534
All other destination markets 115,394 85,533 103,250
Total Russia exports 303,968 226,390 323,425
Unit value (dollars per short ton)
Russia exports to the United States 478 286 301
Russia exports to other majordestination markets.--
Taiwan 454 319 282
Belgium 506 349 349
Lithuania 482 363 308
Kazakhstan 515 326 314
Uzbekistan 563 366 359
Netherlands --- --- 276
Spain --- 304 308
Italy 501 350 287
All other destination markets 518 355 310
Total Russia exports 507 346 310
Share of quantity (percent)
Russia exports to the United States 2.1 1.3 9.1
Russia exports to other majordestination markets.--
Taiwan 13.7 10.3 12.1
Belgium 0.0 0.8 10.1
Lithuania 14.2 15.3 9.8
Kazakhstan 18.2 17.3 9.5
Uzbekistan 11.2 10.1 5.6
Netherlands --- --- 5.3
Spain --- 2.0 3.3
Italy 3.4 6.0 3.2
All other destination markets 37.1 36.9 31.9
Total Russia exports 100.0 100.0 100.0
Source: Official export statistics under HS subheading 7213.91, 7227.20, and 7227.90 as reported by RussiaCustoms and Trade Development Institution in the IHS/GTA database, accessed April 5, 2017.

VII 15
THE INDUSTRY IN SOUTH AFRICA
The Commission issued foreign producers� or exporters� questionnaires to three firmsbelieved to produce and/or export wire rod from South Africa.14 A useable response to theCommission�s questionnaire was received from one firm: ArcelorMittal South Africa. This firm�sexports to the United States accounted for *** percent of U.S. imports of wire rod from SouthAfrica over the period being examined, and for *** percent of overall production of wire rod inSouth Africa. Table VII 13 presents information on the wire rod operations of the respondingproducer and exporter in South Africa.
ArcelorMittal South Africa is the leading steel producer in Africa. The company suppliesmore than 60 percent of South Africa�s steel and exports to countries both within and outsidethe Sub Saharan African region.15 ArcelorMittal South Africa�which is based in Vanderbijlpark,South Africa�is a subsidiary of Luxembourg incorporated ArcelorMittal.16
Changes in operations
ArcelorMittal South Africa, the only reporting producer in South Africa, reported ***since January 1, 2014. The firm indicated that ***.
Operations on wire rod
Table VII 12 presents information on the wire rod operations of the respondingproducer and exporter in South Africa. Capacity in South Africa *** from 2014 to 2016, and isprojected to ***. Production in South Africa increased *** percent from 2014 to 2015 anddecreased *** percent from 2015 to 2016. Production is projected to decrease a further ***percent from 2016 to 2017 but increase *** percent from 2017 to 2018. The capacityutilization rate increased from *** percent in 2014 to *** percent in 2015, then decreased to*** percent in 2016.
Home market shipments increased by *** percent in absolute terms from 2014 to 2016,but decreased as a share of total shipments from *** percent to *** percent from 2014 to 2015before increasing to *** percent in 2016. Commercial shipments accounted for *** homemarket shipments throughout 2014 16. Export shipments fluctuated during the period,increasing *** percent from 2014 to 2015, then decreasing *** percent in 2016. In 2016, ***percent of total shipments of wire rod from South Africa were exported to the United States,and *** percent were exported to other markets. Exports of wire rod from South Africa to the
14 These firms were identified through a review of information submitted in the petition andcontained in proprietary Customs records.
15 ArcelorMittal, �South Africa,� http://corporate.arcelormittal.com/sustainability/localpicture/south africa, accessed April 21, 2017.
16 ArcelorMittal, �Corporate Governance,� http://corporate.arcelormittal.com/investors/corporategovernance, accessed April 21, 2017.

VII 16
United States increased from *** short tons from 2014 to 2015, then decreased to *** shorttons in 2016.
Table VII-12Wire rod: Data for producers in South Africa, 2014-16, and projections for calendar years 2017 and2018
* * * * * * *
Alternative products
As shown in table VII 13, the responding South African firm produced *** on the sameequipment and machinery used to produce wire rod. Wire rod accounted for the largest, but adecreasing, share of overall production of product on this equipment and machinery from 2014to 2016. Overall capacity utilization increased by *** percentage points from 2014 to 2015,then decreased by *** percentage points from 2015 to 2016. ArcelorMittal South Africa reportsthat ***.
Table VII-13Wire rod: Overall capacity and production on the same equipment as in-scope production byproducers in South Africa, 2014-16
* * * * * * *
Exports
According to GTA, the United States was the top export market for bar and rod(including wire rod) from South Africa, accounting for 51.4 percent of exports by quantity in2016 (table VII 14). Other leading export markets include Kenya (accounting for 10.2 percent in2016), Zambia (9.4 percent), and Zimbabwe (8.8 percent). In 2014, Uganda was the leadingexport market for wire rod from South Africa, accounting for 58.8 percent. By 2016, Uganda�sshare of wire rod exports from South Africa decreased to 1.5 percent.

VII 17
Table VII-14Bars and rod (including wire rod): Exports from South Africa, 2014-16
Destination market
Calendar year
2014 2015 2016
Quantity (short tons)
South Africa exports to the United States 0 17,324 24,578
South Africa exports to other majordestination markets.--
Kenya 7,180 16,609 4,890
Zambia 3,929 4,216 4,483
Zimbabwe 2,821 4,075 4,216
Swaziland 1,410 3,563 2,820
Namibia 640 663 2,041
Tanzania 239 8,608 1,324
Botswana 236 173 1,055
Uganda 26,094 11,490 729
All other destination markets 1,817 8,260 1,665
Total South Africa exports 44,366 74,981 47,800
Value (1,000 dollars)
South Africa exports to the United States 0 5,001 6,231
South Africa exports to other majordestination markets.--
Kenya 4,508 6,615 1,270
Zambia 2,408 2,326 1,927
Zimbabwe 2,001 1,964 1,960
Swaziland 1,361 2,003 1,473
Namibia 450 366 1,021
Tanzania 135 2,756 353
Botswana 164 115 589
Uganda 13,011 3,830 170
All other destination markets 1,488 2,759 668
Total South Africa exports 25,525 27,735 15,662
Unit value (dollars per short ton)
South Africa exports to the United States --- 289 254
South Africa exports to other majordestination markets.--
Kenya 628 398 260
Zambia 613 552 430
Zimbabwe 709 482 465
Swaziland 965 562 522
Namibia 703 552 500
Tanzania 563 320 267
Botswana 692 663 558
Uganda 499 333 233
All other destination markets 819 334 402
Total South Africa exports 575 370 328
Table continued on next page.

VII 18
Table VII-14--ContinuedBars and rod (including wire rod): Exports from South Africa, 2014-16
Destination market
Calendar year
2014 2015 2016
Share of quantity (percent)
South Africa exports to the United States --- 23.1 51.4
South Africa exports to other majordestination markets.--
Kenya 16.2 22.2 10.2
Zambia 8.9 5.6 9.4
Zimbabwe 6.4 5.4 8.8
Swaziland 3.2 4.8 5.9
Namibia 1.4 0.9 4.3
Tanzania 0.5 11.5 2.8
Botswana 0.5 0.2 2.2
Uganda 58.8 15.3 1.5
All other destination markets 4.1 11.0 3.5
Total South Africa exports 100.0 100.0 100.0
Source: Official export statistics under HS subheading 7213.91, 7227.20, and 7227.90 as reported by theSouth African Revenue Service in the IHS/GTA database, accessed April 5, 2017.
THE INDUSTRY IN SPAIN
The Commission issued foreign producers� or exporters� questionnaires to 11 firmsbelieved to produce and/or export wire rod from Spain.17 Useable responses to theCommission�s questionnaire were received from four firms: ArcelorMittal Spain, Celsa Atlantic,Compañía Española de Laminación, and Global Steel Wire. These firms� exports to the UnitedStates accounted for all U.S. imports of wire rod from Spain over the period being examined.According to estimates requested of the responding Spanish producers, the production of wirerod in Spain reported in this Part of the report accounts for all production of wire rod in Spain.Table VII 15 presents summary information on the wire rod operations of the respondingproducers and exporters in Spain.
ArcelorMittal Spain, part of Luxembourg based ArcelorMittal, is Spain�s largest producerof steel. The company produces both flat and long products, with its long productsmanufacturing primarily geared toward industry and construction markets.18 CompañíaEspañola de Laminación, Global Steel Wire, and Celsa Atlantic are all part of Celsa Group, basedin Barcelona, Spain. Compañía Española de Laminación (or Celsa Barcelona), which wasestablished in 1967, manufactures a number of steel products in addition to wire rod. Global
17 These firms were identified through a review of information submitted in the petition andcontained in proprietary Customs records.
18 ArcelorMittal, �Spain,� http://corporate.arcelormittal.com/sustainability/local picture/spain,accessed April 25, 2017; ArcelorMittal, �Luxembourg,�http://corporate.arcelormittal.com/sustainability/local picture/luxembourg, accessed April 25, 2017.

VII 19
Steel Wire and Celsa Atlantic were acquired by Celsa Group in 1987 and 2007, respectively.Global Steel Wire focuses on wire rod production, while Celsa Atlantic produces wire rod andreinforcing steel bars and coil.19
Table VII-15Wire rod: Summary data for producers in Spain, 2016
* * * * * * *
Changes in operations
One producer in Spain reported an operational and organizational change since January1, 2014. Celsa Atlantic indicated that ***. Not one of the responding firms reported that itexpected to make operational or organizational changes relating to its wire rod production inthe future.
Operations on wire rod
Table VII 16 presents information on the wire rod operations of the respondingproducers and exporters in Spain. Capacity in Spain was *** from 2014 to 2016; it is projectedto increase by *** percent from 2016 to 2017, then *** in 2018. Production in Spain decreasedby *** percent from 2014 to 2015, then increased *** percent from 2015 to 2016. Productionis also projected to fluctuate during 2016 18, increasing *** percent from 2016 to 2017 anddecreasing *** percent from 2017 to 2018. The capacity utilization rate was *** percent orgreater in each year during 2014 16, and is projected to be *** percent in 2017 and 2018.
Spain�s home market shipments of wire rod increased in both absolute terms and as ashare of that country�s total wire rod shipments, accounting for *** percent of total shipmentsin 2016. While commercial shipments and internal consumption and transfers fluctuated inopposite directions during 2014 16, each one accounted for about *** percent of totalshipments by 2016. Export shipments of wire rod from Spain decreased by *** percent from2014 to 2015, then increased by *** percent from 2015 to 2016. In 2016, *** percent of totalshipments of wire rod from Spain were exported to the United States, and *** percent wereexported to other markets. Exports of wire rod from Spain to the United States increased ***percent from 2014 to 2016. Such exports are projected to increase a further *** percent from2016 to 2017 before decreasing *** percent from 2017 to 2018.
19 Celsa Group, �Celsa Group: Who We Are,�http://www.celsagroup.com/secciones/about/who.aspx, accessed April 25, 2017; Celsa Group,�Contact,� http://www.celsagroup.com/secciones/contact/contact.aspx, accessed April 25, 2017.

VII 20
Table VII-16Wire rod: Data for producers in Spain, 2014-16, and projections for calendar years 2017 and 2018
* * * * * * *
Alternative products
As shown in table VII 17, some responding firms in Spain produced other products onthe same equipment and machinery used to produce wire rod. These products include ***.Wire rod represented the largest share of overall production of product on this equipment andmachinery from 2014 to 2016, accounting for *** percent of such production in each yearduring the period. Overall utilization of this production capacity decreased by *** percentagepoints from 2014 to 2015, and was *** percentage points lower in 2016 compared to 2015.
ArcelorMittal Spain reports that ***, while Global Steel Wire indicates that ***. BothCelsa Atlantic and Compañía Española de Laminación report that ***.
Table VII-17Wire rod: Overall capacity and production on the same equipment as in-scope production byproducers in Spain, 2014-16
* * * * * * *
Exports
As reported in Table VII 18, Spanish exports of bar and rod (including wire rod)decreased from 803 thousand short tons in 2014 to 777 thousand short tons in 2016. Spanishexports of steel bar and rod products to the United States increased from 58 thousand shorttons in 2014 to 86 thousand short tons in 2016. In 2016, the largest export destination forSpanish steel bar and rod exports was France which comprised of 28.8 percent of total Spanishsteel bar and rod exports. The United States was the third largest export destination with 11.1percent of steel bar and rod exports.

VII 21
Table VII-18Bars and rod (including wire rod): Exports from Spain, 2014-16
Destination market
Calendar year
2014 2015 2016
Quantity (short tons)
Spain exports to the United States 58,092 78,177 86,340
Spain exports to other majordestination markets.--
France 120,453 122,926 223,346
Turkey 199,040 211,928 204,682
Italy 90,058 101,474 84,014
Portugal 83,815 67,348 67,122
Germany 78,014 61,817 51,013
Algeria 83,478 43,141 12,576
Netherlands 1,404 11,538 8,555
United Kingdom 20,768 18,175 8,073
All other destination markets 68,176 45,488 31,066
Total Spain exports 803,297 762,012 776,787
Value (1,000 dollars)
Spain exports to the United States 36,737 42,638 41,450
Spain exports to other majordestination markets.--
France 88,674 68,819 105,929
Turkey 117,575 97,821 85,096
Italy 61,270 54,406 39,860
Portugal 50,882 29,869 27,733
Germany 68,360 46,406 33,419
Algeria 46,537 18,190 4,158
Netherlands 1,394 9,751 6,490
United Kingdom 14,139 8,935 4,502
All other destination markets 48,561 22,937 16,259
Total Spain exports 534,129 399,772 364,895
Table continued on next page.

VII 22
Table VII-18--ContinuedBars and rod (including wire rod): Exports from Spain, 2014-16
Destination market
Calendar year
2014 2015 2016
Unit value (dollars per short ton)
Spain exports to the United States 632 545 480
Spain exports to other majordestination markets.--
France 736 560 474
Turkey 591 462 416
Italy 680 536 474
Portugal 607 444 413
Germany 876 751 655
Algeria 557 422 331
Netherlands 993 845 759
United Kingdom 681 492 558
All other destination markets 712 504 523
Total Spain exports 665 525 470
Share of quantity (percent)
Spain exports to the United States 7.2 10.3 11.1
Spain exports to other majordestination markets.--
France 15.0 16.1 28.8
Turkey 24.8 27.8 26.3
Italy 11.2 13.3 10.8
Portugal 10.4 8.8 8.6
Germany 9.7 8.1 6.6
Algeria 10.4 5.7 1.6
Netherlands 0.2 1.5 1.1
United Kingdom 2.6 2.4 1.0
All other destination markets 8.5 6.0 4.0
Total Spain exports 100.0 100.0 100.0
Source: Official export statistics under HS subheading 7213.91, 7227.20, and 7227.90 as reported byEurostat in the IHS/GTA database, accessed April 5, 2017.
THE INDUSTRY IN TURKEY
The Commission issued foreign producers� or exporters� questionnaires to 22 firmsbelieved to produce and/or export wire rod from Turkey.20 A usable response to thequestionnaire was received from four firms: Icdas, Isdemir, Kroman, and Habas. These firms�
20 These firms were identified through a review of information submitted in the petition andcontained in proprietary Customs records.

VII 23
exports of wire rod to the United States accounted for *** percent of U.S. imports of wire rodfrom Turkey in 2016. Responding firms estimate that they accounted for between 10 to 19percent of total production of wire rod in Turkey. Table VII 19 presents summary data onresponding wire rod producers in Turkey.
Table VII-19Wire rod: Summary data for producers in Turkey, 2016
* * * * * * *
Changes in operations
Only one producer, ***. *** anticipates that for 2017 and 2018, demand for its wire rodproducts in ***.
Operations on wire rod
Table VII 20 presents information on the wire rod operations of the respondingproducers in Turkey. Wire rod production capacity decreased by *** percent from 2014 to 2016and is projected to decrease further from 2016 to 2017, albeit by less than *** percent. Wirerod production volume was higher in 2016 compared to 2014, but the increase was only 7,600short tons. The slightly lower production capacity figure in 2016 compared to 2014 combinedwith the slightly larger production volume is reflected in an increase in capacity utilization from*** percent in 2014 to *** percent in 2016. Capacity utilization is projected to be *** percentin 2017 and *** percent in 2018.
Home market shipments � almost of which were commercial shipments as a share oftotal shipments decreased from *** percent in 2014 to *** percent in 2016. From 2014 to2015, exports to markets other than the United States decreased while exports to the UnitedStates increased. From 2015 to 2016, exports to other markets more than *** while exports tothe United States decreased by *** percent. Responding producers project that in 2017 and2018, export volume to the United States and export volume to all other markets willessentially remain at their 2016 levels.
Table VII-20Wire rod: Data for producers in Turkey, 2014-16, and projections for calendar years 2017 and 2018
* * * * * * *
Alternative products
Table VII 21 presents data on capacity and production of wire rod and other productsmade on the same equipment and machinery used to produce wire rod. Total productiondecreased from 2014 to 2015 but then increased from 2015 to 2016. Production of concretereinforcing bars and rods increased throughout 2014 16 whereas wire rod and other productsdecreased from 2014 to 2015 but then increased from 2015 to 2016. Wire rod accounted for
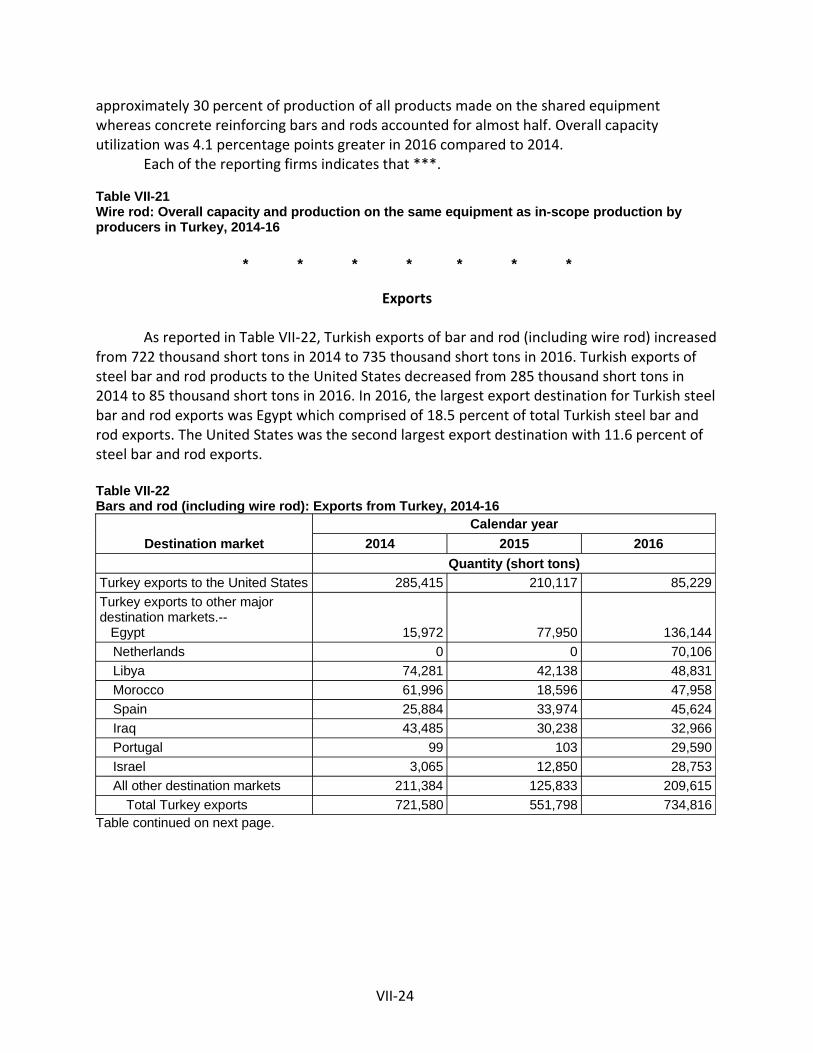
VII 24
approximately 30 percent of production of all products made on the shared equipmentwhereas concrete reinforcing bars and rods accounted for almost half. Overall capacityutilization was 4.1 percentage points greater in 2016 compared to 2014.
Each of the reporting firms indicates that ***.
Table VII-21Wire rod: Overall capacity and production on the same equipment as in-scope production byproducers in Turkey, 2014-16
* * * * * * *
Exports
As reported in Table VII 22, Turkish exports of bar and rod (including wire rod) increasedfrom 722 thousand short tons in 2014 to 735 thousand short tons in 2016. Turkish exports ofsteel bar and rod products to the United States decreased from 285 thousand short tons in2014 to 85 thousand short tons in 2016. In 2016, the largest export destination for Turkish steelbar and rod exports was Egypt which comprised of 18.5 percent of total Turkish steel bar androd exports. The United States was the second largest export destination with 11.6 percent ofsteel bar and rod exports.
Table VII-22Bars and rod (including wire rod): Exports from Turkey, 2014-16
Destination market
Calendar year
2014 2015 2016
Quantity (short tons)
Turkey exports to the United States 285,415 210,117 85,229
Turkey exports to other majordestination markets.--
Egypt 15,972 77,950 136,144
Netherlands 0 0 70,106
Libya 74,281 42,138 48,831
Morocco 61,996 18,596 47,958
Spain 25,884 33,974 45,624
Iraq 43,485 30,238 32,966
Portugal 99 103 29,590
Israel 3,065 12,850 28,753
All other destination markets 211,384 125,833 209,615
Total Turkey exports 721,580 551,798 734,816
Table continued on next page.

VII 25
Table VII-22--ContinuedBars and rod (including wire rod): Exports from Turkey, 2014-16
Destination market
Calendar year
2014 2015 2016
Value (1,000 dollars)
Turkey exports to the United States 149,383 82,093 30,617
Turkey exports to other majordestination markets.--
Egypt 7,906 27,497 44,875
Netherlands 0 0 27,124
Libya 40,079 17,136 17,058
Morocco 32,736 7,345 16,960
Spain 13,435 12,055 17,120
Iraq 23,763 11,829 11,711
Portugal 60 44 11,039
Israel 1,678 5,007 10,247
All other destination markets 116,098 51,060 76,790
Total Turkey exports 385,138 214,066 263,540
Unit value (dollars per short ton)
Turkey exports to the United States 523 391 359
Turkey exports to other majordestination markets.--
Egypt 495 353 330
Netherlands --- --- 387
Libya 540 407 349
Morocco 528 395 354
Spain 519 355 375
Iraq 546 391 355
Portugal 611 429 373
Israel 547 390 356
All other destination markets 549 406 366
Total Turkey exports 534 388 359
Share of quantity (percent)
Turkey exports to the United States 39.6 38.1 11.6
Turkey exports to other majordestination markets.--
Egypt 2.2 14.1 18.5
Netherlands --- --- 9.5
Libya 10.3 7.6 6.6
Morocco 8.6 3.4 6.5
Spain 3.6 6.2 6.2
Iraq 6.0 5.5 4.5
Portugal 0.0 0.0 4.0
Israel 0.4 2.3 3.9
All other destination markets 29.3 22.8 28.5
Total Turkey exports 100.0 100.0 100.0
Source: Official export statistics under HS subheading 7213.91, 7227.20, and 7227.90 as reported by Turkey's StateInstitute of Statistics in the IHS/GTA database, accessed April 5, 2017.

VII 26
THE INDUSTRY IN UKRAINE
The Commission issued foreign producers� or exporters� questionnaires to four firmsbelieved to produce and/or export wire rod from the Ukraine.21 Useable responses to theCommission�s questionnaire were received from two firms: ArcelorMittal Kryvyi Rih andYenakiieve Iron and Steel Works. These firms� exports to the United States accounted for ***percent of U.S. imports of wire rod from the Ukraine over the period being examined.According to estimates requested of the responding Ukrainian producers, the production ofwire rod in the Ukraine reported in this Part of the report accounts for *** percent of overallproduction of wire rod in Ukraine. Table VII 23 presents information on the wire rod operationsof the responding producers and exporters in Ukraine.
ArcelorMittal Kryvyi Rih is part of Luxembourg based ArcelorMittal, which is amongUkraine�s leading foreign investors. The company�s operations in Ukraine range from themining of iron ore to the manufacture of various steel products.22 Until recently, YenakiieveIron and Steel Works (owned by the Metinvest Group) manufactured a number of metalproducts including angles, beams, billets, channels, rails, and reinforcing bars. In March 2017,Metinvest lost control of this enterprise due to political conflict, and no longer operates thesefacilities.23
Table VII-23Wire rod: Summary data for producers in Ukraine, 2016
* * * * * * *
Changes in operations
One producer in Ukraine reported a change in its operations since January 1, 2014.Yenakiieve Iron and Steel Works reported that ***. The company indicates that ***.ArcelorMittal Kryvyi Rih reported ***.
Operations on wire rod
Table VII 24 presents information on the wire rod operations of the respondingproducers and exporters in Ukraine. Capacity in Ukraine decreased by *** percent from 2014 to
21 These firms were identified through a review of information submitted in the petition andcontained in proprietary Customs records.
22 ArcelorMittal, �ArcelorMittal Kryvyi Rih,� http://ukraine.arcelormittal.com/index.php?id=8,accessed April 27, 2017.
23 Metal Bulletin, �PJSC, Yenakiieve Iron & Steel Works/Yenakiieve Steel (Metinvest Group),�company database, http://www.mbdatabase.com/Basic Information/PJSC Yenakiieve Iron Steel WorksYenakiieve Steel Metinvest Group/46767/1 , accessed April 27, 2017; Metinvest, �Metinvest AnnouncesLoss of Control Over Operations in Temporarily Non controlled Territory,�https://emz.metinvestholding.com/en/press/news/show/7394, accessed April 27, 2017.

VII 27
2016, and is projected to decrease a further *** percent from 2016 to 2017 and *** from 2017to 2018. Production in Ukraine decreased *** percent from 2014 to 2015, then increased ***percent from 2015 to 2016. Production is projected to decrease *** percent from 2016 to2017, and remain at the 2017 level in 2018. The capacity utilization rate increased from ***percent in 2014 to *** percent in 2016, and is projected decrease to *** percent in 2017 andremain at that level in 2018.
Ukraine�s home market shipments of wire rod decreased *** percent from 2014 to2015, then increased by *** percent from 2015 to 2016. Commercial shipments representedthe larger share of Ukrainian home markets shipments of wire rod throughout 2014 16,accounting for *** percent of home market shipments in each year during the period.
Export shipments accounted for *** of Ukraine�s total shipments of wire rod during2014 16, with *** percent in 2016. In absolute terms, export shipments fluctuated, decreasing*** percent from 2014 to 2015, then increasing *** percent from 2015 to 2016. In 2016, ***percent of total shipments of wire rod from Ukraine were exported to the United States, and*** percent were exported to other markets. Exports of wire rod from the Ukraine to theUnited States increased by *** percent during 2014 16, from *** short tons to *** short tons.Ukrainian exports of wire rod to the United States are projected to decrease *** percent from2016 to 2017, and *** in 2018.
Table VII-24Wire rod: Data for producers in Ukraine, 2014-16, and projections for calendar years 2017 and2018
* * * * * * *
Alternative products
As shown in table VII 25, responding Ukrainian firms produced *** on the sameequipment and machinery used to produce wire rod. Wire rod accounted for *** percent ofoverall production of product made on this equipment in each year from 2014 to 2016. Overallcapacity utilization increased from *** percent in 2014 to *** percent in 2016. Yenakiieve Ironand Steel Works reports that ***. ***.
Table VII-25Wire rod: Overall capacity and production on the same equipment as in-scope production byproducers in Ukraine, 2014-16
* * * * * * *
Exports
As reported in Table VII 26, Ukrainian exports of bar and rod (including wire rod)increased from 1.2 million short tons in 2014 to 1.3 million short tons in 2016. Ukrainianexports of steel bar and rod products to the United States increased from 21 thousand shorttons in 2014 to 142 thousand short tons in 2016. In 2016, the largest export destination forUkrainian steel bar and rod exports was Israel which comprised of 13.1 percent of total

VII 28
Ukrainian steel bar and rod exports. The United States was the second largest exportdestination with 11.0 percent of steel bar and rod exports.
Table VII-26Bars and rod (including wire rod): Exports from Ukraine, 2014-16
Destination market
Calendar year
2014 2015 2016
Quantity (short tons)
Ukraine exports to the UnitedStates 21,153 99,218 141,598
Ukraine exports to other majordestination markets.--
Israel 178,470 143,081 169,713
Netherlands 71 35,053 128,872
Romania 90,840 83,433 126,898
Egypt 29,529 19,386 112,316
Poland 74,176 50,061 104,874
Bulgaria 59,271 82,356 75,739
Senegal 73,020 83,745 75,000
Colombia 136 21,661 58,909
All other destination markets 705,770 539,835 298,508
Total Ukraine exports 1,232,435 1,157,827 1,292,428
Value (1,000 dollars)
Ukraine exports to the UnitedStates 10,690 36,864 46,162
Ukraine exports to other majordestination markets.--
Israel 85,585 52,027 53,615
Netherlands 34 12,035 43,548
Romania 45,822 32,701 43,568
Egypt 14,434 6,309 35,577
Poland 38,350 17,427 35,529
Bulgaria 28,608 30,148 24,118
Senegal 36,314 30,912 24,461
Colombia 66 7,228 17,646
All other destination markets 344,637 192,495 91,407
Total Ukraine exports 604,540 418,146 415,631
Table continued on next page.

VII 29
Table VII-26--ContinuedBars and rod (including wire rod): Exports from Ukraine, 2014-16
Destination market
Calendar year
2014 2015 2016
Unit value (dollars per short ton)
Ukraine exports to the UnitedStates 505 372 326
Ukraine exports to other majordestination markets.--
Israel 480 364 316
Netherlands 476 343 338
Romania 504 392 343
Egypt 489 325 317
Poland 517 348 339
Bulgaria 483 366 318
Senegal 497 369 326
Colombia 485 334 300
All other destination markets 488 357 306
Total Ukraine exports 491 361 322
Share of quantity (percent)
Ukraine exports to the UnitedStates 1.7 8.6 11.0
Ukraine exports to other majordestination markets.--
Israel 14.5 12.4 13.1
Netherlands 0.0 3.0 10.0
Romania 7.4 7.2 9.8
Egypt 2.4 1.7 8.7
Poland 6.0 4.3 8.1
Bulgaria 4.8 7.1 5.9
Senegal 5.9 7.2 5.8
Colombia 0.0 1.9 4.6
All other destination markets 57.3 46.6 23.1
Total Ukraine exports 100.0 100.0 100.0
Source: Official export statistics under HS subheading 7213.91, 7227.20, and 7227.90 as reported byState Customs Committee of the Ukraine in the IHS/GTA database, accessed April 5, 2017.

VII 30
THE INDUSTRY IN THE UNITED ARAB EMIRATES
The Commission issued foreign producers� or exporters� questionnaires to three firmsbelieved to produce and/or export wire rod from the United Arab Emirates.24 A useableresponse to the Commission�s questionnaire was received from one firm: Emirates Steel. Thisfirm�s exports to the United States accounted for *** percent of U.S. imports of wire rod fromthe United Arab Emirates over the period being examined. According to estimates requested ofthe responding UAE producer, the production of wire rod in the United Arab Emirates reportedin this Part of the report accounts for all production of wire rod in the United Arab Emirates.
Emirates Steel, which is located outside of Abu Dhabi, is a subsidiary of UAE basedholding company Senaat. Senaat established Emirates Steel in 1998, and the company hasexpanded twice since the commissioning of its first plant in October 2001.25
Changes in operations
Emirates Steel, the only reporting producer in the United Arab Emirates, reported nooperational and organizational changes since January 1, 2014. The firm indicated that ***.
Operations on wire rod
Table VII 27 presents information on the wire rod operations of the respondingproducer and exporter in the United Arab Emirates. Capacity in the United Arab Emirates ***from 2014 to 2016, and is projected to *** in 2017 and 2018. Production in the United ArabEmirates increased by *** percent from 2014 to 2016. Production is projected to increase afurther *** percent from 2016 to 2107, and decrease by *** percent from 2017 to 2018. Thecapacity utilization rate increased from *** percent in 2014 to *** percent in 2016, and isprojected to remain above *** percent in 2017 and 2018.
Home market shipments fluctuated in both absolute terms and as a share of totalshipments, and accounted for *** of total shipments from 2014 to 2016. While internalconsumption and transfers increased by *** percent in absolute terms from 2014 to 2016,commercial shipments accounted for *** percent of total home market shipments throughoutthe period. Export shipments increased *** percent in absolute terms from 2014 to 2016 butfluctuated in relative terms, increasing from *** percent of total shipments in 2014 to ***percent in 2015, then decreasing to *** percent in 2016. In 2016, *** percent of total
24 These firms were identified through a review of information submitted in the petition andcontained in proprietary Customs records.
25 Emirates Steel, �WhoWe Are: About Emirates Steel,�https://www.emiratessteel.com/index.php/en/who we are/about emirates steel, accessed April 21,2017; Emirates Steel, �WhoWe Are;Milestones,� https://www.emiratessteel.com/index.php/en/whowe are/milestones, accessed April 21, 2017; Senaat, �About Senaat,� http://www.senaat.co/aboutsenaat, accessed April 21, 2017.

VII 31
shipments of wire rod from the United Arab Emirates were exported to the United States, and*** percent were exported to other markets. Exports of wire rod from the United ArabEmirates to the United States increased from *** short tons from 2014 to 2016, and areprojected to decrease to *** in 2017 and 2018.
Table VII-27Wire rod: Data for producers in the United Arab Emirates, 2014-16, and projections for calendaryears 2017 and 2018
* * * * * * *
Alternative products
As shown in table VII 28, Emirates Steel produced *** on the same equipment andmachinery used to produce wire rod. While the production of wire rod increased in absoluteterms from 2014 to 2016, wire rod accounted for a smaller share of overall production ofproduct made on this equipment and machinery in 2016 than in 2014. Throughout the period,wire rod accounted for *** percent of overall production of product made on this equipmentand machinery. Overall capacity utilization increased steadily during 2014 16, reaching ***percent in 2016. Emirates Steel reports that ***.
Table VII-28Wire rod: Overall capacity and production on the same equipment as in-scope production byproducers in the United Arab Emirates, 2014-16
* * * * * * *
ExportsAs shown in table VII 29, the leading export markets for bar and rod (including wire rod)
from the United Arab Emirates are Saudi Arabia (accounting for 48.4 percent of exports byquantity in 2016), Oman (with 21.7 percent), and Qatar (with 11.3 percent) (table VII 29).During 2016, the United States accounted for 0.1 percent of wire rod exports from the UnitedArab Emirates.
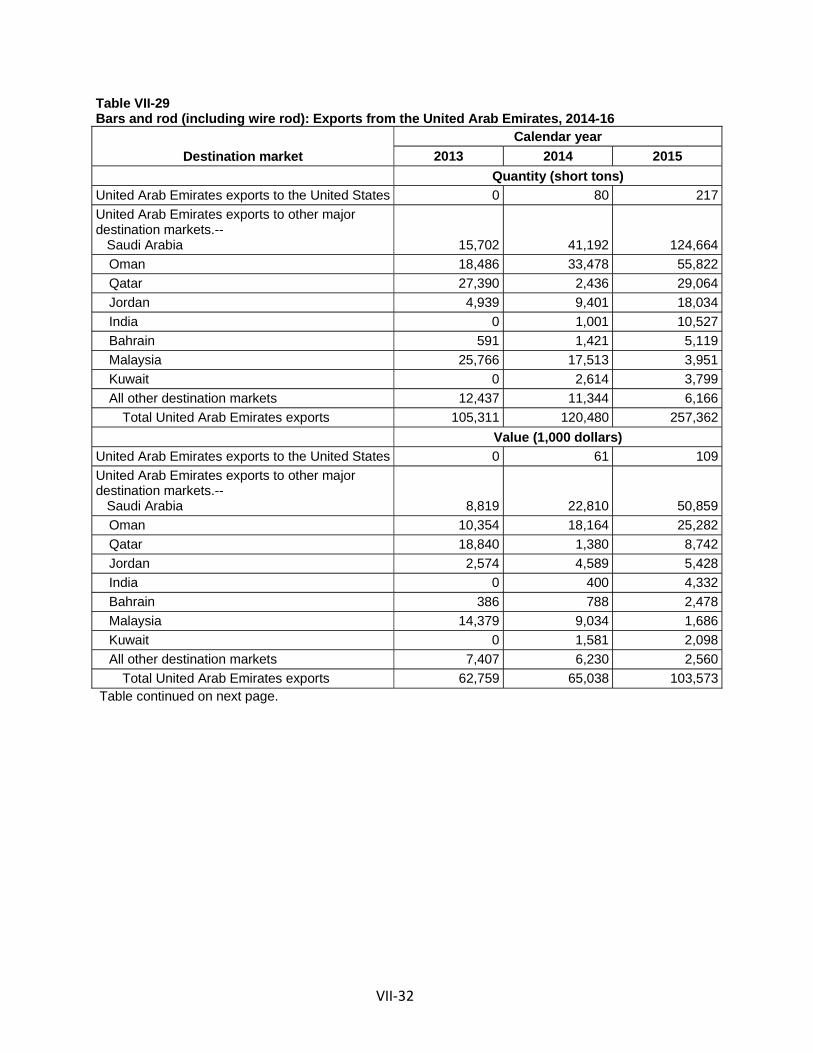
VII 32
Table VII-29Bars and rod (including wire rod): Exports from the United Arab Emirates, 2014-16
Destination market
Calendar year
2013 2014 2015
Quantity (short tons)
United Arab Emirates exports to the United States 0 80 217
United Arab Emirates exports to other majordestination markets.--
Saudi Arabia 15,702 41,192 124,664
Oman 18,486 33,478 55,822
Qatar 27,390 2,436 29,064
Jordan 4,939 9,401 18,034
India 0 1,001 10,527
Bahrain 591 1,421 5,119
Malaysia 25,766 17,513 3,951
Kuwait 0 2,614 3,799
All other destination markets 12,437 11,344 6,166
Total United Arab Emirates exports 105,311 120,480 257,362
Value (1,000 dollars)
United Arab Emirates exports to the United States 0 61 109
United Arab Emirates exports to other majordestination markets.--
Saudi Arabia 8,819 22,810 50,859
Oman 10,354 18,164 25,282
Qatar 18,840 1,380 8,742
Jordan 2,574 4,589 5,428
India 0 400 4,332
Bahrain 386 788 2,478
Malaysia 14,379 9,034 1,686
Kuwait 0 1,581 2,098
All other destination markets 7,407 6,230 2,560
Total United Arab Emirates exports 62,759 65,038 103,573
Table continued on next page.

VII 33
Table VII-29--ContinuedBars and rod (including wire rod): Exports from the United Arab Emirates, 2014-16
Destination market
Calendar year
2013 2014 2015
Unit value (dollars per short ton)
United Arab Emirates exports to the United States --- 764 502
United Arab Emirates exports to other majordestination markets.--
Saudi Arabia 562 554 408
Oman 560 543 453
Qatar 688 567 301
Jordan 521 488 301
India 680 399 412
Bahrain 653 554 484
Malaysia 558 516 427
Kuwait --- 605 552
All other destination markets 596 549 415
Total United Arab Emirates exports 596 540 402
Share of quantity (percent)
United Arab Emirates exports to the United States --- 0.1 0.1
United Arab Emirates exports to other majordestination markets.--
Saudi Arabia 14.9 34.2 48.4
Oman 17.6 27.8 21.7
Qatar 26.0 2.0 11.3
Jordan 4.7 7.8 7.0
India 0.0 0.8 4.1
Bahrain 0.6 1.2 2.0
Malaysia 24.5 14.5 1.5
Kuwait --- 2.2 1.5
All other destination markets 11.8 9.4 2.4
Total United Arab Emirates exports 100.0 100.0 100.0
Source: Export statistics of the United Arab Emirates under HS subheading 7213.91, 7227.20, and7227.90 as reported by UN comtrade in the IHS/GTA database, accessed April 5, 2017.
THE INDUSTRY IN THE UNITED KINGDOM
The Commission issued foreign producers� or exporters� questionnaires to seven firmsbelieved to produce and/or export wire rod from the United Kingdom.26 Useable responses tothe Commission�s questionnaire were received from two firms: British Steel and Celsa UK.These firms� exports to the United States accounted for all U.S. imports of wire rod from the
26 These firms were identified through a review of information submitted in the petition andcontained in proprietary Customs records.

VII 34
United Kingdom over the period being examined. According to estimates requested of theresponding UK producers, the production of wire rod in the United Kingdom reported in thisPart of the report accounts for *** percent of overall production of wire rod in the UnitedKingdom. Table VII 30 presents information on the wire rod operations of the respondingproducers and exporters in the United Kingdom.
British Steel was formed when Tata Steel sold its Long Products Europe to GreybullCapital in 2016. Among other steel products, the company produces wire rod for severalmarkets including construction and engineering, consumer goods, and the automotiveindustry.27 Celsa Steel UK is a subsidiary of Spanish firm Celsa Group, which acquired thecompany in 2003.28 Celsa Steel UK principally supplies product to markets in Ireland and theUnited Kingdom.29
Table VII-30Wire rod: Summary data for producers in the United Kingdom, 2016
* * * * * * *
Changes in operations
British Steel reported that ***. British Steel also reported that ***. Celsa Steel UKreported no operational and organizational changes since January 1, 2014, and indicated that***.
Operations on wire rod
Table VII 31 presents information on the wire rod operations of the respondingproducers and exporters in the United Kingdom. Capacity in the United Kingdom increased by*** percent from 2014 to 2016. Capacity is projected to increase a further *** percent from2016 to 2017 and *** from 2017 to 2018. Production in the United Kingdom increased ***percent from 2014 to 2015, and decreased *** percent from 2015 to 2016. Production isprojected to increase *** percent from 2016 to 2018. The capacity utilization rate increasedfrom *** percent in 2014 to *** percent in 2015, then decreased to *** percent in 2016. Thecapacity utilization rate is projected to increase by *** percentage points from 2016 to 2018.
Home market shipments increased by *** percent as a share of total shipments from2014 to 2016. Both internal consumption and transfers and commercial shipments increased inabsolute terms and as shares on total shipments during the period. While home market
27 British Steel, �Proud of Our Heritage,� http://britishsteel.co.uk/who we are/, accessed April 21,2017; British Steel, �Our Markets,� http://britishsteel.co.uk/who we are/our markets/, accessed April21, 2017.
28 Celsa Group, �Celsa Group: Who We Are,�http://www.celsagroup.com/secciones/about/who.aspx, accessed April 21, 2017
29 Celsa Steel (UK) Ltd., �About Us: Celsa Steel UK,�http://www.celsauk.com/Company.mvc/CelsaSteelUK, accessed April 21, 2017.

VII 35
shipments increased, export shipments as a share of total shipments decreased from ***percent in 2014 to *** percent in 2016. In absolute terms, export shipments fluctuated,increasing *** percent from 2014 to 2015, then decreasing *** percent from 2015 to 2016. In2016, *** percent of total shipments of wire rod from the United Kingdom were exported tothe United States, and *** percent were exported to other markets. Exports of wire rod fromthe United Kingdom to the United States decreased *** percent from 2014 to 2015, thenincreased *** percent from 2015 to 2016. UK exports of wire rod to the United States areprojected to increase *** percent from 2016 to 2017, and *** in 2018.
Table VII-31Wire rod: Data for producers in the United Kingdom, 2014-16, and projections for calendar years2017 and 2018
* * * * * * *
Alternative products
As shown in table VII 32, responding United Kingdom firms produced other products onthe same equipment and machinery used to produce wire rod. These products include ***.Wire rod accounted for the largest, but a decreasing, share of overall production of productmade on this equipment and machinery from 2014 to 2016. Overall capacity utilizationincreased by *** percentage points from 2014 to 2016, and reached *** percent in 2016. CelsaSteel UK reports that ***. British Steel indicates that ***.
Table VII-32Wire rod: Overall capacity and production on the same equipment as in-scope production byproducers in the United Kingdom, 2014-16
* * * * * * *
Exports
As reported in Table VII 33, British exports of bar and rod (including wire rod) decreasedfrom 605 thousand short tons in 2014 to 557 thousand short tons in 2016. British exports ofsteel bar and rod products to the United States decreased from 73 thousand short tons in 2014to 50 thousand short tons in 2016. In 2016, the largest export destination for British steel barand rod exports was Belgium which comprised of 18.2 percent of total British steel bar and rodexports. The United States was the fourth largest export destination with 8.9 percent of steelbar and rod exports.

VII 36
Table VII-33Bars and rod (including wire rod): Exports from the United Kingdom, 2014-16
Destination market
Calendar year
2014 2015 2016
Quantity (short tons)
United Kingdom exports to the United States 72,626 49,645 49,642
United Kingdom exports to other majordestination markets.--
Belgium 99,889 120,998 101,049
Germany 61,157 73,294 92,428
Italy 75,555 91,508 60,032
Sweden 45,875 44,291 37,929
Turkey 40,644 35,804 29,393
Poland 20,477 29,745 27,391
France 37,905 24,191 25,688
Taiwan 19,672 10,686 23,387
All other destination markets 130,922 127,628 109,756
Total United Kingdom exports 604,721 607,789 556,697
Value (1,000 dollars)
United Kingdom exports to the United States 44,416 29,083 23,900
United Kingdom exports to other majordestination markets.--
Belgium 61,777 53,559 41,980
Germany 42,866 38,926 41,774
Italy 51,324 48,926 27,414
Sweden 28,631 22,075 16,859
Turkey 27,469 18,109 13,526
Poland 14,064 14,951 12,523
France 24,759 12,267 11,014
Taiwan 11,121 4,827 8,604
All other destination markets 89,098 66,060 52,140
Total United Kingdom exports 395,524 308,783 249,734
Table continued on next page.

VII 37
Table VII-33--ContinuedBars and rod (including wire rod): Exports from the United Kingdom, 2014-16
Destination market
Calendar year
2014 2015 2016
Unit value (dollars per short ton)
United Kingdom exports to the United States 612 586 481
United Kingdom exports to other majordestination markets.--
Belgium 618 443 415
Germany 701 531 452
Italy 679 535 457
Sweden 624 498 444
Turkey 676 506 460
Poland 687 503 457
France 653 507 429
Taiwan 565 452 368
All other destination markets 681 518 475
Total United Kingdom exports 654 508 449
Share of quantity (percent)
United Kingdom exports to the United States 12.0 8.2 8.9
United Kingdom exports to other majordestination markets.--
Belgium 16.5 19.9 18.2
Germany 10.1 12.1 16.6
Italy 12.5 15.1 10.8
Sweden 7.6 7.3 6.8
Turkey 6.7 5.9 5.3
Poland 3.4 4.9 4.9
France 6.3 4.0 4.6
Taiwan 3.3 1.8 4.2
All other destination markets 21.6 21.0 19.7
Total United Kingdom exports 100.0 100.0 100.0
Source: Official export statistics under HS subheading 7213.91, 7227.20, and 7227.90 as reported byEurostat in the IHS/GTA database, accessed April 5, 2017.
.

VII 38
SUBJECT COUNTRIES COMBINED
Table VII 34 presents information on wire rod operations of the reporting producers andexporters in the subject countries and table VII 35 presents data on overall capacity andproduction for responding firms from subject countries.
Table VII-34Wire rod: Data for producers in subject countries combined, 2014-16, and projection for calendaryears 2017 and 2018
Item
Actual experience Projections
Calendar year
2014 2015 2016 2017 2018
Quantity (short tons)
Capacity 15,427,352 15,043,647 15,166,172 14,651,633 14,655,715
Production 12,804,223 12,697,775 12,922,258 12,998,030 13,276,310
End-of-period inventories 588,445 620,823 512,454 561,735 603,639
Shipments:Home market shipments:
Internal consumption/ transfers 2,303,405 2,373,618 2,201,458 2,403,255 2,533,970
Commercial shipments 5,435,403 5,295,035 5,551,970 5,511,425 5,540,477
Subtotal, home marketshipments 7,738,808 7,668,653 7,753,428 7,914,680 8,074,447
Export shipments to:United States 409,166 628,290 634,071 411,127 394,503
All other markets 4,463,480 4,343,952 4,631,598 4,619,931 4,764,362
Total exports 4,872,646 4,972,242 5,265,669 5,031,058 5,158,865
Total shipments 12,611,454 12,640,895 13,019,097 12,945,738 13,233,312
Ratios and shares (percent)
Capacity utilization 83.0 84.4 85.2 88.7 Error
Inventories/production 4.6 4.9 4.0 4.3 4.5
Inventories/total shipments 4.7 4.9 3.9 4.3 4.6
Share of shipments:Home market shipments:
Internal consumption/ transfers 18.3 18.8 16.9 18.6 19.1
Home market shipments 43.1 41.9 42.6 42.6 41.9
Subtotal, home marketshipments 61.4 60.7 59.6 61.1 61.0
Export shipments to:United States 3.2 5.0 4.9 3.2 3.0
All other markets 35.4 34.4 35.6 35.7 36.0
Total exports 38.6 39.3 40.4 38.9 39.0
Total shipments 100.0 100.0 100.0 100.0 100.0
Source: Compiled from data submitted in response to Commission questionnaires.

VII 39
Table VII-35Wire rod: Subject countries combined producers' overall capacity and production on the sameequipment as subject production, 2014-16
Item
Calendar year
2014 2015 2016
Quantity (short tons)
Overall capacity 25,287,507 24,913,280 23,825,336
Production:Wire rod 12,804,223 12,697,775 12,922,258
Stainless steel bars and rods 0 0 0
Tool steel and high-nickel steel 657 807 807
Ball bearing steel 15,153 12,508 19,490
Concrete reinforcing bars and rods 5,379,021 5,560,533 5,651,041
Other products 2,896,296 2,717,508 2,600,063
Out-of-scope production 8,291,127 8,291,356 8,271,401
Total production on samemachinery 21,095,350 20,989,131 21,193,659
Ratios and shares (percent)
Overall capacity utilization 83.4 84.2 85.4
Share of production:Wire rod 60.7 60.5 61.0
Stainless steel bars and rods 0.0 0.0 0.0
Tool steel and high-nickel steel 0.0 0.0 0.0
Ball bearing steel 0.1 0.1 0.1
Concrete reinforcing bars and rods 25.5 26.5 26.7
Other products 13.7 12.9 12.3
Out-of-scope production 39.3 39.5 39.0
Total production on samemachinery 100.0 100.0 100.0
Source: Compiled from data submitted in response to Commission questionnaires.
U.S. INVENTORIES OF IMPORTED MERCHANDISE
Table VII 36 presents data on U.S. importers� reported inventories of wire rod.
Table VII-36Wire rod: U.S. importers’ inventories, 2014-16
* * * * * * *
U.S. IMPORTERS� OUTSTANDING ORDERS
The Commission requested importers to indicate whether they imported or arranged forthe importation of wired rod from subject countries, Canada, and all other sources afterDecember 31, 2016.

VII 40
Table VII-37Wire rod: U.S. importers’ arranged imports, 2017
* * * * * * *
ANTIDUMPING OR COUNTERVAILING DUTY ORDERS IN THIRD COUNTRY MARKETS
Table VII 38 presents a list of countries with current remedies in effect as well as thetype of trade remedy action and year in which the orders were issued.
Table VII-38Wire rod: Trade remedies on wire rod from subject countries in third countries, by type of actionand year of imposition of duties
Countryimposingremedy
Subject coutry(ies)subject to trade remedy
action Type of remedy Covered productsYear of dutyimposition
Chile
Belarus, Italy, Korea,Russia, South Africa,
Spain, Turkey, Ukraine,United Arab Emirates,
United Kingdom Safeguard measure Steel wire rod April 2016
EurasianEconomicCommission(Russia,Kazakhstan,Belarus, Armenia,and Kyrgyzstan) Ukraine Antidumping Bars and rods March 2016
IndonesiaBelarus, Italy, Spain, United
Kingdom Safeguard measure Bars and rods August 2015
Malaysia Korea Antidumping Steel wire rod February 2013
Malaysia
Belarus, Italy, Korea,Russia, South Africa,
Spain, Turkey, Ukraine,United Arab Emirates,
United KingdomProvisional
safeguard measureSteel wire rod and
deformed bar in coil April 2017
Mexico Ukraine Antidumping/ ***Bars and rods of iron or
non-alloy steel/***September
2000/***
Morocco
Belarus, Russia, Spain,Turkey, Ukraine, United
Kingdom Safeguard measureWire rods and reinforcing
bars March 2015
*** *** *** *** ***
Vietnam
Italy, Korea, Russia, Spain,United Arab Emirates,
United Kingdom Safeguard measure
Certain semi-finished andfinished products of ally
and non-alloy steel,including rods of iron or
non-alloy steel August 2016
Note.—Petitioners noted that ***. Non-trade remedy barriers imposed by third countries in the form of increasedimport duties on imports from certain subject sources were identified for ***.
Source: Petitioner Nucor’s postconference brief, exh. 9 and Notice of Affirmative Final Determination of anInvestigation with Regard to Steel Wire Rods and Deformed Bar in Coils Products Imported Into Malaysia, FederalGovernment Gazette, April 11, 2017.

VII 41
INFORMATION ON NONSUBJECT COUNTRIES
General information
The industries in China, Germany, and Japan are among the largest global producers andexporters of wire rod. The largest wire rod producers in China include ***. China exportedapproximately 11.9 million short tons in 2016. Imports of wire rod from China are currentlysubject to antidumping and countervailing duty orders. The largest wire rod producers inGermany include ArcelorMittal, Badische Stahlwerke, Riva Stahl, and Saarstahl AG. Germanyexported approximately 1.9 million short tons in 2016. The largest wire rod producers in Japaninclude JFE, Kobe Steel, Nakayama Steel Works, and Nippon Steel & Sumitomo Metals Corp.Japan exported approximately 1.7 million short tons in 2016.
The industries in Czech Republic and Brazil are not the largest global producers of wirerod. Nonetheless, they have maintained a presence in the United States. The largest wire rodproducers in the Czech Republic include Moravia Steel and ArcelorMittal. The Czech Republicexported approximately 927 thousand short tons in 2016. The largest wire rod producers inBrazil include ArcelorMittal and Gerdau. Brazil exported approximately 516 thousand shorttons in 2016.
Table VII 39 presents exports of bar and rod (including wire rod) to the world from 2014to 2016.

VII 42
Table VII-39Bars and rod (including wire rod): Global exports by exporter, 2014-16
Exporter
Calendar year
2014 2015 2016
Quantity (short tons)
United States 95,301 75,458 72,557
Subject exporters--Belarus 8,648 200,181 255,596
Italy 796,943 773,843 811,560
Korea 892,517 938,588 925,397
Russia 599,486 654,041 1,042,941
South Africa 44,366 74,981 47,800
Spain 803,297 762,012 776,787
Turkey 721,580 551,798 734,816
Ukraine 1,232,435 1,157,827 1,292,428
United Arab Emirates 120,480 257,362 0
United Kingdom 604,721 607,789 556,697
All subject exporters 5,824,474 5,978,423 6,444,024
All other major reporting exporters--China 12,433,992 13,378,324 11,886,041
Germany 2,108,013 2,109,334 1,861,844
Japan 1,676,861 1,668,732 1,700,278
Czech Republic 727,064 845,786 927,032
Brazil 294,048 415,000 515,901
Canada 500,374 519,169 512,789
Poland 450,450 458,016 421,594
Austria 308,103 304,368 386,660
France 460,871 459,372 368,803
Portugal 415,689 329,236 291,089
All other exporters 2,022,670 1,673,057 1,614,634
Total global exports 27,317,910 28,214,274 27,003,248
Table continued on next page.

VII 43
Table VII-39--ContinuedBars and rod (including wire rod): Global exports by exporter, 2014-16
Exporter
Calendar year
2014 2015 2016
Value (1,000 dollars)
United States 99,541 75,612 66,777
Subject exporters--Belarus 4,459 61,689 68,523
Italy 482,016 349,581 336,634
Korea 542,513 452,596 421,658
Russia 303,968 226,390 323,425
South Africa 25,525 27,735 15,662
Spain 534,129 399,772 364,895
Turkey 385,138 214,066 263,540
Ukraine 604,540 418,146 415,631
United Arab Emirates 65,038 103,573 0
United Kingdom 395,524 308,783 249,734
All subject exporters 3,342,849 2,562,329 2,459,701
All other major reporting exporters--China 5,639,556 4,492,961 3,645,266
Germany 1,376,648 1,067,375 878,477
Japan 1,377,550 1,197,797 1,107,133
Czech Republic 446,358 387,654 385,566
Brazil 174,402 192,760 211,775
Canada 387,078 333,673 303,695
Poland 280,456 217,485 183,233
Austria 284,363 261,368 300,028
France 303,620 228,191 173,842
Portugal 221,142 133,972 101,806
All other exporters 1,213,592 799,018 699,159
Total global exports 15,147,153 11,950,195 10,516,459
Table continued on next page.

VII 44
Table VII-39--ContinuedBars and rod (including wire rod): Global exports by exporter, 2014-16
Exporter
Calendar year
2014 2015 2016
Unit value (dollars per short ton)
United States 1,044 1,002 920
Subject exporters--Belarus 516 308 268
Italy 605 452 415
Korea 608 482 456
Russia 507 346 310
South Africa 575 370 328
Spain 665 525 470
Turkey 534 388 359
Ukraine 491 361 322
United Arab Emirates 540 402 ---
United Kingdom 654 508 449
All subject exporters 574 429 382
All other major reporting exporters--China 454 336 307
Germany 653 506 472
Japan 822 718 651
Czech Republic 614 458 416
Brazil 593 464 410
Canada 774 643 592
Poland 623 475 435
Austria 923 859 776
France 659 497 471
Portugal 532 407 350
All other exporters 600 478 433
Total global exports 554 424 389
Table continued on next page.
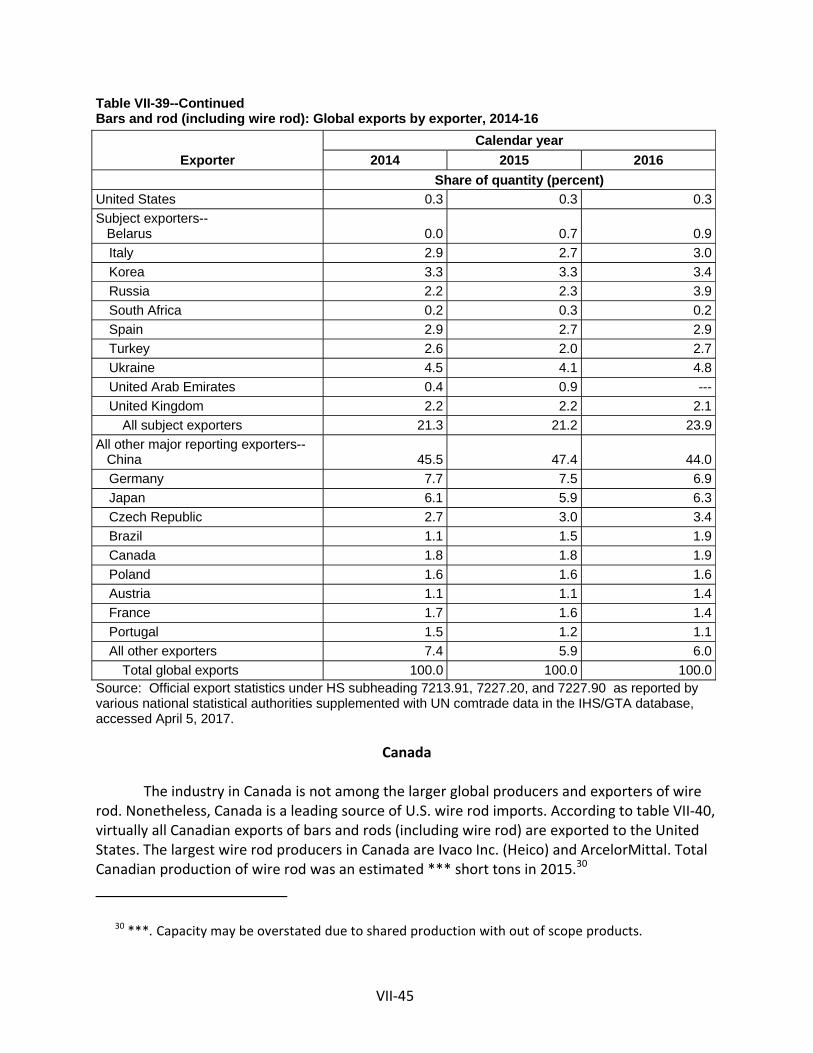
VII 45
Table VII-39--ContinuedBars and rod (including wire rod): Global exports by exporter, 2014-16
Exporter
Calendar year
2014 2015 2016
Share of quantity (percent)
United States 0.3 0.3 0.3
Subject exporters--Belarus 0.0 0.7 0.9
Italy 2.9 2.7 3.0
Korea 3.3 3.3 3.4
Russia 2.2 2.3 3.9
South Africa 0.2 0.3 0.2
Spain 2.9 2.7 2.9
Turkey 2.6 2.0 2.7
Ukraine 4.5 4.1 4.8
United Arab Emirates 0.4 0.9 ---
United Kingdom 2.2 2.2 2.1
All subject exporters 21.3 21.2 23.9
All other major reporting exporters--China 45.5 47.4 44.0
Germany 7.7 7.5 6.9
Japan 6.1 5.9 6.3
Czech Republic 2.7 3.0 3.4
Brazil 1.1 1.5 1.9
Canada 1.8 1.8 1.9
Poland 1.6 1.6 1.6
Austria 1.1 1.1 1.4
France 1.7 1.6 1.4
Portugal 1.5 1.2 1.1
All other exporters 7.4 5.9 6.0
Total global exports 100.0 100.0 100.0
Source: Official export statistics under HS subheading 7213.91, 7227.20, and 7227.90 as reported byvarious national statistical authorities supplemented with UN comtrade data in the IHS/GTA database,accessed April 5, 2017.
Canada
The industry in Canada is not among the larger global producers and exporters of wirerod. Nonetheless, Canada is a leading source of U.S. wire rod imports. According to table VII 40,virtually all Canadian exports of bars and rods (including wire rod) are exported to the UnitedStates. The largest wire rod producers in Canada are Ivaco Inc. (Heico) and ArcelorMittal. TotalCanadian production of wire rod was an estimated *** short tons in 2015.30
30 ***. Capacity may be overstated due to shared production with out of scope products.

VII 46
Table VII-40Bars and rod (including wire rod): Exports by Canada, 2014-16
Destination market
Calendar year
2014 2015 2016
Quantity (short tons)
Canada exports to the UnitedStates 498,029 518,169 512,090
Canada exports to other majordestination markets--
Spain 0 0 282
China 862 532 175
Pakistan 0 0 157
Vietnam 0 0 53
India 473 159 24
Singapore 0 0 5
Brazil 0 0 2
Italy 678 0 0
All other destination markets 331 309 0
Total Canada exports 500,374 519,169 512,789
Value (1,000 dollars)
Canada exports to the UnitedStates 385,664 333,140 303,320
Canada exports to other majordestination markets--
Spain 0 0 171
China 449 248 90
Pakistan 0 0 58
Vietnam 0 0 37
India 235 121 16
Singapore 0 0 3
Brazil 0 0 1
Italy 277 0 0
All other destination markets 453 163 0
Total Canada exports 387,078 333,673 303,695
Table continued on next page.
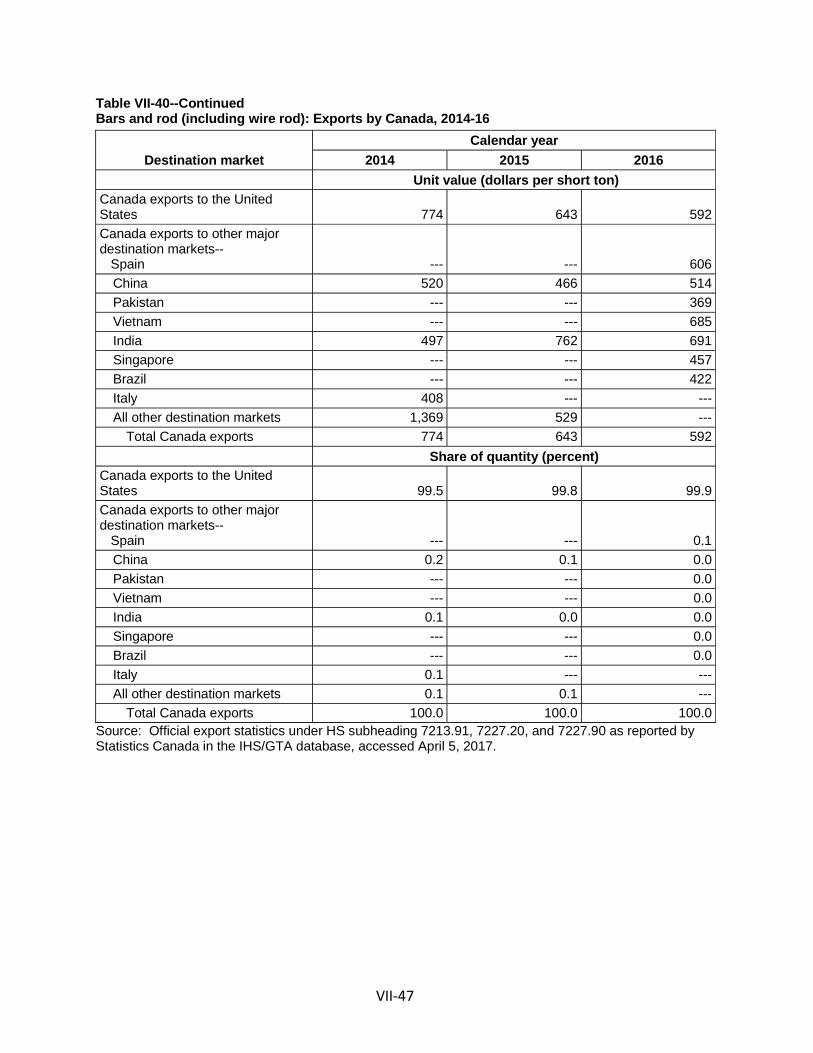
VII 47
Table VII-40--ContinuedBars and rod (including wire rod): Exports by Canada, 2014-16
Destination market
Calendar year
2014 2015 2016
Unit value (dollars per short ton)
Canada exports to the UnitedStates 774 643 592
Canada exports to other majordestination markets--
Spain --- --- 606
China 520 466 514
Pakistan --- --- 369
Vietnam --- --- 685
India 497 762 691
Singapore --- --- 457
Brazil --- --- 422
Italy 408 --- ---
All other destination markets 1,369 529 ---
Total Canada exports 774 643 592
Share of quantity (percent)
Canada exports to the UnitedStates 99.5 99.8 99.9
Canada exports to other majordestination markets--
Spain --- --- 0.1
China 0.2 0.1 0.0
Pakistan --- --- 0.0
Vietnam --- --- 0.0
India 0.1 0.0 0.0
Singapore --- --- 0.0
Brazil --- --- 0.0
Italy 0.1 --- ---
All other destination markets 0.1 0.1 ---
Total Canada exports 100.0 100.0 100.0
Source: Official export statistics under HS subheading 7213.91, 7227.20, and 7227.90 as reported byStatistics Canada in the IHS/GTA database, accessed April 5, 2017.


A-1
APPENDIX A
FEDERAL REGISTER NOTICES


A-3
The Commission makes available notices relevant to its investigations and reviews on itswebsite, www.usitc.gov. In addition, the following tabulation presents, in chronological order,Federal Register notices issued by the Commission and Commerce during the currentproceeding.
Citation Title Link
82 FR 16232,April 3, 2017
Carbon and Certain Alloy SteelWire Rod From Belarus, Italy,Korea, Russia, South Africa,Spain, Turkey, Ukraine, UnitedArab Emirates, and UnitedKingdom; Institution ofAntidumping and CountervailingDuty Investigations andScheduling of Preliminary PhaseInvestigations
https://www.federalregister.gov/documents/2017/04/03/2017-06457/carbon-and-certain-alloy-steel-wire-rod-from-belarus-italy-korea-russia-south-africa-spain-turkey
82 FR 19213,April 26, 2017
Carbon and Alloy Steel Wire RodFrom Italy and Turkey: Initiationof Countervailing DutyInvestigations
https://www.federalregister.gov/documents/2017/04/26/2017-08212/carbon-and-alloy-steel-wire-rod-from-italy-and-turkey-initiation-of-countervailing-duty
82 FR 19207,April 26, 2017
Carbon and Alloy Steel Wire RodFrom Belarus, Italy, the Republicof Korea, the Russian Federation,South Africa, Spain, the Republicof Turkey, Ukraine, United ArabEmirates, and United Kingdom:Initiation of Less-Than-Fair-ValueInvestigations
https://www.federalregister.gov/documents/2017/04/26/2017-08397/carbon-and-alloy-steel-wire-rod-from-belarus-italy-the-republic-of-korea-the-russian-federation


B 1
APPENDIX B
CALENDAR OF THE PUBLIC STAFF CONFERENCE


B 3
CALENDAR OF PUBLIC PRELIMINARY CONFERENCE
Those listed below appeared as witnesses at the United States International TradeCommission�s preliminary conference:
Subject: Carbon and Certain Alloy Steel Wire Rod from Belarus, Italy,Korea, Russia, South Africa, Spain, Turkey, Ukraine, theUnited Arab Emirates, and the United Kingdom
Inv. Nos.: 701 TA 573 574 and 731 TA 1349 1358 (Preliminary)
Date and Time: April 18, 2017 9:30 a.m.
Sessions were held in connection with these preliminary phase investigations inCourtroom B (room 111), 500 E Street, SW., Washington, DC.
OPENING REMARKS:
Respondents (Matthew M. Nolan, Arent Fox LLP)
Petitioner (Alan H. Price, WileyRein LLP)
In Opposition to the Imposition ofAntidumping and Countervailing Duty Orders:
Vorys, Sater, Seymour and Pease LLPWashington, DCon behalf of
The American Wire Producers Association (�AWPA�)
Kimberly A. Korbel, Executive Director, AWPA
John T. Johnson, Jr., President, Mid South Wire Companyand President, AWPA
Christian Stauffer, Vice President for Sourcing and Logistics,Insteel Industries Inc.
Robert Moffitt, Vice President, Purchasing, Heico Wire Group
Terry Hughes, Director of Purchasing for North America,Bekaert Corporation
Andrea Ramirez, Regional Counsel � Americas, GroupLegal U.S., Bekaert Corporation

B 4
In Opposition to the Imposition ofAntidumping and Countervailing Duty Orders (continued):
Frederick P. Waite )) � OF COUNSEL
Kimberly R. Young )
Crowell & Moring LLPWashington, DCon behalf of
Ferriere Nord S.p.A.
Daniel Cannistra ) � OF COUNSEL
White & Case LLPWashington, DCon behalf of
CELSA GroupGlobal Steel Wire S.A.CELSA Atlantic SACompa ia Espa ola de Laminación
David E. Bond )) � OF COUNSEL
Ting Ting Kao )
Mowry & Grimson, PLLCWashington, DCon behalf of
ArcelorMittal South Africa
Kristin Mowry ) � OF COUNSEL
Hogan Lovells US LLPWashington, DCon behalf of
Public Joint Stock Company Yenakiieve Iron and Steel WorksMetinvest International S.A.
Craig Lewis ) � OF COUNSEL
B 5
In Opposition to the Imposition ofAntidumping and Countervailing Duty Orders (continued):
Trade Pacific PLLCWashington, DCon behalf of
POSCO
Young Keun Hwang, President, POSCO AmericaAlabama Processing Center
John Ryoo, Sales Manager, POSCO America Corporation
Jarrod M. Goldfeder ) � OF COUNSEL
Morris Manning & Martin, LLPWashington, DCon behalf of
Kiswire America
David Minnick, CEO, Kiswire America
David Vanderkaay, Technical Service Manager,Kiswire America
Wan Kim, Advisor for Kiswire America
Donald B. Cameron )) � OF COUNSEL
Julie Mendoza )
Steptoe & Johnson LLPWashington, DCon behalf of
British Steel Limited
Richard O. Cunningham )) � OF COUNSEL
Thomas J. Trendl )

B 6
In Opposition to the Imposition ofAntidumping and Countervailing Duty Orders (continued):
Arent Fox LLPWashington, DCon behalf of
Icdas Celik Enerji Tersane ve Ulasim Sanayi A.S. (�Icdas�)The Istanbul Minerals and Metals Exports Association (�IMMIB�)
and its membersThe Turkish Steel Exporters� Association (Çelik Íhracatçilari Birli i (�ÇÍB�)
and its members
Matthew M. Nolan ) � OF COUNSEL
In Support of the Imposition ofAntidumping and Countervailing Duty Orders:
Kelley Drye &Warren LLPWashington, DCon behalf of
Gerdau Ameristeel US Inc.Keystone Consolidated Industries, Inc.Charter Steel
Chris Armstrong, Chief Executive Officer, KeystoneConsolidated Industries, Inc.
Marcelo Canosa, Director of Marketing, Gerdau LongSteel North America
Stephen Ashby, Vice President, Sales, Keystone Steel & Wire
Roxanne Brown, Assistant Legislative Director, United Steelworkers
W. Bradley Hudgens, Economic Consultant, Georgetown EconomicServices
Paul C. Rosenthal )Kathleen W. Cannon ) � OF COUNSELBrooke M. Ringel )

B 7
In Support of the Imposition ofAntidumping and Countervailing Duty Orders (continued):
WileyRein LLPWashington, DCon behalf of
Nucor
Eric Nystrom Director, SBQ and Wire Rod, Nucor
Alan H. Price )) � OF COUNSEL
Daniel B. Pickard )
REBUTTAL/CLOSING REMARKS:
Respondents (Richard O. Cunningham, Steptoe & Johnson LLP)Petitioner (Paul C. Rosenthal, Kelley Drye &Warren LLP)
END


C-1
APPENDIX C
SUMMARY DATA

List of summary tables provided in appendix C
Table C-1 presents summary data for the total U.S. market
Table C-2 presents summary data for the merchant market

Table C-1
Wire rod: Summary data concerning the total U.S. market, 2014-16
2014 2015 2016 2014-16 2014-15 2015-16
U.S. consumption quantity:
Amount.................................................................................... 5,454,176 5,442,066 5,332,017 (2.2) (0.2) (2.0)
Producers' share (fn1)............................................................. 66.9 66.9 66.4 (0.4) 0.0 (0.5)
Importers' share (fn1):
Belarus................................................................................. --- 0.2 0.7 0.7 0.2 0.6
Italy....................................................................................... 0.0 0.0 0.6 0.6 (0.0) 0.6
Korea.................................................................................... 2.0 2.4 1.9 (0.1) 0.4 (0.5)
Russia................................................................................... 0.2 0.1 1.9 1.7 (0.1) 1.8
South Africa.......................................................................... --- 0.8 0.4 0.4 0.8 (0.4)
Spain.................................................................................... 0.6 1.5 1.5 0.9 0.9 0.0
Turkey................................................................................... 3.9 4.9 1.8 (2.0) 1.0 (3.0)
Ukraine................................................................................. 0.3 1.5 3.0 2.8 1.2 1.6
United Arab Emirates........................................................... 0.0 0.3 0.4 0.4 0.3 0.1
United Kingdom.................................................................... 1.3 0.8 1.0 (0.3) (0.5) 0.2
Subject sources................................................................. 8.3 12.4 13.4 5.1 4.2 0.9
Canada................................................................................. 9.6 10.3 10.4 0.7 0.7 0.0
All other sources................................................................... 15.3 10.3 9.8 (5.4) (4.9) (0.5)
Nonsubject sources........................................................... 24.9 20.7 20.2 (4.7) (4.2) (0.5)
All import sources........................................................... 33.1 33.1 33.6 0.4 (0.0) 0.5
U.S. consumption value:
Amount.................................................................................... 3,787,493 3,196,885 2,849,990 (24.8) (15.6) (10.9)
Producers' share (fn1)............................................................. 66.9 64.8 64.5 (2.4) (2.1) (0.3)
Importers' share (fn1):
Belarus................................................................................. --- 0.1 0.4 0.4 0.1 0.3
Italy....................................................................................... 0.0 0.0 0.4 0.4 (0.0) 0.4
Korea.................................................................................... 1.8 2.1 1.8 (0.0) 0.3 (0.3)
Russia................................................................................... 0.2 0.1 1.2 1.0 (0.1) 1.2
South Africa.......................................................................... --- 0.6 0.3 0.3 0.6 (0.3)
Spain.................................................................................... 0.6 1.6 1.6 1.1 1.0 0.0
Turkey................................................................................... 3.3 4.0 1.5 (1.8) 0.7 (2.5)
Ukraine................................................................................. 0.2 1.1 2.1 1.9 0.9 1.0
United Arab Emirates........................................................... 0.0 0.2 0.3 0.3 0.2 0.1
United Kingdom.................................................................... 1.2 0.8 0.9 (0.3) (0.4) 0.1
Subject sources................................................................. 7.4 10.6 10.6 3.3 3.2 0.0
Canada................................................................................. 10.7 11.2 11.4 0.7 0.5 0.2
All other sources................................................................... 15.0 13.3 13.4 (1.6) (1.6) 0.0
Nonsubject sources........................................................... 25.7 24.6 24.8 (0.8) (1.1) 0.3
All import sources........................................................... 33.1 35.2 35.5 2.4 2.1 0.3
U.S. imports from:
Belarus:
Quantity................................................................................ 0 9,059 38,267 fn2 fn2 322.4
Value.................................................................................... 0 3,131 12,434 fn2 fn2 297.1
Unit value.............................................................................. $0 $346 $325 fn2 fn2 (6.0)
Ending inventory quantity..................................................... *** *** *** *** *** ***
Italy:
Quantity................................................................................ 346 246 33,163 9,472.6 (29.0) 13,373.4
Value.................................................................................... 543 291 12,697 2,236.6 (46.4) 4,259.7
Unit value.............................................................................. $1,569 $1,183 $383 (75.6) (24.6) (67.6)
Ending inventory quantity..................................................... *** *** *** *** *** ***
Korea:
Quantity................................................................................ 109,026 128,862 101,970 (6.5) 18.2 (20.9)
Value.................................................................................... 69,377 67,290 51,873 (25.2) (3.0) (22.9)
Unit value.............................................................................. $636 $522 $509 (20.1) (17.9) (2.6)
Ending inventory quantity..................................................... *** *** *** *** *** ***
Russia:
Quantity................................................................................ 12,329 6,857 103,322 738.0 (44.4) 1,406.8
Value.................................................................................... 7,552 2,230 35,215 366.3 (70.5) 1,479.1
Unit value.............................................................................. $613 $325 $341 (44.4) (46.9) 4.8
Ending inventory quantity..................................................... *** *** *** *** *** ***
South Africa:
Quantity................................................................................ 0 45,451 22,049 fn2 fn2 (51.5)
Value.................................................................................... 0 18,830 8,000 fn2 fn2 (57.5)
Unit value.............................................................................. $0 $414 $363 fn2 fn2 (12.4)
Ending inventory quantity..................................................... *** *** *** *** *** ***
Spain:
Quantity................................................................................ 31,778 79,976 78,665 147.5 151.7 (1.6)
Value.................................................................................... 22,392 52,358 47,007 109.9 133.8 (10.2)
Unit value.............................................................................. $705 $655 $598 (15.2) (7.1) (8.7)
Ending inventory quantity..................................................... *** *** *** *** *** ***
Table continued on next page.
Period changes
(Quantity=short tons; Value=1,000 dollars; Unit values, unit labor costs, and unit expenses=dollars per short ton; Period changes=percent--exceptions noted)
Calendar year Calendar year
Reported data
C-3
Total Market

Table C-1--Continued
Wire rod: Summary data concerning the total U.S. market, 2014-16
2014 2015 2016 2014-16 2014-15 2015-16
U.S. imports.--Continued
Turkey:
Quantity................................................................................ 210,901 264,469 98,497 (53.3) 25.4 (62.8)
Value.................................................................................... 125,108 128,556 44,005 (64.8) 2.8 (65.8)
Unit value.............................................................................. $593 $486 $447 (24.7) (18.1) (8.1)
Ending inventory quantity..................................................... *** *** *** *** *** ***
Ukraine:
Quantity................................................................................ 14,625 79,053 161,451 1,003.9 440.5 104.2
Value.................................................................................... 8,684 35,022 59,507 585.3 303.3 69.9
Unit value.............................................................................. $594 $443 $369 (37.9) (25.4) (16.8)
Ending inventory quantity..................................................... *** *** *** *** *** ***
United Arab Emirates:
Quantity................................................................................ 28 17,673 22,159 78,897.0 62,903.0 25.4
Value.................................................................................... 18 6,952 7,631 42,847.1 39,026.8 9.8
Unit value.............................................................................. $633 $393 $344 (45.6) (37.9) (12.5)
Ending inventory quantity..................................................... *** *** *** *** *** ***
United Kingdom:
Quantity................................................................................ 71,379 45,609 52,736 (26.1) (36.1) 15.6
Value.................................................................................... 46,428 24,859 25,035 (46.1) (46.5) 0.7
Unit value.............................................................................. $650 $545 $475 (27.0) (16.2) (12.9)
Ending inventory quantity..................................................... *** *** *** *** *** ***
Subject sources:
Quantity................................................................................ 450,414 677,254 712,279 58.1 50.4 5.2
Value.................................................................................... 280,103 339,520 303,403 8.3 21.2 (10.6)
Unit value.............................................................................. $622 $501 $426 (31.5) (19.4) (15.0)
Ending inventory quantity..................................................... *** *** *** *** *** ***
Canada:
Quantity................................................................................ 524,324 561,752 552,362 5.3 7.1 (1.7)
Value.................................................................................... 405,564 358,637 326,185 (19.6) (11.6) (9.0)
Unit value.............................................................................. $774 $638 $591 (23.7) (17.5) (7.5)
Ending inventory quantity..................................................... *** *** *** *** *** ***
All other sources:
Quantity................................................................................ 833,059 562,237 524,687 (37.0) (32.5) (6.7)
Value.................................................................................... 566,556 426,591 381,719 (32.6) (24.7) (10.5)
Unit value.............................................................................. $680 $759 $728 7.0 11.6 (4.1)
Ending inventory quantity..................................................... *** *** *** *** *** ***
Nonsubject sources:
Quantity................................................................................ 1,357,383 1,123,989 1,077,050 (20.7) (17.2) (4.2)
Value.................................................................................... 972,120 785,228 707,904 (27.2) (19.2) (9.8)
Unit value.............................................................................. $716 $699 $657 (8.2) (2.5) (5.9)
Ending inventory quantity..................................................... *** *** *** *** *** ***
All imports sources:
Quantity................................................................................ 1,807,797 1,801,243 1,789,328 (1.0) (0.4) (0.7)
Value.................................................................................... 1,252,223 1,124,748 1,011,307 (19.2) (10.2) (10.1)
Unit value.............................................................................. $693 $624 $565 (18.4) (9.9) (9.5)
Ending inventory quantity..................................................... *** *** *** *** *** ***
Table continued on next page.
Reported data Period changes
(Quantity=short tons; Value=1,000 dollars; Unit values, unit labor costs, and unit expenses=dollars per short ton; Period changes=percent--exceptions noted)
Calendar year Calendar year
C-4

Table C-1--Continued
Wire rod: Summary data concerning the total U.S. market, 2014-16
2014 2015 2016 2014-16 2014-15 2015-16
U.S. producers':
Average capacity quantity....................................................... 4,890,994 4,928,590 4,635,509 (5.2) 0.8 (5.9)
Production quantity.................................................................. 3,706,939 3,675,269 3,580,955 (3.4) (0.9) (2.6)
Capacity utilization (fn1).......................................................... 75.8 74.6 77.3 1.5 (1.2) 2.7
U.S. shipments:
Quantity................................................................................ 3,646,379 3,640,823 3,542,689 (2.8) (0.2) (2.7)
Value.................................................................................... 2,535,270 2,072,137 1,838,683 (27.5) (18.3) (11.3)
Unit value.............................................................................. $695 $569 $519 (25.4) (18.1) (8.8)
Export shipments:
Quantity................................................................................ 42,744 33,585 38,667 (9.5) (21.4) 15.1
Value.................................................................................... 34,544 22,977 23,452 (32.1) (33.5) 2.1
Unit value.............................................................................. $808 $684 $607 (25.0) (15.3) (11.3)
Ending inventory quantity........................................................ 261,268 262,130 261,730 0.2 0.3 (0.2)
Inventories/total shipments (fn1)............................................. 7.1 7.1 7.3 0.2 0.1 0.2
Production workers.................................................................. 2,269 2,411 2,222 (2.1) 6.3 (7.8)
Hours worked (1,000s)............................................................ 4,835 4,945 4,754 (1.7) 2.3 (3.9)
Wages paid ($1,000)............................................................... 170,593 172,268 168,288 (1.4) 1.0 (2.3)
Hourly wages (dollars)............................................................. $35.28 $34.84 $35.40 0.3 (1.3) 1.6
Productivity (short tons per 1,000 hours)................................ 766.7 743.2 753.3 (1.8) (3.1) 1.3
Unit labor costs........................................................................ $46.02 $46.87 $47.00 2.1 1.9 0.3
Net sales:
Quantity................................................................................ 3,689,123 3,674,408 3,581,356 (2.9) (0.4) (2.5)
Value.................................................................................... 2,569,813 2,095,115 1,862,126 (27.5) (18.5) (11.1)
Unit value.............................................................................. $697 $570 $520 (25.4) (18.1) (8.8)
Cost of goods sold (COGS).................................................... 2,433,233 1,980,765 1,714,896 (29.5) (18.6) (13.4)
Gross profit or (loss)................................................................ 136,580 114,350 147,230 7.8 (16.3) 28.8
SG&A expenses...................................................................... 84,072 76,932 83,693 (0.5) (8.5) 8.8
Operating income or (loss)...................................................... 52,508 37,418 63,537 21.0 (28.7) 69.8
Net income or (loss)................................................................ 39,057 24,142 54,616 39.8 (38.2) 126.2
Capital expenditures................................................................ 97,747 86,292 66,425 (32.0) (11.7) (23.0)
Unit COGS.............................................................................. $660 $539 $479 (27.4) (18.3) (11.2)
Unit SG&A expenses............................................................... $23 $21 $23 2.5 (8.1) 11.6
Unit operating income or (loss)............................................... $14 $10 $18 24.6 (28.5) 74.2
Unit net income or (loss)......................................................... $11 $7 $15 44.0 (37.9) 132.1
COGS/sales (fn1).................................................................... 94.7 94.5 92.1 (2.6) (0.1) (2.4)
Operating income or (loss)/sales (fn1).................................... 2.0 1.8 3.4 1.4 (0.3) 1.6
Net income or (loss)/sales (fn1).............................................. 1.5 1.2 2.9 1.4 (0.4) 1.8
Notes:
fn1.--Reported data are in percent and period changes are in percentage points.
fn2.--Undefined.
Calendar year Calendar year
Source: Compiled from data submitted in response to Commission questionnaires and official U.S. import statistics using HTS statistical reporting numbers 7213.91.3011
7213.91.3015, 7213.91.3020, 7213.91.3093, 7213.91.4500, 7213.91.6000, 7213.99.0030, 7227.20.0030, 7227.20.0080, 7227.90.6010, 7227.90.6020, 7227.90.6030, and
7227.90.6035, accessed April 5, 2017.
C-5
(Quantity=short tons; Value=1,000 dollars; Unit values, unit labor costs, and unit expenses=dollars per short ton; Period changes=percent--exceptions noted)
Reported data Period changes

Table C-2
Wire rod: Summary data concerning the merchant U.S. market, 2014-16
2014 2015 2016 2014-16 2014-15 2015-16
U.S. consumption quantity:
Amount.................................................................................... 4,435,158 4,393,786 4,258,701 (4.0) (0.9) (3.1)
Producers' share (fn1)............................................................. 59.2 59.0 58.0 (1.3) (0.2) (1.0)
Importers' share (fn1):
Belarus................................................................................. --- 0.2 0.9 0.9 0.2 0.7
Italy....................................................................................... 0.0 0.0 0.8 0.8 (0.0) 0.8
Korea.................................................................................... 2.5 2.9 2.4 (0.1) 0.5 (0.5)
Russia................................................................................... 0.3 0.2 2.4 2.1 (0.1) 2.3
South Africa.......................................................................... --- 1.0 0.5 0.5 1.0 (0.5)
Spain.................................................................................... 0.7 1.8 1.8 1.1 1.1 0.0
Turkey................................................................................... 4.8 6.0 2.3 (2.4) 1.3 (3.7)
Ukraine................................................................................. 0.3 1.8 3.8 3.5 1.5 2.0
United Arab Emirates........................................................... 0.0 0.4 0.5 0.5 0.4 0.1
United Kingdom.................................................................... 1.6 1.0 1.2 (0.4) (0.6) 0.2
Subject sources................................................................. 10.2 15.4 16.7 6.6 5.3 1.3
Canada................................................................................. 11.8 12.8 13.0 1.1 1.0 0.2
All other sources................................................................... 18.8 12.8 12.3 (6.5) (6.0) (0.5)
Nonsubject sources........................................................... 30.6 25.6 25.3 (5.3) (5.0) (0.3)
All import sources........................................................... 40.8 41.0 42.0 1.3 0.2 1.0
U.S. consumption value:
Amount.................................................................................... 3,131,198 2,637,141 2,317,039 (26.0) (15.8) (12.1)
Producers' share (fn1)............................................................. 60.0 57.3 56.4 (3.7) (2.7) (1.0)
Importers' share (fn1):
Belarus................................................................................. --- 0.1 0.5 0.5 0.1 0.4
Italy....................................................................................... 0.0 0.0 0.5 0.5 (0.0) 0.5
Korea.................................................................................... 2.2 2.6 2.2 0.0 0.3 (0.3)
Russia................................................................................... 0.2 0.1 1.5 1.3 (0.2) 1.4
South Africa.......................................................................... --- 0.7 0.3 0.3 0.7 (0.4)
Spain.................................................................................... 0.7 2.0 2.0 1.3 1.3 0.0
Turkey................................................................................... 4.0 4.9 1.9 (2.1) 0.9 (3.0)
Ukraine................................................................................. 0.3 1.3 2.6 2.3 1.1 1.2
United Arab Emirates........................................................... 0.0 0.3 0.3 0.3 0.3 0.1
United Kingdom.................................................................... 1.5 0.9 1.1 (0.4) (0.5) 0.1
Subject sources................................................................. 8.9 12.9 13.1 4.1 3.9 0.2
Canada................................................................................. 13.0 13.6 14.1 1.1 0.6 0.5
All other sources................................................................... 18.1 16.2 16.5 (1.6) (1.9) 0.3
Nonsubject sources........................................................... 31.0 29.8 30.6 (0.5) (1.3) 0.8
All import sources........................................................... 40.0 42.7 43.6 3.7 2.7 1.0
U.S. producers':
Commercial U.S. shipments:
Quantity................................................................................ 2,627,361 2,592,543 2,469,373 (6.0) (1.3) (4.8)
Value.................................................................................... 1,878,975 1,512,393 1,305,732 (30.5) (19.5) (13.7)
Unit value.............................................................................. $715 $583 $529 (26.1) (18.4) (9.4)
Commercial sales:
Quantity................................................................................ 2,669,611 2,625,619 2,507,226 (6.1) (1.6) (4.5)
Value.................................................................................... 1,912,967 1,534,935 1,328,554 (30.6) (19.8) (13.4)
Unit value.............................................................................. $717 $585 $530 (26.1) (18.4) (9.4)
Cost of goods sold (COGS).................................................... 1,809,803 1,468,463 1,234,908 (31.8) (18.9) (15.9)
Gross profit or (loss)................................................................ 103,164 66,472 93,646 (9.2) (35.6) 40.9
SG&A expenses...................................................................... 64,366 57,556 63,050 (2.0) (10.6) 9.5
Operating income or (loss)...................................................... 38,798 8,916 30,596 (21.1) (77.0) 243.2
Net income or (loss)................................................................ 32,394 1,646 26,287 (18.9) (94.9) 1,497.0
Unit COGS.............................................................................. $678 $559 $493 (27.3) (17.5) (11.9)
Unit SG&A expenses............................................................... $24 $22 $25 4.3 (9.1) 14.7
Unit operating income or (loss)............................................... $15 $3 $12 (16.0) (76.6) 259.4
Unit net income or (loss)......................................................... $12 $1 $10 (13.6) (94.8) 1,572.4
COGS/sales (fn1).................................................................... 94.6 95.7 93.0 (1.7) 1.1 (2.7)
Operating income or (loss)/sales (fn1).................................... 2.0 0.6 2.3 0.3 (1.4) 1.7
Net income or (loss)/sales (fn1).............................................. 1.7 0.1 2.0 0.3 (1.6) 1.9
Notes:
fn1.--Reported data are in percent and period changes are in percentage points.
fn2.--Undefined.
C-6
Source: Compiled from data submitted in response to Commission questionnaires and official U.S. import statistics using HTS statistical reporting numbers 7213.91.3011
7213.91.3015, 7213.91.3020, 7213.91.3093, 7213.91.4500, 7213.91.6000, 7213.99.0030, 7227.20.0030, 7227.20.0080, 7227.90.6010, 7227.90.6020, 7227.90.6030, and
7227.90.6035, accessed April 5, 2017.
(Quantity=short tons; Value=1,000 dollars; Unit values, unit labor costs, and unit expenses=dollars per short ton; Period changes=percent--exceptions noted)
Reported data Period changes
Calendar year Calendar year
Merchant Market
D 1
APPENDIX D
MONTHLY U.S. SHIPMENTS, IMPORTS, AND MARKET SHARES


D 3
Table D 1Wire rod: Monthly apparent U.S. consumption, January 2014 through December 2016
ItemU.S. producers' U.S.
shipments
U.S. imports from.-- Apparent U.S.consumptionSubject sources Nonsubject sources All import sources
Quantity (short tons)
2014.--January 285,886 14,085 144,490 158,576 444,462
February 274,721 8,201 100,186 108,386 383,107
March 328,273 15,304 132,038 147,342 475,615
April 316,692 22,283 217,573 239,856 556,548
May 295,632 27,543 160,845 188,388 484,020
June 331,861 85,647 79,302 164,949 496,810
July 307,210 5,381 95,999 101,380 408,590
August 306,244 38,400 82,747 121,148 427,392
September 343,171 49,036 113,952 162,989 506,160
October 293,709 92,951 77,815 170,766 464,475
November 263,238 41,032 59,388 100,420 363,658
December 299,739 49,747 86,363 136,110 435,849
2015.--January 309,119 46,156 98,632 144,787 453,906
February 285,921 84,659 83,471 168,130 454,051
March 331,821 69,430 81,980 151,410 483,231
April 319,548 32,653 94,317 126,969 446,517
May 290,034 26,747 95,373 122,120 412,154
June 344,059 38,558 106,050 144,608 488,667
July 330,617 38,113 78,608 116,722 447,339
August 317,245 65,182 99,569 164,751 481,996
September 313,433 73,734 85,042 158,776 472,209
October 273,295 71,172 119,549 190,721 464,016
November 258,191 15,225 91,351 106,576 364,767
December 267,539 110,238 83,272 193,509 461,048
2016.--January 325,015 61,812 83,773 145,585 470,600
February 292,325 70,224 82,158 152,382 444,707
March 330,803 62,813 92,570 155,383 486,186
April 324,456 65,170 81,318 146,488 470,944
May 288,289 62,488 100,060 162,548 450,837
June 309,609 63,682 90,416 154,099 463,708
July 257,280 41,865 98,087 139,952 397,232
August 300,387 86,154 86,443 172,596 472,983
September 291,635 56,014 90,147 146,161 437,796
October 257,439 77,881 89,831 167,711 425,150
November 253,001 41,545 76,515 118,060 371,061
December 312,447 18,629 99,563 118,192 430,639
Source: Compiled from data submitted in response to Commission questionnaires and official U.S. imports basedon General Imports using statistical reporting numbers 2804.69.1000 and 2804.69.5000, accessed on March 16,2017.

D 4
Table D 2Wire rod: Monthly market shares, January 2014 through December 2016
ItemU.S. producers' U.S.
shipments
U.S. imports from.-- Apparent U.S.consumptionSubject sources Nonsubject sources All import sources
Share of quantity (percent)
2014.--January 64.3 3.2 32.5 35.7 100.0
February 71.7 2.1 26.2 28.3 100.0
March 69.0 3.2 27.8 31.0 100.0
April 56.9 4.0 39.1 43.1 100.0
May 61.1 5.7 33.2 38.9 100.0
June 66.8 17.2 16.0 33.2 100.0
July 75.2 1.3 23.5 24.8 100.0
August 71.7 9.0 19.4 28.3 100.0
September 67.8 9.7 22.5 32.2 100.0
October 63.2 20.0 16.8 36.8 100.0
November 72.4 11.3 16.3 27.6 100.0
December 68.8 11.4 19.8 31.2 100.0
2015.--January 68.1 10.2 21.7 31.9 100.0
February 63.0 18.6 18.4 37.0 100.0
March 68.7 14.4 17.0 31.3 100.0
April 71.6 7.3 21.1 28.4 100.0
May 70.4 6.5 23.1 29.6 100.0
June 70.4 7.9 21.7 29.6 100.0
July 73.9 8.5 17.6 26.1 100.0
August 65.8 13.5 20.7 34.2 100.0
September 66.4 15.6 18.0 33.6 100.0
October 58.9 15.3 25.8 41.1 100.0
November 70.8 4.2 25.0 29.2 100.0
December 58.0 23.9 18.1 42.0 100.0
2016.--January 69.1 13.1 17.8 30.9 100.0
February 65.7 15.8 18.5 34.3 100.0
March 68.0 12.9 19.0 32.0 100.0
April 68.9 13.8 17.3 31.1 100.0
May 63.9 13.9 22.2 36.1 100.0
June 66.8 13.7 19.5 33.2 100.0
July 64.8 10.5 24.7 35.2 100.0
August 63.5 18.2 18.3 36.5 100.0
September 66.6 12.8 20.6 33.4 100.0
October 60.6 18.3 21.1 39.4 100.0
November 68.2 11.2 20.6 31.8 100.0
December 72.6 4.3 23.1 27.4 100.0
Source: Derived from table D 2.

E-1
APPENDIX E
NONSUBJECT COUNTRY PRICE DATA


E-3
One importer reported price data for nonsubject country Canada for products 1, 2, and4. Price data reported by this firm accounted for 5.3 percent of U.S. commercial shipments fromCanada in 2016.1 These price items and accompanying data are comparable to those presentedin tables V-3, V-4, and V-6. Price and quantity data for Canada are shown in tables E-1 to E-3and in figures E-1 to E-3 (with domestic and subject sources).
In comparing nonsubject country pricing data with U.S. producer pricing data, prices forwire rod imported from Canada were lower than prices for U.S.-produced wire rod in 15instances and higher in 21 instances. In comparing nonsubject country pricing data with subjectcountry pricing data, prices for wire rod imported from Canada were lower than prices for wirerod imported from subject countries (aggregated) in 9 instances and higher in 23 instances. Ona country-by-country basis, prices for wire rod imported from Canada were lower in a majorityof instances than prices for wire rod imported from Italy (in *** instances) and the United ArabEmirates (in *** instances). Prices for wire rod imported from Canada were higher in a majorityof instances for the remaining eight subject countries. A summary of price differentials ispresented in table E-4.
Table E-1
Wire rod: Weighted-average f.o.b. prices and quantities of imported product 1, by quarters,January 2014-December 2016
* * * * * * *
Table E-2
Wire rod: Weighted-average f.o.b. prices and quantities of imported product 2, by quarters,January 2014-December 2016
* * * * * * *
Table E-3
Wire rod: Weighted-average f.o.b. prices and quantities of imported product 4, by quarters,January 2014-December 2016
* * * * * * *
1 ***.

E-4
Figure E-1
Wire rod: Weighted-average f.o.b. prices and quantities of domestic and imported product 1, byquarters, January 2014-December 2016
* * * * * * *
Figure E-2
Wire rod: Weighted-average f.o.b. prices and quantities of domestic and imported product 2, byquarters, January 2014-December 2016
* * * * * * *
Figure E-3
Wire rod: Weighted-average f.o.b. prices and quantities of domestic and imported product 4, byquarters, January 2014-December 2016
* * * * * * *
Table E-4
Wire rod: Summary of underselling/(overselling), by country, January 2014-December 2016
Comparison
Total
number of
comparisons
Nonsubject lower
than the
comparison source
Nonsubject higher
than the
comparison source
Number
of
quarters
Quantity
(short
tons)
Number
of
quarters
Quantity
(short
tons)
Nonsubject vs United States:
Canada vs. United States 36 15 *** 21 ***
Nonsubject vs subject countries:
Canada vs. Belarus 5 *** *** *** ***
Canada vs. Italy 5 *** *** *** ***
Canada vs. Korea 25 *** *** *** ***
Canada vs. Russia 9 *** *** *** ***
Canada vs. South Africa 10 *** *** *** ***
Canada vs. Spain 6 *** *** *** ***
Canada vs. Turkey 24 *** *** *** ***
Canada vs. United Arab Emirates 5 *** *** *** ***
Canada vs. Ukraine 17 *** *** *** ***
Canada vs. United Kingdom 4 *** *** *** ***Canada vs. Subject
(aggregated) 32 9 *** 23 ***Source: Compiled from data submitted in response to Commission questionnaires.