Embed Size (px)
Citation preview

Capturing richer information: On establishing the validityof an interval-valued survey response mode
Zack Ellerby1 & Christian Wagner1 & Stephen B. Broomell2
Accepted: 18 May 2021# The Author(s) 2021
AbstractObtaining quantitative survey responses that are both accurate and informative is crucial to a wide range of fields. Traditional andubiquitous response formats such as Likert and visual analogue scales require condensation of responses into discrete or pointvalues—but sometimes a range of options may better represent the correct answer. In this paper, we propose an efficient interval-valued response mode, whereby responses are made by marking an ellipse along a continuous scale. We discuss its potential tocapture and quantify valuable information that would be lost using conventional approaches, while preserving a high degree ofresponse efficiency. The information captured by the response interval may represent a possible response range—i.e., a conjunctiveset, such as the real numbers between 3 and 6. Alternatively, it may reflect uncertainty in respect to a distinct response—i.e., adisjunctive set, such as a confidence interval. We then report a validation study, utilizing our recently introduced open-sourcesoftware (DECSYS), to explore how interval-valued survey responses reflect experimental manipulations of several factorshypothesised to influence interval width, across multiple contexts. Results consistently indicate that respondents used intervalwidths effectively, and subjective participant feedback was also positive. We present this as initial empirical evidence for theefficacy and value of interval-valued response capture. Interestingly, our results also provide insight into respondents’ reasoningabout the different aforementioned types of intervals—we replicate a tendency towards overconfidence for those representingepistemic uncertainty (i.e., disjunctive sets), but find intervals representing inherent range (i.e., conjunctive sets) to be well-calibrated.
Keywords Questionnaire . Survey . Interval . Ellipse . Uncertainty . Vagueness . Ambiguity . Sets . Disjunctive . Conjunctive .
Software
Introduction
The collection, analysis, utilization (and monetization) of data,obtained largely from people, has increased exponentially overthe last decades. This growth reflects rapid progress in informa-tion and communications technologies, which have been suc-cessfully exploited to improve access to these data. Many areasof research are already seeing great practical benefits from tech-nological advances—consider the growing prevalence of re-motely administrable digital questionnaires (Behrend et al.,
2011; Gnambs & Kaspar, 2015; Krantz & Reips, 2017;Schmidt, 1997). Moreover, development and evaluation ofmethods and best practices for collecting and interpreting surveyresponse data have long been important topics, subject to bothextensive discussion and empirical research (cf. Converse &Presser, 1986; Fowler, 1995; Groves et al., 2011; Krosnick &Fabrigar, 1997; Meade & Craig, 2012; Payne, 1951/2014; Saris& Gallhofer, 2014; Thurstone & Chave, 1929). However, instark contrast to the rapid development in methods of reachingpeople to acquire data, the predominant modes of capturing,encoding, and quantifying responses to social, behavioural, andpsychological surveys remain fundamentally those developedearly in the twentieth century—i.e., ordinal, ‘Likert-type’ andcontinuous ‘visual analogue’ scales (Freyd, 1923; Likert,1932). We propose that it is time to pause, take stock, and askwhether technological developments permit advances in the typeof data that can be efficiently collected through surveys—i.e.,moving beyond point responses—as well as the means to accessand analyse them.
* Zack [email protected]
1 Laboratory for Uncertainty in Data and Decision Making, School ofComputer Science, University of Nottingham, Jubilee Campus,Wollaton Road, Nottingham NG8 1BB, UK
2 Department of Social and Decision Sciences, Carnegie MellonUniversity, 5000 Forbes Avenue, Pittsburgh, PA 15213, USA
Behavior Research Methodshttps://doi.org/10.3758/s13428-021-01635-0

Specifically, this paper focuses on an issue that we believehas received relatively little attention given its potentialsignificance—the efficient handling of uncertainty or rangethat may be inherent in individual responses. These may arisefrom a variety of factors, including lack of knowledge or infor-mation available to the respondent, inherent randomness, vari-ability, or vagueness in the answer, and ambiguity or ill-definition in the question. This paper begins by discussing thepotential value of capturing such information through interval-valued responses, which may represent either ‘conjunctive’ or‘disjunctive’ sets (cf. Couso & Dubois, 2014; Dubois & Prade,2012), before contextualising this in comparison with the capa-bilities of conventional methods. It then puts forward and em-pirically evaluates an ellipse-based response mode—which isdesigned to efficiently capture and quantify the uncertainty andrange associated with each response in the form of an interval,increasing both fidelity and information content. This methodthus articulates the response level uncertainty that is oftenoverlooked by point response modes.
Changing the actual format of the data (from traditional pointestimates, to interval-valued) is a very substantial shift requiringan equally substantial and sustained research effort across allfacets of the process of questionnaire-based research—fromcapture to analysis. Recent work by the present authors hasincluded development of open-source software for efficient dig-ital administration of interval-valued surveys (DECSYS—cf.Ellerby et al., 2019b), which is available to download (viahttps://www.lucidresearch.org/decsys.html) from GitHub. Thispaper builds upon this—reporting a study designed to providean initial validation of the underlying approach. In this study,participants completed an electronic questionnaire with ques-tions designed to vary systematically along three primary di-mensions expected to influence response interval width: inher-ent variability or range in the appropriate response, adequacyand availability of supporting information, and clarity of ques-tion phrasing. We examine whether interval-valued responsesreliably reflect induced variability along each of thesedimensions—with experimental hypotheses that observed vari-ance in interval widths will be significantly associated with eachfactor. Results find consistently in the affirmative, providing aninitial demonstration of the efficacy of interval-valued responsesto systematically capture additional information across a varietyof circumstances, relative to discrete response modes.
The added value of intervals
Sometimes the correct response to a question is clear anddiscrete. How many sides does a square have? Here, the an-swer four is both correct and complete. However, this is nottrue for all questions. In many cases the appropriate responseis uncertain, due to either ambiguity in the question or lack ofknowledge of the respondent (cf. Converse & Presser, 1986;Coombs & Coombs, 1976; Bruine de Bruin et al., 2011;
Fowler, 1995; Payne, 1951/2014), or because the correct re-sponse intrinsically comprises a range of values (cf. Budescuet al., 2009; Harris et al., 2017; Liu & Mendel, 2008; Wagneret al., 2013; Wu et al., 2012). These three features are illus-trated in the following examples.
First, consider the uncertainty induced by the question‘What number will I roll?’ The context of the question is notspecified—what is to be rolled? If dice, then how many ofthem? Of how many sides? And on how many occasions?Viewed alone, the ambiguity in the question makes it impos-sible to confidently answer. Second, consider the question ‘Iwill roll two fair six-sided dice one time; what sum total will Iroll?’ Here, the context and the meaning of the question arequite clear. However, the correct answer is inherently unpre-dictable. Given the stochastic nature of rolling dice, although abest guess can be made, a specific number remains impossibleto answer with certainty. The only thing we can say for sure isthat the correct answer falls within the interval [2,12]1. Third,consider the range of values associated with the question ‘Ihave one standard six-sided die; what numbers are shown onits faces?’ The question is worded clearly, and all relevantinformation is known. However, the answer comprises a setof distinct values and, to completely express a correct re-sponse, the full range of these values must be represented.The minimum complexity response format with the capacityto do so is an interval, with the answer [1,6].
In each of the cases described, any discrete response isinsufficient to convey all information necessary for a correctanswer. When presented with a discrete response mode, eachsituation will manifest as response uncertainty—in terms ofwhich single response option represents the most appropriateanswer. The act of forcing respondents to condense their an-swer into a discrete approximation can be viewed as addingnoise to the data, as extraneous factors may influence whichdiscrete response option is chosen at the time. Limiting theimpact of collapsing a potentially complex response, by en-abling interval-valued responses—which intrinsically com-prise a range of values (cf. Cloud et al., 2009)—should permit
1 Uncertainty can be broken down into epistemic (reducible, subjective) andaleatoric (irreducible, objective), (cf. Brugnach et al., 2007; Couso & Dubois,2014; Dewulf et al., 2005; Dubois & Prade, 2012; Fox & Ülkümen, 2011;Kwakkel et al., 2010; Walker et al., 2003; Zandvoort et al., 2018). The seconddice example is of aleatoric uncertainty, as the correct response is yet to bedetermined and is therefore currently unknowable. For an example of episte-mic uncertainty, relating instead to a lack of knowledge regarding a knowableanswer, consider the question ‘I have just rolled two fair six-sided dice onetime; what sum total did I roll?’when the dice remain hidden from the respon-dent’s view. Here the answer is knowable but remains uncertain from theperspective of the respondent, until more information can be obtained (e.g.,viewing the dice in question). For the purposes of the present study, we focuson the breadth of underpinning ‘drivers’ of interval width, which may beencountered when completing a conventional questionnaire, rather than argu-ing for a particular typology of uncertainties. It is thus convenient to note thatboth of these cases fall within the single category of disjunctive sets—i.e., theresponse interval reflects the inadequacy of knowledge or information neces-sary for the respondent to make a precise and certain judgement.
Behav Res

the capture of higher-fidelity response data. We argue thatthere are many real-world cases where it would be both morevaluable and more efficient to offer respondents the opportu-nity to provide interval-valued responses, rather than currentlyprevalent point response modes.
One important consideration concerning interval-valuedresponses is that they may capture different types of informa-tion. Specifically, intervals reflecting uncertainty generallycomprise a disjunctive set, in the sense that they describe the(lack of) knowledge of the respondent about a specificquantity—as described in the first two cases above—ratherthan an actual range (cf. Couso & Dubois, 2014; Dubois &Prade, 2012). Confidence intervals are a common example ofsuch disjunctive sets. At the same time, intervals also fre-quently represent conjunctive sets—i.e., true ranges of valuesexisting in the real world—as described in the third caseabove. In this paper, we do not focus on defining the natureof the information captured by the interval; we aim rather todemonstrate that capturing intervals can fundamentally affordthe systematic and efficient capture of information not avail-able using discrete response modes.
Practical applications
One well-documented application for interval-valued judge-ments is in direct elicitation of uncertainty in respect to indi-vidual estimates (i.e., confidence intervals)—whether fromexperts or otherwise (cf. Cooke, 1991; Hemming et al.,2018; Kahneman et al., 1982; Klayman et al., 1999;Morgan, 2014; Soll & Klayman, 2004; Speirs-Bridge et al.,2010). As alluded to above, however, it is important to notethat the information which can be captured by intervals is notlimited to confidence intervals.
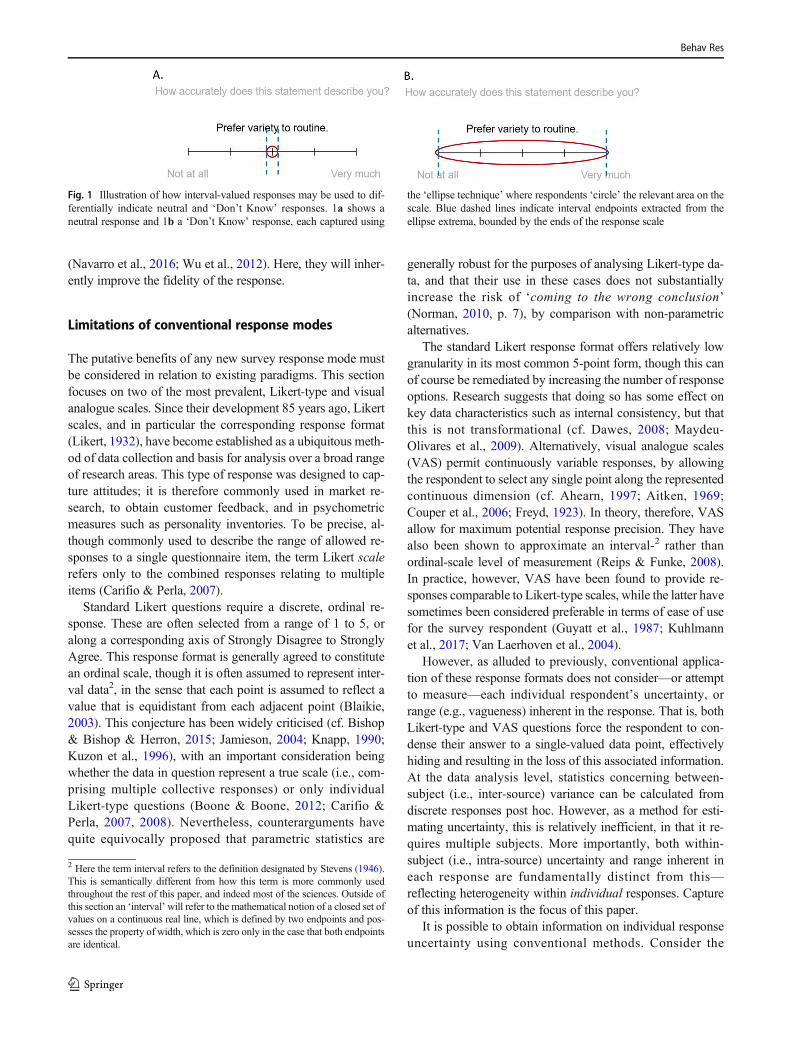
In practice, interval-valued responses may be particularlyuseful in the context of decision research, where participantsare routinely asked to make unfamiliar choices and estimateprobabilities of outcomes under uncertainty (cf. Cubitt et al.,2015; Ellerby & Tunney, 2017, 2019; Tversky & Kahneman,1974). However, aside from eliciting intervals with an explicitdegree of confidence, interval size can also be used moregenerally to identify questions for which participants are moreor less uncertain or confident about the most appropriate re-sponse (cf. Yaniv & Foster, 1995, 1997). Consider the ex-treme case of ‘Don’t Know’ responses, which may beexpressed by selecting the midpoint of an ordinal scale;interval-valued responses allow for the clear distinction be-tween respondents who are uncertain or ambivalent and thosewho are genuinely neutral, as shown in Fig. 1. Difficulty indoing this is a fundamental limitation of point response for-mats (Coombs & Coombs, 1976; Klopfer & Madden, 1980;Krosnick & Fabrigar, 1997) and has led to the frequent intro-duction of an additional ‘Don’t know’ response option
separate from the scale, increasing complexity for respondentsand analysis (discussed further in the next subsection).
In questionnaire pretesting, interval-valued responsescould be used to identify questions that are causing confusionfor participants. Here, unusually broad intervals could beinterpreted as indicating questions that are ambiguous, impre-cise, or otherwise difficult to understand. Complementingexisting tools (e.g., QUAID—Graesser et al., 2000), thiswould allow for easy identification of areas that require im-provements in phrasing or presentation, and could also beparticularly useful for informing the nature of any observeddifferences between native and non-native speakers.
In attitudinal surveys, intervals could also be a valuabletool for informing the degree of conviction with which a re-spondent holds a given attitude or belief, which may be or-thogonal to the strength of the attitude or belief itself. For onecase—consumer preference research—understanding the de-gree of conviction or flexibility associated with consumerpreferences or attitudes could valuably inform the likelihoodof these motivating future behaviour, as well as openness ver-sus resistance to persuasion and potential for establishing con-sensus (Ellerby et al., 2020; Petty et al., 2002; Rucker et al.,2014).
For another example, consider political science, where fa-cilitating the capture of each respondent’s level of commit-ment regarding their voting intentions could be valuable ininforming more accurate models of voting behaviour (cf.Burden, 1997). Specifically, in polling, we could reduce thenoise arising from forcing the respondent to collapse theirresponse model (a complex belief) into a single value at thepoint of completing the survey. As the same participant maycollapse the same belief to a different discrete response whenactually voting (e.g., based on immediate external influence,such as a salient news event on the day of polling), it is pref-erable to capture the actual range of the belief as completely aspossible—thus providing not just voter intent at the pollingstage, but information regarding the level of voter uncertainty.In fact, a study conducted by Aldrich et al. (1982) positivelyevaluated the possibility of allowing respondents to selectmultiple response points along an ordinal response scale.They concluded that their results suggested that discrete mea-sures ‘force a false precision of response… expressed ambi-guity is a real phenomenon. If so, the current practice offorcing respondents to select a single point not only intro-duces another source of measurement error into already im-precise data, but also loses theoretically importantinformation.’ (p. 411). Nevertheless, discrete response scalespredominate to this day.
Finally, intervals will of course be valuable in any casewhere the most correct and complete answer to a question isitself an interval, such as interpretation of probability phrases(cf. Budescu & Wallsten, 1985, 1995; Harris et al., 2017;Karelitz & Budescu, 2004) or other linguistic terms
Behav Res
(Navarro et al., 2016; Wu et al., 2012). Here, they will inher-ently improve the fidelity of the response.
Limitations of conventional response modes
The putative benefits of any new survey response mode mustbe considered in relation to existing paradigms. This sectionfocuses on two of the most prevalent, Likert-type and visualanalogue scales. Since their development 85 years ago, Likertscales, and in particular the corresponding response format(Likert, 1932), have become established as a ubiquitous meth-od of data collection and basis for analysis over a broad rangeof research areas. This type of response was designed to cap-ture attitudes; it is therefore commonly used in market re-search, to obtain customer feedback, and in psychometricmeasures such as personality inventories. To be precise, al-though commonly used to describe the range of allowed re-sponses to a single questionnaire item, the term Likert scalerefers only to the combined responses relating to multipleitems (Carifio & Perla, 2007).
Standard Likert questions require a discrete, ordinal re-sponse. These are often selected from a range of 1 to 5, oralong a corresponding axis of Strongly Disagree to StronglyAgree. This response format is generally agreed to constitutean ordinal scale, though it is often assumed to represent inter-val data2, in the sense that each point is assumed to reflect avalue that is equidistant from each adjacent point (Blaikie,2003). This conjecture has been widely criticised (cf. Bishop& Bishop & Herron, 2015; Jamieson, 2004; Knapp, 1990;Kuzon et al., 1996), with an important consideration beingwhether the data in question represent a true scale (i.e., com-prising multiple collective responses) or only individualLikert-type questions (Boone & Boone, 2012; Carifio &Perla, 2007, 2008). Nevertheless, counterarguments havequite equivocally proposed that parametric statistics are
generally robust for the purposes of analysing Likert-type da-ta, and that their use in these cases does not substantiallyincrease the risk of ‘coming to the wrong conclusion’(Norman, 2010, p. 7), by comparison with non-parametricalternatives.
The standard Likert response format offers relatively lowgranularity in its most common 5-point form, though this canof course be remediated by increasing the number of responseoptions. Research suggests that doing so has some effect onkey data characteristics such as internal consistency, but thatthis is not transformational (cf. Dawes, 2008; Maydeu-Olivares et al., 2009). Alternatively, visual analogue scales(VAS) permit continuously variable responses, by allowingthe respondent to select any single point along the representedcontinuous dimension (cf. Ahearn, 1997; Aitken, 1969;Couper et al., 2006; Freyd, 1923). In theory, therefore, VASallow for maximum potential response precision. They havealso been shown to approximate an interval-2 rather thanordinal-scale level of measurement (Reips & Funke, 2008).In practice, however, VAS have been found to provide re-sponses comparable to Likert-type scales, while the latter havesometimes been considered preferable in terms of ease of usefor the survey respondent (Guyatt et al., 1987; Kuhlmannet al., 2017; Van Laerhoven et al., 2004).
However, as alluded to previously, conventional applica-tion of these response formats does not consider—or attemptto measure—each individual respondent’s uncertainty, orrange (e.g., vagueness) inherent in the response. That is, bothLikert-type and VAS questions force the respondent to con-dense their answer to a single-valued data point, effectivelyhiding and resulting in the loss of this associated information.At the data analysis level, statistics concerning between-subject (i.e., inter-source) variance can be calculated fromdiscrete responses post hoc. However, as a method for esti-mating uncertainty, this is relatively inefficient, in that it re-quires multiple subjects. More importantly, both within-subject (i.e., intra-source) uncertainty and range inherent ineach response are fundamentally distinct from this—reflecting heterogeneity within individual responses. Captureof this information is the focus of this paper.
It is possible to obtain information on individual responseuncertainty using conventional methods. Consider the
Fig. 1 Illustration of how interval-valued responses may be used to dif-ferentially indicate neutral and ‘Don’t Know’ responses. 1a shows aneutral response and 1b a ‘Don’t Know’ response, each captured using
the ‘ellipse technique’ where respondents ‘circle’ the relevant area on thescale. Blue dashed lines indicate interval endpoints extracted from theellipse extrema, bounded by the ends of the response scale
2 Here the term interval refers to the definition designated by Stevens (1946).This is semantically different from how this term is more commonly usedthroughout the rest of this paper, and indeed most of the sciences. Outside ofthis section an ‘interval’will refer to the mathematical notion of a closed set ofvalues on a continuous real line, which is defined by two endpoints and pos-sesses the property of width, which is zero only in the case that both endpointsare identical.
Behav Res

problem of ‘Don’t know’ responses (cf. Coombs & Coombs,1976; Klopfer & Madden, 1980; Krosnick & Fabrigar, 1997).The inclusion of a separate ‘Don’t know’ option offers oneworkaround, but with its own fundamental limitations.Uncertainty is not all or nothing, but of varying degrees—when a ‘Don’t know’ option is present, participants are forcedto choose between giving a best guess, to communicate theirlimited information regarding the subject in question, or in-stead to opt out, to communicate information only about thepresence of some unspecified (though presumably substantial)degree of uncertainty. However, as they cannot express both,in any case where the respondent is neither entirely certain norentirely ignorant, the response will be incomplete.
Alternatively, dedicated additional questions may be askedabout the uncertainty associated with each judgement—whichmay also be framed in terms of confidence (cf. Cheesman &Merikle, 1984; Dienes et al., 1995; Peirce & Jastrow, 1884;Sporer et al., 1995; Tunney & Shanks, 2003). However, thisapproach is inefficient, effectively doubling the number ofresponses that participants are required to provide.Moreover, although this question is not directly examined inthe current study, the lack of cohesion between initial re-sponses and subsequently elicited uncertainty responses mayalso limit response fidelity—for instance, confidence may dif-fer depending upon response time, and if confidence ratingsare provided after initial responses, then these ratings mayhave continued to evolve in the intervening period (cf.Baranski & Petrusic, 1998; Pleskac & Busemeyer, 2010).Finally, although they often correspond, we note that ‘confi-dence’ is a complex notion inequivalent to (un)certainty—andreported confidence may have distinct determinants from un-certainty reported through interval width (Teigen &Jorgensen, 2005). For example, a respondent may be perfectlyconfident of an inherently interval-valued response (e.g., theconjunctive set of numbers shown on a standard die, as men-tioned earlier).
Enabling efficient interval capture using ellipses
An emerging ellipse-based response mode has been devel-oped to allow efficient, coherent, and intuitive capture andquantification of uncertainties and ranges associated with in-dividual survey responses. This method is designed to lever-age the growing prevalence and public familiarity with mod-ern information technologies—such as accurate and portabletouchscreen devices—and builds upon widespread familiaritywith ‘circling’ areas of interest to minimise, and potentiallyeliminate, any added effort investment required to obtain thisricher response information. It is designed as an efficient com-promise between traditional and currently ubiquitousmethods, such as discrete ordinal scales, and more complexor esoteric approaches, such as qualitative interviews, variousmethods of eliciting (specifically) probability distributions (cf.
Bruine de Bruin et al., 2011;Morris et al., 2014; Speirs-Bridgeet al., 2010), including SHELF (Gosling, 2018; O’Hagan,2019), and the ‘fuzzy graphic rating scale’ (FRS), (cf.Hesketh et al., 1988; Hesketh et al., 1992; Lubiano et al.,2016; Quirós et al., 2016).
In contrast to currently predominant point response formats(e.g., Likert-type and VAS), the ellipse response mode elicitsintervals. While a variety of approaches could enable provi-sion of interval-valued responses, in this case respondents doso by drawing an ellipse along a continuous scale, delineatingthe interval that they believe best represents the answer.Crucially, participants are encouraged to use the width of thisellipse (i.e., the size of the interval) to indicate the degree ofrange (e.g., uncertainty, variability, vagueness, or ambiguity)in their response. This is illustrated in Fig. 2, by comparisonwith more traditional Likert-type and VAS response formats.
Therefore, this interval-valued response mode extends be-yond the benefits of existing continuous scales, such as VAS.It not only has the potential to capture responses that are pre-cise, but also makes possible the capture of fundamentallydistinct information, such as individual response uncertaintyor vagueness. This information is usually lost when usingpoint-valued response formats. Moreover, ellipses achievethis in a single, integrated, and cohesive response. These attri-butes should make the approach intuitive to use and quicklyand easily administrable, facilitating broader adoption whilereducing training requirements necessary to obtain high-fidelity responses. The ellipse approach is designed primarilyto streamline the process of interval-valued data collection soas to provide an alternative to point response modes (e.g.,Likert-type or VAS), where it offers a substantial information-al advantage at a minimally increased, or potentially evenreduced, workload—e.g., by counteracting choice paralysiswhen selecting between multiple potentially appropriate dis-crete alternatives or requiring fewer questions to be asked.
Previous research on the elicitation of confidence intervals(an example of disjunctive sets) has consistently indicated thatinterval-valued estimates tend to be overconfident (Juslinet al., 1999; Klayman et al., 1999; Tversky & Kahneman,1974; Yaniv & Foster, 1995, 1997). Further evidence suggeststhat singular interval estimates, such as those elicited by theellipse response mode, are prone to greater overconfidencethan those split into multiple steps (Soll & Klayman, 2004;Speirs-Bridge et al., 2010). At the same time, the coherent,singular nature of ellipse responses is a key asset in avoidingthe added complexity and effort induced by soliciting multipleresponses for each survey item.
While this goes beyond the scope of the present paper,there is evidence to suggest that for uncertainty capture (i.e.,the disjunctive case), ellipses may be better placed to capturerespondents’ subjectively ‘reasonable’ bounds—with the po-tential for follow-up questions to determine subjective confi-dence in the accuracy of the interval provided (Teigen &
Behav Res

Jorgensen, 2005; Winman et al., 2004), and potentially cali-brate or convert these into standardised credible intervals orprobability distributions (cf. Hemming et al., 2018; Speirs-Bridge et al., 2010). However, as discussed earlier, confidenceintervals and, more generally, disjunctive sets are only oneexample of the information which can be captured by inter-vals. In practice, the most appropriate method to use will de-pend upon both the questions to be answered and the time andeffort available to invest. Here we focus on the ellipse re-sponse mode as an alternative to day-to-day surveys that usediscrete responses.
In different disciplines, related research has already beenconducted into practical foundations for using interval-valuedresponses. Much of this has focused on the exploration anddevelopment of appropriate mathematical methods to effec-tively extract, process, and interpret the resulting data (cf.Anderson et al., 2014; Ferson et al., 2007; Havens et al.,2017; Kabir et al., 2021; Liu & Mendel, 2008; McCullochet al., 2019, 2020; Miller et al., 2012; Wagner et al., 2013;Wagner et al., 2015; Wu et al., 2012)—leveraging existingtheory from the fields of interval arithmetic (cf. Cloud et al.,2009; Moore, 1966; Nguyen et al., 2012) and fuzzy set theory(Zadeh, 1965). The present authors have also directed sub-stantial recent work into developing a practical software tool(DECSYS—Ellerby et al., 2019b, 2020), which now makesefficient digital collection of interval-valued survey data scal-able and widely accessible.
Nonetheless, despite the promise of and growing interest inthis response mode, it remains to be conclusively demonstrat-ed whether interval-valued responses provided through ellip-ses reliably capture set-valued information (either disjunc-tive—e.g., arising from uncertainty, or conjunctive—e.g.,arising from vagueness); or whether, due to either participant
satisficing or careless responding (cf. Krosnick, 1991; Meade& Craig, 2012; Vannette & Krosnick, 2014), they might in-stead be arbitrary or dependent upon other extraneous factors.The present study was designed to address this gap in theevidence base and determine whether this ‘quick and easy’approach can indeed provide robust and valuable additionalinformation associated with individual responses—establishing a foundation for further research and develop-ment of methods for efficient interval capture.
Experimental summary
The aim of the experiment was to assess the efficacy ofinterval-valued survey responses to capture meaningful addi-tional information, across a variety of circumstances and re-lating to three potentially distinct sources, which may each bepresent when responding to conventional survey questions.Over a three-section digital questionnaire, we induced varyingdegrees of each—inherent variability in the appropriate re-sponse, adequacy and availability of supporting information,and clarity of question phrasing—to determine whether thevariance in size of elicited intervals is systematic, with refer-ence to established ground truth in each of these cases.
In Section 1, participants were asked to simply identify andreproduce data from a chart, which itself comprised a range ofspecific values (i.e., a conjunctive set). The objective here wassimply to establish whether respondents, given minimal in-struction, are able to understand the basic concept of aninterval-valued response, and to use the ellipse format to com-municate ranges that they are aware of—i.e., which were inthis case explicitly provided.
In Section 2, participants made their own judgementsconcerning stimuli with experimentally controlled degrees of
Fig. 2 Example questionnaire responses. 2a shows a Likert-type ordinalresponse. 2b shows VAS-type response. 2c shows an interval-valuedresponse with low uncertainty. 2d shows an interval-valued responsewith
high uncertainty. Divisions (sub-markers) on continuous scales are illus-trative here only, and questions of appropriate scale design apply as fortraditional scales
Behav Res

both uncertainty and variability. The aim here was to examinehow respondents apply the interval-valued response format torepresent their own experienced degrees of stimulus-relateduncertainty and variability (i.e., both disjunctive and conjunc-tive aspects), as well as the interplay between these twofactors.
In Section 3, participants responded to a broader variety ofitems, which were designed to differ systematically in levelsof ambiguity, specificity, and comprehensibility. In this sec-tion we explore how respondents use interval-valued re-sponses to communicate their own subjectively perceived am-biguities or degrees of uncertainty, when induced by lack ofclarity in, or comprehension of, the question or associatedstimuli.
Eliciting interval-valued responses from participants ineach of these cases, following only brief instruction regardinghow to use this response format at the outset of the study,should provide insight into the potential for practical utilityand real-world adoption of this response mode across a rangeof contexts and situations.
Method
Participants
A total of 40 participants completed this experiment, recruitedin an opportunity sample. As the study was advertised primar-ily across University of Nottingham UK campuses, via phys-ical posters and email list invitations, members of the univer-sity community were disproportionately represented. Insofaras is feasible within this population, the sample was varied—with participants originating from a variety of schools, UKcampuses, and job roles (a substantial proportion of staff par-ticipants were non-academic). Each participant was paid afixed inconvenience allowance of £5 (GBP), to compensatefor their time spent taking part. Nineteen of these self-identified as male and nineteen female, two declined to reporttheir gender. Ages ranged from 18 to 50 (M = 25.65, SD =7.75). Twenty-four reported as native English speakers andfifteen as non-native speakers, while one declined to reportthis.
A range of different statistical analyses were conducted;statistical power will differ substantially between these. Forthe simplest cases, i.e., one-sample and paired-samples para-metric t tests, this final sample size was determined to offer astatistical power of > .99, .87, and .23, to detect a large, me-dium, or small effect, respectively (two-tailed, α = .05, d = .8,.5, and .2—cf. Cohen, 1988). For ANOVAs, power dependsheavily upon specifics—including number of measurements,as well as factors that are not known a priori, such as correla-tions among repeatedmeasures and sphericity of the data to beobtained. Nonetheless, calculations using default values for
these parameters indicated, across all planned ANOVAs, aminimum power of > .99 to detect a large effect, .94 to detecta medium effect, and .26 to detect a small effect (α = .05, corr.among rep. measures = .5, sphericity assumed, F = .4, .25, .1,respectively—cf. Cohen, 1988). When applying worst-casescenarios for sphericity, power across all analyses remainedat minimum .95, .62, and .15, for F = .4, .25, and .1. All powercalculations were made using G*Power (Faul et al., 2007).
Questionnaire items
All questionnaire items were developed for the purposes ofthis study. These were classified into three distinct sections.The purpose and content of all three sections was briefly ex-plained to each participant before the beginning of the study,and this was reiterated for each individual section before itwas begun.
In Section 1, participants observed a chart showing claimednatural life expectancies for several different household pets,if given proper care and attention (see Fig. 3). This was createdusing data obtained from injaf.org, under a CreativeCommons agreement for non-commercial use, and with writ-ten permission from the copyright holder. The data providedwere already in the form of intervals (e.g., ranging between 15and 20 years for a domestic cat)—the task of respondents wastherefore simply to reproduce these data as best they could,over a series of eight specific animals, using the interval-valued scale.
In Section 2, participants were presented with a series of sixsets of 35 marbles—each comprising some proportion of blueversus yellow marbles. Each set was organised into five rows,of seven marbles each. Respondents were tasked with provid-ing their best estimate for how many blue marbles were presentoverall in each row of the given set—with a response scaleranging between zero and seven. Initially, for each set, six outof seven marbles in each row were hidden, entailing a substan-tial degree of uncertainty around this estimate. In the following
Fig. 3 Showing animal life expectancy reference chart, from the firstsection of the survey
Behav Res

questions, three more, and then all marbles in each row of theset were revealed. This process was repeated for each of the sixsets, for a total of 18 questions. Importantly, for some sets thenumber of marbles in each row was identical, but for othersthere was a discrepancy between rows. This between-row var-iability entailed a degree of range in the correct interval-valuedresponse. Example stimuli are shown in Fig. 4.
In the third and final section, respondents answered a col-lection of more varied items. These questions were designedto hold varying degrees of vagueness, ambiguity, or compre-hensibility in their wording or meaning. Crucially, althoughquestions were deliberately worded to induce qualitativelymore or less uncertainty, ambiguity, or vagueness in the re-sponse, the precise quantity of these depended upon the sub-jective interpretation of the respondent. First, questions wereasked concerning the temperature in England, either during aspecific month (December, July) or without qualification, theaim being to establish whether interval widths could be usedto distinguish between more and less specifically phrasedquestions. Second, questions were asked concerning a scenar-io in which a percentage value either increased by 50% ordoubled—with the former being possible to interpret as eithera 50% or 50-percentage-point increase on the original amount.The aim here was to determine whether interval widths coulddiscriminate questions with clear versus potentially ambigu-ous interpretations. Third, respondents were asked to reporthow well they were described by a series of 12 personality-related words—four of these were commonly used (talkative,aggressive, lazy, quiet), four were low-frequency (garrulous,bellicose, indolent, taciturn), and four were not real words, butcreated solely for use in the study (brendacious, apoccular,lombardistic, revenotile). The objective here was to establishwhether intervals could identify questions within which aword was poorly, or not, understood. Fourth, respondentswere asked a series of double-barrelled questions, followedby their single-barrelled counterparts (e.g., Howwell does thisstatement describe you?—I like reading books and watching
television, vs I like reading books, vs I like watchingtelevision. Also: watching and playing sports, drinking teaand coffee, cooking and eating). The objective here was tofurther establish whether intervals could discriminate moreand less specifically phrased questions.
The final two question types in this section moved thefocus from the question wording alone, to the combinationof question and associated stimulus. Fifth, respondents wereasked to judge how many cars, and then how many vehicles,were present within each of two images (see Fig. 5)—each ofthese contained eight vehicles (the more inclusive term) intotal, of which a potentially disputable number could be con-sidered cars. Sixth, and finally, respondents were asked tojudge the number of blue marbles contained in three rows ofeight marbles each (see Fig. 6). For the first of these, thecorrect response was clear, with marbles each being eitherblue (4), green (2), or yellow (2)3,4. For the next, a gradientwas introduced from blue to green to make the number of bluemarbles blurred, or vague. For the final set, marbles eachcontained only blue or yellow3, but five marbles were pat-terned, containing varying proportions of each colour. Asthe question did not clearly specify whether the term bluewas intended to refer only to completely blue, or also to main-ly, or even partially blue marbles, the appropriate responsecould be considered ambiguous. The aim in each of thesecases was to further examine whether the width of interval-valued responses would enable discrimination betweenquestion–stimulus combinations that were clear, and thosethat may be interpreted as vague, unclear, or ambiguous.
Fig. 4 Showing example marble stimuli, from the second section of the survey. In 4a, three marbles from each row remain hidden. In 4b, all 35 marblesare visible. Example (expected) responses are shown below each stimulus
3 Note that as these stimuli were shown on an LED computer screen, a per-ceiver with high enough image resolution could argue that none of the marblestruly contained any yellow—as this percept is created through the combinationat a specific ratio of green and red light output.4 Participants were instructed to judge the number of blue, rather than green oryellow marbles because of the relatively high prevalence of red-green colourdeficiency (up to 8% in European males—Birch, 2012) relative to blue-yellow(<0.01% worldwide—Wright, 1952).
Behav Res

In the subjective feedback section of the questionnaire,participants were asked four questions. These were whetherthey found the response format ‘easy to use’, ‘unnecessarilycomplex’, and whether it allowed them to ‘effectivelycommunicate [their] desired response’, as well as whether‘Overall, [they] liked the response format’. These were ad-ministered using a conventional 5-point ordinal scale, rangingfrom ‘Strongly Disagree’ to ‘Strongly Agree’.
Experimental design
The study used a repeated-measures design, in which eachparticipant completed the entire 63-item questionnaire. Allresponses were made through the ellipse-based interval-valued response mode, using a touchscreen MicrosoftSurface Pro computer, together with a stylus. All surveyswere administered through a local area network, using theDECSYS software’s Workshop Mode (Ellerby et al.,2019b)5. In this paper, response intervals were deconstructedinto two separate dependent variables, namely their position(captured by the interval mean) and width (the distance
between interval endpoints)6,7. Participants also completed ashort feedback questionnaire—adapted from the SystemsUsability Scale (Brooke, 1996)—for which the dependent var-iable was degree of agreement, represented along a 5-pointordinal response scale.
Question order was not randomised for each respondent,due to design factors combined with limitations to therandomisation capabilities of the early version of DECSYSused for the study. In Section 2, for instance, it was necessaryto present the three questions relating to each set of marblestogether and in sequence, with six, then three, then no hiddenmarbles. Question order must therefore be considered as apotential factor when interpreting results; for example, partic-ipants had more experience providing interval-valued re-sponses by the time they were completing the latter stages ofthe survey.
Procedure
Prior to the study, ethical approval was obtained from theUniversity of Nottingham, School of Computer Science—where the lead authors are based. Before beginning the exper-iment, each participant was presented with a project informa-tion sheet, and informed consent was obtained. All partici-pants were free to withdraw from the study at any time and
Fig. 5 Showing example vehicle stimuli, from the third section of the survey. Both stimuli contain a total of eight vehicles, but a potentially disputablenumber of cars
5 This software is available as an open-source package which enables interest-ed parties to run their own instance of the platform to conduct surveys. Beyondthis, DECSYS is designed to enable hosting for example on standard cloudinfrastructure such as Microsoft Azure, providing a similar user experience tocommercial tools such as SurveyMonkey® or Qualtrics®. Here, the softwareprovides the functionality of multiple survey administrator accounts—allowing, for example, individual researchers to develop and administer theirown surveys and access the resulting data. All data here are accessible exclu-sively by the specific survey administrator. In a geographical sense, the phys-ical location of the data stored is determined by whether DECSYS is beingused as a service hosted on a personal server (e.g., within a university) or oncloud infrastructure. In the case of the present study, all data were storedlocally.
6 This enables analysis at a reasonable level of complexity, using establishedmethods. However, in general, it is complete intervals which capture individ-ual responses. With the application of a rapidly advancing body of workaround advanced techniques for handling interval-valued data, we expect thatthere is significant potential in the development of new interval-based quanti-tative analysis methods, offering an efficient approach to rapidly collate, com-pare, and assess rich quantitative information from survey respondents.7 The interval midpoint is used to represent interval location in our analysis,and we do not assume that the midpoint of each interval is necessarily a ‘bestestimate’. In cases where the response interval represents a disjunctive set, arespondent’s ‘best estimate’ may or may not be located at the centre of theinterval provided.
Behav Res

without giving a reason. Following this, participants were in-dividually seated before a Microsoft Surface Pro touchscreencomputer and began the survey process. Initially, participantsread a general instructions page, in which the appropriate useof the interval-valued questionnaire response format wasbriefly explained to them (see Appendix 1). This instructedparticipants to use an ellipse to mark each answer, and that awider ellipse should be used to indicate greater uncertainty,range, or vagueness in the desired response. Illustrated exam-ples were provided here of both a more and a less certainresponse (see also Fig. 2c, d). After this, participants readthrough three slides of task instructions, which provided basicinformation regarding each section of the survey (seeAppendix 2). Participants were then asked to indicate whetherthey had read and fully understood the task information, andto raise any outstanding questions with the experimenter.Once they had done so, they proceeded to complete all threesections of the survey—questions are detailed in theQuestionnaire items section. Total task duration was generally30–40 minutes. Following completion of the main survey,participants were asked to complete a few more short ques-tions, this time on paper, designed to elicit their subjectivefeedback about the interval-valued response format. Oncethese were completed, participants were informed that theyhad finished the study and were provided with their inconve-nience allowance.
Results
A series of statistical analyses were conducted, relating toresponse data obtained within the different sections of thesurvey. These are detailed in the following subsections.
It is important to bear in mind that for the purposes of theanalyses performed here, we extract only certain characteris-tics from the intervals (i.e., interval position—as the mean ofthe interval endpoints, and interval width—as the differencebetween the left and right endpoints)6,7.
Section 1: Reproducing presented intervals
The purpose of this section was to assess the capability ofrespondents to reproduce intervals explicitly provided tothem, using the ellipse response mode. Visualisations of theinterval-valued responses provided in relation to two of theitems in this section are shown in Fig. 7; one shows the rawintervals provided by each respondent, and the second repre-sents an aggregation of these responses, based on the IntervalAgreement Approach (IAA—cf. Wagner et al., 2015). TheIAA represents the degree of agreement across the group—i.e., overlap between all intervals—as a two-dimensional dis-tribution. This may be interpreted as a fuzzy set (cf. Zadeh,1965), with the agreement between intervals at each x-valuedetermining the corresponding degree of membership.
For comparative analysis, we determined both Pearson cor-relation coefficients (r values) and mean square error values(MSE), which were based on a standardised response scaleover [0,100] (to permit comparison with Section 2 results).This was done for both the midpoints and widths of the inter-vals drawn by each of the 40 respondents, over all eight ques-tions, by comparison with those originally provided on theanimal lifespan chart (Fig. 3). The resulting groups of 40 rvalues (representing each respondent) were then comparedagainst zero using one-sample t tests (two-tailed), to examinethe group-level relationship between stimulus and responseintervals. As these data were consistently found to significant-ly deviate from normality, we used bootstrapping to ensurerobustness (10,000 samples). We also report MSE values withbootstrapped 95% confidence intervals.
These tests revealed a significant and strong positive cor-relation between original and drawn interval midpoints,p = .003 (M = .97, 95% CIs .93 to 1.00); also, between origi-nal and drawn interval widths, p = .002 (M = .89, 95% CIs .78to .97). MSE values—with scale range standardised to[0,100]—were as follows: for interval midpoints M = 55.29(95% CIs 6.70 to 122.27), for interval widths M = 33.72(95% CIs 8.99 to 65.65). These results indicate that the
Fig. 6 Showing example marble stimuli, from the third section of the survey. In 6a, the number of blue marbles is clear. In 6b, a gradient blurs thetransition from blue to green. In 6c there is a lack of clarity in whether blue refers to entirely, mainly, or partially blue marbles
Behav Res

interval-valued responses provided in this section closely ap-proximated the original (ground-truth) intervals upon whichthey were based—in terms of both position and width.
Section 2: Reporting disjunctive and conjunctiveintervals
The purpose of this section was to examine whether partici-pants were able to use the ellipse response mode to generateintervals representing observed degrees of both uncertaintyand variability—and then to assess just how the intervals pro-vided reflect these two factors. Two independent forms ofanalysis were applied to achieve these objectives. First, theobjectively definable maximum and minimum bounds onthe possible number of blue marbles in each row were deter-mined for each question, as a benchmark (ground truth) forcomparison. Then, as in the previous section, midpoints andwidths of these intervals were compared against the corre-sponding responses provided by each of the 40 participants,to obtain both r and MSE values (based on a standardisedresponse scale from [0,100]) for each respondent across allquestions. As in Section 1, these data were found to signifi-cantly deviate from normality, so r values were comparedagainst zero using bootstrapped one-sample t tests (two-tailed,10,000 samples), and MSE values are reported withbootstrapped 95% confidence intervals Fig. 8.
These tests revealed a significant and strong positive cor-relation between benchmark and drawn interval midpoints,p < .001 (M = .90, 95% CIs .86 to .94), as well as betweenbenchmark and drawn interval widths, p < .001 (M = .75,95% CIs .68 to .82). In this case, MSE values were: M =65.72 (95% CIs 37.60 to 99.52) for interval midpoints, andM = 954.01 (95% CIs 663.76 to 1267.01) for interval widths.These results indicate that the interval-valued responses pro-vided in this section were again strongly associated with ex-pected values—in this instance representing minimum andmaximum bounds on the possible range of blue marbles,across all rows in any given set. However, in contrast withthe previous section, where the task was simply to reproduceintervals, deviation from benchmark interval width values wassubstantially greater.
Mixed-effects modelling
This second stage of analysis applied linear mixed-effectsmodelling to examine how midpoints and widths ofrespondent-provided intervals were influenced by three salientfactors that were visible to each respondent—two being puta-tive sources of interval width, representing disjunctive andconjunctive aspects, respectively. These factors were the pro-portion of visible marbles that were blue, the proportion ofmarbles that were hidden (i.e., epistemic uncertainty—dis-junctive), and the discrepancy in the visible number of blue
Fig. 7 Responses to questions regarding the natural lifespan of a royalpython and large dog (stated as 20–30 and 8–12 years—see Fig. 3).Panels a and b—showing all interval-valued responses. Panels c and
d—IAA plots showing aggregated interval-valued responses (roundedto nearest response integer)
Behav Res

marbles between rows (i.e., ontic range—conjunctive)—thiswas proportional to the maximum possible discrepancy, ofseven. This analysis was conducted separately for the depen-dent variables of midpoint and width—each also representedas a proportion of the size of the entire response scale.
These three factors were entered into each model, along-side three two-way interaction terms. Two random interceptswere also incorporated, one for participants and another forquestionnaire items. These allow the models to account fordiffering baseline positions and widths between subjects andbetween items. Models were estimated using the restrictedmaximum likelihood method, by means of the fitlmeMATLAB function. The model formula to explain intervalmidpoint (γmi; j ) and interval width (γwi; j ) captured by γzi; jwas therefore as follows:
γzi; j ¼ bz0 þ bz1xBi; j þ bz2x
Hi; j þ bz3x
Di; j þ bz4x
Bi; j*x
Hi; j þ bz5x
Bi; j*x
Di; j
þ bz6xDi; j*x
Hi; j þ μi þ μ j þ εi; j
where z represents the outcome variable, which may be eithermidpoint (m) or width (w) for participant i on item j. b0 de-notes the fixed intercept, while μi and μj denote respectiverandom intercepts for participant and questionnaire item.The remaining b terms denote the coefficients of the six re-spective fixed effects: proportion of visible marbles that wereblue xB, proportion of hidden marbles xH, the discrepancy inblue marbles visible between rows xD, plus two-way interac-tion terms. xi, j represents the observation for each participantand item, and εi, j the error term. Results are shown in Tables 1and 2.
Regarding the midpoint of participant estimates, resultsindicate that this increased directly in line withthe proportion of blue marbles (of those visible), and at a 1:2ratio with the number of hidden marbles—consistent withparticipants assuming a 50% likelihood of each hiddenmarblebeing blue. The two-way interaction term between these twovariables closely compensates for overestimation in caseswhere there is both a high proportion of blue visible marblesand a high proportion of hidden marbles (i.e., this effect reg-ulates the effect of proportion of visible marbles that were blueaccording to the proportion of total marbles that were visible,such that the midpoint increases in line with the proportion oftotal marbles that were blue). Interestingly, a greater discrep-ancy between rows also led to higher average estimates, al-though this effect was ameliorated in cases with a high pro-portion of either hidden or blue visible marbles.
Regarding the widths of participant estimates, results indi-cate that these increased in direct proportion to the observeddiscrepancy between rows, but at only an approximately 4:5ratio with the number of hidden marbles. Note that the upper95% confidence interval of the latter effect is below 1—indicating that this tendency to underestimate uncertaintyconcerning hidden marbles was statistically significant. Thetwo-way interaction term between these two variables indi-cates that the combined effect of hidden marbles and visiblediscrepancy is also less than the sum of its parts. This is con-sistent with two potential explanations: first, that respondentsfind it difficult to integrate conjunctive and disjunctive sourcesof interval width—i.e., the presence of between-row variabil-ity detracts from accurate uncertainty reporting, exacerbatingthe general tendency to underestimate this; second, that whenmore marbles are hidden from view, it is reasonable to giveless weight to observed discrepancies, as these may yet ‘bal-ance out’ when the hidden marbles are revealed—but as moremarbles become visible it becomes increasingly likely that anyvisible discrepancy will be reflected in the final set. All effectsrelating to the proportion of blue visible marbles were foundnot to have any significant effect on response widths.
Section 3: Generating subjective intervals
The purpose of this section was to examine how respondentsused intervals to describe and communicate their own subjec-tively perceived uncertainty about, or range inherent in, theappropriate response, arising from the phrasing or subject of agiven question. For this section, a variety of statistical analy-ses were applied, as appropriate, to examine differences inresponses between items within each of the different subsec-tions. Note that ANOVA model residuals were consistentlyfound to violate the normality assumption. Therefore, we alsoperformed non-parametric robustness checks in each case,based upon Monte Carlo resampling (10,000 samples).
Fig. 8 Showing mean interval widths for each Section 2 stimulus, toillustrate the combined effects of withheld information (hidden marbles)and stimulus variability (discrepancy between rows) on the widths ofresponse intervals. ‘F.D.’ (final discrepancy) represents the maximumdiscrepancy in the number of blue marbles between any two rows ofmarbles in the ‘final’ set—i.e., once all marbles are visible. Error barsshow 95% CIs
Behav Res

Results were found to match the parametric test outcome inevery instance, and are detailed in Appendix 3.
First, we assessed questions deliberately worded in a moreor less specific manner—relating to subjective estimates oftemperature in England—to establish whether intervalsreflected (and could be used to identify) this level of specific-ity. One-way repeated-measures ANOVAs revealed signifi-cant effects of specifying time of year upon both interval mid-points,F(2.079,81.093) = 75.528, p < .001, η2p = .659, and in-terval widths, F(2.260,88.141) = 18.015, p < .001, η2p = .316.
Specifically, the results showed significantly higher absolutetemperature estimates for July, and lower for December, aswell as significantly lower interval widths for both of thesemonths, by contrast with two questions (asked before and afterthe month-specific questions) that did not specify a time ofyear.
Second, we examined whether intervals could discriminatea question with ambiguously interpretable phrasing from anunambiguous question, in this case relating to hypotheticalincreases in percentage recycling rates. Bootstrapped paired-
Table. 1 Showing effects of salient factors on position (midpoint) of response intervals
Fixed effects estimates: DV midpoints b SE 95% CI t p
Intercept .006 .014 −.022, .034 .437 .662
Blue – xBi; j� �
.979 .030 .920, 1.037 32.785 <.001
Hidden – xHi; j� �
.494 .024 .446, .542 20.238 <.001
Discrepancy – xDi; j� �
.389 .036 .319, .459 10.911 <.001
Blue * Hidden – xBi; j*xHi; j
� �−.985 .047 −1.078, −.893 −20.946 <.001
Blue * Discrepancy – xBi; j*xDi; j
� �−.472 .091 −.652, −.293 −5.163 <.001
Discrepancy * Hidden – xDi; j*xHi; j
� �−.145 .071 −.285, −.005 −2.034 .042
Random effects estimates μ
Participant intercept – (μi) .018 .011, .031
Question intercept – (μj) .008 .002, .041
Residual – εi, j .089 .084, .093
Number of observations = 720, AIC = −1365.9, BIC = −1320.2
Table. 2 Showing effects of salient factors on size (width) of response intervals
Fixed effects estimates: DV widths b SE 95% CI t p
Intercept .004 .055 −.105, .112 .069 .945
Blue – xBi; j� �
.012 .104 −.191, .216 .119 .906
Hidden – xHi; j� �
.783 .085 .616, .950 9.222 <.001
Discrepancy – xDi; j� �
.994 .124 .751, 1.237 8.031 <.001
Blue * Hidden – xBi; j*xHi; j
� �.005 .163 −.315, .327 .034 .973
Blue * Discrepancy – xBi; j*xDi; j
� �−.335 .318 −.959, .289 −1.053 .293
Discrepancy * Hidden – xDi; j*xHi; j
� �−.888 .247 −1.374, −.402 −3.590 <.001
Random effects estimates μ
Participant intercept – (μi) .165 .130, .209
Question intercept – (μj) .047 .026, .086
Residual – εi, j .199 .189, .211
Number of observations = 720, AIC = −120.5, BIC = −74.8
Behav Res

samples t tests—used due to violations of normality—revealed significantly higher average interval midpoints whenrespondents were asked to ‘increase [10%] by 50%’ thanwhen asked to ‘double’ this same initial rate, p = .016.However, despite mean interval width being approximatelythree times the size for the former question (.33 vs .11), thisdifference was not found to be statistically significant,p = .161. These results are consistent with a bimodal distribu-tion for the percentage question, comprising groups of respon-dents who interpreted ‘increase by 50%’ differently—i.e.,some interpreted it as a 50-percentage-point increase, leadingto a higher average response midpoint than the ‘double’ ques-tion. The results do not however provide evidence that indi-vidual respondents commonly identified and reported the po-tential ambiguity in the question. These interpretations aresupported by descriptive results showing the actual intervalresponse distributions (see Fig. 9).
Third, we examined whether intervals could identify ques-tions within which a word was not understood by therespondent—likely to be of particular concern when design-ing surveys aimed at non-native speakers—in this case itemsrelated to personality characteristics. Two separate 4 × 3repeated-measures factorial ANOVAs were conducted, withdependent variables of interval midpoint and width, respec-tively. Independent variables were characteristic (four levels:talkative, aggressive, lazy, quiet) and word frequency (threelevels: high, low, and pseudo-word—see Questionnaire itemssection for more detail)—note that the four pseudo-wordswere randomly allocated between characteristic conditions.For interval midpoints, significant main effects were foundfor both characteristic, F(2.386,93.056) = 5.250, p = .004,η2p = .119, and word frequency, F(1.684,65.686) = 7.352,p = .002, η2p = .159, as well as a significant two-way interac-tion term, F(3.466,135.180) = 8.900, p < .001, η2p = .186. Forinterval widths, there was a significant main effect of wordfrequency, F(1.556,60.680) = 59.922, p < .001, η2p = .606,but neither a significant main effect of characteristic, F < 1.0,nor a significant two-way interaction, F(4.332,168.941) =1.166, p = .328. These findings reflect that respondents tendedto identify with certain characteristics more than others. Also,on average, they were more likely to disagree with real words,but this was not the case for all characteristics—e.g., ‘How welldoes the [high-frequency] word talkative describe you?’ re-ceivedmore agreement than both its low-frequency counterpart‘garrulous’ and control pseudo-word ‘brendacious’. Regardinginterval widths, these were largest for pseudo-words, becomingprogressively smaller for real but low-frequency and then high-frequency words—in a pattern highly consistent with expectedlevels of word comprehension (Fig. 10).
Fourth, we used double- versus single-barrelled questionsto examine inmore depth whether intervals could discriminatebetween questions phrased precisely or more ambiguously.
The same approach was taken as previously: two separate4 × 3 repeated-measures factorial ANOVAs were conducted,with dependent variables of interval midpoints and widths,respectively. Independent variables were the general topic ofthe question (four levels: reading books and watching televi-sion vs watching and playing sport vs drinking tea and coffeevs cooking and eating) and the specific subject of the question(three levels: e.g., cooking and eating vs cooking vs eating).For interval midpoints, this revealed a significant main effectof topic, F(2.166,84.474) = 15.483, p < .001, η2p = .284, butno significant main effect of subject, F < 1.0, and no signifi-cant two-way interaction, F(3.254,126.887) = 1.011, p = .395.By contrast, for interval widths, this revealed a significantmain effect of subject, F(1.428,55.687) = 14.375, p < .001,η2
p = .269, but no significant main effect of topic,F(2.411,94.022) = 2.257, p = .100, or a significant two-wayinteraction, F( < 1.0). These results reflect significant differ-ences in overall liking between topics, but not between thespecific subjects within each topic. Nonetheless, significantlybroader intervals were provided for more ambiguous double-barrelled items than for their single-barrelled counterparts(Fig. 11).
Fifth, we examined judgements regarding the definition ofstimuli falling within more or less ambiguous categories—inthis case images of sets of eight vehicles, of which a poten-tially disputable number could be classified as ‘cars’ (see Fig.5, both panels). Two further 2 × 2 repeated-measuresANOVAs were conducted, with respective dependent vari-ables of interval midpoints and widths. In this case, indepen-dent variables were the specific image stimulus used (i.e., Fig.5, panel a vs b), and the clarity of the category over which ajudgement was made (i.e., cars vs vehicles). For interval mid-points, significant within-subject main effects were found forboth image stimulus, F(1,39) = 99.194, p < .001, η2p = .718,and clarity of category, F(1,39) = 85.403, p < .001,η2p = .687, as well as a significant two-way interaction,F(1,39) = 99.545, p < .001, η2p = .719. These indicate that agreater number of stimuli were judged to be vehicles than carsin each image, and also that a greater number of stimuli werejudged to be cars in the second image (Fig. 5, panel b), but anequal number were judged to be vehicles in each image. Forinterval widths, a significant main effect of category claritywas found, F(1,39) = 7.374, p = .010, η2p = .159, but nei-ther a significant main effect of image stimulus, F(1,39) =1.746, p = .194, nor a significant interaction term, F( <1.0). These reflect that broader intervals were providedfor the relatively ambiguous category ‘cars’, across bothimage conditions, than for the more clearly inclusive cate-gory ‘vehicles’.
Sixth, and finally, we examined perceptual judgementsover more or less ambiguous image stimuli in anothercontext—coloured marbles (see Fig. 6, all panels). Two one-
Behav Res

way ANOVAs were conducted, with dependent variables ofinterval midpoint and width, respectively. For interval mid-points, a significant effect of stimulus was found,F(1.498,58.418) = 12.889, p < .001, η2p = .248. The highestinterval midpoints were provided for the colour-gradient setof marbles (panel b: M = 54.74), followed by the solid colourset (panel a: M = 50.21), and finally the patterned set (panel c:M = 42.05). Post hoc paired-samples t tests were conducted toexamine paired differences; these were bootstrapped (10,000samples) to ensure robustness to violations of normality.
These revealed both increments to be statistically significant:p = .011 and p = .005. For interval widths, a significant effectof stimulus was also found, F(1.490,58.126) = 14.196,p < .001, η2p = .267. The widest intervals were drawn for thepatterned marble set (panel c: M = 20.56), followed by thecolour-gradient set (panel b: M = 10.29), and the smallest in-tervals for the unambiguous, solid colours set (panel a: M =1.90). Again, bootstrapped post hoc paired-samples t tests(10,000 samples) revealed each increment to be statisticallysignificant: p = .014 and p = .010. This finding indicates that
Fig. 9 Responses to questions regarding hypothetical increases in recycling rates (beginning at 10%). Panels a and b—showing all interval-valuedresponses. Panels c and d—IAA plots showing aggregated interval-valued responses (rounded to nearest response integer)
Fig. 10 Showing mean interval midpoints (panel a) and widths (panel b) for each of the 12 personality questions. Error bars show 95% CIs
Behav Res

the width of participants’ response intervals reflected the de-gree of uncertainty induced by each stimulus, as hypothesised.Results, illustrated using the IAA method, are shown in Fig.12.
Subjective feedback
After finishing the main questionnaire, participants completedfour subjective feedback questions, designed to assess their
perceptions of the interval-valued response format. Thesewere obtained using a traditional 5-point ordinal responsescale (ranging from 1—Strongly Disagree, to 5—StronglyAgree). Descriptive results are shown in Table 3. By compar-ison with the midpoint of the response scale (3.00), theseindicate significant agreement with the ellipse response modebeing easy to use, allowing effective communication of de-sired responses, and being liked overall, but significant dis-agreement with it being unnecessarily complex.
Fig. 11 Showing mean interval midpoints (panel a) and widths (panel b) for each of the 12 double- vs single-barrelled questions. Error bars show 95%CIs
Fig. 12 Responses to questions concerning the number of blue marbles contained in stimuli shown in Fig. 6. Panels a, b, and c—showing all interval-valued responses. Panels d, e, and f—IAA plots showing aggregated interval-valued responses (rounded to nearest response integer)
Behav Res

Discussion
The present study applied empirical methods to test theefficacy of a novel interval-valued survey response mode,in terms of capturing uncertainty and range in individualresponses, arising from multiple sources. Capturing theseis unfeasible using conventional discrete or point-valuedresponse formats, such as Likert-type and visual analoguescales, without asking specific follow-up questions, at thecost of substantially increased questionnaire duration andcomplexity. By contrast, we hypothesised that the pro-posed interval-valued response mode—which can now beadministered digitally with a high degree of efficiency—can achieve this effectively, within a single coherent re-sponse, by providing participants with an additional di-mension to their answers. Specifically, this response for-mat enables respondents to vary the width of an interval, inthe form of an ellipse drawn along a continuous scale,according to how certain and specific they wish to indicateeach answer to be.
The core aim of this study was to determine whether theproposed interval-valued response mode is capable of system-atically capturing vagueness and uncertainties in individualresponses. This was done by examining interval-valued re-sponses to questions of a specially designed survey, withinwhich respondent knowledge (e.g., information availability),question clarity, and inherent variability in the correct re-sponse were each experimentally manipulated. In operationalterms, it was hypothesised that variance in respondents’ inter-val widths would reliably reflect induced between-item vari-ance in each of these factors.
Results consistently indicated in the affirmative, across avariety of contexts. In the first section of the survey, respon-dents used interval widths to effectively replicate observeddifferences in ranges of expected lifespan between animalspecies—accurately representing both facets of the data pre-sented to them in interval format. This demonstrates the prac-tical utility of this response mode as a quick and coherentmethod enabling participants to provide answers that inher-ently comprise a range (i.e., conjunctive sets). It also suggeststhat the response mode enables individuals to respond reliablyin this context, even though this was not explicitly tested (e.g.,through a test–retest design), and will require future study.
In the second section of the survey, respondents’ intervalswere found to consistently reflect their degree of uncertaintyabout a set of stimuli, in terms of information hidden from them,as well as inherent variability observed between cases within agiven set. We note that the former here would result in a dis-junctive set, representing the (lack of) knowledge of a truevalue, while the latter results in a conjunctive set describingan actual range of values (as no single discrete answer is cor-rect). In turn, it is interesting to note that while each of thesefactors significantly contributed to response widths, results in-dicated that participants tended to substantially underestimatethe former in their response intervals, mirroring a large body ofevidence for overconfidence in probabilistic interval estimates(cf. Juslin et al., 1999; Klayman et al., 1999; Soll & Klayman,2004; Speirs-Bridge et al., 2010; Tversky & Kahneman,1974; Yaniv & Foster, 1995, 1997). By contrast, we found nosuch evidence for underestimation of conjunctive responseranges—which appeared well-calibrated. That is, while inter-vals provided did not tend to encompass all possible outcomeswhen a proportion of the set was hidden, they did closely rep-resent the full range of observed outcomes within a set—at leastwhen a high proportion of marbles were visible. This effect wasevident in certain cases as an otherwise incongruous increase inmean interval widths corresponding to an increase in availableinformation, as greater disparity was revealed within a set thanmay have been expected (see Fig. 8, sets 4 and 6). Futureresearch might be able to leverage a conjunctive set framingas a pathway to reducing overconfidence.
It was also found that when there was a high amount of bothhidden information and stimulus variability, this led to furtherunderestimation of total response width; this may reflect partic-ipants’ difficulty in dealing with these two sources of intervalwidth together (i.e., forcing them to effectively integrate dis-junctive and conjunctive sets), exacerbating the existing tenden-cy to underestimate epistemic uncertainty. Alternatively, it mayreflect a deliberate interaction between the two factors, wherebylower information about the set of stimuli leads to lower confi-dence in the reliability of any variability that is currentlyobserved—that is, participants may have assumed that observeddiscrepancies were more likely to even out once more hiddenmarbles were revealed than they were to increase.
On the whole, these findings demonstrate the capacity ofthe proposed response format to efficiently capture and quan-tify degrees of both disjunctive and conjunctive range inresponses—although it is not designed to discriminate thetwo. This could prove valuable across a wide range of circum-stances where assessments of real-world variables, solicitedfrom experts or the broader population, are crucial to makingpredictions and informing subsequent policy, strategy, or in-vestment decisions—e.g., political polling, supplier selection,marketing, environmental planning, cyber-security (i.e., vul-nerability), and other risk or impact assessments. Likewise, inthe context of social, behavioural, and psychological research,
Table. 3 Showing user feedback regarding the ellipse-based interval-valued response format
Question Mean SE
Easy to use 4.18 .13
Unnecessarily complex 2.05 .14
Effectively communicate 4.35 .15
Overall liking 4.53 .10
Behav Res

intervals may facilitate richer capture and understanding ofparticipants’ preferences, attitudes, or choices, consideringthe relevant information available to them, and in combinationwith more subjective factors such as beliefs and their associ-ated confidence or conviction. Intervals also provide the nec-essary information to guide potential follow-on qualitativeresearch stages, such as to explore the underlying originsand drivers of uncertainties or ambiguities once they havebeen identified.
In the third section of the survey, respondents were found tosystematically vary their interval sizes across a broader range ofsituations—each relating to their degree of subjective uncertain-ty, induced by the wording of the question or its associatedstimulus. Participants drew significantly smaller intervals torepresent temperature estimates for specific months than fornon-time-specific questions. But while respondents were incon-sistent in their interpretations of a deliberately ambiguous ques-tion (‘increase [10%] by 50%’), only a minority explicitlyrecognised and communicated the potential ambiguity in theirresponse by providing a range from 15% to 60%. When pre-sented with personality judgements concerning adjectives ofvarying degrees of obscurity, interval widths reflected wordfrequency in the manner expected. For high-frequency words,interval widths fluctuated between respondents and questions,but these remained relatively small compared with the otherconditions, with no respondents circling the entire scale. Forlow-frequency words, mean widths were substantially greater,indicating uncertainty, with approximately half of responsescovering the entire response scale, indicating that the appropri-ate response was unknown. For fabricated pseudo-words, thismethod of indicating complete uncertainty became the majorityresponse—although it is worth noting that some respondentsdid select only the centre point in these cases. It is likely thatthese participants reverted to a habitualised response, as wouldbe given on a discrete response scale. This may be a greaterproblem over longer questionnaires, for which response fatiguemay increase this effect—but it can be expected that, as theinterval-valued response mode becomes more widely used, fa-miliarity with this format will overcome any inertia workingagainst its appropriate use.
In addition to this, interval widths for double-barrelledquestions were also found to be significantly broader thanthose for their more specific single-barrelled counterparts.Furthermore, questions requiring judgement over stimuluscategory membership found significantly broader intervalsfor a contextually ambiguous category term (car) than for amore clearly inclusive term (vehicle). Likewise, signifi-cantly larger intervals were provided for membership ofthe same category term (blue) when the stimuli over whichthe judgement was made were less clearly classifiable. Thesecases highlight the potential for interval-valued responses toidentify questions which respondents struggle tounderstand—whether due to unclear stimuli or imprecise
question wording. This capability could be of great value,for example in questionnaire pretesting, particularly in caseswhere a questionnaire will be taken by non-native speakers.
Participants’ subjective feedback was also collected andassessed. This was found to be generally positive on all fourquestions asked—consistent with findings in other contexts(Ellerby et al., 2020; Ellerby & Wagner, 2021). On average,respondents agreed both that the response format was easy touse and that it allowed them to effectively communicate theirdesired response, while they disagreed that it was unnecessar-ily complex. Overall liking received greater agreement thanany of the more specific questions, which may be due to somerespondents having been more uncertain in their responses tothe subcomponents, as a result of their greater complexity.Ironically, capturing interval-valued feedback rather thanusing a traditional discrete response scale may have shedmorelight on this effect.
Summary and future work
To summarise, in the present paper we put forward andempirically examine a new ellipse-based questionnaire re-sponse format. This is designed to capture interval-valueddata with a focus on efficiency and user experience, in-cluding through increasingly ubiquitous information tech-nologies, minimising the time and effort requirements forboth survey respondents and administrators. First, wepresent a case for the potential added value of this re-sponse mode, by contrast with conventional alternatives.Here, we identify three primary situations in whichinterval-valued responses might capture new and valuableinformation: where responses inherently comprise a rangeof values, where they are uncertain due to a lack ofknowledge about the correct answer, and where they areambiguous, or otherwise uncertain, due to imprecision orill-definition in either the question or associated stimulus.
Following this, we document a validation study withinwhich interval-valued responses are collected across a rangeof questionnaire items—designed to exemplify each of thethree cases described above. Interval widths were found tosystematically reflect experimentally induced differences be-tween items, in relation to each of these factors. These find-ings provide a basis of empirical evidence for the efficacy andpractical value of this new interval-valued response mode, butfurther research is needed to determine the extent to whichthese generalise—assessing the impact of individual, or sam-ple, differences on the realisation of this value in practice; aswell as exploring the effects of variations in interval-valuedscale design upon outcomes including data fidelity, reliability,and participant workload.
Future work is also required to more thoroughly explorethe broad range of potential benefits offered by thisinformation-rich type of response—as well as to establish
Behav Res

how to best retain and interpret this additional information,through development of novel methods of statistical analysis,which may build upon a broad body of existing work acrossacademic disciplines including symbolic data analysis, inter-val arithmetic, interval ranking, fuzzy sets, and interval aggre-gation through fuzzy integrals (cf. Anderson et al., 2014;Billard, 2006; Billard & Diday, 2004; Ferson et al., 2007;Liu & Mendel, 2008; McCulloch et al., 2019; Miller et al.,2012; Nguyen et al., 2012; Wagner et al., 2013; Wagner et al.,2015; Wu et al., 2012). Another practical concern remains indemonstrating the efficacy of this approach across a broadervariety of real-world contexts—expanding upon a growingbody of research (cf. Ellerby et al., 2019a, 2020; Navarroet al., 2016; Wallace et al., 2016). Finally, it is important thatfuture empirical research is conducted to directly compare thisinterval-valued response mode against existing methods ofboth lower (e.g., Likert, VAS) and higher complexity (e.g.,multi-step interval elicitation, SHELF, FRS)—to establish andquantify the trade-offs between information capture and im-portant practical concerns regarding response efficiency (i.e.,
workload, survey duration, perceived complexity, training re-quirements), which have a large influence on likelihood ofbroader adoption.
Appendix 1: Instructions for the ellipseresponse mode
Thank you for agreeing to take part in this experiment.This task is designed to assess how well people are
able to respond using a newly developed survey re-sponse-format. Here, responses are made by drawing el-lipses on a continuous scale, instead of picking a singleresponse option. How to use this type of response-formatis explained below, with examples. Please read this infor-mation carefully and ask the experimenter if you have anyquestions.
Behav Res

Appendix 2: Survey instructions (text content)
There will be three sections to this survey, each with slightlydifferent tasks. Examples of how you can respond are provid-ed for each.
Section 1: Here you will be provided with a chart, showingthe life expectancies of different animals. In a series of ques-tions, you will be asked to correctly identify the life expectan-cy of an animal from this chart, and to communicate this asaccurately as you can, through drawing an ellipse on the scaleprovided.
Section 2: Here, you will be shown a series of sets ofmarbles. Each set will be made up of 5 rows of 7 marbleseach, but some may be hidden. All marbles will be either blueor yellow, and you will be asked to estimate the number ofblue marbles that are in each row. You will only make oneestimate per set of marbles (5 rows). If anymarbles are hidden,then you should make your estimate including these hiddenmarbles. You can illustrate your degree of uncertainty usingthe width of the ellipse.
Section 3: Here, you will be asked a series of more variedquestions. Respond as you feel appropriate, applying the sameapproach as in the previous sections.
Please indicate when you have read and fully understoodthis information sheet, and you are ready to proceed. Ask theexperimenter if you have any further questions.
Appendix 3: Monte Carlo ANOVA results(robustness checks)
Time of year, one-way (4-level) ANOVAsMidpoints p < .001Widths p < .001Personality words, 4×3 ANOVAsMidpoints: Characteristic p = .002, Word Freq. p < .001,
Int. p < .001Widths: Characteristic p = .638, Word Freq. p < .001, Int.
p = .318Double-barrelled questions, 4×3 ANOVAsMidpoints: Topic p < .001, Subject p = .398, Int. p = .414Widths: Topic p = .082, Subject p < .001, Int. p = .632Vehicle questions, 2×2 ANOVAsMidpoints: Stimulus p < .001, Category Clarity p < .001,
Int. p < .001Widths: Stimulus p = .190, Category Clarity p = .004, Int.
p = .359Marble questions, one-way (3-level) ANOVAsMidpoints p < .001Widths p < .001
Acknowledgement This research was partially supported byUK Research and Innovation, Engineering and Physical SciencesResearch Council [research grants EP/P011918/1 & EP/M02315X/1].
Open Practices Statement The DECSYS software used to implementthe survey documented in this paper is accessible via .https://www.lucidresearch.org/decsys.html. The software is hosted on GitHub toinvite community engagement and contributions under the open-sourceGNU Affero licence. Full code and documentation are stored at thefollowing repository https://github.com/decsys/decsys.
Interval-valued data and commented code for extraction and creationof IAA charts and interval plots—as shown in Figs. 7, 9 & 12—are storedat https://osf.io/pb4ne/ to provide a working example of this process.Further data and study materials are also available via the same link,including original survey stimuli. The experiment was not preregistered.
Open Access This article is licensed under a Creative CommonsAttribution 4.0 International License, which permits use, sharing, adap-tation, distribution and reproduction in any medium or format, as long asyou give appropriate credit to the original author(s) and the source, pro-vide a link to the Creative Commons licence, and indicate if changes weremade. The images or other third party material in this article are includedin the article's Creative Commons licence, unless indicated otherwise in acredit line to the material. If material is not included in the article'sCreative Commons licence and your intended use is not permitted bystatutory regulation or exceeds the permitted use, you will need to obtainpermission directly from the copyright holder. To view a copy of thislicence, visit http://creativecommons.org/licenses/by/4.0/.
References
Ahearn, E.P. (1997). The use of visual analog scales inmood disorders: Acritical review. Journal of Psychiatric Research, 5, 569-579.
Aitken R.C. (1969). Measurement of feelings using visual analoguescales. Proceedings of the Royal Society of Medicine, 62:989–993.
Aldrich, J., Niemi, R., Rabinowitz, G., & Rohde, D. (1982). The mea-surement of public opinion about public policy: A report on somenew issue question formats. American Journal of Political Science,26(2), 391–414. https://doi.org/10.2307/2111047.
Anderson, D. T., Havens, T. C., Wagner, C., Keller, J. M., Anderson, M.F., & Wescott, D. J. (2014). Extension of the fuzzy integral forgeneral fuzzy set-valued information. IEEE Transactions on FuzzySystems, 22(6), 1625-1639.
Baranski, J. V., & Petrusic, W. M. (1998). Probing the locus of confi-dence judgments: Experiments on the time to determine confidence.Journal of Experimental Psychology: Human Perception andPerformance, 24, 929 –945
Behrend, T. S., Sharek, D. J., Meade, A. W., &Wiebe, E. N. (2011). Theviability of crowdsourcing for survey research. Behavior researchmethods, 43(3), 800.
Billard, L. (2006). Symbolic data analysis: what is it?. In Rizzi, A., Vichi,M. (eds.),Compstat 2006 - Proceedings in Computational Statistics.Physica-Verlag HD. https://doi.org/10.1007/978-3-7908-1709-6_20.
Billard, L., & Diday, E. (2004). Symbolic data analysis: Definitions andexamples. https://basepub.dauphine.fr/handle/123456789/6895.
Birch, J. (2012). Worldwide prevalence of red-green color deficiency.JOSA A, 29(3), 313-320.
Bishop, P. A., Herron R.L. (2015). Use and misuse of the Likert itemresponses and other ordinal measures. International Journal ofExercise Science, 8:297–302.
Blaikie N. (2003). Analysing Quantitative Data. Sage Publications.Boone, H. N., & Boone, D. A. (2012). Analyzing Likert data. Journal of
extension, 50(2), 1–5.Brooke, J. (1996). SUS-A quick and dirty usability scale. Usability eval-
uation in industry, 189(194), 4-7.
Behav Res

Brugnach, M., Dewulf, A., Pahl-Wostl, C., & Taillieu, T.(2007). Towards a relational concept of uncertainty: incorporatingthe human dimension. 1-25. In: International Conference inAdaptive and Integrated Water Management, Coping with complex-ity and uncertainty. http://www.newater.uos.de/caiwa/data/papers%20session/B4/2007-10-22%20Brugnach%20et%20al.2007-Caiwa.pdf.
Bruine de Bruin, W., Manski, C. F., Topa, G., & Van Der Klaauw, W.(2011). Measuring consumer uncertainty about future inflation.Journal of Applied Econometrics, 26(3), 454–478.
Budescu, D. V., &Wallsten, T. S. (1985). Consistency in interpretation ofprobabilistic phrases. Organizational Behavior and HumanDecision Processes, 36(3), 391-405.
Budescu, D. V., &Wallsten, T. S. (1995). Processing linguistic probabil-ities: General principles and empirical evidence. In: Psychology ofLearning and Motivation (Vol. 32, pp. 275-318). Academic Press.
Budescu, D. V., Broomell, S., & Por, H. H. (2009). Improving commu-nication of uncertainty in the reports of the Intergovernmental Panelon Climate Change. Psychological science, 20(3), 299-308.
Burden, B. C. (1997). Deterministic and probabilistic voting models.American Journal of Political Science, 41, 1150-1169.
Carifio J, Perla R.J. (2007). Ten Common Misunderstandings,Misconceptions, Persistent Myths and urban legends about Likertscales and Likert response Formats and their Antidotes. Journal ofSocial Sciences, 3(3):106.
Carifio J, Perla R.J. (2008). Resolving the 50-year Debate Around usingandMisusing Likert Scales.Medical Education, 42(12):1150–1152.
Cheesman, J., & Merikle, P. M. (1984). Priming with and without aware-ness. Perception & Psychophysics, 36, 387-395.
Cloud, M. J, Moore, R. E, Kearfott, R.B. (2009). Introduction to IntervalAnalysis. Philadelphia: Society for Industrial and AppliedMathematics (SIAM). ISBN 0-89871-669-1.
Cohen, J. (1988). Statistical Power Analysis for the Behavioral Sciences(2nd ed.). Routledge.
Converse, J. M., & Presser, S. (1986). Survey questions: Handcrafting thestandardized questionnaire (Vol. 63). Sage.
Cooke, R. (1991). Experts in uncertainty: opinion and subjective proba-bility in science. Oxford University Press on Demand.
Coombs, C. H., & Coombs, L. C. (1976). “Don't Know” Item Ambiguityor Respondent Uncertainty? Public Opinion Quarterly, 40(4), 497-514.
Couper, M., Tourangeau, R., Conrad, F., & Singer, E. (2006). Evaluatingthe effectiveness of visual analog scales: A web experiment. SocialScience Computer Review, 24, 227-245.
Couso, I., & Dubois, D. (2014). Statistical reasoning with set-valuedinformation: Ontic vs. epistemic views. International Journal ofApproximate Reasoning, 55(7), 1502-1518.
Cubitt, R. P., Navarro-Martinez, D., & Starmer, C. (2015). On preferenceimprecision. Journal of Risk and Uncertainty, 50(1), 1-34.
Dawes J. (2008). Do Data Characteristics Change According to theNumber of Scale Points Used? An experiment Using 5 point, 7 pointand 10 Point Scales. International Journal of Market Research, 50,61-104.
Dewulf, A., Craps, M., Bouwen, R., Taillieu, T., & Pahl-Wostl, C.(2005). Integrated management of natural resources: dealing withambiguous issues, multiple actors and diverging frames. Water sci-ence and technology, 52(6), 115-124.
Dienes, Z., Altmann, G. T. M., Kwan, L., & Goode, A. (1995). Un-conscious knowledge of artificial grammars is applied strategically.Journal of Experimental Psychology: Learning, Memory, &Cognition, 21, 1322-1338.
Dubois, D., & Prade, H. (2012). Gradualness, uncertainty and bipolarity:making sense of fuzzy sets. Fuzzy sets and Systems, 192, 3-24.
Ellerby, Z. W., & Tunney, R. J. (2017). The Effects of Heuristics andApophenia on Probabilistic Choice. Advances in CognitivePsychology, 13(4), 280.
Ellerby, Z., & Tunney, R. (2019). Probability Matching on a SimpleSimulated Foraging Task: The Effects of Reward Persistence andAccumulation on Choice Behaviour. Advances in CognitivePsychology, 15(2), pp. 37-52.
Ellerby, Z., & Wagner, C. (2021). Do People Prefer to Give Interval-Valued or Point Estimates and Why? In 2021 IEEE InternationalConference on Fuzzy Systems (FUZZ-IEEE). IEEE.
Ellerby, Z., McCulloch, J., Wilson, M., &Wagner, C. (2019a). Exploringhow component factors and their uncertainty affect judgements ofrisk in cyber-security. In S. Nadjm-Tehrani, (Ed.), CriticalInformation Infrastructures Security. CRITIS 2019. Lecture Notesin Computer Science (Vol. 11777). Cham: Springer. https://doi.org/10.1007/978-3-030-37670-3_3.
Ellerby, Z., McCulloch, J., Young, J., & Wagner, C. (2019b). DECSYS–Discrete and Ellipse-based response Capture SYStem. In 2019 IEEEInternational Conference on Fuzzy Systems (FUZZ-IEEE). IEEE.
Ellerby, Z., Miles, O., McCulloch, J., &Wagner, C. (2020). Insights frominterval-valued ratings of consumer products—a DECSYS apprais-al. In 2020 IEEE International Conference on Fuzzy Systems(FUZZ-IEEE). IEEE.
Faul, F., Erdfelder, E., Lang, A.-G., & Buchner, A. (2007). G*Power 3: Aflexible statistical power analysis program for the social, behavioral,and biomedical sciences. Behavior Research Methods, 39, 175-191.
Ferson, S., Kreinovich, V., Hajagos, J., Oberkampf, W., & Ginzburg, L.(2007). Experimental uncertainty estimation and statistics for datahaving interval uncertainty. Sandia National Laboratories, ReportSAND2007-0939. https://doi.org/10.2172/910198.
Fowler, F. J. (1995). Improving survey questions: Design and evaluation(Vol. 38). Sage.
Fox, C. R., & Ülkümen, G. (2011). Distinguishing two dimensions ofuncertainty. In Brun, W., Keren, G., Kirkebøen, G., &Montogomery, H. (eds) Perspectives on thinking, judging, and de-cision making (pp. 21–35). Oslo: Universitetsforlaget.
Freyd, M. (1923). The graphic rating scale. Journal of EducationalPsychology, 14, 83-102.
Gnambs, T., & Kaspar, K. (2015). Disclosure of sensitive behaviorsacross self-administered survey modes: a meta-analysis. Behaviorresearch methods, 47(4), 1237-1259.
Gosling, J. P. (2018). SHELF: The Sheffield Elicitation Framework. InDias, L., Morton, A., & Quigley, J. (eds), Elicitation. InternationalSeries in Operations Research & Management Science (Vol. 261).Cham: Springer. https://doi.org/10.1007/978-3-319-65052-4_4.
Graesser, A. C., Wiemer-Hastings, K., Kreuz, R., Wiemer-Hastings, P.,& Marquis, K. (2000). QUAID: A questionnaire evaluation aid forsurvey methodologists. Behavior Research Methods, Instruments,& Computers, 32(2), 254-262.
Groves, R. M., Fowler Jr, F. J., Couper, M. P., Lepkowski, J. M., Singer,E., & Tourangeau, R. (2011). Survey methodology (Vol. 561). JohnWiley & Sons.
Guyatt, G. H., Townsend, M., Berman, L. B., & Keller, J. L. (1987). Acomparison of Likert and visual analogue scales for measuringchange in function. Journal of chronic diseases, 40(12), 1129-1133.
Harris, A. J., Por, H. H., & Broomell, S. B. (2017). Anchoring climatechange communications. Climatic change, 140(3-4), 387-398.
Havens, T.C., Wagner, C., & Anderson, D.T. (2017). Efficient modelingand representation of agreement in interval-valued data. In 2017IEEE International Conference on Fuzzy Systems (FUZZ-IEEE).IEEE.
Hemming, V., Burgman, M. A., Hanea, A. M., McBride, M. F., &Wintle, B. C. (2018). A practical guide to structured expert elicita-tion using the IDEA protocol. Methods in Ecology and Evolution,9(1), 169-180.
Hesketh, B., McLachlan, K., & Gardner, D. (1992). Work adjustmenttheory: An empirical test using a fuzzy rating scale. Journal ofVocational Behavior, 40(3), 318-337.
Behav Res

Hesketh, T., Pryor, R., & Hesketh, B. (1988). An application of a com-puterized fuzzy graphic rating scale to the psychological measure-ment of individual differences. International Journal of Man-Machine Studies, 29(1), 21-35.
Jamieson S. (2004). Likert scales: how to (ab)use them. MedicalEducation, 38: 1212–1218.
Juslin, P., Wennerholm, P., & Olsson, H. (1999). Format dependence insubjective probability calibration. Journal of ExperimentalPsychology: Learning, Memory, and Cognition, 25(4), 1038.
Kabir, S., Wagner, C., & Ellerby, Z. (2021). Towards HandlingUncertainty-at-Source in AI–A Review and Next Steps for IntervalRegression. arXiv (preprint). https://arxiv.org/abs/2104.07245.
Kahneman, D., Slovic, P., & Tversky, A. (eds.). (1982). Judgment underuncertainty: Heuristics and biases. Cambridge University Press.
Karelitz, T. M., & Budescu, D. V. (2004). You say" probable" and I say"likely": improving interpersonal communication with verbal proba-bility phrases. Journal of Experimental Psychology: Applied, 10(1),25.
Klayman, J., Soll, J. B., Gonzalez-Vallejo, C., & Barlas, S. (1999).Overconfidence: It depends on how, what, and whom you ask.Organizational behavior and human decision processes, 79(3),216-247.
Klopfer, F. J., & Madden, T. M. (1980). The middlemost choice onattitude items: Ambivalence, neutrality, or uncertainty?.Personality and Social Psychology Bulletin, 6(1), 97-101.
Knapp T.R. (1990). Treating ordinal scales as interval scales: an attemptto resolve the controversy. Nursing Research, 39(2):121–123.
Krantz, J. H., & Reips, U. D. (2017). The state of web-based research: Asurvey and call for inclusion in curricula. Behavior researchmethods, 49(5), 1621-1629.
Krosnick, J. A. (1991). Response strategies for coping with the cognitivedemands of attitude measures in surveys. Applied cognitivepsychology, 5(3), 213–236.
Krosnick, J. A., & Fabrigar, L. R. (1997). Designing Rating Scales forEffective Measurement in Surveys. In Lyberg, L., Biemer, P.,Collins, M., De Leeuw, E., Dippo, C., Schwarz, N., & Trewin, D.(eds), Survey Measurement and Process Quality (pp. 141–164).https://doi.org/10.1002/9781118490013.ch6.
Kuhlmann, T., Dantlgraber, M., & Reips, U. D. (2017). Investigatingmeasurement equivalence of visual analogue scales and Likert-type scales in Internet-based personality questionnaires. Behaviorresearch methods, 49(6), 2173-2181.
Kuzon W.M., Urbanchek M.G., McCabe S. (1996). The Seven DeadlySins of Statistical Analysis. Annals of Plastic Surgery. 37(3):265–272.
Kwakkel, J. H.,Walker,W. E., &Marchau, V. A. (2010). Classifying andcommunicating uncertainties in model-based policy analysis.International journal of technology, policy and management,10(4), 299-315.
Likert R. (1932). A Technique for the Measurement of Attitudes.Archives of Psychology. 140: 1–55.
Liu, F., & Mendel, J. M. (2008). Encoding words into interval type-2fuzzy sets using an interval approach. IEEE Transactions on FuzzySystems, 16(6), 1503-1521.
Lubiano, M. A., de Sáa, S. D. L. R., Montenegro, M., Sinova, B., & Gil,M. Á. (2016). Descriptive analysis of responses to items in ques-tionnaires. Why not using a fuzzy rating scale?. InformationSciences, 360, 131-148.
Maydeu-Olivares, A., Kramp, U., García-Forero, C., Gallardo-Pujol, D.,& Coffman, D. (2009). The effect of varying the number of responsealternatives in rating scales: Experimental evidence from intra-individual effects. Behavior Research Methods, 41(2), 295-308.
McCulloch, J., Ellerby, Z., & Wagner, C. (2019). On Comparing andSelecting Approaches to Model Interval-Valued Data as FuzzySets. In 2019 IEEE International Conference on Fuzzy Systems(FUZZ-IEEE). IEEE.
McCulloch, J., Ellerby, Z., &Wagner, C. (2020). Choosing Sample Sizesfor Statistical Measures on Interval-Valued Data. In 2020 IEEEInternational Conference on Fuzzy Systems (FUZZ-IEEE). IEEE.
Meade, A. W., & Craig, S. B. (2012). Identifying careless responses insurvey data. Psychological methods, 17(3), 437.
Miller, S., Wagner, C., Garibaldi, J. M., & Appleby, S. (2012).Constructing general type-2 fuzzy sets from interval-valued data.In 2012 IEEE International Conference on Fuzzy Systems. IEEE.
Moore, R.E. (1966). Interval Analysis. Prentice-Hall. ISBN0-13-476853-1.
Morgan, M. G. (2014). Use (and abuse) of expert elicitation in support ofdecision making for public policy. Proceedings of the Nationalacademy of Sciences, 111(20), 7176-7184.
Morris, D. E., Oakley, J. E., & Crowe, J. A. (2014). A web-based tool foreliciting probability distributions from experts. EnvironmentalModelling & Software, 52, 1-4.
Navarro, J., Wagner, C., Aickelin, U., Green, L., & Ashford, R. (2016,July). Exploring differences in interpretation of words essential inmedical expert-patient communication. In: 2016 IEEE InternationalConference on Fuzzy Systems (FUZZ-IEEE) (pp. 2157-2164). IEEE.
Nguyen, H. T., Kreinovich, V., Wu, B., & Xiang, G. (2012). Computingstatistics under interval and fuzzy uncertainty. Springer Verlag.
Norman, G. (2010). Likert scales, levels of measurement and the “laws”of statistics. Advances in Health Science Education. https://doi.org/10.1007/s10459-010-9222-y
O’Hagan, A. (2019). Expert knowledge elicitation: subjective but scien-tific. The American Statistician, 73(sup1), 69-81.
Payne, S. L. B. (2014). The Art of Asking Questions: Studies in PublicOpinion, 3 (Vol. 451). Princeton University Press. (Original workpublished 1951).
Peirce, C. S., & Jastrow, J. (1884). On small differences of sensation.Memoirs of the National Academy of Sciences, 3, 75-83.
Petty, R. E., Briñol, P., & Tormala, Z. L. (2002). Thought confidence as adeterminant of persuasion: the self-validation hypothesis. Journal ofpersonality and social psychology, 82(5), 722.
Pleskac, T. J., & Busemeyer, J. R. (2010). Two-stage dynamic signaldetection: a theory of choice, decision time, and confidence.Psychological review, 117(3), 864.
Quirós, P., Alonso, J. M., & Pancho, D. P. (2016). Descriptive and com-parative analysis of human perceptions expressed through fuzzyrating scale-based questionnaires. International Journal ofComputational Intelligence Systems, 9(3), 450-467.
Reips, U.-D., Funke, F. (2008). Interval level measurement with visualanalogue scales in Internet-based research: VAS Generator.Behavior Research Methods, 40, 699–704.
Rucker, D. D., Tormala, Z. L., Petty, R. E., & Briñol, P. (2014).Consumer conviction and commitment: An appraisal-based frame-work for attitude certainty. Journal of Consumer Psychology, 24(1),119-136.
Saris, W. E., & Gallhofer, I. N. (2014). Design, evaluation, and analysisof questionnaires for survey research. John Wiley & Sons.
Schmidt, W. C. (1997). World-Wide Web survey research: Benefits,potential problems, and solutions. Behavior research methods, in-struments, & computers, 29(2), 274-279.
Soll, J. B., & Klayman, J. (2004). Overconfidence in interval estimates.Journal of Experimental Psychology: Learning, Memory, andCognition, 30(2), 299.
Speirs-Bridge, A., Fidler, F., McBride, M., Flander, L., Cumming, G., &Burgman, M. (2010). Reducing overconfidence in the interval judg-ments of experts. Risk Analysis: An International Journal, 30(3),512-523.
Sporer, S. L., Penrod, S., Read, D., & Cutler, B. (1995). Choosing, con-fidence, and accuracy: A meta-analysis of the confidence-accuracyrelation in eyewitness identification studies. Psychological Bulletin,118(3), 315.
Behav Res

Stevens S.S. (1946). On the Theory of Scales of Measurement. Science,103 (2684): 677–680.
Teigen, K. H., & Jorgensen, M. (2005). When 90% confidence intervalsare 50% certain: On the credibility of credible intervals. AppliedCognitive Psychology: The Official Journal of the Society forApplied Research in Memory and Cognition, 19(4), 455-475.
Thurstone, L. L., & Chave, E. J. (1929). The measurement of attitude: Apsychological method and some experiments with a scale for mea-suring attitude toward the church. University of Chicago Press.
Tunney, R. J., & Shanks, D. R. (2003). Subjective measures of awarenessand implicit cognition. Memory & Cognition, 31, 1060-1071
Tversky, A., & Kahneman, D. (1974). Judgment under uncertainty:Heuristics and biases. Science, 185(4157), 1124-1131.
Van Laerhoven, H., Van Der Zaag-Loonen, H. J., & Derkx, B. H. (2004).A comparison of Likert scale and visual analogue scales as responseoptions in children's questionnaires. Acta Paediatrica, 93(6), 830-835.
Vannette, D. L., & Krosnick, J. A. (2014). A comparison of surveysatisficing and mindlessness. The Wiley Blackwell handbook ofmindfulness, 1, 312.
Wagner, C., Miller, S., & Garibaldi, J. M. (2013). Similarity based appli-cations for data-driven concept and word models based on type-1and type-2 fuzzy sets. In 2013 IEEE International Conference onFuzzy Systems (FUZZ-IEEE). IEEE.
Wagner, C., Miller, S., Garibaldi, J.M., Anderson, D. T., &Havens, T. C.(2015). From interval-valued data to general type-2 fuzzy sets. IEEETransactions on Fuzzy Systems, 23(2), 248-269.
Walker, W. E., Harremoës, P., Rotmans, J., Van Der Sluijs, J. P., VanAsselt, M. B., Janssen, P., & Krayer von Krauss, M. P. (2003).
Defining uncertainty: a conceptual basis for uncertainty manage-ment in model-based decision support. Integrated assessment,4(1), 5-17.
Wallace, K. J., Wagner, C., & Smith, M. J. (2016). Eliciting humanvalues for conservation planning and decisions: a global issue.Journal of environmental management, 170, 160-168.
Winman, A., Hansson, P., & Juslin, P. (2004). Subjective probabilityintervals: how to reduce overconfidence by interval evaluation.Journal of Experimental Psychology: Learning, Memory, andCognition, 30(6), 1167.
Wright,W. D. (1952). The characteristics of tritanopia. JOSA, 42(8), 509-521.
Wu, D., Mendel, J. M., & Coupland, S. (2012). Enhanced interval ap-proach for encoding words into interval type-2 fuzzy sets and itsconvergence analysis. IEEE Transactions on Fuzzy Systems, 20(3),499-513.
Yaniv, I., & Foster, D. P. (1995). Graininess of judgment under uncer-tainty: An accuracy-informativeness trade-off. Journal ofExperimental Psychology: General, 124(4), 424.
Yaniv, I., & Foster, D. P. (1997). Precision and accuracy of judgmentalestimation. Journal of behavioral decision making, 10(1), 21-32.
Zadeh L.A. (1965). Fuzzy sets. Information and Control, 8, 338-353.Zandvoort, M., Van der Vlist, M. J., Klijn, F., & Van den Brink, A.
(2018). Navigating amid uncertainty in spatial planning. PlanningTheory, 17(1), 96-116.
Publisher’s note Springer Nature remains neutral with regard to jurisdic-tional claims in published maps and institutional affiliations.
Behav Res