Embed Size (px)
Citation preview

Capture, Analysis, and Management of Patient Wait Times
for Outpatient Phlebotomy
Pathology Informatics 2010
Kavous Roumina, Ph.D.
Richard Hill, M.B.A.
Walter H. Henricks, M.D.
Cleveland Clinic

Walter H. Henricks, M.D.
Background and Objective
• Patient satisfaction is a point of emphasis in healthcare organizations today.
• The time that patients wait for outpatient phlebotomy directly impacts their satisfaction.
• Objective: devise a simple yet efficient system to capture and analyze time interval between patients’ arrival at the phlebotomy location and entry into the phlebotomy room

Walter H. Henricks, M.D.
Technology - Patient Wait Time Study (PWTS) system
• Web-based application (ASP.NET, Microsoft) captures raw data real-time
• Second component (VB.NET, Microsoft) batch-processes, validates, and stores the data in a database application (Access, Microsoft).
Walter H. Henricks, M.D.
Process - PWTS System
• Select the study location
Walter H. Henricks, M.D.
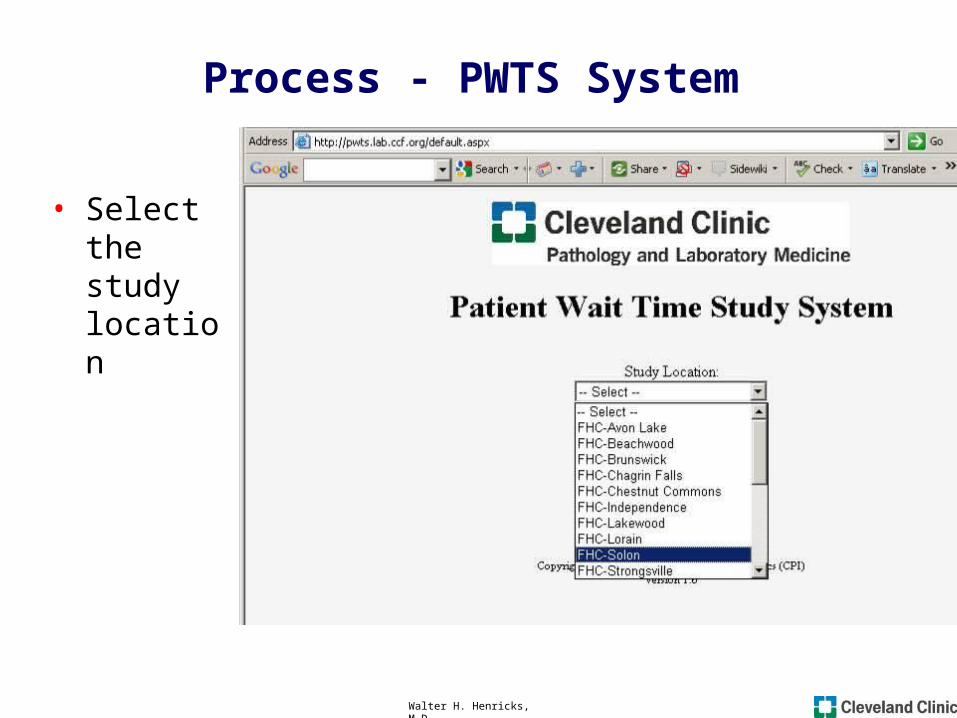
Process - PWTS System
• Patient given card and Start Time (green side) scanned upon patient’s arrival
• Patient keeps the card

Walter H. Henricks, M.D.
Process - PWTS System
• Start time scanned
Walter H. Henricks, M.D.
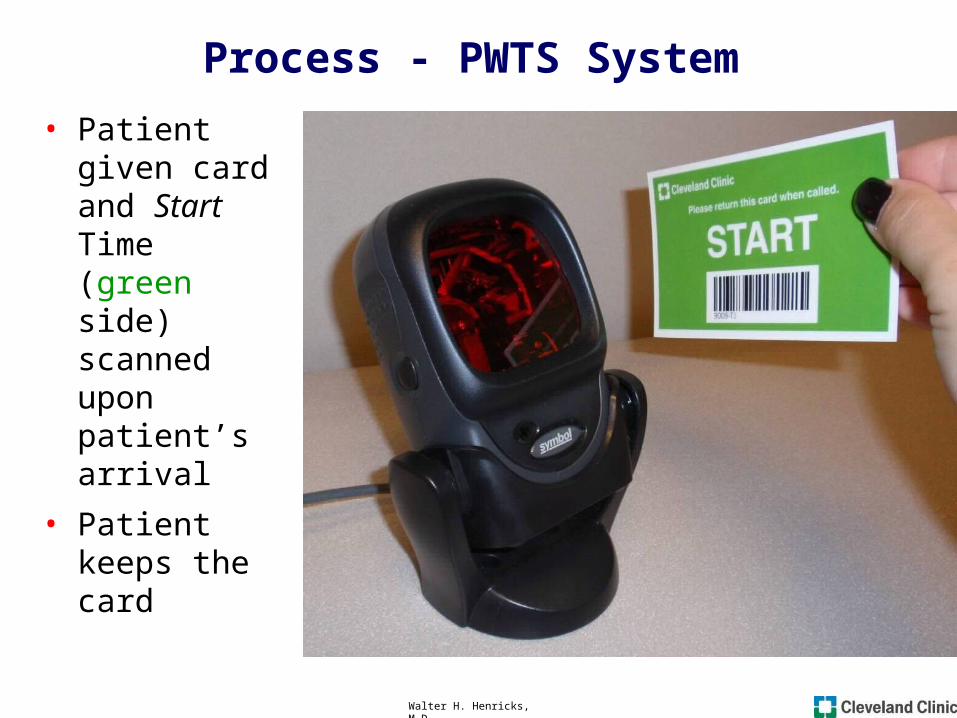
Process - PWTS System
• Start time processed

Walter H. Henricks, M.D.
Process - PWTS System
• Scan Stop Time (red
side) when patient called for phlebotomy (card is returned)

Walter H. Henricks, M.D.
Process - PWTS System
• If there is a cause for any delay in processing, a pre-defined reason is selected.
• Reasons for delay enables better categorization of potential problems.

Walter H. Henricks, M.D.
PWTS Database Reports
• Generated shortly after the completion of the study.
• Grouped by region, location, day-of-week, etc.
• Available for a “rolling” 13 month period (to allow for comparisons).
• Available as PDF on the intranet

Walter H. Henricks, M.D.
PWTS Database Report Definitions
• Patients Waiting More Than 20 Minutes:– Count of wait times 20 minutes or longer, grouped
by the “Reason Delayed.”
• Patients Waiting More Than 20 Minutes – Averaged:– Average wait times and the number of patients who
waited 20 minutes or longer.
• Statistical Summary:– Min, max, and average wait times as well as the
number of patients. Excludes entries that specified a “Reason Delayed.”

Walter H. Henricks, M.D.
PWTS Database Report Definitions
• Visit Counts by Time Intervals:– Count of patients who waited 5, 10, 15, ... minutes.
• Visit Counts by Time of Day:– Count of patient visits for each hour of operation.
• Wait Time Details:– All validated and processed data.

Walter H. Henricks, M.D.
Patient Wait Time Study (03/15/2010 through 03/20/2010)
0
200
400
600
800
1000
1200
1400
Avon L
ake T
own
Center
Beach
wood
Brunsw
ick
Chagrin
Fall
s
Elyria
/Che
stnut C
ommon
s
Inde
pende
nce
Lake
wood
Lora
in
Outpa
tient A
15
Outpa
tient F
10
Outpa
tient J
1-4
Outpa
tient R
21
Outpa
tient S
15Solo
n
Strong
sville
Westl
ake
Willo
ughb
y Hills
0.0%
10.0%
20.0%
30.0%
Number of Cards Percentage of Patients Waiting >20 mins.
Goal: 95% of patients seen within 20
minutes
PWTS Results
• Mgmt. Scorecard based on PWTS reports (single month’s study), across locations Across locations

Walter H. Henricks, M.D.
PWTS Results
• Mgmt. Scorecard based on PWTS reports (single location, “rolling” 12 months):
0.0%
5.0%
10.0%
15.0%
20.0%
25.0%
30.0%
AprJu
neAug O
ctDec Feb
Past 12 Months
Per
cen
t o
ver
20 M
inu
tes
Walter H. Henricks, M.D.
Results and Impact – PWTS System
• PWTS system has been implemented at 23 outpatient locations across Cleveland Clinic Health System
• 184,325 visits have been captured at initial (17) locations over 19 months, averaging 570 visits/week/location.
• Statistical reports are available within hours of completion of measurement period (one week/mo.), compared to weeks with previous manual method

Walter H. Henricks, M.D.
Results and Impact – PWTS System (cont’d.)
• Analysis of data has enabled better distribution of personnel/resources at various locations and across various times of the day.
• Timely availability of such data has, for the first time, recently enabled attainment of the goal of maximum permissible wait times (20 minutes) across all participating locations.

Walter H. Henricks, M.D.
Conclusions – PWTS System
• An effective, simple, yet robust system has enabled easy capture and rapid analysis of wait times for outpatient phlebotomy, an area in which laboratory directly impacts patient satisfaction.
• PWTS provides management data that helps focus resources where necessary, keeping wait times within set targets.
• System is deployable, without major modifications, in any setting involving patient waits such as physician offices, emergency rooms, radiology, and others.