Embed Size (px)
Citation preview
CAPT Mathematics FrameworkThe CAPT design and framework for the assessment of Mathematics was developed by an advisory committee of Connecticut educators and is based on current research and theory about mathematics instruction and assessment. The CAPT mathematics framework that is presented on the following pages integrates the skills, competencies and understandings delineated in Connecticut’s Common Core of Learning (1987), the Connecticut Guide to Curriculum Development in mathematics with the vision described in the National Council of Teachers of Mathematics’ Curriculum and Evaluation Standards for School Mathematics (1989).
Accordingly, the test assumes the acquisition of basic knowledge and skills and requires the application of that knowledge and those skills to the solution of realistic problems drawn from everyday experiences and the needs of the workplace. Using “real-world” scenarios, followed by clusters of either open-ended or constructed-response “grid-in” items, the CAPT assesses the mathematics that 10th grade students are expected to know and be able to do.
The CAPT Mathematics test is based on the view that mathematical understanding is best assessed by doing mathematics, and that doing mathematics means using and discovering knowledge in the course of solving genuine problems. This means that, instead of assessing long division skills directly, students apply division skills. For example, they might be asked to find the price per pound of 2.83 pounds of ground beef that has a total cost of $6.20, compare this price with the unit prices of other possible choices, and finally, justify their purchase decision. Students may use any type of calculator with which they are familiar and comfortable. The calculator can either be provided by the school or brought from home.
Similarly, rather than factor trinomial expressions (a skill that is not part of the CAPT framework), students may be asked to sketch a distance vs. time graph and a speed vs. time graph that represent a single circuit of a pictured roller-coaster ride, thereby applying critical algebraic understandings.
Thus the CAPT Mathematics test assesses knowledge, skills and applications reasonable to expect of all students by the end of 10th grade.
Following is a description of the mathematical processes and the mathematical content areas that constitute the CAPT mathematics framework upon which the test has been constructed.
2004 Mathematics 229
CAPT Mathematics Processes
A. Problem Solving and Reasoning • Formulate problems from situations and given data.
• Develop and apply a variety of strategies to solve problems-particularly multi-step and nonroutine problems.
• Make and evaluate conjectures and arguments.
• Verify, validate and interpret results and claims and generalize solutions.
B. Communicating • Model situations using written, concrete, pictorial, graphical and algebraic
representations.
• Express mathematical ideas and arguments with clarity and coherence.
• Use mathematical language and notation to represent ideas, describe relationships and model situations.
C. Computing and Estimating • Compute accurately and make estimates with whole numbers, fractions, decimals,
percents, integers and rational numbers.
• Select and use appropriate methods for computing, including mental mathematics, estimation, paper-and-pencil and calculator methods.
• Use estimation to assess the reasonableness of results.
2004 Mathematics 230
CAPT Mathematics Content Strands
All CAPT mathematics items will be in a context and require students to solve a problem. In addition, all open-ended CAPT items will require students to show their work and explain their reasoning, thereby communicating their understanding of the relevant mathematics.
All CAPT items will be devised to measure one or more of the following aspects of mathematical content:
The Number and Quantity Strand 1. Number Sense
• Use integers, fractions, decimals, percents and scientific notation in real-world situations to count, measure, compare, order, scale, locate and label.
• Use a variety of representations (including graphs, tables, words, number lines, pictures, etc.) to present, interpret and communicate various kinds of numerical information.
• Demonstrate an understanding of order, magnitude and equivalent forms of numbers.
2. Operations • Identify appropriate operations (including addition, subtraction, multiplication, division,
exponentiation and square roots) and use these operations in a variety of contexts.
• Select appropriate methods for computing (including mental mathematics, estimation, paper-and-pencil and calculator methods).
3. Estimation and Approximation • Use estimation strategies in problem situations.
• Assess the reasonableness of answers to problems.
4. Ratios, Proportions, and Percents • Use ratios, proportions and percents to solve problems.
• Use dimensional analysis to determine equivalent rates (for example, converting inches per minute to feet per hour).
• Use direct and indirect variation to solve numerical, geometric and algebraic problems.
2004 Mathematics 231
The Measurement and Geometry Strand 5. Measurement
• Use the concepts of length, perimeter, area, volume, angle measure, capacity, weight and mass to solve problems, using both metric and customary units.
• Identify appropriate metric and customary measurement units and use appropriatemeasurement tools (including rulers and protractors).
• Estimate, make and use measurements in realistic situations.
• Use formulas and scales to determine measures.
6. Spatial Relationships and Geometry • Interpret, describe and draw 2- and 3-dimensional objects.
• Use the concepts of rotation, reflection and translation to transform geometric figures.
• Describe and use fundamental concepts and properties of, and relationships among, points, lines, planes, angles and shapes (including incidence, parallelism, perpendicularity and the Pythagorean Theorem).
• Use the concepts of congruence and similarity to solve realistic problems.
• Use coordinate representations of geometric figures.
• Solve problems using geometric models.
The Statistics, Probability and Discrete Mathematics Strand 7. Probability and Statistics
• Demonstrate an understanding of sampling and its role in statistical assertions.
• Describe, calculate and apply the concepts of mean, median, mode and range.
• Construct, read and interpret tables, charts and graphs of real-world data.
• Make and evaluate inferences from tables, charts, graphs and other representations of data.
• Use probability to make predictions and evaluate the likelihood of simple andcompound events.
• Use simulations to determine experimental probabilities.
• Compare experimental and theoretical probabilities and make predictions based on these probabilities.
10. Discrete Mathematics* • Use systematic listing and counting strategies, including simple combinations and
permutations, to solve problems.
• Use recursive processes, including iteration, to solve problems.
*The numbering used here is consistent with the Connecticut Mathematics Framework.
2004 Mathematics 232
The Algebra and Functions Strand 8. Patterns
• Construct, describe, extend and analyze a variety of numerical, geometric andstatistical patterns.
• Describe, analyze and generalize patterns using tables, rules, algebraic expressions and equations, and graphs.
• Make and justify predictions based on patterns.
9. Algebra and Functions • Represent and analyze situations involving variable quantities with tables, graphs, verbal
rules and equations, and translate among representations.
• Use variables, expressions, equations and inequalities including formulas to model situations and solve problems.
• Construct and use linear functions to model and solve real-world situations.
• Use the coordinate plane to represent functions.
2004 Mathematics 233
Items Found in This PacketOpen-ended Items Open-ended items are those for which a student must write a response to a question. For example, students may be asked to solve a problem and show all of their work or be asked to make a choice and justify it mathematically. Included in this packet are the eight open-ended items which appeared on the 2004 administration of the Mathematics section of the CAPT.
Open-ended items are scored on a four-point scale (0-3) using a holistic method. This means that the overall quality of a student’s response is considered when making a scoring judgment. The scoring rubric for the mathematics open-ended items (see the following page) describes the characteristics of a response at each given score point. For each score point, there are one or two examples of scored student responses along with a brief discussion of why the response received that particular score.
Grid-in Items Grid-in items are those for which a student must arrive at an answer and enter it into a grid. Included in this packet are several grid-in items which appeared on the 2004 administration of the Mathematics section of the CAPT.
The grid-in items are scored electronically as either correct or incorrect; however, there may be several correct answers for an item. There are times in mathematics when because of rounding (38.21 or 38.2), or representing percents (35% or .35), a number of responses are correct and acceptable.
2004 Mathematics 234
CAPT Mathematics Open-ended Items
2004 Mathematics 235
Scoring Rubric for Mathematics Open-Ended Items
Each score category contains a range of student responses which reflect the descriptions given below.
Score 3 The student has demonstrated a full and complete understanding of all concepts and processes embodied in this application. The student has addressed the task in a mathematically sound manner. The response contains evidence of the student’s competence in problem-solving and reasoning, computing and estimating, and communicating to the full extent that these processes apply to the specified task. The response may, however, contain minor arithmetic errors that do not detract from a demonstration of full understanding. Student work is shown.
Score 2 The student has demonstrated a reasonable understanding of the essential mathematical concepts and processes embodied in this application. The student’s response contains most of the attributes of an appropriate response including a mathematically sound approach and evidence of competence with applicable mathematical processes, but contains flaws that do not diminish countervailing evidence that the student comprehends the essential mathematical ideas addressed by this task. Such flaws include errors ascribable to faulty reading, writing, or drawing skills; errors ascribable to insufficient, non-mathematical knowledge; and errors ascribable to negligent or inattentive execution of mathematical processes or algorithms.
Score 1 The student has demonstrated a limited understanding of some of the concepts and processes embodied in this application. The student’s response contains some of the attributes of an appropriate response, but lacks convincing evidence that the student fully comprehends the essential mathematical ideas addressed by this task. Such deficits include evidence of insufficient mathematical knowledge; errors in fundamental mathematical procedures; and other omissions or anomalies that bring into question the extent of the student’s ability to solve problems of this general type.
Score 0 The student has demonstrated merely an acquaintance with the topic. The student’s response is associated with the task in the item but contains few attributes of an appropriate response. There are significant omissions or anomalies that indicate a basic lack of comprehension in regard to the mathematical ideas and procedures necessary to adequately address the specified task. No evidence is present to suggest that the student has the ability to solve problems of this general type.
2004 Mathematics 236
Water Use Statistics, Probabilty & Discreet Mathematics
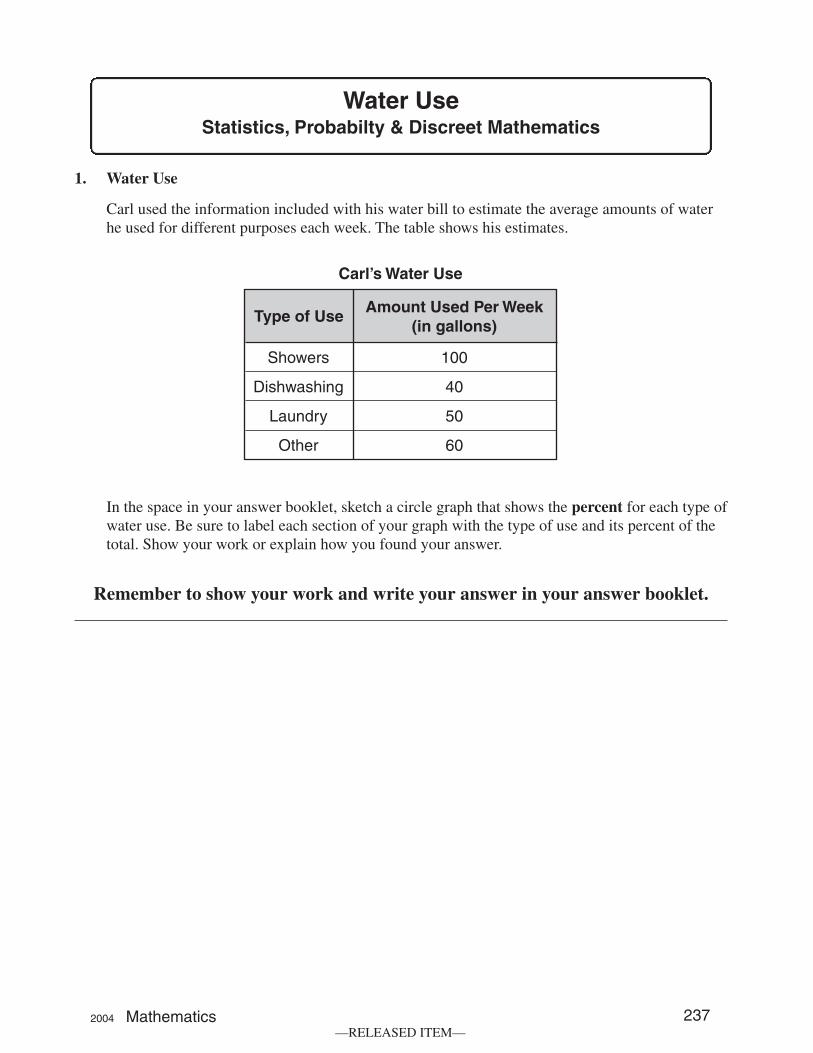
1. Water Use
Carl used the information included with his water bill to estimate the average amounts of water he used for different purposes each week. The table shows his estimates.
Carl’s Water Use
Type of Use Amount Used Per Week (in gallons)
Showers 100
Dishwashing 40
Laundry 50
Other 60
In the space in your answer booklet, sketch a circle graph that shows the percent for each type of water use. Be sure to label each section of your graph with the type of use and its percent of the total. Show your work or explain how you found your answer.
Remember to show your work and write your answer in your answer booklet.
2004 Mathematics 237 —RELEASED ITEM—
Scored Student Responses for Water Use
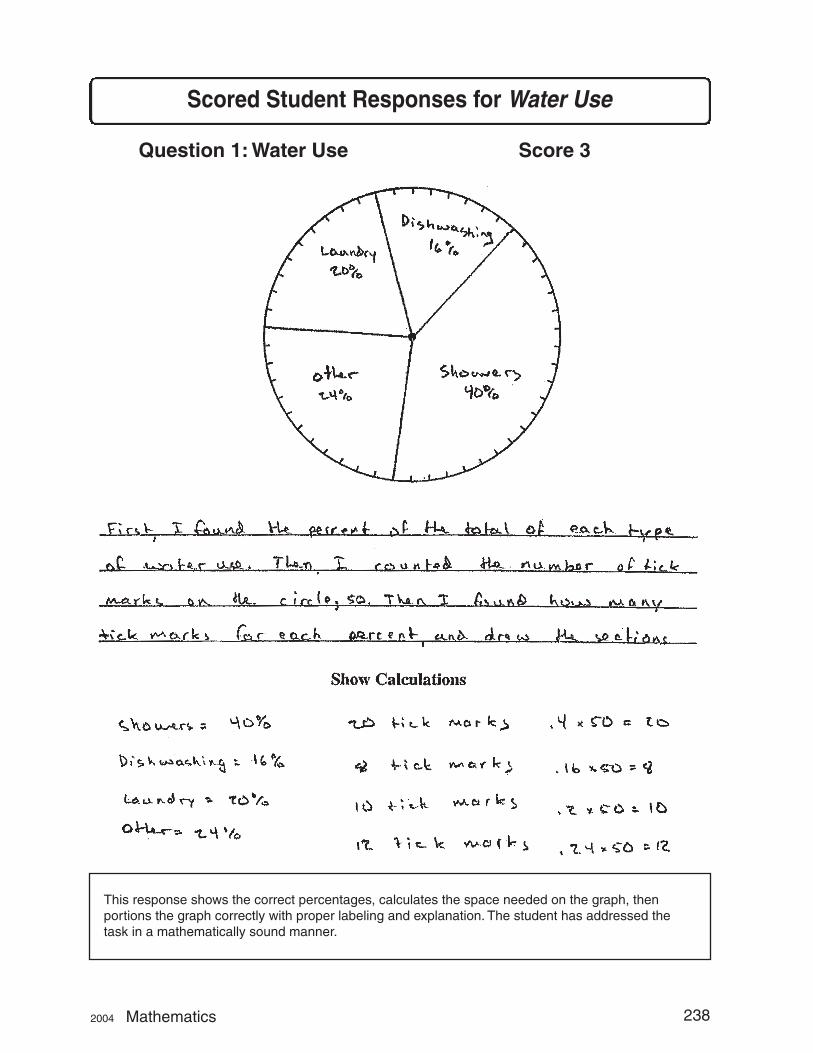
Question 1: Water Use Score 3
This response shows the correct percentages, calculates the space needed on the graph, then portions the graph correctly with proper labeling and explanation. The student has addressed the task in a mathematically sound manner.
2004 Mathematics 238
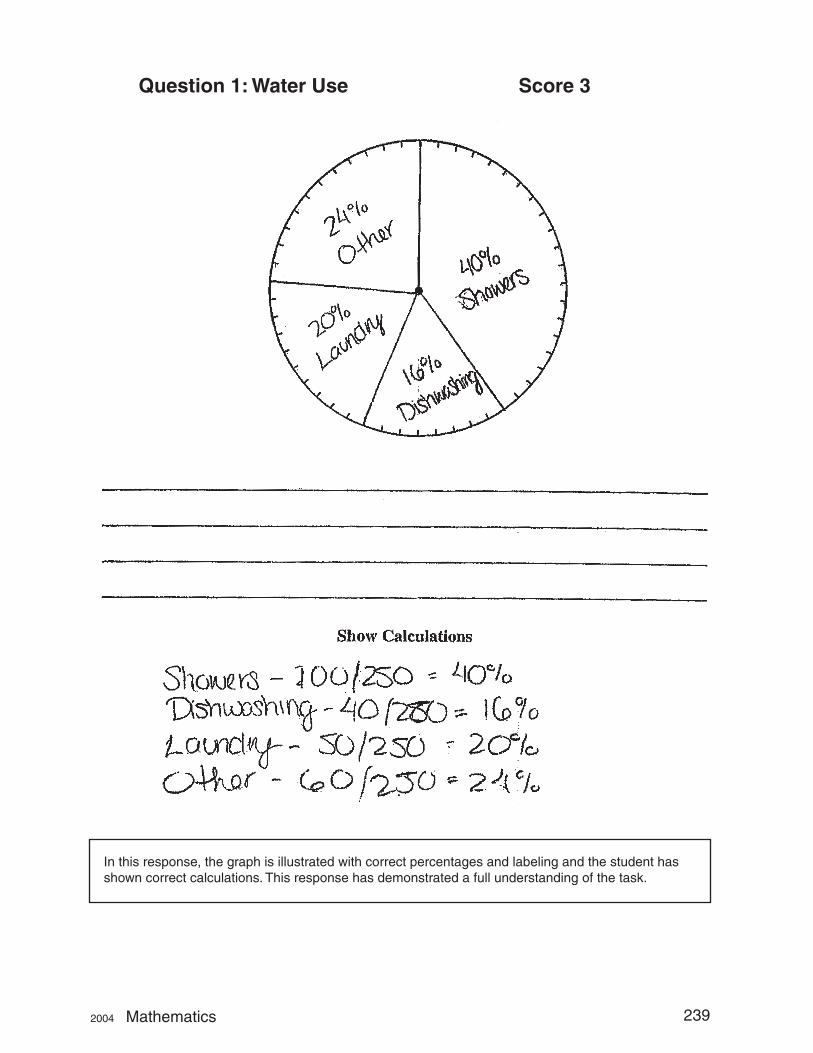
Question 1: Water Use Score 3
In this response, the graph is illustrated with correct percentages and labeling and the student has shown correct calculations. This response has demonstrated a full understanding of the task.
2004 Mathematics 239
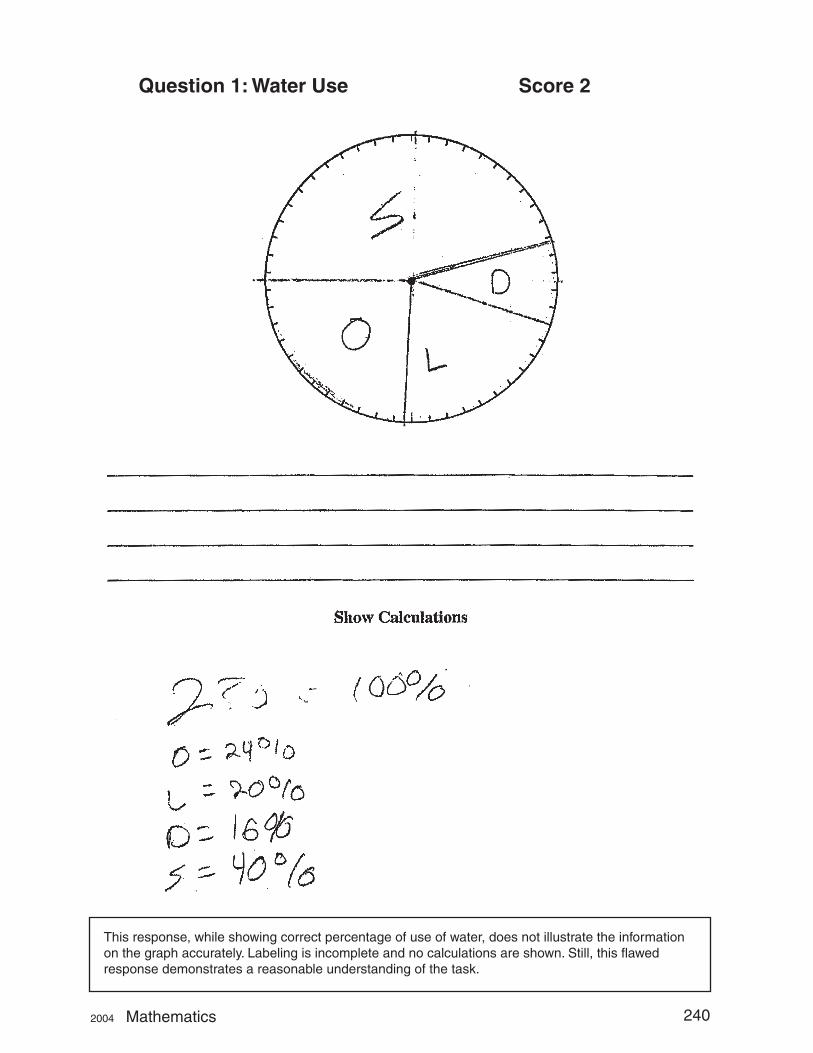
Question 1: Water Use Score 2
This response, while showing correct percentage of use of water, does not illustrate the information on the graph accurately. Labeling is incomplete and no calculations are shown. Still, this flawed response demonstrates a reasonable understanding of the task.
2004 Mathematics 240
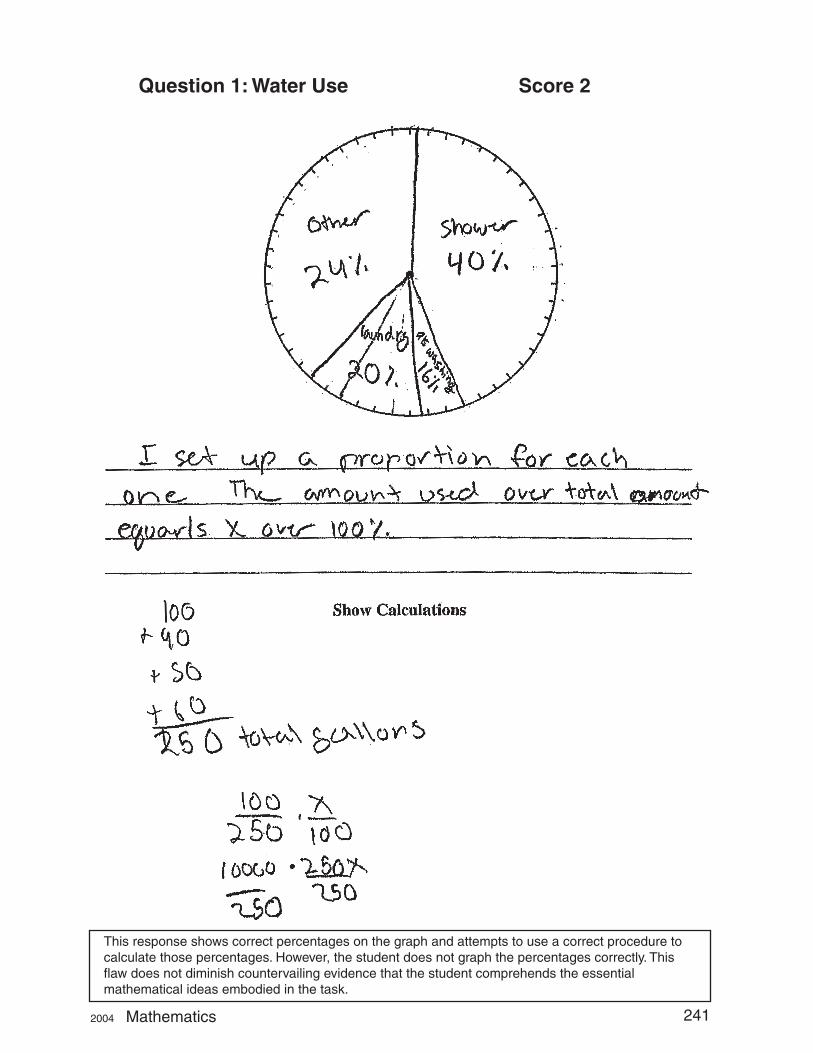
Question 1: Water Use Score 2
This response shows correct percentages on the graph and attempts to use a correct procedure to calculate those percentages. However, the student does not graph the percentages correctly. This flaw does not diminish countervailing evidence that the student comprehends the essential mathematical ideas embodied in the task.
2004 Mathematics 241
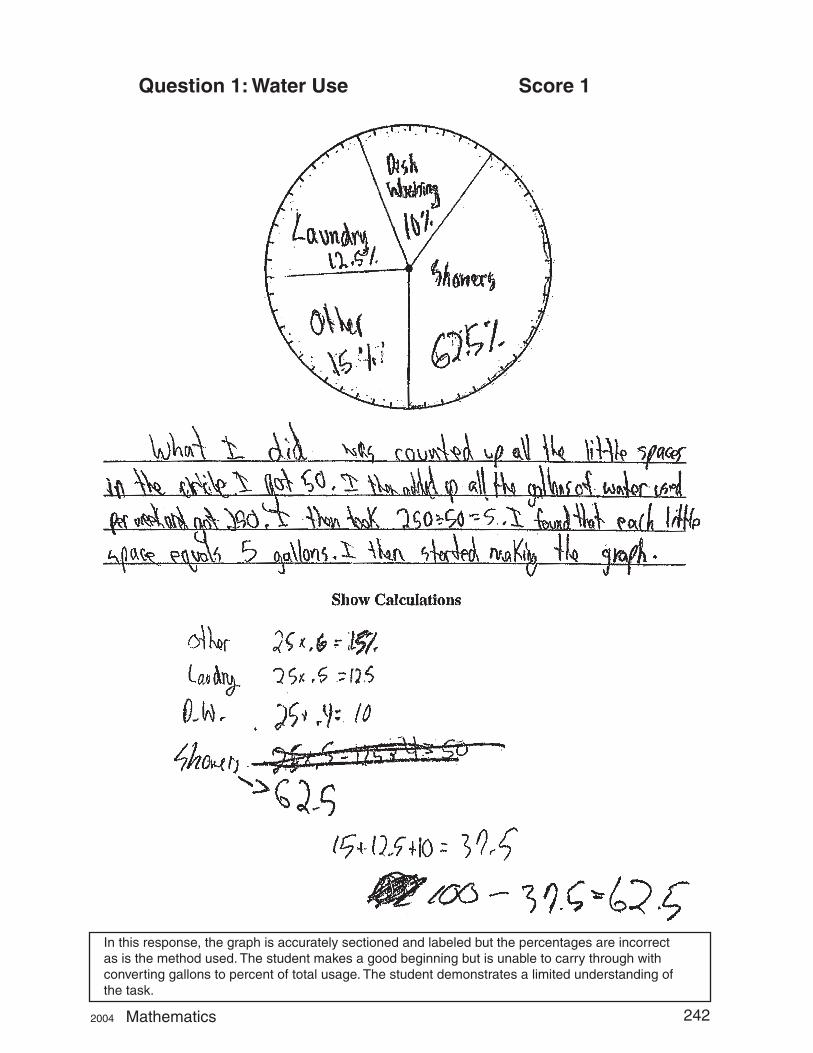
Question 1: Water Use Score 1
In this response, the graph is accurately sectioned and labeled but the percentages are incorrect as is the method used. The student makes a good beginning but is unable to carry through with converting gallons to percent of total usage. The student demonstrates a limited understanding of the task.
2004 Mathematics 242
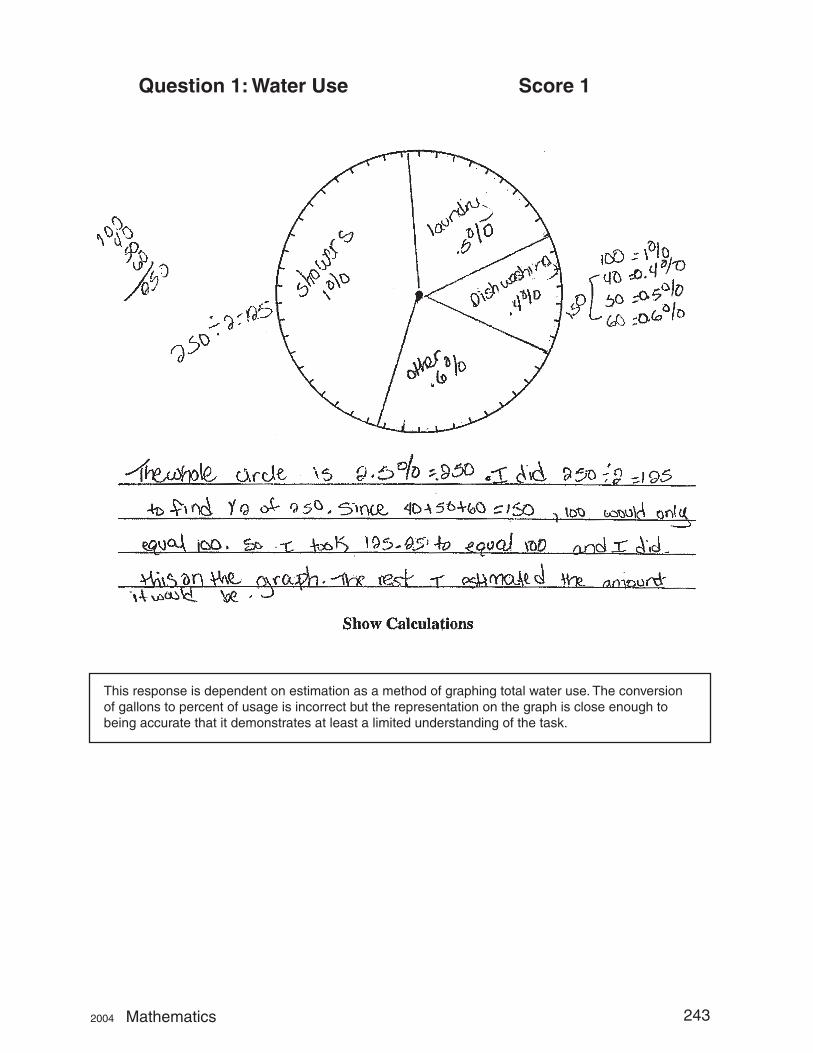
Question 1: Water Use Score 1
This response is dependent on estimation as a method of graphing total water use. The conversion of gallons to percent of usage is incorrect but the representation on the graph is close enough to being accurate that it demonstrates at least a limited understanding of the task.
2004 Mathematics 243
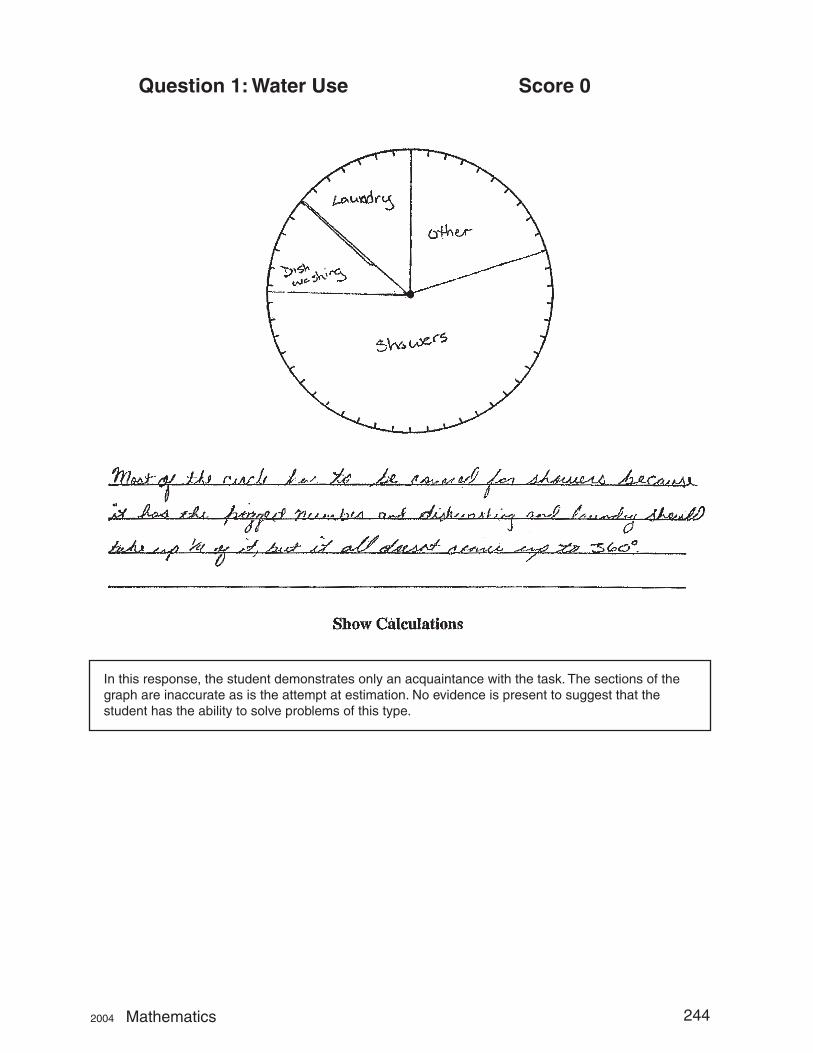
Question 1: Water Use Score 0
In this response, the student demonstrates only an acquaintance with the task. The sections of the graph are inaccurate as is the attempt at estimation. No evidence is present to suggest that the student has the ability to solve problems of this type.
2004 Mathematics 244
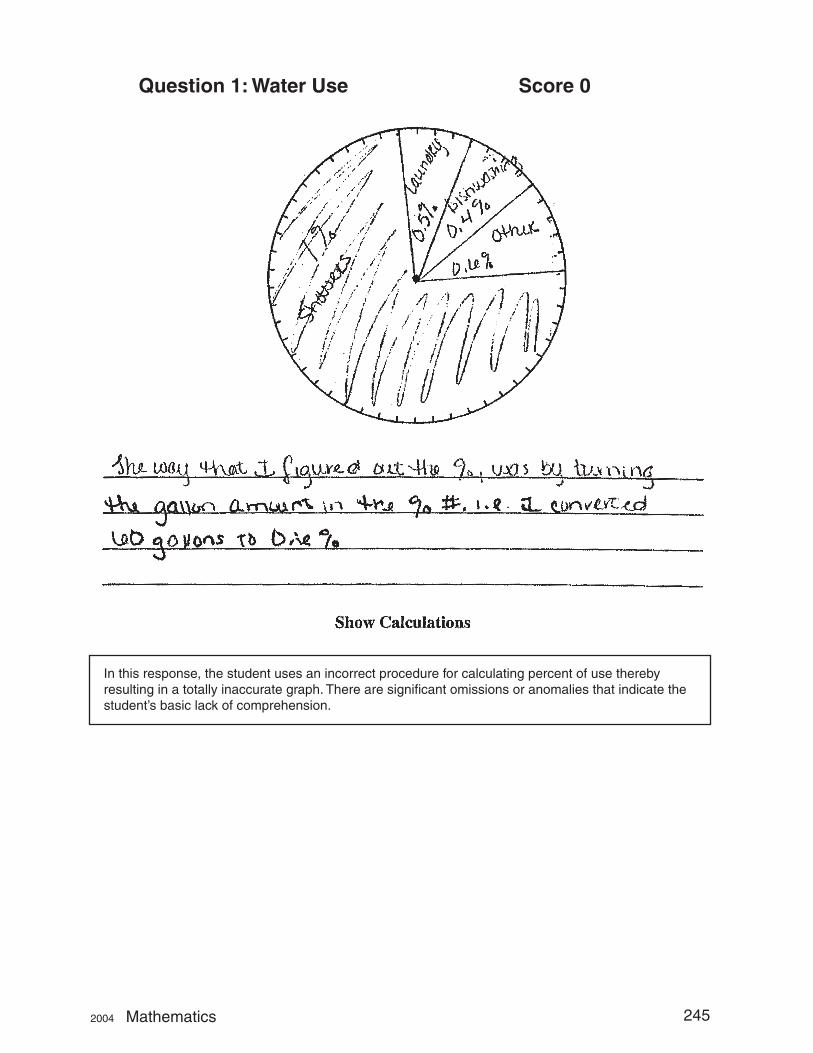
Question 1: Water Use Score 0
In this response, the student uses an incorrect procedure for calculating percent of use thereby resulting in a totally inaccurate graph. There are significant omissions or anomalies that indicate the student’s basic lack of comprehension.
2004 Mathematics 245
Painting Enlargement Measurement & Geometry
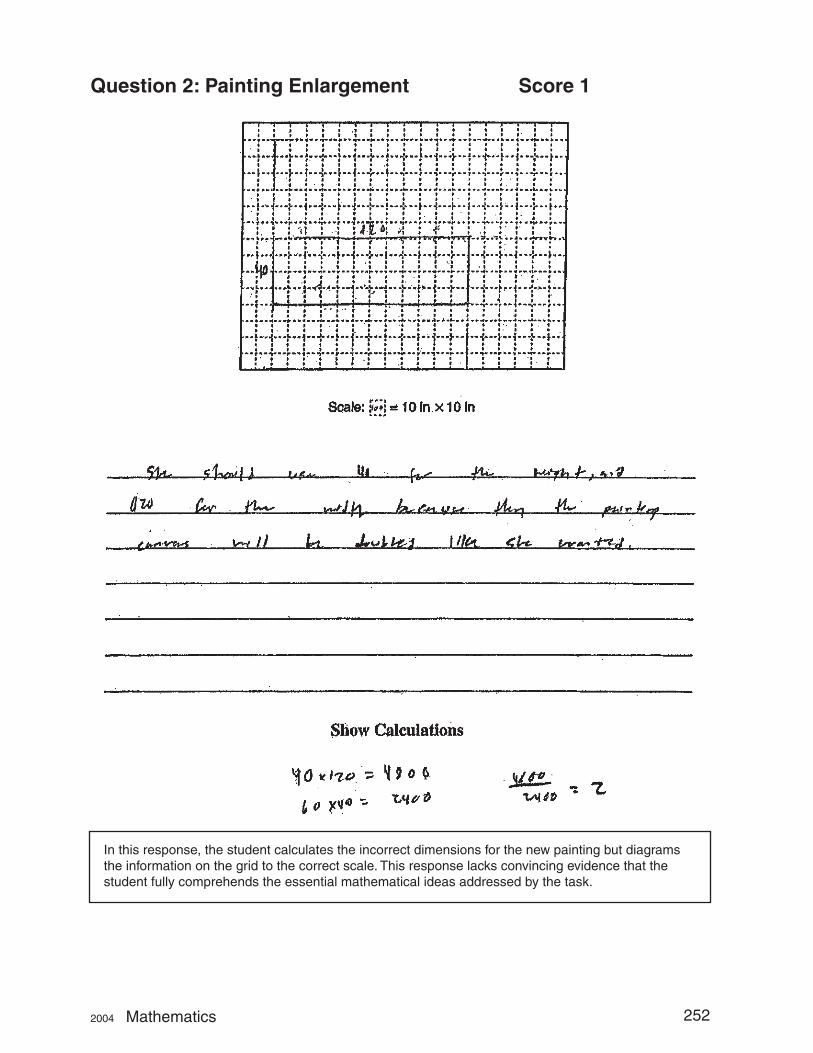
2. Painting Enlargement
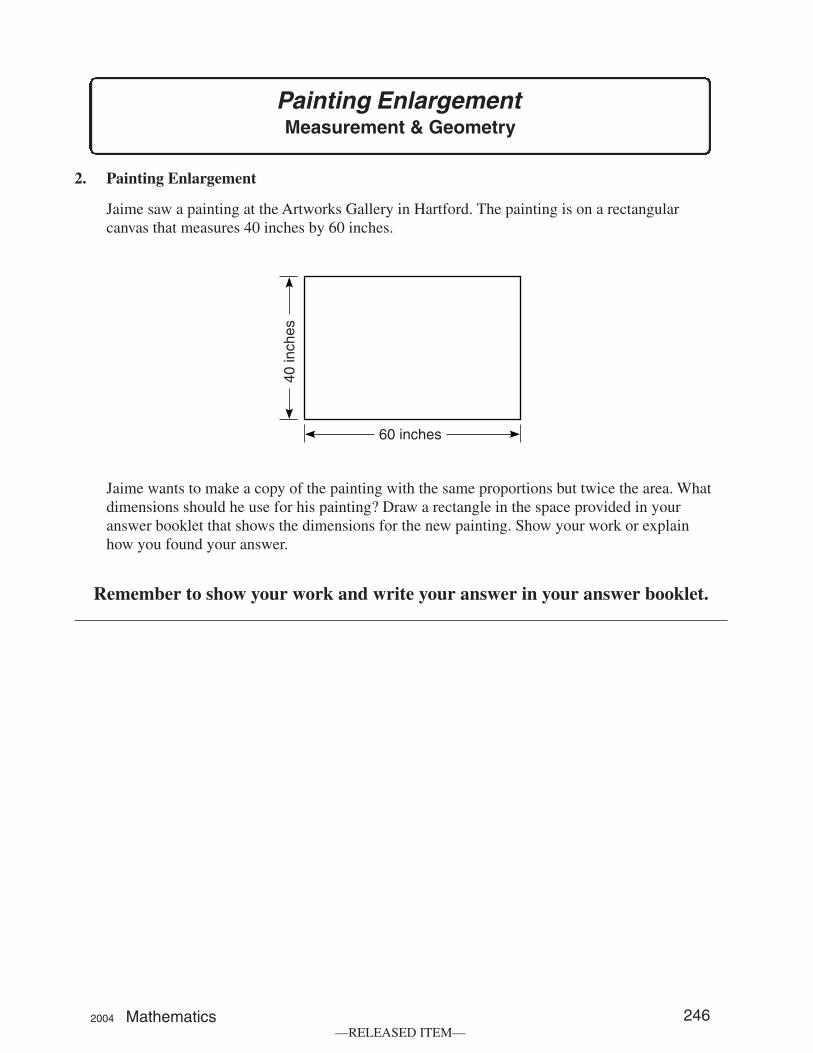
Jaime saw a painting at the Artworks Gallery in Hartford. The painting is on a rectangular canvas that measures 40 inches by 60 inches.
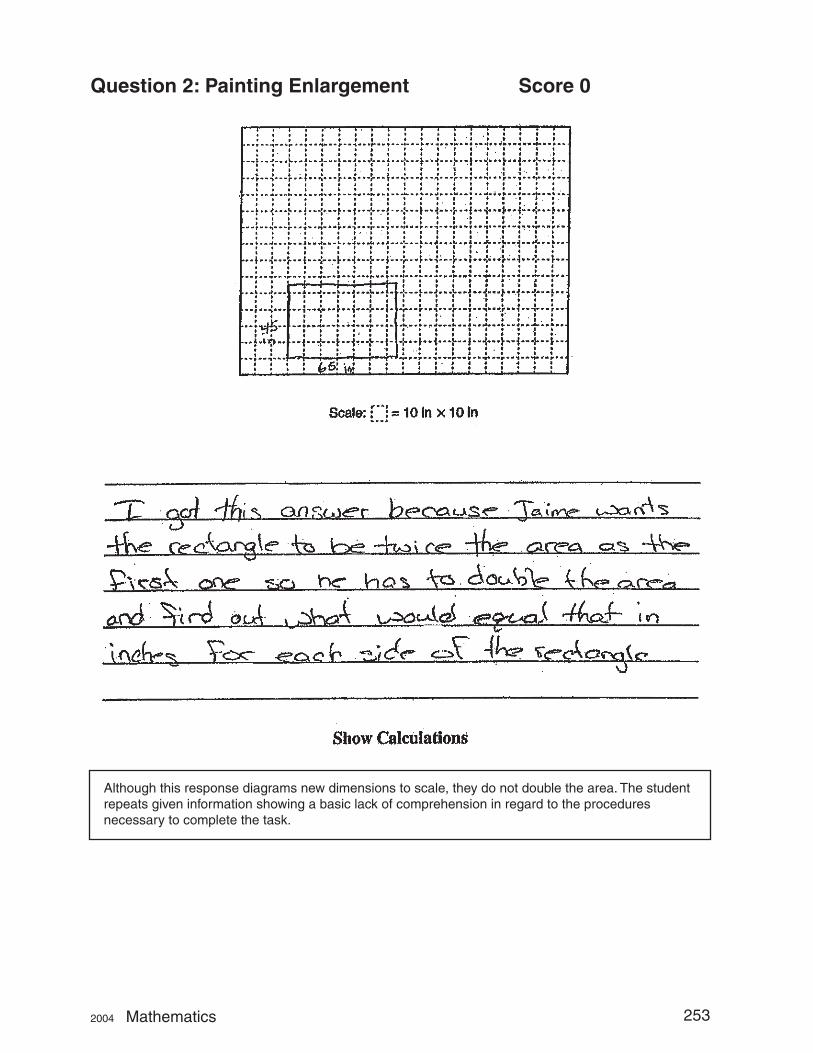
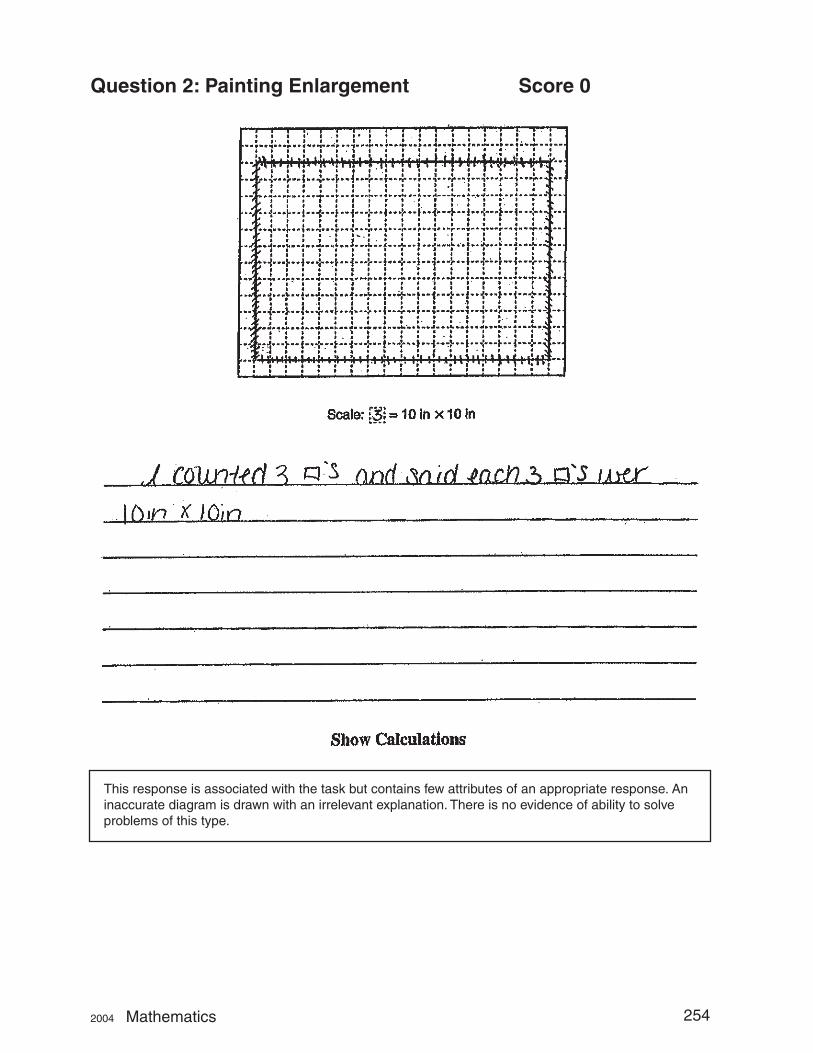
Jaime wants to make a copy of the painting with the same proportions but twice the area. What dimensions should he use for his painting? Draw a rectangle in the space provided in your answer booklet that shows the dimensions for the new painting. Show your work or explain how you found your answer.
Remember to show your work and write your answer in your answer booklet.
2004 Mathematics 246 —RELEASED ITEM—
Score 3
Scored Student Responses for Painting Enlargement
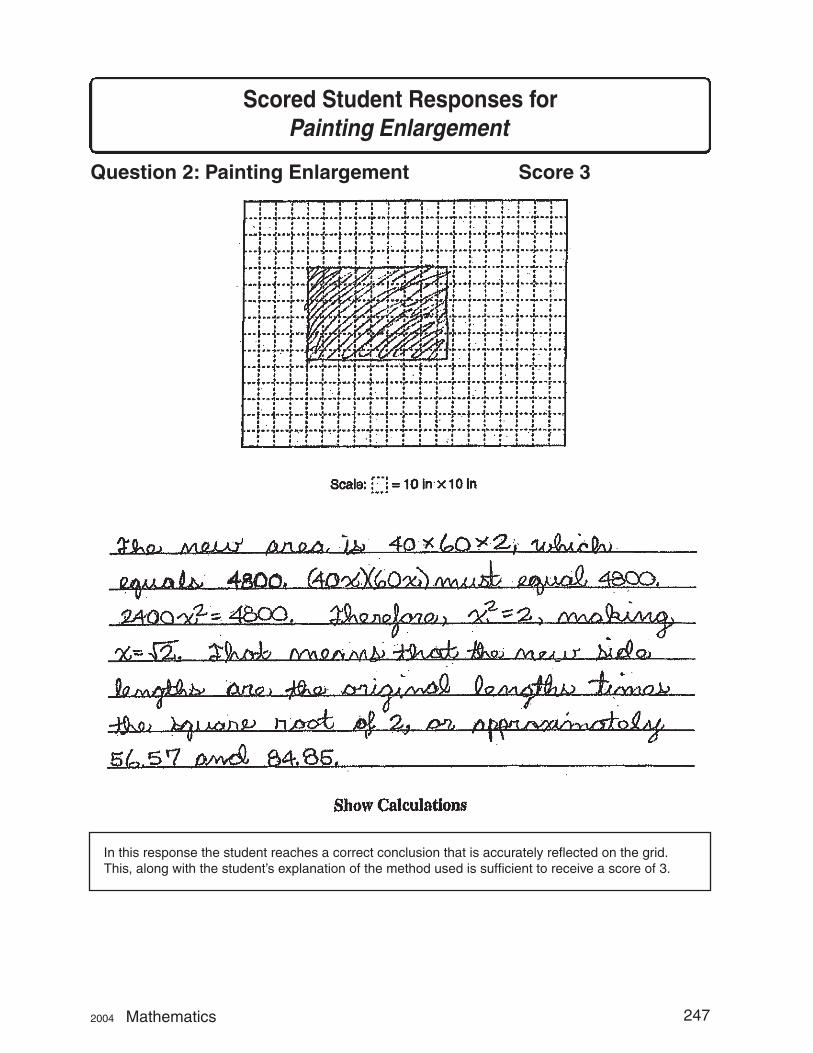
In this response the student reaches a correct conclusion that is accurately reflected on the grid. This, along with the student’s explanation of the method used is sufficient to receive a score of 3.
Question 2: Painting Enlargement
2004 Mathematics 247
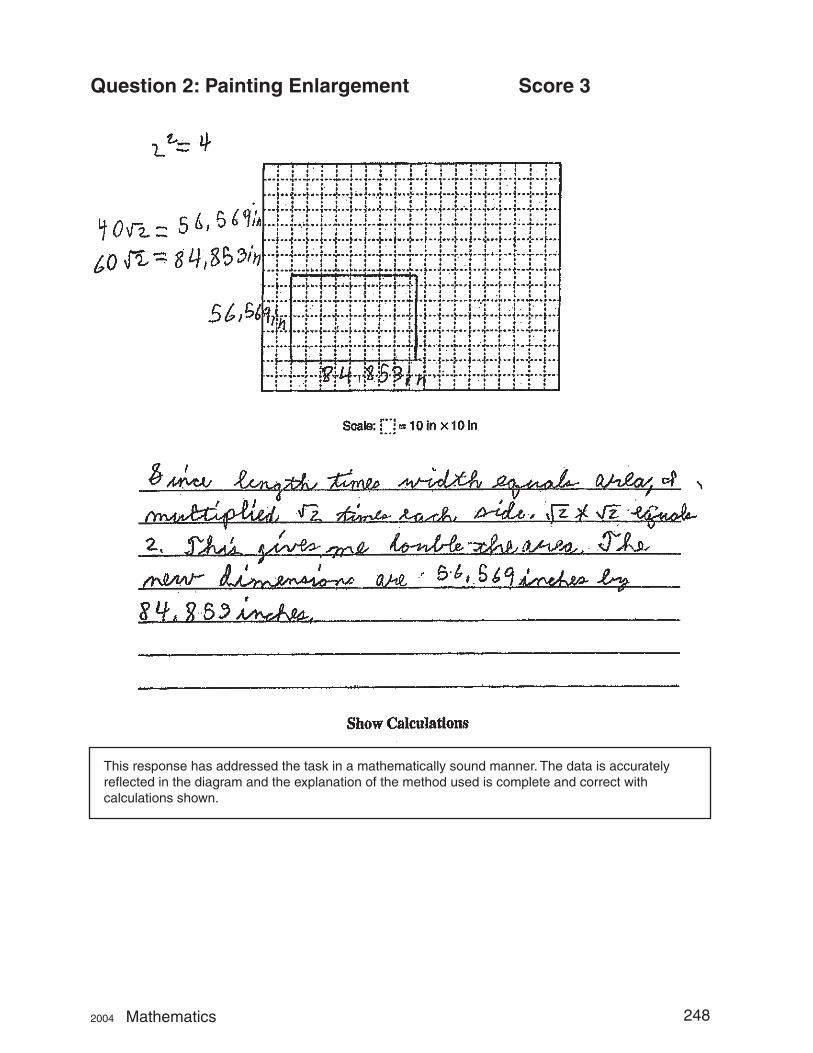
Question 2: Painting Enlargement Score 3
This response has addressed the task in a mathematically sound manner. The data is accurately reflected in the diagram and the explanation of the method used is complete and correct with calculations shown.
2004 Mathematics 248
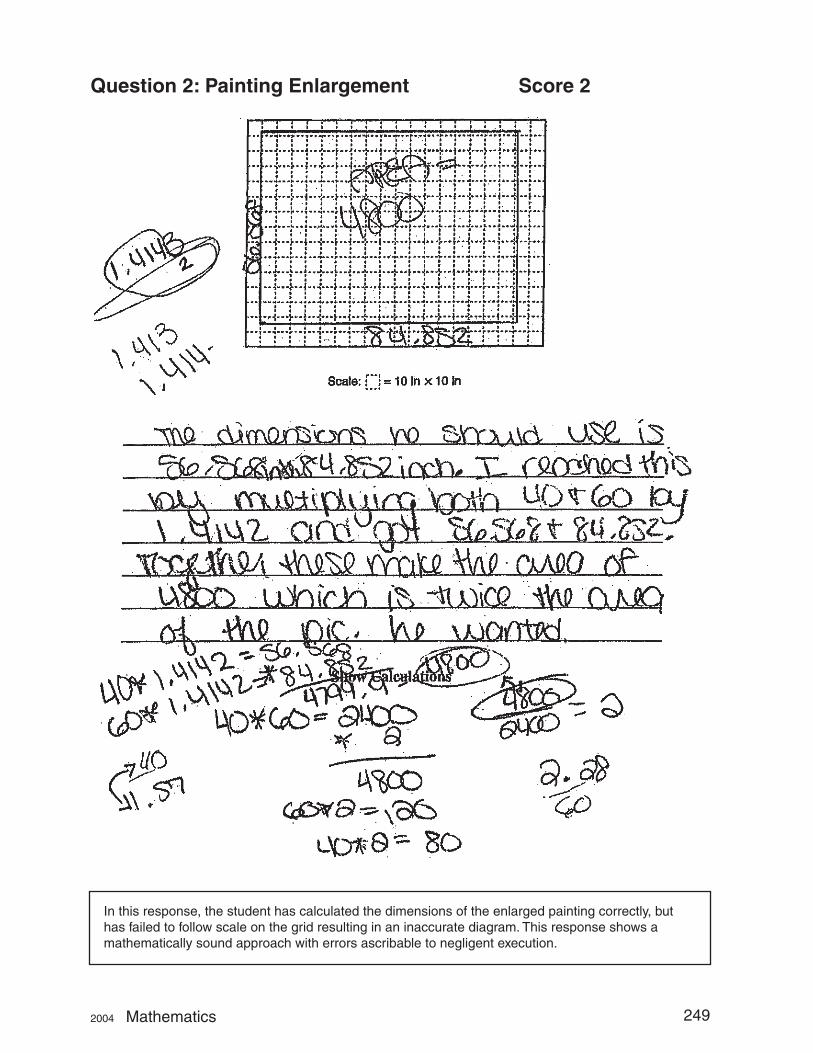
Question 2: Painting Enlargement Score 2
In this response, the student has calculated the dimensions of the enlarged painting correctly, but has failed to follow scale on the grid resulting in an inaccurate diagram. This response shows a mathematically sound approach with errors ascribable to negligent execution.
2004 Mathematics 249
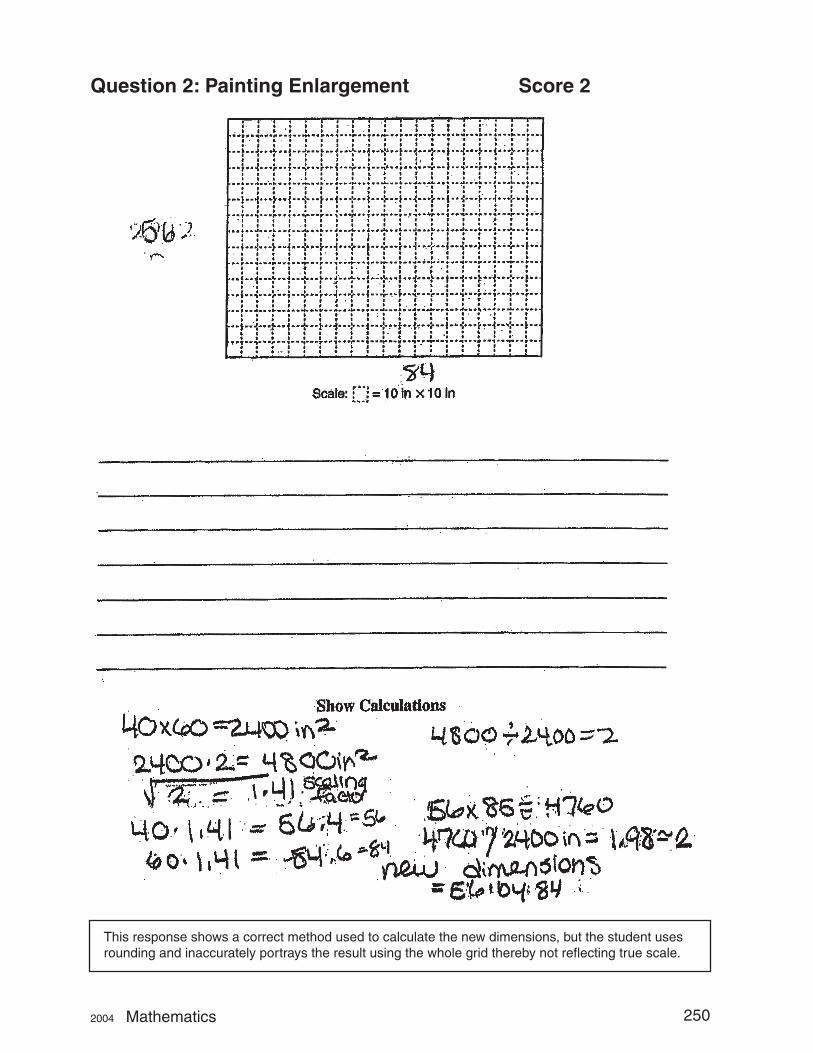
Question 2: Painting Enlargement Score 2
This response shows a correct method used to calculate the new dimensions, but the student usesrounding and inaccurately portrays the result using the whole grid thereby not reflecting true scale.
2004 Mathematics 250
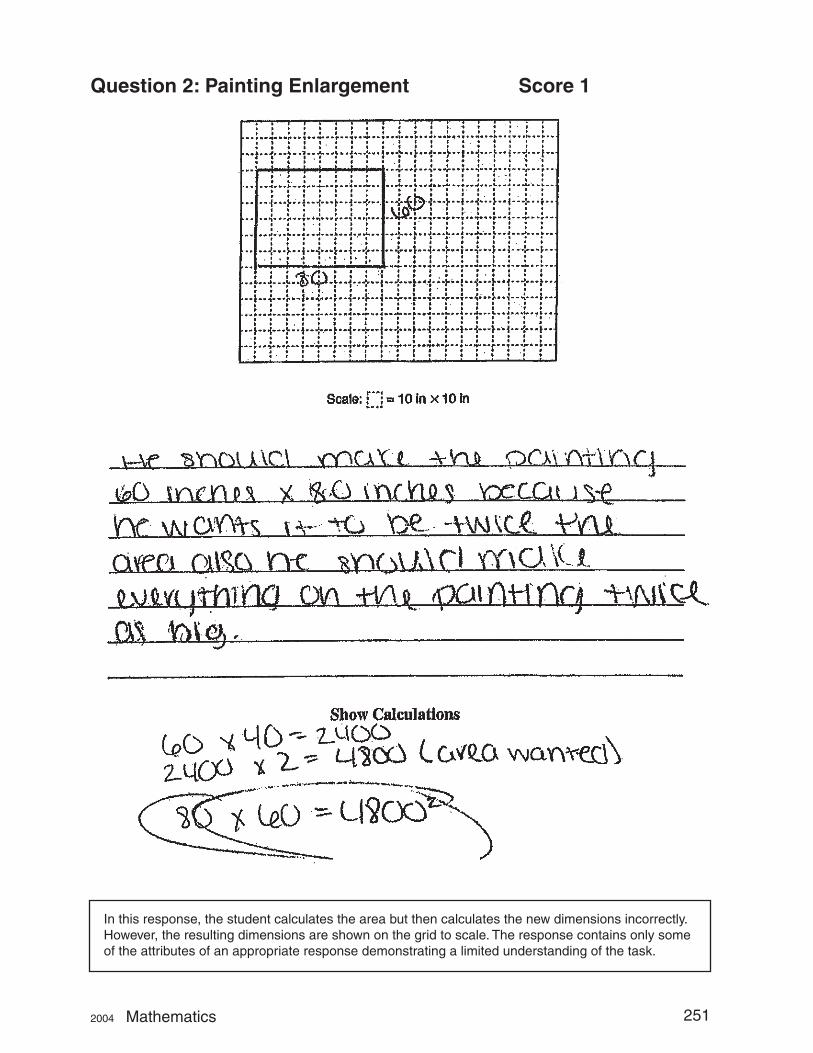
Question 2: Painting Enlargement Score 1
In this response, the student calculates the area but then calculates the new dimensions incorrectly. However, the resulting dimensions are shown on the grid to scale. The response contains only some of the attributes of an appropriate response demonstrating a limited understanding of the task.
2004 Mathematics 251
Question 2: Painting Enlargement Score 1
In this response, the student calculates the incorrect dimensions for the new painting but diagrams the information on the grid to the correct scale. This response lacks convincing evidence that the student fully comprehends the essential mathematical ideas addressed by the task.
2004 Mathematics 252
Question 2: Painting Enlargement Score 0
Although this response diagrams new dimensions to scale, they do not double the area. The student repeats given information showing a basic lack of comprehension in regard to the procedures necessary to complete the task.
2004 Mathematics 253
Question 2: Painting Enlargement Score 0
This response is associated with the task but contains few attributes of an appropriate response. An inaccurate diagram is drawn with an irrelevant explanation. There is no evidence of ability to solve problems of this type.
2004 Mathematics 254
Number & Quantity Sea Fan Polyps
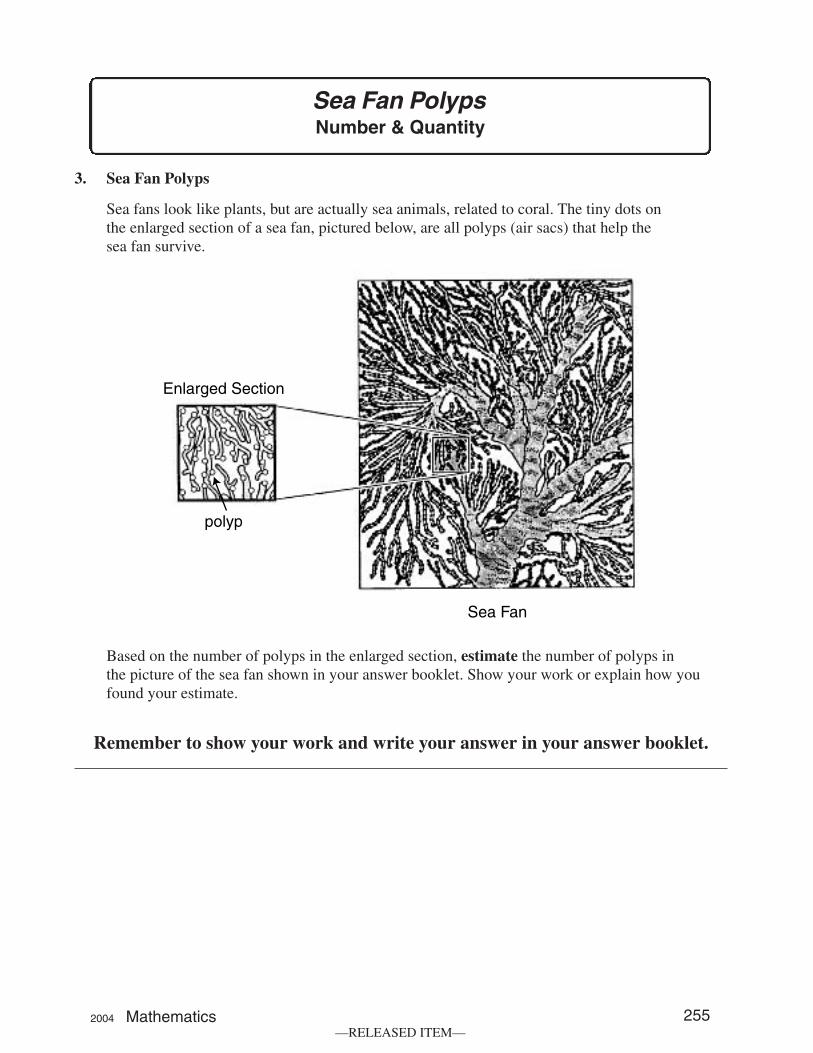
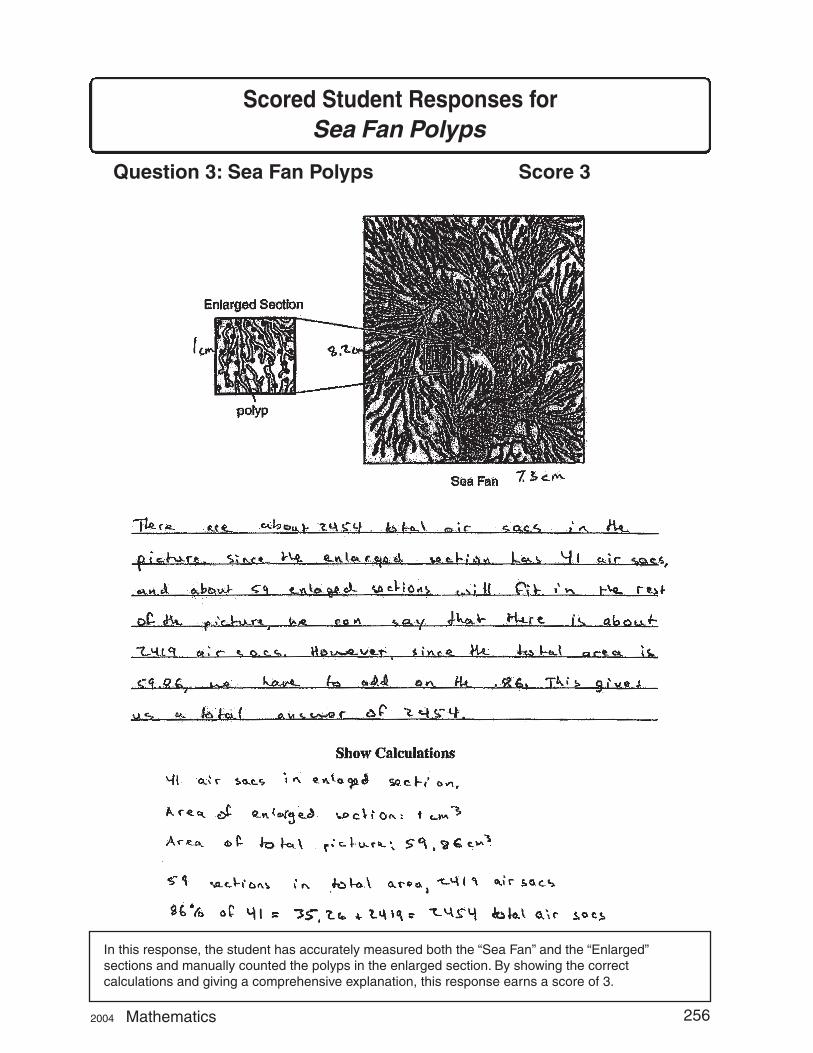
3. Sea Fan Polyps
Sea fans look like plants, but are actually sea animals, related to coral. The tiny dots on the enlarged section of a sea fan, pictured below, are all polyps (air sacs) that help the sea fan survive.
Enlarged Section
polyp
Sea Fan
Based on the number of polyps in the enlarged section, estimate the number of polyps in the picture of the sea fan shown in your answer booklet. Show your work or explain how you found your estimate.
Remember to show your work and write your answer in your answer booklet.
2004 Mathematics 255 —RELEASED ITEM—
Scored Student Responses for Sea Fan Polyps
Question 3: Sea Fan Polyps Score 3
In this response, the student has accurately measured both the “Sea Fan” and the “Enlarged” sections and manually counted the polyps in the enlarged section. By showing the correct calculations and giving a comprehensive explanation, this response earns a score of 3.
2004 Mathematics 256
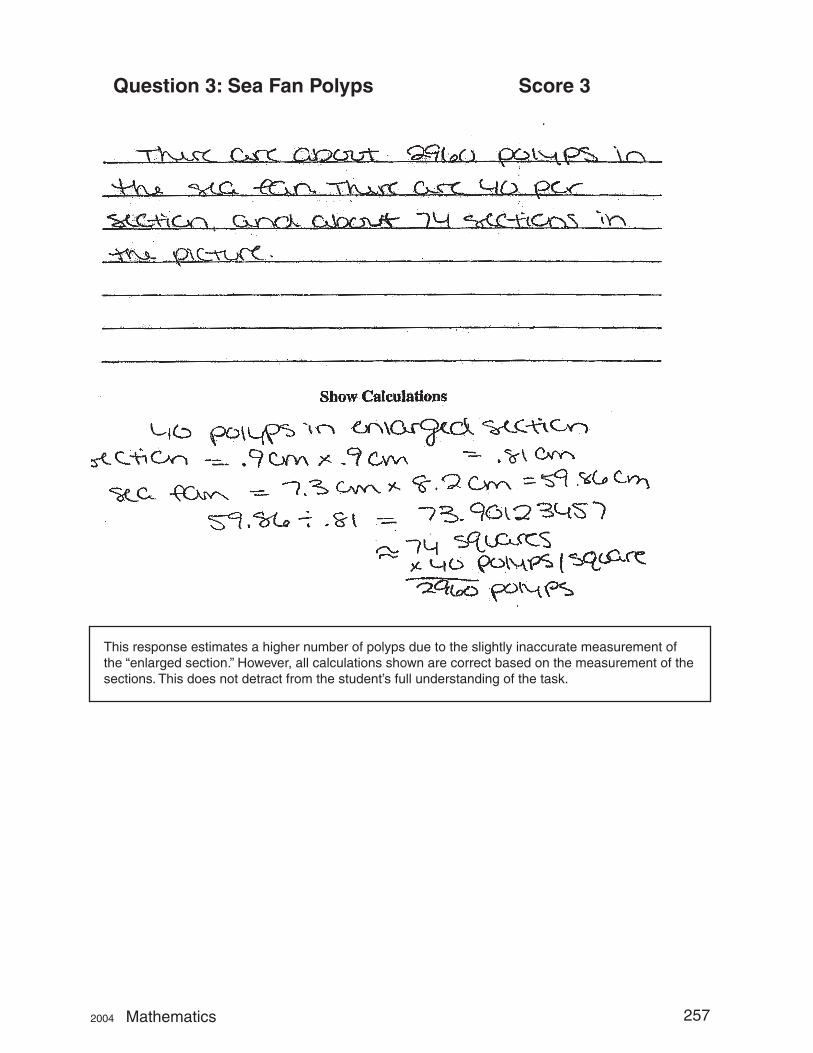
Question 3: Sea Fan Polyps Score 3
This response estimates a higher number of polyps due to the slightly inaccurate measurement of the “enlarged section.” However, all calculations shown are correct based on the measurement of the sections. This does not detract from the student’s full understanding of the task.
2004 Mathematics 257
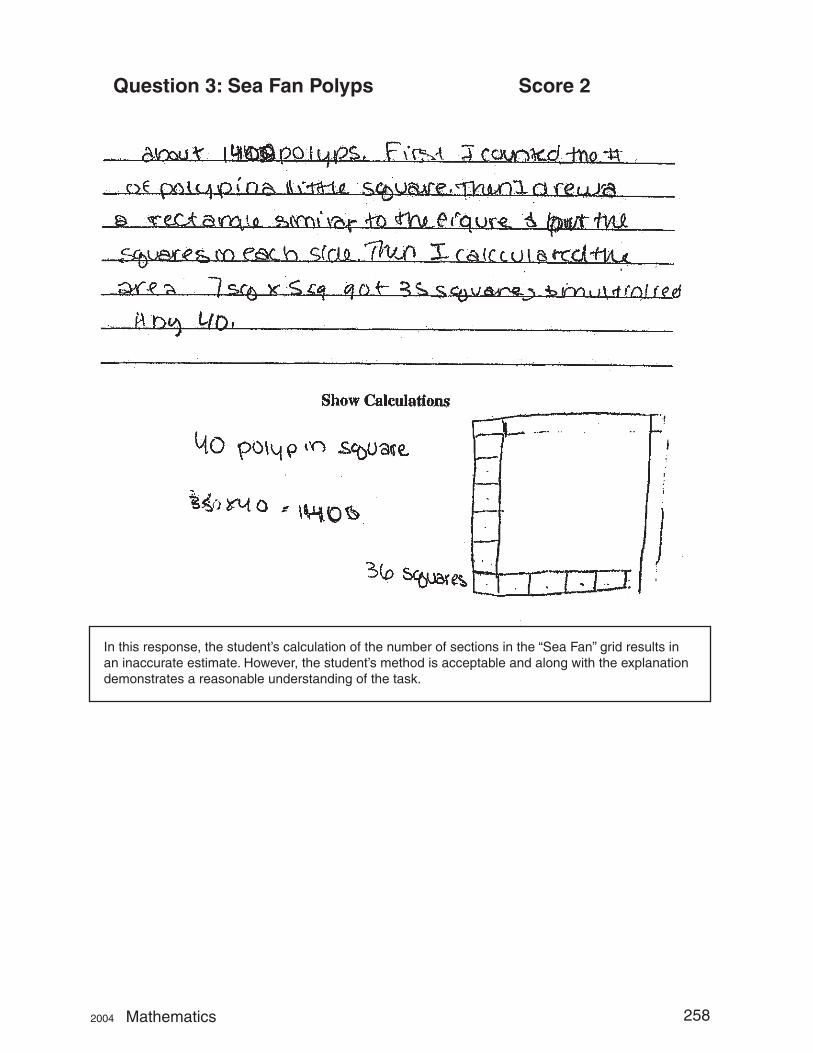
Question 3: Sea Fan Polyps Score 2
In this response, the student’s calculation of the number of sections in the “Sea Fan” grid results in an inaccurate estimate. However, the student’s method is acceptable and along with the explanation demonstrates a reasonable understanding of the task.
2004 Mathematics 258
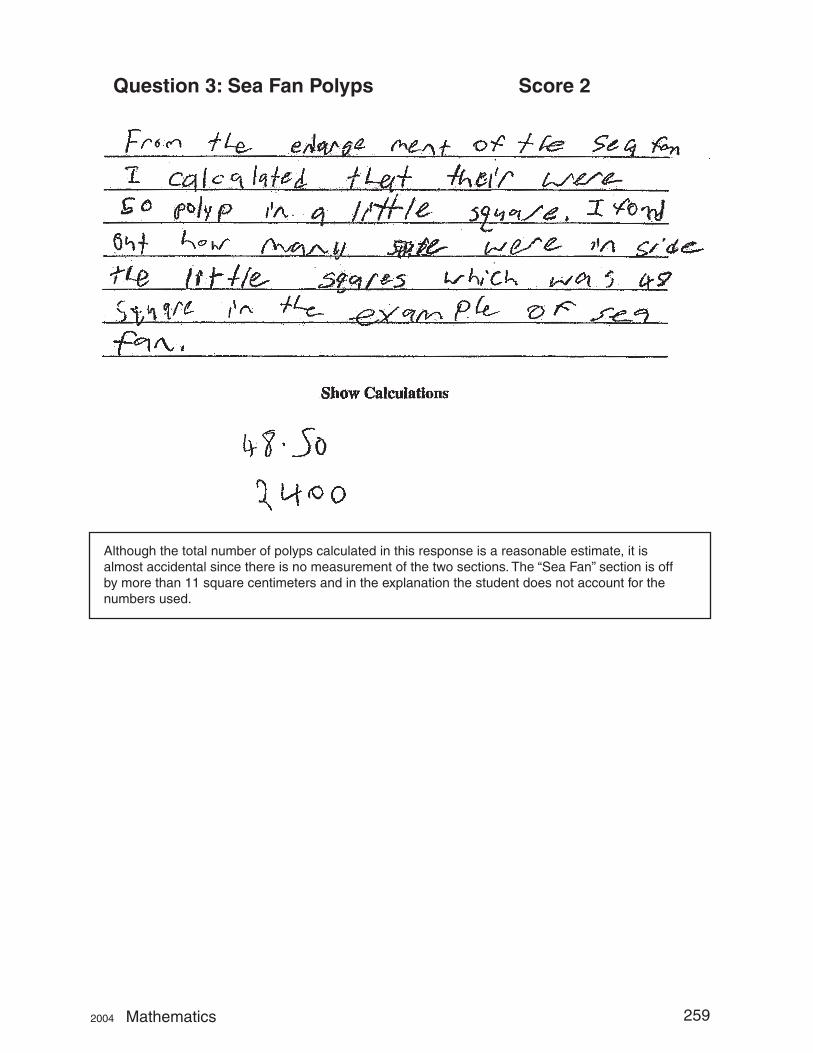
Question 3: Sea Fan Polyps Score 2
Although the total number of polyps calculated in this response is a reasonable estimate, it is almost accidental since there is no measurement of the two sections. The “Sea Fan” section is off by more than 11 square centimeters and in the explanation the student does not account for the numbers used.
2004 Mathematics 259
Question 3: Sea Fan Polyps Score 1
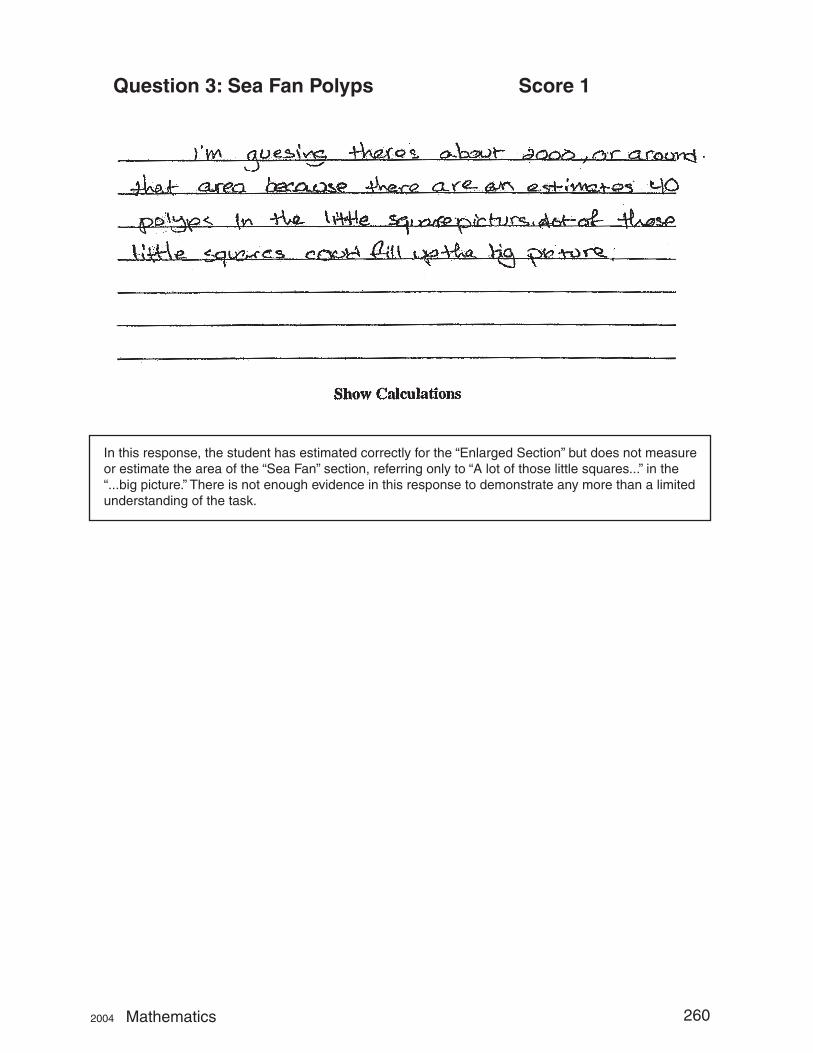
In this response, the student has estimated correctly for the “Enlarged Section” but does not measure or estimate the area of the “Sea Fan” section, referring only to “A lot of those little squares...” in the “...big picture.” There is not enough evidence in this response to demonstrate any more than a limited understanding of the task.
2004 Mathematics 260
Question 3: Sea Fan Polyps Score 1
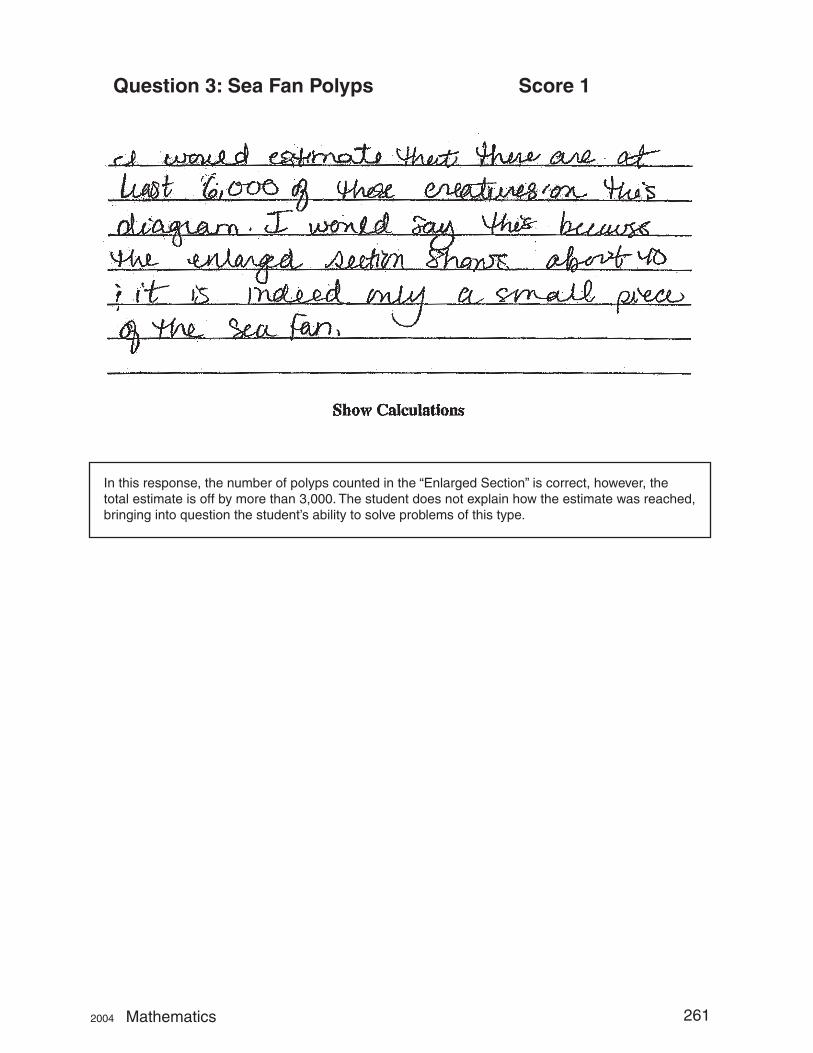
In this response, the number of polyps counted in the “Enlarged Section” is correct, however, the total estimate is off by more than 3,000. The student does not explain how the estimate was reached, bringing into question the student’s ability to solve problems of this type.
2004 Mathematics 261
Question 3: Sea Fan Polyps Score 0
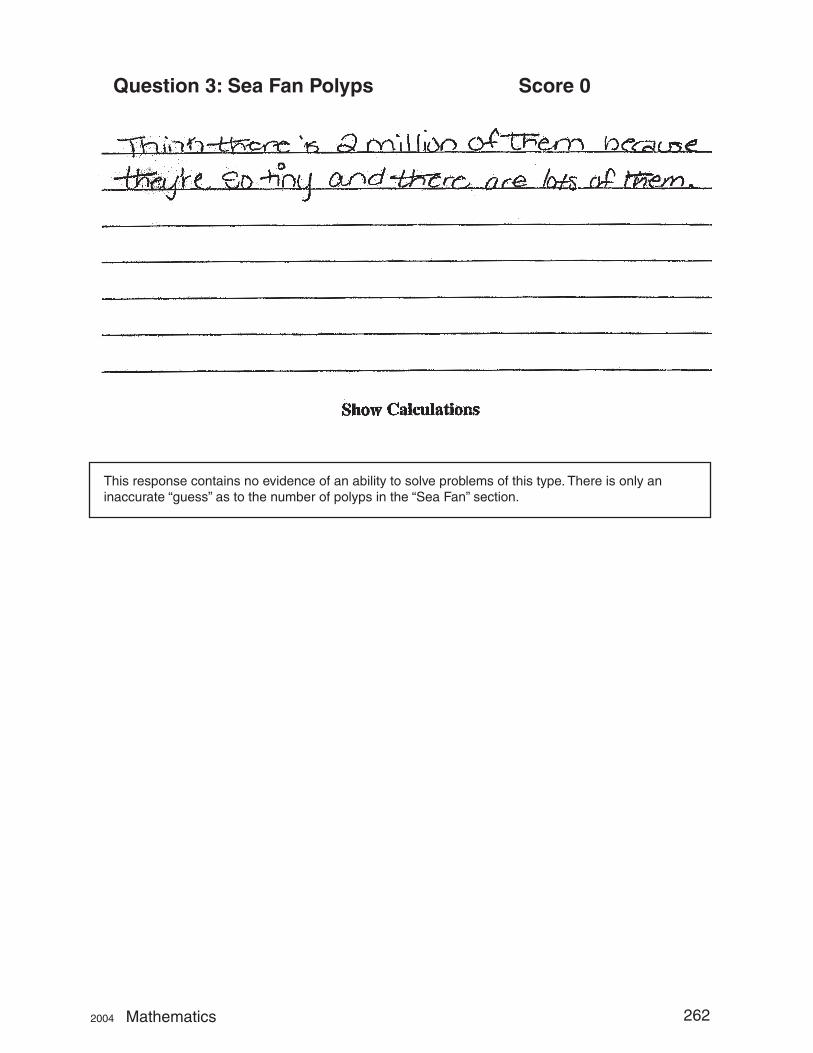
This response contains no evidence of an ability to solve problems of this type. There is only an inaccurate “guess” as to the number of polyps in the “Sea Fan” section.
2004 Mathematics 262
Question 3: Sea Fan Polyps Score 0
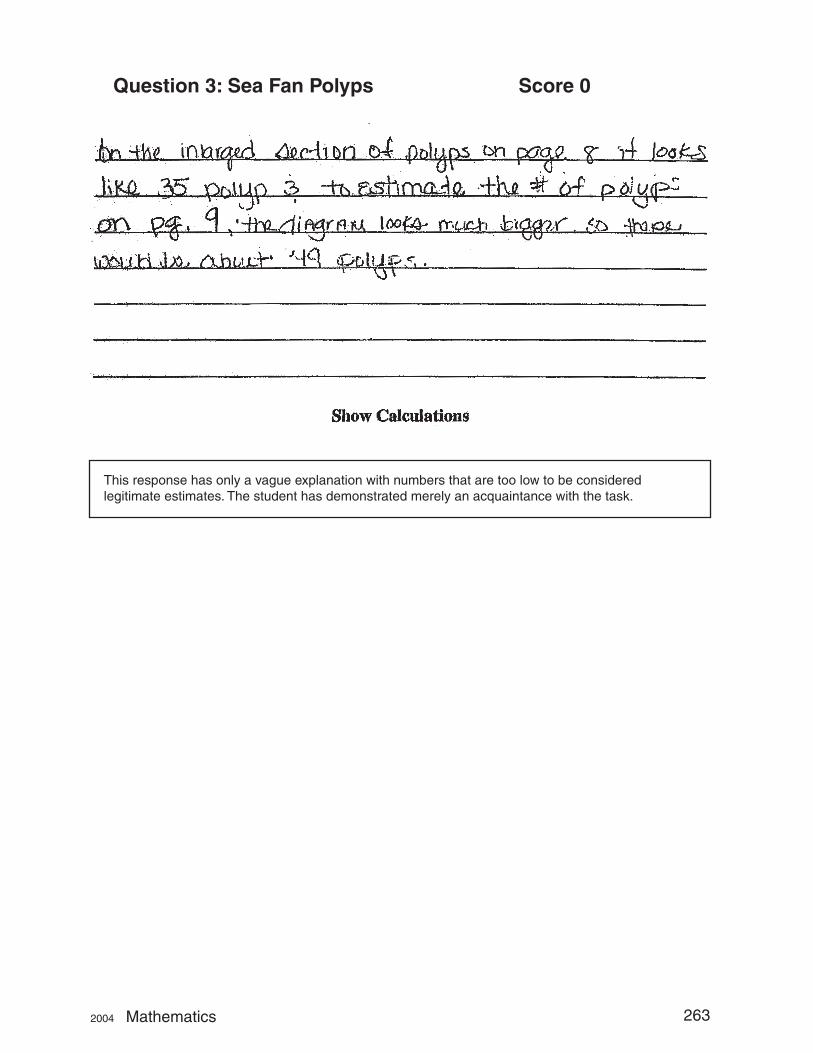
This response has only a vague explanation with numbers that are too low to be consideredlegitimate estimates. The student has demonstrated merely an acquaintance with the task.
2004 Mathematics 263
Car Depreciation Algebra & Functions
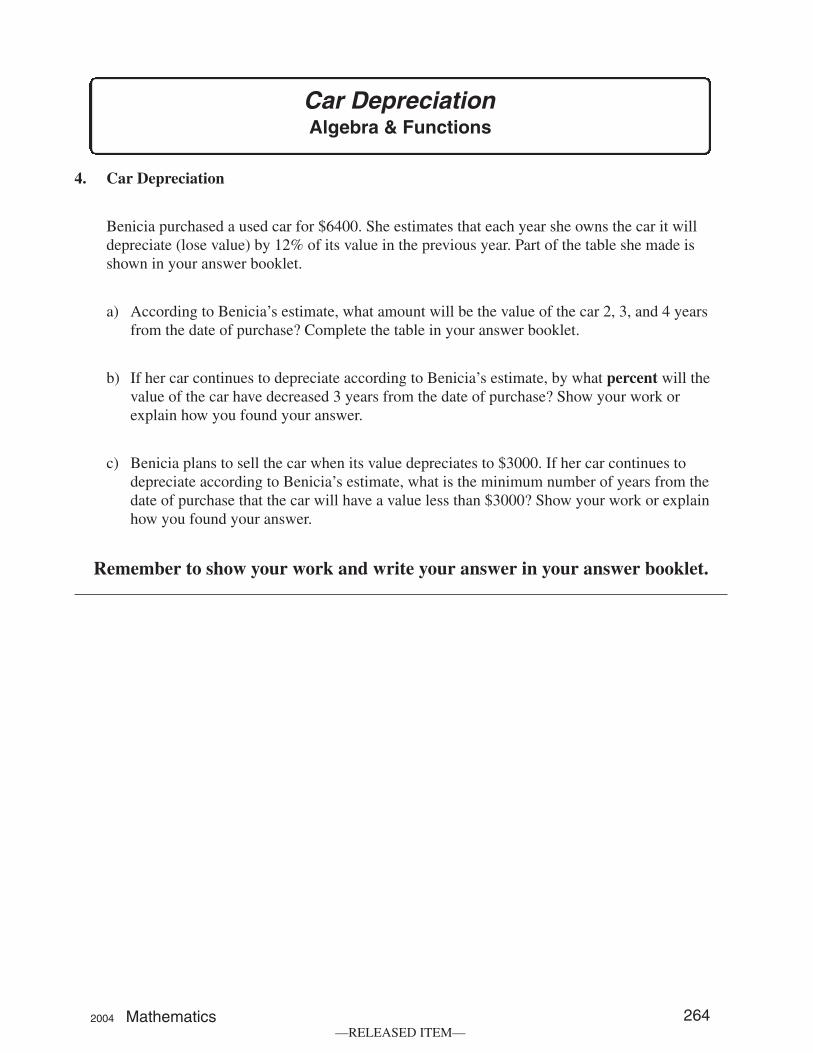
4. Car Depreciation
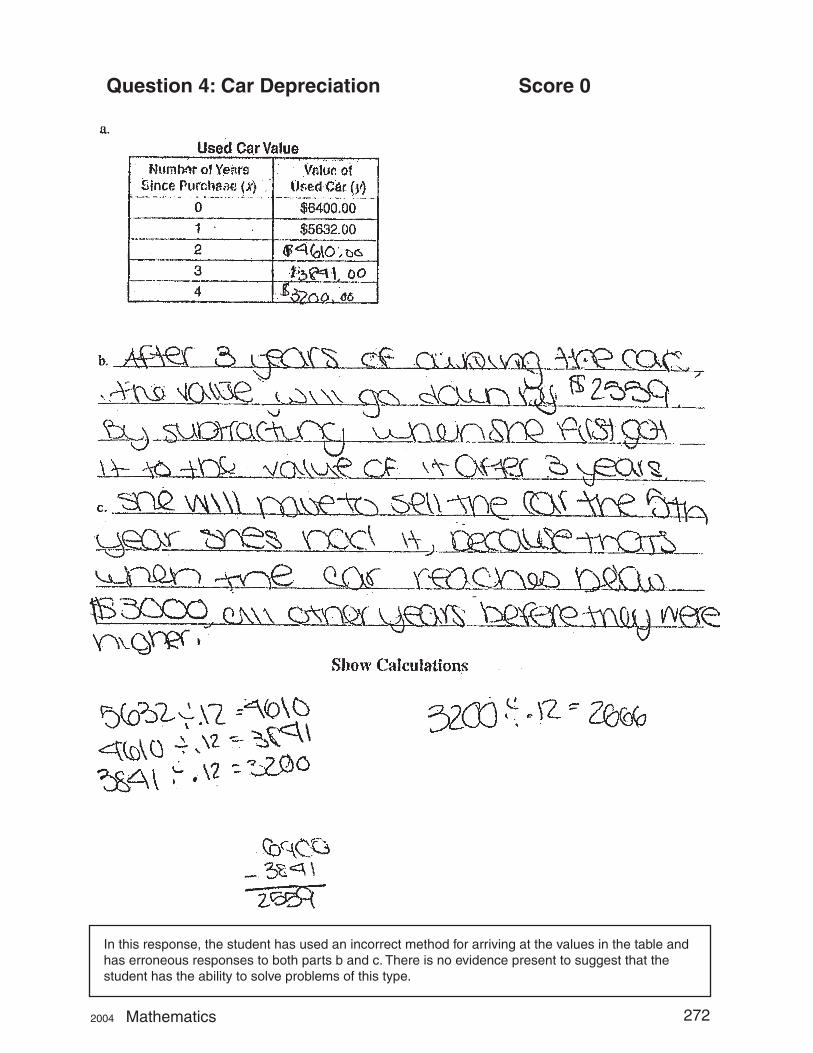
Benicia purchased a used car for $6400. She estimates that each year she owns the car it will depreciate (lose value) by 12% of its value in the previous year. Part of the table she made is shown in your answer booklet.
a) According to Benicia’s estimate, what amount will be the value of the car 2, 3, and 4 years from the date of purchase? Complete the table in your answer booklet.
b) If her car continues to depreciate according to Benicia’s estimate, by what percent will the value of the car have decreased 3 years from the date of purchase? Show your work or explain how you found your answer.
c) Benicia plans to sell the car when its value depreciates to $3000. If her car continues to depreciate according to Benicia’s estimate, what is the minimum number of years from the date of purchase that the car will have a value less than $3000? Show your work or explain how you found your answer.
Remember to show your work and write your answer in your answer booklet.
2004 Mathematics 264 —RELEASED ITEM—
Car DepreciationScored Student Responses for
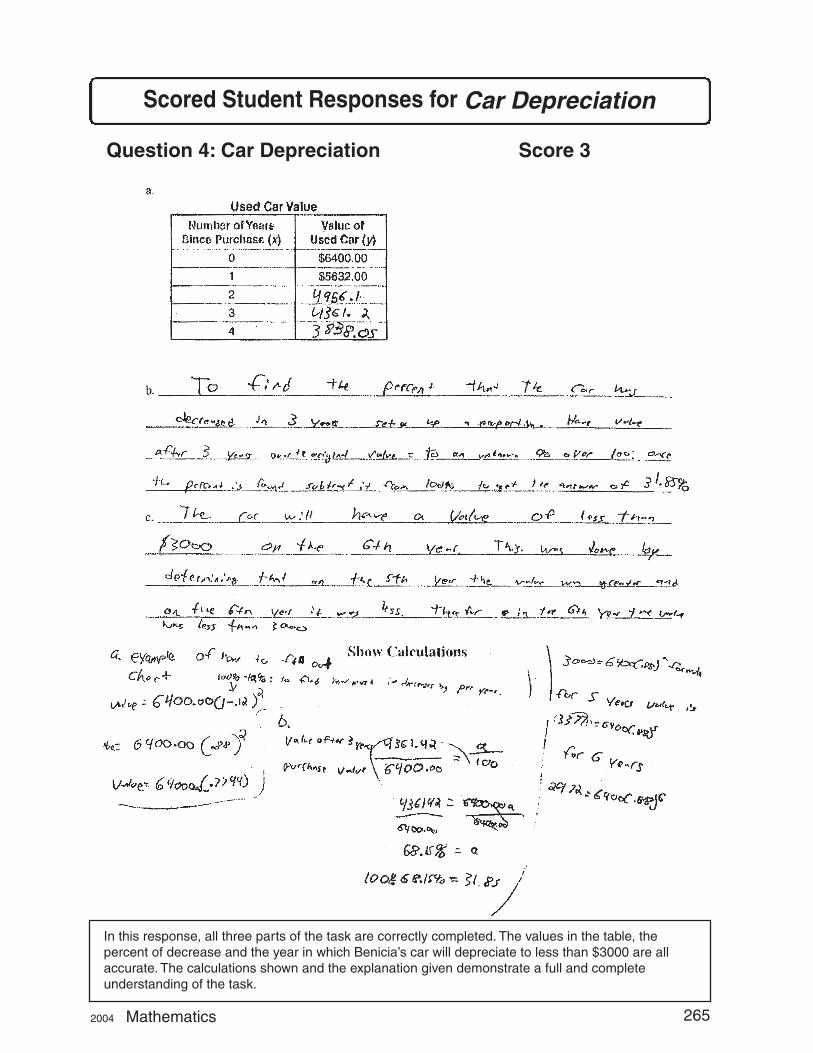
Question 4: Car Depreciation Score 3
understanding of the task.
In this response, all three parts of the task are correctly completed. The values in the table, the percent of decrease and the year in which Benicia’s car will depreciate to less than $3000 are all accurate. The calculations shown and the explanation given demonstrate a full and complete
2004 Mathematics 265
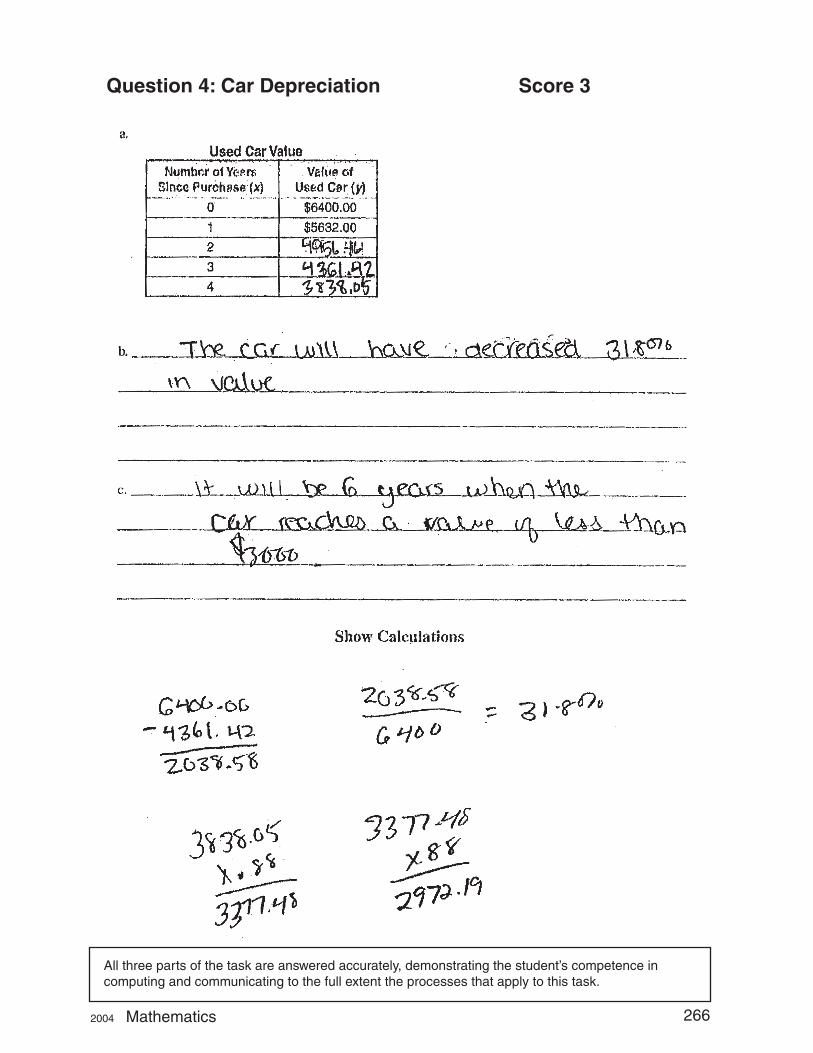
Question 4: Car Depreciation Score 3
All three parts of the task are answered accurately, demonstrating the student’s competence in computing and communicating to the full extent the processes that apply to this task.
2004 Mathematics 266
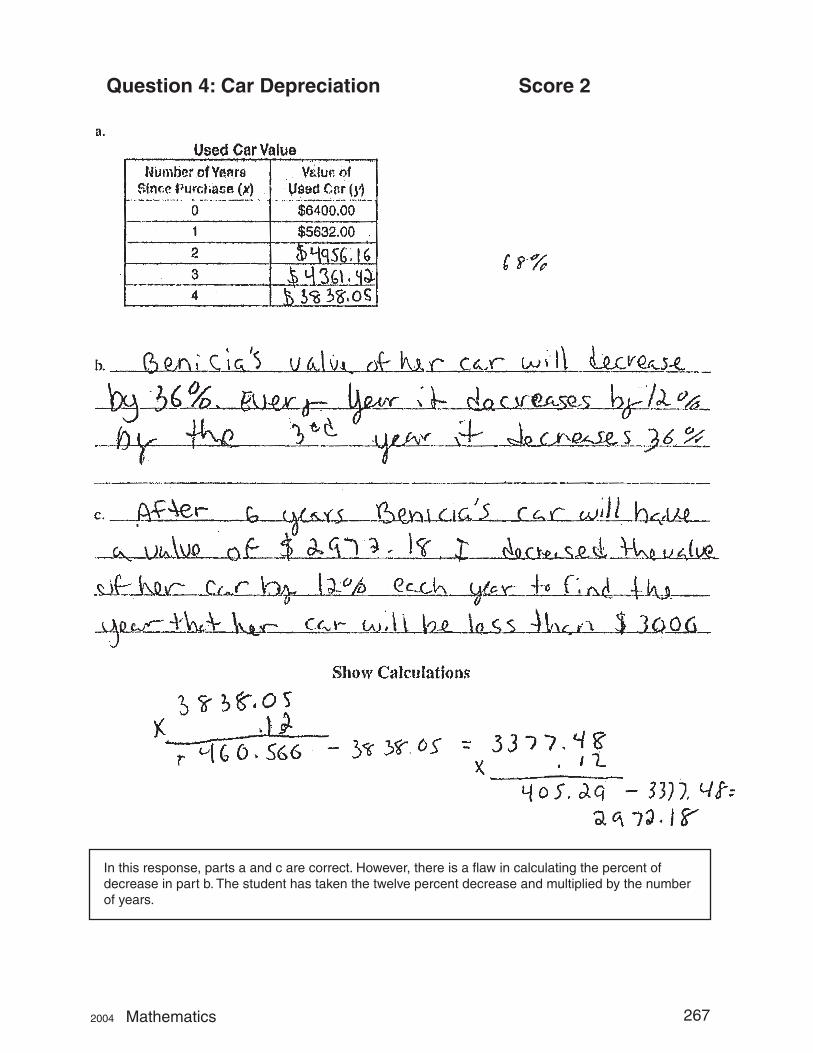
Question 4: Car Depreciation Score 2
In this response, parts a and c are correct. However, there is a flaw in calculating the percent of decrease in part b. The student has taken the twelve percent decrease and multiplied by the number of years.
2004 Mathematics 267
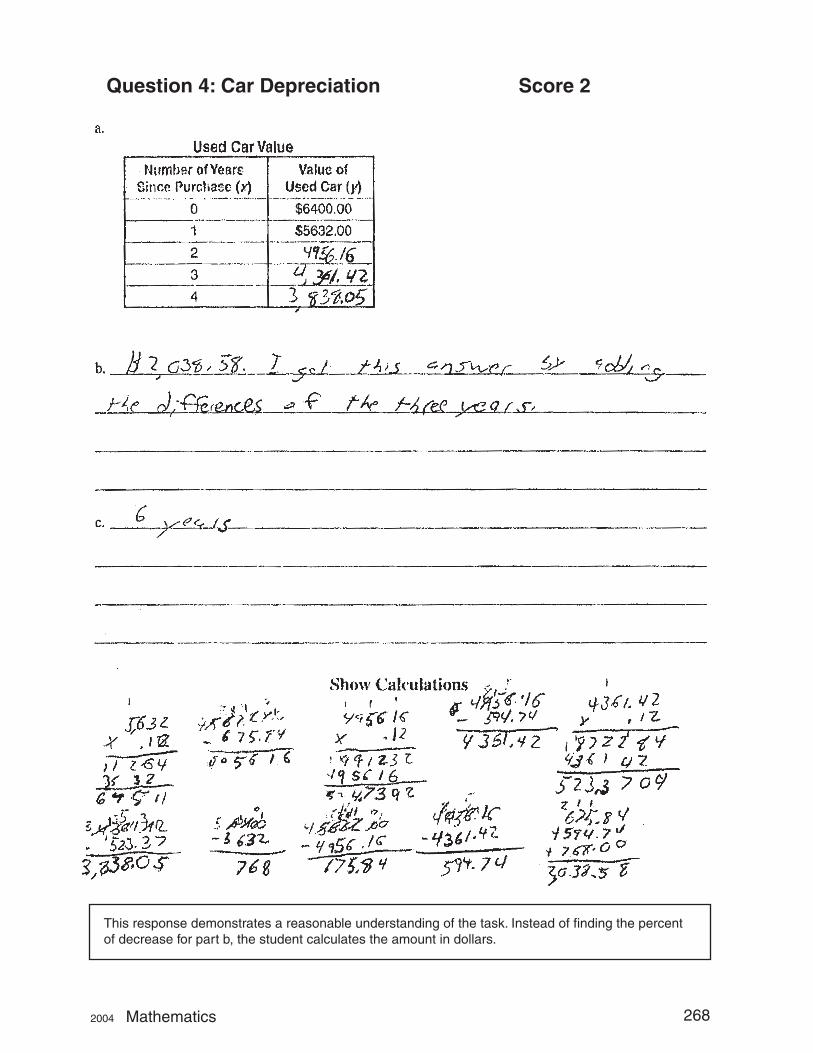
Question 4: Car Depreciation Score 2
This response demonstrates a reasonable understanding of the task. Instead of finding the percent of decrease for part b, the student calculates the amount in dollars.
2004 Mathematics 268
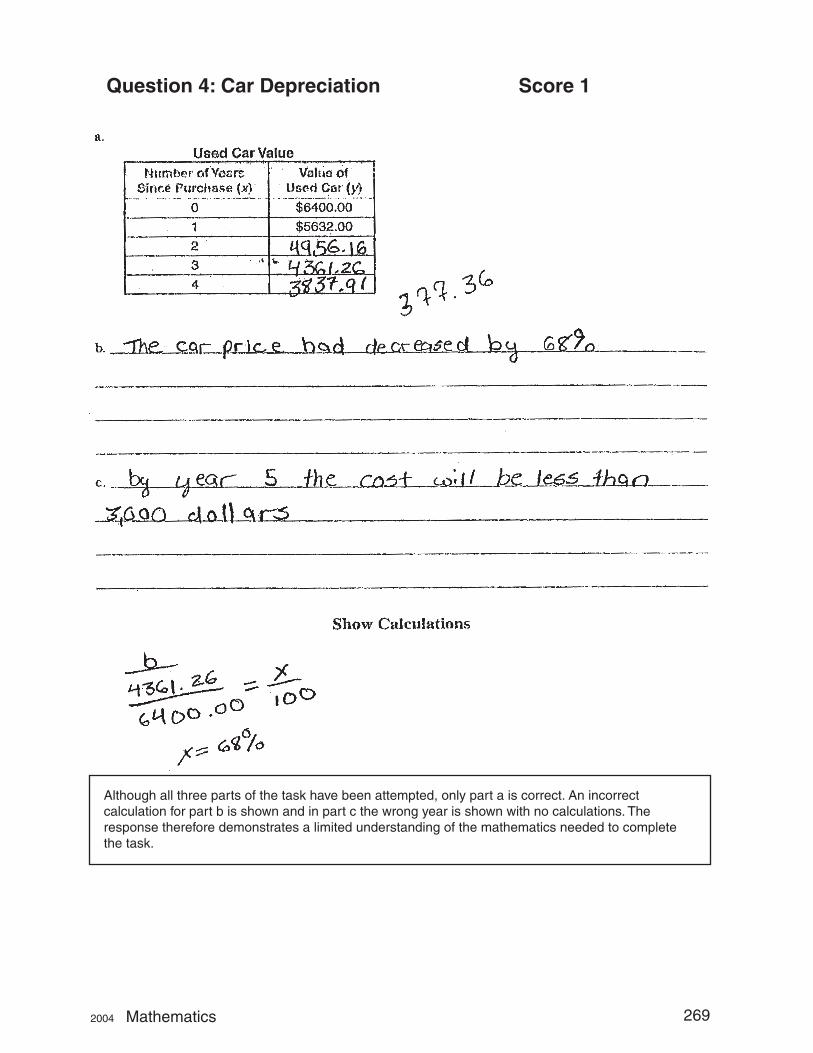
Question 4: Car Depreciation Score 1
Although all three parts of the task have been attempted, only part a is correct. An incorrect calculation for part b is shown and in part c the wrong year is shown with no calculations. The response therefore demonstrates a limited understanding of the mathematics needed to complete the task.
2004 Mathematics 269
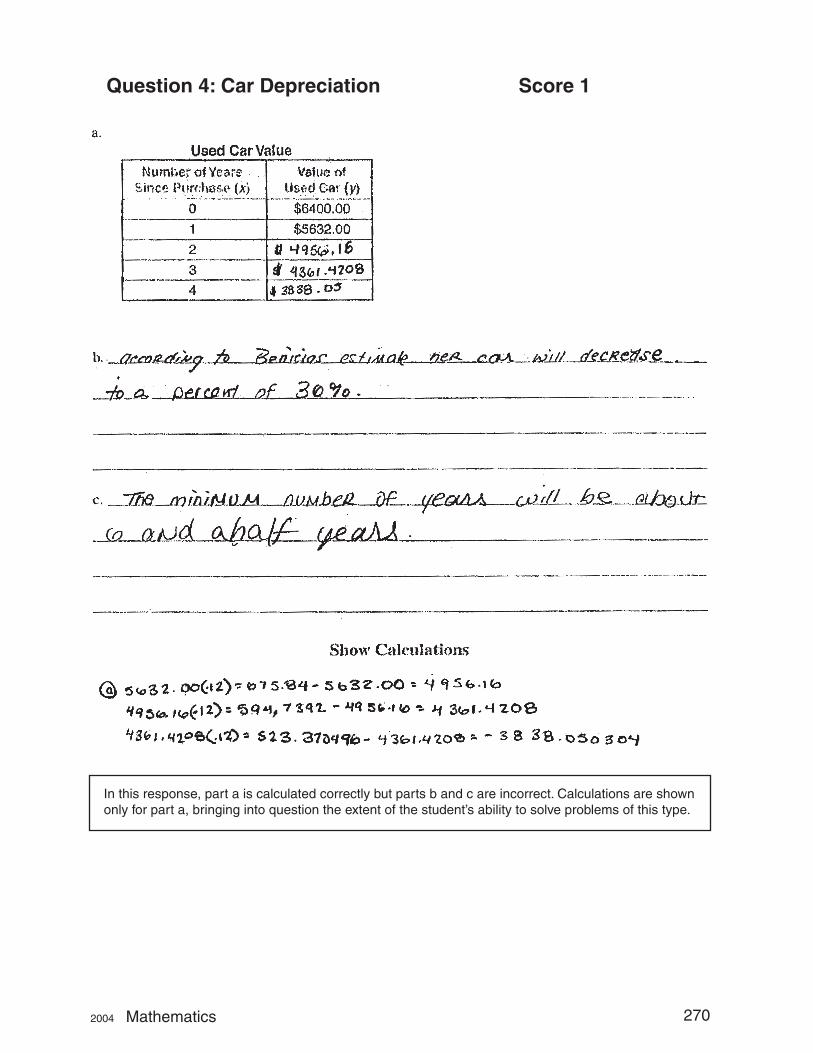
Question 4: Car Depreciation Score 1
In this response, part a is calculated correctly but parts b and c are incorrect. Calculations are shownonly for part a, bringing into question the extent of the student’s ability to solve problems of this type.
2004 Mathematics 270
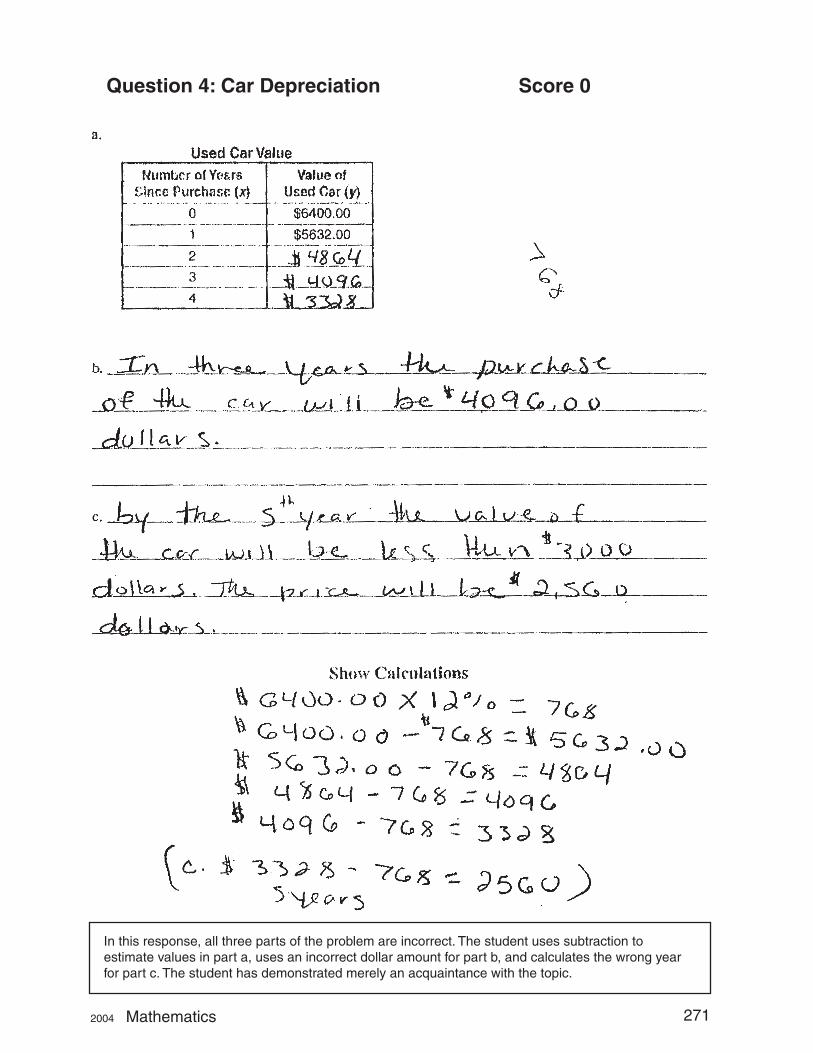
Question 4: Car Depreciation Score 0
In this response, all three parts of the problem are incorrect. The student uses subtraction to estimate values in part a, uses an incorrect dollar amount for part b, and calculates the wrong year for part c. The student has demonstrated merely an acquaintance with the topic.
2004 Mathematics 271
Question 4: Car Depreciation Score 0
In this response, the student has used an incorrect method for arriving at the values in the table and has erroneous responses to both parts b and c. There is no evidence present to suggest that the student has the ability to solve problems of this type.
2004 Mathematics 272
Sports Playoffs Statistics, Probability & Discreet Mathematics
5. Sports Playoffs
In the first round of a sports playoff, each team plays a 5-game series against another team. The first team to win 3 games wins the 5-game series. For example, WLLWW shows that a team won the first game, lost the next two, and then won the last two games.
List all the possible arrangements of wins and losses for a team to win a 5-game series. Keep in mind the series ends when a team wins a total of 3 games.
Remember to show your work and write your answer in your answer booklet.
2004 Mathematics 273 —RELEASED ITEM—
Scored Student Responses for Sports Playoffs
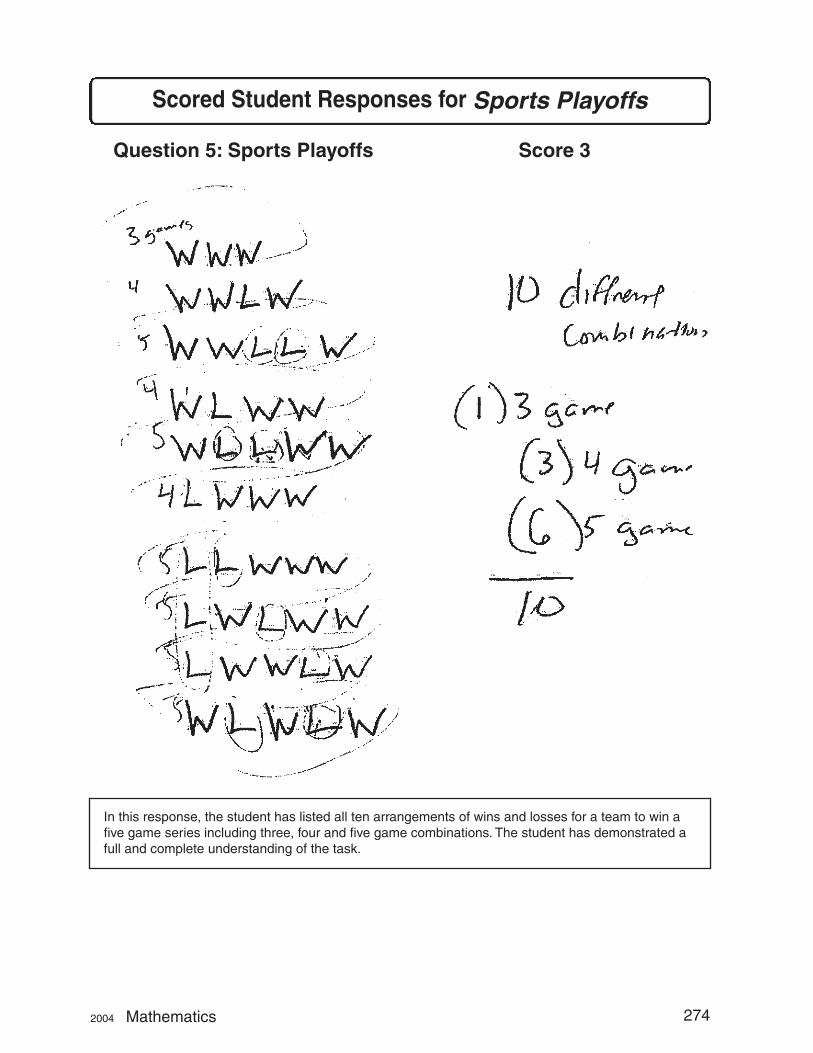
Question 5: Sports Playoffs Score 3
In this response, the student has listed all ten arrangements of wins and losses for a team to win a five game series including three, four and five game combinations. The student has demonstrated a full and complete understanding of the task.
2004 Mathematics 274
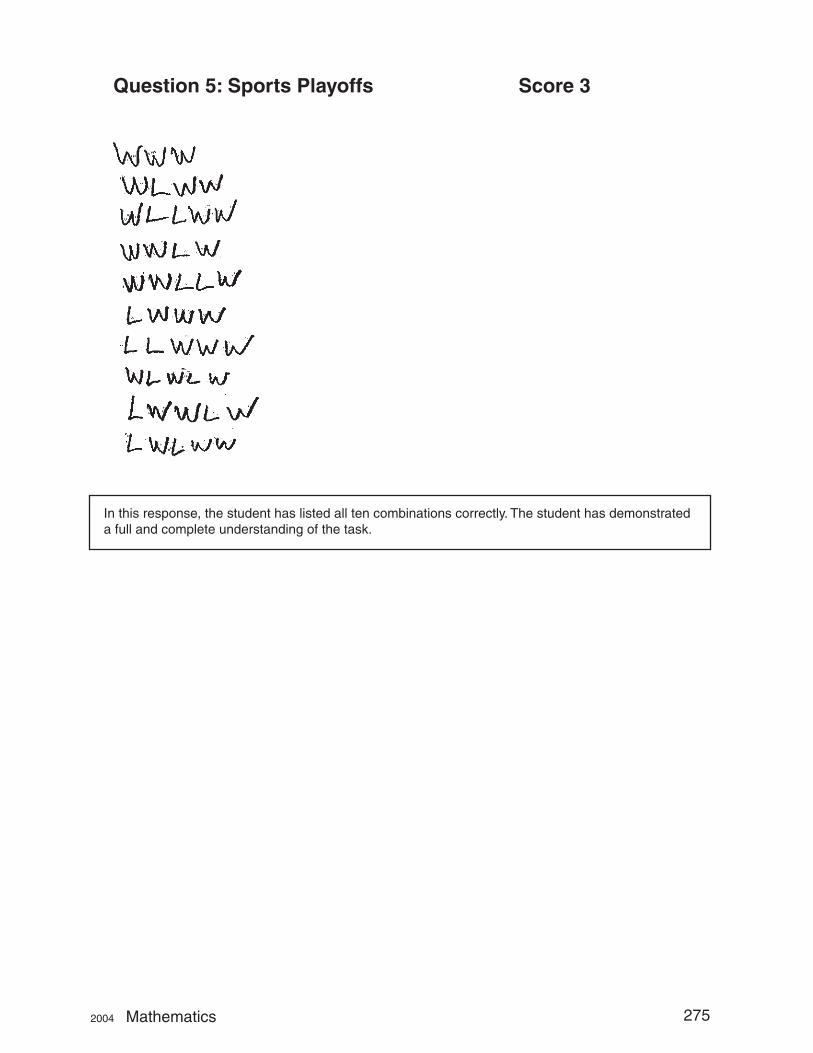
Question 5: Sports Playoffs Score 3
In this response, the student has listed all ten combinations correctly. The student has demonstrated a full and complete understanding of the task.
2004 Mathematics 275
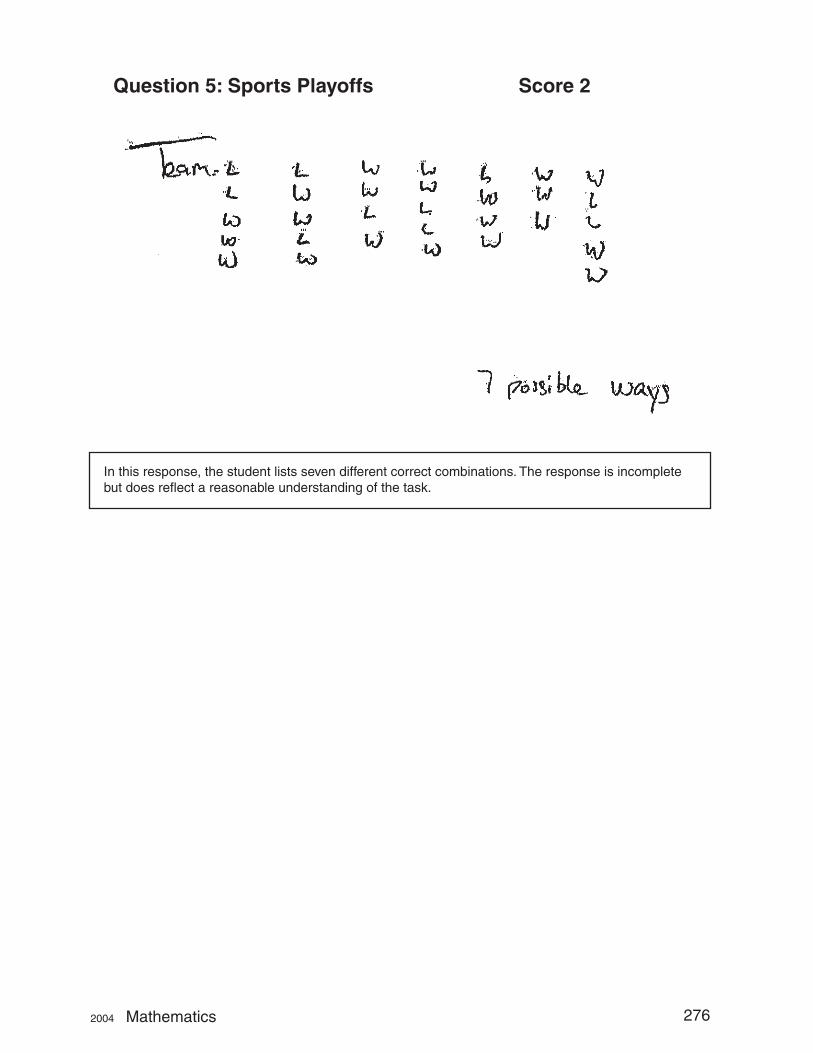
Question 5: Sports Playoffs Score 2
In this response, the student lists seven different correct combinations. The response is incomplete but does reflect a reasonable understanding of the task.
2004 Mathematics 276
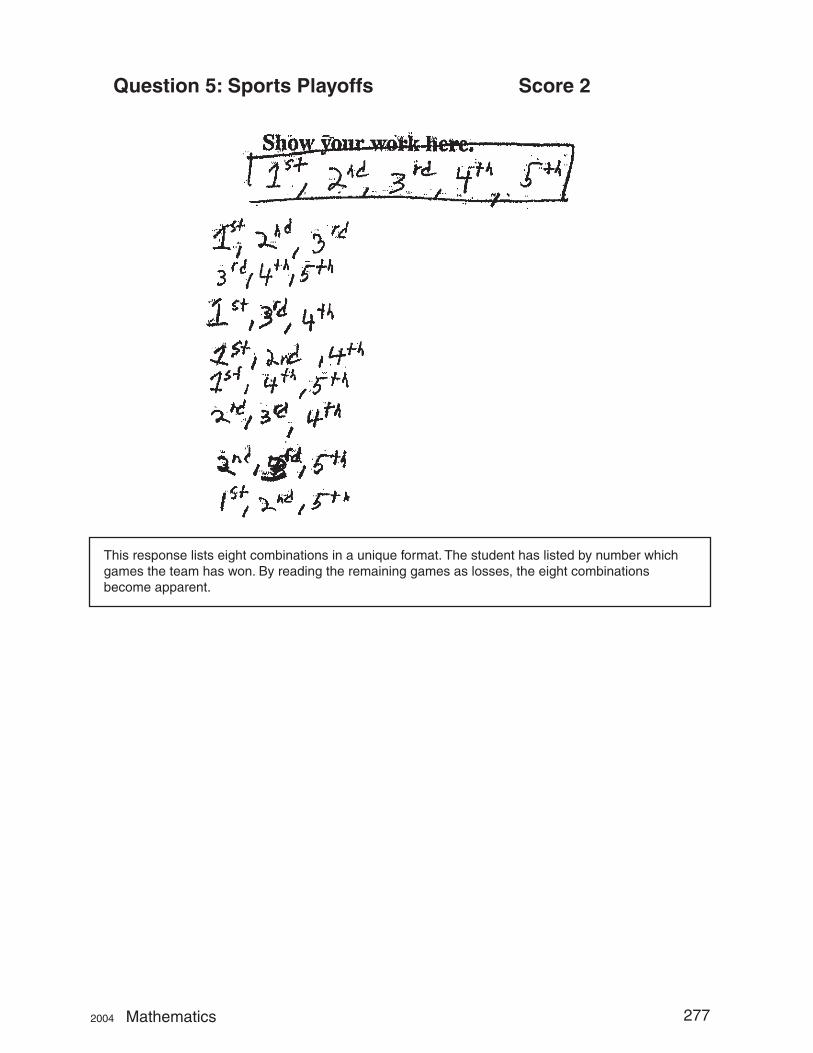
Question 5: Sports Playoffs Score 2
This response lists eight combinations in a unique format. The student has listed by number which games the team has won. By reading the remaining games as losses, the eight combinations become apparent.
2004 Mathematics 277
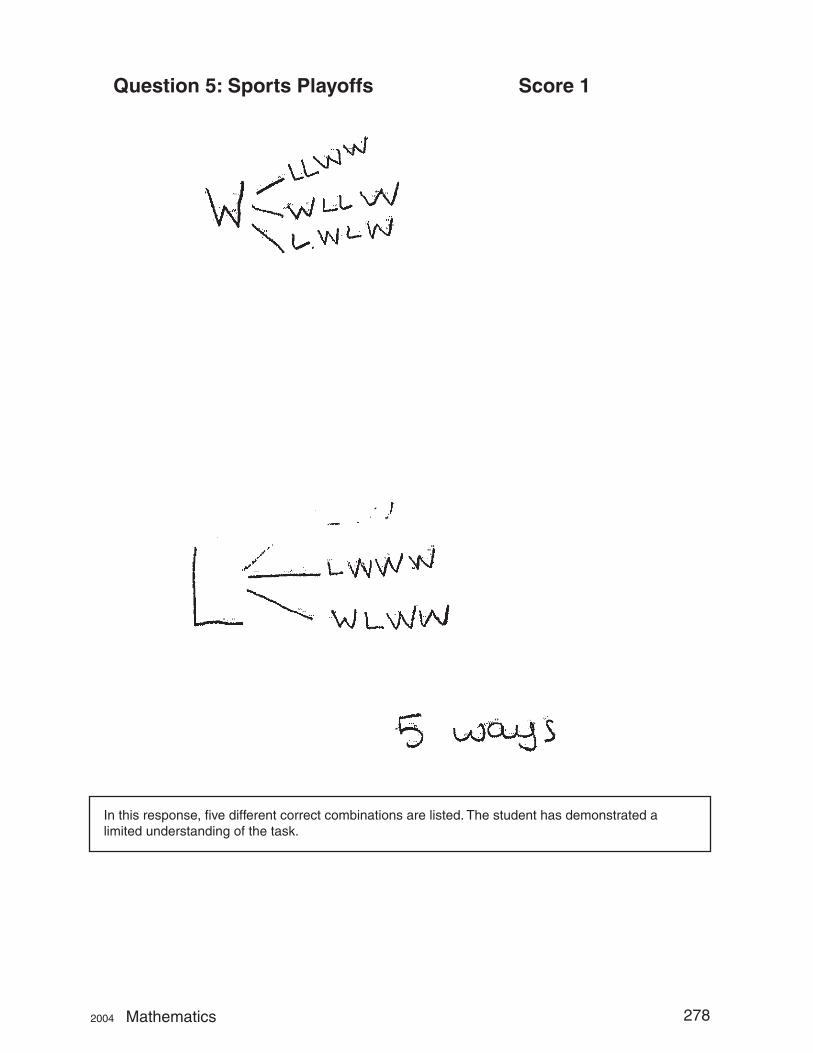
Question 5: Sports Playoffs Score 1
In this response, five different correct combinations are listed. The student has demonstrated a limited understanding of the task.
2004 Mathematics 278
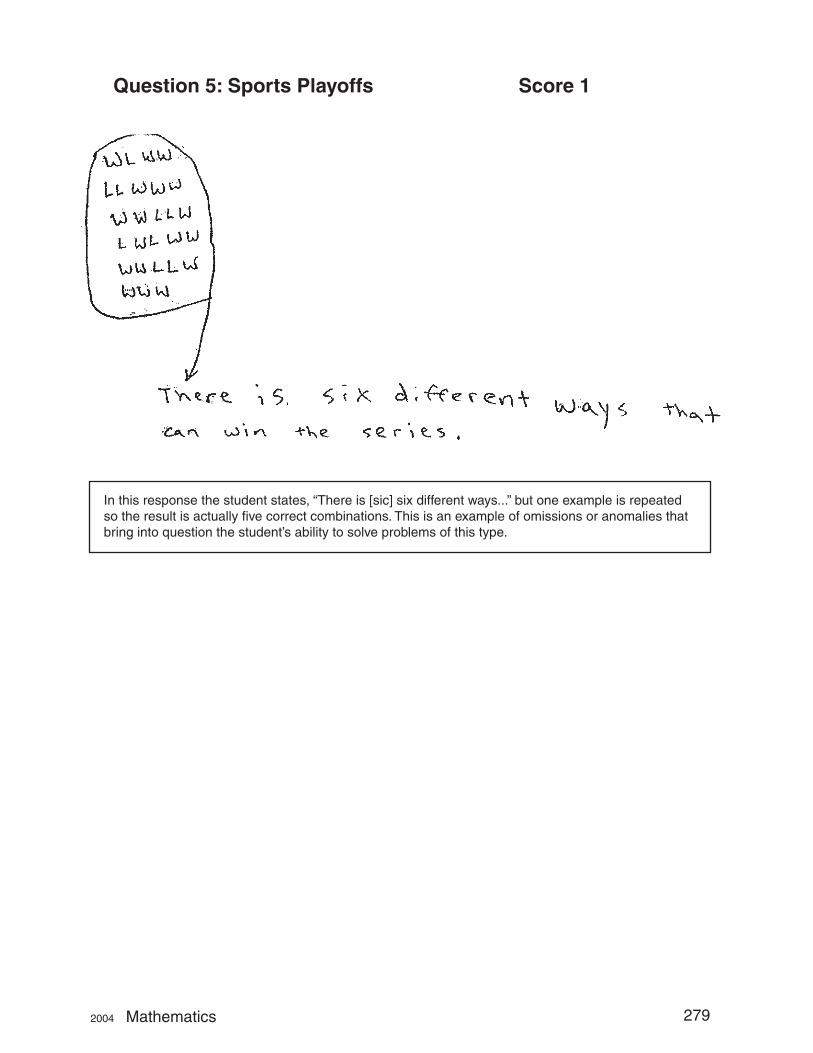
Question 5: Sports Playoffs Score 1
In this response the student states, “There is [sic] six different ways...” but one example is repeated so the result is actually five correct combinations. This is an example of omissions or anomalies that bring into question the student’s ability to solve problems of this type.
2004 Mathematics 279
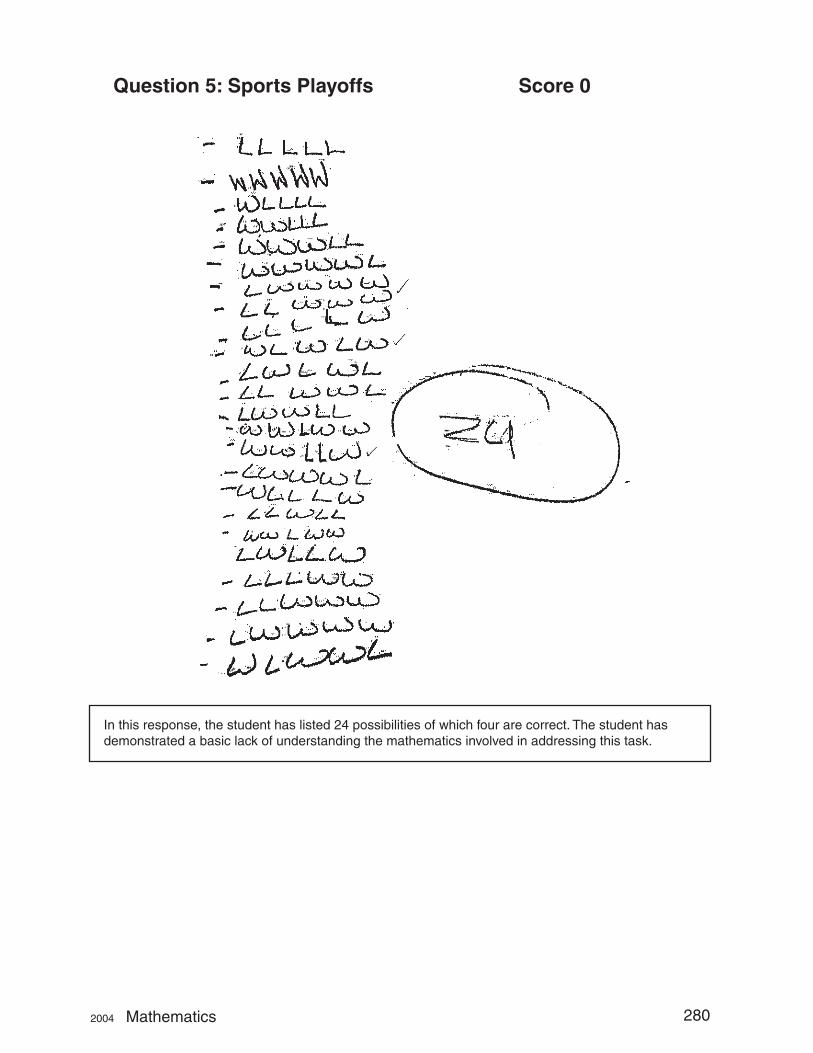
Question 5: Sports Playoffs Score 0
In this response, the student has listed 24 possibilities of which four are correct. The student has demonstrated a basic lack of understanding the mathematics involved in addressing this task.
2004 Mathematics 280
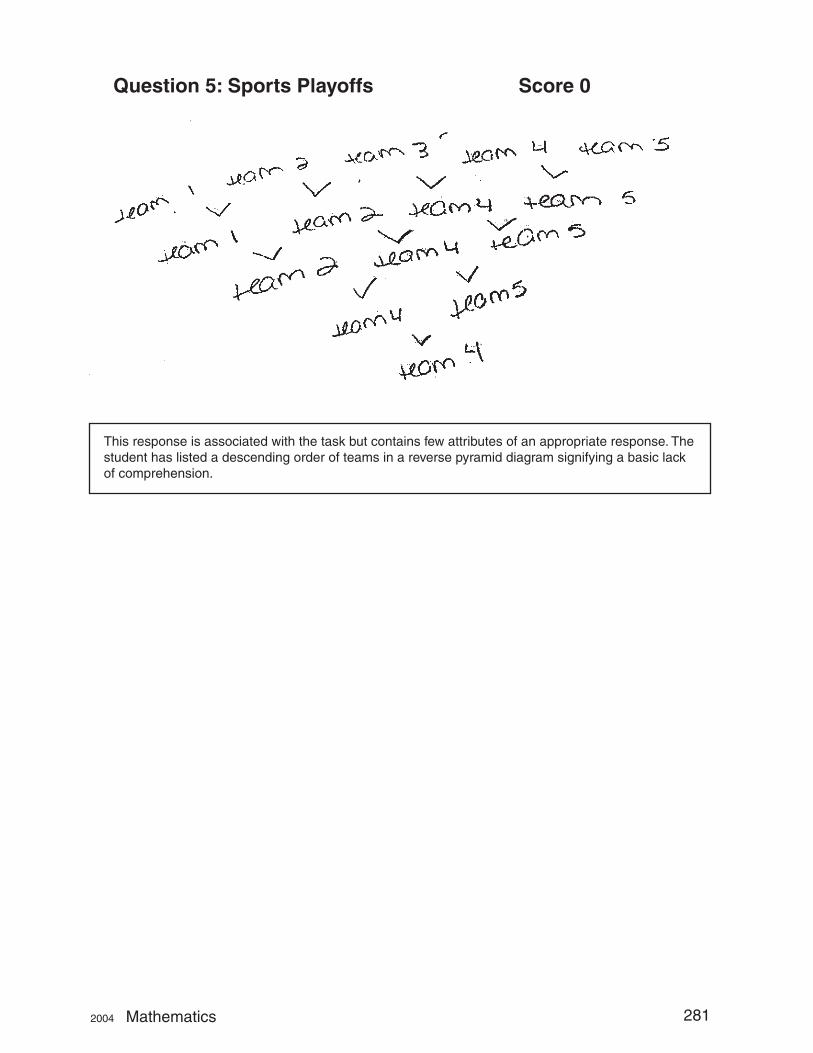
Question 5: Sports Playoffs Score 0
This response is associated with the task but contains few attributes of an appropriate response. The student has listed a descending order of teams in a reverse pyramid diagram signifying a basic lack of comprehension.
2004 Mathematics 281
Hot Air Ballooning Algebra & Functions
6. Hot Air Ballooning
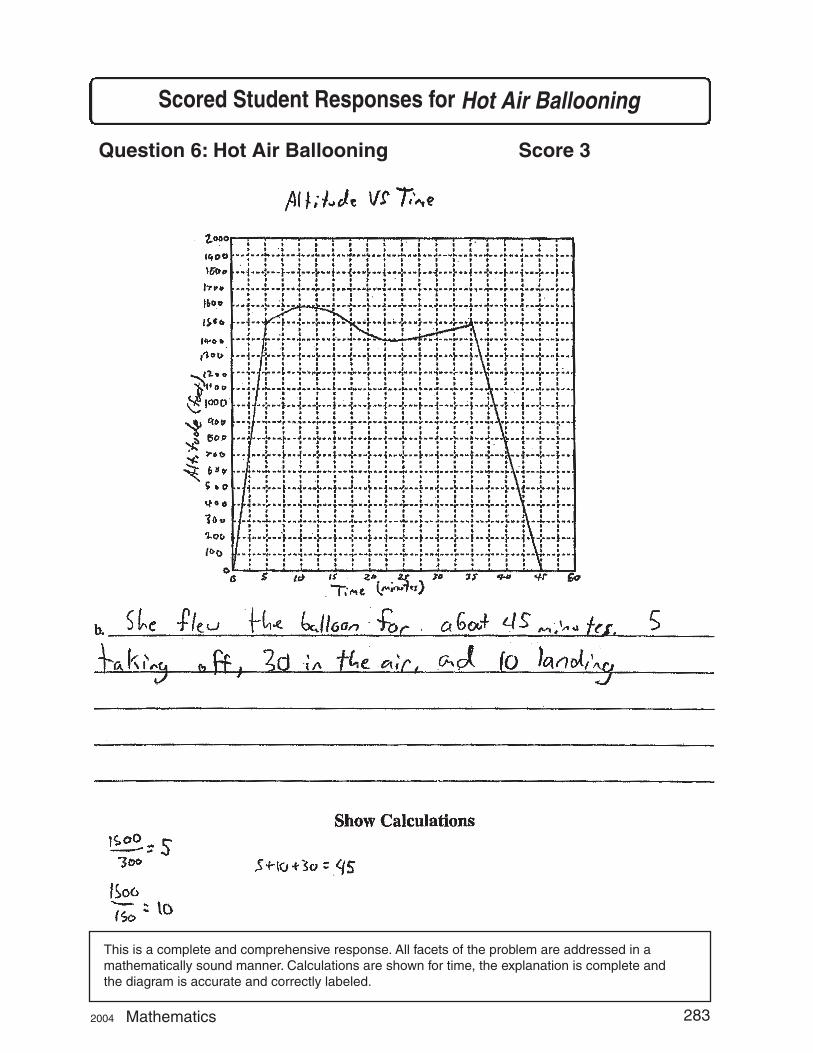
A hot air balloon pilot took her new balloon on a test flight. She made the balloon ascend to an altitude of 1,500 feet at 300 feet per minute. Then, for 30 minutes, she flew it at an altitude that varied between 1,600 and 1,400 feet. Finally, she made it descend for landing at a rate of 150 feet per minute.
a. Construct a graph on the grid provided in your answer booklet to represent the flight of the balloon. Use altitude as a function of time. Remember to title the graph and label the axes.
b. About how long was the total flight time of the balloon? Show your work or explain how you found your answer.
Remember to show your work and write your answer in your answer booklet.
2004 Mathematics 282 —RELEASED ITEM—
Hot Air BallooningScored Student Responses for
Question 6: Hot Air Ballooning Score 3
This is a complete and comprehensive response. All facets of the problem are addressed in a mathematically sound manner. Calculations are shown for time, the explanation is complete and the diagram is accurate and correctly labeled.
2004 Mathematics 283
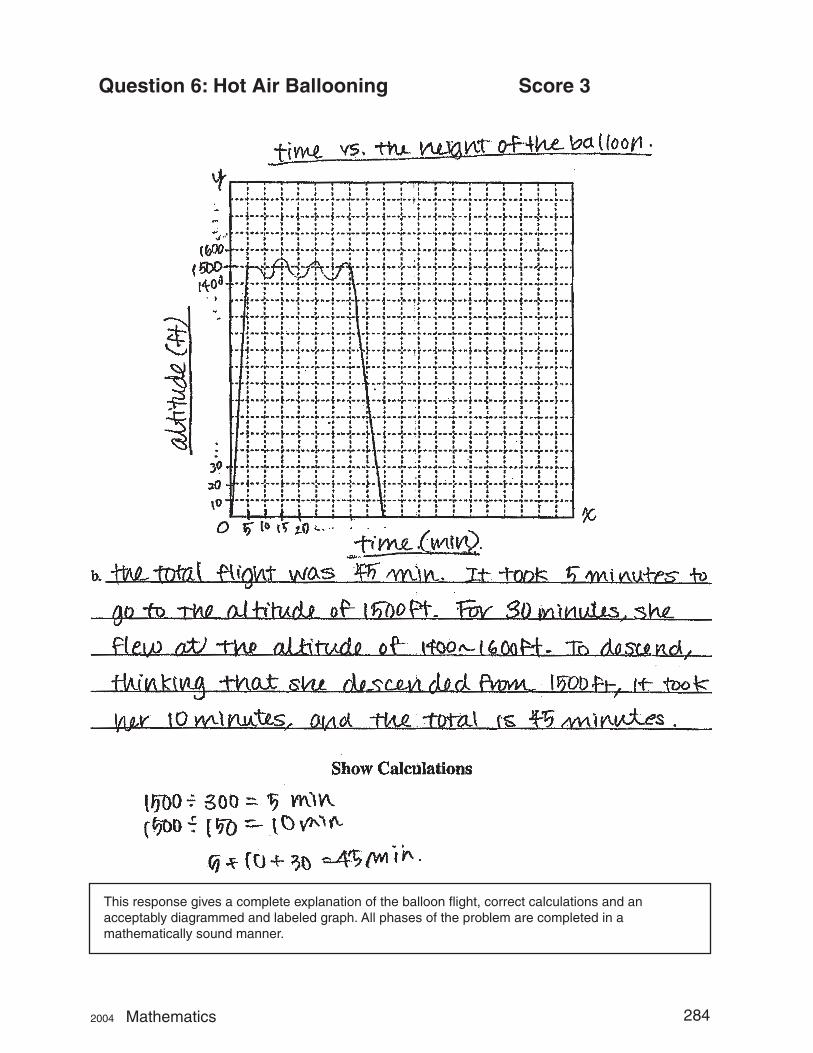
Question 6: Hot Air Ballooning Score 3
This response gives a complete explanation of the balloon flight, correct calculations and an acceptably diagrammed and labeled graph. All phases of the problem are completed in a mathematically sound manner.
2004 Mathematics 284
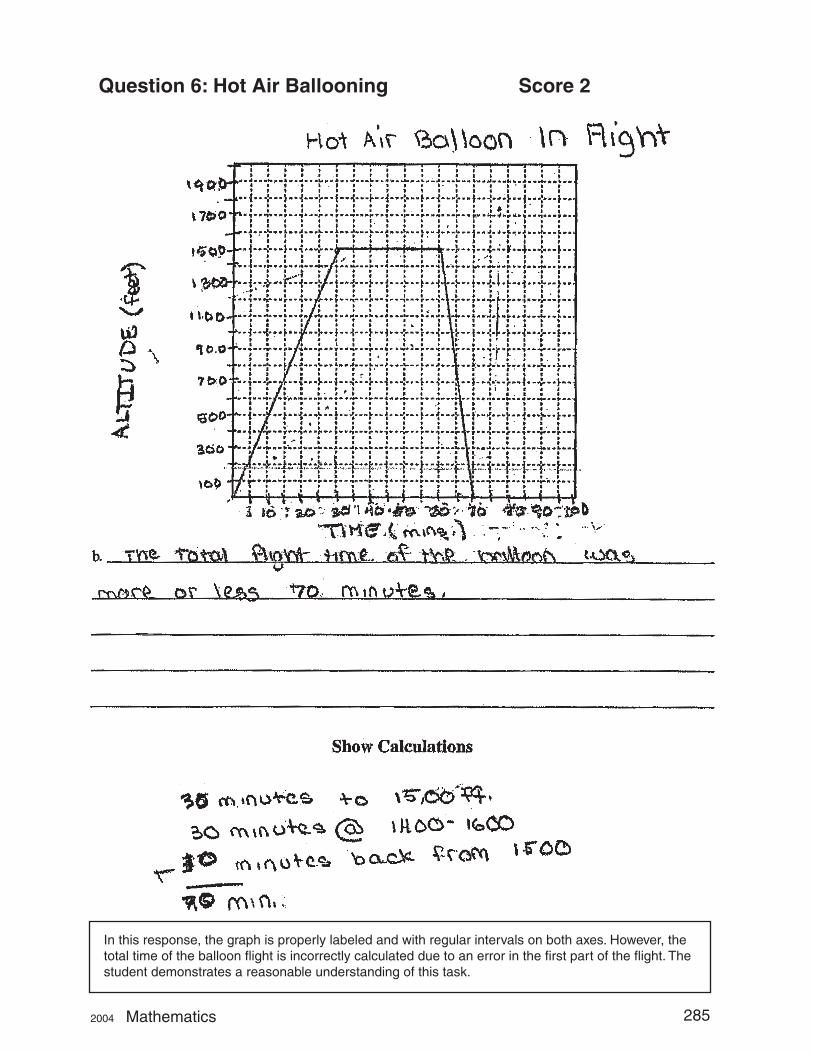
Question 6: Hot Air Ballooning Score 2
In this response, the graph is properly labeled and with regular intervals on both axes. However, the total time of the balloon flight is incorrectly calculated due to an error in the first part of the flight. The student demonstrates a reasonable understanding of this task.
2004 Mathematics 285
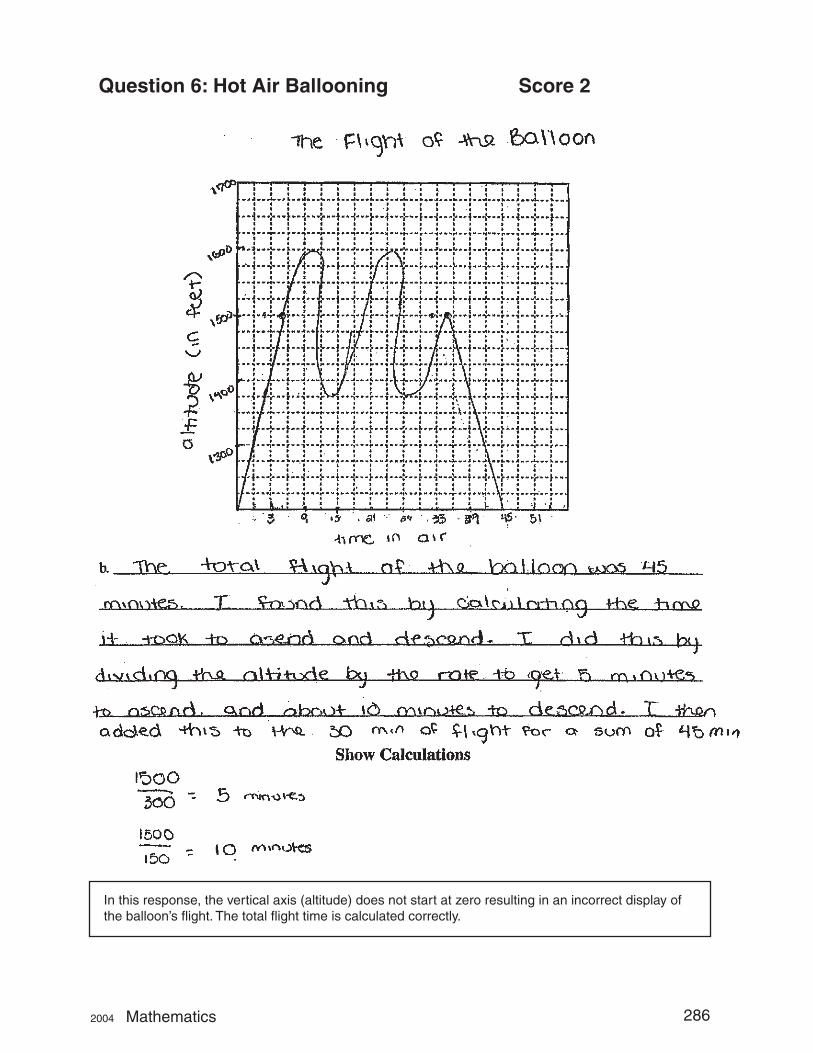
Question 6: Hot Air Ballooning Score 2
In this response, the vertical axis (altitude) does not start at zero resulting in an incorrect display of the balloon’s flight. The total flight time is calculated correctly.
2004 Mathematics 286
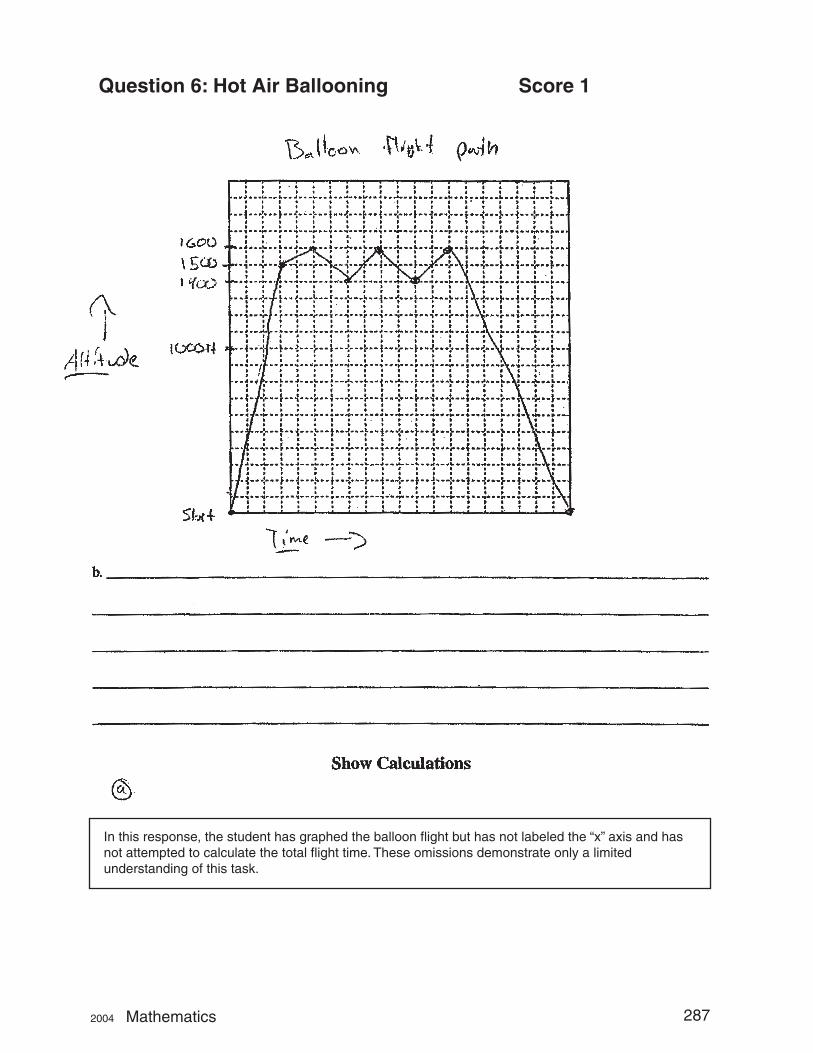
Question 6: Hot Air Ballooning Score 1
In this response, the student has graphed the balloon flight but has not labeled the “x” axis and has not attempted to calculate the total flight time. These omissions demonstrate only a limited understanding of this task.
2004 Mathematics 287
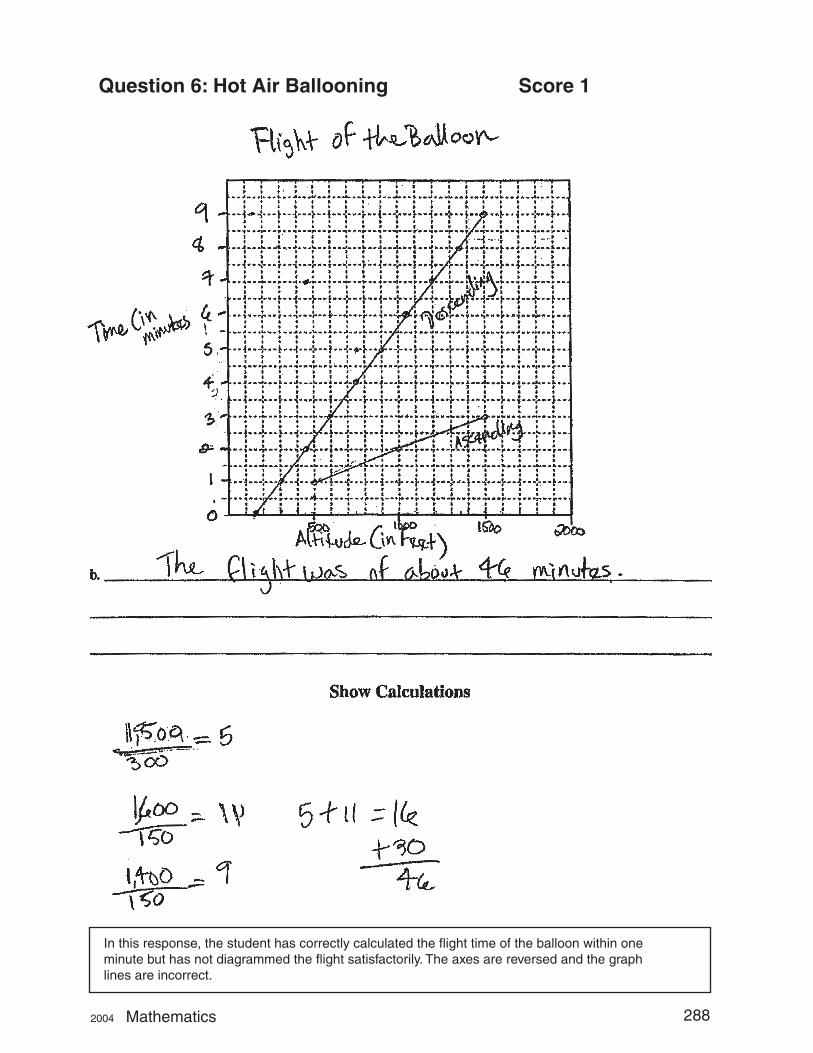
Question 6: Hot Air Ballooning Score 1
In this response, the student has correctly calculated the flight time of the balloon within one minute but has not diagrammed the flight satisfactorily. The axes are reversed and the graph lines are incorrect.
2004 Mathematics 288
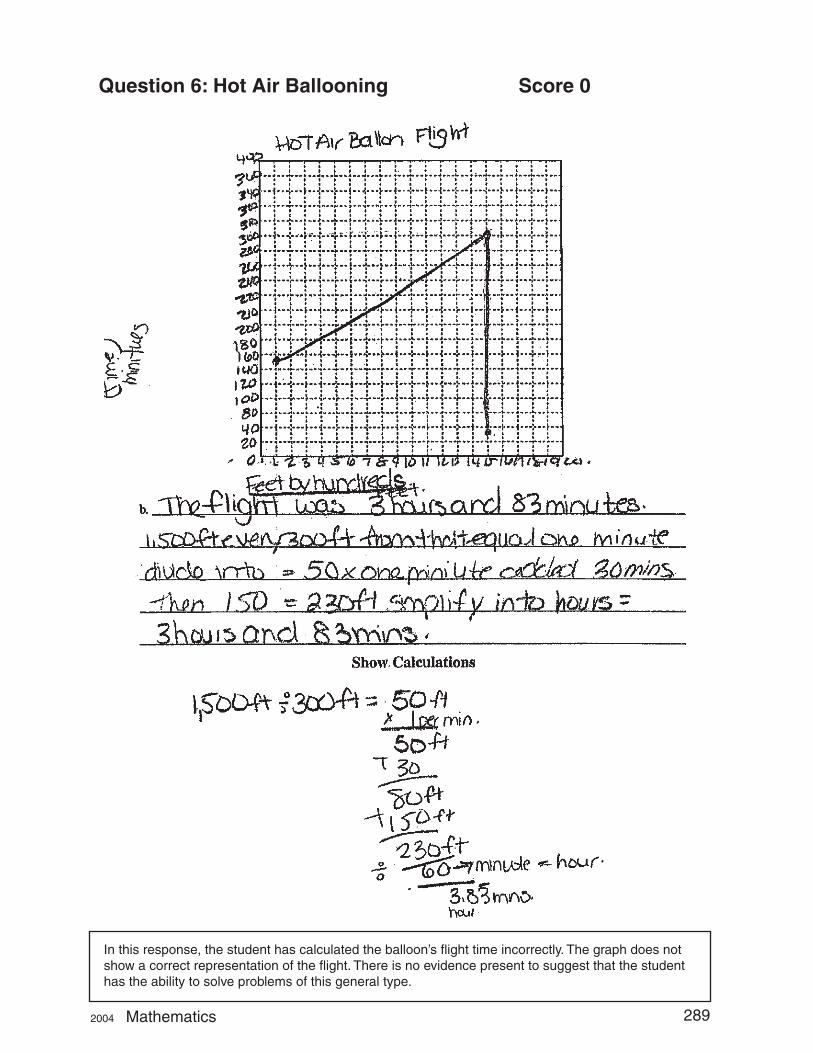
Question 6: Hot Air Ballooning Score 0
In this response, the student has calculated the balloon’s flight time incorrectly. The graph does not show a correct representation of the flight. There is no evidence present to suggest that the student has the ability to solve problems of this general type.
2004 Mathematics 289
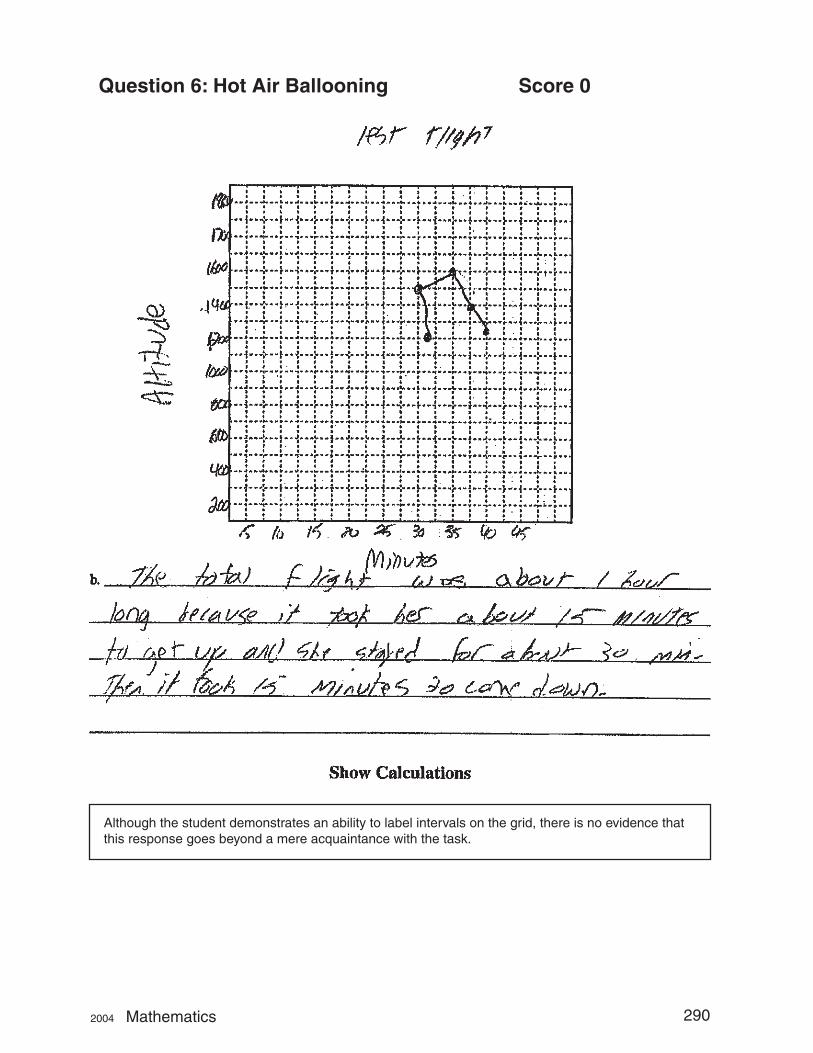
Question 6: Hot Air Ballooning Score 0
Although the student demonstrates an ability to label intervals on the grid, there is no evidence that this response goes beyond a mere acquaintance with the task.
2004 Mathematics 290
Number & Quantity Television Service
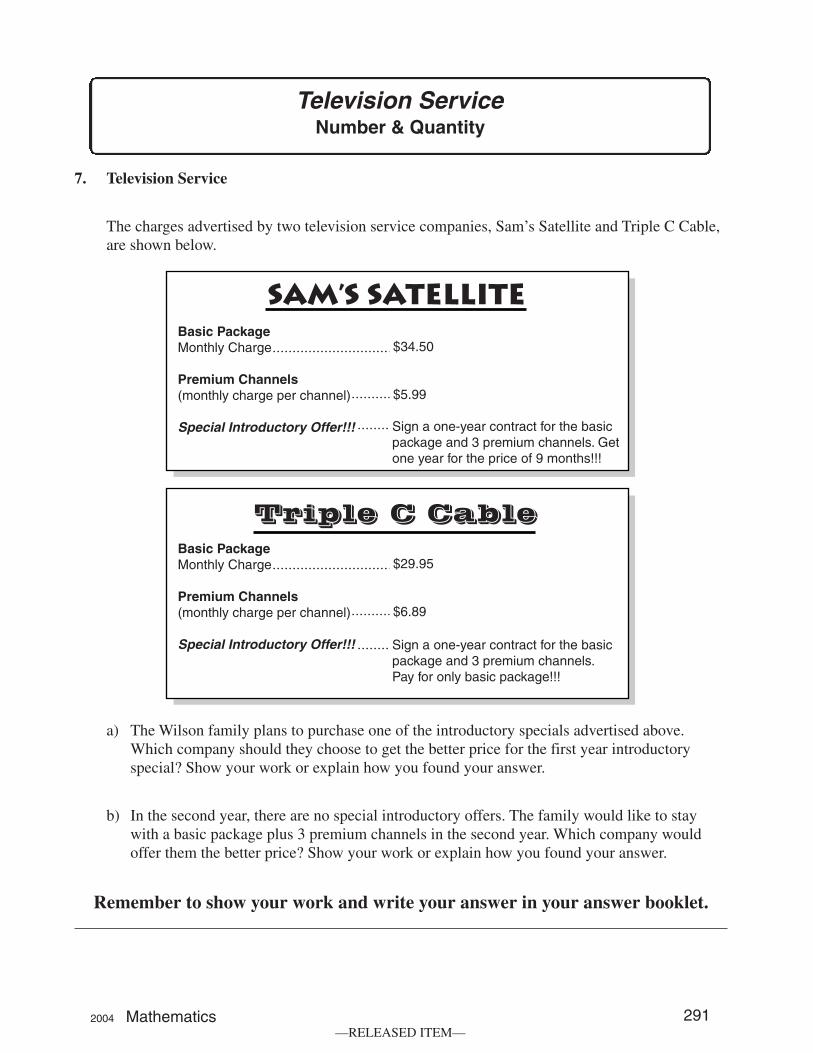
7. Television Service
The charges advertised by two television service companies, Sam’s Satellite and Triple C Cable, are shown below.
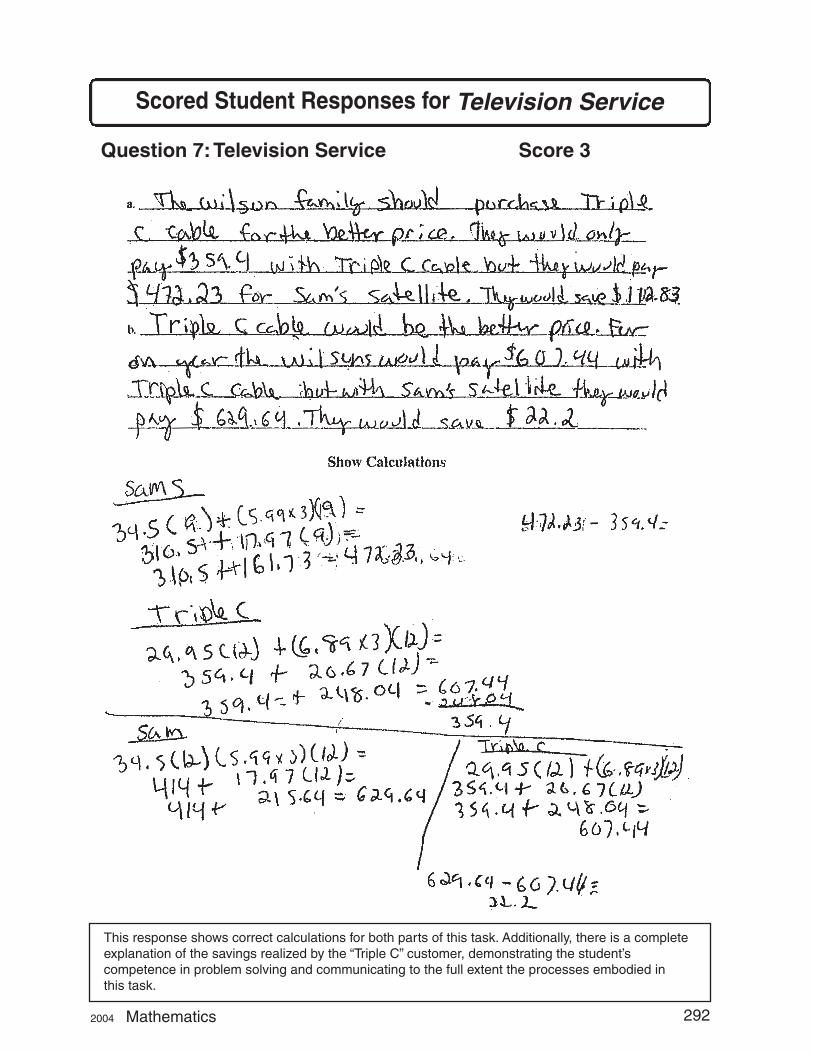
a) The Wilson family plans to purchase one of the introductory specials advertised above. Which company should they choose to get the better price for the first year introductory special? Show your work or explain how you found your answer.
b) In the second year, there are no special introductory offers. The family would like to stay with a basic package plus 3 premium channels in the second year. Which company would offer them the better price? Show your work or explain how you found your answer.
Remember to show your work and write your answer in your answer booklet.
2004 Mathematics 291 —RELEASED ITEM—
Scored Student Responses for Television Service
Question 7: Television Service Score 3
This response shows correct calculations for both parts of this task. Additionally, there is a complete explanation of the savings realized by the “Triple C” customer, demonstrating the student’s competence in problem solving and communicating to the full extent the processes embodied in this task.
2004 Mathematics 292
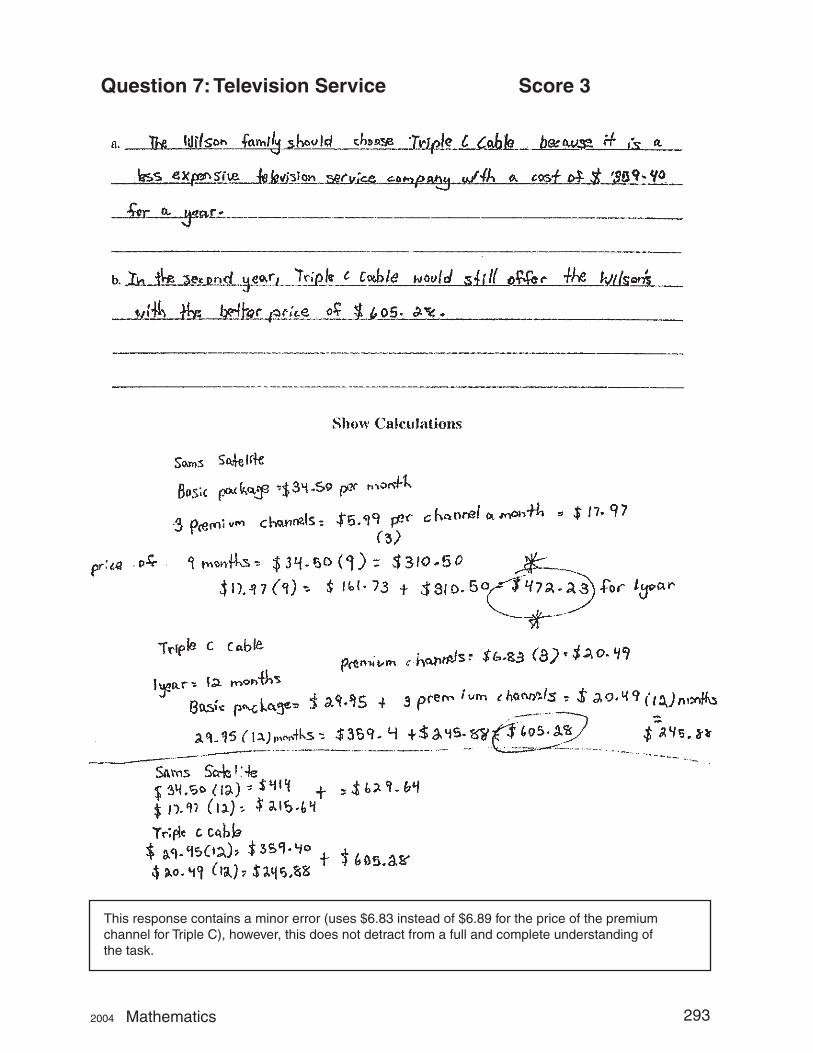
Question 7: Television Service Score 3
This response contains a minor error (uses $6.83 instead of $6.89 for the price of the premium channel for Triple C), however, this does not detract from a full and complete understanding of the task.
2004 Mathematics 293
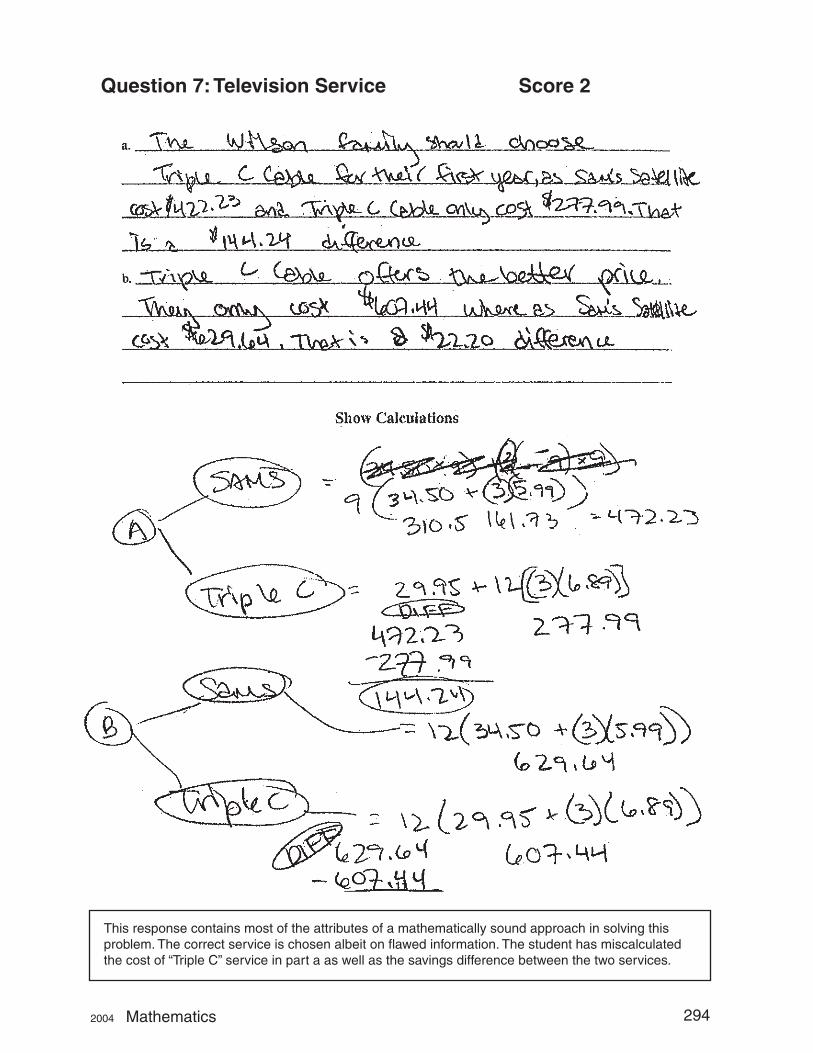
Question 7: Television Service Score 2
This response contains most of the attributes of a mathematically sound approach in solving this problem. The correct service is chosen albeit on flawed information. The student has miscalculated the cost of “Triple C” service in part a as well as the savings difference between the two services.
2004 Mathematics 294
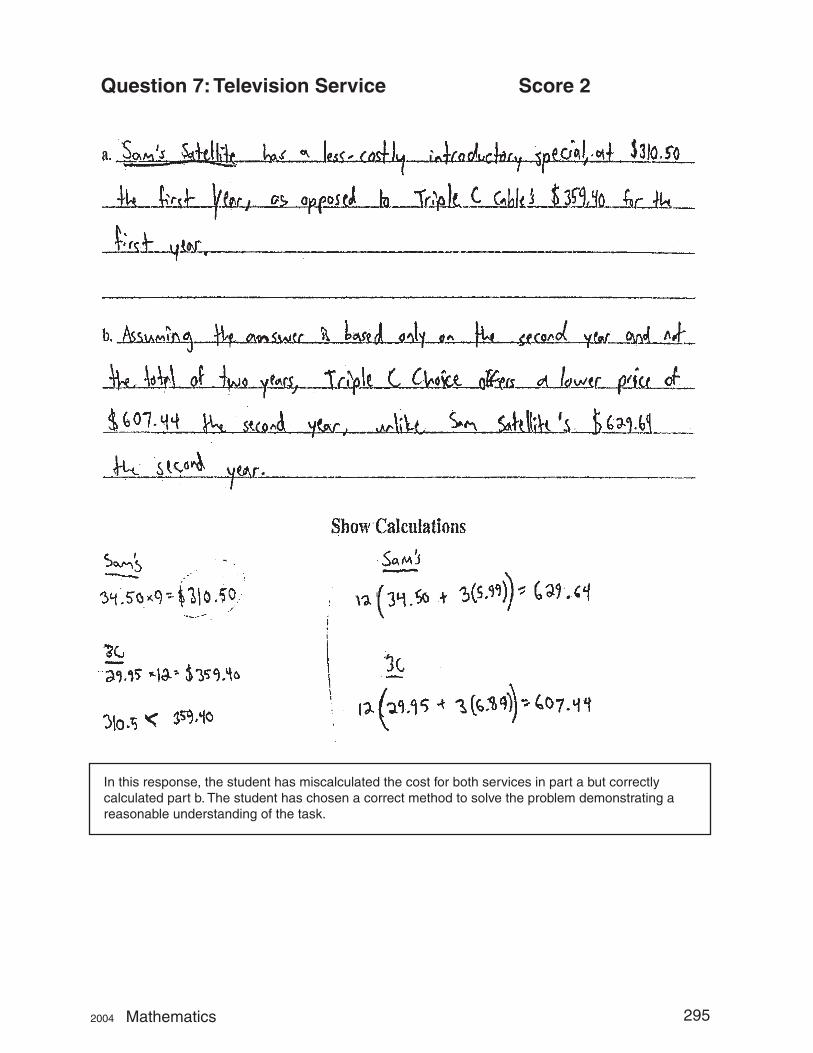
Question 7: Television Service Score 2
In this response, the student has miscalculated the cost for both services in part a but correctly calculated part b. The student has chosen a correct method to solve the problem demonstrating a reasonable understanding of the task.
2004 Mathematics 295
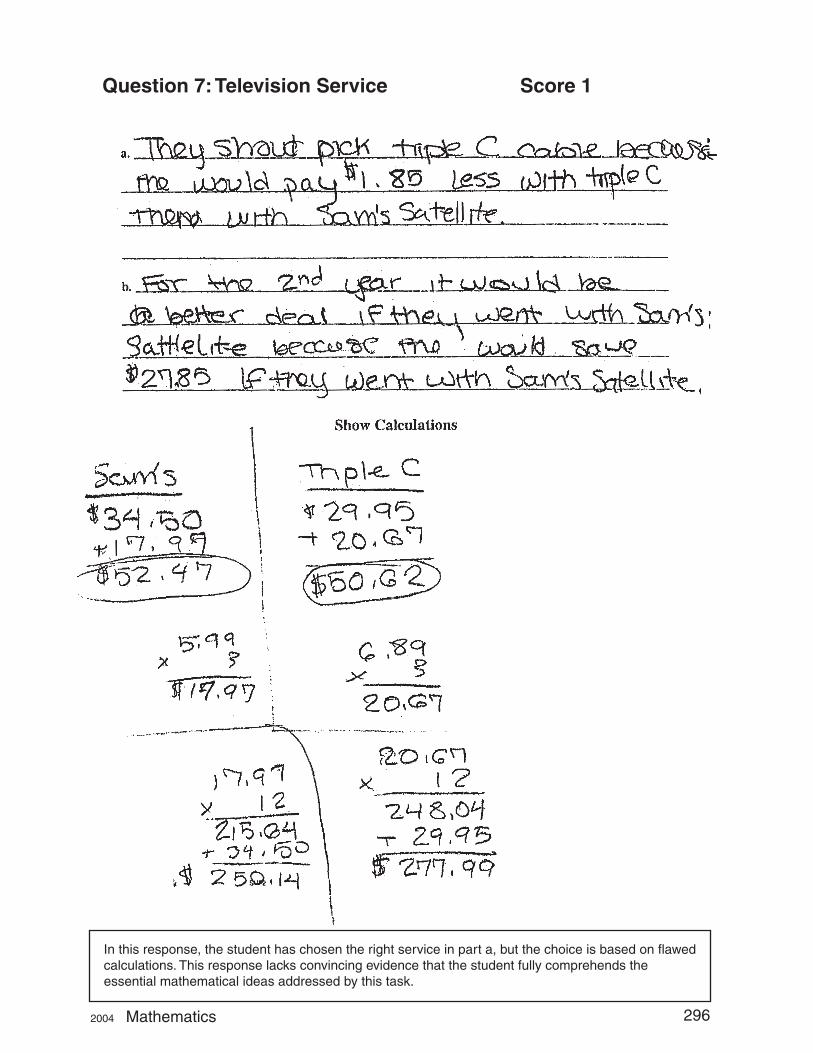
Question 7: Television Service Score 1
In this response, the student has chosen the right service in part a, but the choice is based on flawed calculations. This response lacks convincing evidence that the student fully comprehends the essential mathematical ideas addressed by this task.
2004 Mathematics 296
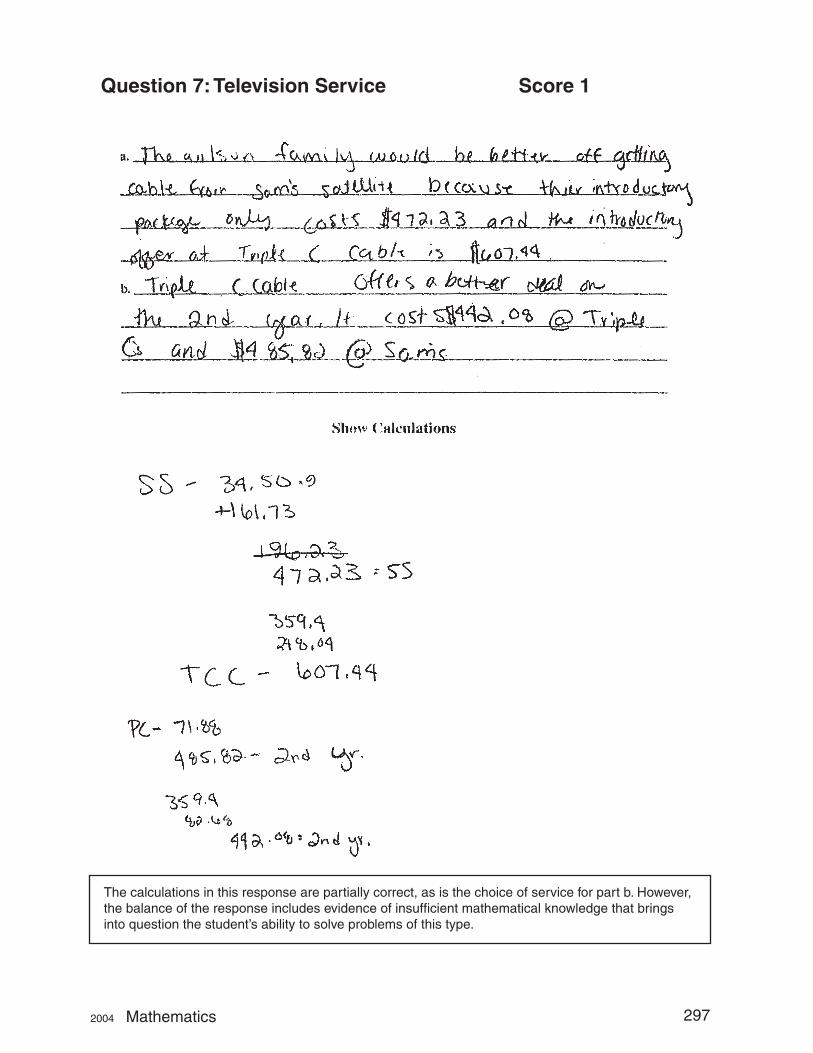
Question 7: Television Service Score 1
The calculations in this response are partially correct, as is the choice of service for part b. However, the balance of the response includes evidence of insufficient mathematical knowledge that brings into question the student’s ability to solve problems of this type.
2004 Mathematics 297
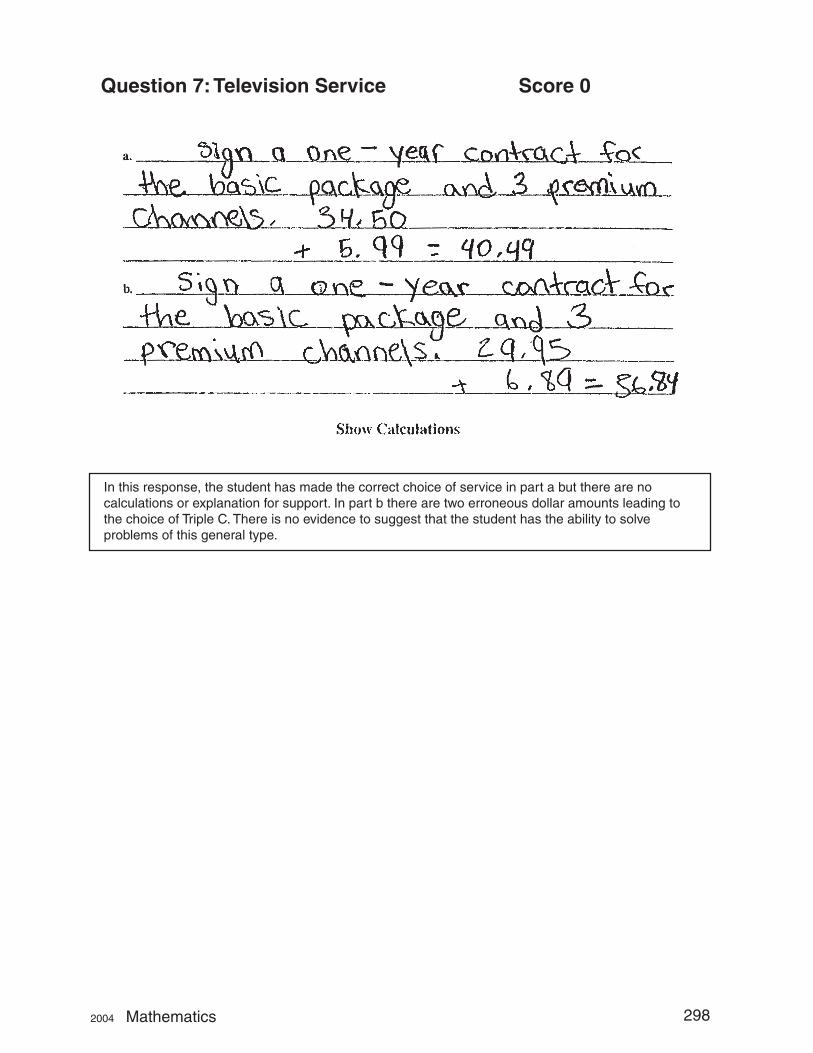
Question 7: Television Service Score 0
In this response, the student has made the correct choice of service in part a but there are no calculations or explanation for support. In part b there are two erroneous dollar amounts leading to the choice of Triple C. There is no evidence to suggest that the student has the ability to solve problems of this general type.
2004 Mathematics 298
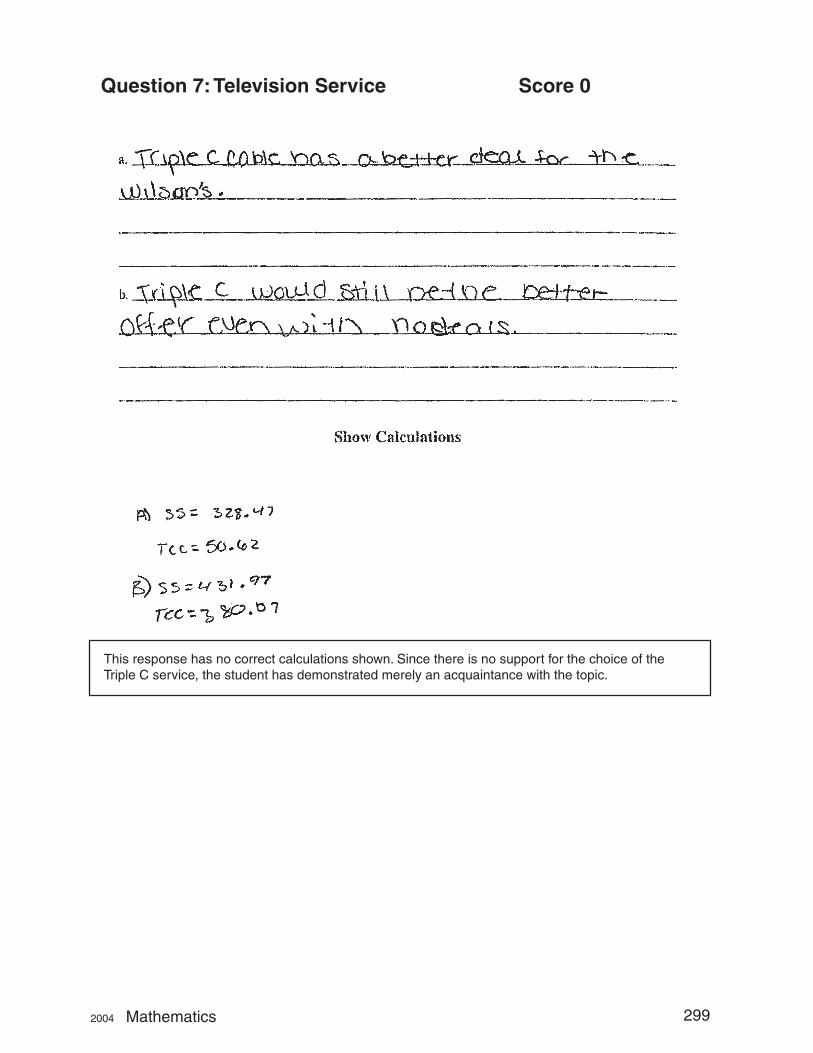
Question 7: Television Service Score 0
This response has no correct calculations shown. Since there is no support for the choice of the Triple C service, the student has demonstrated merely an acquaintance with the topic.
2004 Mathematics 299
Geometric Figure Measurement & Geometry
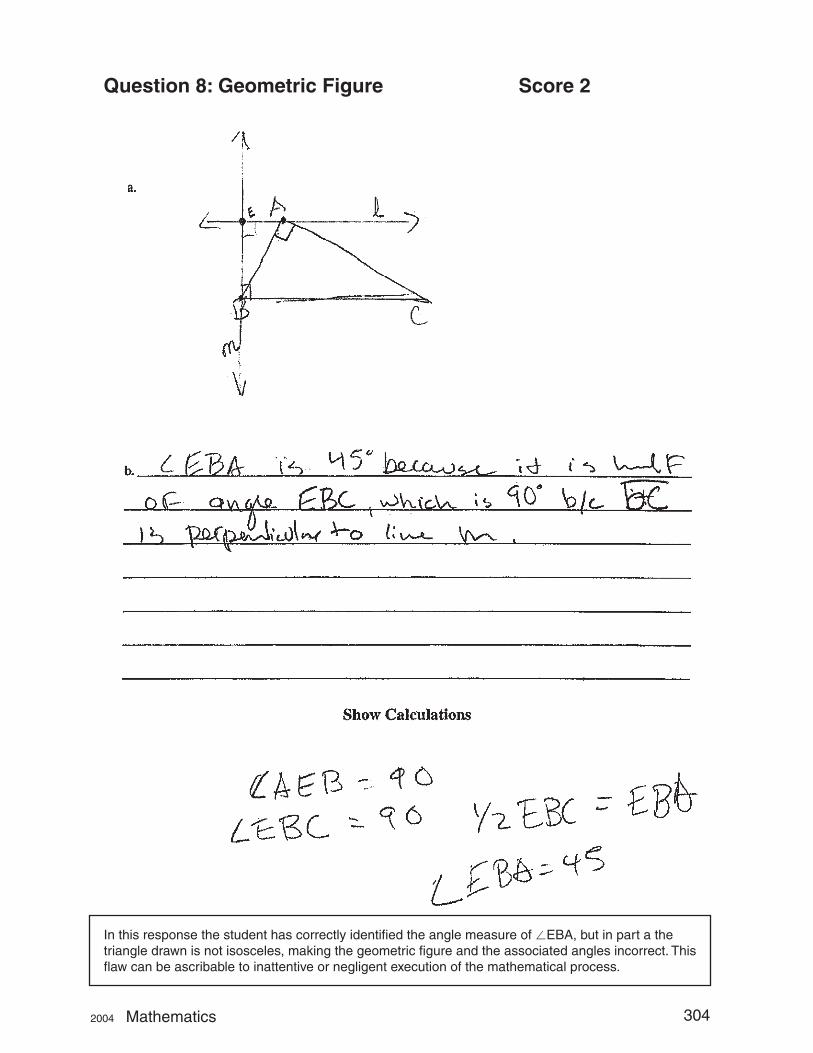
8. Geometric Figure
Delia’s drafting teacher gave her these instructions for drawing a geometric figure to be used in a design for a birdhouse.
• draw isosceles �ABC so that �A is a right angle
• draw line l through point A that is parallel to BC
• draw line m through point B that is perpendicular to BC
• label a point E at the intersection of lines l and m
a. Draw the geometric figure in the space provided in your answer booklet.
b. Delia was asked the measure of �EBA. What is the degree measure of �EBA? Show your work or explain how you found your answer.
Remember to show your work and write your answer in your answer booklet.
2004 Mathematics 300 —RELEASED ITEM—
Geometric FigureScored Student Responses for
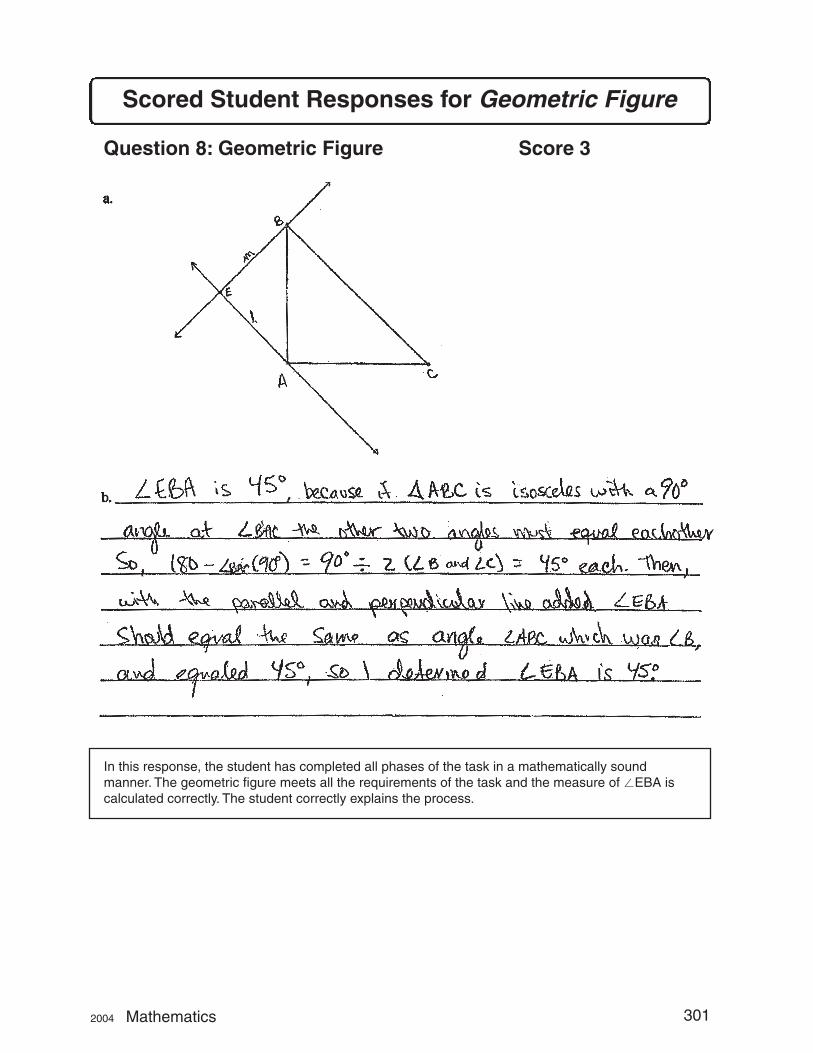
Question 8: Geometric Figure Score 3
In this response, the student has completed all phases of the task in a mathematically sound manner. The geometric figure meets all the requirements of the task and the measure of �EBA is calculated correctly. The student correctly explains the process.
2004 Mathematics 301
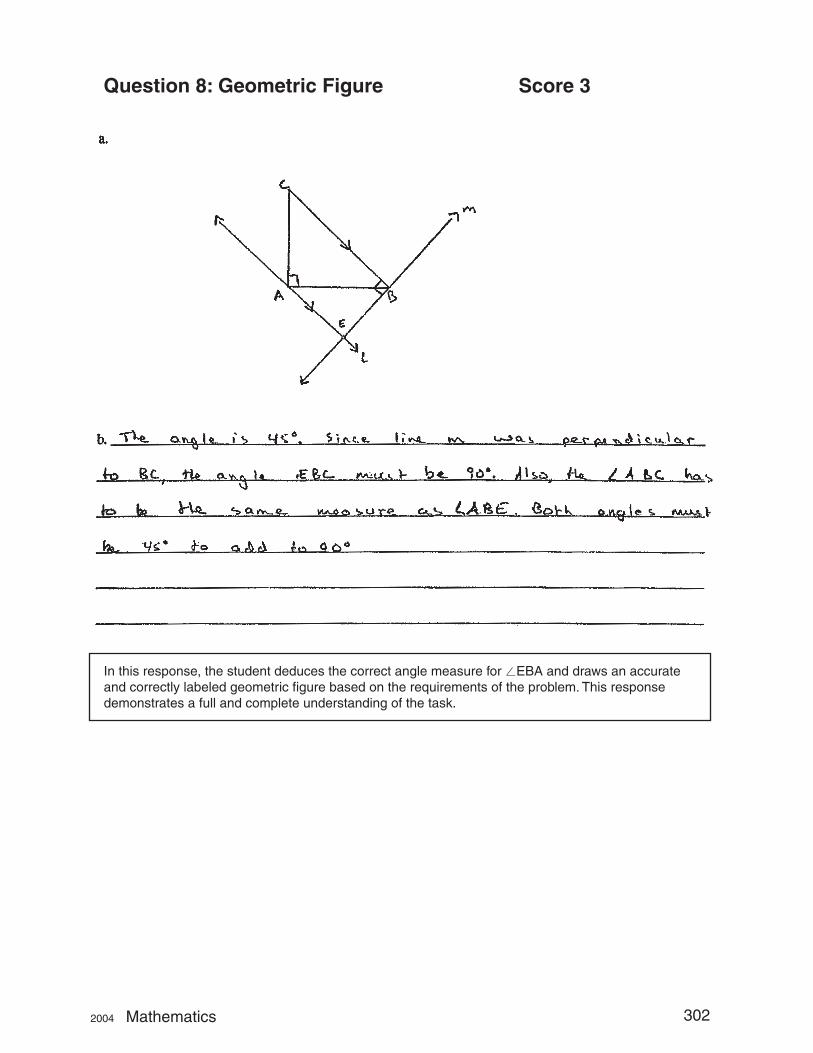
Question 8: Geometric Figure Score 3
In this response, the student deduces the correct angle measure for �EBA and draws an accurate and correctly labeled geometric figure based on the requirements of the problem. This response demonstrates a full and complete understanding of the task.
2004 Mathematics 302
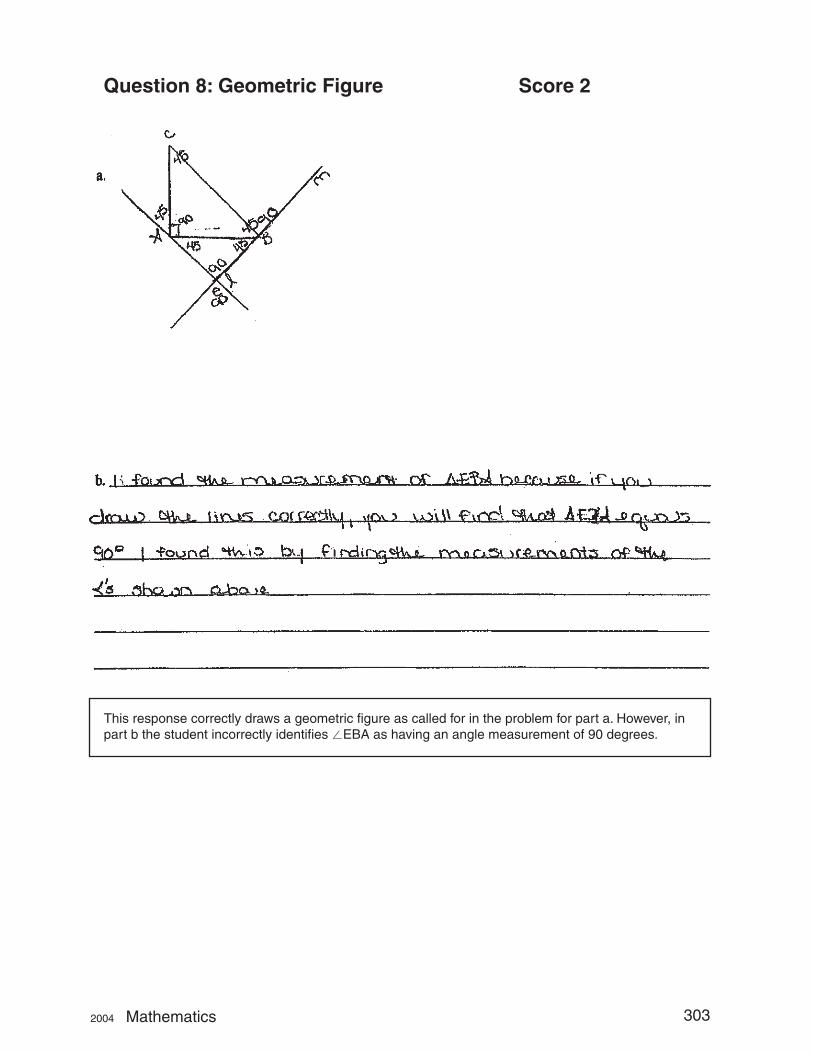
Question 8: Geometric Figure Score 2
This response correctly draws a geometric figure as called for in the problem for part a. However, in part b the student incorrectly identifies �EBA as having an angle measurement of 90 degrees.
2004 Mathematics 303
Question 8: Geometric Figure Score 2
In this response the student has correctly identified the angle measure of �EBA, but in part a the triangle drawn is not isosceles, making the geometric figure and the associated angles incorrect. This flaw can be ascribable to inattentive or negligent execution of the mathematical process.
2004 Mathematics 304
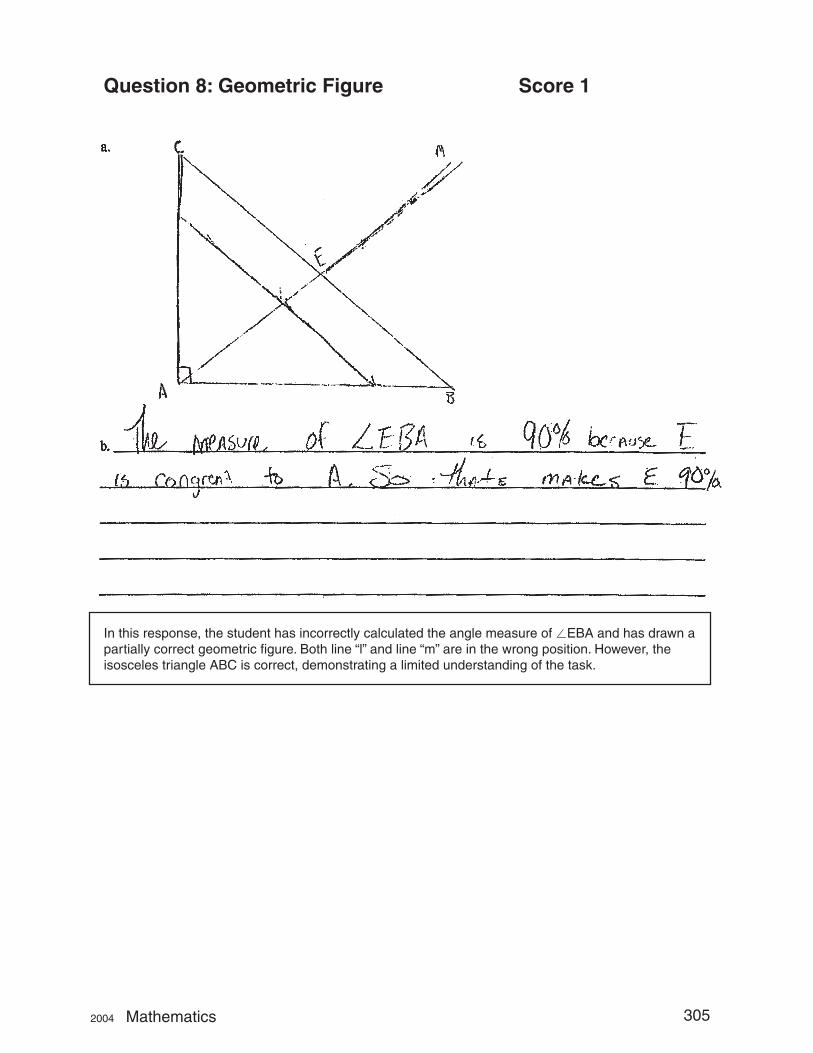
Question 8: Geometric Figure Score 1
In this response, the student has incorrectly calculated the angle measure of �EBA and has drawn a partially correct geometric figure. Both line “l” and line “m” are in the wrong position. However, the isosceles triangle ABC is correct, demonstrating a limited understanding of the task.
2004 Mathematics 305
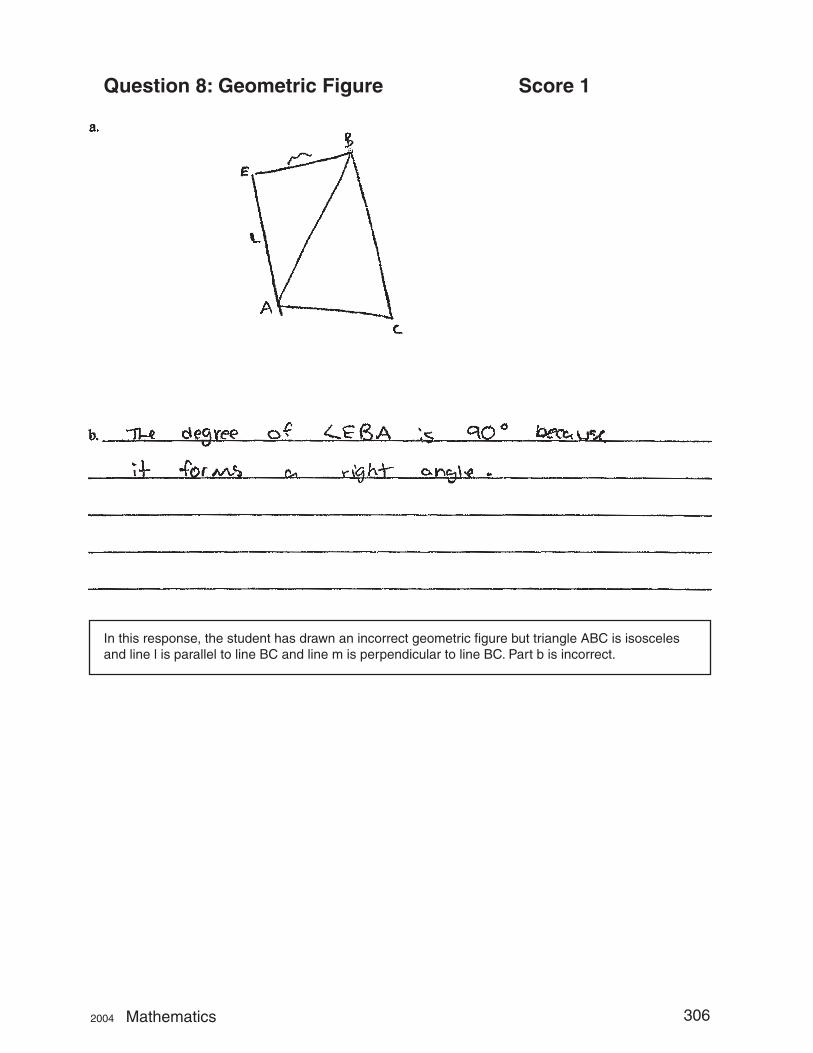
Question 8: Geometric Figure Score 1
In this response, the student has drawn an incorrect geometric figure but triangle ABC is isosceles and line l is parallel to line BC and line m is perpendicular to line BC. Part b is incorrect.
2004 Mathematics 306
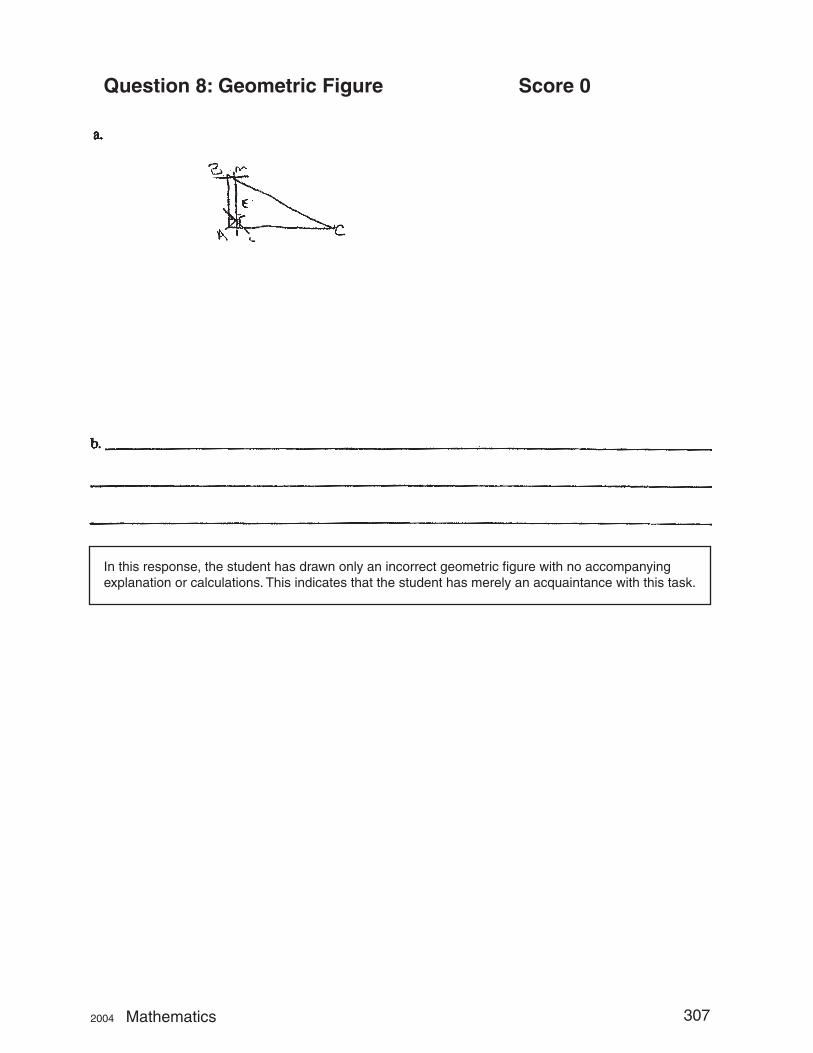
Question 8: Geometric Figure Score 0
In this response, the student has drawn only an incorrect geometric figure with no accompanying explanation or calculations. This indicates that the student has merely an acquaintance with this task.
2004 Mathematics 307
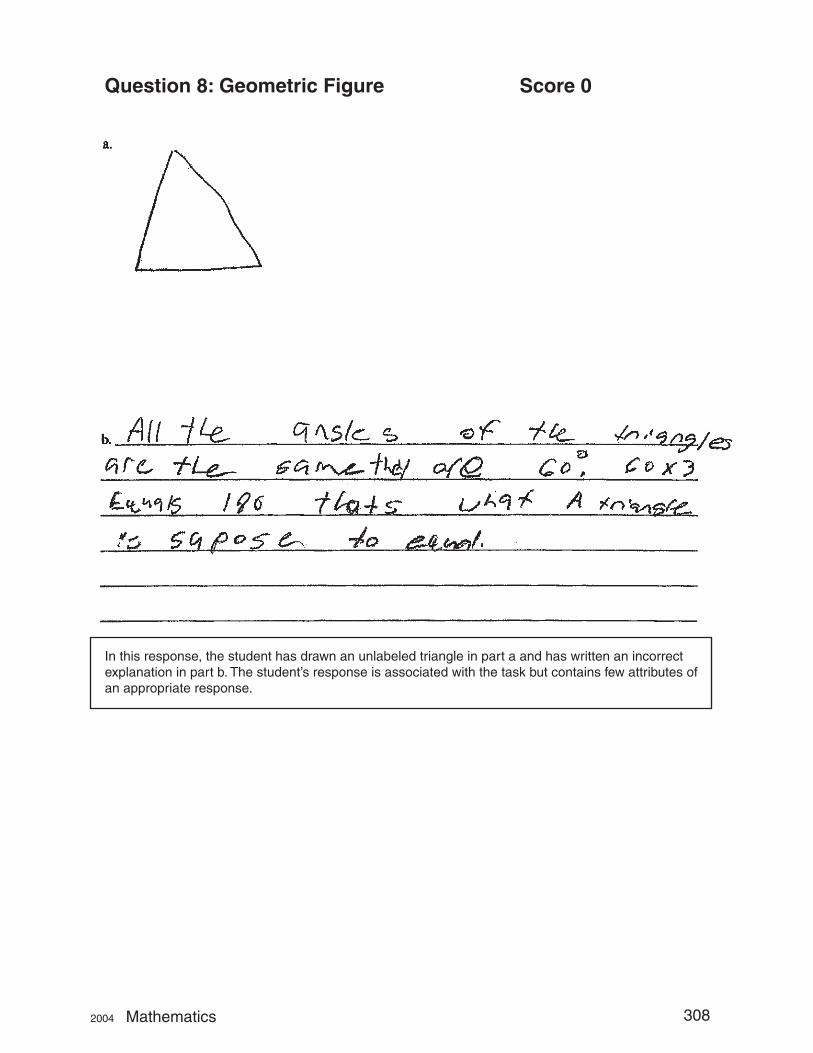
Question 8: Geometric Figure Score 0
In this response, the student has drawn an unlabeled triangle in part a and has written an incorrect explanation in part b. The student’s response is associated with the task but contains few attributes of an appropriate response.
2004 Mathematics 308
CAPT Mathematics Grid-in Items
2004 Mathematics 309
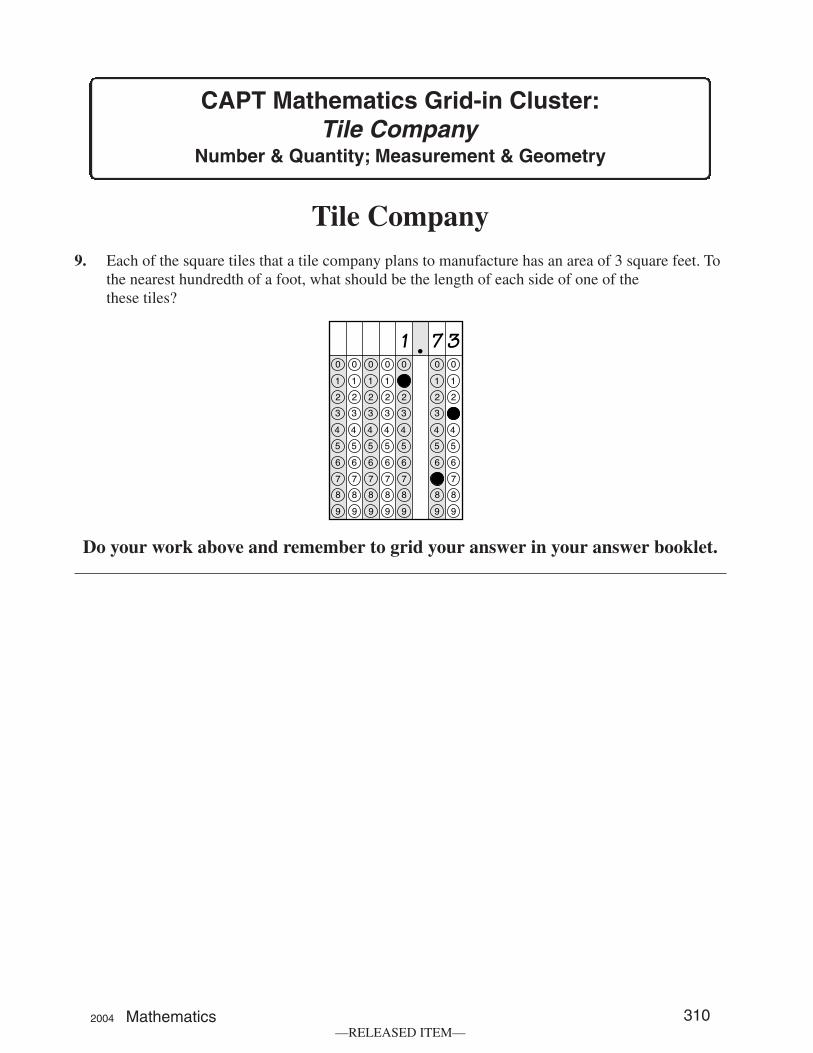
CAPT Mathematics Grid-in Cluster: Tile Company
Number & Quantity; Measurement & Geometry
Tile Company9. Each of the square tiles that a tile company plans to manufacture has an area of 3 square feet. To
the nearest hundredth of a foot, what should be the length of each side of one of the these tiles?
1 7 3
Do your work above and remember to grid your answer in your answer booklet.
2004 Mathematics 310 —RELEASED ITEM—
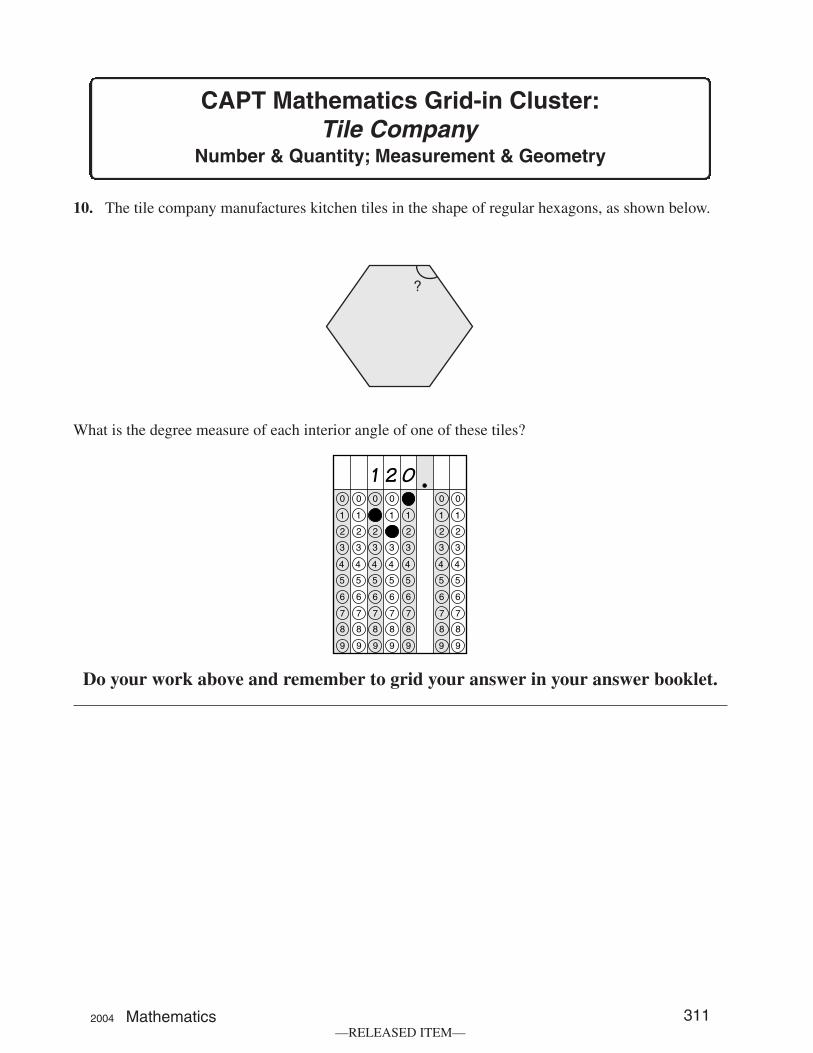
CAPT Mathematics Grid-in Cluster: Tile Company
Number & Quantity; Measurement & Geometry
10. The tile company manufactures kitchen tiles in the shape of regular hexagons, as shown below.
What is the degree measure of each interior angle of one of these tiles?
0 2 1
Do your work above and remember to grid your answer in your answer booklet.
2004 Mathematics 311 —RELEASED ITEM—
CAPT Mathematics Grid-in Cluster: Tile Company (continued)
Number & Quantity; Measurement & Geometry
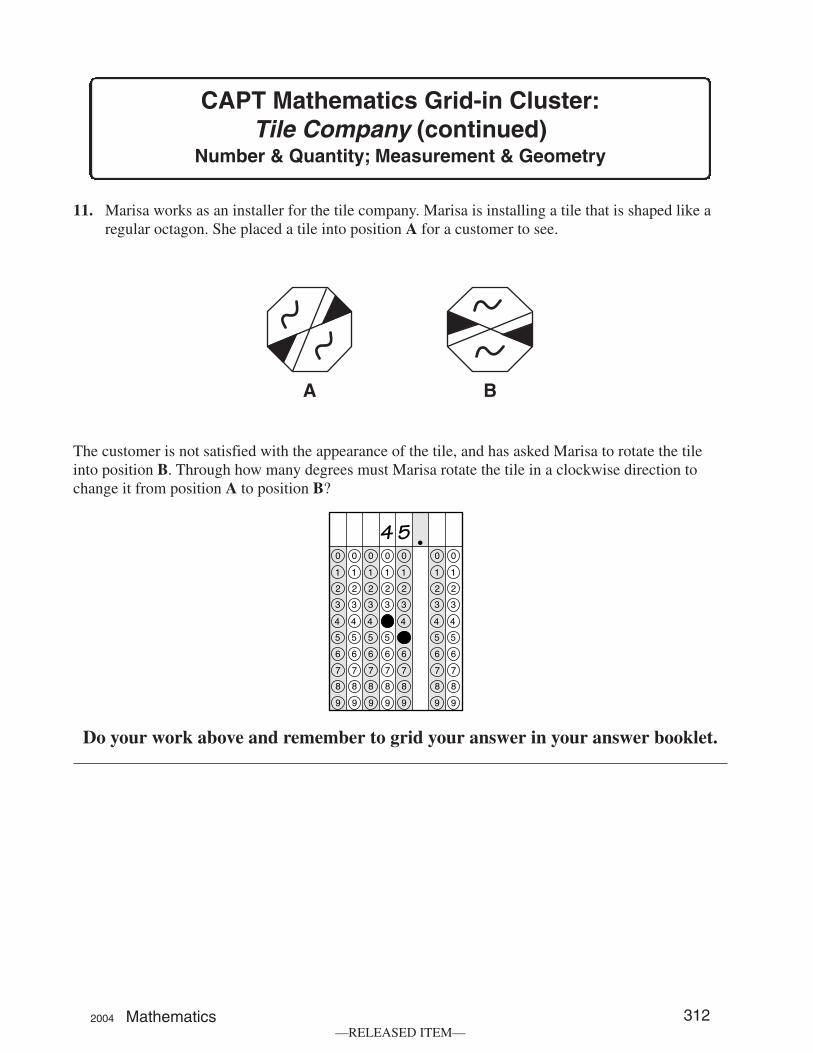
11. Marisa works as an installer for the tile company. Marisa is installing a tile that is shaped like a regular octagon. She placed a tile into position A for a customer to see.
The customer is not satisfied with the appearance of the tile, and has asked Marisa to rotate the tile into position B. Through how many degrees must Marisa rotate the tile in a clockwise direction to change it from position A to position B?
5 4
Do your work above and remember to grid your answer in your answer booklet.
2004 Mathematics 312 —RELEASED ITEM—
CAPT Mathematics Grid-in Cluster: Polygons
Algebra & Functions
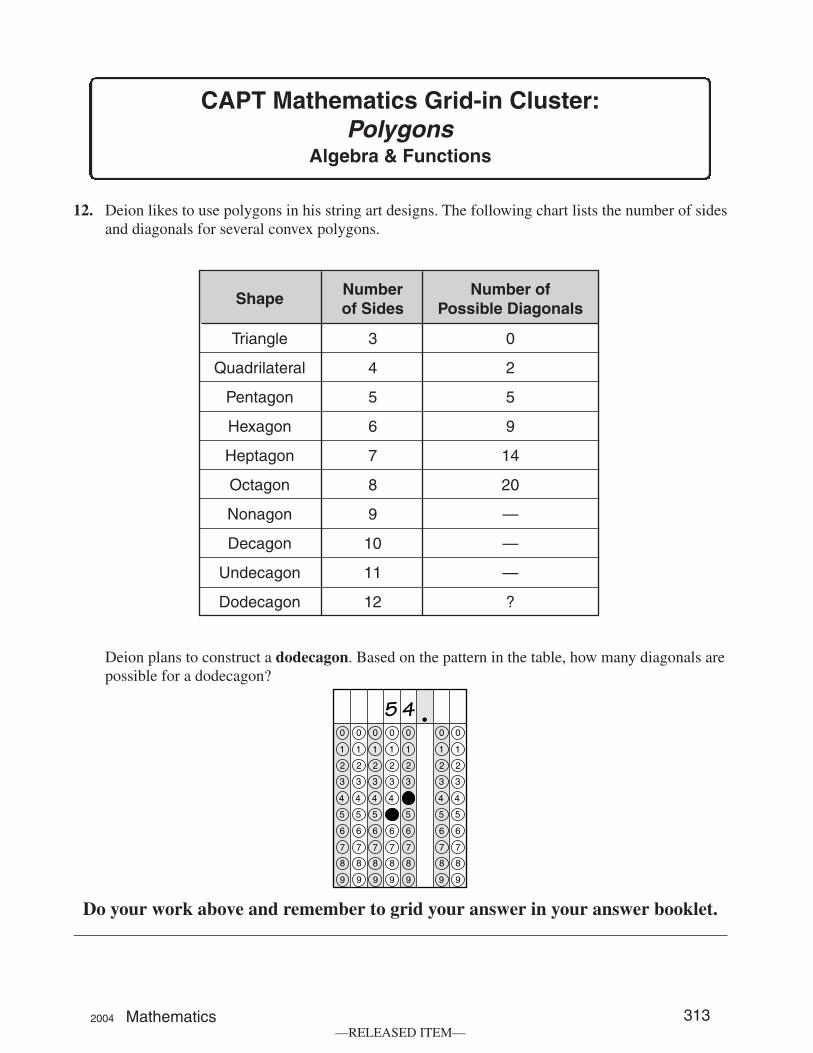
12. Deion likes to use polygons in his string art designs. The following chart lists the number of sides and diagonals for several convex polygons.
Shape Number of Sides
Number of
Heptagon
Octagon
Nonagon
Decagon
Undecagon
Dodecagon
3
4
5
6
7
8
9
10
11
12
0
2
5
9
14
20
—
—
—
?
Possible Diagonals
Triangle
Quadrilateral
Pentagon
Hexagon
Deion plans to construct a dodecagon. Based on the pattern in the table, how many diagonals are possible for a dodecagon?
4 5
Do your work above and remember to grid your answer in your answer booklet.
2004 Mathematics 313 —RELEASED ITEM—
CAPT Mathematics Grid-In Item: State Parks
Statistics, Probability & Discreet Mathematics
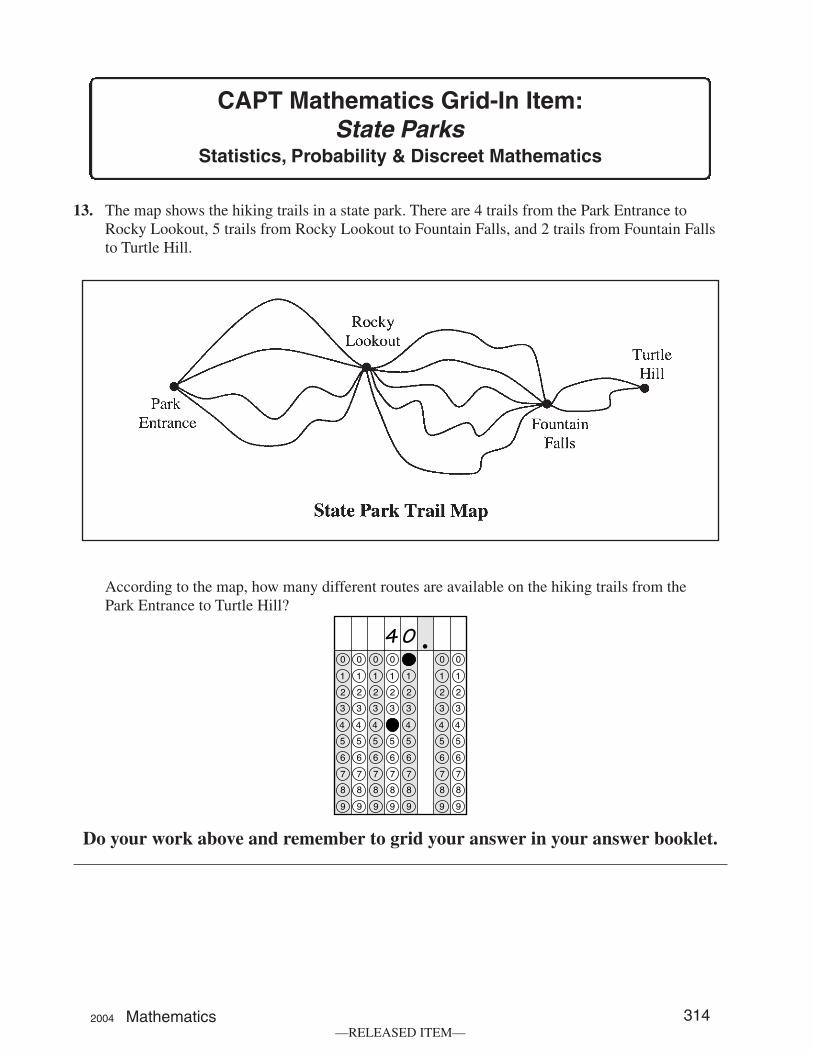
13. The map shows the hiking trails in a state park. There are 4 trails from the Park Entrance to Rocky Lookout, 5 trails from Rocky Lookout to Fountain Falls, and 2 trails from Fountain Falls to Turtle Hill.
According to the map, how many different routes are available on the hiking trails from the Park Entrance to Turtle Hill?
0 4
Do your work above and remember to grid your answer in your answer booklet.
2004 Mathematics 314 —RELEASED ITEM—
CAPT Mathematics Grid-In Item: Largest Cities in Connecticut
Number & Quantity; Statistics, Probability & Discreet Mathematics
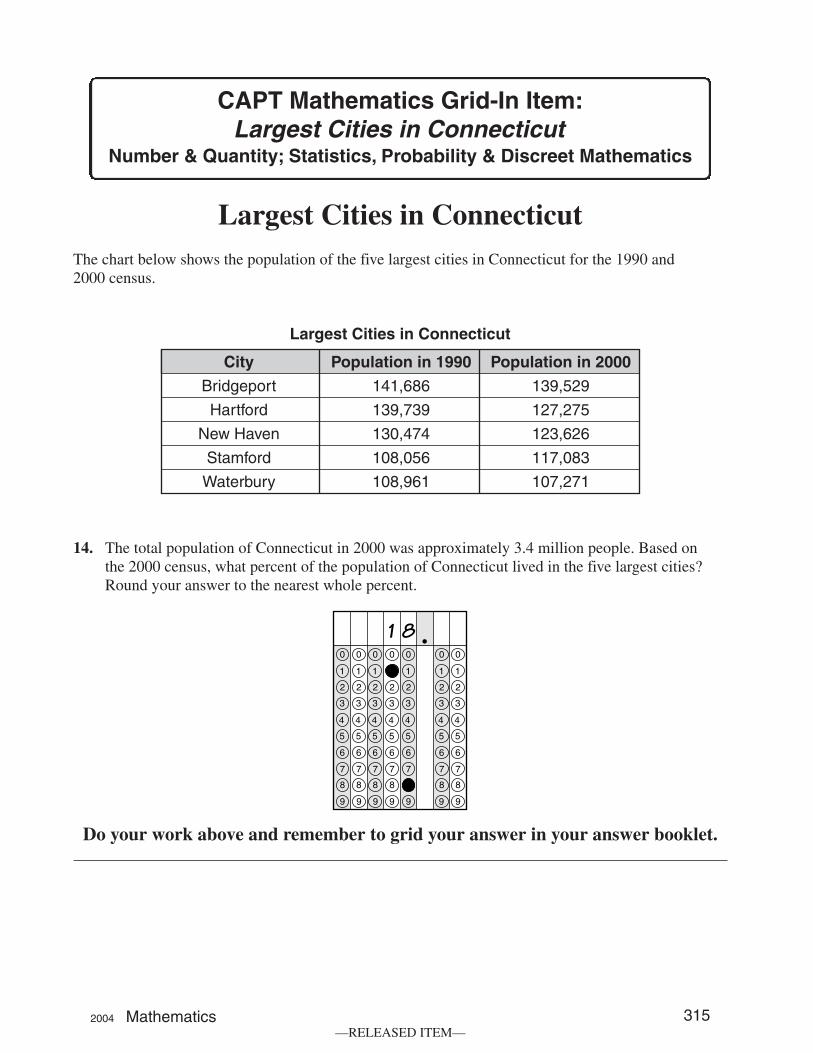
Largest Cities in ConnecticutThe chart below shows the population of the five largest cities in Connecticut for the 1990 and 2000 census.
Largest Cities in Connecticut
City Population in 1990 Population in 2000
Bridgeport 141,686 139,529
Hartford 139,739 127,275
New Haven 130,474 123,626
Stamford 108,056 117,083
Waterbury 108,961 107,271
14. The total population of Connecticut in 2000 was approximately 3.4 million people. Based on the 2000 census, what percent of the population of Connecticut lived in the five largest cities? Round your answer to the nearest whole percent.
8 1
Do your work above and remember to grid your answer in your answer booklet.
2004 Mathematics 315 —RELEASED ITEM—
CAPT Mathematics Grid-In Item: Largest Cities in Connecticut (continued)
Number & Quantity; Statistics, Probability & Discrete Mathematics
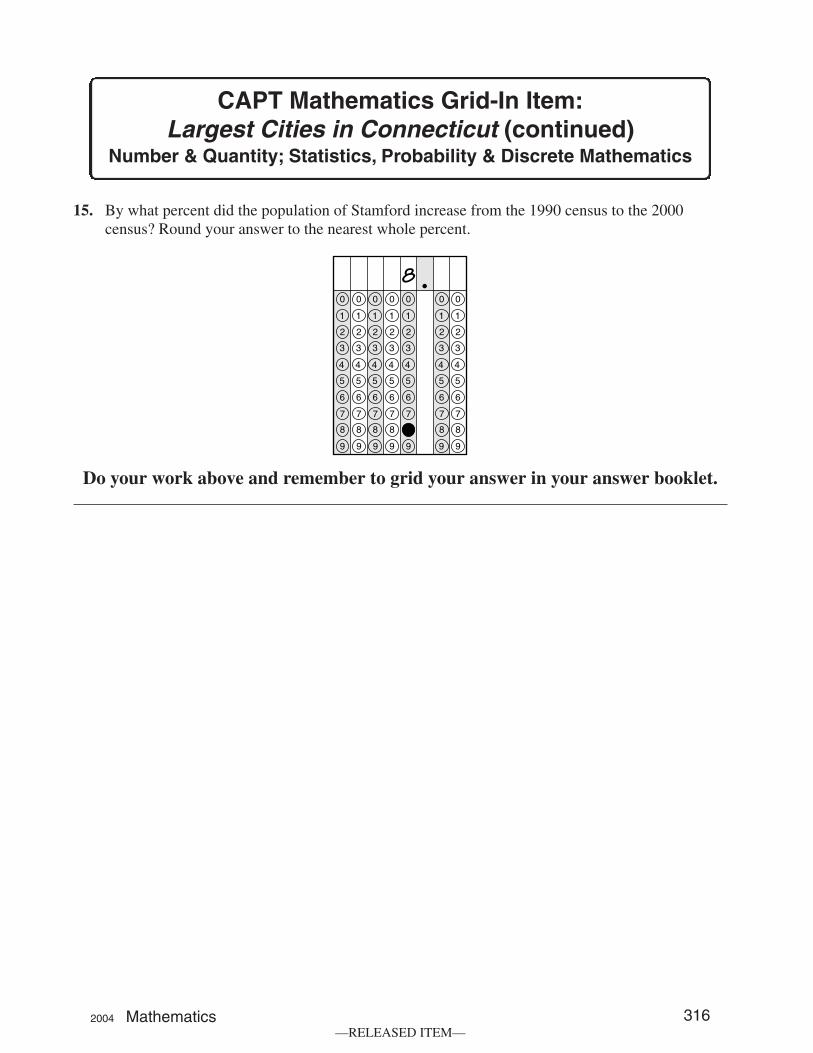
15. By what percent did the population of Stamford increase from the 1990 census to the 2000 census? Round your answer to the nearest whole percent.
8
Do your work above and remember to grid your answer in your answer booklet.
2004 Mathematics 316 —RELEASED ITEM—
CAPT Mathematics Grid-In Item: Largest Cities in Connecticut (continued)
Number & Quantity; Statistics, Probability & Discrete Mathematics
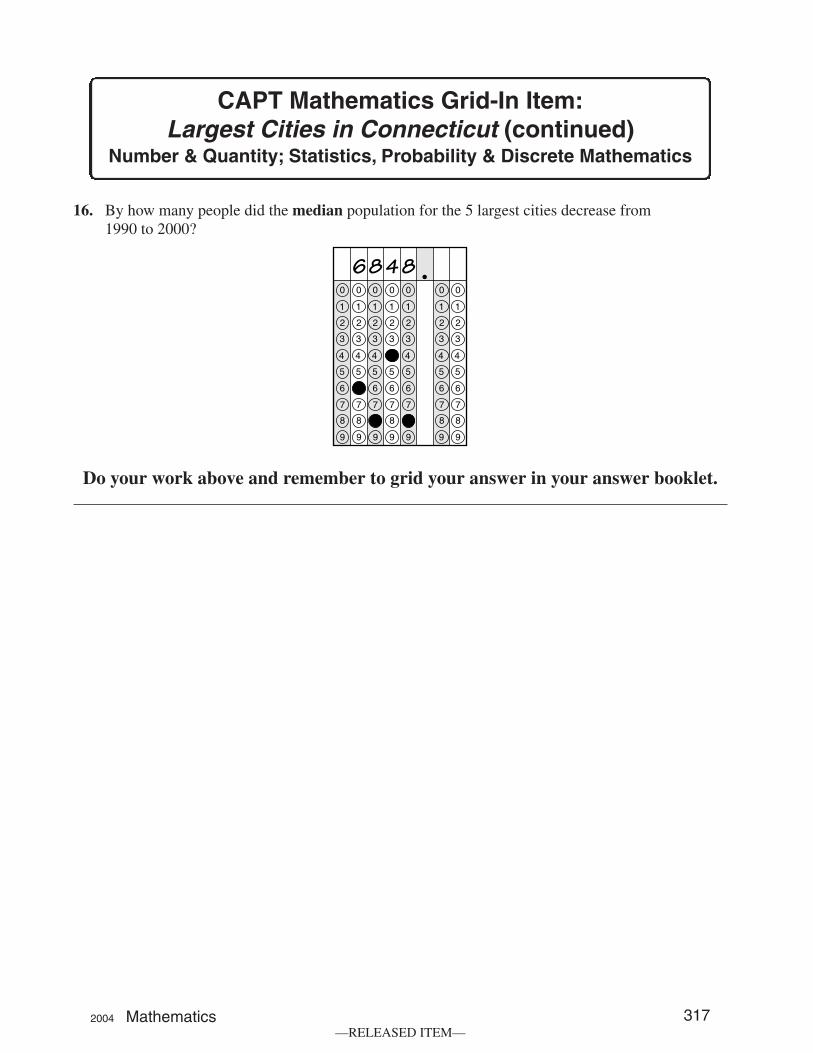
16. By how many people did the median population for the 5 largest cities decrease from 1990 to 2000?
6 8 4 8
Do your work above and remember to grid your answer in your answer booklet.
2004 Mathematics 317 —RELEASED ITEM—
CAPT Mathematics Grid-In Item:
Number & Quantity Snowpack Depth
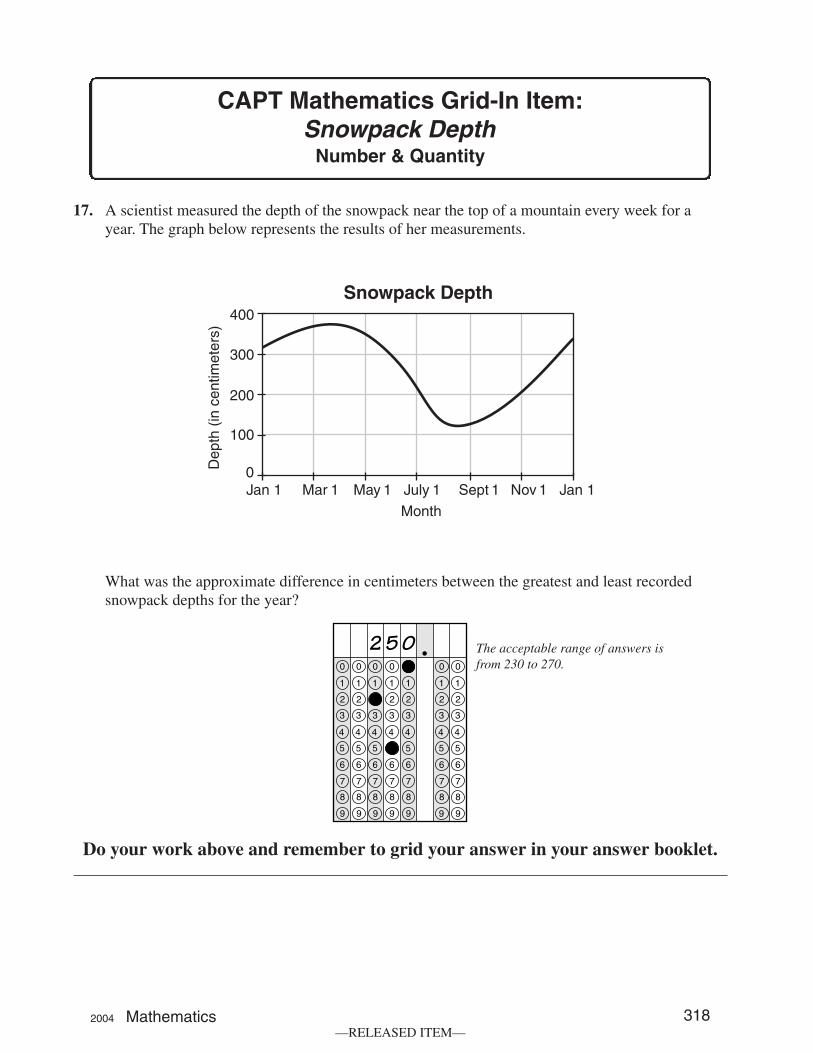
17. A scientist measured the depth of the snowpack near the top of a mountain every week for a year. The graph below represents the results of her measurements.
What was the approximate difference in centimeters between the greatest and least recorded snowpack depths for the year?
2 5 0 The acceptable range of answers is from 230 to 270.
Do your work above and remember to grid your answer in your answer booklet.
2004 Mathematics 318 —RELEASED ITEM—
CAPT Mathematics Grid-In Item: History Tests
Algebra & Functions
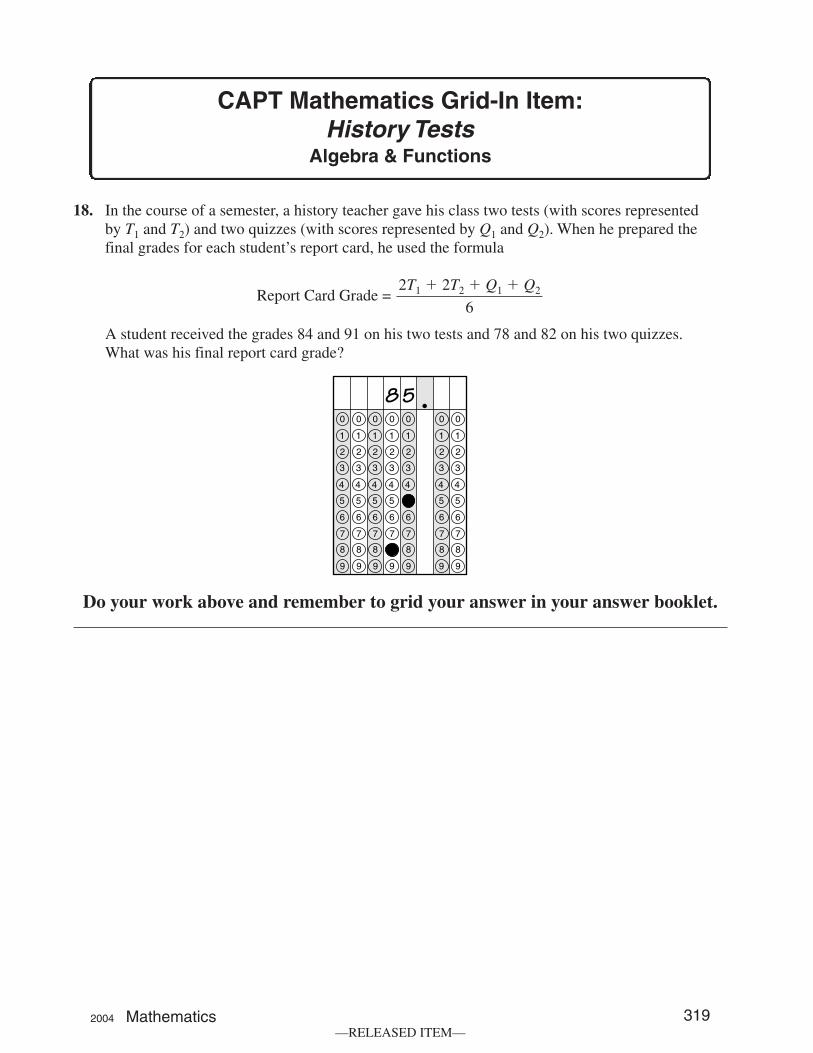
18. In the course of a semester, a history teacher gave his class two tests (with scores represented by T1 and T2) and two quizzes (with scores represented by Q1 and Q2). When he prepared the final grades for each student’s report card, he used the formula
2T1 � 2T2 � Q1 � Q2Report Card Grade = 6
A student received the grades 84 and 91 on his two tests and 78 and 82 on his two quizzes. What was his final report card grade?
8 5
Do your work above and remember to grid your answer in your answer booklet.
2004 Mathematics 319 —RELEASED ITEM—
CAPT Mathematics Grid-In Item: Grass Seed
Measurement & Geometry
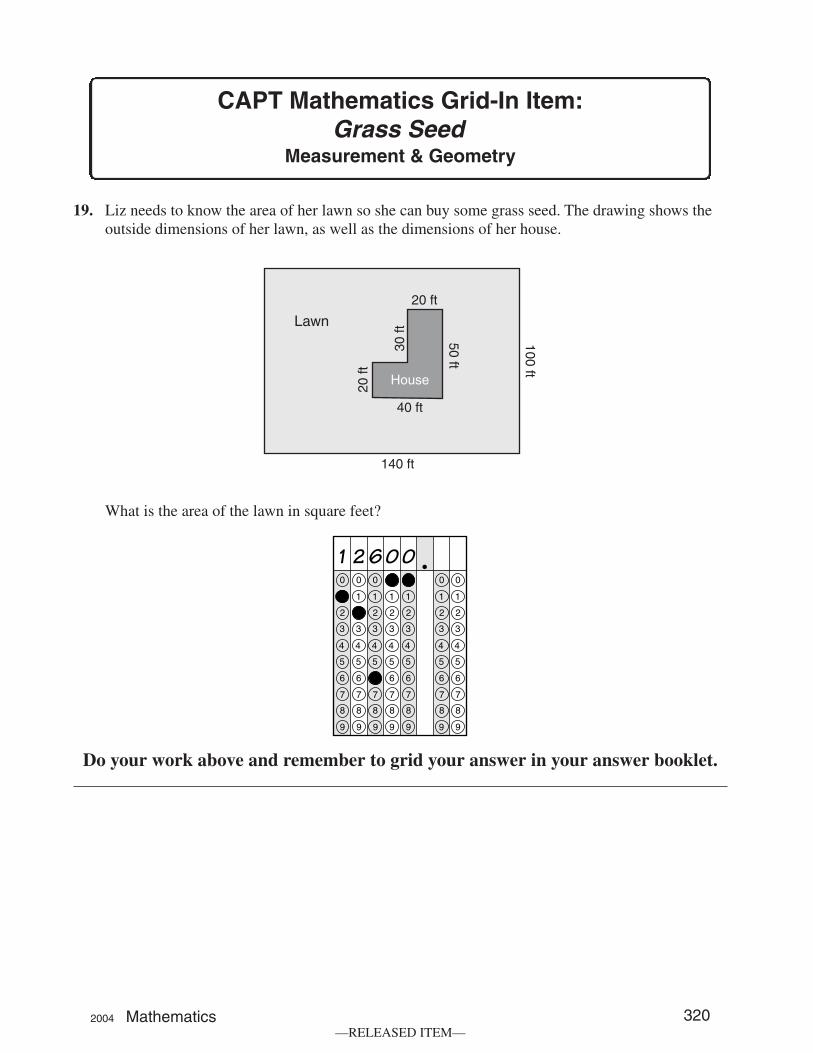
19. Liz needs to know the area of her lawn so she can buy some grass seed. The drawing shows the outside dimensions of her lawn, as well as the dimensions of her house.
What is the area of the lawn in square feet?
1 2 6 0 0
Do your work above and remember to grid your answer in your answer booklet.
2004 Mathematics 320 —RELEASED ITEM—