Embed Size (px)
Citation preview
CAPSTONE PROJECT REPORT
INTERNATIONAL AGRICULTURAL DEVELOPMENT
MASTER’S OF SCIENCE
UNIVERSITY OF CALIFORNIA, DAVIS
MICHAEL WALLACE
MAY 15TH, 2017
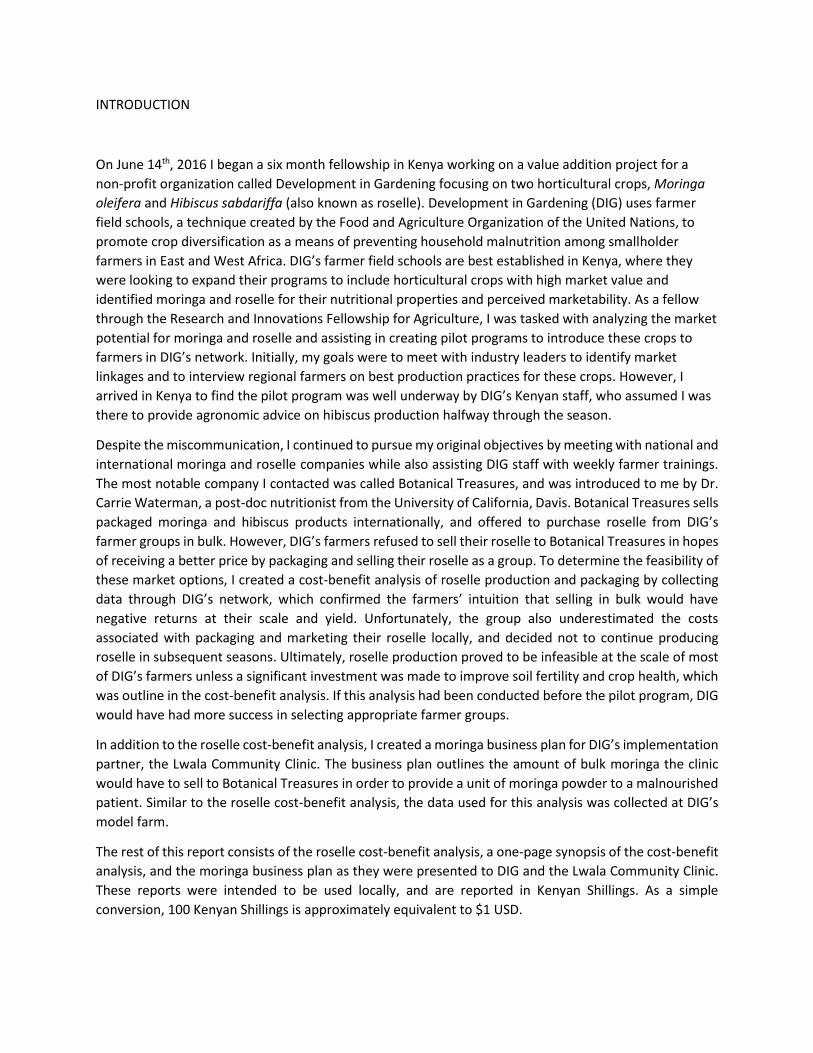
INTRODUCTION
On June 14th, 2016 I began a six month fellowship in Kenya working on a value addition project for a
non-profit organization called Development in Gardening focusing on two horticultural crops, Moringa
oleifera and Hibiscus sabdariffa (also known as roselle). Development in Gardening (DIG) uses farmer
field schools, a technique created by the Food and Agriculture Organization of the United Nations, to
promote crop diversification as a means of preventing household malnutrition among smallholder
farmers in East and West Africa. DIG’s farmer field schools are best established in Kenya, where they
were looking to expand their programs to include horticultural crops with high market value and
identified moringa and roselle for their nutritional properties and perceived marketability. As a fellow
through the Research and Innovations Fellowship for Agriculture, I was tasked with analyzing the market
potential for moringa and roselle and assisting in creating pilot programs to introduce these crops to
farmers in DIG’s network. Initially, my goals were to meet with industry leaders to identify market
linkages and to interview regional farmers on best production practices for these crops. However, I
arrived in Kenya to find the pilot program was well underway by DIG’s Kenyan staff, who assumed I was
there to provide agronomic advice on hibiscus production halfway through the season.
Despite the miscommunication, I continued to pursue my original objectives by meeting with national and
international moringa and roselle companies while also assisting DIG staff with weekly farmer trainings.
The most notable company I contacted was called Botanical Treasures, and was introduced to me by Dr.
Carrie Waterman, a post-doc nutritionist from the University of California, Davis. Botanical Treasures sells
packaged moringa and hibiscus products internationally, and offered to purchase roselle from DIG’s
farmer groups in bulk. However, DIG’s farmers refused to sell their roselle to Botanical Treasures in hopes
of receiving a better price by packaging and selling their roselle as a group. To determine the feasibility of
these market options, I created a cost-benefit analysis of roselle production and packaging by collecting
data through DIG’s network, which confirmed the farmers’ intuition that selling in bulk would have
negative returns at their scale and yield. Unfortunately, the group also underestimated the costs
associated with packaging and marketing their roselle locally, and decided not to continue producing
roselle in subsequent seasons. Ultimately, roselle production proved to be infeasible at the scale of most
of DIG’s farmers unless a significant investment was made to improve soil fertility and crop health, which
was outline in the cost-benefit analysis. If this analysis had been conducted before the pilot program, DIG
would have had more success in selecting appropriate farmer groups.
In addition to the roselle cost-benefit analysis, I created a moringa business plan for DIG’s implementation
partner, the Lwala Community Clinic. The business plan outlines the amount of bulk moringa the clinic
would have to sell to Botanical Treasures in order to provide a unit of moringa powder to a malnourished
patient. Similar to the roselle cost-benefit analysis, the data used for this analysis was collected at DIG’s
model farm.
The rest of this report consists of the roselle cost-benefit analysis, a one-page synopsis of the cost-benefit
analysis, and the moringa business plan as they were presented to DIG and the Lwala Community Clinic.
These reports were intended to be used locally, and are reported in Kenyan Shillings. As a simple
conversion, 100 Kenyan Shillings is approximately equivalent to $1 USD.
Michael Wallace MS International Agricultural Development, Candidate
University of California, Davis
An analysis of value-added roselle production systems based on farmer groups near Rongo, Kenya.
ROSELLE VALUE-ADDITION Cost-Benefit Analysis
ROSELLE VALUE-ADDITION
Contents Introduction .................................................................................................................................................. 1
Cost-Benefit Analysis .................................................................................................................................... 1
Methodology ............................................................................................................................................. 2
Challenges and Assumptions .................................................................................................................... 4
Results and Discussion .............................................................................................................................. 5
Figures 1 and 2: ..................................................................................................................................... 6
Figures 3 and 4: ..................................................................................................................................... 8
Kuna Group Case Study ................................................................................................................................. 9
Conclusion ................................................................................................................................................... 10
Appendix A: Data Collected from DIG Farmer Groups .................................................................................. i
Appendix B: Gross Margins and Gross Profits of Production Scenarios ....................................................... ii
1a
Introduction
This analysis was created as a part of Development in Gardening’s (DIG) Roselle Value-Addition pilot
project in Rongo, Kenya to understand the potential for roselle production systems to improve the lives
of smallholder farmers in Kenya’s highlands. Roselle (Hibiscus sabdariffa) is a plant native to West Africa
typically grown to make tea, herbal infusions, jam, and other products from its bright-red sepals. Rich in
iron, and Vitamins A and C, roselle tea was identified by DIG for its potential to address anemia within its
farmer communities. DIG has two major goals through its Roselle Value-Addition pilot: 1) to increase
household income by teaching their producer groups to grow roselle, make value-added products, and
enter into local and national markets, and 2) to improve household nutrition by encouraging home
consumption of roselle tea among producers.
The major goal of this analysis is to understand the production practices and scale of production
required for DIG to successfully meet its goal of improving household incomes. A cost-benefit analysis
was conducted to determine the profitability and gross margins across a range of production scales and
yields, and variety of value-added products. Data for this analysis was collected at DIG’s model farm plot
located at the Lwala Community Clinic, and the Kuna and Waware community groups associated with
the pilot program. The analysis suggests a threshold of both production scale and yield that need to be
surpassed for farmers to benefit from the value-addition project. Although the analysis relies on small
sample sizes and inaccurate tools of measurement to collect data, DIG can use these thresholds as
general guidelines for planning future projects involving roselle production and value-addition.
Cost-Benefit Analysis
In DIG’s Roselle Value-Addition pilot, a farmer group from a rural center called Kuna near the city of
Rongo was selected to grow roselle, learn value-added processing, and find local and national markets
for their products. Using production information from the Kuna group, as well as from DIG’s model farm
at the Lwala Community Alliance, this cost-benefit analysis determines the feasibility of roselle value-
addition across several production scales.
Members of the Kuna group managed roselle production in the same fashion as traditional maize
systems. Depending on the size of the field and available household resources, some members ploughed
their fields using hoes, while others used oxen and simple moldboard ploughs. Weeding occurred on a
similar schedule to that of maize, with 2-3 major weeding events occurring per season. After the roselle
bloomed, the entire flowers were harvested and the sepals were removed from the boll to be dried.
This analysis gives farmers three options for selling their roselle, two of which were identified by a major
roselle tea company in Kenya called Botanical Treasures. Within Botanical Treasure’s procurement
model, farmers work in groups by region to consolidate and dry roselle. The majority of farmers in the
production group sell “wet” roselle, which include sepals unseparated from the bolls, to a central
aggregator for 20Ksh per kilogram. The aggregator then removes and dries the sepals before selling
them to Botanical Treasures for 300Ksh per kilogram. As an additional option, Botanical Treasures
purchases dried roselle in bulk directly from farmers at a price of 300Ksh per kilogram. As an alternative
to bulk sales, farmers are given the option of drying and packaging roselle individually, then selling the
2a
roselle through local markets. This is the option the Kuna group decided to pursue. These bags can
include a group label to bring brand awareness, or can be sold without the label to save on additional
packaging costs. The prices for packaged roselle used in this analysis come directly from the Kuna group,
who were selling labeled packages for 30Ksh and unlabeled packages for 50Ksh. The drastic price
difference is a result of how farmers viewed the packages. Despite the average package weight being
nearly equal, the branded package looked smaller, and so Kuna farmers decided to sell it for 30Ksh less.
In addition to the Kuna group, data for this analysis was collected through another DIG farmer group in a
city called Waware, and through DIG’s model farm at the Lwala Community Alliance. Some aspects of
production and packaging were not able to be measured, as discussed further in the challenges and
assumptions section below. Despite these limitations, this analysis will provide a general outline of the
production scales and yields required for farmers to profit from roselle, and can be used to plan future
roselle value-addition projects.
Methodology To determine the feasibility of roselle production and value-addition at the household level, this analysis
compares the total costs and revenues of the production system to calculate its gross profit and gross
margin. Gross profit is calculated by subtracting all the costs of producing value-added roselle products
from the expected revenues. Gross margin is a measure of efficiency within the production system,
expressed as a percentage, and is calculated by dividing the gross profit by total revenue. Between two
production systems with equal costs, the system that creates more profit will have a higher gross
margin. For this analysis, gross margin was used as a marker of feasibility for a specific scenario,
regardless of the size of gross profit. To see the both the gross profit and gross margins across all
scenarios, please refer to Appendix B.
To calculate the gross profit and gross margins of roselle production systems, the total costs of
producing value-added roselle products had to be measured. These costs include the tools and inputs
required for cultivation, planting, weeding, harvesting and creating value-added products, and the labor
required across all aspects of the production system. Since the author arrived during the middle of the
production season, no direct measurements on the amount of labor required for ploughing, planting
and weeding were taken. However, roselle production in Kuna closely follows the production practices
of maize, for which labor requirements have been published in a land use study conducted in
Kakamega.1 The labor for cultivating, planting and weeding roselle was inferred from that study.
Labor required for harvesting, remove the sepals, and packaging roselle was measured by the author
using the stop watch feature on an iPhone and multiplying the given time by the number of laborers
involved, as seen in the table below (the complete table is found in Appendix A). The average time
required for harvesting one kilogram of roselle was calculated by taking the average time it took to
harvest one kilogram from the Kuna group and the upper and lower DIG plots. Similar methods were
used to obtain the average time required to remove and package dried sepals per kilogram of dried
roselle. To measure field size, a pace count was conducted around the perimeter of the field and
1 Nambiro, E. 2010. “Trends in land use and agricultural intensification in Kakamega, Western Kenya” (Doctoral dissertation).
Retrieved from the Rheinischen-Friedrich-Wilhelms-Universität zu Bonn.
3a
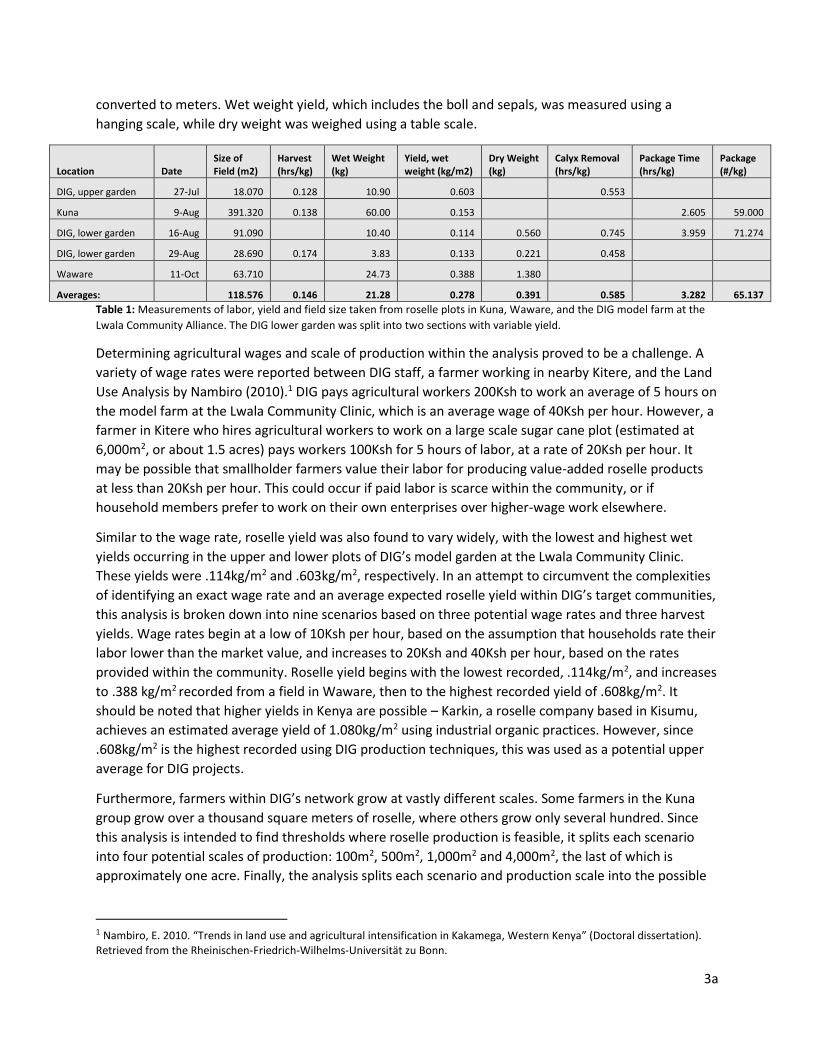
converted to meters. Wet weight yield, which includes the boll and sepals, was measured using a
hanging scale, while dry weight was weighed using a table scale.
Location Date Size of Field (m2)
Harvest (hrs/kg)
Wet Weight (kg)
Yield, wet weight (kg/m2)
Dry Weight (kg)
Calyx Removal (hrs/kg)
Package Time (hrs/kg)
Package (#/kg)
DIG, upper garden 27-Jul 18.070 0.128 10.90 0.603 0.553
Kuna 9-Aug 391.320 0.138 60.00 0.153 2.605 59.000
DIG, lower garden 16-Aug 91.090 10.40 0.114 0.560 0.745 3.959 71.274
DIG, lower garden 29-Aug 28.690 0.174 3.83 0.133 0.221 0.458
Waware 11-Oct 63.710 24.73 0.388 1.380
Averages: 118.576 0.146 21.28 0.278 0.391 0.585 3.282 65.137
Table 1: Measurements of labor, yield and field size taken from roselle plots in Kuna, Waware, and the DIG model farm at the
Lwala Community Alliance. The DIG lower garden was split into two sections with variable yield.
Determining agricultural wages and scale of production within the analysis proved to be a challenge. A
variety of wage rates were reported between DIG staff, a farmer working in nearby Kitere, and the Land
Use Analysis by Nambiro (2010).1 DIG pays agricultural workers 200Ksh to work an average of 5 hours on
the model farm at the Lwala Community Clinic, which is an average wage of 40Ksh per hour. However, a
farmer in Kitere who hires agricultural workers to work on a large scale sugar cane plot (estimated at
6,000m2, or about 1.5 acres) pays workers 100Ksh for 5 hours of labor, at a rate of 20Ksh per hour. It
may be possible that smallholder farmers value their labor for producing value-added roselle products
at less than 20Ksh per hour. This could occur if paid labor is scarce within the community, or if
household members prefer to work on their own enterprises over higher-wage work elsewhere.
Similar to the wage rate, roselle yield was also found to vary widely, with the lowest and highest wet
yields occurring in the upper and lower plots of DIG’s model garden at the Lwala Community Clinic.
These yields were .114kg/m2 and .603kg/m2, respectively. In an attempt to circumvent the complexities
of identifying an exact wage rate and an average expected roselle yield within DIG’s target communities,
this analysis is broken down into nine scenarios based on three potential wage rates and three harvest
yields. Wage rates begin at a low of 10Ksh per hour, based on the assumption that households rate their
labor lower than the market value, and increases to 20Ksh and 40Ksh per hour, based on the rates
provided within the community. Roselle yield begins with the lowest recorded, .114kg/m2, and increases
to .388 kg/m2 recorded from a field in Waware, then to the highest recorded yield of .608kg/m2. It
should be noted that higher yields in Kenya are possible – Karkin, a roselle company based in Kisumu,
achieves an estimated average yield of 1.080kg/m2 using industrial organic practices. However, since
.608kg/m2 is the highest recorded using DIG production techniques, this was used as a potential upper
average for DIG projects.
Furthermore, farmers within DIG’s network grow at vastly different scales. Some farmers in the Kuna
group grow over a thousand square meters of roselle, where others grow only several hundred. Since
this analysis is intended to find thresholds where roselle production is feasible, it splits each scenario
into four potential scales of production: 100m2, 500m2, 1,000m2 and 4,000m2, the last of which is
approximately one acre. Finally, the analysis splits each scenario and production scale into the possible
1 Nambiro, E. 2010. “Trends in land use and agricultural intensification in Kakamega, Western Kenya” (Doctoral dissertation). Retrieved from the Rheinischen-Friedrich-Wilhelms-Universität zu Bonn.
4a
methods of selling roselle mentioned above: 1) in bulk as “wet” sepals, 2) in bulk as dried sepals, 3)
packaged without a label, and 4) packaged with a label.
As the total yield for production systems rises, it is expected that additional capital will be needed for
drying and packaging roselle beyond the household tarps and blankets that are typically used. To
account for this with the Kuna group, DIG built an open-air drying rack capable of drying 8kg of wet
roselle over 20 hours, at a cost of 10,300Ksh (approximately $100 USD). Larger production systems that
package roselle will also benefit from an Impulse Sealer, which seals polypropylene bags more efficiently
than the typical method using candles. The Impulse Sealer costs 2,800Ksh (approximately $28 USD).
Both the Impulse Sealer and open air drying rack are added to any scenarios where yields are 100kg or
greater.
Challenges and Assumptions Beyond determining an appropriate wage rate and average yield, there are several major challenges and
assumptions that limit the results of this analysis. Foremost is the accuracy and completeness of
measurements used. Ideally, this analysis would have measured the yield and labor requirements for
value-added products for the harvest of every plot, however the personal schedules of farmers did not
always allow measurements to be taken. In addition, because of small sample sizes and limited access to
accurate measurement instruments, the compiled averages used in this analysis have a high degree of
error. The hanging scale used, for example, was the only tool available to measure the wet weight of
roselle in the field, but it often gave contradictory results in subsequent measurements of the same
harvests. Due to these limitations, this cost-benefit analysis is a generalization of the potential costs and
revenues a farmer can expect from selling value-added roselle products.
Another major challenge was to determine the labor cost involved in marketing packaged roselle.
Although not an insignificant cost, this was left out of the analysis because of the difficulties in
producing an accurate measure. It can be expected for farmers to initially invest time in introducing
their products to local markets, especially since there is a dearth of roselle products in rural Kenya. From
this point, there are two possible outcomes: the local community will enjoy the products and the farmer
will strive to meet local demand, or the local demand will become saturated and the farmer will have to
search for additional markets. Since this is omitted from the analysis, it is important to keep in mind that
packaging and marketing roselle at the local level includes potentially large, unaccounted costs.
Several major assumptions were also used in this analysis that may skew the results. First, the analysis
assumes farmers will sell all of their product, which is actually a best-case scenario in some instances.
As mentioned above, farmers selling package roselle locally might exceed demand for their products and
be forced to sell outside their preferred markets or consume the roselle at home. In this scenario,
farmers are incentivized to grow less if they are unable to find a new market for their product. This is
less of a problem for roselle sold in bulk to large companies such as Botanical Treasures, who are able to
tap into national and international markets. To ensure farmers have sufficient markets for their
products, scenarios in which both bulk sales and package sales are feasible are ideal for future projects.
Second, the analysis assumes the production practices at each scale to remain the same, using hand
cultivation methods. In reality, this is not the case – as scale increases, households generally move from
hand cultivation to more efficient oxen ploughs. Since that efficiency is overlooked in this analysis, the
gross margins of larger production systems is potentially larger than predicted. However, it is not certain
5a
at what scale households move toward this form of production, or if there are other factors beyond
scale that limit or promote the use of oxen ploughs, so it is assumed that all households use the same
production methods.
Lastly, the analysis assumes household cattle can produce enough manure to maintain all levels of yield
in the analysis. The majority of farmers in the Kuna group only source manure from their own cattle for
their fields, but it is unlikely that all households can maintain soil fertility with their cattle across all
yields and production scales. This is an additional unknown cost that is not accounted for in this analysis.
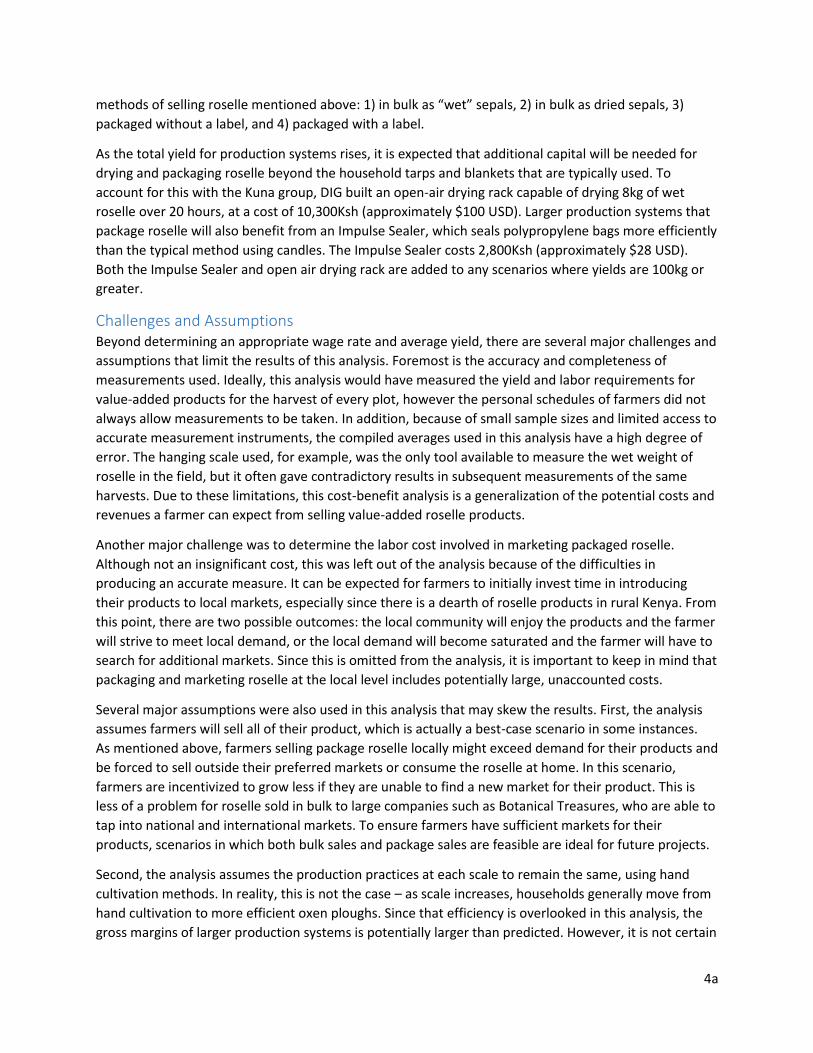
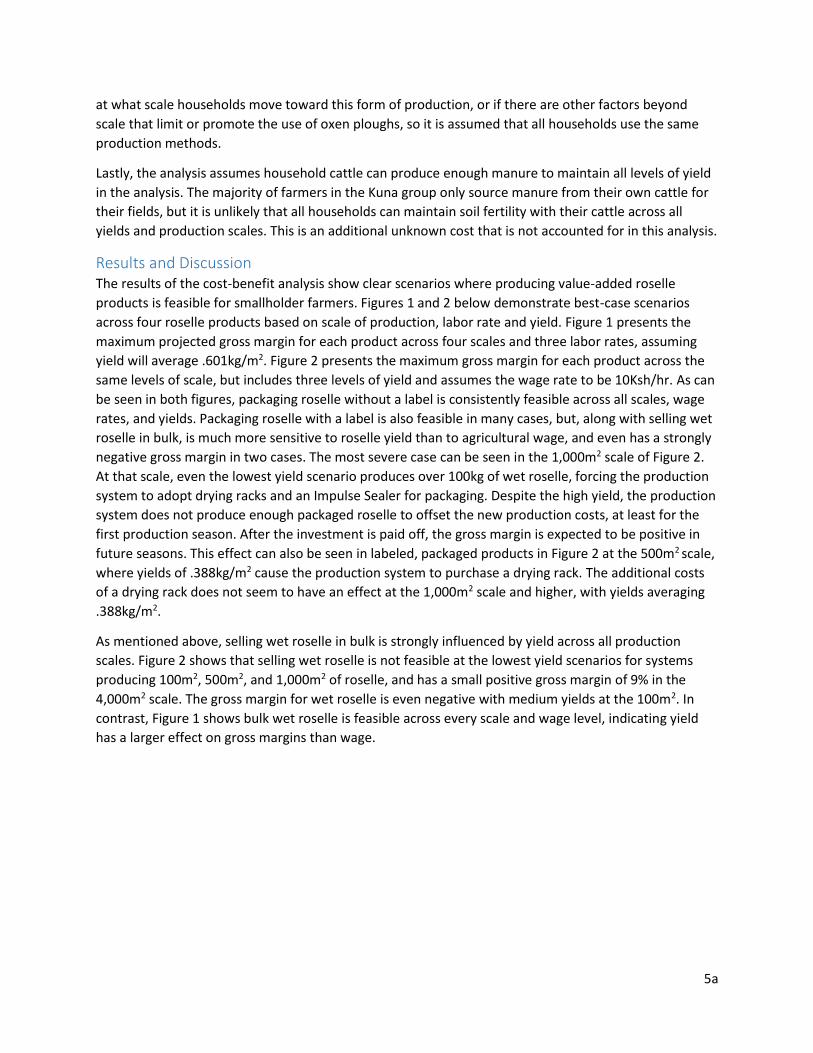
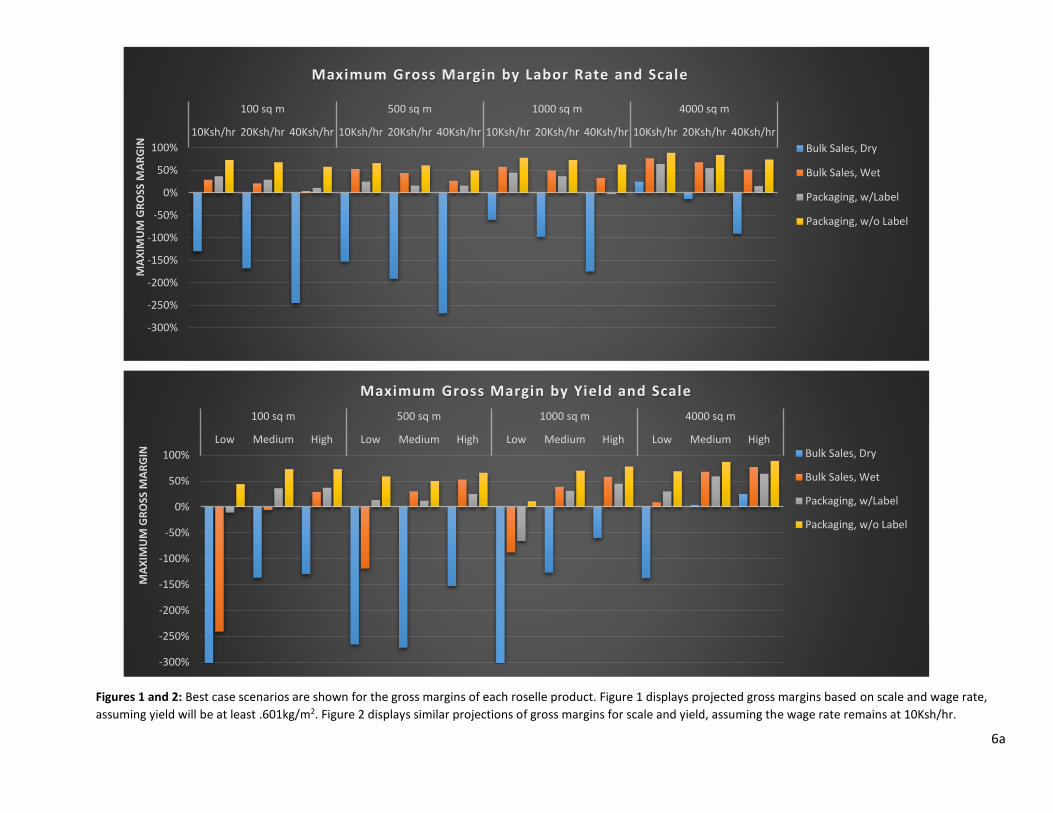
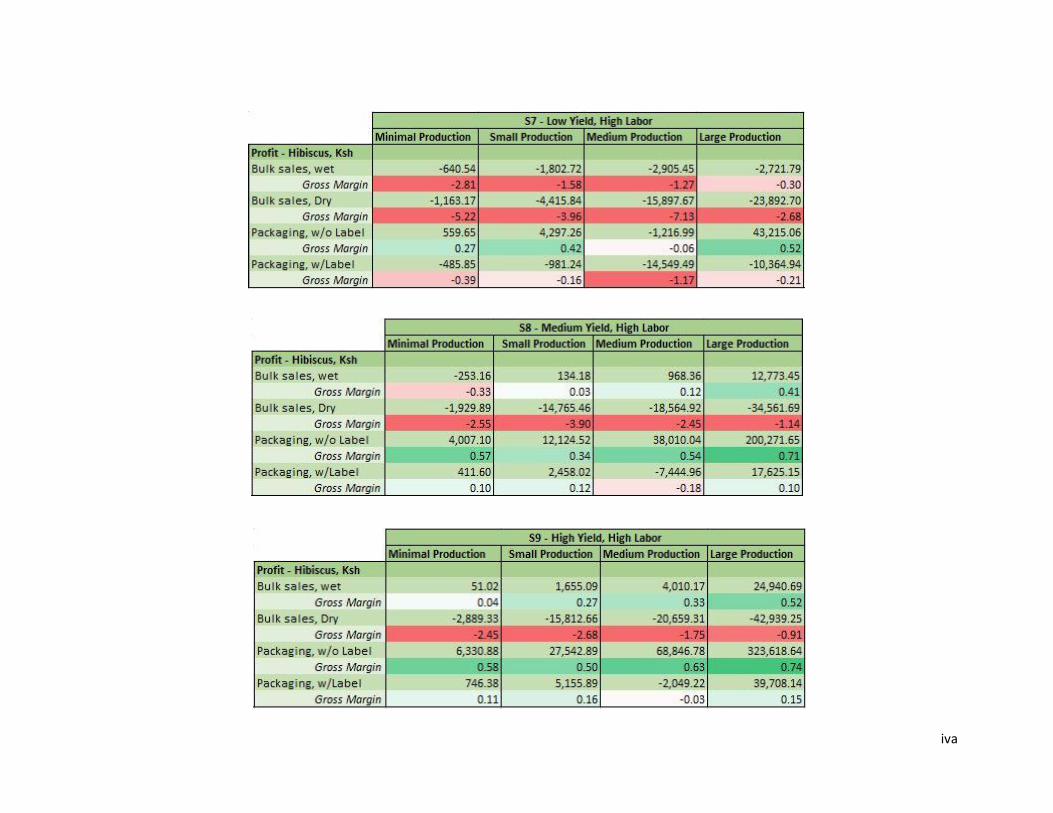
Results and Discussion The results of the cost-benefit analysis show clear scenarios where producing value-added roselle
products is feasible for smallholder farmers. Figures 1 and 2 below demonstrate best-case scenarios
across four roselle products based on scale of production, labor rate and yield. Figure 1 presents the
maximum projected gross margin for each product across four scales and three labor rates, assuming
yield will average .601kg/m2. Figure 2 presents the maximum gross margin for each product across the
same levels of scale, but includes three levels of yield and assumes the wage rate to be 10Ksh/hr. As can
be seen in both figures, packaging roselle without a label is consistently feasible across all scales, wage
rates, and yields. Packaging roselle with a label is also feasible in many cases, but, along with selling wet
roselle in bulk, is much more sensitive to roselle yield than to agricultural wage, and even has a strongly
negative gross margin in two cases. The most severe case can be seen in the 1,000m2 scale of Figure 2.
At that scale, even the lowest yield scenario produces over 100kg of wet roselle, forcing the production
system to adopt drying racks and an Impulse Sealer for packaging. Despite the high yield, the production
system does not produce enough packaged roselle to offset the new production costs, at least for the
first production season. After the investment is paid off, the gross margin is expected to be positive in
future seasons. This effect can also be seen in labeled, packaged products in Figure 2 at the 500m2 scale,
where yields of .388kg/m2 cause the production system to purchase a drying rack. The additional costs
of a drying rack does not seem to have an effect at the 1,000m2 scale and higher, with yields averaging
.388kg/m2.
As mentioned above, selling wet roselle in bulk is strongly influenced by yield across all production
scales. Figure 2 shows that selling wet roselle is not feasible at the lowest yield scenarios for systems
producing 100m2, 500m2, and 1,000m2 of roselle, and has a small positive gross margin of 9% in the
4,000m2 scale. The gross margin for wet roselle is even negative with medium yields at the 100m2. In
contrast, Figure 1 shows bulk wet roselle is feasible across every scale and wage level, indicating yield
has a larger effect on gross margins than wage.
6a
Figures 1 and 2: Best case scenarios are shown for the gross margins of each roselle product. Figure 1 displays projected gross margins based on scale and wage rate,
assuming yield will be at least .601kg/m2. Figure 2 displays similar projections of gross margins for scale and yield, assuming the wage rate remains at 10Ksh/hr.
-300%
-250%
-200%
-150%
-100%
-50%
0%
50%
100%
Low Medium High Low Medium High Low Medium High Low Medium High
100 sq m 500 sq m 1000 sq m 4000 sq m
MA
XIM
UM
GR
OSS
MA
RG
IN
Maximum Gross Margin by Yield and Scale
Bulk Sales, Dry
Bulk Sales, Wet
Packaging, w/Label
Packaging, w/o Label
-300%
-250%
-200%
-150%
-100%
-50%
0%
50%
100%
10Ksh/hr 20Ksh/hr 40Ksh/hr 10Ksh/hr 20Ksh/hr 40Ksh/hr 10Ksh/hr 20Ksh/hr 40Ksh/hr 10Ksh/hr 20Ksh/hr 40Ksh/hr
100 sq m 500 sq m 1000 sq m 4000 sq m
MA
XIM
UM
GR
OSS
MA
RG
IN
Maximum Gross Margin by Labor Rate and Scale
Bulk Sales, Dry
Bulk Sales, Wet
Packaging, w/Label
Packaging, w/o Label
7a
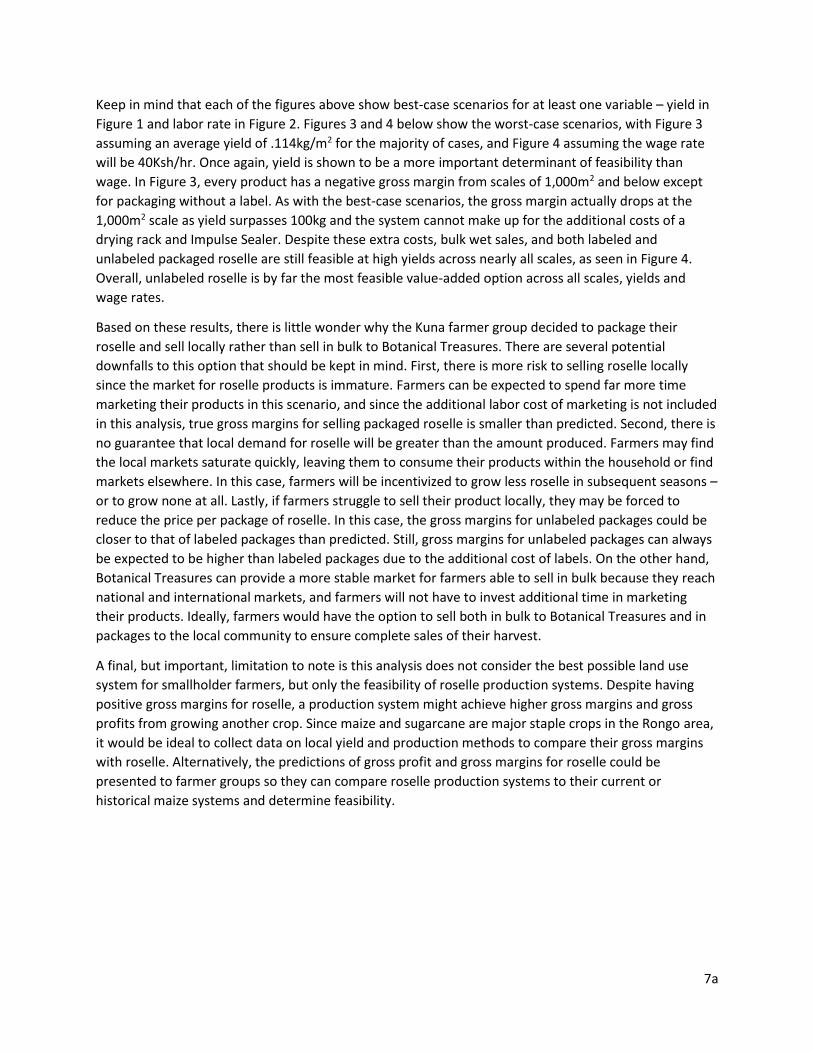
Keep in mind that each of the figures above show best-case scenarios for at least one variable – yield in
Figure 1 and labor rate in Figure 2. Figures 3 and 4 below show the worst-case scenarios, with Figure 3
assuming an average yield of .114kg/m2 for the majority of cases, and Figure 4 assuming the wage rate
will be 40Ksh/hr. Once again, yield is shown to be a more important determinant of feasibility than
wage. In Figure 3, every product has a negative gross margin from scales of 1,000m2 and below except
for packaging without a label. As with the best-case scenarios, the gross margin actually drops at the
1,000m2 scale as yield surpasses 100kg and the system cannot make up for the additional costs of a
drying rack and Impulse Sealer. Despite these extra costs, bulk wet sales, and both labeled and
unlabeled packaged roselle are still feasible at high yields across nearly all scales, as seen in Figure 4.
Overall, unlabeled roselle is by far the most feasible value-added option across all scales, yields and
wage rates.
Based on these results, there is little wonder why the Kuna farmer group decided to package their
roselle and sell locally rather than sell in bulk to Botanical Treasures. There are several potential
downfalls to this option that should be kept in mind. First, there is more risk to selling roselle locally
since the market for roselle products is immature. Farmers can be expected to spend far more time
marketing their products in this scenario, and since the additional labor cost of marketing is not included
in this analysis, true gross margins for selling packaged roselle is smaller than predicted. Second, there is
no guarantee that local demand for roselle will be greater than the amount produced. Farmers may find
the local markets saturate quickly, leaving them to consume their products within the household or find
markets elsewhere. In this case, farmers will be incentivized to grow less roselle in subsequent seasons –
or to grow none at all. Lastly, if farmers struggle to sell their product locally, they may be forced to
reduce the price per package of roselle. In this case, the gross margins for unlabeled packages could be
closer to that of labeled packages than predicted. Still, gross margins for unlabeled packages can always
be expected to be higher than labeled packages due to the additional cost of labels. On the other hand,
Botanical Treasures can provide a more stable market for farmers able to sell in bulk because they reach
national and international markets, and farmers will not have to invest additional time in marketing
their products. Ideally, farmers would have the option to sell both in bulk to Botanical Treasures and in
packages to the local community to ensure complete sales of their harvest.
A final, but important, limitation to note is this analysis does not consider the best possible land use
system for smallholder farmers, but only the feasibility of roselle production systems. Despite having
positive gross margins for roselle, a production system might achieve higher gross margins and gross
profits from growing another crop. Since maize and sugarcane are major staple crops in the Rongo area,
it would be ideal to collect data on local yield and production methods to compare their gross margins
with roselle. Alternatively, the predictions of gross profit and gross margins for roselle could be
presented to farmer groups so they can compare roselle production systems to their current or
historical maize systems and determine feasibility.
8a
Figures 3 and 4: Worst-case scenarios are shown by using the minimum gross margin across all roselle products. Figure 3 shows worst-case scenarios by labor rate and
scale, which in most cases assumes yield will average .114kg/m2 the lowest possible in this analysis. Likewise, Figure 4 shows worst-case scenarios by yield and scale,
assuming the wage rate will be 40Ksh/hr.
-300%
-250%
-200%
-150%
-100%
-50%
0%
50%
100%
10Ksh/hr 20Ksh/hr 40Ksh/hr 10Ksh/hr 20Ksh/hr 40Ksh/hr 10Ksh/hr 20Ksh/hr 40Ksh/hr 10Ksh/hr 20Ksh/hr 40Ksh/hr
100m2 500m2 1000m2 4000m2
MIN
IMU
M G
RO
SS M
AR
GIN
Minimum Gross Margin by Labor Rate and Scale
Bulk Sales, Dry
Bulk Sales, Wet
Packaging, w/Label
Packaging, w/o Label
-300%
-250%
-200%
-150%
-100%
-50%
0%
50%
100%
Low Medium High Low Medium High Low Medium High Low Medium High
100m2 500m2 1000m2 4000m2
MIN
IMU
M G
RO
SS M
AR
GIN
Minimum Gross Margin by Yield and Scale
Bulk Sales, Dry
Bulk Sales, Wet
Packaging, w/Label
Packaging, w/o Label
9a
Kuna Group Case Study The results of the cost-benefit analysis can be used to predict the gross margins of members within the
Kuna group. The group started growing roselle through in the 2016 long-rains season (April – June). By
approximation, all individual plots are less than 1,000m2, with the majority ranging from 100m2 to
500m2. Yield was not measured across plots, but roselle stand appeared similar to that of the Kuna
demonstration garden, which yielded.138kg/m2. This is just above the lowest metric of the cost-benefit
analysis. Based on group discussions and their willingness to engage in labor-intensive value-addition,
the group would likely value their labor between 10Ksh/hr and 20Ksh/hr. The group has widely decided
to package roselle without labels at 50Ksh per package.
Based on these variables, members of the Kuna group
fall within the scenarios presented in Figure 3. With
low yield, plot sizes smaller than 1,000m2, and medium
to low wage rates, the only feasible option is to sell
roselle in unlabeled packages for 50Ksh per package.
As a whole, the group was provided labels free of
charge from DIG. Once the labels run out, it would not
be feasible for individuals to purchase their own labels
to spread Kuna’s brand under current yield and scale.
By increasing yield to .388, which was seen in the
Waware group, both bulk wet sales and packaging
with a label would be feasible at scales of 500m2 and
above. This would greatly expand options within the
group, allowing farmers to switch between bulk sales
and packages based on the demand in local markets.
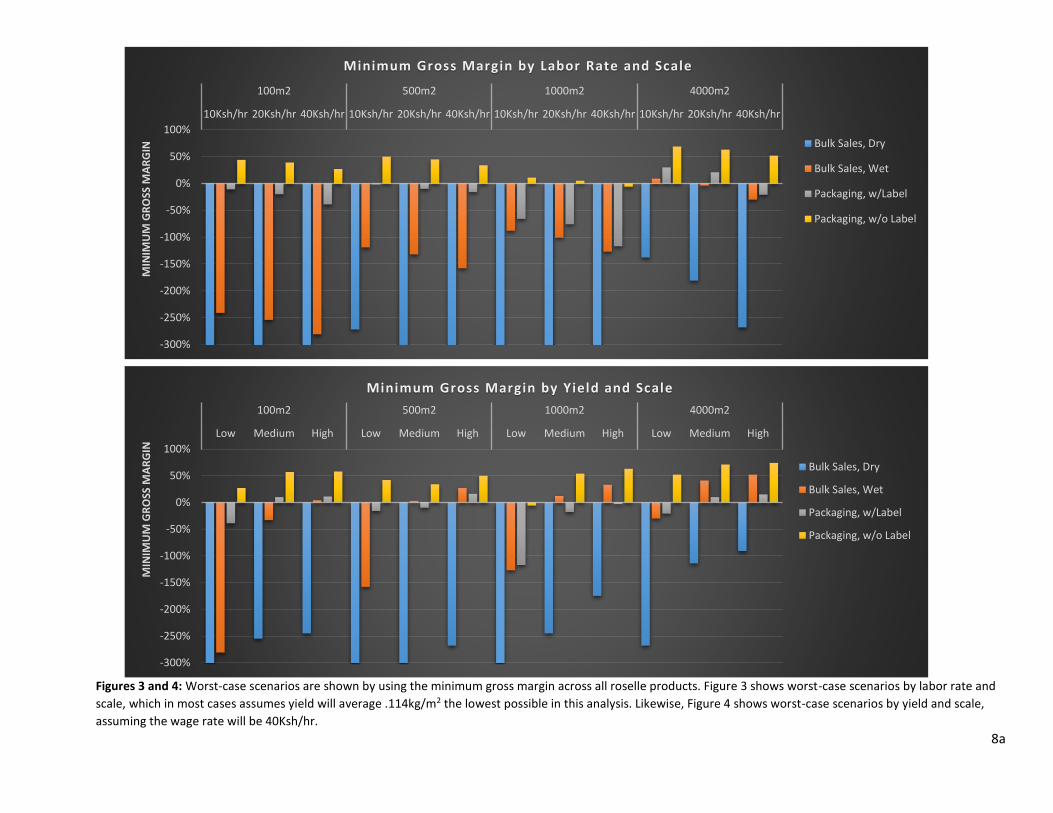
In a recent assessment of fields planted by Kuna group
members, several recently planted fields have poor
germination and varied plant spacing, and are unlikely
to produce yields even at the lowest level used in this
analysis. In addition, several fields in the long-rains also
failed to produce. Initially, the reasons for poor yield
and growth were thought to be caused by pests and fungal disease. After consulting with Botanical
Treasures, it seems a lack of soil fertility and planting late in the rainy season may have a greater effect
on plant growth, as roselle is more susceptible to disease when stressed. The picture at right is an
example of a poor roselle stand in a recently cultivated plot from the Kuna group. The roselle remains in
dense patches throughout the field, possibly from poor planting technique. The plants are also stunted
for their age, and unlikely to produce a substantial yield. Some plots in the Kuna group are faring much
better, with estimated yields around those measured in Waware. With the appropriate application of
fertilizers, proper plant timing with the rains, and more emphasis on planting technique it is likely that
crop failures can be avoided.
Picture 1: Roselle field from Kuna Group. Taken Oct. 27th.

10a
Conclusion By far, the most important variable in determining the feasibility of value-added roselle projects is yield.
Even with a high wage rate, all roselle products were feasible across even the smallest scales, except for
selling dried roselle in bulk. Dried bulk roselle is possibly feasible for intermediary businesses, which
purchase wet roselle from surrounding farmers before drying and selling the roselle to Botanical
Treasures. Based on current yields, the only feasible option for Kuna group members is to sell unlabeled,
packaged roselle to local communities. Being limited to this option has significant risks, as local demand
for roselle is not guaranteed and labor spent on marketing could erode gross margins and gross profits.
The opportunity to sell roselle through multiple avenues limits risk for growers, but yields need to reach
at least and average of .388kg/m2 for bulk sales to be feasible across most scales. Ensuring farmers have
access to sufficient fertilizers and are able to plant with the onset of the rains is key to achieving higher
yields in future roselle value-addition projects.

ia
Appendix A: Data Collected from DIG Farmer Groups
All data were collected from the harvests of the 2016 long-rains from DIG’s Kuna and Waware farmer groups, and DIG’s model farm located at
the Lwala Community Alliance.
Location Date Wet Weight (kg)
Harvest (hrs)
Harvest (hrs/kg)
Size of Field (m2)
Yield, wet weight (kg/m2)
Calyx Removal (hrs)
Calyx Removal (hrs/kg)
Dry Weight (kg)
DIG, upper garden 27-Jul 10.90 1.39 0.128 18.070 0.603 6.030 0.553
DIG, lower garden 16-Aug 10.40 91.090 0.114 7.750 0.745 0.560
Kuna 9-Aug 60.00 8.25 0.138 391.320 0.153
DIG, lower garden 29-Aug 3.83 0.67 0.174 28.690 0.133 1.750 0.458 0.221
Waware 11-Oct 24.73 63.710 0.388 1.380
Averages: 21.28 3.44 0.146 118.576 0.278 5.177 0.585 0.391
Location
Weight of pre-packaged roselle (kg)
Packaged Time (hrs)
Package Time (hrs/kg) Package (#)
Package (#/kg)
Include Labels?
Package Weight (kg/pck)
DIG, upper garden
DIG, lower garden 0.463 1.833 3.959 33 71.274 no 0.014
Kuna 2.000 5.210 2.605 118 59.000 yes 0.016
DIG, lower garden 0.221
Waware 1.380 91 no
Averages: 0.895 3.522 3.282 76 65.137 0.015

iia
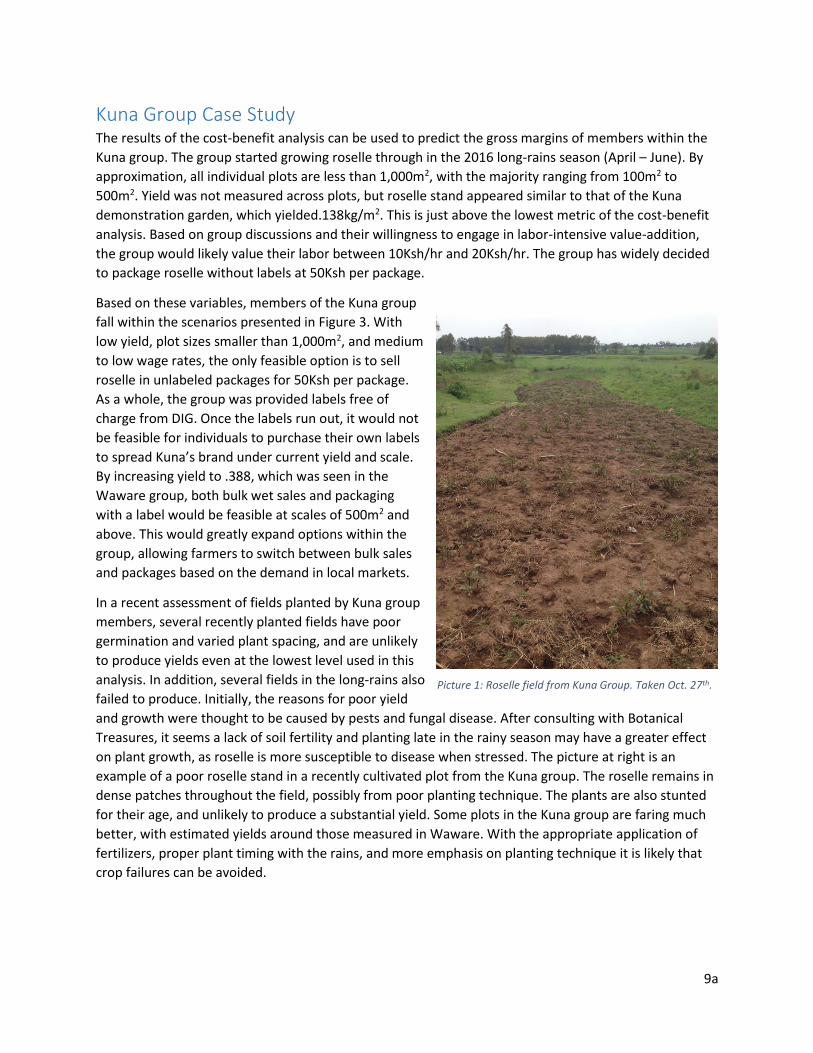
Appendix B: Gross Margins and Gross Profits of Production Scenarios

iiia
iva
Prepared by: Michael Wallace 1b MS International Agricultural Development, Candidate University of California, Davis
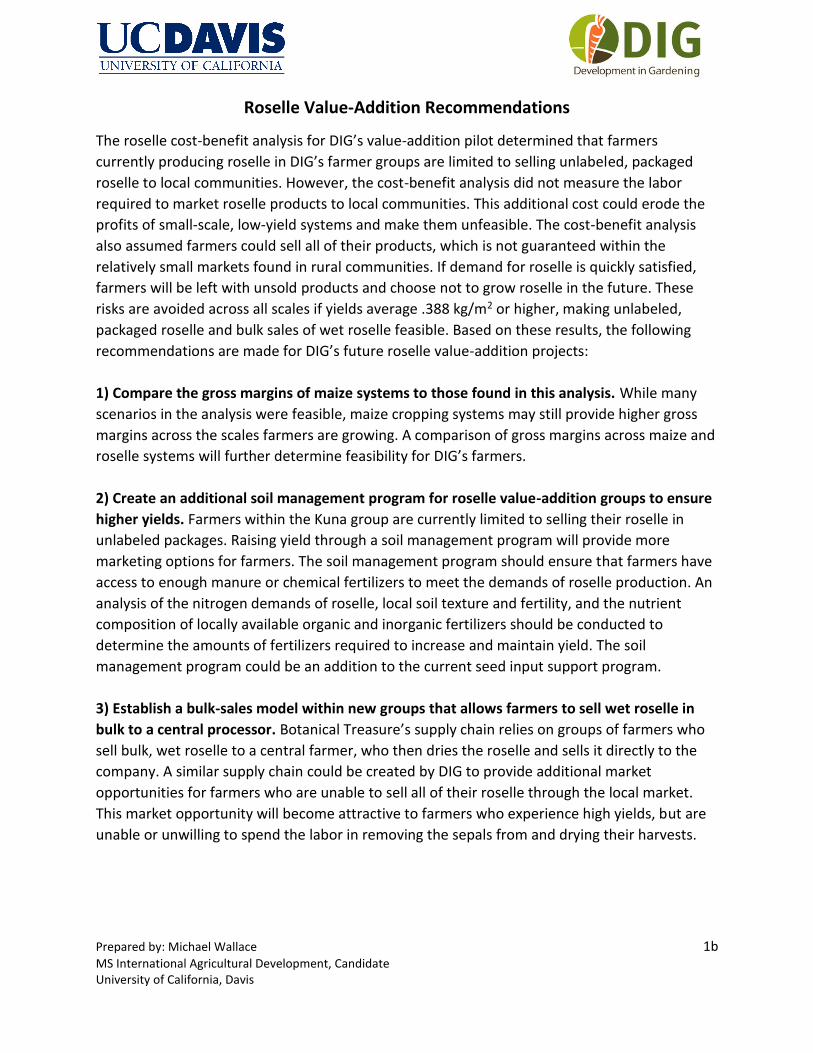
Roselle Value-Addition Recommendations
The roselle cost-benefit analysis for DIG’s value-addition pilot determined that farmers
currently producing roselle in DIG’s farmer groups are limited to selling unlabeled, packaged
roselle to local communities. However, the cost-benefit analysis did not measure the labor
required to market roselle products to local communities. This additional cost could erode the
profits of small-scale, low-yield systems and make them unfeasible. The cost-benefit analysis
also assumed farmers could sell all of their products, which is not guaranteed within the
relatively small markets found in rural communities. If demand for roselle is quickly satisfied,
farmers will be left with unsold products and choose not to grow roselle in the future. These
risks are avoided across all scales if yields average .388 kg/m2 or higher, making unlabeled,
packaged roselle and bulk sales of wet roselle feasible. Based on these results, the following
recommendations are made for DIG’s future roselle value-addition projects:
1) Compare the gross margins of maize systems to those found in this analysis. While many
scenarios in the analysis were feasible, maize cropping systems may still provide higher gross
margins across the scales farmers are growing. A comparison of gross margins across maize and
roselle systems will further determine feasibility for DIG’s farmers.
2) Create an additional soil management program for roselle value-addition groups to ensure
higher yields. Farmers within the Kuna group are currently limited to selling their roselle in
unlabeled packages. Raising yield through a soil management program will provide more
marketing options for farmers. The soil management program should ensure that farmers have
access to enough manure or chemical fertilizers to meet the demands of roselle production. An
analysis of the nitrogen demands of roselle, local soil texture and fertility, and the nutrient
composition of locally available organic and inorganic fertilizers should be conducted to
determine the amounts of fertilizers required to increase and maintain yield. The soil
management program could be an addition to the current seed input support program.
3) Establish a bulk-sales model within new groups that allows farmers to sell wet roselle in
bulk to a central processor. Botanical Treasure’s supply chain relies on groups of farmers who
sell bulk, wet roselle to a central farmer, who then dries the roselle and sells it directly to the
company. A similar supply chain could be created by DIG to provide additional market
opportunities for farmers who are unable to sell all of their roselle through the local market.
This market opportunity will become attractive to farmers who experience high yields, but are
unable or unwilling to spend the labor in removing the sepals from and drying their harvests.
Prepared by: Michael Wallace 1b MS International Agricultural Development, Candidate University of California, Davis
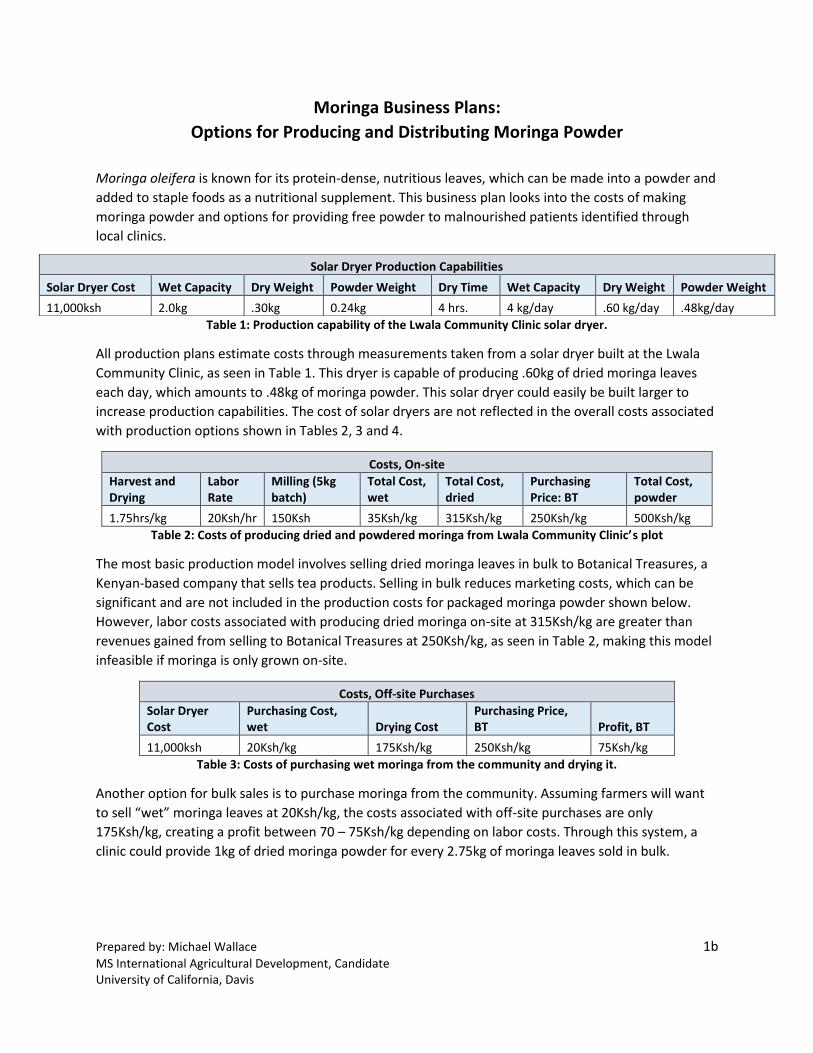
Moringa Business Plans:
Options for Producing and Distributing Moringa Powder
Moringa oleifera is known for its protein-dense, nutritious leaves, which can be made into a powder and
added to staple foods as a nutritional supplement. This business plan looks into the costs of making
moringa powder and options for providing free powder to malnourished patients identified through
local clinics.
Table 1: Production capability of the Lwala Community Clinic solar dryer.
All production plans estimate costs through measurements taken from a solar dryer built at the Lwala
Community Clinic, as seen in Table 1. This dryer is capable of producing .60kg of dried moringa leaves
each day, which amounts to .48kg of moringa powder. This solar dryer could easily be built larger to
increase production capabilities. The cost of solar dryers are not reflected in the overall costs associated
with production options shown in Tables 2, 3 and 4.
Costs, On-site
Harvest and Drying
Labor Rate
Milling (5kg batch)
Total Cost, wet
Total Cost, dried
Purchasing Price: BT
Total Cost, powder
1.75hrs/kg 20Ksh/hr 150Ksh 35Ksh/kg 315Ksh/kg 250Ksh/kg 500Ksh/kg
Table 2: Costs of producing dried and powdered moringa from Lwala Community Clinic’s plot
The most basic production model involves selling dried moringa leaves in bulk to Botanical Treasures, a
Kenyan-based company that sells tea products. Selling in bulk reduces marketing costs, which can be
significant and are not included in the production costs for packaged moringa powder shown below.
However, labor costs associated with producing dried moringa on-site at 315Ksh/kg are greater than
revenues gained from selling to Botanical Treasures at 250Ksh/kg, as seen in Table 2, making this model
infeasible if moringa is only grown on-site.
Costs, Off-site Purchases
Solar Dryer Cost
Purchasing Cost, wet Drying Cost
Purchasing Price, BT Profit, BT
11,000ksh 20Ksh/kg 175Ksh/kg 250Ksh/kg 75Ksh/kg
Table 3: Costs of purchasing wet moringa from the community and drying it.
Another option for bulk sales is to purchase moringa from the community. Assuming farmers will want
to sell “wet” moringa leaves at 20Ksh/kg, the costs associated with off-site purchases are only
175Ksh/kg, creating a profit between 70 – 75Ksh/kg depending on labor costs. Through this system, a
clinic could provide 1kg of dried moringa powder for every 2.75kg of moringa leaves sold in bulk.
Solar Dryer Production Capabilities
Solar Dryer Cost Wet Capacity Dry Weight Powder Weight Dry Time Wet Capacity Dry Weight Powder Weight
11,000ksh 2.0kg .30kg 0.24kg 4 hrs. 4 kg/day .60 kg/day .48kg/day
Prepared by: Michael Wallace 2b MS International Agricultural Development, Candidate University of California, Davis
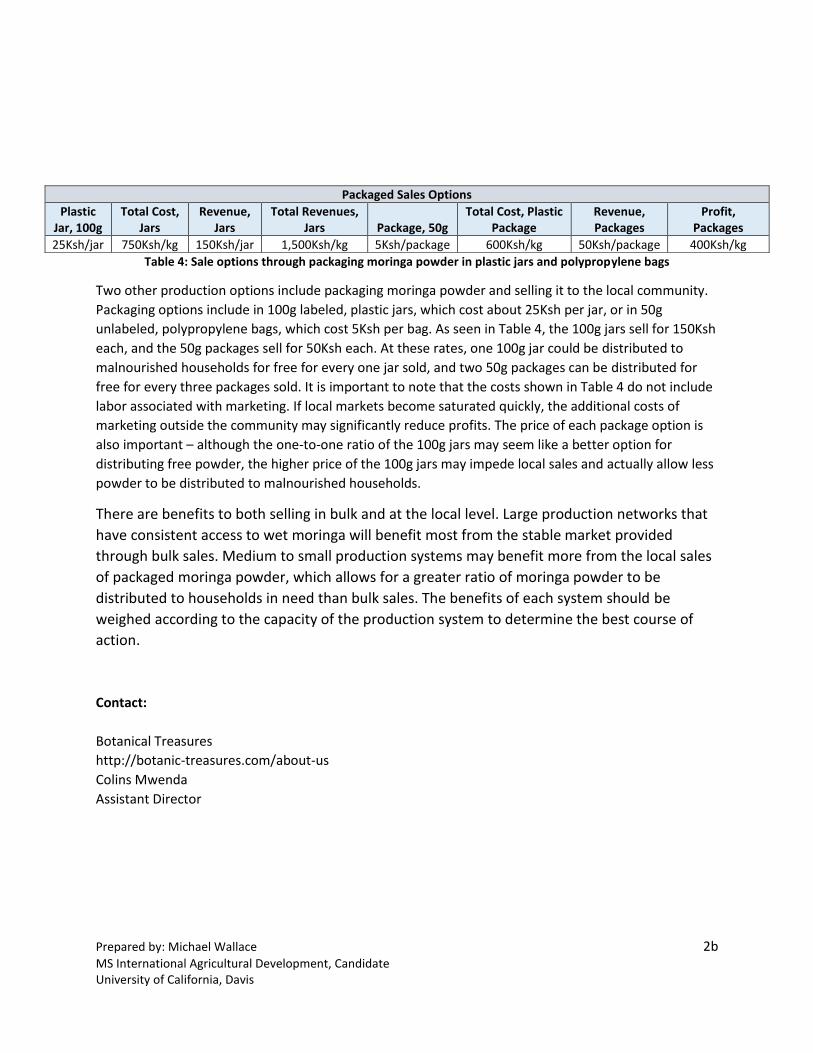
Table 4: Sale options through packaging moringa powder in plastic jars and polypropylene bags
Two other production options include packaging moringa powder and selling it to the local community.
Packaging options include in 100g labeled, plastic jars, which cost about 25Ksh per jar, or in 50g
unlabeled, polypropylene bags, which cost 5Ksh per bag. As seen in Table 4, the 100g jars sell for 150Ksh
each, and the 50g packages sell for 50Ksh each. At these rates, one 100g jar could be distributed to
malnourished households for free for every one jar sold, and two 50g packages can be distributed for
free for every three packages sold. It is important to note that the costs shown in Table 4 do not include
labor associated with marketing. If local markets become saturated quickly, the additional costs of
marketing outside the community may significantly reduce profits. The price of each package option is
also important – although the one-to-one ratio of the 100g jars may seem like a better option for
distributing free powder, the higher price of the 100g jars may impede local sales and actually allow less
powder to be distributed to malnourished households.
There are benefits to both selling in bulk and at the local level. Large production networks that
have consistent access to wet moringa will benefit most from the stable market provided
through bulk sales. Medium to small production systems may benefit more from the local sales
of packaged moringa powder, which allows for a greater ratio of moringa powder to be
distributed to households in need than bulk sales. The benefits of each system should be
weighed according to the capacity of the production system to determine the best course of
action.
Contact:
Botanical Treasures
http://botanic-treasures.com/about-us
Colins Mwenda
Assistant Director
Packaged Sales Options
Plastic Jar, 100g
Total Cost, Jars
Revenue, Jars
Total Revenues, Jars Package, 50g
Total Cost, Plastic Package
Revenue, Packages
Profit, Packages
25Ksh/jar 750Ksh/kg 150Ksh/jar 1,500Ksh/kg 5Ksh/package 600Ksh/kg 50Ksh/package 400Ksh/kg