Embed Size (px)
Citation preview

ABN 78 004 213 692
Aluminium ShApiNg the Future
Capral Limited Annual Report 2011
CA
PR
AL LIM
ITE
D A
NN
UA
L RE
PO
RT
2011
For
per
sona
l use
onl
y

Contents01 CAPRAL’s REsOLUTIONs
02 KEy sTATIsTICs
03 ChAIRMAN’s REPORT
04 MANAgINg DIRECTOR’s REPORT
06 BOARD OF DIRECTORs
08 CORPORATE gOvERNANCE sTATEMENT
13 CORPORATE sOCIAL REsPONsIBILITy sTATEMENT
15 DIRECTORs’ REPORT
27 AUDITOR’s INDEPENDENCE DECLARATION
28 CONsOLIDATED sTATEMENT OF COMPREhENsIvE INCOME
29 CONsOLIDATED sTATEMENT OF FINANCIAL POsITION
30 CONsOLIDATED sTATEMENT OF CAsh FLOws
31 CONsOLIDATED sTATEMENT OF ChANgEs IN EQUITy
32 NOTEs TO ThE FINANCIAL sTATEMENTs
75 DIRECTORs’ DECLARATION
76 INDEPENDENT AUDITOR’s REPORT
78 MEMBER’s DETAILs
IBC CORPORATE DIRECTORy
For
per
sona
l use
onl
y

We ConsIDeR sAFeTY FIRsT.We know that no job is so important that it can’t be done safely. We accept nothing less than zero injuries...
We recognise our customers as the people who determine our success.
We knoW Who ouR CusTomeRs ARe AnD The seRVICe TheY expeCT. AnD We DeLIVeR...
We TAke oWneRshIp FoR eVeRYThIng ThAT We Do.We are empowered to make decisions and always think about the business as our own...
We knoW ThAT TeAmWoRk WILL AChIeVe The BesT oVeRALL BusIness ouTCome.We share ideas and resources to achieve more for us all. We trust each other to do a good job...
We hAVe A pAssIon FoR exCeLLenCe.We stretch ourselves to do the very best we can. We work with urgency and share a will to win...
We hAVe InTegRITY.We are honest and straight-talking and we do the right thing.
C APR AL’s
REsOLUTIONs 01F
or p
erso
nal u
se o
nly

C APR AL ANNUAL REPORT 201102
key statistics
$6.2m $8.8mEBITDA1 PROFIT OPERATINg CAsh FLOw
FOR thE yEAR EndEd 31 dECEmbER 2011 2010 VARiAnCE
sales volumes – External (‘000) 48.3 55.6 (7.3)
$M $M $M
Revenue 348.6 399.7 (51.1)
EBITDA1 6.2 19.2 (13.0)
(Loss)/Profit after Tax (8.0) 6.7 (14.7)
Operating Cash Flow 8.8 19.8 (11.0)
Net Cash 14.8 11.3 3.5
1 Earnings before interest, tax, depreciation and amortisation
For
per
sona
l use
onl
y

03ChAIRMAN’s REPORT
Chairman’s ReportThe Company recorded a loss after tax of $8.0 million for the year ended 31 December 2011 (2010: $6.7 million profit, of which $2.6 million resulted from the recognition of a portion of deferred tax assets).
The Australian aluminium extrusions market declined by an estimated 13% in 2011 as a result of lower construction activity in both the residential and commercial sectors. Private sector housing approvals in 2011 were the lowest recorded since 1996. In addition, manufacturing capacity increased with the introduction of new presses into the local market.
Whilst 2011 saw a disappointing reduction in volume and sales levels, there were a number of pleasing features to Capral’s 2011 performance:
› Notwithstanding the additional local capacity, the Company’s output volumes and revenues declined in line with the overall market, thereby maintaining Capral’s market share.
› The Company’s continued focus on operating efficiency and costs resulted in the daily EBITDA breakeven volume improving a further 6% on 2010. The daily breakeven volume has reduced by some 43% in the three years since 2008.
› The operating efficiencies and continuing cost savings resulted in an operating EBITDA of $9.2 million. A $3 million downward LME mark to market inventory valuation resulted in the reported EBITDA of $6.2 million (2010: $19.2 million).
› Despite the difficult trading conditions, the Company produced an operating cash flow from operations of $8.8 million, resulting in net cash on hand at 31 December 2011 of $14.8 million, a $3.5 million improvement on the $11.3 million net cash on hand a year earlier.
During the year the Company successfully renegotiated its finance facilities for a further three years with GE Capital on favourable terms.
The unacceptably low measures imposed by Customs on imports of aluminium extrusion from China have had no meaningful impact, with inflows from China continuing unabated. In addition, the undervalued Yuan continues to present a major competitive challenge not only to local aluminium extruders, but to Australian manufacturers at large. The Company is encouraged by the Government’s anti-dumping reform agenda, which has already begun its passage,
in part, through Parliament. The Government’s establishment of a taskforce to pursue anti-circumvention activities also holds some promise that much needed surveillance of imports will improve. It is hoped that these initiatives will bring Australian manufacturers some way further towards a “fair go”.
The coming year brings many challenges. In the absence of any meaningful uplift in construction activity, the Company expects volumes to remain in line with 2011 levels and faces pressure on costs and pricing. In addition, whilst the Company has a relatively modest carbon footprint, it is anticipated the introduction of the Carbon Tax in mid-2012 will add approximately $1 million to its second half costs. The lower sustainable operating cost base and other initiatives which have enabled the Company to achieve profitability at the EBITDA level for the past two and a half years will continue to gain traction.
No dividends have been declared or paid for the Financial Year. The Board will continue to consider the circumstances of the Company and its policy in regard to dividends on an annual basis.
2011 saw a number of changes to the senior executive team. Tertius Campbell, with many years in the steel industry, joined Capral as Chief Financial Officer. Dave Munro, previously with Fletcher’s NZ, was appointed to head up our distribution division upon the retirement of Alan Simmonds. I would like to acknowledge the great contribution to Capral made by Martin Haszard, who has announced his retirement from March 2012. Richard Michael, who has many years of success with the Company, has been promoted to the EGM Manufacturing role.
I thank my co-directors for their invaluable assistance and contributions during the year. I would also like to extend the Board’s appreciation to the entire Capral team for their dedication and extreme efforts during 2011. Finally, our thanks to all stakeholders for their continued support.
rex Wood-Ward Chairman
22 February 2012
For
per
sona
l use
onl
y

C apr al annual report 201104
A Positive cash flow in a difficult marketFeatures:
› eBitDA1 profit of $6.2m
› Net loss of $8.0m
› positive operating cash flow of $8.8m
› Strong balance sheet with no debt
› progress with Anti Dumping measures
› improved safety outcomes
Over the last three years, Capral has undertaken a fundamental transition process. A lean management structure has been put in place and a new operating philosophy inculcated. Under “Project Relaunch” over $30m of underlying costs have been removed and the trading EBITDA breakeven level has improved by 43%. The Balance Sheet has been recapitalised, leading to the elimination of debt. Positive cash flow earnings have now been achieved for the last two years.
Despite these dramatic improvements, satisfactory financial returns from the business are yet to be realised and it is disappointing that 2011 did not continue the upwards trajectory in financial returns.
Capral and the industry generally face a number of headwinds.
› Subdued demand has yet to recover from the Global Financial Crisis. Negative consumer sentiment continues to hold back new housing starts, despite the pent up demand estimated to be around 120,000 homes of which 70% is in NSW. Capral derives almost 50% of its demand from the important new housing segment. Approvals fell by 14% in 2011, and the 2011 December quarter, was particularly weak.
Non residential construction contributes around 25% of Capral’s volume and this segment also remains anaemic with the month of December approvals around 20% lower than the prior year. Demand for aluminium extrusions generally has fallen 25% since its peak in 2007.
› Dumped extrusion imports, mainly from China, have continued to capture around 35% of the Australian market and drive down prices, despite winning an Anti Dumping case and duty measures being implemented. The actual level of measures of around 6% for larger importers compares to measures of 30% plus for similar products exported
from China to the USA and Canada. There are indications of a concerning level of circumvention by importers of the measures imposed.
The Federal Government is pursuing a reform agenda of the Anti Dumping regime to bring it up to date and with an objective of enabling similar outcomes to other Western economies. A Government taskforce “Bluenet” is investigating circumvention activities in the Aluminium and other selected industries. These dumped products are being underpinned by Chinese Government subsidies and the fixing (manipulation) of the Chinese currency. On a level playing field, Australia can compete. It is vital that steps are taken which result in a meaningful reduction in the level of dumped products which are causing injury to Australian Industry, including the loss of Australian jobs and know how.
› A number of new aluminium presses have been recently installed in Australia by smaller participants. This extra capacity is adding downward pressure on the local industry’s press utilisation rates.
› Input costs are rising, especially energy and labour. The high $A constrains the prospects of recovery of these additional costs by selling price increases.
Capral is executing a comprehensive strategic plan with four major themes.
Firstly DeFeND what we have. Capral is Australia’s largest manufacturer and distributor of quality Aluminium extrusions. We have a national footprint of world class extrusion plants, supported by a national distribution and logistics capability. We value our long term customer relationships and an experienced and committed workforce. A strong balance sheet is a real asset in these turbulent times.
Secondly we OptiMiSe what we do. Project Relaunch spearheads the various efficiency and cost saving initiatives. The Lean Manufacturing program has been widely embraced by our production employees with 240 employees being awarded a certificate in Competitive manufacturing with a further 170 planned or underway. The aim of the program is to develop our people and provide them with a system to improve the way we do things. It particularly focuses on safety, delivery performance, quality, waste and reducing costs, ultimately
managing Director’s Report
1 EBITDA – Earnings before Interest, Tax, Depreciation and Amortisation
For
per
sona
l use
onl
y

05
providing a better product and service offer to our customers. We are seeing good results from Lean Manufacturing, i.e. delivery performance for the second half of 2011 from our extrusion plants was a highly commendable 96%.
In our Distribution business the focus is on capturing market share in specific areas, refining and rationalising our product and service offers, optimising the supply chain and at the same time reducing costs.
Project Relaunch delivered further cost savings of $10.2m in 2011 helping to mitigate the negative volume, price and inflation impacts.
Thirdly, Capral has an ambition for grOWth and is well placed to leverage the inevitable housing cycle upswing. Our presses are currently only 70% utilised and can be quickly ramped back up to capacity. Innovative new products are being developed and there are a number of geographic and channel to market initiatives underway.
Fourthly, Capral continues to play a leading role as we purSue a better Anti Dumping outcome. Capral is a foundation member of Manufacturing Australia which is an association of large Australian manufacturers recently formed, with a common aim of promoting the development of manufacturing in Australia. The Government has established a Trade Remedies Forum to help implement its Anti Dumping reform agenda. Capral is an active member.
Safety performance improved in 2011 with a 31% reduction in Lost Time injuries coupled with a 39% reduction in hours lost due to injuries. A number of plants and warehouses have demonstrated exceptional safety over long periods of time.
I continue to be impressed with the resilience and commitment of our employees. Our focus is on doing “more with less” and delivering a compelling value proposition for our customers. Mr Martin Haszard our Executive General Manager (EGM) of the Extrusion division has announced his retirement after
30 years of exceptional service with Capral. Mr Richard Michael, who has many years of experience with Capral, will step up to the EGM Manufacturing role.
Outlook There does not appear to be respite from the tough trading environment in the short term. The recent weakness in housing approvals suggests market activity will remain subdued for much of 2012 but inevitably will move into its upswing cycle.
Capral expects its volumes to be similar to 2011 in the absence of a market uplift or a reduction in the level of imports.
A sustained high $A will continue to put pressure on pricing and margins. Input costs will rise with the Carbon Tax linked electricity costs rising by around $1m in the second half of 2012.
Project Relaunch cost savings are targeted to at least cover inflation and Carbon Tax impacts.
In these circumstances the EBITDA for 2012 is expected to be in the $5m to $8m range. Operating cash flow should be positive for the full year with an enhanced net cash position as at 31st December 2012.
Capral will continue to strive to strengthen its underlying business and enhance its competitive position, and is well placed to leverage any demand upturn or any positive developments in Anti Dumping measures.
phil Jobe Managing Director
22 February 2012
MANAgINg DIREC TOR’s
REPORT
For
per
sona
l use
onl
y

C apr al annual report 201106
Directors in office at the date of this report:
Rex Wood-WardChairman of Board (independent)
Appointed 6 November 2008
Chairman of the Board and Remuneration & Nomination Committee and member of the Audit Committee.
Mr Wood-Ward has over 35 years of international experience in general management, mergers and acquisitions, corporate strategy and structuring, including in manufacturing and distribution. He is currently a non-executive director of Coats plc which is unlisted.
Directorships of other listed companies held in last 3 years before end of the Financial Year: None
Philip Jobe B. CommManaging Director (Non-independent)
Appointed 24 April 2009
Mr Jobe was appointed as Capral’s Chief Executive Officer and Managing Director in April 2009. Before joining Capral, Mr Jobe was the Executive General Manager of Boral Limited’s Cement Division, including Managing Director of Blue Circle Southern Cement Pty Limited. This also encompassed the role of Chairman of the Cement Industry Federation. He also had executive responsibility for Boral’s expanding Asian construction materials businesses.
Mr Jobe was previously Managing Director of Stegbar Pty Limited from 1989 to 1994.
Directorships of other listed companies held in last 3 years before end of the Financial Year: None
michael Jefferies B. Comm, CANon-executive director (Non-independent)
Appointed 6 November 2008
Member of the Audit Committee and the Remuneration & Nomination Committee.
Mr Jefferies is a Chartered Accountant who has extensive experience in finance and investment. He is currently an executive director of Guinness Peat Group (Australia) Pty Limited, Chairman of Touch Holdings Limited and a non-executive director of Tower Limited, Metals X Limited and Ozgrowth Limited.
Directorships of other listed companies held in last 3 years before end of the Financial Year:
› Non-executive director of Tower Limited: 19 December 2006 to Current.
› Non-executive director of Metals X Limited: 29 December 2006 to Current.
› Non-executive director of Ozgrowth Limited: 31 October 2007 to Current.
› Alternate Director of ClearView Wealth Limited: 27 July 2011 to Current.
› Non-executive director of ClearView Wealth Limited: 4 November 2008 to 27 July 2011.
› Alternate Director of eServGlobal Limited: 20 March 2009 to 24 October 2011.
Board of Directors
For
per
sona
l use
onl
y

07
ian blair M.mgt, FCANon-executive director (independent)
Appointed 23 May 2006
Chairman of the Audit Committee and member of the Remuneration & Nomination Committee.
Mr Blair is a Chartered Accountant and Company Director. He spent almost 20 years as a partner in major accounting firm Deloitte, and retired after 5 years as CEO of that firm. Mr Blair is currently Chairman of IOOF Holdings Ltd and is a director of SAS Trustee Corporation (NSW State Superannuation Fund). He is Chairman of Bisley & Co Pty Ltd, and, within the last 3 years, retired as a director of Melbourne Business School Ltd and Sisters of Charity Health Service Ltd.
Directorships of other listed companies held in last 3 years before end of the Financial Year:
› Non-executive Chairman of IOOF Holdings Ltd: 3 May 2002 to Current.
Anthony Eisen B.Comm, CANon-executive director (Non-independent)
Appointed: 19 October 2006 (as an alternate director); 29 August 2008 (as a director)
Member of the Audit Committee and the Remuneration & Nomination Committee
Mr Eisen has over 15 years experience in commerce and financial advice. He is currently Chief Investment Officer at Guinness Peat Group and was previously an investment banker in Australia and the United States.
Directorships of other listed companies held in last 3 years before end of the Financial Year:
› Director of ClearView Wealth Limited: 12 November 2007 to Current.
› Director of eServGlobal Limited: 20 March 2009 to 24 October 2011.
› Alternate Director of Tower Limited: 12 December 2006 to 11 November 2011.
Graeme Pettigrew FipA, FAiM, FAiCdNon-executive director (independent)
Appointed 18 June 2010
Member of the Audit Committee and the Remuneration & Nomination Committee.
Mr Pettigrew has held chief executive roles at CSR Building Products Pty Ltd and Chubb Australia Ltd and he is currently a non-executive director of Adelaide Brighton Ltd, Bisalloy Steel Group Ltd and Knauf Plasterboard Pty Ltd. He has relevant experience in the construction and building materials industry, as well as manufacturing and distribution businesses.
Directorships of other listed companies held in last 3 years before end of the Financial Year:
› Non-executive director of Adelaide Brighton Ltd: 27 August 2004 to Current.
› Non-executive director of Bisalloy Steel Group Ltd: 24 April 2006 to Current.
BOARD OF DIREC TORs
For
per
sona
l use
onl
y

C apr al annual report 201108
The Board is responsible for the overall corporate governance of Capral Limited (ABN 78 004 213 692) and its subsidiaries (referred to in this statement as Capral), including setting Capral’s strategic direction, policies and practices, establishing goals for management and monitoring the achievement of those goals.
Capral is committed to implementing the highest possible standards of corporate governance and ensures wherever possible, that its practices are consistent with the Second Edition of the Australian Securities Exchange (ASX) Corporate Governance Council’s Principles and Recommendations.
1. Lay Solid Foundations for management and Oversight
1.1 Board and Management roles
(a) The Board’s key responsibility is the creation, enhancement and protection of long-term shareholder value within an appropriate risk framework. The Board has adopted a formal charter that sets out responsibilities of the Board and Management (and in particular, the Managing Director) and is available on Capral’s website, www.capral.com.au (under Corporate Governance). The Charter is reviewed and amended from time to time as appropriate.
(b) Management’s role is to manage Capral in accordance with the direction and delegations of the Board and it is the Board’s responsibility to oversee the activities of management in carrying out these delegated duties.
(c) Each member of the Board is committed to spending sufficient time to enable them to carry out their duties as a director of Capral and accordingly; any candidate is required to confirm that they have sufficient time to devote to their Board position prior to appointment.
(d) Non-executive directors receive formal letters of appointment setting out the key terms, conditions and expectations of their appointment.
1.2 evaluation of senior executives
(a) The Executive Management Team and other senior managers are provided with a formal job description and executive contract or letter of appointment describing their term, duties, rights, responsibilities and entitlements on termination. Senior managers are subject to a formal performance planning and review process on at least an annual basis, with performance being measured against qualitative and quantitative key performance indicators linked to applicable short term and long term incentive components of each senior manager’s remuneration package.
(b) The Executive Management Team undergoes an induction to gain an understanding of Capral’s financial position, its strategies, operations and risk management framework and of the respective roles of the Board and management.
2. Structure the board to add value2.1 the Directors
(a) The Board consists of 6 directors: the non-executive Chairman; the Managing Director; and 4 other non-executive directors.
(b) Details of the directors, their term of office and their qualifications, skills and experiences are detailed in the Directors’ Report.
2.2 independence of Directors
(a) The Board considers independent decision-making as critical to effective governance. Independent directors are those who have the ability to exercise their duties unfettered by any business or other relationship. The independence of non-executive directors is assessed by the Board against the definition outlined in the Board Charter.
(b) The approach and attitude of each non-executive director is critical in determining independence and must be considered in relation to each director while taking into account all relevant factors, that may include whether or not the non-executive director:
Corporate governance statement
For
per
sona
l use
onl
y

09
(1) is a substantial shareholder of Capral or an officer of, or otherwise associated directly with a substantial shareholder of, Capral;
(2) is, or has previously been, within the last 3 years, employed in an executive capacity by Capral or another group member, or been a director after ceasing to hold any such employment;
(3) is, and has been, within the last 3 years, a principal or employee of a material professional adviser or a material consultant to Capral or another group member. In this context and as a guide, the relationship with the professional adviser or consultant may be deemed to be material if payments from Capral exceed 5% of Capral’s annual expenditure to all professionals and consultants or exceed 5% of the recipient’s annual revenue for advisory or consultancy services;
(4) is a material supplier or customer of Capral or other group member, or an officer of or otherwise associated, directly or indirectly, with a material supplier or customer. In this context and as a guide, the relationship with the supplier or customer may be deemed to be material if annual payments to or from that supplier or customer exceed 5% of the annual consolidated gross revenue of Capral or of that supplier or customer;
(5) has a material contractual relationship with Capral or another group member other than as a director of Capral.
(c) The directors considered by the Board to be independent directors are Mr Pettigrew, Mr Blair and Mr Wood-Ward. It is the intention of Capral, in time having regard to its size, to appoint additional non-executive director(s) in order to comply with the recommendation that a majority of the Board should be independent; all current directors bring independent judgement to bear in Board deliberations and meetings of the independent directors are held as required.
2.3 Chair of the Board
The Chairman, Mr Wood-Ward, is an independent non-executive director and there is a clear division of responsibility between the Chairman and the Managing Director.
2.4 Appointment of Directors
(a) The composition of the Board is balanced, with directors possessing a broad range of skills, experience, expertise, diversity, qualifications and contacts relevant to Capral’s business. The Board (through the Remuneration & Nomination Committee) will review the range of expertise of its members on a regular basis and ensure that it has operational and technical expertise relevant to the operations of Capral that will best complement Board effectiveness. The Board recognises that it must be able to consider current and emerging business issues and challenge the performance of management. Further details of the procedure for the selection and appointment of new directors is set out in the Remuneration and Nomination Committee and Board Charters.
(b) With the exception of the Managing Director:
(1) directors appointed by the Board are required by Capral’s constitution to submit themselves for re-election by shareholders at the Annual General Meeting following their appointment; and
(2) no director will hold office for a continuous period in excess of 3 years or past the third Annual General Meeting following the director’s appointment, whichever is the longer, without submitting for re-election.
2.5 remuneration & Nomination Committee
(a) The Board has established a Remuneration & Nomination Committee that is primarily responsible for determining remuneration and monitoring and reviewing the performance of the Board, its committees, individual directors and senior management. The Committee is responsible for assessing the necessary desirable competencies of Board members, reviewing Board succession plans and providing recommendations for the appointment and removal of directors. Recommendations of the Committee are given to the Board for their consideration and approval.
(b) The Committee Charter is reviewed regularly and is available on Capral’s website, www.capral.com.au (under Corporate Governance).
(c) Given the number of directors, the Committee comprises all of the 5 non-executive directors (3 of whom are independent) and is chaired by Mr Wood-Ward (an independent non-executive director).
(d) Details of Committee members, their Committee meeting attendance and their qualifications are set out in the Directors’ Report.
CORPOR ATE gOvERNANCE
sTATEMENT
For
per
sona
l use
onl
y
C apr al annual report 201110
2.6 induction and Access to information
(a) Newly appointed non-executive directors will be given sufficient knowledge, via an induction program, to ensure that they have a sound working understanding of Capral and the aluminium industry. This includes meetings with key executives, tour of key operating site(s) (to the extent practicable), the provision of an induction package containing key corporate information and management presentations. In order to achieve continuing improvement in Board performance, all directors are encouraged to undergo continual professional development.
(b) The directors have access to all relevant information. Directors may meet with, or independent of, management at any time to discuss any areas of interest or concern. Each director is entitled to seek independent professional advice to assist them to carry out their responsibilities, at Capral’s expense, after approval of the Chairman is obtained. Where appropriate, a copy of this advice is to be made available to all other members of the Board.
(c) The Board participates in an annual self-assessment, with the outcomes substantially addressed (as appropriate).
3. Promote Ethical and Responsible decision-making
3.1 Code of Conduct
(a) The Board acknowledges the need for, and continued maintenance of, the highest standard of ethics, and seeks to ensure that all directors, senior management and employees of Capral act honestly, transparently, diligently and with integrity.
(b) Capral has implemented a Code of Conduct for all employees (including directors) which is intended to promote ethical and responsible decision-making in all stakeholder relationships in order to maintain confidence in Capral’s integrity and the responsibility and accountability of individuals for reporting and investigating reports of unethical practices. The Board, senior management and all other employees of Capral are committed to implementing this Code of Conduct and each individual is accountable for such compliance.
(c) Capral has established a Complaints (Whistleblower) Policy which outlines the process for any employee or contractor of Capral who wishes to report certain conduct. This complaints process can be anonymous and provides protection against action that may be taken in reprisal for disclosing such conduct.
(d) A copy of the Code of Conduct is given to employees, contractors and relevant personnel. The Complaints (Whistleblower) Policy and a summary of the Code of Conduct are available on Capral’s website, www.capral.com.au (under Corporate Governance).
3.2 Diversity
(a) Although Capral has yet to adopt a formal Diversity Policy (and therefore not complied with Recommendation 3.2 or 3.3), Capral respects the benefits arising from workplace diversity to broaden perspective, improve performance and increase shareholder value. Capral aims to promote an environment conducive to the appointment of well qualified employees, senior managers and directors so that there is appropriate diversity to maximise the achievement of the corporate goals.
(b) Capral has recruited women in non-traditional roles in its manufacturing operations and ensures that its employees have access to flexible work arrangements where appropriate.
(c) Capral submitted a workplace program report for the period 1 April 2010 to 31 March 2011, and achieved compliance with the Equal Opportunity for Women in the Workplace Act 1999. The report is available through the EOWA website.
(d) As at 31 December 2011, 25% of Capral’s workforce were women and 14% of senior management positions were held by women. Capral does not have any women on its Board.
(e) Capral has not fully complied with the Recommendations regarding diversity but the steps taken by it are appropriate given the size of the company and the nature of its operations.
4. Safeguard integrity in Financial Reporting4.1 establishment of Audit Committee
(a) The Board has established an Audit Committee that is primarily responsible for determining, monitoring and reviewing the reliability and integrity of Capral’s financial information for inclusion in its financial statements; the effectiveness of internal financial controls; the independence, objectivity and competency of the external auditors; and the policies on risk oversight and management.
(b) The Audit Committee meets at least 3 times per year.
For
per
sona
l use
onl
y

11
4.2 Structure
(a) Given the number of directors, the Committee comprises all of the 5 non-executive directors (3 of whom are independent) and is chaired by Mr Blair (an independent non-executive director).
(b) Details of Committee members, their Committee meeting attendance and their qualifications and financial expertise are set out in the Directors’ Report. It includes members who are all financially literate, members with relevant financial experience and members with relevant industry experience.
(c) The Committee’s Charter is available on Capral’s website, www.capral.com.au (under Corporate Governance).
(d) The external auditor and management attend meetings of the Audit Committee by invitation.
4.3 external auditor
The Audit Committee is responsible for reviewing the nomination, performance and independence of the external auditors. Candidates for the external auditor position must be able to demonstrate complete independence from Capral and an ability to maintain independence through their engagement in that role. The successful candidate must have arrangements in place for the rotation of the audit engagement partner on a regular basis.
At the time of the half-year and full-year audits of Capral’s financial statements, the external auditor formally presents to the Audit Committee a declaration confirming their independence.
5. make timely and balanced disclosure5.1 Capral has an established process to ensure that
it complies with the ASX Listing Rules’ disclosure requirements applicable to Capral and this process is reflected in Capral’s Continuous Disclosure Policy, a copy of which is available on Capral’s website, www.capral.com.au (under Corporate Governance). This process includes a periodic confirmation by senior management that the area(s) for which they are responsible has complied with the Policy.
5.2 To enhance clarity and balance of reporting and to enable investors to make an informed assessment of Capral’s performance, financial results are accompanied by commentary.
6. Respect the Rights of Shareholders6.1 Capral has a Shareholder Communications Policy that
promotes effective communication with shareholders, including beneficial holders, a copy of which is available on Capral’s website, www.capral.com.au (under Corporate Governance).
6.2 Shareholders can access Capral’s share price and all recent ASX announcements (including any media releases and any materials presented at significant investor briefings), via Capral’s website, www.capral.com.au (under Invest/Shareholder Information/Share Price).
6.3 The Annual Report, half-year report and the Annual General Meeting are all important communication forums. Capral invites questions from shareholders and these will be answered within the confines of information that is already in the public domain and is not market sensitive. The external auditor attends the Annual General Meeting and can respond to relevant shareholder questions.
6.4 Capral makes available a telephone number and email address for shareholders to make enquiries, as published on Capral’s website, www.capral.com.au (under Invest/Shareholder Information/Share Registry).
6.5 Capral keeps a summary record for internal use of the issues discussed at investor/ analyst briefings.
7. Recognise and manage Risk7.1 risk Management policies
(a) The Board recognises that there are strategic, operational and financial risks in Capral’s business and has established a sound system of risk oversight and management and internal control to identify, assess, monitor and manage risk.
(b) Capral has a Board approved Risk Management Policy, published on its website, www.capral.com.au (under Corporate Governance), that assists Capral in identifying and managing risk in accordance with best practice.
7.2 risk reporting
(a) Management is responsible for designing and implementing the risk management framework. Management identifies and reviews the key risks impacting each area of the business and develops strategies to effectively mitigate these risks. Management reports to the Board on the effectiveness of Capral’s management of its material business risks.
CORPOR ATE gOvERNANCE
sTATEMENT
For
per
sona
l use
onl
y

C apr al annual report 201112
(b) The Audit Committee is responsible for risk oversight, risk management and internal control. There is currently no designated Internal Audit resource but the function, which is undertaken by management, assists with regard to business risk management, and provides regular reports to the Audit Committee.
7.3 Managing Director and Chief Financial Officer Declaration
When the Board approves the half and full-year results, the Managing Director and Chief Financial Officer have represented to the Audit Committee and the Board that, to the best of their knowledge:
(a) the statement given in accordance with section 295A of the Corporations Act is founded on a sound system of risk management and internal control; and
(b) Capral’s risk management and internal control system is operating effectively in all material respects in relation to financial reporting risks.
8. Remunerate Fairly and Responsibly8.1 The Board has established a Remuneration & Nomination
Committee to establish and review remuneration levels for the Managing Director and executive team members and incentive policies for all employees. As described above, the Remuneration & Nomination Committee operates in accordance with its Charter and reviews executive remuneration and performance related matters, with reference to Capral’s performance, executive performance, comparable available benchmarking information and independent advice, as appropriate.
8.2 The remuneration policies and practices of Capral are designed to remunerate fairly and responsibly, to attract qualified and experienced candidates and to retain and motivate senior management and employees.
8.3 The payment of bonuses and other incentive payments are reviewed at least annually by the Committee and recommendations are put to the Board for its approval. All bonuses and incentives are linked to performance criteria. The Board can exercise its discretion in relation to approving bonuses and incentives but, any changes are justified by reference to measurable performance criteria.
8.4 Remuneration for senior management is divided into three parts:
(a) a fixed remuneration which is made up of base salary, superannuation and salary sacrifices;
(b) short term incentives paid in cash, directly earned upon the successful achievement of specific financial and operational targets. Incentives are based on performance criteria which are set and reviewed by the Committee at least annually; and
(c) long term incentives for specific senior managers, that vest upon the successful achievement of performance hurdles or vesting conditions (as applicable) which are determined by the Committee.
8.5 Details of the Managing Director’s employment contract are set out in the Remuneration Report.
8.6 Non-executive directors are entitled to receive fees (from a pool of funds, the limit of which is approved by shareholders in general meeting). There are no schemes for retirement benefits, other than statutory superannuation, for non-executive directors.
8.7 Further details about Capral’s remuneration policies are set out in the Remuneration Report.
the Corporate governance Statement and related governance materials are available on Capral’s website, www.capral.com.au (under Corporate governance).
For
per
sona
l use
onl
y

13
Corporate social Responsibility statementCapral has implemented policies and management systems to deliver in the areas of safety and the environment. Capral contributes to local communities where it operates.
SafetySafety is one of Capral’s key Resolutions. Capral understands the necessity of providing a safe workplace and is committed to ensuring people return home safely through safe working conditions and behaviours through ‘Safety First’ and related programs.
There were notable safety achievements during 2011:
› Campbellfield and Canning Vale Manufacturing sites reached 2.5 years LTI free. A number of Distribution sites remained LTI/MTI free for 2011: Wangara RDC and Aluminium Centres at Hobart, Malaga, Slacks Creek, Townsville and Wetherill Park.
› Bremer and Campbellfield Manufacturing both secured AS4801-2001 (OHS management system) Certification, with our other sites achieving a Letter of Assurance score of over 70%.
› A number of training programs were rolled out, including Safety Observations, Hazard Identification and Incident Investigation. The Distribution Division completed Safety Leadership Training to its senior managers.
› Perception surveys have been completed, with improvement plans in place.
Capral has intensified its focus on safety lead indicators, such as behavioural observations and risk management. In 2011, there were 30 reportable injuries, compared to 43 in 2010. This is a significant improvement (30%) on 2010 and also against the previous 3 years, as shown below:
MeASure/ YeAr 2008 2009 2010 2011
LTI 15 7 16 11
MTI 26 24 27 19
LTI/MTI 41 31 43 30
LTI/MTI Frequency* 17.5 16.3 23.1 19.5
LTI Severity* 162.1 92.9 276.7 194.9
Frequency = no. of injuries per million work hours Severity = no. of days lost per million hours worked
In 2012, Capral will continue to promote lead indicators throughout the business, with more involvement from all employees in undertaking behavioural observations and driving the reduction of hazards in the work place.
EnvironmentCapral is committed to minimising the environmental impacts of its extrusion and distribution activities; this involves examining our operations to identify environmental friendly opportunities; minimising adverse consequences of new plant, equipment and processes by assessing implications in the design, purchase and commissioning phases, ensuring prevention measures are taken prior to operation; managing waste materials using the hierarchy of reduce/reuse/recycle, ensuring that any disposal will be to appropriate environmental standards. Capral also continues to investigate the potential use of recycled materials into a range of products.
Both our Bremer Park and Campbellfield facilities have obtained certification to ISO14001 - Environmental Management Systems. This International Standard requires a management system that recognizes and manages the primary environmental issues through awareness and assessment of applicable legal requirements, objectives for improvement, assignment of responsibilities, competent personnel, communications, procedures, controls and monitoring, emergency response capability, self correction and assessment, and internal reviews. The Penrith, Angaston and Canning Vale manufacturing plants are in the process of obtaining ISO14001 certification. These plants have implemented the necessary practices and procedures and are meeting the required regulatory requirements in anticipation of ISO14001 certification.
Examples of Capral’s activities undertaken at some of its sites are detailed below:
› initiatives to identify and target opportunities for waste reduction (such as various collaborations to recycle waste into industrial oil soak products);
› working with customers to optimise the recycling of packaging materials;
› working with suppliers to develop new packaging techniques aimed at minimising materials and reducing product damage and waste;
CORPOR ATE sOCIAL REsPONsIBIL IT y
sTATEMENT
For
per
sona
l use
onl
y

C apr al annual report 201114
› customer return of timber bases for recycling or reusing;
› utilization of Hydrochloric Acid 33% to substitute Sulphuric Acid to reduce excess of sulphate discharges to Trade Waste system;
› introduction of a number of water efficiency initiatives, including continual monitoring of piping and valves;
› implementation of a closed lock system for de-ironised rinse tanks;
› implementation of cascade system in Anodising process rinse tanks.
Capral has a relatively modest carbon footprint and is not included in the top 500 site emitters. Our main emissions come from 2 sources; use of gas for heating ovens (10 KTPA) and electricity (40 KTPA).
Capral is committed to meeting its obligations under the National Greenhouse Energy Reporting Act.
CommunityCapral contributes in a variety of ways to the communities where its facilities are located including the provision of a range of skilled and unskilled employment opportunities, the positive economic impact on other local businesses and involvement in community based groups including education institutions.
Capral has embraced the Lean Manufacturing Program, with 240 employees being awarded a Certificate in Competitive Manufacturing and a further 170 planned or underway. There were 286 employees undergoing traineeships in 2011, with 189 registered for Certificate 3 and 97 for Certificate 4. These programs will result in development and formal recognition of skills.
Capral offers a number of apprenticeships in areas such as Engineering (Mechanical and Electrical) and Boilermaking. Capral also operates a Study Assistance program which provides financial support for employees choosing to undertake professional qualifications. Capral is actively seeking a Die Correction trade qualification to be made available in Australia to facilitate the development of this specialist skill locally.
At Bremer Park (QLD), where Capral operates its largest operation:
› Capral is a corporate sponsor of the Ipswich Festival;
› for a number of years, a Red Cross Donor Mobile has attended the site every 6 months. Every blood donation has the potential to save up to 3 lives;
› the site knocked on the door of a number of local Ipswich businesses, offering to provide equipment, labour and office space to those badly affected by the Queensland floods in 2011.
A number of Capral sites raise money for Cancer through Australia’s Biggest Morning Tea and Daffodil Day. In 2011, Capral’s Canning Vale (WA) site assisted the Western Australian Surf Life Savers and the Fire Brigade with fundraising activities.
Capral’s Angaston (SA) site contributes towards the local community sporting complex located in Tanunda. The complex is utilised by school children and the general public and is the hub of sporting activities for the region.
For
per
sona
l use
onl
y

15
Your directors present their report on the consolidated entity consisting of Capral Limited (Capral) and the entities it controlled at the end of, or during, the financial year ended 31 December 2011 (Financial Year).
directorsThe following persons were directors of Capral during the Financial Year and, except as indicated below, up to the date of this report:
NAMe periOD OFFiCe helD
R.L. Wood-Ward 6 November 2008 – Date of this report
P.J. Jobe 24 April 2009 – Date of this report
I.B. Blair 23 May 2006 – Date of this report
A.M. Eisen 19 October 2006 (as alternate) and 29 August 2008 (as director) – Date of this report
M. Jefferies 6 November 2008 – Date of this report
G.F. Pettigrew 18 June 2010 – Date of this report
Details of directors, their qualifications, experience, special responsibilities (including committee memberships) and directorships of other listed companies held in the last three years before end of the Financial Year are set out on page 6 and 7.
Principal activitiesDuring the Financial Year, the principal continuing activities of the consolidated entity consisted of the manufacturing, marketing and distribution of semi-fabricated aluminium products.
dividendsNo dividends or distributions have been declared or paid for the Financial Year.
Review of operationsA review of operations of the consolidated entity are referred to in the Managing Director’s Report and the Financial Report.
Significant changes in the state of affairsThere were no significant changes in the state of affairs of the consolidated entity.
matters subsequent to the end of the Financial yearNo matter or circumstance has arisen since the end of the Financial Year that has significantly affected, or may significantly affect the consolidated entity’s operations, the results of those operations or the consolidated entity’s state of affairs in future financial years.
Likely developments and expected results of operationsInformation on likely developments is detailed in the Managing Director’s Report on pages 4 and 5. This report omits information about likely developments and expected future results that would unreasonably prejudice Capral.
Directors’ Report
DIREC TORs’ REPORT
For
per
sona
l use
onl
y

C apr al annual report 201116
Other information for members to make an informed assessmentOther information that members reasonably require to make an informed assessment of the operations, financial position, business strategies and prospects for future financial years of the consolidated entity are referred to in the Managing Director’s Report and the Financial Report.
directors’ meetingsThe numbers of directors’ meetings (including meetings of committees) held, and the number of meetings attended, by each director during the Financial Year, are as follows:
BOArD AuDit
COMMitteereMuNerAtiON &
NOMiNAtiON COMMittee
DireCtOr helD AtteNDeD helD AtteNDeD helD AtteNDeD
R.L. Wood-Ward 6 6 3 3 2 2
P.J. Jobe 6 6 3 3 1 2 2 1
I.B. Blair 6 6 3 3 2 2
A.M. Eisen 6 3 3 1 2 2
M. Jefferies 6 5 3 3 2 2
G.F. Pettigrew 6 6 3 3 2 2
1 Attended meetings in an ex-officio capacity
directors’ interests and benefitsOrdinary Shares
Details of holdings of ordinary shares in Capral for the directors (including former directors who held office during the Financial Year) at the beginning and end of the Financial Year and at the date of this report are as follows:
NAMe pOSitiON
OrDiNArY ShAreS FullY pAiD iN the COMpANY
BAlANCe At 1.1.2011
BAlANCe At 31.12.2011
BAlANCe At DAte OF thiS repOrt
R.L .Wood-WardDirector and Chairman of the Board – – –
P.J. Jobe Managing Director 185,500 185,500 185,500
I.B. Blair Director 227,348 227,348 227,348
A.M. Eisen Director – – –
M. Jefferies Director – – –
G.F. Pettigrew Director – – –
In addition to the interests shown above, indirect interests in Capral shares held by the Managing Director, Mr. Jobe, are as follows:
NAture OF Other iNtereStS BAlANCe At
1.1.2011 BAlANCe At
31.12.2011BAlANCe At DAte
OF thiS repOrt
Options at $0.50 4,300,000 4,300,000 4,300,000
Options at $0.25 10,000,000 10,000,000 10,000,000
Options at $0.40 5,000,000 5,000,000 5,000,000
Options at $0.60 5,000,000 5,000,000 5,000,000
For
per
sona
l use
onl
y

17
Unissued shares or interests under optionAt the date of this report, there are 29,930,406 (2010: 28,203,996) unissued shares or interests under option. Refer to sections 1 and 2 of the Remuneration Report.
No shares have been issued during or since the end of the Financial Year as a result of an exercise of an option.
Company SecretaryMr R Rolfe – General Counsel & Company Secretary, LLB (Hon) (University of Leicester, UK)
Mr Rolfe was appointed as General Counsel of Capral on 12 June 2006 and to the position of Company Secretary on 23 June 2006.
Mr Rolfe was admitted as a Solicitor of the Supreme Court of England and Wales in 1998 and New South Wales in 2002. Prior to joining Capral, Mr Rolfe was a senior corporate lawyer at Qantas Airways Limited from July 2002 to June 2006.
REmUnERAtiOn REPORt (AUditEd)This report sets out the philosophy and process of Capral for the remuneration of its directors, Executive Management Team, senior management and other employees. It also details the actual remuneration of its key management personnel (including the directors) during the Financial Year.
Section 1: the Remuneration Philosophy and ProcessThe remuneration policies and practices of Capral are designed to attract qualified and experienced candidates, and retain and motivate employees.
(a) remuneration & Nomination Committee
The Remuneration & Nomination Committee is responsible for reviewing and making recommendations to the Board of Directors (the Board) on remuneration policies for Capral including, in particular, those governing the directors (including the Managing Director) and executive managers.
Remuneration (including the bonuses and other incentive payments) of the Managing Director and certain executive managers is reviewed annually by the Remuneration & Nomination Committee and recommendations are put to the Board for its approval. All bonuses and incentives are linked to performance criteria. The Board can exercise its discretion in relation to approving bonuses and incentives. Changes must be justified by reference to measurable performance criteria.
The Remuneration & Nomination Committee may seek independent advice as appropriate in setting the structure and levels of remuneration based on the principle that the elements of remuneration should be set at an appropriate level having regard to market practice for roles of similar scope and
skill. No remuneration recommendations have been made by remuneration consultants in relation to the Financial Year.
(b) performance planning and review
Capral has a process to evaluate and discuss performance and development plans at least annually with salaried employees. This two way process between the employee and their immediate supervisor is referred to as Performance Planning and Review (ppr).
The PPR is a 4-Step process covering:
Step 1: An agreement of objectives for the year ahead and the setting of key performance measures against which the achievement of those objectives will be assessed.
Step 2: A review of performance against the previously agreed objectives for the period under review.
Step 3: Employee comment and feedback.
Step 4: Short and long term training and development needs and career aspirations.
Within Capral, managers have a responsibility to provide prompt and constructive feedback to staff on performance, behaviour and attitudes. The PPR process ensures that there is better understanding of Capral’s objectives thereby increasing the likelihood of their achievement. It also enables managers to evaluate and develop employee skills and performance and identify future development needs. Employees benefit through recognition, performance feedback and career guidance.
(c) Non-executive Directors
The structure of Capral’s non-executive director remuneration is distinct from that applicable to the Managing Director and other senior executives.
The Board, in conjunction with the Remuneration & Nomination Committee, seeks to establish remuneration of non-executive directors at a level that enables Capral to attract and retain high quality directors at a reasonable cost. Remuneration of non-executive directors and their terms of office are governed by Capral’s constitution and not by contract.
Non-executive directors remuneration is allocated out of the pool of funds the limit of which is approved by shareholders in general meeting and each director is entitled to the payment of an annual fee in cash and superannuation contributions for their services. Additional fees are not paid for sitting on Board committees, however the extra responsibility of the Chairman of the Board and committees is recognised by the payment of a higher fee. Non-executive directors do not receive any shares, options or other securities as part of their remuneration nor are they eligible to participate in any of Capral’s equity incentive plans. There are no schemes for retirement benefits (other than statutory superannuation payments).
Details of payments to non-executive directors are set out on pages 20 and 21.
DIREC TORs’ REPORT
For
per
sona
l use
onl
y

C apr al annual report 201118
(d) Senior Management remuneration
The remuneration policy for the Managing Director, Executive Management Team and senior management seeks to attract and retain people with the required capabilities to lead Capral in the achievement of planned business objectives and focus on delivering annual safety and financial targets.
Remuneration is reviewed annually in February and approved changes applied from 1 March.
The Remuneration & Nomination Committee reviews the remuneration arrangements of the Managing Director and certain executive managers, where as for other members of senior management the relevant Executive General Manager makes recommendations to the Managing Director.
For the Managing Director, Executive Management Team and other senior management, remuneration consists of a fixed annual salary and superannuation plus an at-risk component that comprises short term incentive plan (Stip) and long term incentive plan (ltip) (see below).
The proportions of fixed and at-risk remuneration are established for the Managing Director, Executive Management Team and other senior management relative to their position in Capral. The policy used as a guide for at-risk remuneration is 25% for the Executive Management Team and 10%-20% for other senior managers for the achievement of objective targets.
(e) Base Salary plus Superannuation = total employment Cost
The level of the total employment cost (being base salary plus superannuation) (teC) is determined having regard to job responsibilities, skills, experience and performance. Salaries are reviewed annually.
(f) Short term incentive plan
The short term incentive plan (Stip) was introduced in 2006 and most recently revised during 2010. It is designed to encourage participants to assist Capral in achieving continuous improvement by aligning their interests with those of Capral and its stakeholders and rewarding them when key performance measures are achieved.
For the Financial Year, there were 3 separate short term incentive programs: (1) senior employees have the opportunity to earn a cash incentive, based on a specified percentage of TEC dependent on each individual’s level of responsibility. The actual incentive earned is based on the achievement of company and business unit targets. There are ‘minimum’, ‘target’ and ‘stretch’ goals; (2) other salaried employees can earn payments for achieving targets set by their managers; and (3) sales or sales-related employees participate in quarterly sales incentive programs in relation to revenue, gross margin and debtor days targets.
For the Managing Director, Chief Financial Officer, and employees functional at corporate level, STIP targets relate to company earnings before interest, tax and amortisation (eBitDA), company working capital and specific objectives (including safety) whereas for EGM Manufacturing, EGM Distribution and their functional employees, STIP targets also relate to business unit EBITDA and working capital. An amount higher than the specified percentage of TEC is paid if ‘stretch’ targets are achieved.
In addition to the above, the Managing Director’s STIP targets relate to performance criteria determined annually by the Board.
The company-wide performance measures used for STIP are established each year by the Remuneration & Nomination Committee. The Managing Director is responsible for recommending to the Committee the STIP targets and the amount of STIP, if any, to be paid.
(g) Managing Director – Options
The Managing Director does not participate in the LTIP (see below).
No options have been granted to the Managing Director during the Financial Year (2010: Nil). During the Financial Year 5,000,000 (Tranche 2) options vested.
The total number of options granted to Mr Jobe and outstanding as at the end of the Financial Year is 24,300,000. The fair value of the options is detailed in Note 37 of the Financial Report.
(h) long term incentive plan
The long term incentive plan (ltip) was introduced in 2006 and is restricted to the Executive Management Team and selected members of senior management. LTIP is designed to strengthen the alignment of the interests of senior managers with shareholders and support a culture of share ownership and shareholder wealth. It also aims to provide competitive remuneration for the retention of specifically targeted members of senior management.
The Managing Director makes recommendations to the Remuneration & Nomination Committee regarding the proposed participants and the amount of the entitlements.
Performance Rights granted 2007–2010
Rights to ordinary shares issued under LTIP between 2007 and 2010 are subject to Capral’s performance, measured against the S&P/ASX 200 Industrials Index but excluding those companies who are classified in the Global Industry Classification Standard sector numbers 4010 “Banks” and 4030 “Insurance” (Total Shareholder Return (tSr) test). The TSR is tested over an initial 2 year performance period, and re-tested each year over the subsequent 3 years. After the third re-test, unvested rights will lapse.
For
per
sona
l use
onl
y

19
Performance Rights granted 2011
Rights to ordinary shares issued under LTIP during the Financial Year are subject to performance conditions:
› 60% of rights are subject to a Basic Earnings Per Share performance condition; and
› 40% of rights are subject to a TSR performance condition.
The rights subject to the EPS condition were granted in 3 tranches of 20%, and will be tested on 31 December 2011, 2012 and 2013 respectively. The EPS condition will be calculated each year as follows:
A Net Profit Before Tax Target as specified by the Board for that year (adjusted for any extraordinary items) divided by number of securities on issue.
If the condition is met in a given year, the rights will convert to shares at the end of the 3 year vesting period and will be issued to participants provided that they continue to be employed by Capral. If the condition is not met in a given year, those rights will lapse.
The rights subject to the TSR condition are subject to Capral’s performance, measured against the entities with ordinary shares and units (as the case may be) included in the S&P/ASX All Ordinaries Index as at 1 January 2011 but excluding those companies who are classified in the Global Industry Classification Standard sector number 40. The TSR is tested over a 3 year performance period and the testing date is as 31 December 2013.
All rights
Vested rights convert on a one-for-one basis to ordinary shares. Shares allocated remain held (subject to a holding lock) under LTIP up to 10 years from the date rights were originally granted. The use of EPS and TSR tests is consistent with market practice as it ensures alignment between comparative shareholder return and remuneration of executives.
Vesting at each testing date in relation to the measurement of the relevant grant is determined in accordance with Table A below:
tABle A
perCeNtile OF tSr % rightS VeStiNg
Less than 50th None
50th 50
More than 50th less than 75th
Between 50 and 100 (pro rata)
More than 75th 100
As at 31 December 2011, none of the remaining rights granted as part of the 2007 offer (29,500 rights), 2008 offer (76,000 rights) or 2009 offer (365,000 rights) vested as at 31 December 2008 (in relation to the 2007 offer only) or 31 December 2009 (in relation to the 2007 and 2008 offers) or 31 December 2010 (in relation to the 2007, 2008 and 2009 offers) or 31 December 2011 (in relation to 2007, 2008, 2009 offers) testing dates. The rights granted as part of the 2007 offer (29,500 rights) lapsed on 1 January 2012. 20% EPS tranche of 2011 offer (681,420 rights) lapsed on 31 December 2011.
During the Financial Year, 3,407,101 rights were granted under LTIP (2010: Nil).
Under LTIP, 3,196,181 rights remain outstanding at the end of the Financial Year.
Capral intends to grant further rights under the LTIP to selected individuals during the financial year ending 31 December 2012.
Options (Executives and senior Managers)
No options to acquire ordinary shares were granted under LTIP during the Financial Year (2010: 459,000). During the Financial Year 1,231,863 options vested but at the date of this report remain subject to a disposal restriction.
2,463,725 options issued under LTIP remain outstanding at the end of the Financial Year.
Refer to section 2 of this report for further details.
(i) Anti-hedging policy
Capral personnel are not permitted to enter into transactions with securities (or any derivative thereof) which limit the economic risk of any unvested entitlements awarded under any Capral equity-based remuneration scheme currently in operation or which will be offered by Capral in the future. As part of Capral’s due diligence undertaken at the time of the financial results, participants in any Capral equity plan are required to confirm that they have not entered into any such prohibited transactions.
DIREC TORs’ REPORT
For
per
sona
l use
onl
y

C apr al annual report 201120
Section 2: Remuneration of directors and other key management personnelThe following table sets out the remuneration of the key management personnel (including the directors) during the Financial Year.
The key management personnel of the consolidated entity are the non-executive directors, Managing Director, Company Secretary and those executives that are part of the Executive Management Team (and report directly to the Managing Director). These people have the authority and responsibility for planning, directing and controlling the day-to-day activities of Capral.
The non-executive directors, other key management personnel and five company executives who received the highest remuneration for the Financial Year and for 2010 financial year are detailed below.
ShOrt-terM eMplOYee BeNeFitS
pOSt-eMplOYMeNt BeNeFitS
Other lONg-terM BeNeFitS
terMiNAtiON BeNeFitS
ShAre-BASeD pAYMeNtS tOtAl
tOtAl perFOrMANCe relAteD
SAlArY AND FeeS BONuS
NON-MONetArY BeNeFitS
Super-ANNuAtiON
perFOrMANCerightS10 OptiONS10
NAMe YeAr title $ $ $ $ $ $ $ $ $ %
Directors
P.J. Jobe+ 2011 Managing Director 1,150,000 793,440 – 50,000 – – – 934,793 2,928,233 59
2010 Managing Director 1,140,396 1,364,449 – 18,064 – – – 3,321,949 5,844,858 80
R. Wood-Ward1 2011 Chairman 120,000 – – 10,800 – – – – 130,800 –
2010 Chairman 107,211 – – 9,649 – – – 116,860 –
I.B. Blair 2011 Non-executive director 70,000 – – 6,300 – – – – 76,300 –
2010 Non-executive director 70,269 – – 6,324 – – – – 76,593 –
A.M. Eisen 2011 Non-executive director 55,000 – – – – – – – 55,000 –
2010 Non-executive director 55,000 – – – – – – – 55,000 –
M. Jefferies 2011 Non-executive director 55,000 – – – – – – – 55,000 –
2010 Non-executive director 55,000 – – – – – – – 55,000 –
G. Pettigrew2 2011 Non-executive director 55,000 – – 4,949 – – – – 59,949 –
2010 Non-executive director 27,711 – – 2,494 – – – – 30,205 –
P.J. Arnall3 2010 Chairman 28,615 – – 2,575 – – – – 31,190 –
executives
T. Campbell4*+ 2011 Chief Financial Officer 176,538 21,718 – 16,493 – – 20,262 – 235,011 18
M. Haszard*+ 2011 egM Manufacturing 389,908 81,810 – 35,092 – – 51,932 40,637 599,379 29
2010 EGM Manufacturing 357,213 111,915 – 20,023 – – 44,287 50,901 584,339 35
D. Munro5*+ 2011 egM Distribution 152,435 21,720 – 15,886 – – – – 190,041 11
A. Simmonds6*+ 2011 egM Distribution 160,707 – – 7,900 – 50,047 (124,211) (49,536) 44,907 –
2010 EGM Distribution 300,390 50,254 – 14,517 – – 40,207 43,442 448,810 30
M. Lamb7*+ 2011 CFO 143,750 – – 11,538 – 105,807 – (23,023) 238,072 –
2010 CFO 274,100 61,979 – 28,722 – – – 23,023 387,824 22
R. Rolfe12*+ 2011 gen. Counsel/Co. Sec. 238,472 44,674 – 23,429 – – 12,017 10,516 329,108 20
2010 Gen. Counsel/Co. Sec. 232,967 41,611 – 23,284 – – 18,051 12,375 328,288 22
E. Pollard8* 2010 EGM Human Resources 161,963 45,799 – 17,277 – – (109,871) (4,365) 110,803 –
I. Timmis9* 2010 CFO 59,050 – – 10,812 – 2,867 – (7,068) 65,661 –
total 2011 2,766,810 963,362 – 182,387 – 155,854 (40,000) 913,387 4,941,800
Total 2010 2,869,885 1,676,007 – 153,741 – 2,867 (7,326) 3,440,257 8,135,431
Refer to section 1 of the Remuneration Report for terms and conditions of compensation for the Managing Director and other key management personnel.
1 Mr Wood-Ward appointed as Chairman of the Board and Remuneration & Nomination Committee on 17 March 2010.
2 Mr Pettigrew was appointed as a non-executive director on 18 June 2010.
3 Mr Arnall resigned on 17 March 2010.
4 Mr Campbell appointed as Chief Financial Officer on 1 June 2011.
5 Mr Munro appointed as Executive General Manager Distribution on 14 June 2011.
6 Mr Simmonds retired on 9 June 2011.
For
per
sona
l use
onl
y

21Section 2: Remuneration of directors and other key management personnelThe following table sets out the remuneration of the key management personnel (including the directors) during the Financial Year.
The key management personnel of the consolidated entity are the non-executive directors, Managing Director, Company Secretary and those executives that are part of the Executive Management Team (and report directly to the Managing Director). These people have the authority and responsibility for planning, directing and controlling the day-to-day activities of Capral.
The non-executive directors, other key management personnel and five company executives who received the highest remuneration for the Financial Year and for 2010 financial year are detailed below.
ShOrt-terM eMplOYee BeNeFitS
pOSt-eMplOYMeNt BeNeFitS
Other lONg-terM BeNeFitS
terMiNAtiON BeNeFitS
ShAre-BASeD pAYMeNtS tOtAl
tOtAl perFOrMANCe relAteD
SAlArY AND FeeS BONuS
NON-MONetArY BeNeFitS
Super-ANNuAtiON
perFOrMANCerightS10 OptiONS10
NAMe YeAr title $ $ $ $ $ $ $ $ $ %
Directors
P.J. Jobe+ 2011 Managing Director 1,150,000 793,440 – 50,000 – – – 934,793 2,928,233 59
2010 Managing Director 1,140,396 1,364,449 – 18,064 – – – 3,321,949 5,844,858 80
R. Wood-Ward1 2011 Chairman 120,000 – – 10,800 – – – – 130,800 –
2010 Chairman 107,211 – – 9,649 – – – 116,860 –
I.B. Blair 2011 Non-executive director 70,000 – – 6,300 – – – – 76,300 –
2010 Non-executive director 70,269 – – 6,324 – – – – 76,593 –
A.M. Eisen 2011 Non-executive director 55,000 – – – – – – – 55,000 –
2010 Non-executive director 55,000 – – – – – – – 55,000 –
M. Jefferies 2011 Non-executive director 55,000 – – – – – – – 55,000 –
2010 Non-executive director 55,000 – – – – – – – 55,000 –
G. Pettigrew2 2011 Non-executive director 55,000 – – 4,949 – – – – 59,949 –
2010 Non-executive director 27,711 – – 2,494 – – – – 30,205 –
P.J. Arnall3 2010 Chairman 28,615 – – 2,575 – – – – 31,190 –
executives
T. Campbell4*+ 2011 Chief Financial Officer 176,538 21,718 – 16,493 – – 20,262 – 235,011 18
M. Haszard*+ 2011 egM Manufacturing 389,908 81,810 – 35,092 – – 51,932 40,637 599,379 29
2010 EGM Manufacturing 357,213 111,915 – 20,023 – – 44,287 50,901 584,339 35
D. Munro5*+ 2011 egM Distribution 152,435 21,720 – 15,886 – – – – 190,041 11
A. Simmonds6*+ 2011 egM Distribution 160,707 – – 7,900 – 50,047 (124,211) (49,536) 44,907 –
2010 EGM Distribution 300,390 50,254 – 14,517 – – 40,207 43,442 448,810 30
M. Lamb7*+ 2011 CFO 143,750 – – 11,538 – 105,807 – (23,023) 238,072 –
2010 CFO 274,100 61,979 – 28,722 – – – 23,023 387,824 22
R. Rolfe12*+ 2011 gen. Counsel/Co. Sec. 238,472 44,674 – 23,429 – – 12,017 10,516 329,108 20
2010 Gen. Counsel/Co. Sec. 232,967 41,611 – 23,284 – – 18,051 12,375 328,288 22
E. Pollard8* 2010 EGM Human Resources 161,963 45,799 – 17,277 – – (109,871) (4,365) 110,803 –
I. Timmis9* 2010 CFO 59,050 – – 10,812 – 2,867 – (7,068) 65,661 –
total 2011 2,766,810 963,362 – 182,387 – 155,854 (40,000) 913,387 4,941,800
Total 2010 2,869,885 1,676,007 – 153,741 – 2,867 (7,326) 3,440,257 8,135,431
DIREC TORs’ REPORT
7 Mr Lamb was appointed as Chief Financial Officer on 1 March 2010 and left employment on 10 June 2011.
8 Ms Pollard resigned on 15 November 2010.
9 Mr Timmis left employment with Capral on 5 March 2010.
10 All LTIP performance rights and options listed are securities that have not yet vested except for some of the options granted in 2009 that have vested. Refer to section 1(h) of this report. In relation to options of the Managing Director, refer to section 1(g) of the Remuneration Report.
11 All bonus amounts are on an accrual basis.
12 Mr Rolfe was one of Capral’s top five remunerated executives in the 2010 financial year.
* Capral’s Key Management Personnel (other than Directors).
+ Capral’s top five remunerated executives.
For
per
sona
l use
onl
y

C apr al annual report 201122
performance rights, Options and bonuses provided as compensation
Performance rights
During the financial year ended 31 December 2011, performance rights were granted as equity compensation benefits under the LTIP, to certain key management personnel as disclosed below. The performance rights were granted at no cost to the participant. 20% EPS (Tranche 1) of 2011 offer (235,373 rights) lapsed as at the relevant 31 December 2011 testing date. For details of the vesting conditions and further details relating to the performance rights, refer to section 1 of this report.
2011VeSteD
NO trANChegrANt
NO. grANt
DAte
FAir VAlue per right At grANt DAte
($)teSt DAte
lApSeD NO.
executives
M. Haszard 624,134 22/03/2011 (124,827)
Tranche 1 – EPS 20% 124,827 $0.29 31/12/2011 (124,827)
Tranche 2 – EPS 20% 124,827 $0.28 31/12/2012
Tranche 3 – EPS 20% 124,827 $0.27 31/12/2013
Tranche – TSR 40% 249,653 $0.24 31/12/2013
T. Campbell1 400,000 14/06/2011 (80,000)
Tranche 1 – EPS 20% 80,000 $0.28 31/12/2011 (80,000)
Tranche 2 – EPS 20% 80,000 $0.27 31/12/2012
Tranche 3 – EPS 20% 80,000 $0.26 31/12/2013
Tranche – TSR 40% 160,000 $0.22 31/12/2013
R. Rolfe 152,729 22/03/2011 (30,546)
Tranche 1 – EPS 20% 30,546 $0.29 31/12/2011 (30,546)
Tranche 2 – EPS 20% 30,546 $0.28 31/12/2012
Tranche 3 – EPS 20% 30,545 $0.27 31/12/2013
Tranche – TSR 40% 61,092 $0.24 31/12/2013
total – 1,176,863 (235,373)
Notes
1 Mr Campbell commenced with Capral on 1 June 2011
No performance rights were issued under the LTIP during the financial year ended 31 December 2010.
For
per
sona
l use
onl
y

23
Options
No Options were issued under the LTIP during the Financial Year.
During the financial year ended 31 December 2010, options were granted as equity compensation benefits to the previous Chief Financial Officer under the LTIP, as part of the 2010 offer, as disclosed below.
2010VeSteD
NO. trANChegrANteD
NO.grANt
DAte
eXerCiSe priCe per
OptiON ($)
FAir VAlue per OptiON
At grANt DAte
($)eXerCiSe
DAteFOrFeiteD
NO.eXpirY
DAte
executives
M. Lamb1 – 459,000 1/03/2010 (459,000) 16/10/2014
Tranche 1 229,500 0.25 0.14 16/10/2011 (229,500)
Tranche 2 114,750 0.40 0.12 16/10/2012 (114,750)
Tranche 3 114,750 0.60 0.10 16/10/2012 (114,750)
total – 459,000 (459,000)
Notes
1 Mr Lamb commenced with Capral on 1 March 2010, and left employment with Capral in June 2011 and his options forfeited.
For further details relating to the options refer to section 1 of this report.
Bonuses
During the Financial Year, STIP bonus payments were made to the Managing Director and certain key management personnel. The percentages of bonus paid and forfeited (as a result of not meeting the performance criteria) are disclosed below:
2011% OF BONuS
pAiD% OF BONuS
FOrFeiteD
% OF COMpeNSAtiON FOr the YeAr CONSiStiNg
OF Stip BONuS
executives
P. Jobe 66.1 33.9 39.8
M. Haszard 77.0 23.0 16.1
T. Campbell1 49.6 50.4 11.0
D. Munro2 58.6 41.4 12.5
A. Simmonds3 – – –
M. Lamb4 – – –
R. Rolfe 83.4 16.6 14.6
2011 financial year bonuses are payable in 2012 financial year.
Notes
1 Mr Campbell commenced with Capral in June 2011.
2 Mr Munro commenced with Capral in June 2011.
3 Mr Simmonds retired on 9 June 2011.
4 Mr Lamb left employment with Capral in June 2011.
DIREC TORs’ REPORT
For
per
sona
l use
onl
y

C apr al annual report 201124
In the financial year ended 31 December 2010, STIP bonus payments were made to the Managing Director and certain key management personnel. The percentages of bonus paid and forfeited (as a result of not meeting the performance criteria) are disclosed below:
2010% OF BONuS
pAiD% OF BONuS
FOrFeiteD
% OF COMpeNSAtiON FOr the YeAr CONSiStiNg
OF Stip BONuS
executives
P. Jobe 100.0 – 54.1
M. Haszard 130.3 – 22.9
A. Simmonds 68.6 31.4 13.8
M. Lamb 3 – – –
E. Pollard 2 87.2 12.8 20.4
I. Timmis 1 – – –
2010 financial year bonuses were paid in 2011 financial year.
Notes
1 Mr Timmis left employment with Capral during the financial year ended 31 December 2010.
2 Ms Pollard resigned on 15 November 2010.
3 Mr Lamb commenced with Capral in March 2010.
Section 3: Relationship between remuneration and company performanceDuring the Financial Year and the previous 4 financial years (2007-2010), Capral’s performance was as follows:
YeAr eNDeD 31 DeCNet prOFit/(lOSS)
$MDiViDeND
CeNtS per ShAreBASiC eArNiNgS/(lOSS)
CeNtS per ShAre
ShAre priCe (ClOSiNg)
$
2011 (8.00) – (2.1)1 0.175
2010 6.73 – 1.71 0.180
2009 (29.11) – (27.5)1 0.335
2008 (130.79) – (58.4) 0.068
2007 (33.57) – (17.2) 0.380
1 Basic earnings per share for the financial years 2009, 2010 and 2011 have been calculated on a post-consolidation basis
Whilst continuing to ensure that Capral attracts and retains qualified, experienced and motivated employees in accordance with the remuneration policy by remunerating employees at a competitive level, Capral has maintained salary levels by ensuring that average annual salary increases are kept in line with CPI and placing more emphasis on at-risk remuneration in order to align remuneration of the employees to the performance of Capral and shareholder wealth.
For the Financial Year and the financial years ended 31 December 2007 and 2010, Capral made STIP payments based upon the achievement of performance measures in respect of the prior year. Capral made a STIP payment for the first half of the financial year ended 31 December 2008 only, based upon the achievement of performance targets determined at the start of the year. No STIP payments were paid in the financial year ended 31 December 2009. Refer to section 1(f) above for further details.
None of the LTIP rights granted as part of the 2007, 2008, 2009 and 2011 offers have vested as at the relevant 31 December testing dates (refer to section 1(h) above). 20% EPS (Tranche 1) of 2011 offer (681,420 rights) and 2006 offer (13,500 rights) lapsed on 31 December 2011.
For
per
sona
l use
onl
y

25
Section 4: Summary of Key Employment ContractsDetails of the key contract terms for the Managing Director and other key management personnel as at the end of the Financial Year are as follows:
CONtrACt DetAilS p. JOBe t. CAMpBell M. hASzArD D. MuNrO r. rOlFe
Existing contract end date 15 April 2012 No fixed end date No fixed end date No fixed end date No fixed end date
Notice of termination by Capral 6 months
12 months for year 1, then 6 months
1 month; 13 months for redundancy
12 months for year 1, then 6 months 16 weeks
Notice of termination by employee 6 months
12 months for year 1, then 6 months 6 months
12 months for year 1, then 6 months 16 weeks
Termination payments (in lieu of notice)
6 months salary plus accrued but unpaid STIP for previous financial year.
12 months salary plus accrued but unpaid STIP for previous financial year, reverting to 6 months from 1 June 2012.
1 month salary plus all accrued but unpaid STIP for the previous financial year; 13 months salary plus accrued but unpaid STIP for previous financial year in case of redundancy.
12 months salary plus accrued but unpaid STIP for previous financial year, reverting to 6 months from 14 June 2012.
16 weeks salary.
environmental regulations
Manufacturing licences and consents required by laws and regulations are held by the consolidated entity at each relevant site as advised by consulting with relevant environmental authorities. All applications for and renewals of licences have been granted and all consents have been given by all relevant authorities.
Directors’ and officers’ indemnities and insurance
Under Capral’s constitution, Capral is required to indemnify, to the extent permitted by law, each director and secretary of Capral against any liability incurred by that person as an officer of Capral. The directors listed on page 4 and the secretary listed on page 10 have the benefit of this indemnity. During the Financial Year, Capral paid a premium for directors’ and officers’ liability insurance policies which cover current and former directors, company secretaries and officers of the consolidated entity. Details of the nature of the liabilities covered and the amount of the premium paid in respect of the directors’ and officers’ insurance policies are not disclosed, as such disclosure is prohibited under the terms of the contracts.
indemnities to auditors
In respect of non-audit services provided in relation to reviews of tax consulting and compliance advice during the Financial Year, Deloitte Touche Tohmatsu, Capral’s auditor, has the benefit of an indemnity (including in respect of legal costs) for any third party claim in connection with the use, distribution or reliance of their work (except to the extent caused by the wilful misconduct or fraud of Deloitte Touche Tohmatsu, or where it has agreed that the third party may rely on the work or it may be used in a public document).
DIREC TORs’ REPORT
For
per
sona
l use
onl
y

C apr al annual report 201126
proceedings on behalf of Capral
No person has applied to the Court under section 237 of the Corporations Act for leave to bring proceedings on behalf of Capral, or to intervene in any proceedings to which Capral is party, for the purpose of taking responsibility on behalf of Capral for all or part of those proceedings. No proceedings have been brought or intervened in on behalf of Capral with leave of the Court under section 237 of the Corporations Act.
Non-audit services
Capral may decide to employ the auditor on assignments additional to their statutory audit services where the auditor’s expertise and experience with the consolidated entity are important.
The Board has considered this position and in accordance with the advice received from the Audit Committee, it is satisfied that the provision of these services during the Financial Year by the auditor is compatible with, and did not compromise, the general standard of auditor independence imposed by the Corporations Act for the following reasons:
(1) the non-audit services provided do not involve reviewing or auditing the auditor’s own work and have not involved partners or staff acting in a management or decision-making capacity for Capral or in the processing or originating of transactions;
(2) all non-audit services and the related fees have been reviewed by the Audit Committee to ensure complete transparency and that they do not affect the integrity and objectivity of Deloitte Touche Tohmatsu; and
(3) the declaration required by section 307C of the Corporations Act 2001 confirming independence has been received from Deloitte Touche Tohmatsu.
Details of the amounts paid or payable to Capral’s auditor (Deloitte Touche Tohmatsu) for audit and non-audit services provided during the Financial Year are set out in Note 33 of the financial statements.
Auditor’s independence declaration
The auditors’ independence declaration as required under section 307C of the Corporations Act is set out on page 27.
rounding of amounts
Capral is a company of the kind referred to in Class Order 98/0100, dated 10 July 1998, and in accordance with that Class Order amounts in the Directors’ Report and the Financial Report are rounded off to the nearest thousand dollars, unless otherwise indicated.
Signed in accordance with a resolution of directors made pursuant to section 298(2) of the Corporations Act 2001.
On behalf of the directors
r. l. Wood-Ward p.J. Jobe Chairman Managing Director
Sydney 22 February 2012
For
per
sona
l use
onl
y

27
Auditor’s Independence Declaration
Member of Deloitte Touche Tohmatsu Limited
For
per
sona
l use
onl
y
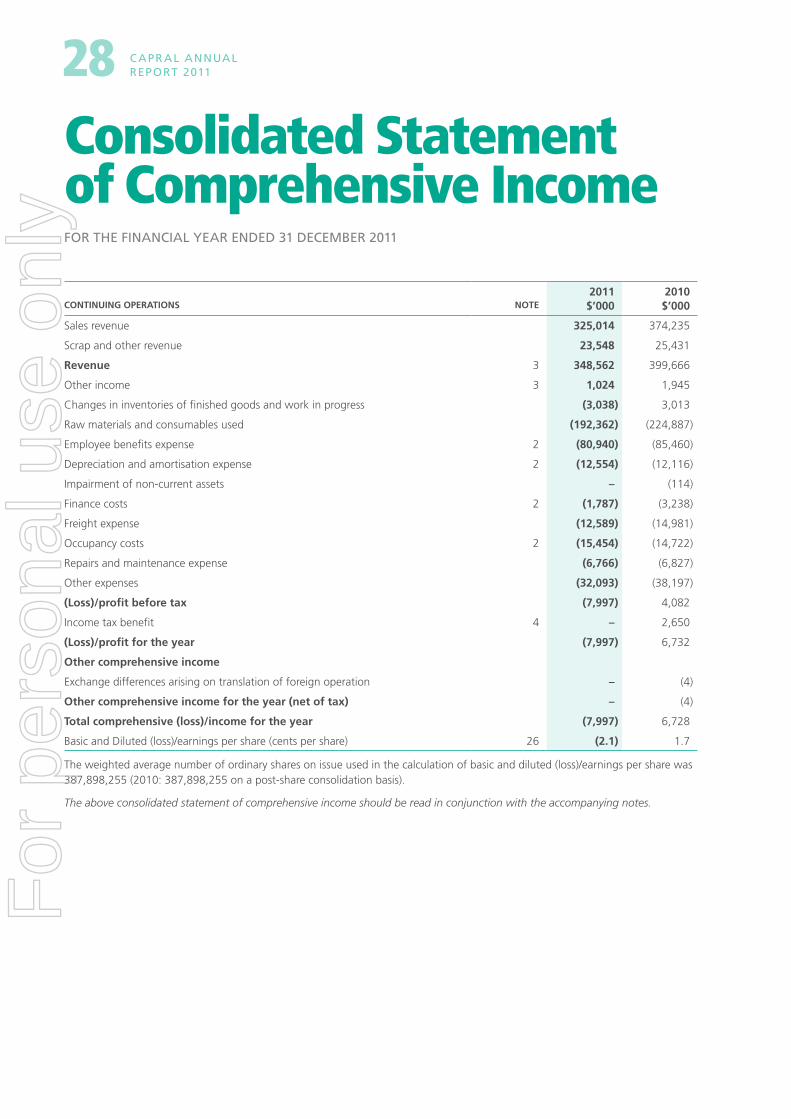
C apr al annual report 201128
2011 2010CONtiNuiNg OperAtiONS NOte $’000 $’000
Sales revenue 325,014 374,235
Scrap and other revenue 23,548 25,431
revenue 3 348,562 399,666
Other income 3 1,024 1,945
Changes in inventories of finished goods and work in progress (3,038) 3,013
Raw materials and consumables used (192,362) (224,887)
Employee benefits expense 2 (80,940) (85,460)
Depreciation and amortisation expense 2 (12,554) (12,116)
Impairment of non-current assets – (114)
Finance costs 2 (1,787) (3,238)
Freight expense (12,589) (14,981)
Occupancy costs 2 (15,454) (14,722)
Repairs and maintenance expense (6,766) (6,827)
Other expenses (32,093) (38,197)
(loss)/profit before tax (7,997) 4,082
Income tax benefit 4 – 2,650
(loss)/profit for the year (7,997) 6,732
Other comprehensive income
Exchange differences arising on translation of foreign operation – (4)
Other comprehensive income for the year (net of tax) – (4)
total comprehensive (loss)/income for the year (7,997) 6,728
Basic and Diluted (loss)/earnings per share (cents per share) 26 (2.1) 1.7
The weighted average number of ordinary shares on issue used in the calculation of basic and diluted (loss)/earnings per share was 387,898,255 (2010: 387,898,255 on a post-share consolidation basis).
The above consolidated statement of comprehensive income should be read in conjunction with the accompanying notes.
Consolidated statement of Comprehensive IncomeFOR ThE FINANCIAL yEAR ENDED 31 DECEMBER 2011
For
per
sona
l use
onl
y

29
2011 2010NOte $’000 $’000
ASSetS
Current assets
Cash and cash equivalents 7 15,002 33,400
Trade and other receivables 8 44,111 51,984
Inventories 9 57,057 63,703
Prepayments 10 2,563 2,647
total current assets 118,733 151,734
Non-current assets
Other receivables 8 163 –
Deferred tax assets 11 2,857 2,857
Property, plant and equipment 15 98,506 105,301
Other intangible assets 16 1,307 2,249
total non-current assets 102,833 110,407
total assets 221,566 262,141
liABilitieS
Current liabilities
Trade and other payables 18 51,405 64,473
Borrowings 19 179 22,053
Provisions 20 8,691 8,998
Deferred income 21 333 231
total current liabilities 60,608 95,755
Non-current liabilities
Provisions 20 4,411 3,833
Deferred income 22 310 464
total non-current liabilities 4,721 4,297
total liabilities 65,329 100,052
Net assets 156,237 162,089
eQuitY
Issued capital 23 410,476 410,476
Reserves 24 (a) 7,986 4,878
Accumulated losses 24 (b) (262,225) (253,265)
total equity 156,237 162,089
The above consolidated statement of financial position should be read in conjunction with the accompanying notes.
Consolidated statement of Financial position As AT 31 DECEMBER 2011
FINANCIAL sTATEMENTs
For
per
sona
l use
onl
y

C apr al annual report 201130
Consolidated statement of Cash FlowsFOR ThE FINANCIAL yEAR ENDED 31 DECEMBER 2011
2011 2010NOte $’000 $’000
Cash flows from operating activities
Receipts from customers 391,294 446,835
Payments to suppliers and employees (380,884) (424,340)
10,410 22,495
Interest and other costs of finance paid (1,567) (2,697)
Net cash provided by operating activities 35(ii) 8,843 19,798
Cash flows from investing activities
Payments for property, plant and equipment (5,352) (2,937)
Payments for software assets (116) (39)
Net cash outflow on acquisition of subsidiary – (1,257)
Interest received 315 212
Proceeds from sale of property, plant and equipment 6 1,436
Net cash flows used in investing activities (5,147) (2,585)
Cash flows from financing activities
Repayment of borrowings (22,128) (5,750)
Net cash used in financing activities (22,128) (5,750)
Net (decrease)/increase in cash and cash equivalents (18,432) 11,463
Cash and cash equivalents at the beginning of the financial year 33,117 21,658
Effects of exchange rate changes on the balance of cash held in foreign currencies
– (4)
Cash and cash equivalents at the end of the financial year 35(i) 14,685 33,117
The above consolidated statement of cash flows should be read in conjunction with the accompanying notes.
For
per
sona
l use
onl
y

31
Consolidated statement of Changes in equityFOR ThE yEAR ENDED 31 DECEMBER 2011
FullY pAiD OrDiNArY
ShAreS
FOreigN CurreNCY
trANSlAtiON reSerVe
eQuitY-SettleD COMpeNSAtiON
reSerVe
ACtuAriAl (lOSS)/gAiN ON
retireMeNt BeNeFit plAN
ACCuMulAteD lOSSeS tOtAl
$’000 $’000 $’000 $’000 $’000 $’000
Balance as at 1 January 2010 410,476 (919) 3,040 (963) (259,997) 151,637
Profit for the period – – – – 6,732 6,732
Exchange differences arising on translation of foreign operations – (4) – – – (4)
Total comprehensive income for the period – (4) – – 6,732 6,728
Share-based payments expense – – 3,724 – – 3,724
Balance as at 31 December 2010 410,476 (923) 6,764 (963) (253,265) 162,089
Balance as at 1 January 2011 410,476 (923) 6,764 (963) (253,265) 162,089
Loss for the period – – – – (7,997) (7,997)
Total comprehensive income for the period – – – – (7,997) (7,997)
Transfer to profit and loss on disposal of a foreign subsidiary – 923 – – – 923
Transfer to accumulated losses – – – 963 (963) –
Share-based payments expense – – 1,222 – – 1,222
Balance as at 31 December 2011 410,476 – 7,986 – (262,225) 156,237
The above consolidated statement of changes in equity should be read in conjunction with the accompanying notes.
FINANCIAL sTATEMENTs
For
per
sona
l use
onl
y

C apr al annual report 201132
1a. General informationCapral Limited (the Company) is a public listed company incorporated and operating in Australia. The Company’s shares are quoted on the Australian Securities Exchange (ASX Code: CAA).
The Company’s registered office and its principal place of business is as follows:
registered office & principal place of business
71 Ashburn Road Bundamba QLD 4304 Tel: (07) 3816 7000
The principal continuing activities of the consolidated entity consist of the manufacturing, marketing and distribution of semi-fabricated aluminium products.
1b. Adoption of new and revised Accounting Standards In the current year, the Group has adopted all the new and revised Standards and Interpretations issued by the Australian Accounting Standards Board (the AASB) that are relevant to its operations and effective for the current annual reporting period. The adoption of other new and revised Standards and Interpretations has not resulted in any changes to the Group’s accounting policies, and has only impacted on the Group’s financial statements with respect to disclosure.
Initial application of the following Standards and Interpretations is not expected to have any material impact to the financial report of the consolidated entity and the Company:
StANDArDeFFeCtiVe FOr ANNuAl repOrtiNg
periODS BegiNNiNg ON Or AFtereXpeCteD tO Be iNitiAllY ApplieD
iN the FiNANCiAl YeAr eNDiNg
AASB 9 ‘Financial Instruments’ 1 January 2015 31 December 2015
AASB 2009-11 ‘Amendments to Australian Accounting Standards arising from AASB 9’ 1 January 2013 31 December 2013
AASB 10 ‘Consolidated Financial Statements’ 1 January 2013 31 December 2013
AASB 12 ‘Disclosure of Interests in Other Entities’ 1 January 2013 31 December 2013
AASB 13 ‘Fair Value Measurement’ 1 January 2013 31 December 2013
AASB 2011-8 ‘Amendments to Australian Accounting Standards arising from AASB 13’ 1 January 2013 31 December 2013
AASB 119 ‘Employee Benefits’ 1 January 2013 31 December 2013
AASB 2011-10 ‘Amendments to Australian Accounting Standards arising from AASB 119’ 1 January 2013 31 December 2013
AASB 2011-11 ‘Amendments to AASB 119 arising from Reduced Disclosure Requirements’ 1 January 2013 31 December 2013
AASB 2010-8 ‘Amendments to Australian Accounting Standards – Deferred Tax: Recovery of Underlying Assets’ 1 January 2012 31 December 2012
AASB 2011-4 ‘Amendments to Australian Accounting Standards to Remove Individual Key Management Personnel Disclosure Requirements’ 1 July 2013 31 December 2014
notes to the Financial statementsFOR ThE FINANCIAL yEAR ENDED 31 DECEMBER 2011
For
per
sona
l use
onl
y

Notes to the FiNaNcial
statemeNts 33
1c. Significant accounting policies Statement of Compliance
The financial report is a general purpose financial report which has been prepared in accordance with the Corporations Act 2001, Accounting Standards and Interpretations, and complies with other requirements of the law.
The financial report includes the financial statements of the Company and the financial statements of the Group.
Accounting Standards include Australian equivalents to International Financial Reporting Standards (‘A-IFRS’). Compliance with A-IFRS ensures that the financial statements and notes of the Group comply with International Financial Reporting Standards (‘IFRS’).
The financial statements were authorised for issue by the directors on 22 February 2012.
Basis of preparation
The financial report has been prepared on the basis of historical cost, except for the revaluation of certain non-current assets and financial instruments. Cost is based on the fair values of the consideration given in exchange for assets. All amounts are presented in Australian dollars, unless otherwise noted.
The Company is of a kind referred to in ASIC Class Order 98/0100, dated 10 July 1998, issued by the Australian Securities and Investments Commission, relating to the “rounding off” of amounts in the financial report. Amounts in the financial report have been rounded off in accordance with that Class Order to the nearest thousand dollars, or in certain cases, the nearest dollar as indicated.
The following significant accounting policies have been adopted in the preparation and presentation of the financial report:
(a) Basis of Consolidation
The financial statements incorporate the financial statements of the Company and entities (including special purpose entities) controlled by the Company (and its subsidiaries) (referred to as ‘the Group’ in these financial statements).
Control is achieved where the Company has the power to govern the financial and operating policies of an entity so as to obtain benefits from its activities.
The results of the subsidiaries acquired or disposed of during the year are included in the statement of comprehensive income from the effective date of acquisition or up to the effective date of disposal, as appropriate.
Where necessary, adjustments are made to the financial statements of subsidiaries to bring their accounting policies into line with those used by other members of the Group. All intra-group transactions, balances, income and expenses are eliminated in full on consolidation.
(b) Borrowing Costs
Borrowing costs directly attributable to the acquisition, construction or production of qualifying assets, which are assets that necessarily take a substantial period of time to get ready for their intended use or sale, are added to the cost of those assets, until such time as the assets are substantially ready for their intended use or sale. Investment income earned on the temporary investment of specific borrowings pending their expenditure on qualifying assets is deducted from the borrowing costs eligible for capitalisation. All other borrowing costs are recognised in profit or loss in the period in which they are incurred.
(c) Business Combinations
Acquisitions of subsidiaries and businesses are accounted for using the acquisition method. The consideration for each acquisition is measured at the aggregate of the fair values (at the date of exchange) of assets given, liabilities incurred or assumed, and equity instruments issued by the Group in exchange for control of the acquiree. Acquisition-related costs are recognised in profit or loss as incurred.
Where applicable, the consideration for the acquisition includes any asset or liability resulting from a contingent consideration arrangement, measured at its acquisition-date fair value. Subsequent changes in such fair values are adjusted against the cost of acquisition where they qualify as measurement period adjustments (see below). All other subsequent changes in the fair value of contingent consideration classified as an asset or liability are accounted for in accordance with relevant Standards. Changes in the fair value of contingent consideration classified as equity are not recognised.
The acquiree’s identifiable assets, liabilities and contingent liabilities that meet the conditions for recognition under AASB 3(2008) are recognised at their fair value at the acquisition date, except that:
› deferred tax assets or liabilities and liabilities or assets related to employee benefit arrangements are recognised and measured in accordance with AASB 112 Income Taxes and AASB 119 Employee Benefits respectively;
› liabilities or equity instruments related to the replacement by the Group of an acquiree’s share based payment awards are measured in accordance with AASB 2 Share-based Payment; and
For
per
sona
l use
onl
y

C apr al annual report 201134
1c. Significant accounting policies (Cont’d) (c) Business Combinations (Cont’d)
› assets (or disposal groups) that are classified as held for sale in accordance with AASB 5 Noncurrent Assets Held for Sale and Discontinued Operations are measured in accordance with that Standard.
(d) Cash and Cash equivalents
Cash comprises cash on hand and demand deposits. Cash equivalents are short-term, highly liquid investments that are readily convertible to known amounts of cash and which are subject to an insignificant risk of change in value and have a maturity of three months or less at the date of acquisition. Bank overdrafts are shown within borrowings in current liabilities in the statement of financial position.
(e) Derivative Financial instruments
The Group enters into a variety of derivative financial instruments to manage its exposure to interest rate and foreign exchange rate risk, including foreign exchange forward contracts.
Further details of derivative financial instruments are disclosed in Note 31 to the financial statements. Derivatives are initially recognised at fair value at the date a derivative contract is entered into and are subsequently remeasured to their fair value at each reporting date.
The resulting gain or loss is recognised in profit or loss immediately. The fair value of hedging derivatives is classified as a non-current asset or a non-current liability if the remaining maturity of the hedge relationship is more than 12 months, and as a current asset or current liability if the remaining maturity of the hedge relationship is less than 12 months. The Group’s derivatives do not qualify for hedge accounting, and are not designated into an effective hedge relationship and are classified as a current asset and current liability.
embedded Derivatives
Derivatives embedded in other financial instruments or other host contracts are treated as separate derivatives when their risks and characteristics are not closely related to those of the financial instrument, and the financial instruments are measured at fair value with changes in fair value recognised in profit or loss.
(f) employee Benefits
(i) salaries, wages and leave benefits
A liability is recognised for benefits accruing to employees in respect of wages and salaries, including non-monetary benefits, annual leave and long service leave, when it is probable that settlement will be required and they are capable of being measured reliably. Liabilities recognised in respect of employee benefits expected to be settled within 12 months, are measured at their nominal values using the remuneration rate expected to apply at the time of settlement. Liabilities
recognised in respect of employee benefits which are not expected to be settled within 12 months are measured at the present value of the estimated future cash outflows to be made by the Group in respect of services provided by employees up to reporting date.
(ii) share-based payments
Equity-settled share-based payments granted under the Managing Director’s employment contract, and the Long Term Incentive Plan (LTIP), are independently valued at grant date. The fair value determined at the grant date of the equity-settled share-based payments is expensed on a straight-line basis over the vesting period, based on the Group’s estimate of shares that will eventually vest.
(iii) Defined benefit plan
For defined benefit plans, the cost of providing benefits is determined using the projected unit credit method, with actuarial valuations being carried out at each reporting date.
Actuarial gains and losses are recognised in full in equity in the period in which they occur.
Past service cost is recognised immediately to the extent that the benefits are already vested, and otherwise is amortised on a straight-line basis over the average period until the benefits become vested.
The defined benefit obligation recognised in the statement of financial position represents the present value of the defined benefit obligation, adjusted for unrecognised past service cost, net of the fair value of the plan assets. Any asset resulting from this calculation is limited to past service cost, plus the present value of available refunds and reductions in future contributions to the plan.
(iv) Defined contribution plan
Contributions to defined contribution superannuation plans are expensed when incurred.
(g) Financial Assets
Investments are recognised and derecognised on trade date where the purchase or sale of an investment is under a contract whose terms require delivery of the investment within the timeframe established by the market concerned, and are initially measured at fair value, net of transaction costs except for those financial assets classified as at fair value through the profit or loss which are initially measured at fair value. Subsequent to initial recognition, investments in subsidiaries are measured at cost in the Company’s financial statements. Other financial assets are classified into the following specified categories: Financial assets ‘at fair value through profit or loss’, ‘held-to-maturity investments’, ‘available-for-sale’ financial assets, and ‘loans and receivables’. The classification depends on the nature and purpose of the financial assets and is determined at the time of initial recognition.
For
per
sona
l use
onl
y

Notes to the FiNaNcial
statemeNts 35
Effective interest method
The effective interest method is a method of calculating the amortised cost of a financial asset and of allocating interest income over the relevant period. The effective interest rate is the rate that exactly discounts estimated future cash receipts through the expected life of the financial asset, or, where appropriate, a shorter period.
Income is recognised on an effective interest rate basis for debt instruments other than financial assets ‘at fair value through profit or loss’.
Financial assets at fair value through profit or loss
Financial assets are classified as financial assets at fair value through profit or loss where the financial asset:
(i) has been acquired principally for the purpose of selling in the near future;
(ii) is a part of an identified portfolio of financial instruments that the Group manages together and has a recent actual pattern of short-term profit taking; or
(iii) is a derivative that is not designated and effective as a hedging instrument.
Financial assets at fair value through profit or loss are stated at fair value, with any resultant gain or loss recognised in the profit or loss. The net gain or loss recognised in profit or loss incorporates any dividend or interest earned on the financial asset. Fair value is determined in the manner described in Note 31.
Loans and receivables
Trade receivables, loans, and other receivables that have fixed or determinable payments that are not quoted in an active market are classified as ‘loans and receivables’. Loans and receivables are measured at amortised cost using the effective interest method less impairment. Interest is recognised by applying the effective interest rate.
Impairment of financial assets
Financial assets, other than those at fair value through profit or loss, are assessed for indicators of impairment at each balance sheet date. Financial assets are impaired where there is objective evidence that as a result of one or more events that occurred after the initial recognition of the financial asset the estimated future cash flows of the investment have been impacted.
For financial assets carried at amortised cost, the amount of the impairment is the difference between the asset’s carrying amount and the present value of estimated future cash flows, discounted at the original effective interest rate.
The carrying amount of the financial asset is reduced by the impairment loss directly for all financial assets with the
exception of trade receivables where the carrying amount is reduced through the use of an allowance account. When a trade receivable is uncollectible, it is written off against the allowance account. Subsequent recoveries of amounts previously written off are credited against the allowance account. Changes in the carrying amount of the allowance account are recognised in profit or loss.
Derecognition of financial assets
The Group derecognises a financial asset only when the contractual rights to the cash flows from the asset expire, or it transfers the financial asset and substantially all the risks and rewards of ownership of the asset to another entity. If the Group neither transfers nor retains substantially all the risks and rewards of ownership and continues to control the transferred asset, the Group recognises its retained interest in the asset and an associated liability for the amounts it may have to pay. If the Group retains substantially all the risks and rewards of ownership of a transferred financial asset, the Group continues to recognise the financial asset and also recognises a collateralised borrowing for the proceeds received.
(h) Financial instruments issued by the group
Debt and equity instruments
Debt and equity instruments are classified as either liabilities or as equity in accordance with the substance of the contractual arrangement.
Financial liabilities at fair value through profit or loss
Financial liabilities at fair value through profit or loss are stated at fair value, with any resultant gain or loss recognised in the profit or loss. The net gain or loss recognised in profit or loss incorporates any interest paid on the financial liability. Fair value is determined in the manner described in Note 31.
Compound instruments
The component parts of compound instruments are classified separately as financial liabilities and equity in accordance with the substance of the contractual arrangement. At the date of issue, the fair value of the liability component is estimated using the prevailing market interest rate for a similar non-convertible instrument.
This amount is recorded as a liability on an amortised cost basis until extinguished on conversion or upon the instruments reaching maturity. The equity component initially brought to account is determined by deducting the amount of the liability component from the fair value of the compound instrument as a whole. This is recognised and included in equity, net of income tax effects and is not subsequently remeasured.
For
per
sona
l use
onl
y

C apr al annual report 201136
1c. Significant accounting policies (Cont’d)(h) Financial instruments issued by the group (Cont’d)
Financial guarantee contract liabilities
Financial guarantee contract liabilities are measured initially at their fair values and subsequently at the higher of the amount recognised as a provision and the amount initially recognised less cumulative amortisation.
Financial liabilities
Financial liabilities are classified as either financial liabilities ‘at fair value through profit or loss’ or other financial liabilities.
Financial liabilities at fair value through profit or loss
Financial liabilities at fair value through profit or loss are stated at fair value, with any resultant gain or loss recognised in profit or loss. The net gain or loss recognised in profit or loss incorporates any interest paid on the financial liability. Fair value is determined in the manner described in Note 31.
Other financial liabilities
Other financial liabilities, including borrowings, are initially measured at fair value, net of transaction costs.
Other financial liabilities are subsequently measured at amortised cost using the effective interest method, with interest expense recognised on an effective yield basis.
The effective interest method is a method of calculating the amortised cost of a financial liability and of allocating interest expense over the relevant period. The effective interest rate is the rate that exactly discounts estimated future cash payments through the expected life of the financial liability, or, where appropriate, a shorter period.
(i) Foreign Currency
The individual financial statements of each group entity are presented in the currency of the primary economic environment in which the entity operates (its functional currency). For the purpose of the financial statements, the results and financial position of each entity are expressed in Australian dollars, which is the functional currency of the Company, and the presentation currency for the financial statements. In preparing the financial statements of the individual entities, transactions in currencies other than the entity’s functional currency (foreign currencies) are recorded at the rates of exchange prevailing on the dates of the transactions. At each balance sheet date, monetary items denominated in foreign currencies are retranslated at the rates prevailing at the balance sheet date. Non-monetary items carried at fair value that are denominated in foreign currencies are retranslated at the rates prevailing on the date when the fair value was determined. Non monetary items that are measured in terms of historical cost in a foreign currency are not retranslated.
Exchange differences are recognised in profit or loss in the period in which they arise except for:
(i) Exchange differences which relate to assets under
construction for future productive use, which are included in the cost of those assets where they are regarded as an adjustment to interest costs on foreign currency borrowings;
(ii) Exchange differences on transactions entered into in order to hedge certain foreign currency risks; and
(iii) Exchange differences on monetary items receivable from or payable to a foreign operation for which settlement is neither planned or likely to occur, which form part of the net investment in a foreign operation, and which are recognised in the foreign currency translation reserve and recognised in profit or loss on disposal of the net investment.
On consolidation, the assets and liabilities of the Group’s foreign operations (including comparatives) are translated into Australian dollars at exchange rates prevailing on the balance sheet date.
Income and expense items (including comparatives) are translated at the average exchange rates for the period, unless exchange rates fluctuated significantly during that period, in which case the exchange rates at the dates of the transactions are used.
Exchange differences arising, if any, are classified as equity and transferred to the Group’s translation reserve. Such exchange differences are recognised in profit or loss in the period in which the foreign operation is disposed. Goodwill and fair value adjustments arising on the acquisition of a foreign entity on or after the date of transition to A-IFRS are treated as assets and liabilities of the foreign entity and translated at exchange rates prevailing at reporting date. Goodwill arising on acquisitions before the date of transition to A-IFRS is treated as an Australian dollar denominated asset.
(j) goodwill
Goodwill arising in a business combination is recognised as an asset at the date that control is acquired (the acquisition date). Goodwill is measured as the excess of the sum of the consideration transferred, the amount of any non-controlling interests in the acquiree, and the fair value of the acquirer’s previously held equity interest in the acquiree (if any) over the net of the acquisition-date amounts of the identifiable assets acquired and the liabilities assumed. If, after reassessment, the Group’s interest in the fair value of the acquiree’s identifiable net assets exceeds the sum of the consideration transferred, the amount of any non-controlling interests in the acquiree and the fair value of the acquirer’s previously held equity interest in the acquiree (if any), the excess is recognised immediately in profit or loss as a bargain purchase gain. Goodwill is not amortised but is reviewed for impairment at least annually.
For the purpose of impairment testing, goodwill is allocated to each of the Group’s cash-generating units expected to benefit from the synergies of the combination. Cash-generating units to which goodwill has been allocated are tested for impairment annually, or more frequently when there is an indication that the unit may be impaired. If the recoverable amount of the
For
per
sona
l use
onl
y

Notes to the FiNaNcial
statemeNts 37
cash-generating unit is less than its carrying amount, the impairment loss is allocated first to reduce the carrying amount of any goodwill allocated to the unit and then to the other assets of the unit pro-rata on the basis of the carrying amount of each asset in the unit. An impairment loss recognised for goodwill is not reversed in a subsequent period.
(k) government grants
Government grants are assistance by the Government in the form of transfers of resources to the Group in return for past or future compliance with certain conditions relating to the operating activities of the entity.
Government grants include Government assistance where there are no conditions specifically relating to the operating activities of the Group other than the requirement to operate in certain regions or industry sectors.
Government grants are not recognised until there is a reasonable assurance that the Group will comply with the conditions attaching to them and the grants will be received. Government grants whose primary condition is that the Group should purchase, construct or otherwise acquire long-term assets are recognised as deferred income in the balance sheet and recognised as income on a systematic and rational basis over the useful lives of the related assets. Other Government grants are recognised as income over the periods necessary to match them with the related costs which they are intended to compensate on a systematic basis.
(l) impairment of Other tangible and intangible Assets excluding goodwill
At each reporting date, the Group reviews the carrying amounts of its tangible and intangible assets to determine whether there is any indication that those assets have suffered an impairment loss. If any such indication exists, the recoverable amount of the asset is estimated in order to determine the extent of the impairment loss (if any). Where the asset does not generate cash flows that are independent from other assets, the Group estimates the recoverable amount of the cash-generating unit (Cgu) to which that asset belongs.
Intangible assets with indefinite useful lives and intangible assets not yet available for use are tested for impairment annually and whenever there is an indication that the asset may be impaired. Recoverable amount is the higher of fair value less costs to sell and value in use. In assessing value in use, the estimated future cash flows are discounted to their present value using a pre-tax discount rate that reflects current market assessments of the time value of money and the risks specific to the asset for which the estimates of future cash flows have not been adjusted. If the recoverable amount of an asset (or CGU) is estimated to be less than its carrying amount, the carrying amount of the asset (CGU) is reduced to its recoverable amount. An impairment loss is recognised in profit or loss immediately, unless the relevant asset is carried at fair value, in which case the impairment loss is treated as a revaluation decrease.
Where an impairment loss subsequently reverses, the carrying amount of the asset (CGU) is increased to the revised estimate of its recoverable amount, but only to the extent that the increased carrying amount does not exceed the carrying amount that would have been determined had no impairment loss been recognised for the asset (CGU) in prior years. A reversal of an impairment loss is recognised in the profit or loss immediately, unless the relevant asset is carried at fair value, in which case the reversal of the impairment loss is treated as a revaluation increase.
(m) income tax
The income tax expense or revenue for the period is the tax payable on the current period’s taxable income based on the national income tax rate for each jurisdiction adjusted by changes in deferred tax assets and liabilities attributable to temporary differences between the tax bases of assets and liabilities and their carrying amounts in the financial statements, and to unused tax losses.
Deferred tax assets are recognised for deductible temporary differences and unused tax losses only if it is probable that future taxable amounts will be available to utilise those temporary differences and losses.
The Company and its wholly-owned Australian entities have implemented the tax consolidation legislation.
The current and deferred tax amounts for the tax-consolidated group are allocated to the members of the tax-consolidated group (including the Company as the head entity) using the ‘separate taxpayer within group’ approach, with deferred taxes being allocated by reference to the carrying amounts in the financial statements of each member entity and the tax values applying under tax consolidation. Current tax liabilities and assets and deferred tax assets arising from unused tax losses and relevant tax credits arising from this allocation process are then accounted for as immediately assumed by the head entity, as under Australian taxation law the head entity has the legal obligation (or right) to these amounts.
(n) intangible Assets
Intangible assets acquired in a business combination are identified and recognised separately from goodwill where they satisfy the definition of an intangible asset and their fair value can be measured reliably.
Patents, trademarks and licences
Patents, trademarks and licences are recorded at cost less accumulated amortisation and impairment. Amortisation is charged on a straight line basis over their estimated useful lives, which vary from 5 to 16 years.
The estimated useful life and amortisation method is reviewed at the end of each annual reporting period, with any changes being recognised as a change in accounting estimate.
For
per
sona
l use
onl
y

C apr al annual report 201138
1c. Significant accounting policies (Cont’d)(n) intangible Assets (Cont’d)
software
Software assets including system development costs have a finite useful life and are carried at cost less accumulated amortisation and impairment losses. Amortisation is calculated using the straight-line method to allocate the cost over the assets estimated useful lives, which vary from 3 to 5 years.
(o) inventories
Inventories representing aluminium and other supplies are valued at the lower of cost and net realisable value.
Net realisable value represents the estimated selling price less all estimated costs of completion and costs necessary to make the sale.
Aluminium log is valued at moving average of direct purchase cost. Cost of rolled product has been determined principally on moving average of direct purchase costs. Costs for finished and partly finished includes moving average metal cost, direct labour, and appropriate proportion of fixed and variable factory overhead.
(p) leased Assets
The group as lessee:
Leases are classified as finance leases when the terms of the lease transfer substantially all the risks and rewards incidental to ownership of the leased asset to the lessee. All other leases are classified as operating leases.
Operating lease payments are recognised as an expense on a straight-line basis over the lease team, except where another systematic basis is more representative of the time pattern in which economic benefits from the leased asset are consumed.
In the event that lease incentives are received to enter into operating leases, such incentives are recognised as a liability. The aggregate benefits of incentives are recognised as a reduction of rental expense on a straight-line basis, except where another systematic basis is more representative of the time pattern in which economic benefits from the leased asset are consumed.
The group as lessor:
Amounts due from lessees under finance leases are recognised as receivables at the amount of the Group’s net investment in the leases. Finance lease income is allocated to accounting periods so as to reflect a constant periodic rate of return on the Group’s net investment outstanding in respect of the leases.
Rental income from operating leases is recognised on a straight-line basis over the term of the relevant lease. Initial direct costs incurred in negotiating and arranging an operating lease are added to the carrying amount of the leased asset and recognised on a straight-line basis over the lease term.
(q) Non-current Assets held for Sale
Non-current assets classified as held for sale are measured, with certain exceptions, at the lower of carrying amount and fair value less costs to sell.
Non-current assets are classified as held for sale if their carrying amount will be recovered principally through a sale transaction rather than through continuing use. This condition is regarded as met only when the asset is available for immediate sale in its present condition subject only to terms that are usual and customary for such a sale and the sale is highly probable. The sale of the asset must be expected to be completed within one year from the date of classification, except in the circumstances where sale is delayed by events or circumstances outside the Group’s control and the Group remains committed to the sale.
(r) property, plant and equipment
Land and buildings are measured at fair value less any subsequent accumulated depreciation and subsequent accumulated impairment losses. Fair value is determined on the basis of a periodic, independent valuation by external valuation experts, based on discounted cash flows or capitalisation of net income, as appropriate.
Periodic reviews are conducted every three to five years. The fair values are recognised in the financial statements of the Group, and are reviewed at the end of each reporting period to ensure that the carrying value of land and buildings is not materially different from their fair values. Any revaluation increase arising on revaluation of land and buildings are credited to the asset revaluation reserve except to the extent that the increase reverses a revaluation decrease for the same asset previously recognised as an expense in profit or loss, in which case the increase is credited to the profit and loss to the extent of the decrease previously charged. A decrease in carrying amount arising on the revaluation of land and buildings is charged as an expense in profit or loss to the extent that it exceeds the balance, if any, held in the revaluation reserve relating to a previous revaluation of that asset.
Depreciation on revalued buildings is charged to profit or loss. On the subsequent sale or retirement of revalued property, the attributable revaluation surplus remaining in the revaluation reserve, net of any related taxes, is transferred directly to retained earnings.
Plant and equipment, and leasehold improvements are stated at cost less accumulated depreciation and impairment. Cost includes expenditure that is directly attributable to the acquisition of the item.
In the event that settlement of all or part of the purchase consideration is deferred, cost is determined by discounting the amounts payable in the future to their present value as at the date of acquisition. Depreciation is provided on property, plant and equipment, including freehold buildings but excluding land. Depreciation is calculated on a straight-line basis so as to write off the net cost or other revalued amount of each asset over its expected useful life to its estimated residual value.
Leasehold improvements are depreciated over the period of the lease or estimated useful life, whichever is shorter, using the straight-line method. The estimated useful lives, residual values and depreciation method are reviewed at the end of
For
per
sona
l use
onl
y

Notes to the FiNaNcial
statemeNts 39
each annual reporting period, with the effect of any changes recognised on a prospective basis.
(s) provisions
Provisions are recognised when the Group has a present, legal or constructive obligation as a result of past events, it is probable that the Group will be required to settle the obligation, and a reliable estimate can be made of the amount of the obligation.
The amount recognised as a provision is the best estimate of the consideration required to settle the present obligation at reporting date, taking into account the risks and uncertainties surrounding the obligation. Where a provision is measured using the cashflows estimated to settle the present obligation, its carrying amount is the present value of those cashflows. When some or all of the economic benefits required to settle a provision are expected to be recovered from a third party, the receivable is recognised as an asset if it is virtually certain that the reimbursement will be received and the amount of the receivable can be measured reliably.
Onerous contracts
Present obligations arising under onerous contracts are recognised and measured as a provision. An onerous contract is considered to exist where the Group has a contract under which the unavoidable costs of meeting the obligations under the contract exceed the economic benefits expected to be received under it.
Restructurings
A restructuring provision is recognised when the Group has developed a detailed formal plan for the restructuring and has raised a valid expectation in those affected that it will carry out the restructuring by starting to implement the plan or announcing its main features to those affected by it.
The measurement of a restructuring provision includes only the direct expenditures arising from the restructuring, which are those amounts that are both necessarily entailed by the restructuring and not associated with the ongoing activities of the entity.
Provision for restoration and rehabilitation
A provision for restoration and rehabilitation is recognised when there is a present obligation as a result of production activities undertaken, it is probable that an outflow of economic benefits will be required to settle the obligation, and the amount of the provision can be measured reliably. The estimated future obligations include the costs of removing the facilities and restoring the affecting areas.
(t) revenue recognition
Revenue is measured at the fair value of the consideration received or receivable. Sales revenue comprises sales of goods and services at net invoice values less returns, trade allowances and applicable rebates.
sale of goods
Revenue from the sale of goods is recognised when all the following conditions are satisfied:
(i) the Group has transferred to the buyer the significant risks and rewards of ownership of the goods;
(ii) the Group retains neither continuing managerial involvement to the degree normally associated with ownership nor effective control over the goods sold;
(iii) the amount of revenue can be measured reliably;
(iv) it is probable that the economic benefits associated with the transaction will flow to the entity; and
(v) the costs incurred or to be incurred in respect of the transaction can be measured reliably.
Royalties
Royalty revenue is recognised on an accrual basis in accordance with the substance of the relevant agreement.
Royalties determined on a time basis are recognised on a straight-line basis over the period of the agreement. Royalty arrangements that are based on production, sales and other measures are recognised by reference to the underlying agreement.
Rental income
The Group’s policy for recognition of revenue from operating leases is described in 1c (p).
Interest revenue
Interest revenue is accrued on a time basis, by reference to the principal outstanding and at the effective interest rate applicable, which is the rate that exactly discounts estimated future cash receipts through the expected life of the financial asset to that asset’s net carrying amount.
(u) Share-based payments
Equity-settled share-based payments with employees are measured at the fair value of the equity instrument at the grant date.
The fair value of the performance rights is estimated at grant date using a Monte-Carlo Simulation analysis taking into account the terms and conditions upon which the securities are granted.
The fair value of the options is estimated at grant date using a binomial tree model taking into account the terms and conditions upon which the securities are granted.
The expected life used in the model has been adjusted, based on management’s best estimate, for the effects of non-transferability, exercise restrictions, and behavioural considerations.
The fair value determined at the grant date of the equity-settled share-based payments is expensed on a straight-line basis over the vesting period, based on the Group’s estimate of shares that will eventually vest.
For
per
sona
l use
onl
y

C apr al annual report 201140
1c. Significant accounting policies (Cont’d)(u) Share-based payments (Cont’d)
Further details on how the fair value of equity-settled share-based transactions have been determined can be found in Note 37.
(v) goods and Services tax
Revenues, expenses and assets are recognised net of the amount of goods and services tax (gSt) except:
(i) where the amount of GST incurred is not recoverable from the taxation authority, it is recognised as part of the cost of acquisition of an asset or as part of an item of expense; or
(ii) for receivables and payables which are recognised inclusive of GST.
The net amount of GST recoverable from, or payable to, the taxation authority is included as part of receivables or payables. Cash flows are included in the cash flow statement on a gross basis. The GST component of cash flows arising from investing and financing activities which is recoverable from, or payable to, the taxation authority, is classified as operating cash flows.
(w) earnings per share
(i) Basic earnings per share
Basic earnings per share is calculated by dividing the profit/(loss) attributable to equity holders of the Group, excluding any costs of servicing equity other than ordinary shares, by the weighted average number of ordinary shares outstanding during the year, adjusted for bonus elements in ordinary shares issued during the year.
(ii) Diluted earnings per share
Diluted earnings per share adjusts the figures used in the determination of basic earnings per share to take into account the weighted average number of shares assumed to have been issued for no consideration in relation to dilutive potential ordinary shares.
1d. Critical accounting judgements and key sources of estimation uncertainty
In the application of the Group’s accounting policies, which are described in note 1c, management is required to make judgements, estimates and assumptions about carrying values of assets and liabilities that are not readily apparent from other sources. The estimates and associated assumptions are based on historical experience and various other factors that are believed to be reasonable under the circumstances, the results of which form the basis of making the judgements. Actual results may differ from these estimates.
The estimates and underlying assumptions are reviewed on an ongoing basis. Revisions to accounting estimates are recognised in the period in which the estimate is revised if the revision affects only that period, or in the period of the revision and future periods if the revision affects both current and future periods.
Key sources of estimation uncertainty
The following are the key assumptions concerning the future, and other key sources of estimation uncertainty at the balance sheet date, that have a significant risk of causing a material adjustment to the carrying amounts of assets and liabilities within the next financial year:
Impairment of non-current assets
Determining whether non-current assets are impaired requires an estimation of the value in use of the single cash-generating unit to which non-current assets has been allocated. The value in use calculation requires the entity to estimate the future cash flows expected to arise from the cash-generating unit and a suitable discount rate in order to calculate present value.
Details of the impairment calculation is provided in Note 16.
Critical judgements in applying the Company’s accounting policies
The following are the critical judgements (apart from those involving estimations which are dealt with above), that management has made in the process of applying the Group’s accounting policies and that have the most significant effect on the amounts recognised in the financial statements.
Inventories
Note 9 sets out the categories of inventory carried. The net realisable value of inventories is the estimated selling price in the ordinary course of business less estimated costs to sell which approximates fair value less cost to sell. The key assumptions require the use of management judgement and are reviewed annually.
These key assumptions are the variables affecting the estimated costs to sell and the expected selling price. Any reassessment of cost to sell or selling price in a particular year will affect the cost of goods sold.
Employee benefits
Management judgement is applied in determining the following key assumptions used in the calculation of long service leave at balance sheet date:
(i) future on-cost rates,
(ii) experience of employee departures and period of service, and
(iii) future increase in wages and salaries.
Useful lives of property, plant and equipment
The Group reviews the estimated useful lives of property, plant and equipment at the end of each annual reporting period. During the financial year, the directors determined that there were no revisions to the useful lives of property, plant and equipment.
For
per
sona
l use
onl
y

Notes to the FiNaNcial
statemeNts 41
2 (Loss)/profit for the year
CONSOliDAteD
2011 2010$’000 $’000
(a) Other expenses
(Loss)/profit before tax includes the following specific net expenses:
Cost of sales of goods 274,424 306,829
Inventory:
Write-down of inventory to net realisable value 62 482
Reversal of write-down of inventory (567) (19)
Contractual penalties to suppliers – 452
Amortisation of other intellectual property 320 349
Amortisation of software 742 722
Total amortisation 1,062 1,071
Depreciation:
Buildings 97 90
Leasehold improvements 851 874
Plant and equipment 10,544 10,081
Total depreciation 11,492 11,045
Total depreciation and amortisation 12,554 12,116
Operating lease rental expenses
Sublease income received (332) (196)
Minimum lease payments 15,786 14,918
15,454 14,722
Other charges against assets
Impairment of trade receivables 288 752
Employee benefit expense
Post employment benefits:
– defined contribution plans 5,497 5,539
Equity-settled share-based payments 1,222 3,724
Termination benefits 215 595
Other employee benefits 74,006 75,602
80,940 85,460
Finance costs
Interest and finance charges paid/payable
– Other persons 1,787 3,238
Net finance costs are compromised of:
Interest on bank overdrafts and loans 1,787 3,238
Total interest expense 1,787 3,238
(b) gains and losses
Net loss on foreign exchange (5) (4)
Net (loss)/gain on disposal of property, plant and equipment (645) 129
Net loss on deregistration of a foreign subsidiary (567) –
For
per
sona
l use
onl
y

C apr al annual report 201142
3 Revenue and other income
CONSOliDAteD
2011 2010$’000 $’000
revenue from continuing operations
Sales revenue – sale of goods 325,014 374,235
Other revenue
Scrap revenue 23,233 25,214
Interest – other 315 217
Total other revenue 23,548 25,431
Other income
Discount on acquisition of a subsidiary – 804
Royalties 351 248
Government grants and dividends 155 155
Net gain on disposal of property, plant and equipment – 129
Other income 518 609
1,024 1,945
4 income tax expense(a) income tax comprises:
Deferred tax benefit – 2,650
(b) reconciliation of income tax benefit to prima facie tax payable
(Loss)/profit from continuing operations before income tax expense (7,997) 4,082
Income tax calculated @ 30% (2010:30%) (2,399) 1,225
Tax effect of non-assessable / non-deductible items:
Effect of revenue that is exempt from taxation – (242)
Effect of expenses that are not deductible in determining taxable profit 566 1,582
Effect of tax losses utilised – (2,565)
Previously unrecognised and unused tax losses now recognised deferred tax assets – (2,650)
Effect of unused tax losses not recognised as deferred tax assets 1,833 –
Income tax benefit – (2,650)
(c) tax losses
Accumulated unused gross tax losses for which no deferred tax asset has been recognised 274,957 269,535
Potential tax benefit @ 30% (2010:30%) 82,487 80,861
All unused tax losses were incurred by Australian entities
5 Changes in accounting estimatesThere were no changes in accounting estimates during the financial year (2010: Changes to the method of estimating provision for doubtful debts were made).
For
per
sona
l use
onl
y
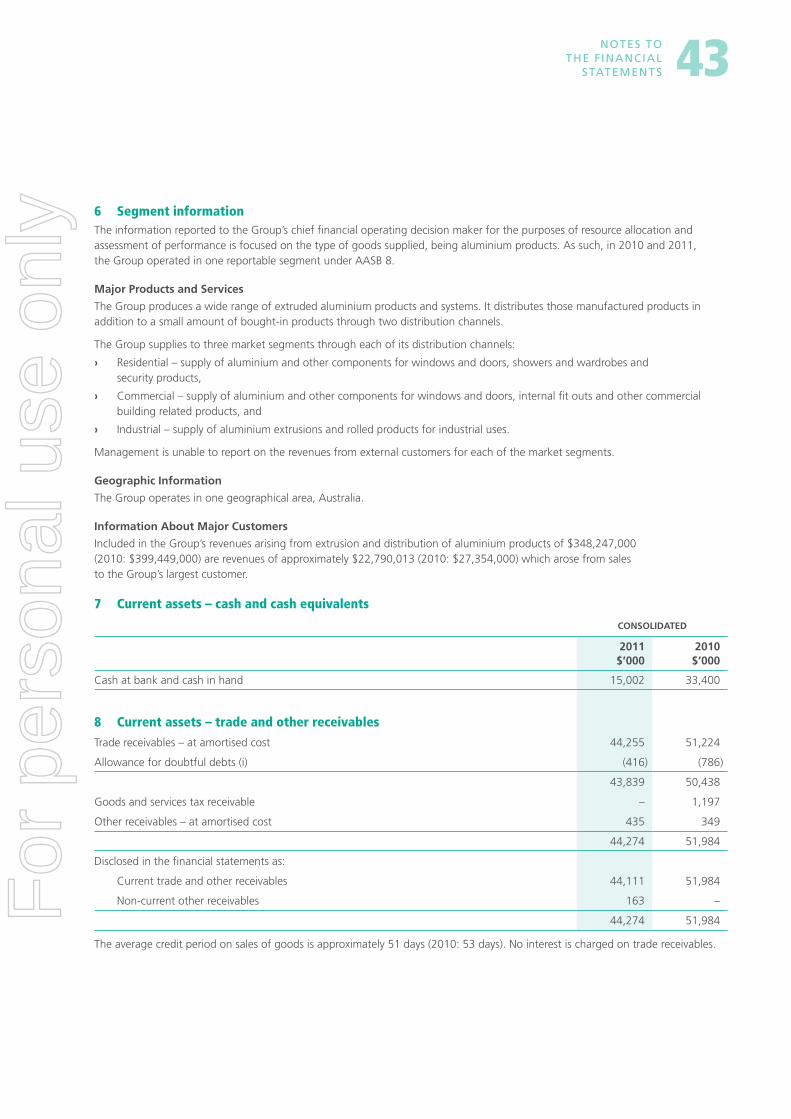
Notes to the FiNaNcial
statemeNts 43
6 Segment informationThe information reported to the Group’s chief financial operating decision maker for the purposes of resource allocation and assessment of performance is focused on the type of goods supplied, being aluminium products. As such, in 2010 and 2011, the Group operated in one reportable segment under AASB 8.
Major products and Services
The Group produces a wide range of extruded aluminium products and systems. It distributes those manufactured products in addition to a small amount of bought-in products through two distribution channels.
The Group supplies to three market segments through each of its distribution channels:
› Residential – supply of aluminium and other components for windows and doors, showers and wardrobes and security products,
› Commercial – supply of aluminium and other components for windows and doors, internal fit outs and other commercial building related products, and
› Industrial – supply of aluminium extrusions and rolled products for industrial uses.
Management is unable to report on the revenues from external customers for each of the market segments.
geographic information
The Group operates in one geographical area, Australia.
information About Major Customers
Included in the Group’s revenues arising from extrusion and distribution of aluminium products of $348,247,000 (2010: $399,449,000) are revenues of approximately $22,790,013 (2010: $27,354,000) which arose from sales to the Group’s largest customer.
7 Current assets – cash and cash equivalents
CONSOliDAteD
2011 2010$’000 $’000
Cash at bank and cash in hand 15,002 33,400
8 Current assets – trade and other receivablesTrade receivables – at amortised cost 44,255 51,224
Allowance for doubtful debts (i) (416) (786)
43,839 50,438
Goods and services tax receivable – 1,197
Other receivables – at amortised cost 435 349
44,274 51,984
Disclosed in the financial statements as:
Current trade and other receivables 44,111 51,984
Non-current other receivables 163 –
44,274 51,984
The average credit period on sales of goods is approximately 51 days (2010: 53 days). No interest is charged on trade receivables.
For
per
sona
l use
onl
y

C apr al annual report 201144
8 Current assets – trade and other receivables (Cont’d)During both the Financial Year and 2010 the provision has been based on a percentage of the total debt for customers who are subject to formal payment plans or legal action and 1.75% of the 90 day and over balances. The provision for doubtful debts is reviewed each month and necessary adjustments made to the provision. The provision is based on estimated irrecoverable amounts from the sale of goods, determined by reference to past experience and knowledge of customers. Allowances are made for known doubtful debts at the time of appointment of administrators, liquidators or other formal insolvency events.
Included in the Group’s trade receivables are debtors with balances in 61 days and over of $0.730 million (2010: $1.301 million). No further amount has been provided for as the Group believes that this past due balance is still considered recoverable. The Group does not hold any collateral over these balances, but does hold trade indemnity insurance for 90% of the amount outstanding, after applying the deductible, of certain receivables. The average age of these receivables is 98 days (2010: 91 days).
Aging past due but not impaired:
CONSOliDAteD
2011 2010$’000 $’000
1–30 days past due 876 1,221
31–60 days past due 553 192
61+ days past due 532 961
Total 1,961 2,374
Included in the allowance for doubtful debts are individually impaired trade receivables with a balance of $198,000 (2010: $354,000). The impairment recognised represents the difference between the carrying amount of these trade receivables and the present value of the expected proceeds.
CONSOliDAteD
2011 2010$’000 $’000
1–30 days past due – 13
31–60 days past due – 1
61+ days past due 198 340
Total 198 354
(i) Movement in the allowance for doubtful debts.
Balance at beginning of the financial year (786) (735)
Amounts written off during the financial year 288 752
Decrease/(increase) in allowance recognised in profit or loss 82 (803)
Balance at end of the financial year (416) (786)
In determining the recoverability of a trade receivable the Group considers any change in the credit quality of the trade receivable from the date credit was initially granted up to the reporting date. The Group and Company do not have any significant exposure to any individual customer or counterparty.
Major concentrations of credit risk are in the construction, transport, consumer durable and electrical industries in Australia. Furthermore, the Company has credit insurance cover which requires ongoing management of credit accounts with monthly reports provided to the Insurer. Accordingly, there is no further credit provision required in excess of the allowance for doubtful debts.
For
per
sona
l use
onl
y

Notes to the FiNaNcial
statemeNts 45
9 Current assets – inventories
CONSOliDAteD
2011 2010$’000 $’000
Raw materials and stores 16,463 19,485
Work in progress 1,610 2,129
Finished goods 38,984 42,089
57,057 63,703
All inventories are expected to be recovered within 12 months.
10 Current assets – prepayments Prepayments 2,563 2,647
11 deferred tax assetsDeferred tax assets 2,857 2,857
The Group has recognised deferred tax assets of $2,857,000 (2010: $2,857,000) (the Company $2,650,000 – 2010: $2,650,000) based upon the forecasted operational performance and more than probable recovery in the shorter term of these prior year losses.
12 non-current assets – investmentsDetails of subsidiaries
The financial statements incorporate the assets, liabilities and results of the following subsidiaries:
eQuitY hOlDiNg
2011 2010 COuNtrY OF
eNtitY NAMe % % iNCOrpOrAtiON
Aluminium Extrusion & Distribution Pty Limited1 100 100 Australia
Capral Superannuation Pty Limited2 100 100 Australia
Capral Wages Superannuation Pty Limited2 100 100 Australia
Aluminium Distributors Pty Limited2 100 100 Australia
Capral Finance Pty Limited2 100 100 Australia
Capral Aluminium NZ Limited3,5 100 100 New Zealand
Austex Dies Pty Limited4 100 100 Australia
1 Subsidiary has been granted relief from the necessity to prepare financial reports in accordance with Class Order 98/1418 issued by ASIC. The Company and Aluminium Extrusion & Distribution Pty Limited have entered into a deed of cross guarantee (Deed).
2 On 27 March 2009, the wholly owned Australian subsidiaries were added to the Deed.
3 On 27 March 2009, a separate deed of cross guarantee was put in place for Capral Aluminium NZ Limited as it is a non-Australian subsidiary. The deed has been revoked on 28 November 2011 as a result of deregistration of the company.
4 Acquired on 17 September 2010 by Capral Limited.
5 Deregistration confirmed by New Zealand Company Registrar on 15 December 2011 and removed from New Zealand Company Registrar on 27 January 2012. The results of the group included the results of Capral Aluminium NZ Limited until 15 December 2011.F
or p
erso
nal u
se o
nly

C apr al annual report 201146
13 Related partiesparent entities
The ultimate parent entity within the Group is Capral Limited.
equity interests in controlled entities
Interests in controlled entities are set out in Note 12.
transactions with key management personnel
Refer to Note 37 in relation to securities granted and forfeited during the Financial Year under the Long Term Incentive Plan that include:
› rights granted to Capral’s Chief Financial Officer, Executive General Manager, Manufacturing and Company Secretary (who are key management personnel);
› rights and/or options forfeited by Capral’s previous Chief Financial Officer and previous Executive General Manager, Distribution (who were key management personnel).
Details of the compensation of, and transactions with, each Director of the Company and key management personnel of the Group are set out in the Directors’ Report and in particular, the Remuneration Report.
transactions with other related parties
In 2011, as the parent entity in the consolidated entity, the Company had no loans advanced from controlled entities (2010: $66.7 million). The prior year loans were settled during the Financial Year as part of a distribution arising from the deregistration of a controlled entity. The Company has entered into transactions with controlled entities and as a result has accrued interest expense of $0.2 million (2010: $1.2 million) and incurred rental expense of $0.6 million (2010: $0.4 million) in the Financial Year. These transactions were conducted on commercial terms and conditions at market rates.
14 business combinations
DAte OF ACQuiSitiON
prOpOrtiON OF ShAreS ACQuireD
CONSiDerAtiON trANSFerreD
(%) $’000
Subsidiary acquired
2010
Austex Dies Pty Limited 17/9/2010 100 1,100
Principal activity: manufacture of dies
CONSOliDAteD
2011 2010$’000 $’000
Consideration transferred
Cash – 1,100
Total consideration transferred – 1,100
In 2010, acquisition-related costs amounting to $53,215 have been excluded from the consideration transferred and have been recognised as an expense in the period, within the ‘Other expenses’ line item in the Consolidated Statement of Comprehensive Income.F
or p
erso
nal u
se o
nly

Notes to the FiNaNcial
statemeNts 47
CONSOliDAteD
2011 2010$’000 $’000
Assets acquired and liabilities assumed at the date of acquisition
Current assets
Trade and other receivables – 1,395
Inventories – 280
Non-current assets
Fixed assets – 1,242
Deferred tax assets – 207
Current liabilities
Overdraft facility – (157)
Trade and other payables – (458)
Employee benefits – (605)
Total – 1,904
In 2010, the receivables acquired (which principally comprised trade receivables) in this transaction with a fair value of $1,395,000 had gross contractual amounts of $1,395,000 (including $977,000 of receivables from Capral). Capral believes that there is no adjustment required to the fair value of receivables at the acquisition date.
CONSOliDAteD
2011 2010$’000 $’000
Discount on acquisition
Consideration transferred – 1,100
Less: fair value of identifiable net assets acquired – (1,904)
Discount on acquisition* – (804)
* Excess of acquirer’s interest in the net fair value of acquiree’s identifiable assets, liabilities and contingent liabilities over the cost of the acquisition. Capral acquired Austex Dies Pty Limited consequent to a prior agreement without an obligation to assume all liabilities (including contingent) and assets. Consideration relative to net assets took into account Capral’s assumption of the additional transaction risk.
CONSOliDAteD
2011 2010$’000 $’000
Net cash outflow on acquisition of a subsidiary
Consideration paid in cash – 1,100
Add: cash and cash equivalent balances acquired (overdraft) – 157
Net cash outflow on acquisition of a subsidiary – 1,257
impact of acquisition on the results of the group
Included in the profit for the financial year 2010 is $13,104 attributable to the additional business generated by Austex Dies Pty Limited. Revenue for the period includes $304,906 in respect of Austex Dies Pty Limited.
Had the business combination been effected at 1 January 2010, the revenue of the Group would have been $400.3 million and the profit for the year would have been $6.9 million for the financial year 2010.
For
per
sona
l use
onl
y

C apr al annual report 201148
15 Property, plant and equipment
CONSOliDAteD
2011 2010$’000 $’000
Freehold land
At valuation 1,200 1,200
Accumulated depreciation – –
Net book amount 1,200 1,200
Buildings
At valuation 2,942 2,850
Accumulated depreciation (362) (271)
Net book amount 2,580 2,579
Leasehold improvements
At cost 9,596 10,435
Accumulated depreciation (4,538) (4,100)
Net book amount 5,058 6,335
Total land and buildings 8,838 10,114
Plant, machinery and equipment
At cost 205,571 202,334
Accumulated depreciation (108,198) (97,947)
Accumulated impairment losses (9,951) (9,951)
Net book amount 87,422 94,436
Construction work in progress at cost 2,246 751
Net plant, machinery and equipment 89,668 95,187
Total property, plant and equipment – net book value 98,506 105,301
The following useful lives are used in the calculation of depreciation:
Buildings 20–33 YearsLeasehold improvements 5–25 YearsPlant and equipment 3–25 Years
(i) Valuations of land and building:
An independent valuation of the Group’s land and buildings was performed by CB Richard Ellis (V) Pty Ltd (CBre) in 2008 to determine the fair value of the land and buildings. The valuation, which conforms to International Valuation Standards, was determined by reference to recent market transactions on arm’s length term at the time.
For
per
sona
l use
onl
y

Notes to the FiNaNcial
statemeNts 49
(ii) Carrying amounts that would have been recognised if land and buildings were stated at cost:
CONSOliDAteD
2011 2010$’000 $’000
Freehold land
At cost 1,750 1,750
Accumulated depreciation – –
Net book amount 1,750 1,750
Buildings
At cost 3,376 3,284
Accumulated depreciation (641) (550)
Net book amount 2,735 2,734
reconciliations
Reconciliations of the carrying amounts of each class of property, plant and equipment at the beginning and end of the current and prior financial year are set out below:
FreehOlD lAND At FAir
VAlueBuilDiNgS At
FAir VAlue
leASehOlD iMprOVeMeNtS
At COSt
plANt AND eQuipMeNt At
COSt
iN COurSe OF CONStruCtiON
At COSt tOtAl
$’000 $’000 $’000 $’000 $’000 $’000
Consolidated
2011
Opening net book amount 1,200 2,579 6,335 94,436 751 105,301
Additions – 95 152 2,835 2,270 5,352
Disposals – (4) (578) (70) – (652)
Transfers – 7 – 765 (775) (3)
Impairment of non-current asset – – – – – –
Depreciation charge (Note 2(a)) – (97) (851) (10,544) – (11,492)
Net book amount at 31 December 2011 1,200 2,580 5,058 87,422 2,246 98,506
2010
Opening net book amount 1,200 2,796 7,082 101,363 1,147 113,588
Additions – 6 262 1,973 698 2,939
Austex Acquisition – – 7 1,195 40 1,242
Disposals – (93) (192) (1,024) – (1,309)
Transfers – (40) 50 1,124 (1,134) –
Impairment of non-current assets – – – (114) – (114)
Depreciation charge (Note 2(a)) – (90) (874) (10,081) – (11,045)
Net book amount at 31 December 2010 1,200 2,579 6,335 94,436 751 105,301
For
per
sona
l use
onl
y

C apr al annual report 201150
16 intangibles
Other iNtelleCtuAl
prOpertY SOFtWAre tOtAl
$’000 $’000 $’000
Consolidated
2011
Cost 15,915 23,052 38,967
Accumulated amortisation (8,113) (19,922) (28,035)
Accumulated impairment losses (7,429) (2,196) (9,625)
Net book value 373 934 1,307
2010
Cost 15,915 22,932 38,847
Accumulated amortisation (7,793) (19,180) (26,973)
Accumulated impairment losses (7,429) (2,196) (9,625)
Net book value 693 1,556 2,249
impairment testing of property, plant & equipment, goodwill and other intangible assets
Where there is an indication of impairment of an asset within a cash-generating unit, AASB 136 requires that asset to be tested for impairment before testing for impairment as part of the cash-generating unit.
If there is an indication of impairment, the recoverable amount of property, plant & equipment, goodwill and other intangible assets will be determined by reference to a value in use discounted cash flow valuation of the Group, utilising financial forecasts and projections.
The valuation is based on forecast and projected cash flows for a 15 year period commencing January 2012 with a terminal value being applied at the end of this period. The forecast and projected cash flows assumptions are based on financial forecasts for the period January 2012 to December 2016. Net cash flows for subsequent financial periods are projected to grow at 3.1% (2010: 3.7%) per annum. This growth rate corresponds to the average 10 year growth rate based on external economic sources. A discount rate of 13.0% (2010: 14.50%), representing the Company’s weighted average cost of capital, has been applied to the cash flow projections.
The key assumptions used by Capral in preparing the value in use cash flow valuation for the financial year ended 31 December 2011 are as follows:
volumes
In determining assumptions in relation to sales volumes into the commercial and residential/domestic market, Capral have based these on reputable third party long term economic forecast reports with reference to historical performance and seasonal trends. Consideration was also given to both the commercial strategies being employed by the Company through its strategic initiatives across all market channels and market share recovery.
Margins
In setting price and margin assumptions, historical performance trends and the impact of previous price increases were reviewed in assessing the timing and quantum of future price increases. Recent history in relation to direct costs and the impact of higher volumes on manufacturing variances were assessed in setting assumptions on absorbed conversion costs.
working Capital and Capital Expenditure
These assumptions were set in light of the strategic initiatives and approved capital expenditure, with working capital flexed in relation to the assumed production capacity for volumes throughout the forecast period and historical performance.
For
per
sona
l use
onl
y

Notes to the FiNaNcial
statemeNts 51
Economic Factors
Assumptions including Gross Domestic Production (GDP), the Consumer Price Index (CPI), expected wage and salary increases, foreign exchange and the future impact of crude oil prices have been made with reference to third party economic forecasts and the Company’s strategic plans and budgets.
Allocation of goodwill to cash generating units
The Group operates as one indivisible cash generating unit.
Impairment of carrying value of assets
In 2011, as a result of a detailed review of the remaining useful lives and recoverability of non-current assets, Capral has determined that no impairment write-down of specific assets was necessary (2010: $114,000).
Refer below and Note 15 for further details.
Reconciliations
Reconciliations of the carrying amounts of each class of intangibles at the beginning and end of the current financial year are set out below:
Other iNtelleCtuAl
prOpertY SOFtWAre tOtAl
$’000 $’000 $’000
Consolidated
2011
Opening net book amount 693 1,556 2,249
Additions – 117 117
Transfers – 3 3
Amortisation (320) (742) (1,062)
Net book amount at 31 December 2011 373 934 1,307
2010
Opening net book amount 1,042 2,239 3,281
Additions – 39 39
Amortisation (349) (722) (1,071)
Net book amount at 31 December 2010 693 1,556 2,249
17 Assets pledged as securityIn accordance with the security arrangements of liabilities, as disclosed in Note 19 to the financial statements, all assets of the Group have been pledged as security. The holder of the security does not have the right to sell or repledge the assets other than in the event of default under the principal finance agreement where the security is enforced.
18 Current liabilities – payables
CONSOliDAteD
2011 2010$’000 $’000
Trade payables (i) 42,057 53,101
Goods and services tax payable 796 –
Other payables 8,552 11,372
51,405 64,473
(i) The average credit period on purchases is 56 days from the end of the month (2010:45 days). No interest is charged on the trade payables. The Group has financial risk management policies in place to ensure that all payables are paid within the credit timeframe.
For
per
sona
l use
onl
y

C apr al annual report 201152
19 borrowings
CONSOliDAteD
2011 2010$’000 $’000
unsecured – at amortised cost
Current
Loans from other entities 48 48
Secured – at amortised cost
Current
Revolver facility – Note 27(a)(i)* (186) –
Term loan facility – Note 27(a)(ii) – 21,722
Overdraft Facility – Note 27(a) 317 283
179 22,053
Disclosed in the financial statements as:
Current borrowings 179 22,053
179 22,053
* includes capitalised borrowing costs in relation to the GE facilities
20 Provisions
Current
Employee benefits4 8,244 8,337
Make good on leased assets1 188 90
Restructuring and termination costs5 119 430
Other2 140 141
8,691 8,998
Non-current
Employee benefits 2,015 1,808
Make good on leased assets1 1,468 1,443
Other3 928 582
4,411 3,833
1 Provision for make good on leased assets comprises obligations relating to site closure and other costs associated with operating lease rental properties.
2 Other current provisions include provisions for customer claims including metal returns net of scrap and pricing adjustments.
3 Other non-current provisions include amounts relating to the straight-lining of fixed rate increases in rental payments.
4 The current provision for employee benefits includes $548,023 of annual leave entitlements accrued but not expected to be taken within 12 months (2010: $632,542).
5 The provision for restructuring costs represents the present value of management’s best estimate of the costs directly and necessarily caused by the restructuring that are not associated with the ongoing activities of the Group, including termination benefits.F
or p
erso
nal u
se o
nly

Notes to the FiNaNcial
statemeNts 53
20 Provisions (Cont’d)
CONSOliDAteD
MAKe gOOD ON leASeD
ASSetS Other
reStruCturiNg AND
terMiNAtiON COStS tOtAl
MOVeMeNtS iN CArrYiNg AMOuNtS $’000 $’000 $’000 $’000
Carrying value at the beginning of the financial year 1,533 723 430 2,686
Additional amounts provided 123 2,935 – 3,058
Utilised – (2,590) (311) (2,901)
Carrying value at the end of the financial year 1,656 1,068 119 2,843
21 deferred income – current
CONSOliDAteD
2011 2010$’000 $’000
Deferred government grants 155 155
Deferred income – other 178 76
333 231
22 deferred income – non-currentDeferred government grants 310 464
23 issued capital
COMpANY CONSOliDAteD
2011 2010 2011 2010No. 000 No. 000 $’000 $’000
(a) Share capital
Ordinary shares: fully paid 387,898 387,898 410,476 410,476
Changes to the then Corporations Law abolished the authorised capital and par value concept in relation to the share capital from 1 July 1998. Therefore, the Company does not have a limited amount of authorised capital and issued shares do not have a par value.
No movement in share capital in 2011 and 2010.
For
per
sona
l use
onl
y

C apr al annual report 201154
24 Reserves and accumulated losses
CONSOliDAteD
2011 2010$’000 $’000
Foreign currency translation reserve – (923)
Equity-settled compensation reserve 7,986 6,764
Actuarial loss on retirement benefit fund – (963)
7,986 4,878
Accumulated losses (262,225) (253,265)
(254,239) (248,387)
24 (a) Movements in reserves were:
Foreign currency translation reserve
Balance at the beginning of the financial year (923) (919)
Transfer to profit and loss on disposal of a foreign subsidiary 923 –
Currency translation differences arising on translation of overseas subsidiaries during the financial year
– (4)
Balance at the end of the financial year – (923)
equity-settled compensation reserve
Balance at the beginning of the financial year 6,764 3,040
Expense recognised 1,222 3,724
Balance at the end of the financial year 7,986 6,764
Actuarial gains/(losses) on retirement benefit fund
Balance at the beginning of the financial year (963) (963)
Transfer to accumulated losses 963 –
Balance at the end of the financial year – (963)
24 (b) Accumulated losses
Balance at the beginning of the financial year (253,265) (259,997)
Transfer of actuarial losses on retirement benefit plan (963) –
Net (loss)/gain attributable to members of Capral Limited (7,997) 6,732
Balance at the end of the financial year (262,225) (253,265)
25 dividendsOrdinary shares: Nil (2010:Nil) – –
Franking credits
Franking credits available for subsequent financial years based on a tax rate of 30% (2010:30%) 27,105 27,105For
per
sona
l use
onl
y

Notes to the FiNaNcial
statemeNts 55
26 Earnings/(loss) per share
CONSOliDAteD
2011 CeNtS per
ShAre
2010 CeNtS per
ShAre
Basic and diluted (loss)/earnings per share (2.1) 1.7
The weighted average number of ordinary shares on issue used in the calculation of basic and diluted earnings per share was 387,898,255 (2010: 387,898,255). Loss used in the calculation of basic and diluted loss per share for 2011 was $7,997,000 (2010: profit $6,732,000).
There are 29,959,906 (2010: 28,217,496) performance rights and options, with the potential to dilute future earnings at the end of the Financial Year. As at balance date, these potential and contingently issuable shares are not dilutive and are therefore excluded from the weighted average number of ordinary shares for the purposes of diluted earnings per share.
27 Stand by arrangement and credit facilities
CONSOliDAteD
2011 2010$’000 $’000
Secured bank loan facilities with various maturing dates through to 2014.
Amount used 317 22,005
Amount unused 78,578 46,472
Total available facilities 78,895 68,477
a) 2011 Financial Arrangements
In 2011, the Company’s financing comprised a renewal of existing arrangements with GE Commercial Corporation (Australia) Pty Ltd (GE), with a facility of up to $90 million. The term of this facility ends on 30 June 2014. The facility is fully secured and consists of the following:
i. A $60 million revolver facility for a term of 3 years with an interest rate of the 90 day bank bill swap plus a margin rate of 2.00% (2010: 2.00%). Part of the revolver facility is a receivables purchase facility whereby the Company has agreed to sell its receivables to the financier, in return for funding, based on the level of the receivables balance in the revolving account available to be drawn, contingent on the Company meeting its obligations set out in the facility agreement.
ii. Up to $30 million term loan facility for a term of 3 years with an interest rate of the 90 day bank bill swap rate plus a margin rate of 2.50% (2010: 2.50%).
In July 2011, Austex Dies Pty Limited (a fully owned subsidiary of the Company) maintained the Overdraft Facility with the Australia and New Zealand Banking Group Limited of up to $400,000 with an interest rate of the bank reference rate minus a margin rate of 5% (2010: bank bill swap reference rate plus a margin rate of 1.35%). The overdraft facility is fully secured by bank guarantee.
b) 2010 Financial Arrangements In 2010, the Company’s financing comprised the existing arrangements with GE of up to $104.5 million. The term of this
facility was due to expire on 30 September 2011, before it was renewed as detailed above. The facility was fully secured and consisted of the following:
i. A $70 million revolver facility for a term of 3 years with an interest rate of the 90 day bank bill plus a margin rate of 2.00% (2009: 2.00%). Part of the revolver facility was a receivables purchase facility whereby the Company agreed to sell its receivables to the financier, in return for funding, based on the level of the receivables balance in the revolving account available to be drawn, contingent on the Company meeting its obligations set out in the facility agreement.
ii. A $34.5 million term loan facility for a term of up to 3 years with an interest rate of the 90 day bank bill rate plus a margin rate of 2.50% (2009: 2.50%).
On 17 September 2010, Austex Dies Pty Limited undertook an Overdraft Facility with the Australia and New Zealand Banking Group Limited of up to $400,000 with an interest rate of the bank bill swap reference rate plus a margin rate of 1.35%. The overdraft facility was fully secured by bank guarantee.
For
per
sona
l use
onl
y

C apr al annual report 201156
28 Commitments for expenditure – capital
CONSOliDAteD
2011 2010$’000 $’000
Commitments for the acquisition of plant and equipment contracted for at the reporting date but not recognised as liabilities payable:
Within one year 969 669
29 Commitments for expenditure – operating leasesCommitments for minimum lease payments in relation to non-cancellable operating leases for office and plant premises are payable as follows:
Within one year 17,868 17,138
Later than one year but not later than five years 59,174 58,325
Later than five years 63,562 70,369
140,604 145,832
Operating leases relate to warehouse facilities with lease terms of between 2 to 5 years, with options to extend for a further 5 years. The Group does not have an option to purchase the leased asset at the expiry of the lease period.
Non-cancellable operating lease receivable
Within one year 818 189
Later than one year but not later than five years 1,834 84
Later than five years – –
2,652 273
For
per
sona
l use
onl
y

Notes to the FiNaNcial
statemeNts 57
30 deed of Cross GuaranteePursuant to ASIC Class Order 98/1418, the wholly owned subsidiary, Aluminium Extrusion and Distribution Pty Limited (AeD) is relieved from the Corporations Act 2001 requirement for the preparation, audit and lodgement of financial reports.
It is a condition of that class order that the Company and AED enter into a Deed of Cross Guarantee (Deed). Under the Deed the Company guarantees the payment of all debts of AED in full, in the event of a winding up. AED in turn has guaranteed the payment of the debts of the Company in full in the event that it is wound up.
On 27 March 2009, the other wholly owned Australian subsidiaries of the Company (Capral Wages Superannuation Pty Limited, Capral Superannuation Pty Limited, Capral Finance Pty Limited and Aluminium Distributors Pty Limited) were added to the Deed.
For the 2011 and 2010 financial years, the closed group represents the Company and its wholly owned Australian subsidiaries of the Company (except for Austex Dies Pty Limited).
ClOSeD grOup
2011 2010$’000 $’000
Statement of comprehensive income
Revenue 347,644 399,353
Other income1 49,905 1,068
Changes in inventories of finished goods and work in progress (3,038) (3,013)
Raw materials and consumables used (195,704) (219,560)
Employee benefits expense (78,086) (84,651)
Depreciation and amortisation expense (12,296) (12,184)
Impairment of non-current assets – (114)
Finance costs (1,967) (3,527)
Freight expense (12,484) (14,982)
Occupancy costs (15,183) (14,634)
Repairs and maintenance expense (6,559) (6,827)
Other expenses (31,718) (37,381)
Profit before income tax 40,514 3,548
Income tax benefit – 2,650
Profit for the year 40,514 6,198
Other comprehensive income for the year (net of tax) – –
Total comprehensive income for the year 40,514 6,198
Summary of movements in accumulated losses
Accumulated losses at the beginning of the year (303,932) (310,130)
Profit for the year 40,514 6,198
Accumulated losses at the end of the year (263,418) (303,932)
1 Includes dividend income of $49.8m from Capral Aluminium NZ Limited – eliminated on consolidation at the end of the Financial Year.For
per
sona
l use
onl
y

C apr al annual report 201158
30 deed of Cross Guarantee (Cont’d)
ClOSeD grOup
2011 2010$’000 $’000
Statement of financial position
Current assets
Cash and cash equivalents 14,803 32,768
Trade and other receivables 42,992 42,533
Inventories 56,830 63,378
Prepayments 2,495 2,871
total current assets 117,120 141,550
Non current assets
Other receivables 88 –
Deferred tax assets 2,650 2,650
Investment in subsidiaries 1,100 1,100
Property, plant and equipment 97,443 104,083
Other intangible assets 1,307 2,249
total non current assets 102,588 110,082
total assets 219,708 251,632
liABilitieS
Current liabilities
Trade and other payables 51,206 103,173
Borrowings 179 21,770
Provisions 8,225 8,853
Deferred income 333 231
total current liabilities 59,943 134,027
Non current liabilities
Borrowings –
Provisions 4,411 3,833
Deferred income 310 464
total non current liabilities 4,721 4,297
total liabilities 64,664 138,325
Net ASSetS 155,044 113,308
eQuitY
Issued capital 410,476 410,476
Reserves 7,986 6,764
Accumulated losses (263,418) (303,932)
tOtAl eQuitY 155,044 113,308
For
per
sona
l use
onl
y
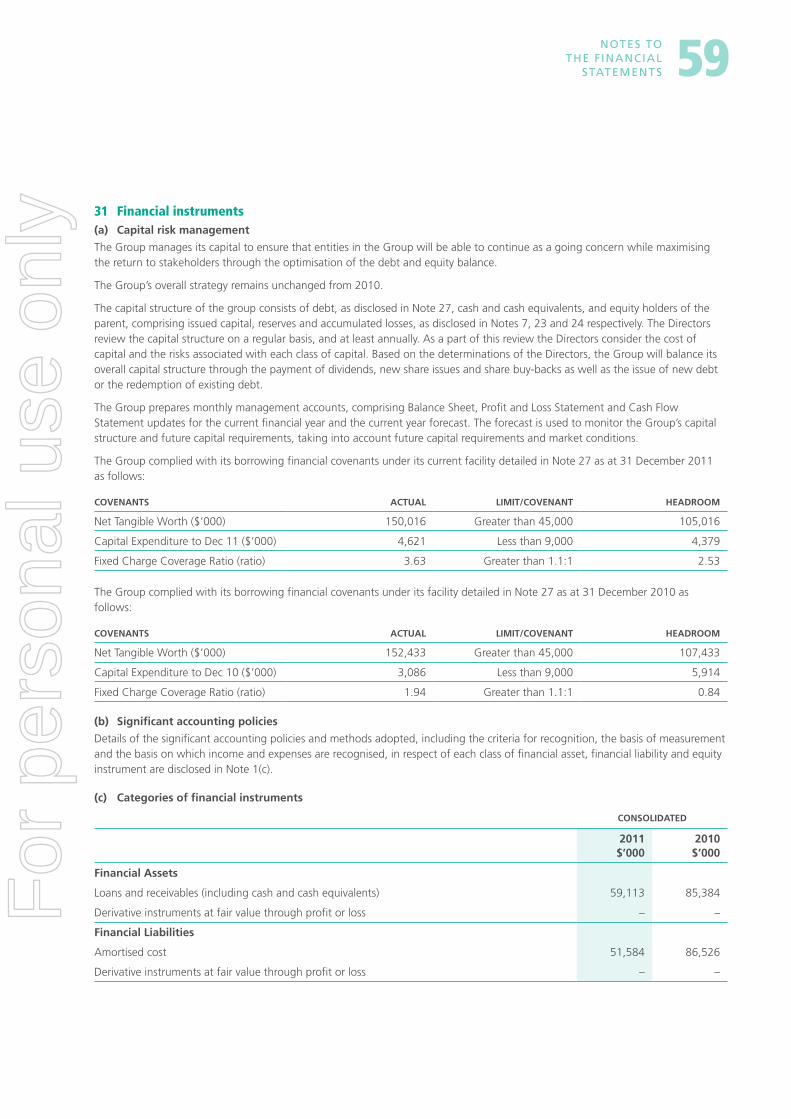
Notes to the FiNaNcial
statemeNts 59
31 Financial instruments(a) Capital risk management
The Group manages its capital to ensure that entities in the Group will be able to continue as a going concern while maximising the return to stakeholders through the optimisation of the debt and equity balance.
The Group’s overall strategy remains unchanged from 2010.
The capital structure of the group consists of debt, as disclosed in Note 27, cash and cash equivalents, and equity holders of the parent, comprising issued capital, reserves and accumulated losses, as disclosed in Notes 7, 23 and 24 respectively. The Directors review the capital structure on a regular basis, and at least annually. As a part of this review the Directors consider the cost of capital and the risks associated with each class of capital. Based on the determinations of the Directors, the Group will balance its overall capital structure through the payment of dividends, new share issues and share buy-backs as well as the issue of new debt or the redemption of existing debt.
The Group prepares monthly management accounts, comprising Balance Sheet, Profit and Loss Statement and Cash Flow Statement updates for the current financial year and the current year forecast. The forecast is used to monitor the Group’s capital structure and future capital requirements, taking into account future capital requirements and market conditions.
The Group complied with its borrowing financial covenants under its current facility detailed in Note 27 as at 31 December 2011 as follows:
COVeNANtS ACtuAl liMit/COVeNANt heADrOOM
Net Tangible Worth ($’000) 150,016 Greater than 45,000 105,016
Capital Expenditure to Dec 11 ($’000) 4,621 Less than 9,000 4,379
Fixed Charge Coverage Ratio (ratio) 3.63 Greater than 1.1:1 2.53
The Group complied with its borrowing financial covenants under its facility detailed in Note 27 as at 31 December 2010 as follows:
COVeNANtS ACtuAl liMit/COVeNANt heADrOOM
Net Tangible Worth ($’000) 152,433 Greater than 45,000 107,433
Capital Expenditure to Dec 10 ($’000) 3,086 Less than 9,000 5,914
Fixed Charge Coverage Ratio (ratio) 1.94 Greater than 1.1:1 0.84
(b) Significant accounting policies
Details of the significant accounting policies and methods adopted, including the criteria for recognition, the basis of measurement and the basis on which income and expenses are recognised, in respect of each class of financial asset, financial liability and equity instrument are disclosed in Note 1(c).
(c) Categories of financial instruments
CONSOliDAteD
2011 2010$’000 $’000
Financial Assets
Loans and receivables (including cash and cash equivalents) 59,113 85,384
Derivative instruments at fair value through profit or loss – –
Financial liabilities
Amortised cost 51,584 86,526
Derivative instruments at fair value through profit or loss – –
For
per
sona
l use
onl
y

C apr al annual report 201160
31 Financial instruments (Cont’d)(d) Financial risk management objectives
The Group’s treasury function monitors and manages the financial risks relating to the operations of the Group through internal risk reports. These risks include market risk (including currency risk, interest rate risk and equity price risk), credit risk and liquidity risk. These risks are analysed below.
(e) Market risk
The Group’s activities expose it primarily to the financial risks of changes in foreign currency exchange rates (refer note 31(f)) and interest rates (refer note 31(g)). From time to time, the Group enters into a variety of derivative financial instruments to manage its exposure to interest rate and foreign currency risk, including:
(i) foreign exchange forward contracts to hedge the exchange rate risk arising on the purchase of aluminium rolled product from overseas in US dollars; and
(ii) interest rate options to mitigate the risk of rising interest rates.
At a Group and Company level, market risk exposures are measured using a sensitivity analysis. There has been no material change to the Group’s exposure to market risks or the manner in which it manages and measures the risk during the financial year.
(f) Foreign currency risk management
The Group undertakes certain transactions in foreign currencies, resulting in exposures to exchange rate fluctuations. Exchange rate exposures are managed within approved policy parameters utilising forward foreign exchange contracts. It is the policy of the Group to enter into forward foreign exchange contracts from time to time to manage the risk associated with anticipated foreign currency sales and purchase transactions.
The carrying amount of the Group’s and Company’s foreign currency denominated monetary assets and monetary liabilities at the reporting date is as follows:
CONSOliDAteD
2011 2010$’000 $’000
EURO (trade payables) 72 34
USD (trade payables) – 33
NZD (trade payables) – 13
Foreign currency sensitivity
The Group is exposed to Euros (2010: Euros and US dollars).
The Group’s exposure to foreign currency risk at reporting date was considered insignificant and as a result the Group did not enter into foreign exchange forward contracts. The Group’s exposure to foreign exchange rate fluctuations was limited to trade payables outstanding at reporting date denominated in currencies other than Australian dollar (AUD). The total value of trade payables denominated in currencies other than the AUD at reporting date was $72,000 (2010: $80,000).
The following table details the Group’s sensitivity to a 10% increase and decrease in the AUD against the relevant foreign currency. 10% represents management’s assessment of the possible change in foreign exchange rates. The sensitivity analysis includes only foreign currency denominated monetary items outstanding at 31 December 2011 and 31 December 2010 and adjusts their translation at the period end for a 10% change in foreign currency rates. A positive number indicates an increase in profit.
CONSOliDAteD
2011 2010$’000 $’000
Profit or loss (after tax)
– AUD strengthens by 10% 7 8
– AUD weakens by 10% (7) (8)
For
per
sona
l use
onl
y

Notes to the FiNaNcial
statemeNts 61
(g) interest rate risk management
The Group interest rate risk arises from borrowings, cash and derivatives.
The Group is exposed to interest rate risk as the Group borrows funds at floating interest rates. The risk is managed by the Group by maintaining an appropriate mix between fixed and floating rate borrowings, and by the use of interest rate options. Hedging activities are evaluated regularly to align with interest rate views and defined risk appetite, ensuring optimal hedging strategies are applied, by either positioning the balance sheet or protecting interest expense through different interest rate cycles.
The Group’s exposures to interest rates on financial assets and financial liabilities are detailed below.
Interest rate sensitivity
The sensitivity analysis below shows the effect on profit or loss after tax for the financial year if there is a change in interest rates with all other variables held constant. This is determined by applying the change in interest rates to both derivative and non-derivative instruments at the reporting date that have an exposure to interest rate changes. A 50 basis point (0.5%) increase and a 50 basis point (0.5%) decrease represents management’s assessment of the possible change in interest rates (2010: 80bp or 0.8% increase and 80bp or 0.8% decrease). A positive number indicates an increase in profit.
CONSOliDAteD
2011 2010$’000 $’000
profit or loss (after tax)
Impact of a 50bp (2010: 80bp) increase in AUD interest rates
– Cash and cash equivalents 53 185
– Floating rate debt (1) (124)
Impact of a 50bp (2010: 80bp) decrease in AUD interest rates
– Cash and cash equivalents (53) (185)
– Floating rate debt 1 124
(h) Credit risk management
Credit risk refers to the risk that a counterparty will default on its contractual obligations resulting in financial loss to the Group. The Group has exposures to credit risk on cash and cash equivalents, receivables and derivative financial assets. The credit risk on financial assets of the Group which have been recognised on the balance sheet, other than investments in shares, is generally the carrying amount, net of any allowances for doubtful debts.
The Group does not have any significant exposure to any individual customer or counterparty. Major concentrations of credit risk are in the construction, transport, consumer durable and electrical industries in Australia. The Company has credit insurance cover which requires ongoing management of credit accounts with monthly reports provided to the Insurer. Experienced credit management and associated internal policies ensure constant monitoring of the credit risk for the Company.
There is no concentration of credit risk with respect to receivables as the Group has a large number of customers.
The ageing of receivables is detailed below:
CONSOliDAteD
2011 2010$’000 $’000
Current 42,096 48,496
1–30 days 876 1,234
31–60 days 553 193
60+ days 730 1,301
44,255 51,224
For
per
sona
l use
onl
y

C apr al annual report 201162
31 Financial instruments (Cont’d)(i) liquidity risk management
Ultimate responsibility for liquidity risk management rests with the Board of Directors, who have built an appropriate liquidity risk management framework for the management of the Group’s short, medium and long-term funding and liquidity management requirements. The Group manages liquidity risk by maintaining adequate banking facilities and reserve borrowing facilities, complying with covenants, monitoring forecast and actual cash flows, and matching the maturity profiles of financial assets and liabilities. Included in note 27 is a list of additional undrawn facilities that the Group has at its disposal to further reduce liquidity risk.
Liquidity and interest risk tables
Financial assets are made up of cash of $15,002,000 (2010: $33,400,000) and trade and other receivables of $44,274,000 (2010: $51,984,000). Cash is liquid and trade and other receivables are expected to be realised on average within 51 days. Cash balances earn 3.3% interest per annum (2010: 4.6%). Trade and other receivables are interest-free.
The following table details the Group’s remaining contractual maturity for its non-derivative financial liabilities. The table has been drawn up based on the undiscounted cash flows of financial liabilities based on the earliest date on which the Group can be required to pay. The table includes both interest and principal cash flows. The contractual maturity is a fair representation of management’s expectations of actual repayments.
WeighteD AVerAge eFFeCtiVe
iNtereSt rAte
leSS thAN
1 YeAr1 – 3
YeArS3 – 5
YeArS
greAter thAN
5 YeArS
% $’000 $’000 $’000 $’000
Consolidated
2011
Trade and other payables – 51,405 – – –
Floating rate debt 7.32% 317 – – –
51,722 – – –
2010
Trade and other payables – 64,473 – – –
Floating rate debt 8.75% 23,266 – – –
87,739 – – –
(j) Fair value of financial instruments
The fair values of financial assets, financial liabilities and derivative instruments are determined as follows:
(i) the fair value of financial assets and financial liabilities (excluding derivative instruments) are determined in accordance with generally accepted pricing models based on the discounted cash flow analysis using prices from observable market data; and
(ii) the fair value of derivative instruments are calculated using quoted prices. Where such prices are not available, the discounted cash flow analysis is employed using observable market data for non-option derivatives. For option derivatives, option pricing models are used with key inputs sourced from observable market data.
The Directors consider that the carrying amounts of financial assets and financial liabilities recorded at amortised cost in the financial statements approximate their fair values.F
or p
erso
nal u
se o
nly

Notes to the FiNaNcial
statemeNts 63
32 Contingent liabilitiesClaims and possible claims, indeterminable in amount, have arisen in the ordinary course of business against entities in the consolidated entity. Based on legal advice obtained, the Directors believe that any resulting liability will not materially affect the financial position of the consolidated entity.
The Company’s bankers have granted guarantees in respect of rental obligations on lease commitments, use of utilities infrastructure and corporate credit cards. At 31 December 2011 these guarantees totalled $4,896,301 (2010: $5,490,924).
33 Remuneration of auditors
CONSOliDAteD
2011 2010$ $
During the year the auditor of the parent entity and its related practices earned the following remuneration:
Auditor of the parent entity
Audit or review of financial reports of the entity or any entity in the consolidated entity 368,000 460,000
Other non-audit services
– tax compliance and consulting 337,214 197,235
Total remuneration 705,214 657,235
It is the Group’s policy to employ the Company’s auditors, Deloitte Touche Tohmatsu, on assignments additional to their statutory duties where their expertise and experience is considered invaluable to the assignment. It is the Group’s policy to seek tenders for all other work, in particular, due diligence and major consulting projects.
34 Events after reporting dateNo matter or circumstance has arisen since the end of the financial year that has significantly affected, or may significantly affect the Group’s operations, the results of those operations or the Group’s state of affairs in future financial years.
For
per
sona
l use
onl
y

C apr al annual report 201164
35 notes to the cash flow statement
CONSOliDAteD
2011 2010$’000 $’000
(i) Reconciliation of cash and cash equivalents
reconciliation of cash and cash equivalents
For the purposes of the Cash Flow Statement, cash and cash equivalents includes cash on hand and at bank and short term deposits at call net of bank overdrafts. Cash as at the end of the financial year as shown in the Cash Flow Statement is reconciled to the related items in the Balance Sheet as follows:
Cash at bank and on hand 15,002 33,400
Overdraft facility (317) (283)
14,685 33,117
(ii) Reconciliation of profit/(loss) for the year to net cash flows from operating activities
(Loss)/profit for the year (7,997) 6,732
Non-cash items:
Depreciation and amortisation of non-current assets 12,554 12,116
Impairment of non-current assets – 114
Discount on acquisition – (804)
Allowance for doubtful trade debts (370) 51
Loss/(gain) on sale of property, plant and equipment 645 (129)
Loss on sale of a subsidiary 567 –
Share-based payments expense 1,222 3,724
Interest expense accrued but not paid 220 541
Interest income reclassified to investing activities (315) (212)
Change in assets and liabilities:
Increase in net deferred taxes – (2,650)
Decrease in current receivables 8,243 8,784
Decrease/(increase) in inventories 6,645 (14,698)
Decrease in prepayments 84 34
Increase in non-current receivables (163) –
(Decrease)/increase in trade payables and payables (12,711) 6,460
Increase/(decrease) in employee benefit provisions 113 (202)
Increase in other provisions 158 171
Decrease in deferred income (52) (234)
Net cash used in operating activities 8,843 19,798
(iii) Details of finance facilities are included in note 27 to the financial statements.
(iv) Non-cash financing activities
There were no non-cash financing activities during the Financial Year and the 2010 year.
For
per
sona
l use
onl
y

Notes to the FiNaNcial
statemeNts 65
36 Parent entity disclosures
COMpANY
2011 2010$’000 $’000
Financial position
Assets
Current assets 117,522 150,662
Non-current assets 94,114 133,162
Total assets 211,636 283,824
liabilities
Current liabilities to third parties 26,720 94,795
Current liabilities to controlled entities 16,583 84,146
Non-current liabilities 4,721 4,329
Total liabilities 48,024 183,270
equity
Issued capital 410,476 410,476
Accumulated losses (254,850) (316,686)
reserves
Equity-settled compensation reserve 7,986 6,764
Total Equity 136,581 100,554
Financial performance
Profit for the year 61,836 5,591
Other comprehensive income – –
Total comprehensive income 61,836 5,591
guarantees entered into by the parent entity in relation to the debts of its subsidiaries
Deed of cross guarantee – refer Note 30 – –
Contingent liabilities of the parent entity
Refer note 32
Commitments for the acquisition of property, plant and equipment by the parent entity
Commitments for the acquisition of property, plant and equipment by the parent entity is noted
Within one year 969 669
For
per
sona
l use
onl
y

C apr al annual report 201166
37 Share-based payments performance rights
Executive and senior Management
Refer to section 1(h) of the Remuneration Report for details of rights issued under the Long Term Incentive Plan.
The following share-based payment arrangements were in existence during the current reporting period:
perFOrMANCe right SerieS (ltip)NuMBer AS
At 31 DeC 11grANt
DAteeXpirY
DAte
eXerCiSe priCe
$
FAir VAlue At grANt DAte
$
Issued 16 March 20071 29,500 16/03/2007 31/12/2011 – 3.00
Issued 31 March 20082 76,000 31/03/2008 31/12/2012 – 2.50
Issued 26 March 20093 365,000 26/03/2009 31/12/2013 – 0.75
Issued 22 March 20114 1,202,841 22/03/2011 31/12/2013 – 0.24
Issued 22 March 20114 601,420 22/03/2011 31/12/2013 – 0.27
Issued 22 March 20114 601,420 22/03/2011 31/12/2013 – 0.28
Issued 14 June 20115 160,000 14/06/2011 31/12/2013 – 0.22
Issued 14 June 20115 80,000 14/06/2011 31/12/2013 – 0.26
Issued 14 June 20115 80,000 14/06/2011 31/12/2013 – 0.27
1 In accordance with the terms of the LTIP arrangement, performance rights issued during the financial year ended 31 December 2007 have an average vesting date of 22 February 2010.
2 In accordance with the terms of the LTIP arrangement, performance rights issued during the financial year ended 31 December 2008 have an average vesting date of 19 April 2010.
3 In accordance with the terms of the LTIP arrangement, performance rights issued during the financial year ended 31 December 2009 have an average vesting date of 13 April 2011.
4 In accordance with the terms of the LTIP arrangement, performance rights issued during the financial year ended 31 December 2011 have an average vesting date of 1 March 2014.
5 In accordance with the terms of the LTIP arrangement, performance rights issued during the financial year ended 31 December 2011 have an average vesting date of 1 March 2014.
The following share-based payment arrangements were in existence during the comparative reporting period:
perFOrMANCe right SerieS (ltip)
NuMBer AS At 31 DeC 10
(pOSt CONSOliDAtiON)
grANt DAte
eXpirY DAte
eXerCiSe priCe
$
FAir VAlue At grANt DAte
$ (pOSt
CONSOliDAtiON)
Issued 14 March 20061 13,500 14/03/2006 31/12/2010 – 8.60
Issued 16 March 20072 34,500 16/03/2007 31/12/2011 – 3.00
Issued 31 March 20083 96,000 31/03/2008 31/12/2012 – 2.50
Issued 26 March 20094 455,000 26/03/2009 31/12/2013 – 0.75
1 In accordance with the terms of the LTIP arrangement, performance rights issued during the financial year ended 31 December 2006 have an average vesting date of 30 June 2008.
2 In accordance with the terms of the LTIP arrangement, performance rights issued during the financial year ended 31 December 2007 have an average vesting date of 22 February 2010.
3 In accordance with the terms of the LTIP arrangement, performance rights issued during the financial year ended 31 December 2008 have an average vesting date of 19 April 2010.
4 In accordance with the terms of the LTIP arrangement, performance rights issued during the financial year ended 31 December 2009 have an average vesting date of 13 April 2011.
For
per
sona
l use
onl
y

Notes to the FiNaNcial
statemeNts 67
perFOrMANCe rightS (ltip)
iNputS iNtO the MODel14 JuNe
201122 MArCh
201126 MArCh
200931 MArCh
200816 MArCh
2007
Grant date 14/06/2011 22/03/2011 26/03/2009 31/03/2008 16/03/2007
Dividend yield 3.5% 3.3% 0% 0% 0%
Risk free yield 4.81% 4.96% 3.32% 6.05% 6.00%
Expected volatility 60% 60% 80% 55% 37%
Last testing date 31/12/2013 31/12/2013 31/12/2013 31/12/2012 31/12/2011
Exercise price n.a n.a n.a n.a. n.a.
Share price at grant date (pre consolidation) n.a n.a $0.082 $0.300 $0.74
Share price at grant date (post consolidation) $0.285 $0.30 $0.820 $3.000 $7.40
Performance right life 2.7 years 2.9 years 2.3 years 2.3 years 3.2 years
Options
Executive and senior Management
In 2011, no options to acquire ordinary shares were granted under LTIP. 854,771 options issued in 2009 and 2010 were forfeited due to the departure from employment with Capral of option holders. 2,463,725 options remain outstanding at the end of the Financial Year (2010: 3,318,496).
In 2010, 459,000 options to acquire ordinary shares were granted under LTIP as part of the 2010 offer to Capral’s Chief Financial Officer. These options have expired due to his departure from employment with Capral in 2011. 1,012,500 options issued in 2009 lapsed due to the departure from employment with Capral of option holders. 3,318,496 options were outstanding at the end of 2010 (2009: 3,871,996).
The following share-based payment arrangements were in existence during the current reporting period:
OptiONS (ltip)
NuMBer (pOSt
CONSOliDAtiON)grANt
DAteeXpirY
DAte
eXerCiSe priCe
$ (pOSt
CONSOliDAtiON)
FAir VAlue At grANt DAte
$ (pOSt
CONSOliDAtiON)
Issued 16 October 20091 1,231,863 16/10/2009 16/10/2014 0.25 0.29
Issued 16 October 20092 615,931 16/10/2009 16/10/2014 0.40 0.26
Issued 16 October 20092 615,931 16/10/2009 16/10/2014 0.60 0.23
1 In accordance with the terms of the LTIP arrangement, options issued during the financial year ended 31 December 2009 and the Financial Year have a vesting date of 16 October 2011.
2 In accordance with the terms of the LTIP arrangement, options issued during the financial year ended 31 December 2009 and the Financial Year have a vesting date of 16 October 2012.
For
per
sona
l use
onl
y

C apr al annual report 201168
37 Share-based payments (Cont’d)The following share-based payment arrangements were in existence during the comparative reporting period:
OptiONS (ltip)
NuMBer (pOSt
CONSOliDAtiON)grANt
DAteeXpirY
DAte
eXerCiSe priCe
$ (pOSt
CONSOliDAtiON)
FAir VAlue At grANt DAte
$ (pOSt
CONSOliDAtiON)
Issued 16 October 20091 1,429,748 16/10/2009 16/10/2014 0.25 0.29
Issued 16 October 20092 714,874 16/10/2009 16/10/2014 0.40 0.26
Issued 16 October 20092 714,874 16/10/2009 16/10/2014 0.60 0.23
Issued 1 March 20101 229,500 1/3/2010 16/10/2014 0.25 0.14
Issued 1 March 20102 114,750 1/3/2010 16/10/2014 0.40 0.12
Issued 1 March 20102 114,750 1/3/2010 16/10/2014 0.60 0.10
1 In accordance with the terms of the LTIP arrangement, options issued during the financial year ended 31 December 2009 and the Financial Year have a vesting date of 16 October 2011.
2 In accordance with the terms of the LTIP arrangement, options issued during the financial year ended 31 December 2009 and the Financial Year have a vesting date of 16 October 2012.
OptiONS (ltip)
16 OCtOBer 2009
iNputS iNtO the MODel trANChe 1 trANChe 2 trANChe 3
Grant date 16/10/2009 16/10/2009 16/10/2009
Dividend yield 0% 0% 0%
Risk free yield 5.08% 5.16% 5.16%
Expected volatility 80% 80% 80%
Expiry date 16/10/2014 16/10/2014 16/10/2014
Exercise price $0.250 $0.400 $0.600
Share price at grant date $0.42 $0.42 $0.42
Option life 5.0 years 5.0 years 5.0 years
For
per
sona
l use
onl
y

Notes to the FiNaNcial
statemeNts 69
Managing Director
During 2011, no options were issued to the Managing Director (2010: nil).
The Managing Director commenced with Capral on 15 April 2009 and does not participate in LTIP (see Remuneration Report).
In the 2009 financial year, Capral granted to the Managing Director, Mr Phil Jobe, options to acquire Capral shares as follows. These options were adjusted on the Share Consolidation record date of 23 November 2009 on a 10 for 1 basis, as detailed below:
OptiONS (MANAgiNg DireCtOr)
NuMBer (pOSt
CONSOliDAtiON)grANt
DAteeXpirY
DAte
eXerCiSe priCe
$ (pOSt
CONSOliDAtiON)
FAir VAlue At grANt DAte
$ (pOSt
CONSOliDAtiON)
Issued 24 April 20091 1,433,333 24/04/2009 20/04/2016 0.50 0.52
Issued 24 April 20091 1,433,333 24/04/2009 20/04/2016 0.50 0.54
Issued 24 April 20091 1,433,334 24/04/2009 20/04/2016 0.50 0.54
Issued 9 October 20092 10,000,000 9/10/2009 16/10/2014 0.25 0.22
Issued 9 October 20092 5,000,000 9/10/2009 16/10/2014 0.40 0.19
Issued 9 October 20092 5,000,000 9/10/2009 16/10/2014 0.60 0.18
1 In accordance with the terms of the Managing Director’s employment contract, options issued during the financial year ended 31 December 2009 have vesting dates between 20 April 2009 and 20 April 2012.
2 In accordance with the terms of the options approved by Shareholders at the EGM on 9 October 2009, options issued during the financial year ended 31 December 2009 have vesting dates between 16 October 2010 and 16 October 2012.
Outlined below are the inputs to the model used for calculating the fair value of the equity-settled options granted to the Managing Director:
OptiONS (MANAgiNg DireCtOr)
9 OCtOBer 2009 24 April 2009
iNputS iNtO the MODel trANChe 1 trANChe 2 trANChe 3 trANChe 1 trANChe 2 trANChe 3
Grant date 9/10/2009 9/10/2009 9/10/2009 24/4/2009 24/4/2009 24/4/2009
Dividend yield 0% 0% 0% 0% 0% 0%
Risk free yield 4.97% 5.05% 5.13% 3.66% 3.87% 4.05%
Expected volatility 80% 80% 80% 75% 70% 65%
Last exercise date 16/10/2014 16/10/2014 16/10/2014 20/04/2016 20/04/2016 20/04/2016
Exercise Price $0.250 $0.400 $0.600 $0.500 $0.500 $0.500
Share price at grant date (pre consolidation) $0.035 $0.035 $0.035 $0.080 $0.080 $0.080
Share price at grant date (post consolidation) $0.350 $0.350 $0.350 $0.800 $0.800 $0.800
Option life 5.0 years 5.0 years 5.0 years 7.0 years 7.0 years 7.0 years
Expected volatility reflects the assumption that historical volatility is indicative of future trends, which may not be the actual outcome.F
or p
erso
nal u
se o
nly
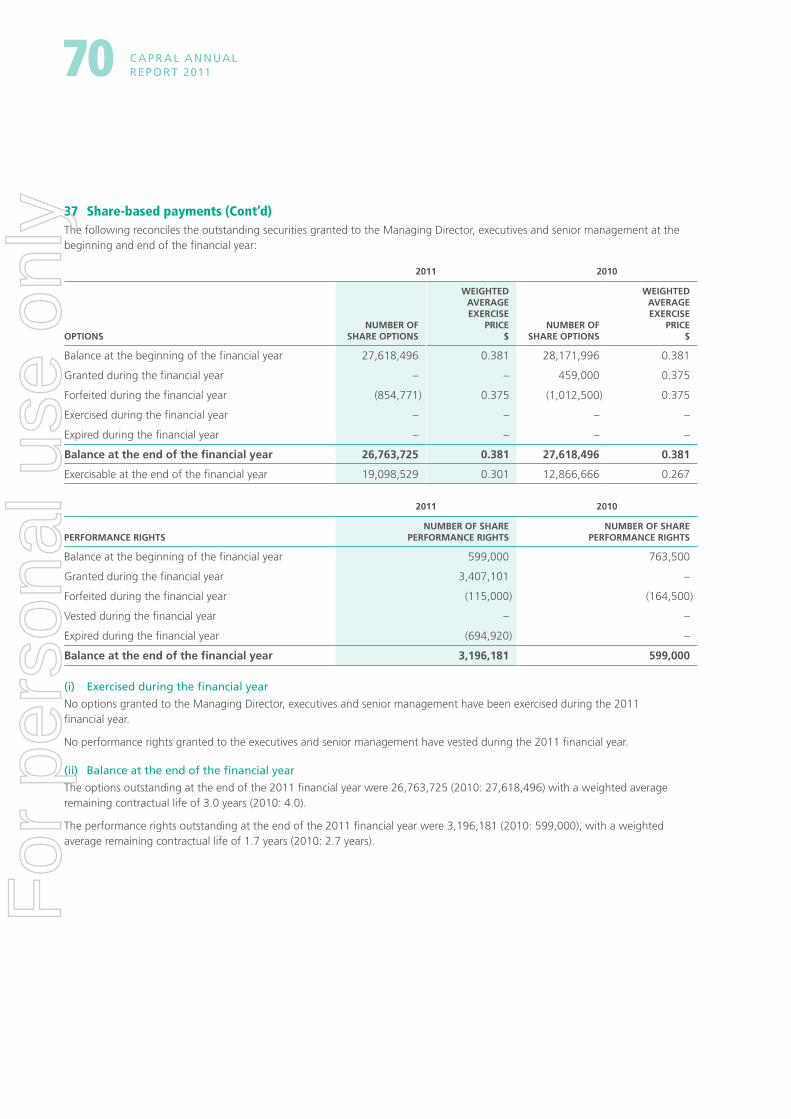
C apr al annual report 201170
37 Share-based payments (Cont’d)The following reconciles the outstanding securities granted to the Managing Director, executives and senior management at the beginning and end of the financial year:
2011 2010
OptiONSNuMBer OF
ShAre OptiONS
WeighteD AVerAge eXerCiSe
priCe $
NuMBer OF ShAre OptiONS
WeighteD AVerAge eXerCiSe
priCe $
Balance at the beginning of the financial year 27,618,496 0.381 28,171,996 0.381
Granted during the financial year – – 459,000 0.375
Forfeited during the financial year (854,771) 0.375 (1,012,500) 0.375
Exercised during the financial year – – – –
Expired during the financial year – – – –
Balance at the end of the financial year 26,763,725 0.381 27,618,496 0.381
Exercisable at the end of the financial year 19,098,529 0.301 12,866,666 0.267
2011 2010
perFOrMANCe rightSNuMBer OF ShAre
perFOrMANCe rightSNuMBer OF ShAre
perFOrMANCe rightS
Balance at the beginning of the financial year 599,000 763,500
Granted during the financial year 3,407,101 –
Forfeited during the financial year (115,000) (164,500)
Vested during the financial year – –
Expired during the financial year (694,920) –
Balance at the end of the financial year 3,196,181 599,000
(i) Exercised during the financial year
No options granted to the Managing Director, executives and senior management have been exercised during the 2011 financial year.
No performance rights granted to the executives and senior management have vested during the 2011 financial year.
(ii) Balance at the end of the financial year
The options outstanding at the end of the 2011 financial year were 26,763,725 (2010: 27,618,496) with a weighted average remaining contractual life of 3.0 years (2010: 4.0).
The performance rights outstanding at the end of the 2011 financial year were 3,196,181 (2010: 599,000), with a weighted average remaining contractual life of 1.7 years (2010: 2.7 years).
For
per
sona
l use
onl
y

Notes to the FiNaNcial
statemeNts 71
38 Key management personnel compensation(a) Compensation of Key Management personnel
The aggregate compensation made to directors and other members of key management personnel of the Company and the Group is set out below:
CONSOliDAteD/COMpANY
2011 2010$ $
Short-term benefits 3,730,172 4,545,892
Post-employment benefits 182,387 153,741
Other long-term benefits – –
Termination benefits 155,854 2,867
Share-based payments 873,387 3,432,931
4,941,800 8,135,431
(b) performance rights and options holdings of Key Management personnel
The remuneration policy for the Managing Director, Executive Management Team and senior management is set out in the Remuneration Report.
Details of the performance rights and options held by Key Management Personnel during the Financial Year are as follows:
2011 – perFOrMANCe rightS
helD At StArt OF YeAr
grANteD AS COMpeNSAtiON lApSeD VeSteD
helD At eND OF YeAr
Directors
P Jobe – – – – –
executives
T Campbell1 – 400,000 (80,000) – 320,000
M Lamb2 – – – – –
M Haszard 125,000 624,134 (124,827) – 624,307
A Simmonds3 117,000 – (117,000) – –
D Munro4 – – – – –
R Rolfe 52,000 152,729 (32,546) – 172,183
294,000 1,176,863 (354,373) – 1,116,490
None of the performance rights included in the above table vested as at 31 December 2011.
For
per
sona
l use
onl
y

C apr al annual report 201172
38 Key management personnel compensation (Cont’d)
2011 – OptiONShelD At
StArt OF YeArgrANteD AS
COMpeNSAtiON Other eXerCiSeDhelD At
eND OF YeAr
Directors
P Jobe 24,300,000 – – – 24,300,000
executives
T Campbell1 – – – – –
M Lamb2 459,000 – (459,000) – –
M Haszard 463,725 – – – 463,725
A Simmonds3 395,771 – (395,771) – –
D Munro4 – – – – –
R Rolfe 120,000 – – – 120,000
25,738,496 – (854,771) – 24,883,725
1 Mr Campbell commenced employment with Capral in June 2011
2 Mr Lamb left employment with Capral in June 2011
3 Mr Simmonds retired on 9 June 2011
4 Mr Munro commenced employment with Capral in June 2011
A total of 17,866,667 options granted to Mr P Jobe included in the above table are exercisable as at 31 December 2011.
2010 – perFOrMANCe rightS
helD At StArt OF YeAr
grANteD AS COMpeNSAtiON lApSeD VeSteD
helD At eND OF YeAr
Directors
P Jobe – – – – –
executives
I Timmis1 – – – – –
M Lamb2 – – – – –
M Haszard 125,000 – – – 125,000
A Simmonds 117,000 – – – 117,000
E Pollard3 119,500 – (119,500) – –
361,500 – (119,500) – 242,000
None of the performance rights included in the above table vested as at 31 December 2010.
2010 – OptiONShelD At
StArt OF YeArgrANteD AS
COMpeNSAtiON Other eXerCiSeDhelD At
eND OF YeAr
Directors
P Jobe 24,300,000 – – – 24,300,000
executives
I Timmis1 459,000 – (459,000) – –
M Lamb2 – 459,000 – – 459,000
M Haszard 463,725 – – – 463,725
A Simmonds 395,771 – – – 395,771
E Pollard3 283,500 – (283,500) – –
25,901,996 459,000 (742,500) – 25,618,496
1 Mr Timmis left employment with Capral in March 2010
2 Mr Lamb commenced employment with Capral in March 2010
3 Ms Pollard resigned on 15 November 2010
A total of 12,866,666 options granted to Mr P Jobe included in the above table were exercisable as at 31 December 2010.
For
per
sona
l use
onl
y

73NOTEs TO ThE FINANCIAL
sTATEMENTs
(c) Shareholdings of Key Management personnel – fully paid ordinary shares of the Company
Details of the holdings of the Company’s ordinary shares of Key Management Personnel during the Financial Year and 2010 financial year are as follows:
2011helD At
StArt OF YeArgrANteD AS
COMpeNSAtiON
reCeiVeD ON VeStiNg OF perFOrMANCe rightS/ eXerCiSe
OF OptiONSOther ChANgeS
DuriNg the YeArhelD At
eND OF YeAr
Directors
R Wood-Ward – – – – –
P Jobe 185,500 – – – 185,500
I Blair 227,348 – – – 227,348
A Eisen – – – – –
M Jefferies – – – – –
G F Pettigrew – – – – –
executives
T Campbell1 – – – – –
M Haszard 100,000 – – (100,000)2 –
D Munro3 – – – – –
R Rolfe 84,750 – – – 84,750
597,598 – – (100,000) 497,598
1 Mr Campbell commenced employment with Capral in June 2011
2 Disposed on market in accordance with the Capral Securities Trading Policy
3 Mr Munro commenced employment with Capral in June 2011
2010helD At
StArt OF YeArgrANteD AS
COMpeNSAtiON
reCeiVeD ON VeStiNg OF perFOrMANCe rightS/ eXerCiSe
OF OptiONSOther ChANgeS
DuriNg the YeArhelD At
eND OF YeAr
Directors
R Wood-Ward – – – – –
P Jobe 35,500 – – 150,0001 185,500
I Blair 227,348 – – – 227,348
A Eisen – – – – –
M Jefferies – – – – –
G F Pettigrew2 – – – – –
executives
M Lamb3 – – – 70,0001 70,000
M Haszard 200,000 – – (100,000)4 100,000
A Simmonds 202,000 – – – 202,000
664,848 – – 120,000 784,848
1 Purchased on market in accordance with the Capral Securities Trading Policy
2 Appointed non-executive director on 18 June 2010
3 Mr Lamb commenced with Capral on 1 March 2010
4 Disposed on market in accordance with the Capral Securities Trading Policy
For
per
sona
l use
onl
y

C apr al annual report 201174
38 Key management personnel compensation (Cont’d)The shareholdings of former Key Management Personnel as at the termination date were as follows:
2011helD At
StArt OF YeArgrANteD AS
reMuNerAtiONON eXerCiSe
OF OptiONOther ChANgeS
DuriNg the YeArhelD At DAte
OF terMiNAtiON
Directors – – – – –
executives
M Lamb1 70,000 70,000
A Simmonds2 202,000 – – (202,000)3 –
1 Mr Lamb left employment in June 2011
2 Mr Simmonds retired on 9 June 2011
3 Disposed on market in accordance with the Capral Securities Trading Policy
2010helD At
StArt OF YeArgrANteD AS
reMuNerAtiONON eXerCiSe
OF OptiONOther ChANgeS
DuriNg the YeArhelD At DAte
OF terMiNAtiON
Directors
P Arnall1 36,348 – – – 36,348
executives
I Timmis2 800,000 800,000
E Pollard3 100,000 – – – 100,000
1 Mr Arnall retired on 17 March 2010
2 Mr Timmis left employment in March 2010
3 Ms Pollard resigned on 15 November 2010 from Capral.
For
per
sona
l use
onl
y

75
The directors declare that:
(a) in the directors’ opinion, there are reasonable grounds to believe that Capral will be able to pay its debts as and when they become due and payable;
(b) in the directors’ opinion, the attached financial statements and notes thereto are in accordance with the Corporations Act 2001, including compliance with accounting standards and giving a true and fair view of the financial position and performance of Capral and the consolidated entity;
(c) in the directors’ opinion, the financial statements and notes thereto are in accordance with International Financial Reporting Standards issued by the International Accounting Standards Board; and
(d) the directors have been given declarations required by section 295A of the Corporations Act 2001.
At the date of this declaration, Capral is within the class of companies affected by ASIC Class Order 98/1418. The nature of the deed of cross guarantee is such that each company which is party to the deed, guarantees to each creditor payment in full of any debt in accordance with the deed of cross guarantee.
In the directors’ opinion there are reasonable grounds to believe that Capral and the companies to which the ASIC Class Order applies, as detailed in Note 30 to the financial statements will, as a group, be able to meet any obligations or liabilities to which they are, or may become, subject by virtue of the deed of cross guarantee.
Signed in accordance with a resolution of the directors made pursuant to section 295(5) of the Corporations Act 2001.
On behalf of the directors
r. l. Wood-Ward p.J. Jobe Chairman Managing Director
Sydney 22 February 2012
Directors’ Declaration
For
per
sona
l use
onl
y

C apr al annual report 201176
Independent Auditor’s Report
Member of Deloitte Touche Tohmatsu Limited
For
per
sona
l use
onl
y

77INDEPENDENT AUDITOR’s
REPORT
For
per
sona
l use
onl
y

C apr al annual report 201178
member Details(IN ACCORDANCE wITh ThE LIsTINg RULEs:) As AT 29 FEBRUARy 2012
1. twenty largest holdersDetails of Capral’s twenty largest shareholders were as follows:
NO.
NAMe OF hOlDer
NuMBer OF ShAreS helD
iSSueD CApitAl helD (%)
1 GPG Nominees Pty Limited 118,045,834 30.43
2 Guinness Peat Group (Australia) Pty Limited 54,045,337 13.93
3 J P Morgan Nominees Australia Limited 50,943,922 13.13
4 National Nominees Limited 34,443,183 8.88
5 RBC Dexia Investor Services Australia Nominees Pty Limited – Pipooled Account 32,608,205 8.41
6 Citicorp Nominees Pty Limited 18,323,898 4.72
7 GPG Nominees Pty Ltd 11,636,947 3.00
8 HSBC Custody Nominees (Australia) Limited 10,342,464 2.67
9 Cogent Nominees Pty Limited 5,999,522 1.55
10 Citicorp Nominees Pty Limited – Colonial First State Inv Account 3,783,141 0.98
11 Bell Potter Nominees Ltd – BB Nominees Account 1,518,000 0.39
12 UBS Nominees Pty Ltd 1,500,000 0.39
13 UBS Wealth Management Australia Nominees Pty Ltd 1,462,041 0.38
14 Chemical Trustee Limited 1,404,000 0.36
15 Mr Herbert Gregory Greber 1,300,000 0.34
16 Excelsior Holdings Pty Limited – Ord River Investments Account 1,000,000 0.26
17 Mrs Tew Hua Cameron 886,181 0.23
18 Melbourne Corporation of Australia Pty Ltd – Superfund Account 881,000 0.23
19 Di Iulio Homes Pty Limited – Di Iulio Super Fund Account 864,676 0.22
20 Concord Pacific Investment Pty Ltd – Prinjade Investment Account 725,000 0.19
total 351,713,351 90.67
2. Substantial holdersSubstantial shareholders as notified to Capral in accordance with the Corporations Act 2001:
NAMe
NuMBer OF ShAreS
perCeNtAge OF ShAreS helD
Guinness Peat Group 183,728,118 47.37
Orbis Investment Management 71,356,553 18.40
Perpetual Limited 38,750,398 9.99
Acorn Capital Limited 24,745,368 6.38For
per
sona
l use
onl
y

79
3. number of holders(a) Quoted equity securities: there were 4,449 holders of ordinary shares.
(b) Unquoted equity securities - options: there were 2,463,725 unquoted options issued to 15 optionholders under the Capral Long Term Incentive Plan. There are no optionholders who hold 20% or more options under this plan.
There were 24,300,000 unquoted options issued to Capral’s Managing Director.
(c) Unquoted equity securities - performance rights: there were 3,166,681 unquoted performance rights issued to 21 holders under the Capral Long Term Incentive Plan. There are no holders who hold 20% or more performance rights under this plan.
4. Voting rights(a) Voting rights attaching to the fully paid ordinary shares are, on a show of hands, one vote per person present as a member proxy,
attorney, or representative thereof and on a poll, one vote per share for every member present in person or by proxy or by attorney or by representative.
(b) Holders of options and performance rights do not have any voting rights on the equity securities held by them. Ordinary shares issued on exercise of options or vesting of performance rights will carry the same voting rights as all other fully paid ordinary shares of Capral.
5. distribution of equity securities(a) Quoted ordinary shares
rANge OF ShAreS NuMBer OF hOlDerS
1 – 1,000 3,089
1,001 – 5,000 669
5,001 – 10,000 205
10,001 – 100,000 388
100,001 and over 98
total 4,449
(b) unquoted options / performance rights
Options issued under the Capral Long Term Incentive Plan with a vesting date of 16 October 2011 and an exercise price of $0.25:
rANge OF OptiONS NuMBer OF hOlDerS
1 – 1,000 0
1,001 – 5,000 0
5,001 – 10,000 0
10,001 – 100,000 14
100,001 and over 1
total 15
MEMBER DETAILs
For
per
sona
l use
onl
y

C apr al annual report 201180
Options issued under the Capral Long Term Incentive Plan with a vesting date of 16 October 2012 and an exercise price of $0.40:
rANge OF OptiONS NuMBer OF hOlDerS
1 – 1,000 0
1,001 – 5,000 0
5,001 – 10,000 0
10,001 – 100,000 14
100,001 and over 1
total 15
Options issued under the Capral Long Term Incentive Plan with a vesting date of 16 October 2012 and an exercise price of $0.60:
rANge OF OptiONS NuMBer OF hOlDerS
1 – 1,000 0
1,001 – 5,000 0
5,001 – 10,000 0
10,001 – 100,000 14
100,001 and over 1
total 15
Options issued to the Managing Director with various vesting and expiry dates and exercise prices:
rANge OF OptiONS NuMBer OF hOlDerS
1 – 1,000 0
1,001 – 5,000 0
5,001 – 10,000 0
10,001 – 100,000 0
100,001 and over 1
total 1
Performance rights granted under the Capral Long Term Incentive Plan with various vesting and expiry dates and a nil exercise price:
rANge OF OptiONS NuMBer OF hOlDerS
1 – 1,000 0
1,001 – 5,000 0
5,001 – 10,000 2
10,001 – 100,000 5
100,001 and over 14
total 21
6. marketable parcels: There are 3,572 shareholders holding less than a marketable parcel* of shares. (* Minimum parcel size of shares: 3,031)
7. On-market buy back: There is no current on-market buy back.
For
per
sona
l use
onl
y

Capral’s Registered Office & Principal Administration Office71 Ashburn Road Bundamba QLD 4304
Telephone: +61 (0)7 3816 7000 Fax: +61 (0)7 3816 7111
Share RegistryComputershare Investor services Pty Limited ABN 48 078 279 277
Level 2, 60 Carrington street sydney Nsw 2000
Telephone: 1800 855 080 Fax: +61 (0)3 9473 2118
AuditorDeloitte Touche Tohmatsu ABN 74 490 121 060
grosvenor Place 225 george street sydney Nsw 2000
Securities Exchange ListingCapral’s shares are quoted on the Australian securities Exchange (Code: CAA).
Company SecretaryMr Richard Rolfe
Corporate Directory
For
per
sona
l use
onl
y

C apr al annual report 2011A
CA
PR
AL LIM
ITE
D A
NN
UA
L RE
PO
RT
2011
CAPRAL LIMITED ABN 78 004 213 692
71 AshBURN RD, BUNDAMBA QLD 4304 T 07 3816 7000 | F 07 3816 7111
www.capral.com.au
For
per
sona
l use
onl
y