Embed Size (px)
Citation preview

Capitaliza on Rate Study
January 2020
Oklahoma Tax Commission
Ad Valorem Division
Public Service Sec on
Post Office Box 269060
Oklahoma City, OK 73126‐9060
405‐319‐8200


EXECUTIVE SUMMARY

Executive Summary The income approach to value converts projected future income or cash flow into an estimate of present value. The accuracy of this approach is no greater than the validity of the assumptions used to estimate the key variables, particularly the capitalization rate variable. The mathematical techniques used in the approach convert those assumptions into an estimate of current market value. This booklet contains a study of each of the eight state assessed industry groups in Oklahoma. Industry data was gathered by group as identified by Value Line Investment Survey published from the period of November 2019 through January 2020. Generally accepted appraisal procedures were used to estimate the cost of capital for debt and equity. The long term debt cost is the cost for a particular risk class of debt on the lien date. The equity rate reflects the rate of return or compensation that will satisfy the risk that a prospective purchaser would assume by investing in the property. Authority for Valuation The Oklahoma Tax Commission, Ad Valorem Division, is charged with the responsibility for the valuation of Railroad, Air Carrier, and Public Service Corporation property in accordance with Title 68, Oklahoma Statutes, Section 2808. The term “public service” includes electric companies, fluid or product pipeline companies, gas distribution and transmission companies, telecommunication companies, and water companies. Band of Investment, Capital Structure A representative capital structure is developed for each industry using the market value of equity and the book value of long term debt. Using Value Line Investment Survey the market value of equity can be calculated by multiplying the number of shares outstanding by the listed stock price, or by utilizing the given market capitalization number already calculated. The debt components are book amounts unless market amounts are readily available and predetermined to be significantly different. Preferred stock was excluded in the calculations for all industry types. The rates of debt and equity capital are weighted by the respective amounts of such capital deemed most likely to be employed by a prospective buyer. The result is a representative or typical capital structure of an industry group of companies, not that of the present owner. Cost of Debt Cost of debt was calculated as the twelve month bond yield average from Mergent Bond Record for public utility and industrial bonds utilizing that bond rating perceived as typical for each industry.

Executive Summary Cost of Capital Equity rate calculations were derived upon review of Discounted Cash Flow, Capital Asset Pricing Model (CAPM), and Earnings Price Ratio. Discounted Cash Flow (Gordon Growth Model) allows for the calculation of two rates within its model utilizing the dividend yield, dividend growth rate estimates, and earnings growth rate estimates as listed in Value Line Investment Survey. Cost of capital being calculated for dividends by adding the dividend yield and the dividend estimate. Similarly the cost of capital for earnings is calculated by adding the dividend yield and the earnings estimate. No calculation is utilized where the resulting yield or growth estimate equity rate is below the chosen cost of debt for each respective industry.
Capital Asset Pricing Model (CAPM) in the application of the CAPM, the most sensitive component affecting the outcome is the estimate of the beta statistic. A choice of time frames and frequencies of measurement in the calculation of the beta can produce significantly different results. Another factor in the use of beta is the choice of whether to use an unadjusted beta or a beta adjusted to reflect the fact that betas revert to the mean over time. For this study the company levered betas as developed and presented in The Value Line Investment Survey for the selected industry groups are used.
Earnings Price Ratios (E/P Ratio) utilizing Value Line Investment Survey for the selected industry groups, the E/P Ratio was calculated with the projected earnings divided by the recent price. Flotation Costs Flotation costs are those costs associated with the issuance of new securities and include both the underwriting spread and the costs incurred by the issuing company from the offering. Financial theory suggests and evidence supports that firms do not typically issue new common equity as a matter of common practice. Therefore in determining a capitalization rate, no adjustment will be made in the capitalization rate or the income stream for hypothetical flotation costs. Flotation costs actually incurred may be accounted for in the income stream. Utilization of Other Studies and Data Valuation staff has considered and where appropriate utilized data and capitalization studies submitted by assessed and interested parties in the development of the derived rates. The capitalization rates published in this study are intended to be applied to the unitary operations of those companies subject to central valuation and assessment by the Oklahoma State Board of Equalization.

Industry Capitalization Rate Summary
Mergents 2019 Twelve Month Bond Yield Averages
Equity Debt Market Long Term CapitalizationIndustry Rate Rate Capitalization Debt Rate
AirlineCargo 13.60% 4.55% 80.71% 19.29% 11.85%
Passenger 13.50% 4.55% 76.27% 23.73% 11.38%
Electric 8.45% 4.19% 63.95% 36.05% 6.92%
Fluid Pipeline (Petroleum Integrated) 13.20% 4.55% 82.47% 17.53% 11.68%
Gas Distribution (Natural Gas Utility) 9.20% 4.19% 68.31% 31.69% 7.61%
Gas Transmission (Natural Gas Diversified) 13.90% 4.55% 59.23% 40.77% 10.09%
Oil/Gas Distribution 15.10% 4.55% 45.95% 54.05% 9.40%
Pipeline MLPs 14.30% 4.55% 57.98% 42.02% 10.20%
Railroad 13.20% 4.55% 83.37% 16.63% 11.76%
Telecommunications Services 12.30% 4.55% 67.00% 33.00% 9.74%
Telecommunications Utility 13.70% 4.19% 31.67% 68.33% 7.21%
Water 9.40% 4.19% 73.23% 26.77% 8.01%

Airline Industry

2020 Capitalization Rate Study Airline Industry Notes
• Recognizing the different operational services as provided by this industry group, it was broken out into two segments, cargo and
passenger service. • From the passenger service segment, WestJet Airlines Ltd. was excluded due to Value Line information listed in Canadian dollars. • Staff considered capitalization studies submitted by:
No Submissions
• Staff relied upon the results of the following models and appraisal judgment in the development of equity rates:
1. Discounted Cash Flow 2. Capital Asset Pricing Model, Ex-Post and Ex Ante 3. Earnings/Price Ratio

Industry Capitalization Rate
Mergents 2019 Twelve Month Bond Yield Averages
Equity Market Long Term CapitalizationIndustry Rate Capitalization Debt Rate
AirlineCargo 13.60% 80.71% 19.29% 11.85%
Passenger 13.50% 76.27% 23.73% 11.38%

Industry Equity Rate Summary
AirlineCargo
CapM Ex Post Equity Rate 11.76%
CapM Ex Ante Equity Rate 15.19%
DCF (Dividend) Equity Rate 11.15%
DCF (Earnings) Equity Rate 11.93%
Earnings Price Ratio 13.79%
Passenger
CapM Ex Post Equity Rate 10.69%
CapM Ex Ante Equity Rate 13.73%
DCF (Dividend) Equity Rate 13.59%
DCF (Earnings) Equity Rate 10.96%
Earnings Price Ratio 14.91%

CapM Equity Rates
b* Risk Free Rate (2.25%) plus Risk Premium Rate (7.15%)c* Risk Free Rate (2.25%) plus Risk Premium Rate (9.73%)Value Line Investment Survey, November 2019 through January 2020, Morningstar
Ex Post Ex Ante Value Line Ex Post Ex AnteRisk Premium Risk Premium Beta CAPM Equity Rate CAPM Equity Rate
Industry b* c* d (((b-2.25%)*d)+2.25%) (((c-2.25%)*d)+2.25%)
AirlineCargo 9.40% 11.98% 1.33 11.76% 15.19%
Passenger 9.40% 11.98% 1.18 10.69% 13.73%

Discounted Cash Flow (Gordon Growth)
Value Line Investment Survey, November 2019 through January 2020
Value Market Dividend Equity Rate Equity RateLine Capitalization Yield Dividends Earnings Dividend Earnings
Industry Company Strength d e f g (e+f) (e+g)
AirlineCargo
Atlas Air Wordwide Holdings B+ 675,000,000 15.00% 15.00%FedEx Corp. A++ 42,100,000,000 1.60% 10.00% 7.50% 11.60% 9.10%United Parcel Service, Inc. A 105,500,000,000 3.20% 7.50% 8.50% 10.70% 11.70%
Median 42,100,000,000 11.15% 11.70%Arithmetic Mean 49,425,000,000 11.15% 11.93%
PassengerAlaska Air Group , Inc. B+ 8,700,000,000 2.00% 8.00% 5.50% 10.00% 7.50%Allegiant Travel Company B++ 2,700,000,000 1.70% 3.50% 9.00% 5.20% 10.70%American Airlines Group B+ 12,800,000,000 1.40% 7.00% 7.50% 8.40% 8.90%Copa Holdings, S.A. B++ 4,500,000,000 2.50% 7.00% 11.50% 9.50% 14.00%Delta Air Lines, Inc. B+ 37,000,000,000 3.00% 19.00% 9.50% 22.00% 12.50%Hawaiian Holdings, Inc. B+ 1,400,000,000 1.60% 20.00% 1.50% 21.60%JetBlue Airways Corp. B++ 5,600,000,000 8.50% 8.50%SkyWest, Inc. B+ 3,200,000,000 0.80% 13.50% 14.00% 14.30% 14.80%Southwest Airlines A 30,900,000,000 1.20% 16.50% 10.50% 17.70% 11.70%Spirit Airlines, Inc. B++ 2,600,000,000 12.50% 12.50%United Airlines Holdings, Inc. B 23,500,000,000 8.50% 8.50%
Median 5,600,000,000 12.15% 11.20%Arithmetic Mean 12,081,818,182 13.59% 10.96%
Growth Estimate

E/P Ratio
Value Line Investment Survey, November 2019 through January 2020
Value Market Recent Projected E/PLine Capitalization Price Earnings Ratio
Industry Company Strength c d e (e/d)
AirlineCargo
Atlas Air Wordwide Holdings B+ 675,000,000 26.27 5.80 22.08%FedEx Corp. A++ 42,100,000,000 161.22 18.00 11.16%United Parcel Service, Inc. A 105,500,000,000 123.01 10.00 8.13%
Median 42,100,000,000 11.16%Arithmetic Mean 49,425,000,000 13.79%
PassengerAlaska Air Group , Inc. B+ 8,700,000,000 70.84 8.60 12.14%Allegiant Travel Company B++ 2,700,000,000 168.21 19.00 11.30%American Airlines Group B+ 12,800,000,000 29.52 6.60 22.36%Copa Holdings, S.A. B++ 4,500,000,000 105.69 12.00 11.35%Delta Air Lines, Inc. B+ 37,000,000,000 57.22 9.50 16.60%Hawaiian Holdings, Inc. B+ 1,400,000,000 29.62 4.50 15.19%JetBlue Airways Corp. B++ 5,600,000,000 19.30 3.00 15.54%SkyWest, Inc. B+ 3,200,000,000 62.85 8.60 13.68%Southwest Airlines A 30,900,000,000 57.85 6.75 11.67%Spirit Airlines, Inc. B++ 2,600,000,000 37.86 6.40 16.90%United Airlines Holdings, Inc. B 23,500,000,000 92.72 16.00 17.26%
Median 5,600,000,000 15.19%Arithmetic Mean 12,081,818,182 14.91%

Capital Structure
Value Line Investment Survey, November 2019 through January 2020
Value Market Long Term Debt/Equity Percentage PercentageLine Capitalization Debt Ratio Equity Debt
Industry Company Strength c d (d/c) (c/(c+d)) (d/(c+d))
AirlineCargo
Atlas Air Wordwide Holdings B+ 675,000,000 2,031,600,000 3.01 24.94% 75.06%FedEx Corp. A++ 42,100,000,000 18,726,000,000 0.44 69.21% 30.79%United Parcel Service, Inc. A 105,500,000,000 21,740,000,000 0.21 82.91% 17.09%
Median 42,100,000,000 18,726,000,000 0.44 69.21% 30.79%Arithmetic Mean 49,425,000,000 14,165,866,667 1.22 59.02% 40.98%Weighted Average 87,021,518,294 20,794,509,729 80.71% 19.29%
PassengerAlaska Air Group , Inc. B+ 8,700,000,000 1,444,000,000 0.17 85.76% 14.24%Allegiant Travel Company B++ 2,700,000,000 1,213,300,000 0.45 69.00% 31.00%American Airlines Group B+ 12,800,000,000 21,625,000,000 1.69 37.18% 62.82%Copa Holdings, S.A. B++ 4,500,000,000 965,500,000 0.21 82.33% 17.67%Delta Air Lines, Inc. B+ 37,000,000,000 7,923,000,000 0.21 82.36% 17.64%Hawaiian Holdings, Inc. B+ 1,400,000,000 704,500,000 0.50 66.52% 33.48%JetBlue Airways Corp. B++ 5,600,000,000 1,320,000,000 0.24 80.92% 19.08%SkyWest, Inc. B+ 3,200,000,000 2,622,200,000 0.82 54.96% 45.04%Southwest Airlines A 30,900,000,000 2,398,000,000 0.08 92.80% 7.20%Spirit Airlines, Inc. B++ 2,600,000,000 1,968,900,000 0.76 56.91% 43.09%United Airlines Holdings, Inc. B 23,500,000,000 13,086,000,000 0.56 64.23% 35.77%
Median 5,600,000,000 1,968,900,000 0.45 69.00% 31.00%Arithmetic Mean 12,081,818,182 5,024,581,818 0.52 70.27% 29.73%Weighted Average 24,028,969,150 7,476,615,049 76.27% 23.73%

Beta
Value Line Investment Survey, November 2019 through January 2020
Value LineIndustry Company Levered Beta
Airline, Selected ComparablesCargo
Atlas Air Wordwide Holdings 1.70FedEx Corp. 1.30United Parcel Service, Inc. 1.00
Median 1.30Arithmetic Mean 1.33
PassengerAlaska Air Group , Inc. 1.05Allegiant Travel Company 0.85American Airlines Group 1.30Copa Holdings, S.A. 1.30Delta Air Lines, Inc. 1.10Hawaiian Holdings, Inc. 1.25JetBlue Airways Corp. 1.20SkyWest, Inc. 1.40Southwest Airlines 1.15Spirit Airlines, Inc. 1.15United Airlines Holdings, Inc. 1.20
Median 1.20Arithmetic Mean 1.18

Beta
Value Line Investment Survey, November 2019 through January 2020
Value LineIndustry Company Levered Beta
Airline, Value LineAlaska Air Group , Inc. 1.05Allegiant Travel Company 0.85American Airlines Group 1.30Atlas Air Wordwide Holdings 1.70Copa Holdings, S.A. 1.30Delta Air Lines, Inc. 1.10FedEx Corp. 1.30Hawaiian Holdings, Inc. 1.25JetBlue Airways Corp. 1.20SkyWest, Inc. 1.40Southwest Airlines 1.15Spirit Airlines, Inc. 1.15United Airlines Holdings, Inc. 1.20United Parcel Service, Inc. 1.00WestJet Airlines Ltd. 0.70
Median 1.20Arithmetic Mean 1.18

Mergents 2019 Corporate Bond Yield Averages
Month Public Utility Industrial Aa A Baa Aaa Aa A Baa
January 4.48% 4.41% 4.18% 4.35% 4.91% 3.93% 4.07% 4.32% 5.32%
February 4.35% 4.27% 4.05% 4.25% 4.76% 3.79% 3.93% 4.21% 5.13%
March 4.26% 4.21% 3.98% 4.16% 4.65% 3.77% 3.87% 4.17% 5.02%
April 4.18% 4.11% 3.91% 4.08% 4.55% 3.69% 3.79% 4.08% 4.85%
May 4.10% 4.06% 3.84% 3.98% 4.47% 3.67% 3.76% 4.03% 4.78%
June 3.93% 3.85% 3.65% 3.82% 4.31% 3.42% 3.53% 3.84% 4.60%
July 3.79% 3.70% 3.53% 3.69% 4.13% 3.29% 3.38% 3.70% 4.42%
August 3.36% 3.36% 3.17% 3.29% 3.63% 2.98% 2.99% 3.34% 4.11%
September 3.44% 3.38% 3.24% 3.37% 3.71% 3.03% 3.02% 3.35% 4.11%
October 3.45% 3.37% 3.24% 3.39% 3.72% 3.01% 3.01% 3.35% 4.12%
November 3.48% 3.40% 3.25% 3.43% 3.76% 3.06% 3.06% 3.37% 4.12%
December 3.45% 3.34% 3.22% 3.40% 3.73% 3.01% 3.00% 3.32% 4.03%
3.86% 3.79% 3.61% 3.77% 4.19% 3.39% 3.45% 3.76% 4.55%
Corporate by Groups Public Utility Bonds Industrial Bonds

Electric Industry

2020 Capitalization Rate Study Electric Industry Notes
• From the Electric Industry segment, Fortis, Inc. was excluded due to Value Line information listed in Canadian dollars. Evergy, Inc., a merger between Great Plains Energy and Westar Energy, was also excluded due to the lack of financial information.
• Staff considered capitalization studies submitted by:
No Submissions
• Staff relied upon the results of the following models and appraisal judgment in the development of equity rates:
1. Discounted Cash Flows 2. Capital Asset Pricing Model, Ex-Post and Ex-Ante 3. Earnings/Price Ratio

Industry Capitalization Rate
Mergents 2019 Twelve Month Bond Yield Averages
Equity Market Long Term CapitalizationIndustry Rate Capitalization Debt Rate
Electric 8.45% 63.95% 36.05% 6.92%

Industry Equity Rate SummaryElectric
CapM Ex Post Equity Rate 6.61%
CapM Ex Ante Equity Rate 8.19%
DCF (Dividend) Equity Rate 8.27%
DCF (Earnings) Equity Rate 8.89%
Earnings Price Ratio 5.66%

CapM Equity Rates
b* Risk Free Rate (2.25%) plus Risk Premium Rate (7.15%)c* Risk Free Rate (2.25%) plus Risk Premium Rate (9.73%)Value Line Investment Survey, November 2019 through January 2020, Morningstar
Ex Post Ex Ante Value Line Ex Post Ex AnteRisk Premium Risk Premium Beta CAPM Equity Rate CAPM Equity Rate
Industry b* c* d (((b-2.25%)*d)+2.25%) (((c-2.25%)*d)+2.25%)
Electric 9.40% 11.98% 0.61 6.61% 8.19%

Discounted Cash Flow (Gordon Growth)
Value Line Investment Survey, November 2019 through January 2020
Value Market Dividend Equity Rate Equity RateLine Capitalization Yield Dividends Earnings Dividend Earnings
Industry Company Strength d e f g (e+f) (e+g)
Growth Estimate
ElectricAllete, Inc. A 4,100,000,000 3.10% 5.00% 5.00% 8.10% 8.10%Alliant Energy Corp. A 12,700,000,000 2.70% 5.50% 6.50% 8.20% 9.20%Ameren Corporation A 18,000,000,000 2.70% 4.50% 6.50% 7.20% 9.20%American Electric Power Company, Inc. A+ 45,000,000,000 3.10% 5.50% 4.00% 8.60% 7.10%CenterPoint Energy, Inc. B+ 12,000,000,000 4.90% 2.50% 10.50% 7.40% 15.40%CMS Energy Corporation B++ 17,000,000,000 2.70% 7.00% 7.00% 9.70% 9.70%DTE Energy Company B++ 23,000,000,000 3.30% 7.00% 4.50% 10.30% 7.80%Entergy Corporation B++ 23,000,000,000 3.20% 3.50% 2.00% 6.70% 5.20%MGE Energy Inc. A+ 2,700,000,000 1.90% 5.00% 6.00% 6.90% 7.90%OGE Energy Corp. A 8,400,000,000 3.80% 6.50% 6.50% 10.30% 10.30%Otter Tail Corporation A 2,000,000,000 3.00% 4.00% 5.00% 7.00% 8.00%WEC Energy Group, Inc. A+ 28,000,000,000 2.80% 6.00% 6.00% 8.80% 8.80%
Median 14,850,000,000 8.15% 8.45%Arithmetic Mean 16,325,000,000 8.27% 8.89%
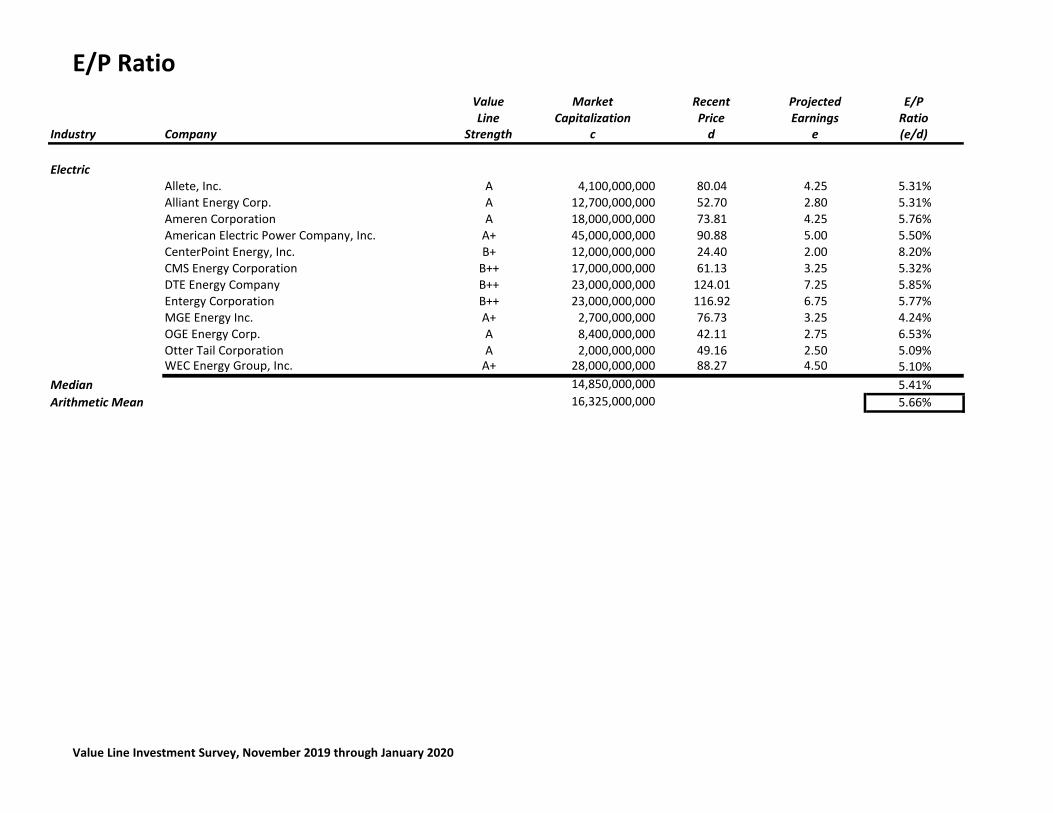
E/P Ratio
Value Line Investment Survey, November 2019 through January 2020
Value Market Recent Projected E/PLine Capitalization Price Earnings Ratio
Industry Company Strength c d e (e/d)
ElectricAllete, Inc. A 4,100,000,000 80.04 4.25 5.31%Alliant Energy Corp. A 12,700,000,000 52.70 2.80 5.31%Ameren Corporation A 18,000,000,000 73.81 4.25 5.76%American Electric Power Company, Inc. A+ 45,000,000,000 90.88 5.00 5.50%CenterPoint Energy, Inc. B+ 12,000,000,000 24.40 2.00 8.20%CMS Energy Corporation B++ 17,000,000,000 61.13 3.25 5.32%DTE Energy Company B++ 23,000,000,000 124.01 7.25 5.85%Entergy Corporation B++ 23,000,000,000 116.92 6.75 5.77%MGE Energy Inc. A+ 2,700,000,000 76.73 3.25 4.24%OGE Energy Corp. A 8,400,000,000 42.11 2.75 6.53%Otter Tail Corporation A 2,000,000,000 49.16 2.50 5.09%WEC Energy Group, Inc. A+ 28,000,000,000 88.27 4.50 5.10%
Median 14,850,000,000 5.41%Arithmetic Mean 16,325,000,000 5.66%

Capital Structure
Value Line Investment Survey, November 2019 through January 2020
Value Market Long Term Debt/Equity Percentage PercentageLine Capitalization Debt Ratio Equity Debt
Industry Company Strength c d (d/c) (c/(c+d)) (d/(c+d))
ElectricAllete, Inc. A 4,100,000,000 1,404,900,000 0.34 74.48% 25.52%Alliant Energy Corp. A 12,700,000,000 5,535,100,000 0.44 69.65% 30.35%Ameren Corporation A 18,000,000,000 8,651,000,000 0.48 67.54% 32.46%American Electric Power Company, Inc. A+ 45,000,000,000 24,554,000,000 0.55 64.70% 35.30%CenterPoint Energy, Inc. B+ 12,000,000,000 14,014,000,000 1.17 46.13% 53.87%CMS Energy Corporation B++ 17,000,000,000 12,121,000,000 0.71 58.38% 41.62%DTE Energy Company B++ 23,000,000,000 13,858,000,000 0.60 62.40% 37.60%Entergy Corporation B++ 23,000,000,000 16,938,000,000 0.74 57.59% 42.41%MGE Energy Inc. A+ 2,700,000,000 490,200,000 0.18 84.63% 15.37%OGE Energy Corp. A 8,400,000,000 3,194,700,000 0.38 72.45% 27.55%Otter Tail Corporation A 2,000,000,000 590,000,000 0.30 77.22% 22.78%WEC Energy Group, Inc. A+ 28,000,000,000 10,897,000,000 0.39 71.98% 28.02%
Median 14,850,000,000 9,774,000,000 0.46 68.59% 31.41%Arithmetic Mean 16,325,000,000 9,353,991,667 0.52 67.26% 32.74%Weighted Average 24,930,832,057 14,056,620,112 63.95% 36.05%
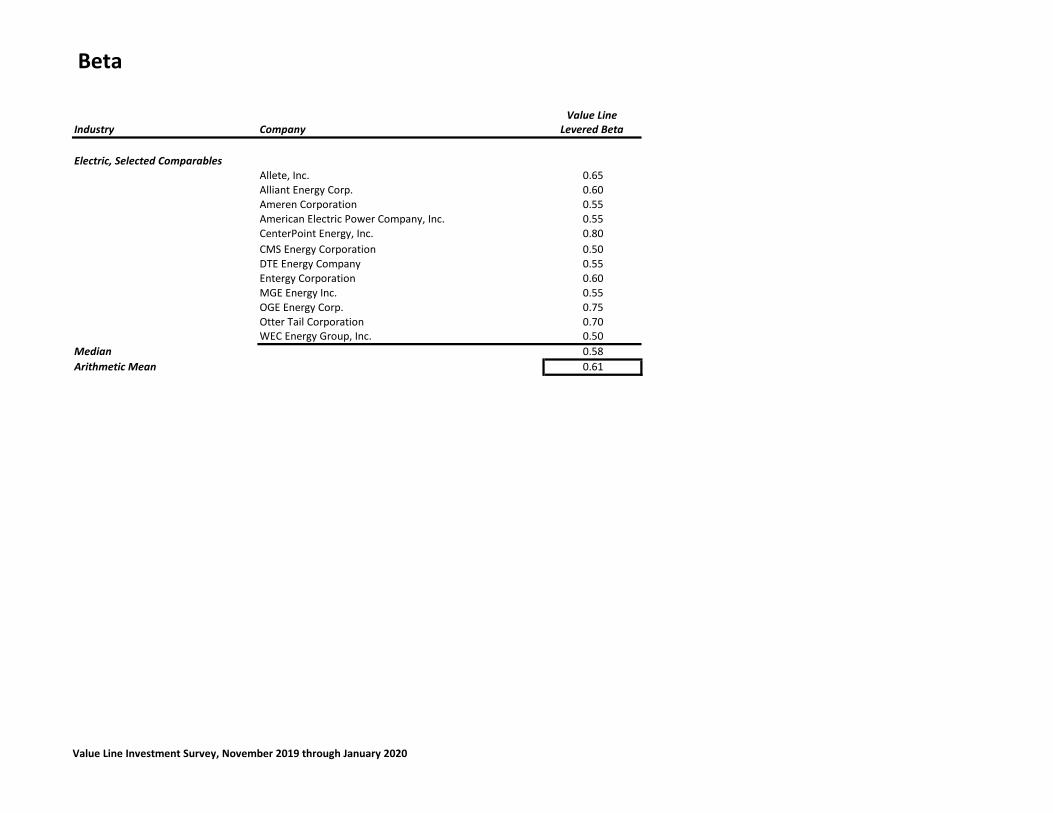
Beta
Value Line Investment Survey, November 2019 through January 2020
Value LineIndustry Company Levered Beta
Electric, Selected ComparablesAllete, Inc. 0.65Alliant Energy Corp. 0.60Ameren Corporation 0.55American Electric Power Company, Inc. 0.55CenterPoint Energy, Inc. 0.80CMS Energy Corporation 0.50DTE Energy Company 0.55Entergy Corporation 0.60MGE Energy Inc. 0.55OGE Energy Corp. 0.75Otter Tail Corporation 0.70WEC Energy Group, Inc. 0.50
Median 0.58Arithmetic Mean 0.61

Beta
Value Line Investment Survey, November 2019 through January 2020
Value LineIndustry Company Levered Beta
Electric, Value LineAllete, Inc. 0.65Alliant Energy Corp. 0.60Ameren Corporation 0.55American Electric Power Company, Inc. 0.55CenterPoint Energy, Inc. 0.80CMS Energy Corporation 0.50DTE Energy Company 0.55Entergy Corporation 0.60Evergy, Inc.Fortis Inc. 0.60MGE Energy Inc. 0.55OGE Energy Corp. 0.75Otter Tail Corporation 0.70WEC Energy Group, Inc. 0.50
Median 0.60Arithmetic Mean 0.61

Mergents 2019 Corporate Bond Yield Averages
Month Public Utility Industrial Aa A Baa Aaa Aa A Baa
January 4.48% 4.41% 4.18% 4.35% 4.91% 3.93% 4.07% 4.32% 5.32%
February 4.35% 4.27% 4.05% 4.25% 4.76% 3.79% 3.93% 4.21% 5.13%
March 4.26% 4.21% 3.98% 4.16% 4.65% 3.77% 3.87% 4.17% 5.02%
April 4.18% 4.11% 3.91% 4.08% 4.55% 3.69% 3.79% 4.08% 4.85%
May 4.10% 4.06% 3.84% 3.98% 4.47% 3.67% 3.76% 4.03% 4.78%
June 3.93% 3.85% 3.65% 3.82% 4.31% 3.42% 3.53% 3.84% 4.60%
July 3.79% 3.70% 3.53% 3.69% 4.13% 3.29% 3.38% 3.70% 4.42%
August 3.36% 3.36% 3.17% 3.29% 3.63% 2.98% 2.99% 3.34% 4.11%
September 3.44% 3.38% 3.24% 3.37% 3.71% 3.03% 3.02% 3.35% 4.11%
October 3.45% 3.37% 3.24% 3.39% 3.72% 3.01% 3.01% 3.35% 4.12%
November 3.48% 3.40% 3.25% 3.43% 3.76% 3.06% 3.06% 3.37% 4.12%
December 3.45% 3.34% 3.22% 3.40% 3.73% 3.01% 3.00% 3.32% 4.03%
3.86% 3.79% 3.61% 3.77% 4.19% 3.39% 3.45% 3.76% 4.55%
Corporate by Groups Public Utility Bonds Industrial Bonds

Fluid Pipeline

2020 Capitalization Rate Study Fluid Pipeline (Petroleum Integrated) Industry Notes
• From the Fluid Pipeline (Petroleum Integrated) Industry segment, Petroleo Brasileiro S.A. was excluded. While publicly traded, the
Brazilian Government is a majority holder of the common stock. Cenovus Energy Inc., Husky Energy Inc., and Suncor Energy, Inc. were excluded due to Value Line information listed in Canadian dollars.
• Staff considered capitalization studies submitted by:
Enterprise Products Partners, L.P. – Liquid Pipeline Industry
• Staff relied upon the results of the following models and appraisal judgment in the development of equity rates:
4. Discounted Cash Flows 5. Capital Asset Pricing Model, Ex-Post and Ex-Ante 6. Earnings/Price Ratio

Industry Capitalization Rate
Mergents 2019 Twelve Month Bond Yield Averages
Equity Market Long Term CapitalizationIndustry Rate Capitalization Debt Rate
Fluid Pipeline (Petroleum Integrated) 13.20% 82.47% 17.53% 11.68%
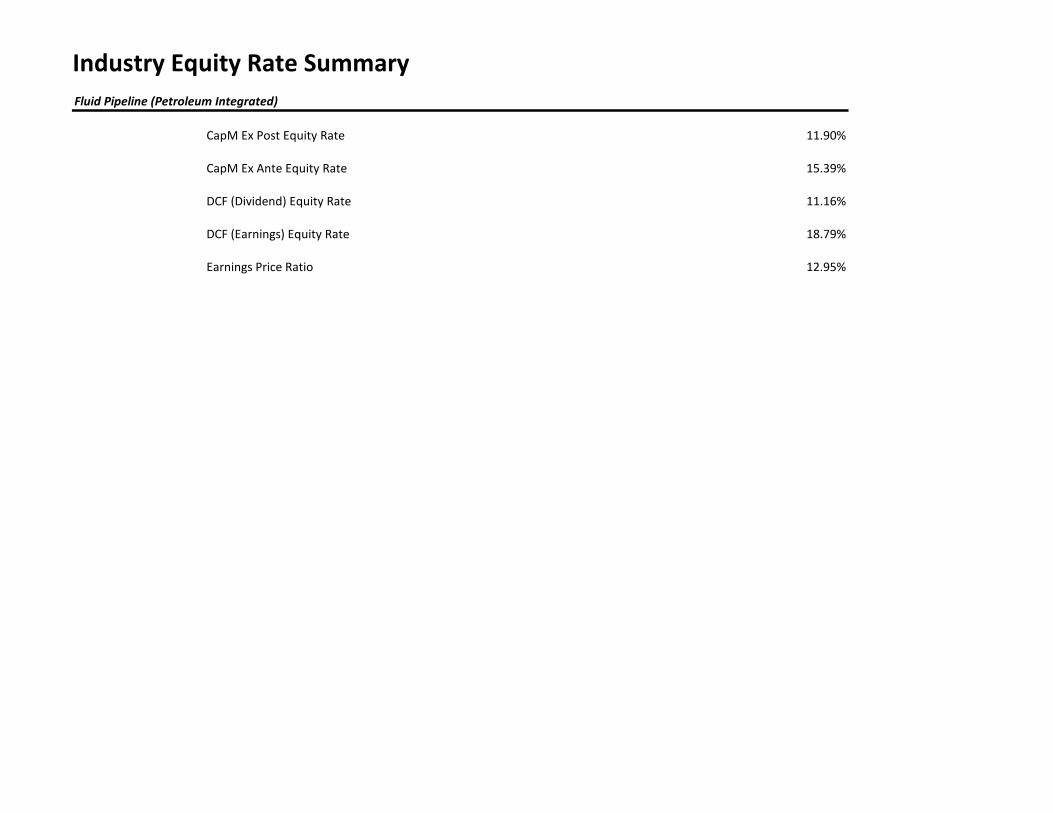
Industry Equity Rate SummaryFluid Pipeline (Petroleum Integrated)
CapM Ex Post Equity Rate 11.90%
CapM Ex Ante Equity Rate 15.39%
DCF (Dividend) Equity Rate 11.16%
DCF (Earnings) Equity Rate 18.79%
Earnings Price Ratio 12.95%

CapM Equity Rates
b* Risk Free Rate (2.25%) plus Risk Premium Rate (7.15%)c* Risk Free Rate (2.25%) plus Risk Premium Rate (9.73%)Value Line Investment Survey, November 2019 through January 2020, Morningstar
Ex Post Ex Ante Value Line Ex Post Ex AnteRisk Premium Risk Premium Beta CAPM Equity Rate CAPM Equity Rate
Industry b* c* d (((b-2.25%)*d)+2.25%) (((c-2.25%)*d)+2.25%)
Fluid Pipeline (Petroleum Integrated) 9.40% 11.98% 1.35 11.90% 15.39%

Discounted Cash Flow (Gordon Growth)
Value Line Investment Survey, November 2019 through January 2020
Value Market Dividend Equity Rate Equity RateLine Capitalization Yield Dividends Earnings Dividend Earnings
Industry Company Strength d e f g (e+f) (e+g)
Growth Estimate
Fluid Pipeline (Petroleum Integrated)BP p.l.c. B++ 132,000,000,000 6.40% 2.50% 0.00% 8.90% 6.40%CVR Energy, Inc. B+ 4,500,000,000 7.10% 8.50% 28.00% 15.60% 35.10%Chevron Corp. A++ 220,000,000,000 4.20% 3.50% 7.70% Delek US Holdings, Inc. B+ 2,600,000,000 3.40% 17.00% 20.40% Exxon Mobil Corp. A++ 287,000,000,000 5.20% 3.50% 11.00% 8.70% 16.20%Hess Corporation B 20,200,000,000 1.50% HollyFrontier Corporation B++ 8,400,000,000 2.70% 3.50% 17.00% 6.20% 19.70%Imperial Oil Ltd. A 18,700,000,000 2.70% 8.50% 16.00% 11.20% 18.70%Marathon Petroleum Corp. A 40,200,000,000 3.40% 11.50% 11.00% 14.90% 14.40%Murphy Oil Corp. B 3,600,000,000 4.30% 6.00% 10.30% Occidental Petroleum B++ 34,100,000,000 8.30% 3.00% 11.30% 8.30%PBF Energy, Inc. B+ 3,800,000,000 3.80% 2.50% 18.00% 6.30% 21.80%Par Pacific Holdings, Inc. B+ 1,300,000,000 Phillips 66 A+ 52,200,000,000 3.30% 11.00% 10.00% 14.30% 13.30%Royal Dutch Shell plc A+ 238,000,000,000 6.40% 2.50% 30.00% 8.90% 36.40%Total S.A. A++ 143,000,000,000 5.90% 5.00% 14.00% 10.90% 19.90%Valero Energy Corp. A+ 40,100,000,000 3.80% 8.00% 11.50% 11.80% 15.30%
Median 34,100,000,000 10.90% 17.45%Arithmetic Mean 73,511,764,706 11.16% 18.79%

E/P Ratio
Value Line Investment Survey, November 2019 through January 2020
Value Market Recent Projected E/PLine Capitalization Price Earnings Ratio
Industry Company Strength c d e (e/d)
Fluid Pipeline (Petroleum Integrated)BP p.l.c. B++ 132,000,000,000 38.65 5.85 15.14%CVR Energy, Inc. B+ 4,500,000,000 44.78 5.00 11.17%Chevron Corp. A++ 220,000,000,000 116.45 9.50 8.16%Delek US Holdings, Inc. B+ 2,600,000,000 35.28 6.25 17.72%Exxon Mobil Corp. A++ 287,000,000,000 67.82 6.25 9.22%Hess Corporation B 20,200,000,000 66.20 2.75 4.15%HollyFrontier Corporation B++ 8,400,000,000 52.30 8.00 15.30%Imperial Oil Ltd. A 18,700,000,000 24.85 2.90 11.67%Marathon Petroleum Corp. A 40,200,000,000 61.85 7.90 12.77%Murphy Oil Corp. B 3,600,000,000 23.17 4.50 19.42%Occidental Petroleum B++ 34,100,000,000 38.14 6.00 15.73%PBF Energy, Inc. B+ 3,800,000,000 31.94 6.00 18.79%Par Pacific Holdings, Inc. B+ 1,300,000,000 25.02 2.75 10.99%Phillips 66 A+ 52,200,000,000 117.42 11.50 9.79%Royal Dutch Shell plc A+ 238,000,000,000 58.94 8.75 14.85%Total S.A. A++ 143,000,000,000 53.66 7.50 13.98%Valero Energy Corp. A+ 40,100,000,000 97.62 11.00 11.27%
Median 34,100,000,000 12.77%Arithmetic Mean 73,511,764,706 12.95%

Capital Structure
Value Line Investment Survey, November 2019 through January 2020
Value Market Long Term Debt/Equity Percentage PercentageLine Capitalization Debt Ratio Equity Debt
Industry Company Strength c d (d/c) (c/(c+d)) (d/(c+d))
Fluid Pipeline (Petroleum Integrated)BP p.l.c. B++ 132,000,000,000 58,300,000,000 0.44 69.36% 30.64%CVR Energy, Inc. B+ 4,500,000,000 1,190,000,000 0.26 79.09% 20.91%Chevron Corp. A++ 220,000,000,000 25,056,000,000 0.11 89.78% 10.22%Delek US Holdings, Inc. B+ 2,600,000,000 1,935,000,000 0.74 57.33% 42.67%Exxon Mobil Corp. A++ 287,000,000,000 25,950,000,000 0.09 91.71% 8.29%Hess Corporation B 20,200,000,000 6,768,000,000 0.34 74.90% 25.10%HollyFrontier Corporation B++ 8,400,000,000 2,425,200,000 0.29 77.60% 22.40%Imperial Oil Ltd. A 18,700,000,000 3,795,000,000 0.20 83.13% 16.87%Marathon Petroleum Corp. A 40,200,000,000 28,282,000,000 0.70 58.70% 41.30%Murphy Oil Corp. B 3,600,000,000 2,779,200,000 0.77 56.43% 43.57%Occidental Petroleum B++ 34,100,000,000 47,583,000,000 1.40 41.75% 58.25%PBF Energy, Inc. B+ 3,800,000,000 2,064,000,000 0.54 64.80% 35.20%Par Pacific Holdings, Inc. B+ 1,300,000,000 638,300,000 0.49 67.07% 32.93%Phillips 66 A+ 52,200,000,000 11,083,000,000 0.21 82.49% 17.51%Royal Dutch Shell plc A+ 238,000,000,000 76,100,000,000 0.32 75.77% 24.23%Total S.A. A++ 143,000,000,000 47,900,000,000 0.33 74.91% 25.09%Valero Energy Corp. A+ 40,100,000,000 9,170,000,000 0.23 81.39% 18.61%
Median 34,100,000,000 9,170,000,000 0.33 74.91% 25.09%Arithmetic Mean 73,511,764,706 20,648,158,824 0.44 72.13% 27.87%Weighted Average 186,670,472,913 39,673,483,388 82.47% 17.53%

Beta
Value Line Investment Survey, November 2019 through January 2020
Value LineIndustry Company Levered Beta
Fluid Pipeline (Petroleum Integrated), Selected ComparablesBP p.l.c. 1.20CVR Energy, Inc. 1.40Chevron Corp. 1.25Delek US Holdings, Inc. 1.65Exxon Mobil Corp. 1.10Hess Corporation 1.80HollyFrontier Corporation 1.25Imperial Oil Ltd. 1.25Marathon Petroleum Corp. 1.50Murphy Oil Corp. 1.75Occidental Petroleum 1.25PBF Energy, Inc. 1.50Par Pacific Holdings, Inc. 0.95Phillips 66 1.25Royal Dutch Shell plc 1.25Total S.A. 1.25Valero Energy Corp. 1.30
Median 1.25Arithmetic Mean 1.35

Beta
Value Line Investment Survey, November 2019 through January 2020
Value LineIndustry Company Levered Beta
Fluid Pipeline (Petroleum Integrated), Value LineBP p.l.c. 1.20CVR Energy, Inc. 1.40Cenovus Energy, Inc. 1.40Chevron Corp. 1.25Delek US Holdings, Inc. 1.65Exxon Mobil Corp. 1.10Hess Corporation 1.80HollyFrontier Corporation 1.25Husky Energy Inc. 1.25Imperial Oil Ltd. 1.25Marathon Petroleum Corp. 1.50Murphy Oil Corp. 1.75Occidental Petroleum 1.25PBF Energy, Inc. 1.50Par Pacific Holdings, Inc. 0.95Petroleo Brasileiro S.A. (Petrobas) 1.90Phillips 66 1.25Royal Dutch Shell plc 1.25Suncor Energy Inc. 1.10Total S.A. 1.25Valero Energy Corp. 1.30
Median 1.25Arithmetic Mean 1.36

Mergents 2019 Corporate Bond Yield Averages
Month Public Utility Industrial Aa A Baa Aaa Aa A Baa
January 4.48% 4.41% 4.18% 4.35% 4.91% 3.93% 4.07% 4.32% 5.32%
February 4.35% 4.27% 4.05% 4.25% 4.76% 3.79% 3.93% 4.21% 5.13%
March 4.26% 4.21% 3.98% 4.16% 4.65% 3.77% 3.87% 4.17% 5.02%
April 4.18% 4.11% 3.91% 4.08% 4.55% 3.69% 3.79% 4.08% 4.85%
May 4.10% 4.06% 3.84% 3.98% 4.47% 3.67% 3.76% 4.03% 4.78%
June 3.93% 3.85% 3.65% 3.82% 4.31% 3.42% 3.53% 3.84% 4.60%
July 3.79% 3.70% 3.53% 3.69% 4.13% 3.29% 3.38% 3.70% 4.42%
August 3.36% 3.36% 3.17% 3.29% 3.63% 2.98% 2.99% 3.34% 4.11%
September 3.44% 3.38% 3.24% 3.37% 3.71% 3.03% 3.02% 3.35% 4.11%
October 3.45% 3.37% 3.24% 3.39% 3.72% 3.01% 3.01% 3.35% 4.12%
November 3.48% 3.40% 3.25% 3.43% 3.76% 3.06% 3.06% 3.37% 4.12%
December 3.45% 3.34% 3.22% 3.40% 3.73% 3.01% 3.00% 3.32% 4.03%
3.86% 3.79% 3.61% 3.77% 4.19% 3.39% 3.45% 3.76% 4.55%
Corporate by Groups Public Utility Bonds Industrial Bonds

Gas Distribution

2020 Capitalization Rate Study Gas Distribution (Natural Gas Utility) Industry Notes
• From the Natural Gas Utility Industry segment, UGI Corp. was excluded as they presented to primarily market propane gas.
• Staff considered capitalization studies submitted by:
Southern Star Central Gas Pipeline, Inc. – K.E. Andrews & CO.
• Staff relied upon the results of the following models and appraisal judgment in the development of equity rates:
1. Discounted Cash Flow 2. Capital Asset Pricing Model, Ex-Post and Ex Ante 3. Earnings/Price Ratio
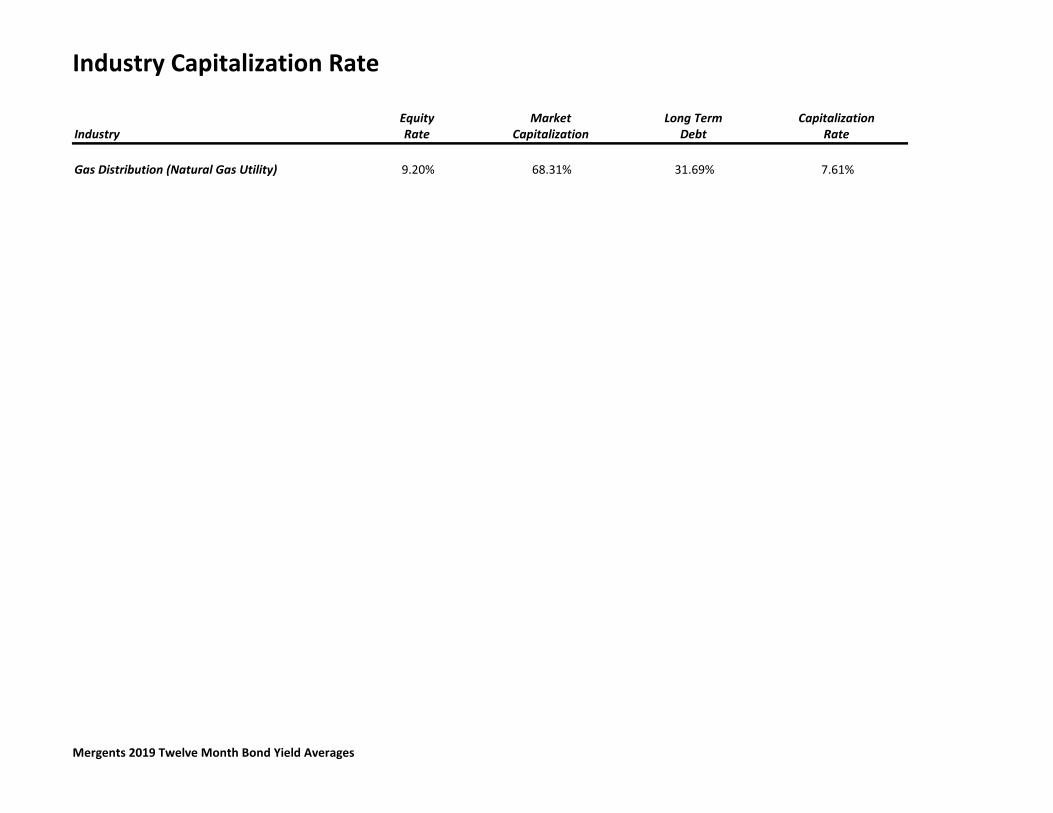
Industry Capitalization Rate
Mergents 2019 Twelve Month Bond Yield Averages
Equity Market Long Term CapitalizationIndustry Rate Capitalization Debt Rate
Gas Distribution (Natural Gas Utility) 9.20% 68.31% 31.69% 7.61%

Industry Equity Rate SummaryGas Distribution (Natural Gas Utility)
CapM Ex Post Equity Rate 6.97%
CapM Ex Ante Equity Rate 8.67%
DCF (Dividend) Equity Rate 9.03%
DCF (Earnings) Equity Rate 13.03%
Earnings Price Ratio 6.22%

CapM Equity Rates
b* Risk Free Rate (2.25%) plus Risk Premium Rate (7.15%)c* Risk Free Rate (2.25%) plus Risk Premium Rate (9.73%)Value Line Investment Survey, November 2019 through January 2020, Morningstar
Ex Post Ex Ante Value Line Ex Post Ex AnteRisk Premium Risk Premium Beta CAPM Equity Rate CAPM Equity Rate
Industry b* c* d (((b-2.25%)*d)+2.25%) (((c-2.25%)*d)+2.25%)
Gas Distribution (Natural Gas Utility) 9.40% 11.98% 0.66 6.97% 8.67%

Discounted Cash Flow (Gordon Growth)
Value Line Investment Survey, November 2019 through January 2020
Value Market Dividend Equity Rate Equity RateLine Capitalization Yield Dividends Earnings Dividend Earnings
Industry Company Strength d e f g (e+f) (e+g)
Growth Estimate
Gas Distribution (Natural Gas Utility)Atmos Energy Corporation A+ 12,800,000,000 2.10% 7.50% 7.50% 9.60% 9.60%Chesapeake Utilities Corporation A 1,500,000,000 1.90% 9.00% 9.00% 10.90% 10.90%New Jersey Resources Corp. A+ 3,900,000,000 2.90% 6.00% 2.50% 8.90% 5.40%NiSource Inc. B+ 9,700,000,000 3.10% 9.00% 12.50% 12.10% 15.60%Northwest Natural Holding Co. A 2,000,000,000 2.90% 2.50% 27.00% 5.40% 29.90%ONE Gas, Inc. A 4,600,000,000 2.50% 8.50% 8.00% 11.00% 10.50%South Jersey Industries, Inc. B++ 2,800,000,000 4.10% 4.00% 10.50% 8.10% 14.60%Southwest Gas Holdings, Inc. A 4,200,000,000 3.00% 5.00% 9.00% 8.00% 12.00%Spire Inc. B++ 3,800,000,000 3.30% 4.00% 5.50% 7.30% 8.80%
Median 3,900,000,000 8.90% 10.90%Arithmetic Mean 5,033,333,333 9.03% 13.03%

E/P Ratio
Value Line Investment Survey, November 2019 through January 2020
Value Market Recent Projected E/PLine Capitalization Price Earnings Ratio
Industry Company Strength c d e (e/d)
Gas Distribution (Natural Gas Utility)Atmos Energy Corporation A+ 12,800,000,000 108.64 5.60 5.15%Chesapeake Utilities Corporation A 1,500,000,000 90.36 5.00 5.53%New Jersey Resources Corp. A+ 3,900,000,000 42.98 2.35 5.47%NiSource Inc. B+ 9,700,000,000 26.04 1.80 6.91%Northwest Natural Holding Co. A 2,000,000,000 65.16 3.50 5.37%ONE Gas, Inc. A 4,600,000,000 87.92 4.75 5.40%South Jersey Industries, Inc. B++ 2,800,000,000 30.30 2.40 7.92%Southwest Gas Holdings, Inc. A 4,200,000,000 76.79 5.80 7.55%Spire Inc. B++ 3,800,000,000 75.00 5.00 6.67%
Median 3,900,000,000 5.53%Arithmetic Mean 5,033,333,333 6.22%

Capital Structure
Value Line Investment Survey, November 2019 through January 2020
Value Market Long Term Debt/Equity Percentage PercentageLine Capitalization Debt Ratio Equity Debt
Industry Company Strength c d (d/c) (c/(c+d)) (d/(c+d))
Gas Distribution (Natural Gas Utility)Atmos Energy Corporation A+ 12,800,000,000 3,529,100,000 0.28 78.39% 21.61%Chesapeake Utilities Corporation A 1,500,000,000 375,800,000 0.25 79.97% 20.03%New Jersey Resources Corp. A+ 3,900,000,000 1,211,800,000 0.31 76.29% 23.71%NiSource Inc. B+ 9,700,000,000 7,853,800,000 0.81 55.26% 44.74%Northwest Natural Holding Co. A 2,000,000,000 806,000,000 0.40 71.28% 28.72%ONE Gas, Inc. A 4,600,000,000 1,285,900,000 0.28 78.15% 21.85%South Jersey Industries, Inc. B++ 2,800,000,000 2,022,800,000 0.72 58.06% 41.94%Southwest Gas Holdings, Inc. A 4,200,000,000 2,462,100,000 0.59 63.04% 36.96%Spire Inc. B++ 3,800,000,000 2,042,300,000 0.54 65.04% 34.96%
Median 3,900,000,000 2,022,800,000 0.40 71.28% 28.72%Arithmetic Mean 5,033,333,333 2,398,844,444 0.46 69.50% 30.50%Weighted Average 7,515,894,040 3,486,459,161 68.31% 31.69%

Beta
Value Line Investment Survey, November 2019 through January 2020
Value LineIndustry Company Levered Beta
Gas Distribution (Natural Gas Utility), Selected ComparablesAtmos Energy Corporation 0.60Chesapeake Utilities Corporation 0.65New Jersey Resources Corp. 0.70NiSource Inc. 0.55Northwest Natural Holding Co. 0.60ONE Gas, Inc. 0.65South Jersey Industries, Inc. 0.80Southwest Gas Holdings, Inc. 0.70Spire Inc. 0.65
Median 0.65Arithmetic Mean 0.66
Gas Distribution (Natural Gas Utility), Value LineAtmos Energy Corporation 0.60Chesapeake Utilities Corporation 0.65New Jersey Resources Corp. 0.70NiSource Inc. 0.55Northwest Natural Holding Co. 0.60ONE Gas, Inc. 0.65South Jersey Industries, Inc. 0.80Southwest Gas Holdings, Inc. 0.70Spire Inc. 0.65UGI Corp. 0.80
Median 0.65Arithmetic Mean 0.67

Mergents 2019 Corporate Bond Yield Averages
Month Public Utility Industrial Aa A Baa Aaa Aa A Baa
January 4.48% 4.41% 4.18% 4.35% 4.91% 3.93% 4.07% 4.32% 5.32%
February 4.35% 4.27% 4.05% 4.25% 4.76% 3.79% 3.93% 4.21% 5.13%
March 4.26% 4.21% 3.98% 4.16% 4.65% 3.77% 3.87% 4.17% 5.02%
April 4.18% 4.11% 3.91% 4.08% 4.55% 3.69% 3.79% 4.08% 4.85%
May 4.10% 4.06% 3.84% 3.98% 4.47% 3.67% 3.76% 4.03% 4.78%
June 3.93% 3.85% 3.65% 3.82% 4.31% 3.42% 3.53% 3.84% 4.60%
July 3.79% 3.70% 3.53% 3.69% 4.13% 3.29% 3.38% 3.70% 4.42%
August 3.36% 3.36% 3.17% 3.29% 3.63% 2.98% 2.99% 3.34% 4.11%
September 3.44% 3.38% 3.24% 3.37% 3.71% 3.03% 3.02% 3.35% 4.11%
October 3.45% 3.37% 3.24% 3.39% 3.72% 3.01% 3.01% 3.35% 4.12%
November 3.48% 3.40% 3.25% 3.43% 3.76% 3.06% 3.06% 3.37% 4.12%
December 3.45% 3.34% 3.22% 3.40% 3.73% 3.01% 3.00% 3.32% 4.03%
3.86% 3.79% 3.61% 3.77% 4.19% 3.39% 3.45% 3.76% 4.55%
Corporate by Groups Public Utility Bonds Industrial Bonds

Gas Transmission

2020 Capitalization Rate Study Gas Transmission (Natural Gas Diversified) Industry Notes
• From the Gas Transmission Industry segment, Antero Resources Corporation, Cabot Oil & Gas, California Resources Corp. (CRC), Callon
Petroleum Co., Centennial Resource Development, Inc., Cimarex Energy Co., CNX Resources Corp., Concho Resources, Inc., Devon Energy Corp., Encana Corporation, EOG Resources, Inc., EQT Corporation, PDC Energy, Inc., QEP Resources, Inc., and WPX Energy, Inc. were excluded as they presented to be primarily engaged in the exploration and production of oil and natural gas. Brigham Minerals was excluded as they presented to be engaged in purchasing and operating mineral and royalty interests. Enerplus Corporation and Paramount Resources Lt. were excluded as Value Line reports all figures in Canadian dollars.
• Staff considered capitalization studies submitted by:
Southern Star Central Gas Pipeline, Inc. – K.E. Andrews & Co.
• Staff relied upon the results of the following models and appraisal judgment in the development of equity rates:
1. Discounted Cash Flow 2. Capital Asset Pricing Model, Ex-Post and Ex Ante 3. Earnings/Price Ratio

Industry Capitalization Rate
Mergents 2019 Twelve Month Bond Yield Averages
Equity Market Long Term CapitalizationIndustry Rate Capitalization Debt Rate
Gas Transmission (Natural Gas Diversified) 13.90% 59.23% 40.77% 10.09%

Industry Equity Rate SummaryGas Transmission (Natural Gas Diversified)
CapM Ex Post Equity Rate 12.12%
CapM Ex Ante Equity Rate 15.68%
DCF (Dividend) Equity Rate 8.30%
DCF (Earnings) Equity Rate 16.85%
Earnings Price Ratio 19.43%

CapM Equity Rates
b* Risk Free Rate (2.25%) plus Risk Premium Rate (7.15%)c* Risk Free Rate (2.25%) plus Risk Premium Rate (9.73%)Value Line Investment Survey, November 2019 through January 2020, Morningstar
Ex Post Ex Ante Value Line Ex Post Ex AnteRisk Premium Risk Premium Beta CAPM Equity Rate CAPM Equity Rate
Industry b* c* d (((b-2.25%)*d)+2.25%) (((c-2.25%)*d)+2.25%)
Gas Transmission (Natural Gas Diversified) 9.40% 11.98% 1.38 12.12% 15.68%
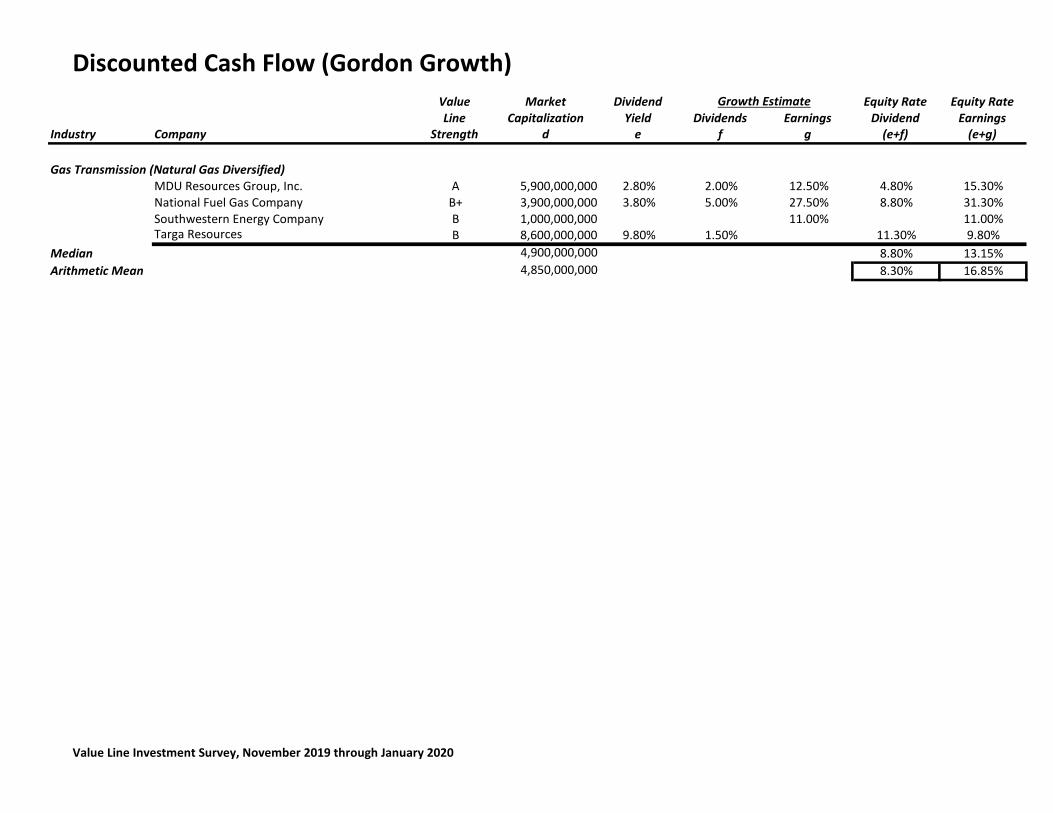
Discounted Cash Flow (Gordon Growth)
Value Line Investment Survey, November 2019 through January 2020
Value Market Dividend Equity Rate Equity RateLine Capitalization Yield Dividends Earnings Dividend Earnings
Industry Company Strength d e f g (e+f) (e+g)
Growth Estimate
Gas Transmission (Natural Gas Diversified)MDU Resources Group, Inc. A 5,900,000,000 2.80% 2.00% 12.50% 4.80% 15.30%National Fuel Gas Company B+ 3,900,000,000 3.80% 5.00% 27.50% 8.80% 31.30%Southwestern Energy Company B 1,000,000,000 11.00% 11.00%Targa Resources B 8,600,000,000 9.80% 1.50% 11.30% 9.80%
Median 4,900,000,000 8.80% 13.15%Arithmetic Mean 4,850,000,000 8.30% 16.85%

E/P Ratio
Value Line Investment Survey, November 2019 through January 2020
Value Market Recent Projected E/PLine Capitalization Price Earnings Ratio
Industry Company Strength c d e (e/d)
Gas Transmission (Natural Gas Diversified)MDU Resources Group, Inc. A 5,900,000,000 29.22 2.70 9.24%National Fuel Gas Company B+ 3,900,000,000 45.56 6.25 13.72%Southwestern Energy Company B 1,000,000,000 1.90 0.90 47.37%Targa Resources B 8,600,000,000 37.11 2.75 7.41%
Median 4,900,000,000 11.48%Arithmetic Mean 4,850,000,000 19.43%

Capital Structure
Value Line Investment Survey, November 2019 through January 2020
Value Market Long Term Debt/Equity Percentage PercentageLine Capitalization Debt Ratio Equity Debt
Industry Company Strength c d (d/c) (c/(c+d)) (d/(c+d))
Gas Transmission (Natural Gas Diversified)MDU Resources Group, Inc. A 5,900,000,000 2,180,900,000 0.37 73.01% 26.99%National Fuel Gas Company B+ 3,900,000,000 2,133,700,000 0.55 64.64% 35.36%Southwestern Energy Company B 1,000,000,000 2,219,000,000 2.22 31.07% 68.93%Targa Resources B 8,600,000,000 7,279,700,000 0.85 54.16% 45.84%
Median 4,900,000,000 2,199,950,000 0.70 59.40% 40.60%Arithmetic Mean 4,850,000,000 3,453,325,000 1.00 55.72% 44.28%Weighted Average 6,442,268,041 4,433,668,041 59.23% 40.77%

Beta
Value Line Investment Survey, November 2019 through January 2020
Value LineIndustry Company Levered Beta
Gas Transmission (Natural Gas Diversified), Selected ComparablesMDU Resources Group, Inc. 0.95National Fuel Gas Company 0.95Southwestern Energy Company 1.70Targa Resources 1.90
Median 1.33Arithmetic Mean 1.38
Gas Transmission (Natural Gas Diversified), Value LineAntero Resources Corporation 1.50Brigham MineralsCabot Oil & Gas 1.15California Resources Corp. (CRC) 3.35Callon Petroleum Co. 2.00Centennial Resource Development, Inc. 1.75Cimarex Energy Co. 1.50CNX Resource Corp. 1.50Concho Resources, Inc. 1.70Devon Energy Corp. 1.90Encana Corporation 1.85Enerplus Corporation 2.10EOG Resources, Inc. 1.45EQT CorporationMDU Resources Group, Inc. 0.95National Fuel Gas Company 0.95Paramount Resources Ltd. 2.20PDC Energy, Inc. 1.70QEP Resources, Inc. 2.10Southwestern Energy Company 1.70Targa Resources 1.90WPX Energy, Inc. 2.10
Median 1.73Arithmetic Mean 1.77

Mergents 2019 Corporate Bond Yield Averages
Month Public Utility Industrial Aa A Baa Aaa Aa A Baa
January 4.48% 4.41% 4.18% 4.35% 4.91% 3.93% 4.07% 4.32% 5.32%
February 4.35% 4.27% 4.05% 4.25% 4.76% 3.79% 3.93% 4.21% 5.13%
March 4.26% 4.21% 3.98% 4.16% 4.65% 3.77% 3.87% 4.17% 5.02%
April 4.18% 4.11% 3.91% 4.08% 4.55% 3.69% 3.79% 4.08% 4.85%
May 4.10% 4.06% 3.84% 3.98% 4.47% 3.67% 3.76% 4.03% 4.78%
June 3.93% 3.85% 3.65% 3.82% 4.31% 3.42% 3.53% 3.84% 4.60%
July 3.79% 3.70% 3.53% 3.69% 4.13% 3.29% 3.38% 3.70% 4.42%
August 3.36% 3.36% 3.17% 3.29% 3.63% 2.98% 2.99% 3.34% 4.11%
September 3.44% 3.38% 3.24% 3.37% 3.71% 3.03% 3.02% 3.35% 4.11%
October 3.45% 3.37% 3.24% 3.39% 3.72% 3.01% 3.01% 3.35% 4.12%
November 3.48% 3.40% 3.25% 3.43% 3.76% 3.06% 3.06% 3.37% 4.12%
December 3.45% 3.34% 3.22% 3.40% 3.73% 3.01% 3.00% 3.32% 4.03%
3.86% 3.79% 3.61% 3.77% 4.19% 3.39% 3.45% 3.76% 4.55%
Corporate by Groups Public Utility Bonds Industrial Bonds

Oil/Gas Distribution

2020 Capitalization Rate Study Oil/Gas Distribution Industry Notes
• From the Oil/Gas Distribution Industry, Clean Energy Fuels Corp was excluded as they develop and operate fueling stations and are
presented to be a provider of natural gas for vehicle fleets. Antero Midstream Corporation and Tellurian, Inc. were excluded as Value Line lacked sufficient financial information to report. Enbridge Inc. and Pembina Pipeline Corp. were excluded due to Value Line reports all figures in Canadian dollars. World Fuel Services Corp. was excluded as they presented to be primarily engaged in the marketing and sale of fuel and related products. Tellurian, Inc. was also excluded due to lack of financial information.
• Staff considered capitalization studies submitted by:
Southern Star Central Gas Pipeline, Inc. – K.E. Andrews & Co.
• Staff relied upon the results of the following models and appraisal judgment in the development of equity rates:
1. Discounted Cash Flow 2. Capital Asset Pricing Model, Ex-Post and Ex Ante 3. Earnings/Price Ratio

Industry Capitalization Rate
Mergents 2019 Twelve Month Bond Yield Averages
Equity Market Long Term CapitalizationIndustry Rate Capitalization Debt Rate
Oil/Gas Distribution 15.10% 45.95% 54.05% 9.40%

Industry Equity Rate SummaryOil/Gas Distribution
CapM Ex Post Equity Rate 12.83%
CapM Ex Ante Equity Rate 16.65%
DCF (Dividend) Equity Rate 17.56%
DCF (Earnings) Equity Rate 27.36%
Earnings Price Ratio 8.99%

CapM Equity Rates
b* Risk Free Rate (2.25%) plus Risk Premium Rate (7.15%)c* Risk Free Rate (2.25%) plus Risk Premium Rate (9.73%)Value Line Investment Survey, November 2019 through January 2020, Morningstar
Ex Post Ex Ante Value Line Ex Post Ex AnteRisk Premium Risk Premium Beta CAPM Equity Rate CAPM Equity Rate
Industry b* c* d (((b-2.25%)*d)+2.25%) (((c-2.25%)*d)+2.25%)
Oil/Gas Distribution 9.40% 11.98% 1.48 12.83% 16.65%

Discounted Cash Flow (Gordon Growth)
Value Line Investment Survey, November 2019 through January 2020
Value Market Dividend Equity Rate Equity RateLine Capitalization Yield Dividends Earnings Dividend Earnings
Industry Company Strength d e f g (e+f) (e+g)
Growth Estimate
Oil/Gas DistributionCheniere Energy, Inc. B 15,200,000,000EnLink Midstream, LLC B 2,300,000,000 24.10% 1.50% 25.60% 24.10%Kinder Morgan, Inc. B 45,300,000,000 5.00% 17.50% 35.50% 22.50% 40.50%ONEOK, Inc. B+ 28,800,000,000 5.40% 10.00% 17.00% 15.40% 22.40%TC Energy Corp. B++ 47,900,000,000 5.90% 5.50% 17.00% 11.40% 22.90%The Williams Companies, Inc. B+ 26,800,000,000 6.90% 6.00% 20.00% 12.90% 26.90%
Median 27,800,000,000 15.40% 24.10%Arithmetic Mean 27,716,666,667 17.56% 27.36%

E/P Ratio
Value Line Investment Survey, November 2019 through January 2020
Value Market Recent Projected E/PLine Capitalization Price Earnings Ratio
Industry Company Strength c d e (e/d)
Oil/Gas DistributionCheniere Energy, Inc. B 15,200,000,000 59.80 4.00 6.69%EnLink Midstream, LLC B 2,300,000,000 4.69 0.60 12.79%Kinder Morgan, Inc. B 45,300,000,000 20.01 1.90 9.50%ONEOK, Inc. B+ 28,800,000,000 69.76 5.25 7.53%TC Energy Corp. B++ 47,900,000,000 51.24 4.30 8.39%The Williams Companies, Inc. B+ 26,800,000,000 22.14 2.00 9.03%
Median 27,800,000,000 8.71%Arithmetic Mean 27,716,666,667 8.99%

Capital Structure
Value Line Investment Survey, November 2019 through January 2020
Value Market Long Term Debt/Equity Percentage PercentageLine Capitalization Debt Ratio Equity Debt
Industry Company Strength c d (d/c) (c/(c+d)) (d/(c+d))
Oil/Gas DistributionCheniere Energy, Inc. B 15,200,000,000 230,800,000,000 15.18 6.18% 93.82%EnLink Midstream, LLC B 2,300,000,000 4,688,000,000 2.04 32.91% 67.09%Kinder Morgan, Inc. B 45,300,000,000 32,100,000,000 0.71 58.53% 41.47%ONEOK, Inc. B+ 28,800,000,000 12,479,500,000 0.43 69.77% 30.23%TC Energy Corp. B++ 47,900,000,000 27,655,600,000 0.58 63.40% 36.60%The Williams Companies, Inc. B+ 26,800,000,000 20,719,000,000 0.77 56.40% 43.60%
Median 27,800,000,000 24,187,300,000 0.74 57.46% 42.54%Arithmetic Mean 27,716,666,667 54,740,350,000 3.29 47.86% 52.14%Weighted Average 36,864,161,155 43,370,140,950 45.95% 54.05%
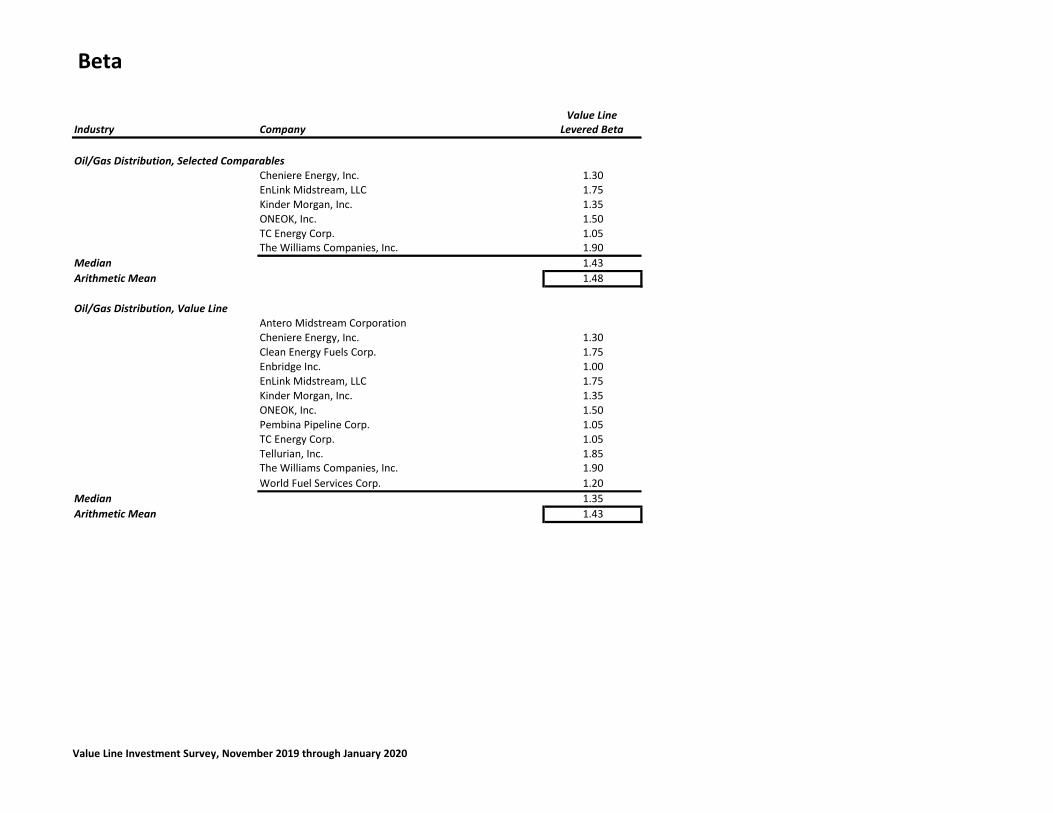
Beta
Value Line Investment Survey, November 2019 through January 2020
Value LineIndustry Company Levered Beta
Oil/Gas Distribution, Selected ComparablesCheniere Energy, Inc. 1.30EnLink Midstream, LLC 1.75Kinder Morgan, Inc. 1.35ONEOK, Inc. 1.50TC Energy Corp. 1.05The Williams Companies, Inc. 1.90
Median 1.43Arithmetic Mean 1.48
Oil/Gas Distribution, Value LineAntero Midstream CorporationCheniere Energy, Inc. 1.30Clean Energy Fuels Corp. 1.75Enbridge Inc. 1.00EnLink Midstream, LLC 1.75Kinder Morgan, Inc. 1.35ONEOK, Inc. 1.50Pembina Pipeline Corp. 1.05TC Energy Corp. 1.05Tellurian, Inc. 1.85The Williams Companies, Inc. 1.90World Fuel Services Corp. 1.20
Median 1.35Arithmetic Mean 1.43

Mergents 2019 Corporate Bond Yield Averages
Month Public Utility Industrial Aa A Baa Aaa Aa A Baa
January 4.48% 4.41% 4.18% 4.35% 4.91% 3.93% 4.07% 4.32% 5.32%
February 4.35% 4.27% 4.05% 4.25% 4.76% 3.79% 3.93% 4.21% 5.13%
March 4.26% 4.21% 3.98% 4.16% 4.65% 3.77% 3.87% 4.17% 5.02%
April 4.18% 4.11% 3.91% 4.08% 4.55% 3.69% 3.79% 4.08% 4.85%
May 4.10% 4.06% 3.84% 3.98% 4.47% 3.67% 3.76% 4.03% 4.78%
June 3.93% 3.85% 3.65% 3.82% 4.31% 3.42% 3.53% 3.84% 4.60%
July 3.79% 3.70% 3.53% 3.69% 4.13% 3.29% 3.38% 3.70% 4.42%
August 3.36% 3.36% 3.17% 3.29% 3.63% 2.98% 2.99% 3.34% 4.11%
September 3.44% 3.38% 3.24% 3.37% 3.71% 3.03% 3.02% 3.35% 4.11%
October 3.45% 3.37% 3.24% 3.39% 3.72% 3.01% 3.01% 3.35% 4.12%
November 3.48% 3.40% 3.25% 3.43% 3.76% 3.06% 3.06% 3.37% 4.12%
December 3.45% 3.34% 3.22% 3.40% 3.73% 3.01% 3.00% 3.32% 4.03%
3.86% 3.79% 3.61% 3.77% 4.19% 3.39% 3.45% 3.76% 4.55%
Corporate by Groups Public Utility Bonds Industrial Bonds
Pipeline MLPs Industry

2020 Capitalization Rate Study Pipeline MLPs Industry Notes
• From the Pipeline MLPs Industry segment, Suburban Propane Partners, L.P. were excluded due to being primarily involved in the
marketing and distribution of propane gas. Rattler Midstream LP was excluded due to lack of financial information.
• Staff considered capitalization studies submitted by: Enterprise Products Partners, L.P. – MLP Pipelines Industry Southern Star Central Gas Pipeline, Inc. – K.E. Andrews & Co.
• Staff relied upon the results of the following models and appraisal judgment in the development of equity rates:
7. Discounted Cash Flows 8. Capital Asset Pricing Model, Ex-Post and Ex-Ante 9. Earnings/Price Ratio

Industry Capitalization Rate
Mergents 2019 Twelve Month Bond Yield Averages
Equity Market Long Term CapitalizationIndustry Rate Capitalization Debt Rate
Pipeline MLPs 14.30% 57.98% 42.02% 10.20%

Industry Equity Rate SummaryPipeline MLPs
CapM Ex Post Equity Rate 11.69%
CapM Ex Ante Equity Rate 15.09%
DCF (Dividend) Equity Rate 17.87%
DCF (Earnings) Equity Rate 18.48%
Earnings Price Ratio 13.97%

CapM Equity Rates
b* Risk Free Rate (2.25%) plus Risk Premium Rate (7.15%)c* Risk Free Rate (2.25%) plus Risk Premium Rate (9.73%)Value Line Investment Survey, November 2019 through January 2020, Morningstar
Ex Post Ex Ante Value Line Ex Post Ex AnteRisk Premium Risk Premium Beta CAPM Equity Rate CAPM Equity Rate
Industry b* c* d (((b-2.25%)*d)+2.25%) (((c-2.25%)*d)+2.25%)
Pipeline MLPs 9.40% 11.98% 1.32 11.69% 15.09%

Discounted Cash Flow (Gordon Growth)
Value Line Investment Survey, November 2019 through January 2020
Value Market Dividend Equity Rate Equity RateLine Capitalization Yield Dividends Earnings Dividend Earnings
Industry Company Strength d e f g (e+f) (e+g)
Growth Estimate
Pipeline MLPsCheniere Energy Partners, L.P. B 19,500,000,000 6.60% 11.50% 18.10% 6.60%DCP Midstream LP B+ 3,000,000,000 14.80% 2.00% 17.50% 16.80% 32.30%EQM Midstream Partners, LP B++ 4,700,000,000 20.30% 4.50% 2.00% 24.80% 22.30%Enable Midstream Partners, LP B+ 3,900,000,000 14.60% 7.50% 18.50% 22.10% 33.10%Energy Transfer, L.P. B+ 29,900,000,000 10.70% 3.00% 13.00% 13.70% 23.70%Enterprise Products Partners, LP B++ 55,100,000,000 7.20% 8.50% 10.50% 15.70% 17.70%Holly Energy Partners, L.P. B 2,400,000,000 12.00% 2.50% 2.50% 14.50% 14.50%MPLX, LP B+ 24,000,000,000 8.80% 5.00% 13.80% 8.80%Magellan Midstream Partners, L.P. B++ 13,500,000,000 7.40% 9.50% 6.00% 16.90% 13.40%NuStar Energy L.P. B+ 3,000,000,000 8.60% -6.50% 9.50% 18.10%Phillips 66 Partners LP B++ 12,400,000,000 6.40% 16.00% 14.00% 22.40% 20.40%Plains All American Pipeline, L.P. B+ 12,600,000,000 9.10% 5.50% 12.00% 14.60% 21.10%Plains GP Holdings, L.P. B 3,100,000,000 8.40% 0.50% 8.90% 8.40%Shell Midstream Partners, L.P. B+ 4,600,000,000 9.50% 13.50% 12.50% 23.00% 22.00%Tallgrass Energy, LP B+ 3,200,000,000 12.40% 11.00% 23.40% 12.40%Western Gas Partners, LP B+ 8,100,000,000 13.90% 5.50% 7.00% 19.40% 20.90%
Median 6,400,000,000 16.90% 19.25%Arithmetic Mean 12,687,500,000 17.87% 18.48%
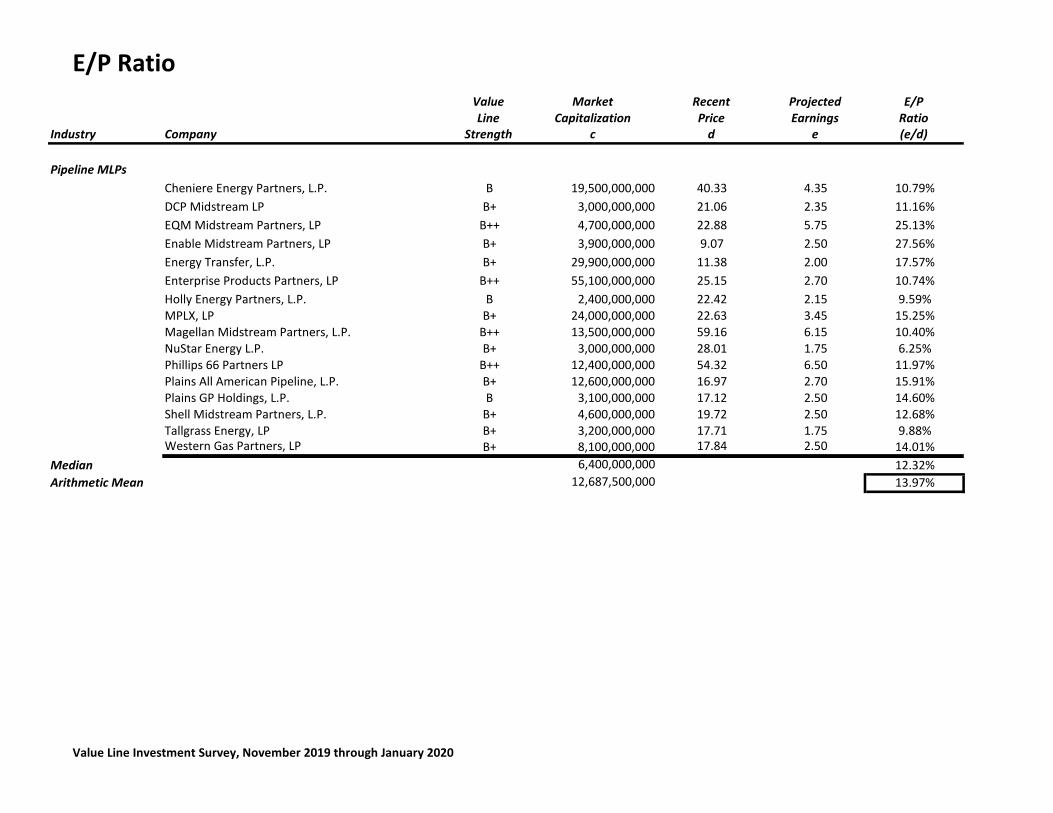
E/P Ratio
Value Line Investment Survey, November 2019 through January 2020
Value Market Recent Projected E/PLine Capitalization Price Earnings Ratio
Industry Company Strength c d e (e/d)
Pipeline MLPsCheniere Energy Partners, L.P. B 19,500,000,000 40.33 4.35 10.79%DCP Midstream LP B+ 3,000,000,000 21.06 2.35 11.16%EQM Midstream Partners, LP B++ 4,700,000,000 22.88 5.75 25.13%Enable Midstream Partners, LP B+ 3,900,000,000 9.07 2.50 27.56%Energy Transfer, L.P. B+ 29,900,000,000 11.38 2.00 17.57%Enterprise Products Partners, LP B++ 55,100,000,000 25.15 2.70 10.74%Holly Energy Partners, L.P. B 2,400,000,000 22.42 2.15 9.59%MPLX, LP B+ 24,000,000,000 22.63 3.45 15.25%Magellan Midstream Partners, L.P. B++ 13,500,000,000 59.16 6.15 10.40%NuStar Energy L.P. B+ 3,000,000,000 28.01 1.75 6.25%Phillips 66 Partners LP B++ 12,400,000,000 54.32 6.50 11.97%Plains All American Pipeline, L.P. B+ 12,600,000,000 16.97 2.70 15.91%Plains GP Holdings, L.P. B 3,100,000,000 17.12 2.50 14.60%Shell Midstream Partners, L.P. B+ 4,600,000,000 19.72 2.50 12.68%Tallgrass Energy, LP B+ 3,200,000,000 17.71 1.75 9.88%Western Gas Partners, LP B+ 8,100,000,000 17.84 2.50 14.01%
Median 6,400,000,000 12.32%Arithmetic Mean 12,687,500,000 13.97%
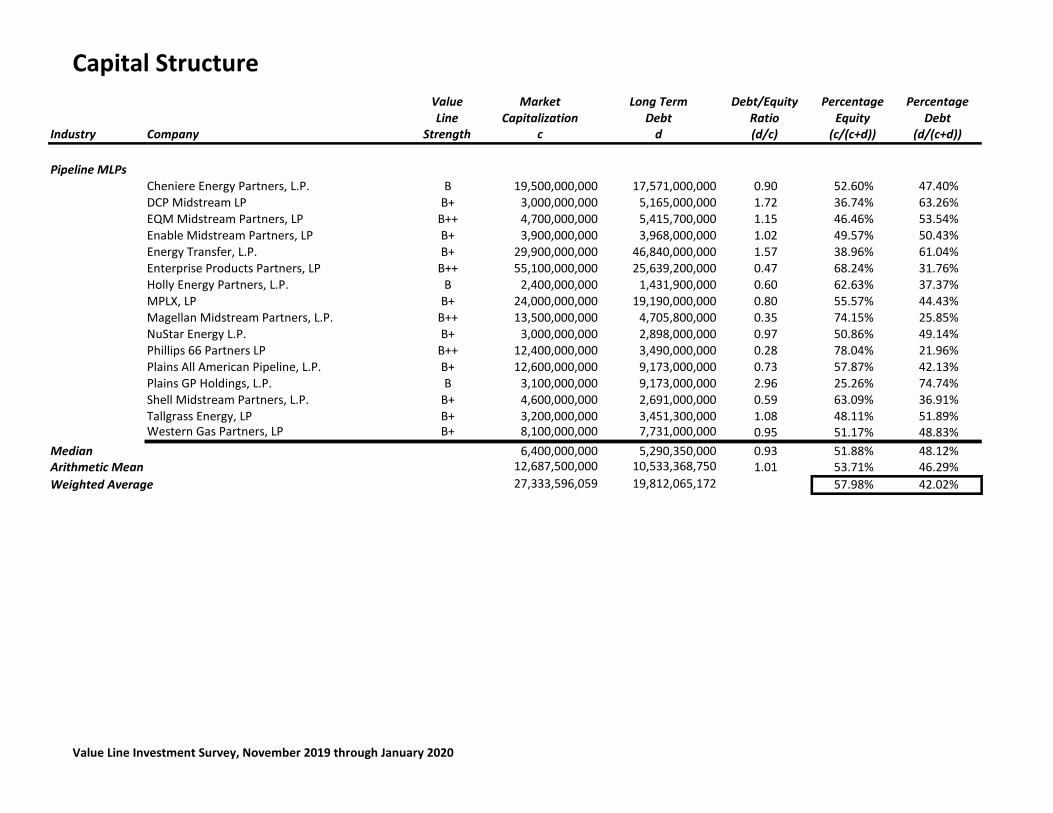
Capital Structure
Value Line Investment Survey, November 2019 through January 2020
Value Market Long Term Debt/Equity Percentage PercentageLine Capitalization Debt Ratio Equity Debt
Industry Company Strength c d (d/c) (c/(c+d)) (d/(c+d))
Pipeline MLPsCheniere Energy Partners, L.P. B 19,500,000,000 17,571,000,000 0.90 52.60% 47.40%DCP Midstream LP B+ 3,000,000,000 5,165,000,000 1.72 36.74% 63.26%EQM Midstream Partners, LP B++ 4,700,000,000 5,415,700,000 1.15 46.46% 53.54%Enable Midstream Partners, LP B+ 3,900,000,000 3,968,000,000 1.02 49.57% 50.43%Energy Transfer, L.P. B+ 29,900,000,000 46,840,000,000 1.57 38.96% 61.04%Enterprise Products Partners, LP B++ 55,100,000,000 25,639,200,000 0.47 68.24% 31.76%Holly Energy Partners, L.P. B 2,400,000,000 1,431,900,000 0.60 62.63% 37.37%MPLX, LP B+ 24,000,000,000 19,190,000,000 0.80 55.57% 44.43%Magellan Midstream Partners, L.P. B++ 13,500,000,000 4,705,800,000 0.35 74.15% 25.85%NuStar Energy L.P. B+ 3,000,000,000 2,898,000,000 0.97 50.86% 49.14%Phillips 66 Partners LP B++ 12,400,000,000 3,490,000,000 0.28 78.04% 21.96%Plains All American Pipeline, L.P. B+ 12,600,000,000 9,173,000,000 0.73 57.87% 42.13%Plains GP Holdings, L.P. B 3,100,000,000 9,173,000,000 2.96 25.26% 74.74%Shell Midstream Partners, L.P. B+ 4,600,000,000 2,691,000,000 0.59 63.09% 36.91%Tallgrass Energy, LP B+ 3,200,000,000 3,451,300,000 1.08 48.11% 51.89%Western Gas Partners, LP B+ 8,100,000,000 7,731,000,000 0.95 51.17% 48.83%
Median 6,400,000,000 5,290,350,000 0.93 51.88% 48.12%Arithmetic Mean 12,687,500,000 10,533,368,750 1.01 53.71% 46.29%Weighted Average 27,333,596,059 19,812,065,172 57.98% 42.02%

Beta
Value Line Investment Survey, November 2019 through January 2020
Value LineIndustry Company Levered Beta
Pipeline MLPs, Selected ComparablesCheniere Energy Partners, L.P. 1.00DCP Midstream LP 1.70EQM Midstream Partners, LP 1.15Enable Midstream Partners, LP 1.15Energy Transfer, L.P. 2.05Enterprise Products Partners, LP 1.25Holly Energy Partners, L.P. 0.95MPLX, LP 1.35Magellan Midstream Partners, L.P. 1.05NuStar Energy L.P. 1.45Phillips 66 Partners LP 0.95Plains All American Pipeline, L.P. 1.45Plains GP Holdings, L.P. 1.50Shell Midstream Partners, L.P. 1.20Tallgrass Energy, LP 1.40Western Gas Partners, LP 1.45
Median 1.30Arithmetic Mean 1.32

Beta
Value Line Investment Survey, November 2019 through January 2020
Value LineIndustry Company Levered Beta
Pipeline MLPs, Value LineCheniere Energy Partners, L.P. 1.00DCP Midstream LP 1.70EQM Midstream Partners, LP 1.15Enable Midstream Partners, LP 1.15Energy Transfer, L.P. 2.05Enterprise Products Partners, LP 1.25Holly Energy Partners, L.P. 0.95MPLX, LP 1.35Magellan Midstream Partners, L.P. 1.05NuStar Energy L.P. 1.45Phillips 66 Partners LP 0.95Plains All American Pipeline, L.P. 1.45Plains GP Holdings, L.P. 1.50Rattler Midstream LPShell Midstream Partners, L.P. 1.20Suburban Propane Partners, L.P. 0.95Tallgrass Energy, LP 1.40Western Gas Partners, LP 1.45
Median 1.25Arithmetic Mean 1.29

Mergents 2019 Corporate Bond Yield Averages
Month Public Utility Industrial Aa A Baa Aaa Aa A Baa
January 4.48% 4.41% 4.18% 4.35% 4.91% 3.93% 4.07% 4.32% 5.32%
February 4.35% 4.27% 4.05% 4.25% 4.76% 3.79% 3.93% 4.21% 5.13%
March 4.26% 4.21% 3.98% 4.16% 4.65% 3.77% 3.87% 4.17% 5.02%
April 4.18% 4.11% 3.91% 4.08% 4.55% 3.69% 3.79% 4.08% 4.85%
May 4.10% 4.06% 3.84% 3.98% 4.47% 3.67% 3.76% 4.03% 4.78%
June 3.93% 3.85% 3.65% 3.82% 4.31% 3.42% 3.53% 3.84% 4.60%
July 3.79% 3.70% 3.53% 3.69% 4.13% 3.29% 3.38% 3.70% 4.42%
August 3.36% 3.36% 3.17% 3.29% 3.63% 2.98% 2.99% 3.34% 4.11%
September 3.44% 3.38% 3.24% 3.37% 3.71% 3.03% 3.02% 3.35% 4.11%
October 3.45% 3.37% 3.24% 3.39% 3.72% 3.01% 3.01% 3.35% 4.12%
November 3.48% 3.40% 3.25% 3.43% 3.76% 3.06% 3.06% 3.37% 4.12%
December 3.45% 3.34% 3.22% 3.40% 3.73% 3.01% 3.00% 3.32% 4.03%
3.86% 3.79% 3.61% 3.77% 4.19% 3.39% 3.45% 3.76% 4.55%
Corporate by Groups Public Utility Bonds Industrial Bonds

Railroad
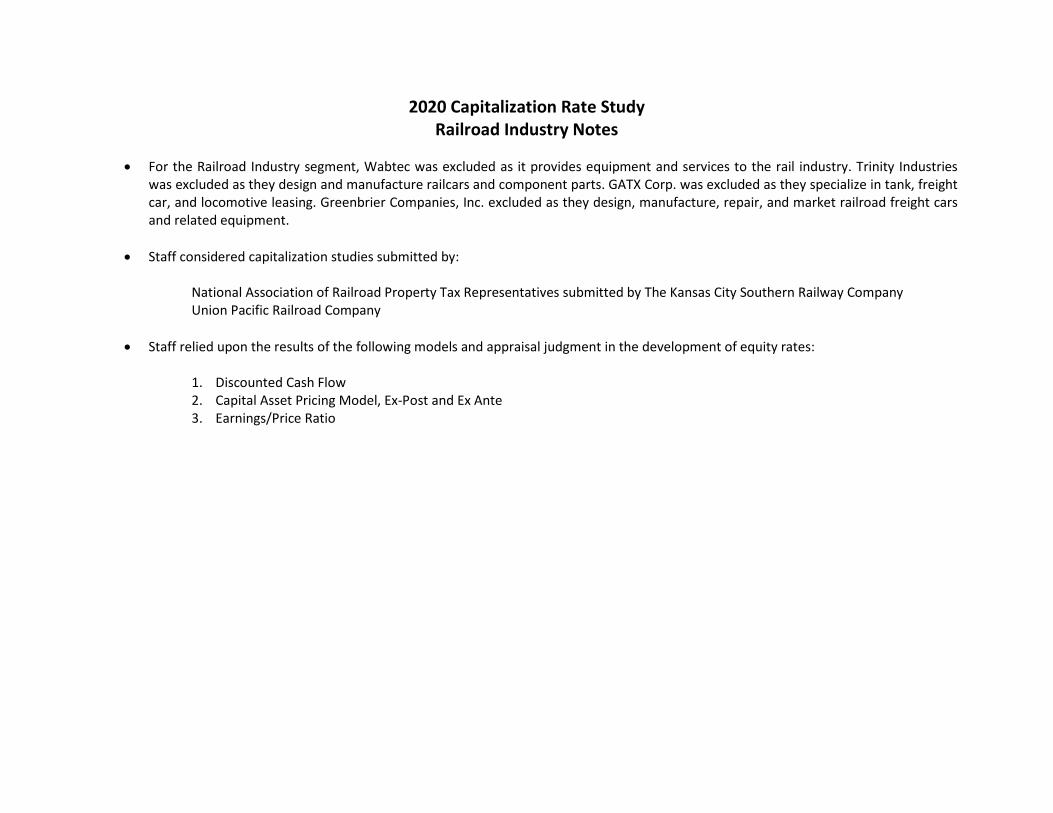
2020 Capitalization Rate Study Railroad Industry Notes
• For the Railroad Industry segment, Wabtec was excluded as it provides equipment and services to the rail industry. Trinity Industries
was excluded as they design and manufacture railcars and component parts. GATX Corp. was excluded as they specialize in tank, freight car, and locomotive leasing. Greenbrier Companies, Inc. excluded as they design, manufacture, repair, and market railroad freight cars and related equipment.
• Staff considered capitalization studies submitted by:
National Association of Railroad Property Tax Representatives submitted by The Kansas City Southern Railway Company Union Pacific Railroad Company
• Staff relied upon the results of the following models and appraisal judgment in the development of equity rates:
1. Discounted Cash Flow 2. Capital Asset Pricing Model, Ex-Post and Ex Ante 3. Earnings/Price Ratio

Industry Capitalization Rate
Mergents 2019 Twelve Month Bond Yield Averages
Equity Market Long Term CapitalizationIndustry Rate Capitalization Debt Rate
Railroad 13.20% 83.37% 16.63% 11.76%
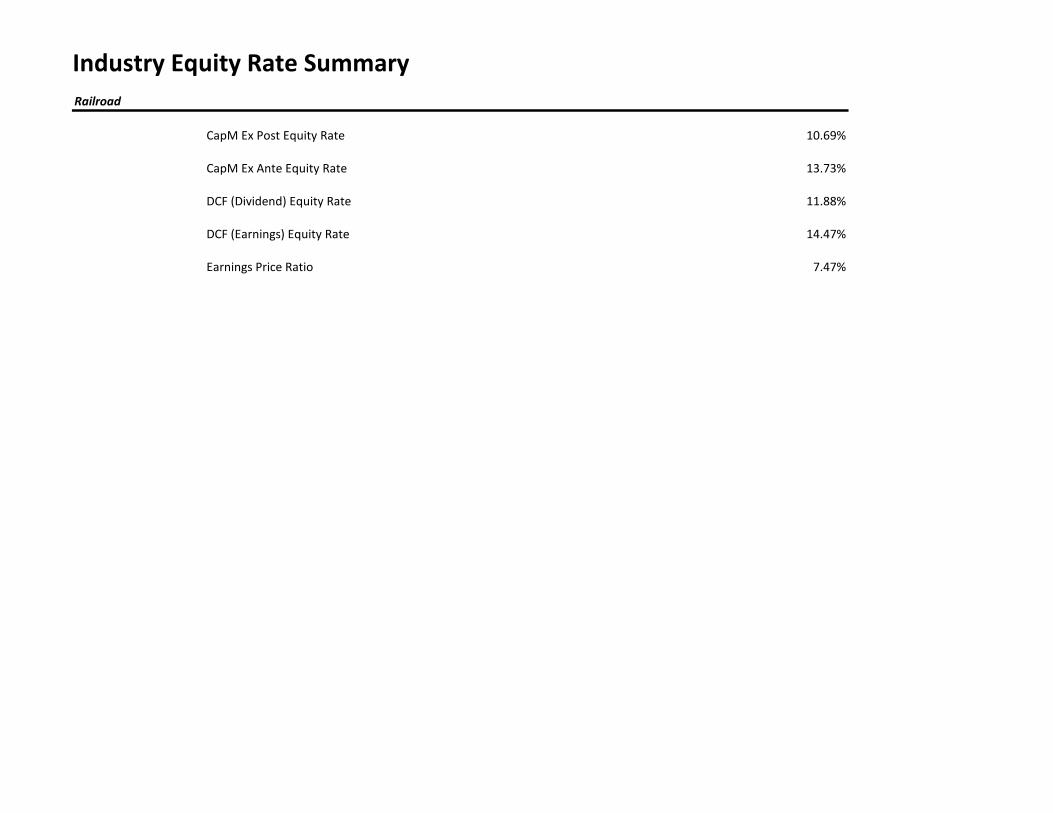
Industry Equity Rate SummaryRailroad
CapM Ex Post Equity Rate 10.69%
CapM Ex Ante Equity Rate 13.73%
DCF (Dividend) Equity Rate 11.88%
DCF (Earnings) Equity Rate 14.47%
Earnings Price Ratio 7.47%

CapM Equity Rates
b* Risk Free Rate (2.25%) plus Risk Premium Rate (7.15%)c* Risk Free Rate (2.25%) plus Risk Premium Rate (9.73%)Value Line Investment Survey, November 2019 through January 2020, Morningstar
Ex Post Ex Ante Value Line Ex Post Ex AnteRisk Premium Risk Premium Beta CAPM Equity Rate CAPM Equity Rate
Industry b* c* d (((b-2.25%)*d)+2.25%) (((c-2.25%)*d)+2.25%)
Railroad 9.40% 11.98% 1.18 10.69% 13.73%

Discounted Cash Flow (Gordon Growth)
Value Line Investment Survey, November 2019 through January 2020
Value Market Dividend Equity Rate Equity RateLine Capitalization Yield Dividends Earnings Dividend Earnings
Industry Company Strength d e f g (e+f) (e+g)
Growth Estimate
RailroadCanadian National Railway A 67,100,000,000 2.30% 8.00% 10.00% 10.30% 12.30%Canadian Pacific Railway Limited B++ 32,200,000,000 1.10% 15.00% 12.00% 16.10% 13.10%CSX Corporation B++ 56,900,000,000 1.30% 10.00% 14.50% 11.30% 15.80%Gennesee & Wyoming B+ 6,400,000,000 13.50% 13.50%Kansas City Southern, Inc. A 15,100,000,000 1.00% 8.00% 12.00% 9.00% 13.00%Norfolk Southern Corp. A+ 50,300,000,000 1.90% 10.50% 15.00% 12.40% 16.90%Union Pacific Corporation A++ 122,000,000,000 2.20% 10.00% 14.50% 12.20% 16.70%
Median 50,300,000,000 11.75% 13.50%Arithmetic Mean 50,000,000,000 11.88% 14.47%

E/P Ratio
Value Line Investment Survey, November 2019 through January 2020
Value Market Recent Projected E/PLine Capitalization Price Earnings Ratio
Industry Company Strength c d e (e/d)
RailroadCanadian National Railway A 67,100,000,000 93.13 6.85 7.36%Canadian Pacific Railway Limited B++ 32,200,000,000 235.09 18.10 7.70%CSX Corporation B++ 56,900,000,000 72.75 5.90 8.11%Gennesee & Wyoming B+ 6,400,000,000 111.46 7.40 6.64%Kansas City Southern, Inc. A 15,100,000,000 152.51 10.30 6.75%Norfolk Southern Corp. A+ 50,300,000,000 193.01 15.85 8.21%Union Pacific Corporation A++ 122,000,000,000 175.47 13.15 7.49%
Median 50,300,000,000 7.49%Arithmetic Mean 50,000,000,000 7.47%

Capital Structure
Value Line Investment Survey, November 2019 through January 2020
Value Market Long Term Debt/Equity Percentage PercentageLine Capitalization Debt Ratio Equity Debt
Industry Company Strength c d (d/c) (c/(c+d)) (d/(c+d))
RailroadCanadian National Railway A 67,100,000,000 8,806,000,000 0.13 88.40% 11.60%Canadian Pacific Railway Limited B++ 32,200,000,000 6,315,000,000 0.20 83.60% 16.40%CSX Corporation B++ 56,900,000,000 15,992,000,000 0.28 78.06% 21.94%Gennesee & Wyoming B+ 6,400,000,000 2,176,600,000 0.34 74.62% 25.38%Kansas City Southern, Inc. A 15,100,000,000 2,394,800,000 0.16 86.31% 13.69%Norfolk Southern Corp. A+ 50,300,000,000 11,085,000,000 0.22 81.94% 18.06%Union Pacific Corporation A++ 122,000,000,000 24,314,000,000 0.20 83.38% 16.62%
Median 50,300,000,000 8,806,000,000 0.22 83.38% 16.62%Arithmetic Mean 50,000,000,000 10,154,771,429 0.24 82.33% 17.67%Weighted Average 75,599,771,429 15,080,416,057 83.37% 16.63%

Beta
Value Line Investment Survey, November 2019 through January 2020
Value LineIndustry Company Levered Beta
Railroad, Selected ComparablesCanadian National Railway 1.05Canadian Pacific Railway Limited 1.15CSX Corporation 1.25Gennesee & Wyoming 1.35Kansas City Southern, Inc. 1.10Norfolk Southern Corp. 1.20Union Pacific Corporation 1.15
Median 1.15Arithmetic Mean 1.18
Railroad, Value LineCanadian National Railway 1.05Canadian Pacific Railway Limited 1.15CSX Corporation 1.25GATX Corp. 1.25Gennesee & Wyoming 1.35The Greenbriar Companies, Inc. 1.75Kansas City Southern, Inc. 1.10Norfolk Southern Corp. 1.20Trinity Industries Inc.Union Pacific Corporation 1.15Wabtec 1.20
Median 1.15Arithmetic Mean 1.25

Mergents 2019 Corporate Bond Yield Averages
Month Public Utility Industrial Aa A Baa Aaa Aa A Baa
January 4.48% 4.41% 4.18% 4.35% 4.91% 3.93% 4.07% 4.32% 5.32%
February 4.35% 4.27% 4.05% 4.25% 4.76% 3.79% 3.93% 4.21% 5.13%
March 4.26% 4.21% 3.98% 4.16% 4.65% 3.77% 3.87% 4.17% 5.02%
April 4.18% 4.11% 3.91% 4.08% 4.55% 3.69% 3.79% 4.08% 4.85%
May 4.10% 4.06% 3.84% 3.98% 4.47% 3.67% 3.76% 4.03% 4.78%
June 3.93% 3.85% 3.65% 3.82% 4.31% 3.42% 3.53% 3.84% 4.60%
July 3.79% 3.70% 3.53% 3.69% 4.13% 3.29% 3.38% 3.70% 4.42%
August 3.36% 3.36% 3.17% 3.29% 3.63% 2.98% 2.99% 3.34% 4.11%
September 3.44% 3.38% 3.24% 3.37% 3.71% 3.03% 3.02% 3.35% 4.11%
October 3.45% 3.37% 3.24% 3.39% 3.72% 3.01% 3.01% 3.35% 4.12%
November 3.48% 3.40% 3.25% 3.43% 3.76% 3.06% 3.06% 3.37% 4.12%
December 3.45% 3.34% 3.22% 3.40% 3.73% 3.01% 3.00% 3.32% 4.03%
3.86% 3.79% 3.61% 3.77% 4.19% 3.39% 3.45% 3.76% 4.55%
Corporate by Groups Public Utility Bonds Industrial Bonds

Telecommunication Services

2020 Capitalization Rate Study Telecommunication Services Industry Notes
• From the Telecommunication Services segment, America Movil, TELUS Corporation, Liberty Latin America Ltd., China Mobile Ltd.,
Intelsat S.A., Millicom International Celullar S.A., and Vodafone Group PLC, were excluded as being principally and primarily involved in non-domestic operations. Dycom, Inc. was excluded as the company is principally engaged in the telecommunications and electrical services business providing engineering, construction, maintenance and installation to telecommunication providers. Gogo Inc. was excluded as they offer wireless services to airlines. J2 Global Communications and Bandwidth Inc. were excluded as they principally offer value-added and tandem interconnection services. Zoom Video Communications, Inc. was excluded as to the lack of financial information.
• Staff considered capitalization studies submitted by:
Duff & Phelps – Communications Wireline Carriers on behalf of Windstream Companies, Cox Oklahoma Telecom, LLC, and
CenturyLink Communications, LLC
• Staff relied upon the results of the following models and appraisal judgment in the development of equity rates:
1. Discounted Cash Flow 2. Capital Asset Pricing Model, Ex-Post and Ex Ante 3. Earnings/Price Ratio

Industry Capitalization Rate
Mergents 2019 Twelve Month Bond Yield Averages
Equity Market Long Term CapitalizationIndustry Rate Capitalization Debt Rate
Telecommunications Services 12.30% 67.00% 33.00% 9.74%

Industry Equity Rate SummaryTelecommunications Services
CapM Ex Post Equity Rate 9.69%
CapM Ex Ante Equity Rate 12.37%
DCF (Dividend) Equity Rate 7.58%
DCF (Earnings) Equity Rate 15.60%
Earnings Price Ratio 7.93%
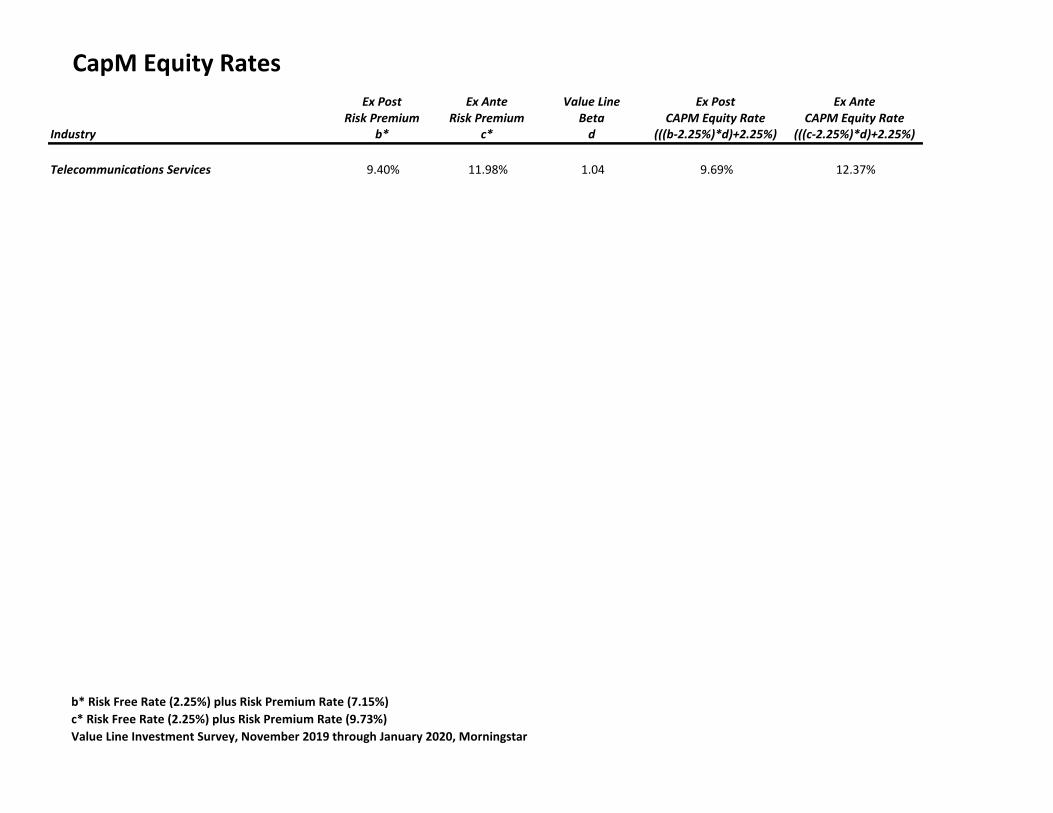
CapM Equity Rates
b* Risk Free Rate (2.25%) plus Risk Premium Rate (7.15%)c* Risk Free Rate (2.25%) plus Risk Premium Rate (9.73%)Value Line Investment Survey, November 2019 through January 2020, Morningstar
Ex Post Ex Ante Value Line Ex Post Ex AnteRisk Premium Risk Premium Beta CAPM Equity Rate CAPM Equity Rate
Industry b* c* d (((b-2.25%)*d)+2.25%) (((c-2.25%)*d)+2.25%)
Telecommunications Services 9.40% 11.98% 1.04 9.69% 12.37%

Discounted Cash Flow (Gordon Growth)
Value Line Investment Survey, November 2019 through January 2020
Value Market Dividend Equity Rate Equity RateLine Capitalization Yield Dividends Earnings Dividend Earnings
Industry Company Strength d e f g (e+f) (e+g)
Growth Estimate
Telecommunications ServicesAT&T Inc. A++ 274,000,000,000 5.50% 4.50% 5.50% 10.00% 11.00%ATN International, Inc. B++ 900,000,000 1.20% -4.00% 16.00% 17.20%IDT Corporation B 200,000,000 12.50% 12.50%Intelsat, S.A. C+ 900,000,000Iridium Communications Inc. B 3,100,000,000 22.50% 22.50%Ooma, Inc. B 300,000,000Shenandoah Telecommunications Company B 1,900,000,000 0.80% 7.50% 19.50% 8.30% 20.30%Sprint Corporation C++ 23,400,000,000Telephone & Data Systems, Inc. B 2,700,000,000 2.90% 3.00% 7.50% 5.90% 10.40%T-Mobile US, Inc. B+ 66,700,000,000 18.50% 18.50%U.S. Cellular B+ 2,900,000,000 15.00% 15.00%Verizon Communications A++ 250,000,000,000 4.10% 2.00% 4.00% 6.10% 8.10%Vonage Holdings Corp. B 1,800,000,000 20.50% 20.50%
Median 2,700,000,000 7.20% 16.10%Arithmetic Mean 48,369,230,769 7.58% 15.60%

E/P Ratio
Value Line Investment Survey, November 2019 through January 2020
Value Market Recent Projected E/PLine Capitalization Price Earnings Ratio
Industry Company Strength c d e (e/d)
Telecommunications ServicesAT&T Inc. A++ 274,000,000,000 37.55 4.35 11.58%ATN International, Inc. B++ 900,000,000 55.87 3.20 5.73%IDT Corporation B 200,000,000 7.11 0.80 11.25%Intelsat, S.A. C+ 900,000,000 6.43 1.00 15.55%Iridium Communications Inc. B 3,100,000,000 23.82 1.65 6.93%Ooma, Inc. B 300,000,000 13.87 0.30 2.16%Shenandoah Telecommunications Company B 1,900,000,000 37.69 2.15 5.70%Sprint Corporation C++ 23,400,000,000 5.69 0.35 6.15%Telephone & Data Systems, Inc. B 2,700,000,000 23.50 1.50 6.38%T-Mobile US, Inc. B+ 66,700,000,000 78.01 6.15 7.88%U.S. Cellular B+ 2,900,000,000 33.60 1.85 5.51%Verizon Communications A++ 250,000,000,000 60.14 5.25 8.73%Vonage Holdings Corp. B 1,800,000,000 7.36 0.70 9.51%
Median 2,700,000,000 6.93%Arithmetic Mean 48,369,230,769 7.93%

Capital Structure
Value Line Investment Survey, November 2019 through January 2020
Value Market Long Term Debt/Equity Percentage PercentageLine Capitalization Debt Ratio Equity Debt
Industry Company Strength c d (d/c) (c/(c+d)) (d/(c+d))
Telecommunications ServicesAT&T Inc. A++ 274,000,000,000 153,568,000,000 0.56 64.08% 35.92%ATN International, Inc. B++ 900,000,000 83,600,000 0.09 91.50% 8.50%IDT Corporation B 200,000,000 0 100.00% 0.00%Intelsat, S.A. C+ 900,000,000 14,454,600,000 1.50 5.86% 94.14%Iridium Communications Inc. B 3,100,000,000 1,631,500,000 0.53 65.52% 34.48%Ooma, Inc. B 300,000,000 0 100.00% 0.00%Shenandoah Telecommunications Company B 1,900,000,000 696,400,000 0.37 73.18% 26.82%Sprint Corporation C++ 23,400,000,000 33,268,000,000 1.42 41.29% 58.71%Telephone & Data Systems, Inc. B 2,700,000,000 2,405,000,000 0.89 52.89% 47.11%T-Mobile US, Inc. B+ 66,700,000,000 28,623,000,000 0.43 69.97% 30.03%U.S. Cellular B+ 2,900,000,000 1,592,000,000 0.55 64.56% 35.44%Verizon Communications A++ 250,000,000,000 101,769,000,000 0.41 71.07% 28.93%Vonage Holdings Corp. B 1,800,000,000 508,800,000 0.28 77.96% 22.04%
Median 2,700,000,000 1,631,500,000 0.43 69.97% 30.03%Arithmetic Mean 48,369,230,769 26,046,146,154 0.54 67.53% 32.47%Weighted Average 226,791,284,987 111,703,242,096 67.00% 33.00%

Beta
Value Line Investment Survey, November 2019 through January 2020
Value LineIndustry Company Levered Beta
Telecommunications Services, Selected ComparablesAT&T Inc. 0.75ATN International, Inc. 0.80IDT CorporationIntelsat, S.A. 1.50Iridium Communications Inc. 1.25Ooma, Inc. 1.05Shenandoah Telecommunications Company 1.00Sprint Corporation 1.20Telephone & Data Systems, Inc. 1.20T-Mobile US, Inc. 0.95U.S. Cellular 1.15Verizon Communications 0.75Vonage Holdings Corp. 0.85
Median 1.03Arithmetic Mean 1.04
Beta
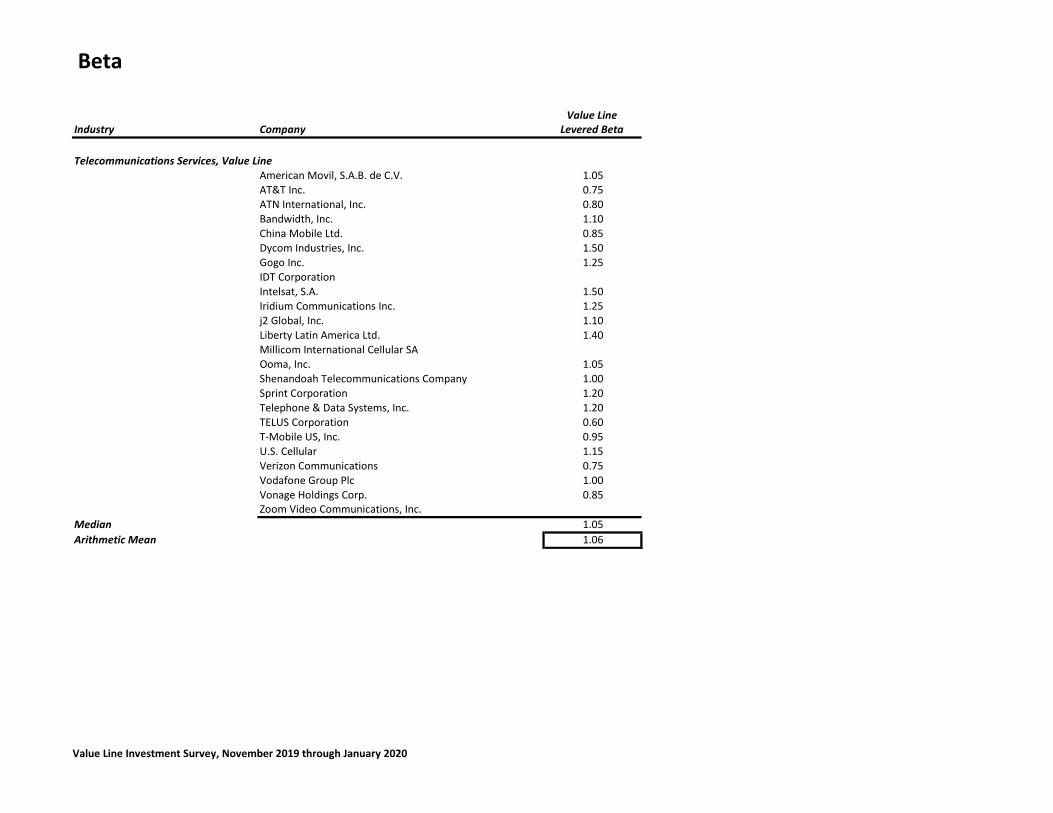
Value Line Investment Survey, November 2019 through January 2020
Value LineIndustry Company Levered Beta
Telecommunications Services, Value LineAmerican Movil, S.A.B. de C.V. 1.05AT&T Inc. 0.75ATN International, Inc. 0.80Bandwidth, Inc. 1.10China Mobile Ltd. 0.85Dycom Industries, Inc. 1.50Gogo Inc. 1.25IDT CorporationIntelsat, S.A. 1.50Iridium Communications Inc. 1.25j2 Global, Inc. 1.10Liberty Latin America Ltd. 1.40Millicom International Cellular SAOoma, Inc. 1.05Shenandoah Telecommunications Company 1.00Sprint Corporation 1.20Telephone & Data Systems, Inc. 1.20TELUS Corporation 0.60T-Mobile US, Inc. 0.95U.S. Cellular 1.15Verizon Communications 0.75Vodafone Group Plc 1.00Vonage Holdings Corp. 0.85Zoom Video Communications, Inc.
Median 1.05Arithmetic Mean 1.06

Mergents 2019 Corporate Bond Yield Averages
Month Public Utility Industrial Aa A Baa Aaa Aa A Baa
January 4.48% 4.41% 4.18% 4.35% 4.91% 3.93% 4.07% 4.32% 5.32%
February 4.35% 4.27% 4.05% 4.25% 4.76% 3.79% 3.93% 4.21% 5.13%
March 4.26% 4.21% 3.98% 4.16% 4.65% 3.77% 3.87% 4.17% 5.02%
April 4.18% 4.11% 3.91% 4.08% 4.55% 3.69% 3.79% 4.08% 4.85%
May 4.10% 4.06% 3.84% 3.98% 4.47% 3.67% 3.76% 4.03% 4.78%
June 3.93% 3.85% 3.65% 3.82% 4.31% 3.42% 3.53% 3.84% 4.60%
July 3.79% 3.70% 3.53% 3.69% 4.13% 3.29% 3.38% 3.70% 4.42%
August 3.36% 3.36% 3.17% 3.29% 3.63% 2.98% 2.99% 3.34% 4.11%
September 3.44% 3.38% 3.24% 3.37% 3.71% 3.03% 3.02% 3.35% 4.11%
October 3.45% 3.37% 3.24% 3.39% 3.72% 3.01% 3.01% 3.35% 4.12%
November 3.48% 3.40% 3.25% 3.43% 3.76% 3.06% 3.06% 3.37% 4.12%
December 3.45% 3.34% 3.22% 3.40% 3.73% 3.01% 3.00% 3.32% 4.03%
3.86% 3.79% 3.61% 3.77% 4.19% 3.39% 3.45% 3.76% 4.55%
Corporate by Groups Public Utility Bonds Industrial Bonds
Telecommunications Utility

2020 Capitalization Rate Study Telecommunications Utility Industry Notes
• From the Telecommunication Utility segment, BCE Inc., Deutsche Telecom AG, and Telefonica, S.A. were excluded as being principally
and primarily involved in non-domestic operations.
• Staff considered capitalization studies submitted by:
Duff & Phelps – Communications Wireline Carriers on behalf of Windstream Companies, Cox Oklahoma Telecom, LLC, and CenturyLink Communications, LLC
• Staff relied upon the results of the following models and appraisal judgment in the development of equity rates:
1. Discounted Cash Flow 2. Capital Asset Pricing Model, Ex-Post and Ex-Ante 3. Earnings/Price Ratio

Industry Capitalization Rate
Mergents 2019 Twelve Month Bond Yield Averages
Equity Market Long Term CapitalizationIndustry Rate Capitalization Debt Rate
Telecommunications Utility 13.70% 31.67% 68.33% 7.21%

Industry Equity Rate SummaryTelecommunications Utility
CapM Ex Post Equity Rate 11.55%
CapM Ex Ante Equity Rate 14.90%
DCF (Dividend) Equity Rate
DCF (Earnings) Equity Rate 8.00%
Earnings Price Ratio 15.51%

CapM Equity Rates
b* Risk Free Rate (2.25%) plus Risk Premium Rate (7.15%)c* Risk Free Rate (2.25%) plus Risk Premium Rate (9.73%)Value Line Investment Survey, November 2019 through January 2020, Morningstar
Ex Post Ex Ante Value Line Ex Post Ex AnteRisk Premium Risk Premium Beta CAPM Equity Rate CAPM Equity Rate
Industry b* c* d (((b-2.25%)*d)+2.25%) (((c-2.25%)*d)+2.25%)
Telecommunications Utility 9.40% 11.98% 1.30 11.55% 14.90%

Discounted Cash Flow (Gordon Growth)
Value Line Investment Survey, November 2019 through January 2020
Value Market Dividend Equity Rate Equity RateLine Capitalization Yield Dividends Earnings Dividend Earnings
Industry Company Strength d e f g (e+f) (e+g)
Growth Estimate
Telecommunications UtilityCenturyLink, Inc. B 15,500,000,000 7.00% -12.50% 1.00% 8.00%Cincinnati Bell C+ 325,000,000Consolidated Communications Holdings, Inc. C+ 275,000,000
Median 325,000,000 8.00%Arithmetic Mean 5,366,666,667 8.00%

E/P Ratio
Value Line Investment Survey, November 2019 through January 2020
Value Market Recent Projected E/PLine Capitalization Price Earnings Ratio
Industry Company Strength c d e (e/d)
Telecommunications UtilityCenturyLink, Inc. B 15,500,000,000 14.19 1.40 9.87%Cincinnati Bell C+ 325,000,000 6.45 0.30 4.65%Consolidated Communications Holdings, Inc. C+ 275,000,000 3.75 1.20 32.00%
Median 325,000,000 9.87%Arithmetic Mean 5,366,666,667 15.51%

Capital Structure
Value Line Investment Survey, November 2019 through January 2020
Value Market Long Term Debt/Equity Percentage PercentageLine Capitalization Debt Ratio Equity Debt
Industry Company Strength c d (d/c) (c/(c+d)) (d/(c+d))
Telecommunications UtilityCenturyLink, Inc. B 15,500,000,000 33,381,000,000 2.15 31.71% 68.29%Cincinnati Bell C+ 325,000,000 1,904,000,000 5.86 14.58% 85.42%Consolidated Communications Holdings, Inc. C+ 275,000,000 2,285,200,000 8.31 10.74% 89.26%
Median 325,000,000 2,285,200,000 5.86 14.58% 85.42%Arithmetic Mean 5,366,666,667 12,523,400,000 5.44 19.01% 80.99%Weighted Average 14,933,618,012 32,214,455,280 31.67% 68.33%

Beta
Value Line Investment Survey, November 2019 through January 2020
Value LineIndustry Company Levered Beta
Telecommunications Utility, Selected ComparablesCenturyLink, Inc. 1.10Cincinnati Bell 1.70Consolidated Communications Holdings, Inc. 1.10
Median 1.10Arithmetic Mean 1.30
Telecommunications Utility, Value LineBCE Inc. 0.70CenturyLink, Inc. 1.10Cincinnati Bell 1.70Consolidated Communications Holdings, Inc. 1.10Deutsche Telekom AG 0.85Telefonica, S.A. 1.10
Median 1.10Arithmetic Mean 1.09

Mergents 2019 Corporate Bond Yield Averages
Month Public Utility Industrial Aa A Baa Aaa Aa A Baa
January 4.48% 4.41% 4.18% 4.35% 4.91% 3.93% 4.07% 4.32% 5.32%
February 4.35% 4.27% 4.05% 4.25% 4.76% 3.79% 3.93% 4.21% 5.13%
March 4.26% 4.21% 3.98% 4.16% 4.65% 3.77% 3.87% 4.17% 5.02%
April 4.18% 4.11% 3.91% 4.08% 4.55% 3.69% 3.79% 4.08% 4.85%
May 4.10% 4.06% 3.84% 3.98% 4.47% 3.67% 3.76% 4.03% 4.78%
June 3.93% 3.85% 3.65% 3.82% 4.31% 3.42% 3.53% 3.84% 4.60%
July 3.79% 3.70% 3.53% 3.69% 4.13% 3.29% 3.38% 3.70% 4.42%
August 3.36% 3.36% 3.17% 3.29% 3.63% 2.98% 2.99% 3.34% 4.11%
September 3.44% 3.38% 3.24% 3.37% 3.71% 3.03% 3.02% 3.35% 4.11%
October 3.45% 3.37% 3.24% 3.39% 3.72% 3.01% 3.01% 3.35% 4.12%
November 3.48% 3.40% 3.25% 3.43% 3.76% 3.06% 3.06% 3.37% 4.12%
December 3.45% 3.34% 3.22% 3.40% 3.73% 3.01% 3.00% 3.32% 4.03%
3.86% 3.79% 3.61% 3.77% 4.19% 3.39% 3.45% 3.76% 4.55%
Corporate by Groups Public Utility Bonds Industrial Bonds

Water

2020 Capitalization Rate Study Water Industry Notes
• From the Water Industry segment, Consolidated Water Company Ltd. was excluded as being primarily involved in non-domestic
operations. • Staff considered capitalization studies submitted by:
No Submissions • Staff relied upon the results of the following models and appraisal judgment in the development of equity rates:
1. Discounted Cash Flow 2. Capital Asset Pricing Model, Ex-Post and Ex Ante 3. Earnings/Price Ratio

Industry Capitalization Rate
Mergents 2019 Twelve Month Bond Yield Averages
Equity Market Long Term CapitalizationIndustry Rate Capitalization Debt Rate
Water 9.40% 73.23% 26.77% 8.01%

Industry Equity Rate SummaryWater
CapM Ex Post Equity Rate 6.97%
CapM Ex Ante Equity Rate 8.67%
DCF (Dividend) Equity Rate 9.01%
DCF (Earnings) Equity Rate 9.87%
Earnings Price Ratio 3.96%

CapM Equity Rates
b* Risk Free Rate (2.25%) plus Risk Premium Rate (7.15%)c* Risk Free Rate (2.25%) plus Risk Premium Rate (9.73%)Value Line Investment Survey, November 2019 through January 2020, Morningstar
Ex Post Ex Ante Value Line Ex Post Ex AnteRisk Premium Risk Premium Beta CAPM Equity Rate CAPM Equity Rate
Industry b* c* d (((b-2.25%)*d)+2.25%) (((c-2.25%)*d)+2.25%)
Water 9.40% 11.98% 0.66 6.97% 8.67%

Discounted Cash Flow (Gordon Growth)
Value Line Investment Survey, November 2019 through January 2020
Value Market Dividend Equity Rate Equity RateLine Capitalization Yield Dividends Earnings Dividend Earnings
Industry Company Strength d e f g (e+f) (e+g)
Growth Estimate
WaterAmerican States Water Co. A 3,200,000,000 1.40% 9.50% 8.00% 10.90% 9.40%American Water Works Company, Inc. B+ 22,200,000,000 1.70% 9.00% 9.50% 10.70% 11.20%Aqua America, Inc. A 10,200,000,000 2.10% 8.00% 8.00% 10.10% 10.10%California Water Service Group B++ 2,500,000,000 1.50% 6.50% 8.00% 8.00% 9.50%MiddleSex Water Company B++ 1,100,000,000 1.60% 5.00% 7.50% 6.60% 9.10%SJW Group B+ 2,000,000,000 1.70% 7.00% 7.00% 8.70% 8.70%The York Water Company B+ 600,000,000 1.60% 6.50% 9.50% 8.10% 11.10%
Median 2,500,000,000 8.70% 9.50%Arithmetic Mean 5,971,428,571 9.01% 9.87%

E/P Ratio
Value Line Investment Survey, November 2019 through January 2020
Value Market Recent Projected E/PLine Capitalization Price Earnings Ratio
Industry Company Strength c d e (e/d)
WaterAmerican States Water Co. A 3,200,000,000 87.33 2.75 3.15%American Water Works Company, Inc. B+ 22,200,000,000 123.05 4.70 3.82%Aqua America, Inc. A 10,200,000,000 47.08 2.00 4.25%California Water Service Group B++ 2,500,000,000 51.52 2.00 3.88%MiddleSex Water Company B++ 1,100,000,000 63.56 2.45 3.85%SJW Group B+ 2,000,000,000 71.79 3.65 5.08%The York Water Company B+ 600,000,000 46.38 1.70 3.67%
Median 2,500,000,000 3.85%Arithmetic Mean 5,971,428,571 3.96%

Capital Structure
Value Line Investment Survey, November 2019 through January 2020
Value Market Long Term Debt/Equity Percentage PercentageLine Capitalization Debt Ratio Equity Debt
Industry Company Strength c d (d/c) (c/(c+d)) (d/(c+d))
WaterAmerican States Water Co. A 3,200,000,000 475,000,000 0.15 87.07% 12.93%American Water Works Company, Inc. B+ 22,200,000,000 8,640,000,000 0.39 71.98% 28.02%Aqua America, Inc. A 10,200,000,000 2,898,300,000 0.28 77.87% 22.13%California Water Service Group B++ 2,500,000,000 807,500,000 0.32 75.59% 24.41%MiddleSex Water Company B++ 1,100,000,000 228,300,000 0.21 82.81% 17.19%SJW Group B+ 2,000,000,000 511,100,000 0.26 79.65% 20.35%The York Water Company B+ 600,000,000 94,200,000 0.16 86.43% 13.57%
Median 2,500,000,000 511,100,000 0.26 79.65% 20.35%Arithmetic Mean 5,971,428,571 1,950,628,571 0.25 80.20% 19.80%Weighted Average 14,807,177,033 5,412,422,488 73.23% 26.77%

Beta
Value Line Investment Survey, November 2019 through January 2020
Value LineIndustry Company Levered Beta
Water, Selected ComparablesAmerican States Water Co. 0.65American Water Works Company, Inc. 0.55Aqua America, Inc. 0.65California Water Service Group 0.70MiddleSex Water Company 0.75SJW Group 0.60The York Water Company 0.70
Median 0.65Arithmetic Mean 0.66
Water, Value LineAmerican States Water Co. 0.65American Water Works Company, Inc. 0.55Aqua America, Inc. 0.65California Water Service Group 0.70Consolidated Water Co. Ltd. 0.85MiddleSex Water Company 0.75SJW Group 0.60The York Water Company 0.70
Median 0.68Arithmetic Mean 0.68

Mergents 2019 Corporate Bond Yield Averages
Month Public Utility Industrial Aa A Baa Aaa Aa A Baa
January 4.48% 4.41% 4.18% 4.35% 4.91% 3.93% 4.07% 4.32% 5.32%
February 4.35% 4.27% 4.05% 4.25% 4.76% 3.79% 3.93% 4.21% 5.13%
March 4.26% 4.21% 3.98% 4.16% 4.65% 3.77% 3.87% 4.17% 5.02%
April 4.18% 4.11% 3.91% 4.08% 4.55% 3.69% 3.79% 4.08% 4.85%
May 4.10% 4.06% 3.84% 3.98% 4.47% 3.67% 3.76% 4.03% 4.78%
June 3.93% 3.85% 3.65% 3.82% 4.31% 3.42% 3.53% 3.84% 4.60%
July 3.79% 3.70% 3.53% 3.69% 4.13% 3.29% 3.38% 3.70% 4.42%
August 3.36% 3.36% 3.17% 3.29% 3.63% 2.98% 2.99% 3.34% 4.11%
September 3.44% 3.38% 3.24% 3.37% 3.71% 3.03% 3.02% 3.35% 4.11%
October 3.45% 3.37% 3.24% 3.39% 3.72% 3.01% 3.01% 3.35% 4.12%
November 3.48% 3.40% 3.25% 3.43% 3.76% 3.06% 3.06% 3.37% 4.12%
December 3.45% 3.34% 3.22% 3.40% 3.73% 3.01% 3.00% 3.32% 4.03%
3.86% 3.79% 3.61% 3.77% 4.19% 3.39% 3.45% 3.76% 4.55%
Corporate by Groups Public Utility Bonds Industrial Bonds


![[Webinar] Creating Content That Converts](https://img.dokumen.tips/doc/110x75/55a9e59a1a28abd20b8b4668/webinar-creating-content-that-converts.jpg)