Embed Size (px)
Citation preview

Capital Structure in the Real Estate and Construction Industry An empirical study of the pecking order theory, the trade-off theory and the maturity-
matching principle
University of Gothenburg
School of Business, Economics and Law
Department of Business Administration
Industrial and Financial Management
Bachelor Thesis
Fall 2016
Supervisor: Sara Lundqvist
Authors:
Astrid Seeman
Lars Jacobson

Bachelor Thesis Fall 2016
2
Abstract
The aim of this report is to test if the real estate industry and the construction industry in Sweden
are described by the pecking order theory, trade-off theory and/or the maturity-matching
principle by investigating determinants of capital structure in the two industries separately. The
theoretical framework used in this report is the pecking order theory, the trade-off theory and
the maturity-matching principle in order to establish the research topic. A static panel data
regression is performed on a decomposed leverage level to test the hypotheses empirically,
including the unobserved firm characteristics: growth opportunities, profitability, size,
tangibility, volatility in earnings, non-debt tax shields and lastly effective tax rate. The results
indicate that the Swedish real estate industry and the Swedish construction industry differ
significantly over the period of 2007 to 2015. In general, the report provides support for both
the pecking order theory, the trade-off theory and the maturity-matching principle.
Keywords: The pecking order theory, The trade-off theory, The maturity-matching principle,
Swedish real estate industry, Swedish construction industry, Static panel data regression

Bachelor Thesis Fall 2016
3
Table of Contents
1. Introduction ...................................................................................................................... 5
1.1. Problem Discussion .................................................................................................. 6
1.2. Aim ............................................................................................................................. 7
1.3. Research Question .................................................................................................... 7
1.4. Contribution.............................................................................................................. 7
2. Theory................................................................................................................................ 8
2.1. Factors of Capital Structure .................................................................................... 8
Table I. Factors Measures ............................................................................................... 9
2.2. General Capital Structure Theories ....................................................................... 9
2.2.1. Modigliani and Miller’s Propositions ........................................................... 10
2.2.2. Pecking Order Hypothesis ............................................................................. 10
2.2.3. Trade-off Theory ............................................................................................ 11
2.3. Maturity Capital Structure Theory ...................................................................... 14
2.3.1. The Maturity-Matching Principle ................................................................ 14
2.4. Hypotheses .............................................................................................................. 14
2.4.1. Hypotheses ...................................................................................................... 14
2.4.2. Description of Expected Signs ....................................................................... 16
Table II. Expected Signs Real Estate Industry ............................................................ 16
Table III. Expected Signs Construction Industry ....................................................... 17
3. Method ............................................................................................................................. 18
3.1. Data ............................................................................................................................... 18
Table V. Number of Firms............................................................................................. 19
3.2. Static Panel OLS Regression ...................................................................................... 19
Table IV. Hausman Test ................................................................................................ 20
3.3. Discussion of data ........................................................................................................ 21
4. Results and Analysis ....................................................................................................... 22
4.1. Characteristics of the Data Set .............................................................................. 22
Figure I. Leverage Development Over Time ............................................................... 22
Table VI. Correlation for the Construction Industry and the Real Estate Industry
.......................................................................................................................................... 23
Table VII. Descriptive Statistics of Independent Variables ....................................... 24

Bachelor Thesis Fall 2016
4
4.2. Regression ............................................................................................................... 25
Table VIII. Regression Results...................................................................................... 25
Table IX. Result Signs Real Estate ............................................................................... 26
Table X. Result Signs Construction .............................................................................. 27
4.2.1. Growth Opportunities .................................................................................... 27
4.2.2. Profitability ..................................................................................................... 28
4.2.3. Size ................................................................................................................... 29
4.2.4. Tangibility ....................................................................................................... 29
4.2.5. Non-Debt Tax Shields .................................................................................... 30
4.2.6. Effective Tax Rate .......................................................................................... 30
4.3. Discussion and Reliability of the Report .............................................................. 31
5. Conclusion ....................................................................................................................... 32
5.1. Conclusion of the report ........................................................................................ 32
6. References ....................................................................................................................... 34
7. Appendix ......................................................................................................................... 38
Table XI. Level of Leverage .......................................................................................... 38
Table XII. Regression with One Lag ............................................................................ 39
Table XIII. Regression with Two Lags ......................................................................... 39

Bachelor Thesis Fall 2016
5
1. Introduction
This section will highlight the problem discussion and introduce the reader to the subject of the
report. This is followed by a literature review of previous studies within the same area to show
the economic background of the objectives of the report. This section also includes a definition
of the problem, the main purpose and contribution of the study.
Companies face decisions related to capital structure and general financing on a daily basis.
Financing generally originates from internal funds, debt or equity. Modigliani & Miller (1958)
introduced that the choice of capital structure affected the cost of capital and hence the market
value. They also considered that under certain assumptions taken into consideration the value
of a firm should be independent of its capital structure, since the net effect of the tax advantage
of debt at the firm level and the tax disadvantage of debt at the personal level is down to zero.
By relaxing these assumptions, a theoretical framework can be reached that resembles the
reality of the firm. Furthermore, two theoretical models have evolved to explain how firms
determine their specific capital structure. These models are, the pecking order theory and the
trade-off theory, presented by Myers and Majluf (1984) as well as Myers (1984). This thesis
investigates the Swedish real estate industry and the Swedish construction industry. These
industries are chosen because they currently are expected to grow in the coming years. The real
estate industry has a low risk and does not maximize their debt when assets are growing.
(Nyman, 2016). The industry is predicted to grow substantially the coming years and without
any downside risks due to unbalance between supply and demand. The return on construction
projects is expected to be 100% in the next 10 years (Privata Affärer, 2016).
The main research done to empirically test the implications of the pecking order theory and the
trade-off theory has almost entirely focused on public large firms. Firms within the same
industry should face similar risks, since they produce similar products and face the same costs
for material (Ferri & Jones, 1979). Whereas Myers believes that the firm's debt to equity ratio
is affected by its financing needs and not by industry standards (Myers, 1984). However, Harris
and Raviv has shown that companies within a particular industry is more like-minded than
companies in different sectors in terms of gearing (Harris M. & Raviv A.1991).

Bachelor Thesis Fall 2016
6
Industries face different challenges, for example new technologies, environmental regulations
and different economic conditions. Moreover, companies active in industries with variable
profit tend to have more capital as a buffer against eventual threats. The real estate industry has
stable returns and the construction industry has periodic revenues which is given unevenly
(Phillips, M, Roberts, J & Watson, S, 2017, Sikich, 2017). Therefore, it can be argued that the
construction industry should have more capital as a buffer than the real estate industry. With
good knowledge of the factors that affect the capital structure it is possible to get an
understanding of how companies and sectors adapt the allocation between equity and debt.
1.1. Problem Discussion
This report's focus is to fill the gap of information about capital structure in the real estate and
construction industries. This is completed with an empirical test of the pecking order theory
and the trade-off theory on a decomposed level of leverage using short-term and long-term debt
measures. To get further insights on a decomposed level, the maturity matching principle is
also considered. The report also differs from previous studies with the specialization in the real
estate industry and construction industry in a Swedish setting. Therefore, a Swedish nationwide
panel data is used and is covering the period of 2007 to 2015. Furthermore, this to complete a
static panel data regression comprising the firm characteristics such as growth opportunities,
profitability, size, tangibility, non-debt tax shields and lastly effective tax rate. Hence, firms
operating in the same industry face similar business environment and are therefore considered
to have comparable operating risks (Berk, DeMarzo 2011). Consequently this should lead to
intra-industry similarities and inter-industry differences in the firm's capital structure. Therefore
firms within sectors such as the real estate industry and the construction industry are expected
to have lower operating risk and therefore higher leverage ratio than the firms who operate
within areas such as software and biotechnology (Bougheas 2004).

Bachelor Thesis Fall 2016
7
There are few previous studies that have contributed to the knowledge in specific industries.
The main research done to empirically test the implications of the pecking order theory, the
trade-off theory and maturity-matching principle, has almost entirely focused on public large
firms. Moreover, research within this area has also focused on a specific country or region, for
example on public American or German firms. Furthermore, this report will contribute to those
involved in the Swedish capital market since further research is needed and will be proposed.
Hence, the hope is to provide a better foundation for further academic research and
practitioners, e.g. investors and managers, when they try to better understand capital structure.
1.2. Aim
The aim of this report is to test if the real estate industry and the construction industry in Sweden
are described by the pecking order theory, trade-off theory and/or the maturity-matching
principle by investigating determinants of capital structure in the two industries separately.
1.3. Research Question
Which theory, of the pecking order theory, trade-off theory and the maturity-matching
principle, does best describe the capital structure of the Swedish real estate and construction
industries?
1.4. Contribution
This thesis is inspired by previous studies that contributes to the capital structure debate and
specializes in examining if the leverage development among Swedish real estate firms and
Swedish construction firms can be explained by the pecking order theory, the trade-off theory
and the maturity-matching principle.
This report will contribute to further knowledge within the field of capital structure. In the
context of firms financing decisions, following the important contributions by Modigliani and
Miller (1958, 1963), various studies has been devoted to investigate what the main factors of
firm's capital structure are. In the beginning of the mid-1980s empirical research aimed at
comparing and contrasting the predictive powers of the major theories of capital structure,
earlier work concentrated mostly on the developing economies.
Bachelor Thesis Fall 2016
8
2. Theory
This section will cover the most relevant theoretical background regarding the subject of the
report, the focus is on capital structure. First, the factors of capital structure tested in this report
are chosen and presented. Thereafter, Modigliani and Miller’s proposistions are stated and lead
to the other theories in the section. The hypotheses of the report are presented and formed from
the theoretical framework including the pecking order theory, the trade-off theory and the
maturity-matching principle.
2.1. Factors of Capital Structure
Previous researchers such as Chittenden et al. (1996) and Van der Wijst and Thurik (1993) have
proved that influences of the independent variables on the total debt is a net effect of opposite
effects on the measures short-term and long-term debt. Therefore, assets structure should be
positively correlated with the long term-debt and negatively correlated with the short-term debt
which could work to neutralize the net effect on total debt. Hence, to use only the total debt as
a measure would disregard the change in a factor on a decomposed level of leverage.
The chosen factors that are investigated in the regression will be presented. The impact of the
factor is motivated using previous theories. However, it is difficult to draw conclusions from
previous reported studies since the authors use different measures for the different factors of
capital structure. The factors of capital structure that constantly reappear in previous reports are
growth opportunities, profitability, size, tangibility, non-debt tax shields, depreciation,
volatility and effective tax rate. (e.g. Sogorb-Mira, 2005; Bauer 2004; Bradley, Jarrell & Kim
1983; Kester 1986). For this report the chosen factors are the most common ones; growth
opportunities, profitability, size, tangibility, non-debt tax shields and effective tax rate.

Bachelor Thesis Fall 2016
9
The measures for each variable presented in the theory, is explained in Table III. For this report
the chosen factors are therefore; growth opportunities, profitability, size, tangibility, non-debt
tax shields and effective tax rate. The chosen variables will be further discussed in 5. Result
and Analysis.
Table I. Factors Measures
Variables Measure
Growth Opportunities (Turnovert/ Turnovert-1)-1
Profitability EBITDAt/ Turnovert
Size Log (Total Assets)t
Tangibility Tangible Assetst / Total Assetst
Non-Debt Tax Shields Depreciationt/ Turnovert
Effective Tax Rate Taxt/ Earnings before taxt
Total Debt/ Assets (Leverage) Total Debtt/ Total Assetst
2.2. General Capital Structure Theories
There are three models that are considered into the mainstream of corporate finance. There is
the trade-off theory, it provides an actual formula to calculate the optimal capital structure.
Furthermore, there is the pecking order and the signaling hypothesis, which tries to explain and
observe patterns for optimal capital structure (Copeland & Weston, 1992). The signaling
hypothesis will be excluded due to irrelevance (Ross 1977).

Bachelor Thesis Fall 2016
10
2.2.1. Modigliani and Miller’s Propositions
Modigliani and Miller demonstrated that in a capital market free of taxes, transaction costs and
other frictions; the choice of a firm’s capital structure could not affect its market valuation. To
make this reliable there are several assumptions that must be fulfilled:
• The capital markets are frictionless, which implies that assets can be purchased and sold
instantly without any costs.
• That it is possible to lend and borrow at a risk-free rate.
• There are no costs of bankruptcy for the firm.
• Corporations are operating in the same group of risk.
• Personal and corporate income taxes do not exist.
• Cash flow is eternally and there is no growth.
• The information available is the same for corporate insiders and the public.
• Agency costs do not exist and managers always maximize the shareholder’s wealth.
These assumptions are not applicable in practice and new theories is needed for explaining
this further.
2.2.2. Pecking Order Hypothesis
Donaldson (1961) has discovered a pecking order for how firms establish their long-term
financing. The pecking order assumes the information asymmetry exists between managers of
the company and the investors, it is where the managers have an information advantage over
the investors. This creates adverse selection problems, which means that investors are unable
to make accurate investments decisions based on the information received from the company.
(Myers, 1984). Due to the adverse selection problem, certain debt is preferred over others.
A firm that maximizes its profit, which firms in general tend to do, operates on the margin, the
top of the curve, in order to balance the tax shield and the costs of distress. Initially, firms prefer
internal financing to external financing of any sort (debt or equity), when financing positive net
present value projects. Further on, when a firm has insufficient cash flows from internal sources,
it sells parts of its investments in marketable securities. As a firm is required to receive more
external financing, it will work down the pecking order securities. The pecking order is
beginning with the safe debt, then continuing through risky debt, convertible securities,
preferred stock, and lastly common stock. The pecking order theory explains the observed
patterns regarding financing preferences of firms (Myers & Majluf, 1984).

Bachelor Thesis Fall 2016
11
Firms with growth opportunities should generally have a high demand for funds. If retained
earnings is not enough to provide the desirable number of funds, firms will most likely search
for external financing (Michaelas et al., 1999). Using external financing will increase the
leverage of the firm. Therefore, the relation between growth opportunities and total debt over
total assets should be positive.
The pecking order theory concludes that firms chooses internal financing before debt and also
debt before assets. Profitable firms have greater internal finance which results in less external
financing in line with to the pecking order theory, ceteris paribus (Myers & Majluf, 1984).
Firms with high profitability is sensitive to takeovers, hence increased leverage. Therefore,
profitable firms that has been acquired will have a higher debt-to-asset ratio (Jensen, 1986).
Therefore, a negative relation is expected between profitability and total debt over total assets.
This is assumed to apply for short-term and long-term debt as well since sensitivity to takeovers
should affect as much in the short run as in the long run.
2.2.3. Trade-off Theory
In contrast to the pecking order, in the trade-off model, agency costs, taxes and bankruptcy
costs push more profitable firms towards higher book leverage, resulting in a positive relation
to profitability. A trade-off between the cost and benefits of debt is often described as the
optimal capital structure. In this case, costs are represented by the cost of financial distress and
agency costs arising between owners and creditors (Jensen and Meckling, 1976). While the
benefits in this case can be measured by the tax shields of debt (Myers, 1984). The optimal
capital structure is reached when the cost and benefits of debt are equal, which depending on
the characteristics of the firm may vary from firm to firm.
In the theory of the trade-off, the cost of debt is represented by the financial distress costs and
finally the probability of bankruptcy. It is commonly presumed that a large firm is less likely to
default, since they are more diversified and therefore should have a greater debt capacity
(Titman and Wessels, 1988). As the value of the firm increases, the ratio of direct bankruptcy
costs to the firm’s value decreases which might have an impact on the firm’s borrowing
decisions. Hence, the firm will take more leverage (Warner, 1977).

Bachelor Thesis Fall 2016
12
Transaction costs for large firms are reduced since there might be struggles with asymmetric
information issues which could increase larger firms’ preferences for equity over debt
compared to smaller firms (Fama & Jensen, 1983). Due to the fact that a firm that is larger
generally diversifies more, they have a lower probability of bankruptcy. Hence, a positive
relation between size and short-term debt and a negative relation between size and long-term
debt is predicted.
An implication of leverage is that it increases a firm's probability to default on its debt
obligations, which indicates that risky firms should borrow less (Myers, 1984). Tangible assets
are debt associated with problems such as moral hazard and adverse selection problems, which
encourage lenders to require security on a firm’s loans. Moreover, intangible assets will be
associated with higher cost of liquidation, there is no secondary market due to asset specificity
(Williamson, 1988). Most capital structure theories conclude that the type of assets owned by
a firm should be an important factor of capital structure. The value of liquidation for the firm
is affected by the extent to which a firm’s assets are tangible (Titman & Wessels, 1988). An
increase in the proportion of tangible assets will increase the value of liquidation for the firm
since the values of the tangible assets can be assessed easier.
The tangible assets are more likely to be accepted as collateral than the intangible assets. Funds
provided to the borrower are restricted to a specific project by collateralizing debt. The creditors
might require for them more favorable terms if no such guarantee exists for a project, potentially
forcing the firm to use equity instead of debt as financing. Using tangible assets as collateral
will prevent risk from shifting due to that the firm will have difficulties shifting investments to
riskier projects (Myers, 1977). Hence, a greater fraction of tangible assets will increase the
incentives to using lender to finance and increasing leverage. (Rajan & Zingales, 1995).
Therefore, a positive relation between tangibility and total debt over total assets is expected. A
negative relation between the tangibility and short-term debt and a positive relation between
tangibility and long-term debt is expected due to that long-term debt enables that more of the
assets can be used as collateral.

Bachelor Thesis Fall 2016
13
In the corrected seminal work by Miller and Modigliani with the realization of the tax advantage
of debt, they argued that firms should instead employ as much debt as possible to maximize the
value of the firm (Modigliani and Miller, 1963). However, there are additional sources of tax
shields that can be an alternative to debt. These sources are discretionary expenses, research
and development (R&D) and depreciation (DeAngelo and Masulis, 1980). Firms have a strong
incentive to increase leverage resulting for tax deductible interest tax shield (Miller and
Modigliani, 1963). Furthermore, large amounts of non-debt related corporate tax shields, for
example tax credits for R&D and tax deductions for depreciation, indicates that debt is related
inversely to non-debt tax shields. Titman & Wessels (1988) cannot find any statistical evidence
that non-debt tax shields affect debt ratios. Larger non-debt tax shields implicate increased
probability of no taxable income, thus decreasing the expected corporate tax rate and expected
payoff from interest tax shields (DeAngelo, Masulis, 1980). The trade-off theory supports these
predictions and includes that non-debt tax shields have lower expected tax rates, hence lower
book leverage (Fama, French, 2002), which has been empirically supported by De Miguel &
Pindado (2001). Therefore, a negative relation between non-debt tax shields and total debt over
total assets is predicted. This is assumed to apply for short-term and long-term debt as well
since lower book leverage should affect as much in the short run as in the long run.
The main benefit of trade-off theory are the tax benefits of debt (Myers, 1984). These benefits
exist due to that interest payments of debt are tax deductible and payments to equity owners,
i.e. dividend payments, are not tax deductible. Debt is therefore less expensive than equity and
when the effective tax rate increases the advantages of debt increases. Since the main benefit
in the trade-off theory is the tax benefit of debt, which is the effective tax rate, it can be argued
that effective tax rate should have a positive relation to short-term, long-term and total debt
over total assets. This has been supported empirically (Sogorb-Mira, 2005).

Bachelor Thesis Fall 2016
14
2.3. Maturity Capital Structure Theory
2.3.1. The Maturity-Matching Principle
This section will help to determine hypotheses on a short-term and long-term debt basis. The
Maturity-Matching Principle states that a firm fund short-term assets with short-term debt and
long-term assets with long-term debt. Furthermore, the maturity-matching principle states that
intangible assets must be financed with equity. Matching yields benefits that the firm's financial
flexibility enhances, that overall financing costs minimizes and that the firm’s risk of default is
reduced.
According to this theory it would be better to finance inventory with long-term debt if it is
rather stable and relatively permanent inventory. By doing this, the firms can avoid frequent
finance ability of short-term credit. Short-term debt provides two basic advantages over long-
term debt; lower average interest rates and flexibility regarding the amount borrowed over time.
The theory mentions disadvantages of issuing short-term debt. First, greater issuance costs over
time by rolling over the short-term debt. Second, firms face a risk to be unable to refinance
maturing debt. Third, firms face a risk of changing interest rates on its short-term debt, which
they would not if they would have issues long-term debt on a fixed rate instead. (Ogden, Jen &
O'Connor 2002)
2.4. Hypotheses
2.4.1. Hypotheses
The pecking order and the trade-off theory, have many shared predictions about leverage,
though motivated by different forces. However, two major differences where the theories
disagree is profitability, where the trade-off theory suggests a negative relation between
leverage and profitability. Furthermore, they disagree on the relation for growth opportunities
where the pecking order theory highlights the large equity issues of small low-leverage growth
firms (Farma & French 2002).

Bachelor Thesis Fall 2016
15
Bond and Scott (2006) concludes in a study that listed real estate firms in the United Kingdom
that debt is the most common security issued when external financing is needed. Another
finding from the study is that debt issuance is tracking financing deficit closely. Ghosh et al
(1999) finds in the American market that a significant negative stock price reacts to equity
issues. According to the pecking order theory, this shows that information asymmetry exists.
The empirical findings favor that the real estate industry is aligning with the pecking order
theory. In contrary, the construction industry which is assumed to not align with the pecking
order theory due to limited research on testing the theoretical framework on capital structure.
Therefore, the first hypothesis is formed: The pecking order theory should be more prominent
in the real estate industry relative to the construction industry.
The real estate industry has unique characteristics i.e. supporting high levels of debt due to high
ratio of collateral on the balance sheets which could implicate a reduction in financial distress
costs. Allen (1995) finds that American real estate firms raise more leverage compared to other
industries due to having lower agency and bankruptcy costs. Riddiough (2003) finds that firms
strive towards a designated debt ratio when examining public security offerings. These findings
favor the trade-off theory on optimal capital structure.
The construction industry is also assumed to align with these findings and the second hypothesis
is formed. The trade-off theory should align with the real estate industry and the construction
industry.
Agency problems developed from growth opportunities can be according Myers (1977)
mitigated by issuing short-term debt instead of long-term debt. According to the maturity-
matching principle, short-term assets is funded by short-term debt and long-term assets is
funded by long-term debt. The real estate industry mostly has long-term assets in form of
buildings which concludes in mostly long-term debt. The real estate industry should thereby
have a negative relation between growth opportunities and short-term debt over total assets and
a positive relation between growth opportunities and long-term debt over total assets. The
construction industry mostly has short-term assets in form of labor, property, plant and
equipment which concludes in mostly short-term debt. The construction industry should
therefore have a positive relation between growth opportunities and short-term debt over total

Bachelor Thesis Fall 2016
16
assets and a negative relation between growth opportunities and long-term debt over total
assets.
A third hypothesis is formed: The maturity-matching principle should align with the real estate
industry and the construction industry.
2.4.2. Description of Expected Signs
Table I. & table II. describes the expected signs which will be investigated and tested against
the Swedish real estate industry and the Swedish construction industry capital structures.
Furthermore, each of these signs describes the characteristics of the firm to be observed and
investigated, they are linked to either the pecking order theory or the trade-off theory. The
expected signs are found and formed from the theory, and the most relevant for this report are
selected.
Table II. Expected Signs Real Estate Industry
Table I. shows the expected signs arranged after origin in the theoretical framework. The table describes the
expected signs for the real estate industry of the relation to each variable, divided into STD = short-term debt,
LTD = long-term debt and TD = total debt over total assets.
VARIABLES EXPECTED
SIGN STD EXPECTED
SIGN LTD EXPECTED SIGN TD
GROWTH
OPPORTUNITIES - + Pecking Order
PROFITABILITY - - Pecking Order
SIZE + - Trade-off Theory
TANGIBILITY - + Trade-off Theory
NON-DEBT
TAX SHIELDS - - Trade-off Theory
TAX RATE + + Trade-off Theory

Bachelor Thesis Fall 2016
17
Table III. Expected Signs Construction Industry
Table II shows the expected signs arranged after origin in the theoretical framework. The table describes the
expected signs for the construction industry of the relation to each variable, divided into STD = short-term debt,
LTD = long-term debt and TD = total debt over total assets.
VARIABLES EXPECTED
SIGN STD EXPECTED
SIGN LTD EXPECTED SIGN TD
GROWTH OPPORTUNITIES + - Pecking Order
PROFITABILITY + + Pecking Order
SIZE + - Trade-off Theory
TANGIBILITY - + Trade-off Theory
NON-DEBT
TAX SHIELDS - - Trade-off Theory
TAX RATE + + Trade-off Theory

Bachelor Thesis Fall 2016
18
3. Method
This section presents the strategy of research for the report. A quantitative method for analyzing
data and a literature review will be conducted. The purpose for the literature review was to
evaluate the subject and construct a theoretical framework for interpretation of the collected
data presented in the quantitative analysis and also to construct proxy variables.
3.1. Data
The data for the regression is collected from Business Retrievers database which provides
approximately 10 years of accounting data for Swedish firms. The sample used in this report is
selected with limits in turnover in the real estate industry and the construction industry. The 30
largest firms in the real estate and construction industry is selected which generates the turnover
limit for the real estate industry to be more than 2000 MSEK and more than 1000 MSEK for
the construction industry. These limits are selected to include and show larger firms in the
industry, and not take into consideration the smallest firms because the data provided may have
abnormal borrowing terms. This could lead to selection bias. However, it could be that
companies include issues that we do not wish to investigate such as operative managerial
theories. Since the firm selection is made in 2015 and following the same firms back to 2007,
this could lead to survivorship bias. Firms not existing anymore, who existed in this period are
not taken into consideration. The firms are selected by industry in Business Retriever where the
real estate industry is defined as “renting and operating of own or leased real estate”. Moreover,
the construction industry is defined as “construction and civil engineering activities and related
technical consultancy” and also “construction of buildings”. The data is collected from 2007 to
2015. The chosen years for the regression is to see the change over time and due to limitations
in the database. The sample includes firms with parent companies which could create noise and
potential measurement errors due to that external financing is investigated. This is disregarded
and assumed to not affect the outcome substantially. The data set includes 30 real estate firms
and 30 construction firms after adjustments which concludes in total 60 firms in the unbalanced
panel data.
Bachelor Thesis Fall 2016
19
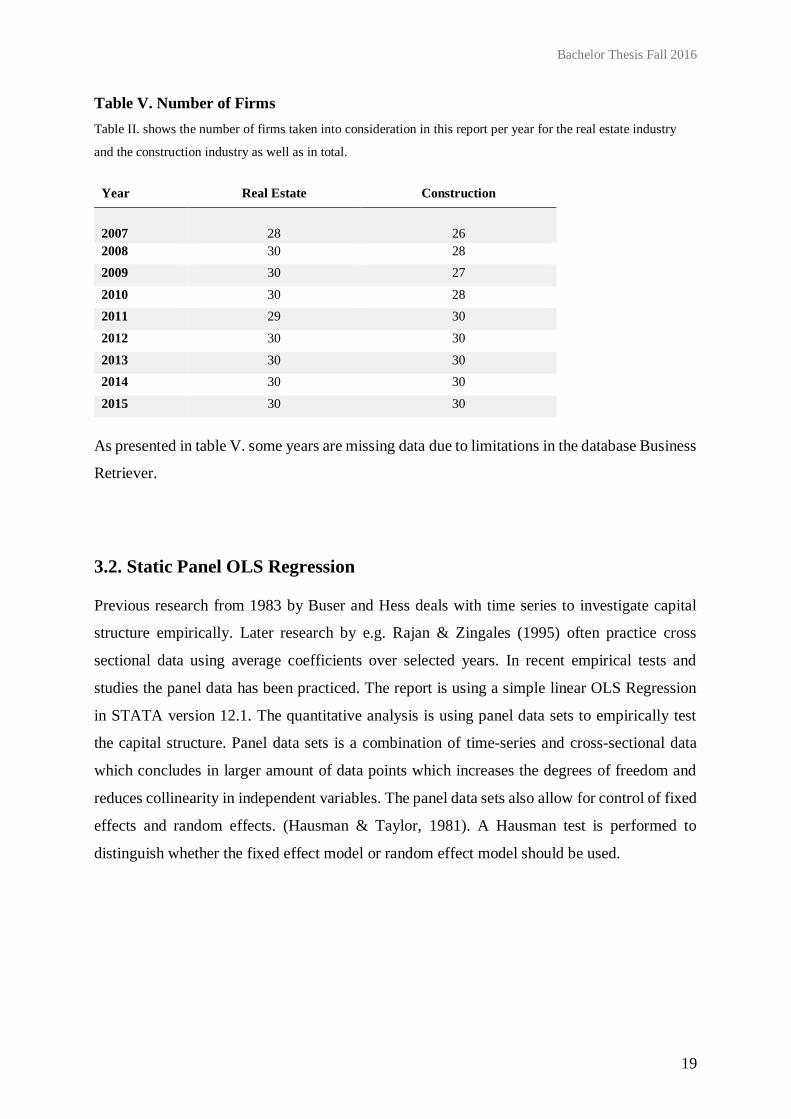
Table V. Number of Firms
Table II. shows the number of firms taken into consideration in this report per year for the real estate industry
and the construction industry as well as in total.
Year Real Estate Construction
2007
28
26 2008 30 28
2009 30 27
2010 30 28
2011 29 30
2012 30 30
2013 30 30
2014 30 30
2015 30 30
As presented in table V. some years are missing data due to limitations in the database Business
Retriever.
3.2. Static Panel OLS Regression
Previous research from 1983 by Buser and Hess deals with time series to investigate capital
structure empirically. Later research by e.g. Rajan & Zingales (1995) often practice cross
sectional data using average coefficients over selected years. In recent empirical tests and
studies the panel data has been practiced. The report is using a simple linear OLS Regression
in STATA version 12.1. The quantitative analysis is using panel data sets to empirically test
the capital structure. Panel data sets is a combination of time-series and cross-sectional data
which concludes in larger amount of data points which increases the degrees of freedom and
reduces collinearity in independent variables. The panel data sets also allow for control of fixed
effects and random effects. (Hausman & Taylor, 1981). A Hausman test is performed to
distinguish whether the fixed effect model or random effect model should be used.

Bachelor Thesis Fall 2016
20
Table IV. Hausman Test
Table IV. describes the outcome of the Hausman te from the selected data. b = consistent under H0 and Ha,
obtained from xtreg, B= inconsistent under Ha, efficient under H0, obtained from xtreg, Test: H0: difference in
coefficients not systematic, Chi2 (6) = (b-B)’((V_b-V_B)^(-1))(b-B), = 1.78, Prob>chi2 = 0.9391, (V_b-v_B is
not positive definite)
Coefficients
(b) (B) (b-B) Sqrt(diag(v_b-v_B))
FE RE Difference S.E
H1 Growth Opp. -0.0006663 -0.0008972 0.0002309 0.000658
H2 Profitability -0.0670396 -0.067778 0.0007384 0.0017731
H3 Size 0.0022048 0.0016349 0.0005699 0.0070253
H4 Tangibility -0.0397379 -0.0137089 -0.026029 0.0264235
H5 NDTS -0.1842498 -0.1875114 0.0032615 0.0042618
H6 Tax Rate 0.0149232 0.0148317 0.0000915 0.0003703
The outcome from the Hausman test shows V_b-v_B is not positive definite, which implicates
that a fixed effect model is more accurate. Therefore, the regression will be based on a fixed
effect model. Hence, using panel data methodology in empirical tests allows control for firm
heterogeneity and reduces collinearity among independent variable.
The panel data model is:
Y=H1X1+H2X2 +H3X3+H4X4+ H5X5+H6X6 +e
Where: Y is the dependent variable Leverage measured as debt-to-equity ratio.
X1 is the independent variable Growth opportunities measured as growth in turnover.
X2 is the independent variable Profitability measured as EBITDA over sales.
X3 is the independent variable Size measured as the natural logarithm of total assets.
X4 is the independent variable Tangibility measured as tangible assets over total assets in book values.
X5 is the independent variable Non-debt tax shield measured as annual depreciation expenses over net
sales.
X6 is the independent variable Effective tax rate measured as tax divided by earnings per share.
is the intercept term.

Bachelor Thesis Fall 2016
21
3.3. Discussion of data
This report will follow out a literature review to investigate the aim of the report. The literature
review will be based on scholarly papers which includes the current knowledge as well as
theoretical contributions from papers including capital structure. The data is collected from
scholarly databases such as Google Scholar, Sciencedirect and Business Retriever database.
Corporate Finance theory prefers using market values of the measured assets and debt when
defining capital structure. Due to limitations in the data set in Retriever Business, book values
are used to complete the research. The data is collected from the 30 largest firms from both
industries. To broaden the study, smaller firms could also be taken into consideration which
would increase the number of observations and could change the result.
The authors cannot assume responsibility for the validity of all data sources. Some of the data
sources are continuously updated and since they are collected during the time this paper was
written any responsibility for updates of these sources cannot be taken into consideration.

Bachelor Thesis Fall 2016
22
4. Results and Analysis
This section describes the key characteristics of the data set. Both for leverage ratios and the
determinants of capital structure, the data is presented separately for the real estate industry and
the construction industry, as well as together. This section also provides the result and analysis
of the regression. The tables explain the result, and the graphs gives some understanding of the
capital structure of real estate and construction firms.
4.1. Characteristics of the Data Set
The leverage levels over time are quite similar. However, on a decomposed leverage level,
differences are shown in capital structure between the two industries. It is shown in figure I.
that the real estate industry has throughout the years significantly higher level of long-term
leverage.
Figure I. Leverage Development Over Time
Figure I. illustrates the leverage development for the two selected industries on the Swedish market between 2007
to 2015 in short-term-, long-term- and total- debt over total assets.

Bachelor Thesis Fall 2016
23
The construction industry generally has a considerable amount of property, plant and equipment
noted on the balance sheet which is shown as short-term debt, however they have less long-
term debt. The real estate firms have on average employed around 25 % short-term debt over
total assets and 35% long-term debt over total assets, whereas the construction firms 60 % short-
term debt over total assets and 5 % long-term debt over total assets. Overall, the industries show
steady debt levels which is recognized from the trade-off theory.
Table VI. Correlation for the Construction Industry and the Real Estate Industry
Table VI. describes the correlation between the variables for the construction industry and the real estate industry.
The correlation between the different variables presented in Table VI. differ in magnitude.
Growth opportunities has the lowest correlation to leverage for the real estate industry and
effective tax rate has the lowest correlation to leverage for the construction industry. Size and
tangibility has the highest correlation to leverage for the real estate industry and growth
opportunities has the highest correlation to leverage for the construction industry.

Bachelor Thesis Fall 2016
24
Table VII. Descriptive Statistics of Independent Variables
Table VII. shows characteristics from the data set for the real estate firms and construction firms
separatly.
Variable Mean SD Max Min Median Skewness Kurtosis
Rea
l E
state
Fir
ms
Growth 0,14 0,515937073 5,38 -0,78 0,04 5,6814825 44,72712606
Profit. 0.53 0.58149924 2.77 -0.7 0.39 1,2317551 2,027348522
Size 15.81 2.035305615 18.51 7.6 16.32 -2,1520780 6,15409934
Tangibility 1.48 0.658899676 2.51 0 1.84 -1,0102189 -0,506214875
Non-debt
Tax Shield
0.01 0.020031035 0.15 0.00 0 4,0886540 20,60517944
Effective
Tax Rate
0.21 0.732008054 9.65 -2.75 0.22 8,6575847 108,7375647
Con
stru
ctio
n f
irm
s
Growth. 0,41 2,588977269 36,83 -0,47 0,06 11,71366952 154,6123378
Profit. -0.08 1.835254504 0.42 -29.69 0.04 -16,09736331 260,5822301
Size 13.79 1.676761484 18.4 10.42 13.36 1,080430196 0,59584878
Tangibility 0.13 0.168353296 0.9 0 0.07 2,09008907 4,52205968
Non-debt
Tax Shield
0.06 0.795648244 12.91 0 0 16,15405094 261,8730263
Effective
Tax Rate
0.23 0.271000372 1.39 -2.49 0.24 -3,114482875 42,67701429
Table VII. describes the key characteristics of the dataset. The leverage ratios and factors of
capital structure are presented separately for the real estate and the construction industry. This
table helps to explain some of the results later in the paper. This table and Figure I. of the
leverage levels, gives some understanding of the capital structure in the real estate and the
construction industry. In Table VII. it can be noticed that the variables are overall relatively
similar.

Bachelor Thesis Fall 2016
25
4.2. Regression
The variables are generally similar for the Real Estate Industry and the Construction industry.
However, the growth opportunities, profitability and non-debt tax shield is larger for the
Construction industry. The size, tangibility and effective tax rate is larger for the Real Estate
industry.
Table VIII. Regression Results
Table VIII shows the results from the fixed effect panel regression made in STATA. It describes the coefficients
for the two industries divided into short-, long- and total-debt. Furthermore, the t-values are given in the parenthesis
and *** = p<0.001, ** = p<0.01 and * = p<0.05.
Factor Short-Term Debt Long-Term Debt Total Debt
R. E C R. E C R. E C
Growth -0.004 (-0.30)
0.001 (0.29)
0.035* (2.16)
-0.003* (-2.03)
0.027* (2.13)
-0.002 (-0.66)
Profitability -0.014 (-1.04)
-0.316* (-2.35)
-0.036* (-2.31)
0.142* (2.28)
-0.061*** (-4.99)
-0.174 (-1.32)
Size 0.01 (0.51)
0.023 (1.78)
-0.068* (-2.17)
0.007 (1.20)
-0.021 (-0.83)
0.031** (2.37)
Tangibility -0.005 (-0.11)
-0.045 (-0.74)
-0.012 (-0.22)
-0.063* (-2.23)
-0.011 (-0.25)
-0.106 (-1.80)
NDTS -0.136 (-0.33)
-0.728* (-2.33)
1.208* (2.54)
0.298* (2.07)
1.046** (2.80)
-0.43 (-1.40)
Effective tax Rate -0.015* (-2.03)
0.023 (1.02)
0.031*** (3.60)
0.006 (0.54)
-0.007 (1.80)
0.029 (1.29)
R2 (within) 0.023 0.038 0.17 0.292 0.253 0.103
R2 (overall) 0.039 0.006 0.073 0.000 0.002 0.030
F-statistic 0.91 1.48 6.63 15.29 11.00 4.28
Observations 264 259 264 259 264 259
Year Dummies YES YES YES YES YES YES
Fixed Effect Fixed Effect Fixed Effect Fixed Effect Fixed Effect Fixed Effect

Bachelor Thesis Fall 2016
26
The results from the regression is mostly in line with the theory aswell as previous studies,
however some coefficients differ from the hypotheses. The results and the expected signs are
presented in the Table IX and Table X. Most estimates are statistically significant and also
economically meaningful that capture effects that are determinants of capital structure. Some
estimates however, have lower significance levels which might be a result of the low number
of observations.
On a decomposed leverage level, the R2 values are generally satisfying in comparison to
previous work (Hall 2004). However, the R2 values for total debt are significantly lower, which
might be because of neutralizing effects arising from counteractive effects from the variables
from short-term and long-term debt.
Table IX. Result Signs Real Estate
Table IX shows the expected sign and the regression result for short-term and long-term debt of the real estate
industry, for each sign based on the theory and the actual regression made in the report.
VARIABLES EXP. SIGN
STD REG. RES REAL
ESTATE
EXP. SIGN
LTD REG. RES REAL
ESTATE
EXP. SIGN
TD REG. RES REAL
ESTATE
GROWTH
OPPORTUNITIES - - + + + +
PROFITABILITY - - - - - -
SIZE + + - - + -
TANGIBILITY - - + - + -
NON-DEBT TAX SHIELDS
- - - + - +
EFFECTIVE TAX RATE
+ - + + + -

Bachelor Thesis Fall 2016
27
Table X. Result Signs Construction
Table X shows the expected sign and the regression result for short-term and long-term debt of the construction
industry, for each sign based on the theory and the actual regression made in the report.
4.2.1. Growth Opportunities
As expected growth opportunities for real estate firms are negatively related to short-term debt
over total assets and positively related to long-term and total debt over total assets. The real
estate industry can therefore be assumed to act according to the pecking order theory and have
more safe debt. This could be due to the fact that they have more acquired assets that does not
decrease in value and exhibit stable and high sales. Therefore, the real estate can utilize financial
leverage more. In the contrary, the construction industry shows as expected a positive relation
between growth opportunities and short-term debt over total assets and a negative relation to
long-term debt over total assets. An abnormal sign is the relation to total debt which is negative
even though a positive relation was expected. Therefore, the construction industry shows signs
of less external financing when having growth opportunities and a reason for this is that large
investments might not be needed or that they have desirable amount of internal funds when
starting new projects.
VARIABLES EXP.
SIGN
STD
REG. RES CONSTRUCTION
EXP.
SIGN
LTD
REG. RES CONSTRUCTION
EXP.
SIGN
TD
REG. RES CONSTRUCTION
GROWTH
OPPORTUNITIES + + - - - -
PROFITABILITY + - + + + -
SIZE + + - + + +
TANGIBILITY - - + - + -
NON-DEBT TAX SHIELDS
- - - + - -
EFFECTIVE TAX RATE
+ + + + + +

Bachelor Thesis Fall 2016
28
In contrast, the real estate industry shows signs of more external financing when having growth
opportunities which could be due to required major investments for land and construction. In
addition, the economical meaningfulness of the results should be carefully considered. All other
relation is in line with the hypotheses which strengthens the maturity matching principle which
states that firm funds short-term assets with short-term debt and long-term assets with long-
term debt. In addition, the long-term debt results and the results from the total debt in the real
estate industry are statistically significant. Whereas the results for the long-term debt for the
construction industry has a lower coefficient magnitude, which makes it uncertain if the result
can be economically meaningful.
4.2.2. Profitability
The real estate industry has as expected a negative relation between profitability and all debt
ratios. However, the construction industry shows a different result for long-term debt over total
assets. The real estate industry has a negative relation as expected, this shows that generally
real estate firms require less external financing when becoming more profitable. When
becoming more profitable real estate firms generally have increasing revenues in rents which
lower the incentives for external financing. However, the construction industry has the opposite
relation which indicates that construction firms require more external financing when becoming
more profitable. The results for the construction industry is not in line with the pecking order
theory. This was expected and could be reasonable because the construction industry might
prefer more ongoing projects when being profitable. The construction industry can be seen as
highly volatile due to incomes based on separate projects obtained from procurements. The
relation between total debt over total assets and profitability is negatively related as expected
for the real estate industry but not for the construction industry. The negative impact on total
debt suggests that profitable firms in both industries would prefer to substitute debt with internal
funds. Moreover, the long-term debt results, the short-term debt results in the construction
industry and the results from the total debt in the real estate industry are statistically significant.

Bachelor Thesis Fall 2016
29
4.2.3. Size
The real estate industry show as expected a positive relation between size and short-term debt
over total assets and a negative relation to long-term debt over total assets. Which is in line with
the theory that larger firms diversify more and have a lower probability of bankruptcy.
However, the relation between size and total debt over total assets differ from the theory with
its negative relation which was not expected. This means that larger real estate firms do not
employ more debt. The construction industry shows as expected a positive relation between
size and short-term and total debt over total assets, which is in line with the theory. The relation
between size and long-term debt over total assets is positive which was not predicted, which
weakens the arguments that larger firms diversifies more and have a lower probability of
bankruptcy. The construction firms do not withhold the same amount of assets as the real estate
firms do, which puts them in a different situation when it comes to taking on debt.
The data shows signs that real estate firms employ more long-term debt than the construction
firms. This could answer the differences in the regression results in long-term debt. The results
may change when considering even smaller firms with different borrowing characteristics.
Furthermore, the long-term debt results in the real estate industry is statistically significant.
4.2.4. Tangibility
According to the hypotheses, tangibility is negatively related to short-term debt over total assets
for both industries. There is also a negative relation between tangibility and long-term and total
debt over total assets for both industries, which is not in line with the theory. The hypotheses
claim that acquiring more long-term debt enables that more of the assets can be used as
collateral. Which is not applicable for the real estate and the construction industries. This
suggests that firms in both industries does not match the maturity of their debt structure with
their assets structure. Construction firms typically have higher short-term debt levels than real
estate firms, this should suggest that tangible assets are more desirable for construction firms
than real estate firms since they are in need for substituting long-term for short-term debt. In
addition, the long-term debt results in the construction industry is statistically significant.

Bachelor Thesis Fall 2016
30
4.2.5. Non-Debt Tax Shields
Non-debt tax shield is as expected, negatively related to short-term debt over total assets for
both industries. Therefore, both industries employ as much short-term debt as possible to
maximize the value of the firm. According to the hypotheses it was expected to be a negative
relation between long-term debt over total assets and non-debt tax shield, however both
industries show a positive relation to non-debt tax shield instead. This could be because the
firm uses other sources of tax shields as an alternative to debt. The real estate industry show a
positive relation to total debt over total assets which is not in line with the theory, which was
not expected. This argues with the trade-off theory that the non-debt tax shields have lower
expected tax rates which also lowers the book leverage. In contrast to this, the construction
industry shows a negative relation to total debt over total assets which is in line with the theory.
Furthermore, the long-term debt results, the short-term debt results in the construction industry
and the results from the total debt in the real estate industry are statistically significant.
4.2.6. Effective Tax Rate
The relation between effective tax rate and short-term and total debt over total assets is negative
for real estate industry and positive for the construction industry. The relation between effective
tax rate and long-term debt is positive for both industries. In the theory, it is stated that it is
beneficial to use debt instead of equity because interest payments of debt are tax deductible.
The regression suggests that in the construction industry benefits from less expensive debt
compared to equity. For long-term debt, the real estate industry benefits from the same
statement. However, it contradicts this statement for short-term and total debt. The real estate
industry shows generally that higher taxes should increase leverage and the construction
industry shows the opposite. This could be because higher tax rates lower profitability for real
estate firms which reduces the firm's lending capacity, and hence the opposite for the
construction industry. Moreover, the short-term debt results in the real estate industry and the
results from the long-term debt in the real estate industry are statistically significant.

Bachelor Thesis Fall 2016
31
4.3. Discussion and Reliability of the Report
The characteristics explained by the theory of the pecking order and the trade-off theory,
affecting capital structure are by nature unobserved, to estimate these proxies must be used.
The most difficult problem with the use of proxies in the research for capital structure is the
struggle finding proxies that are uncorrelated to other proxies that are relevant, is identified by
Titman (1988). Moreover, Fama and French (2002) argues that the use of panel regressions
ignores the bias in the standard errors since it is correlated across years. The completed
correlation matrix results indicate that the correlation between the independent variables are
generally quite small, which means there is a low degree of first order collinearity between the
independent variables. The phenomena of reversed causality, i.e. that is if the leverage ratios
should affect the factors instead of the other way around, can be minimized by using static panel
data methodology where the control of this problem can be included by testing for firm and
time specific effects.
To test if the results are robust an additional one lag regression and a two lag regression are
performed in Table XII and Table XIII. Increasing the lagged effect reduces the economical
meaningfulness and the statistical significant for all variables including the R2 variables. No
other tests of robustness were performed. Further suggestions to test robustness of the analysis
are to change the measurements for the variables and add other control variables such as age.
In addition, the methods used in this report follow previous studies and the results discovered
are in line with earlier findings. Also, the Swedish firm setting prevent the generalizability of
the reports results in an international context.

Bachelor Thesis Fall 2016
32
5. Conclusion
This section concludes the analysis of the results and discusses the most important parts of the
study. This section also connects the analysis of factors of capital structure with the pecking
order theory, trade-off theory and maturity-matching principle to answer the aim of the report.
5.1. Conclusion of the report
The report contributes to better understanding of how the Swedish real estate firms and the
Swedish construction firms have chosen their capital structure between the years 2007 and 2015
and may be used as base for further research on the subject of optimal capital structure in a
Swedish setting. However, the results from the static panel data regression are not definite, they
generally support the literature of the pecking order, the trade-off theory and the maturity-
matching principle. The investigation of the hypotheses come to the conclusion that on a
decomposed level of leverage the two industries differ significantly over the time period of
2007 to 2015 on the Swedish market.
Tangibility affects capital the same for both the real estate and the construction industry,
however the magnitude of the coefficient for the construction industry is larger. Which is not
expected since the real estate firms have more tangible assets than the construction industry.
The firms in both industries do not match their maturity of their debt structure with their asset
structure. Further the construction industry is statistically significant and the real estate industry
is not, which makes the conclusions uncertain. The industries differ completely for the factor
growth opportunities; the construction industry therefore show signs for less external financing
when having growth opportunities and the real estate industry show signs for more external
financing. This could be related to that they already have desirable amounts of internal funds
when starting new projects and the real estate industry require major investments for land and
construction. The real estate industry show more results that are statistically significant than the
construction industry.

Bachelor Thesis Fall 2016
33
Generally, the results from this report indicates that leverage ratios on a decomposed level are
sensitive to the factors of capital structure chosen in the report. With this said, other
characteristics that affect firms in the Swedish real estate and construction industry could be
captured using another setting. In conclusion, the real estate industry can be better explained
using the factors that originates from the pecking order theory, and the construction industry
follows the factors from the trade-off theory in higher extent. The maturity-matching principle
was tested briefly in the report, the results matched the expectations from the theory perfectly
and was applicable for both industries. Therefore, all three hypothesis was correct.
In practice, the results from this report may help practitioners on the market understand why
firms have the observed leverage ratios and how firms deviating from sector standards will
likely develop in the Swedish real estate and construction industry. The report may also provide
an insight in how one single theory perspective lacks comprehensive explanatory power when
explaining the leverage development on the Swedish market.

Bachelor Thesis Fall 2016
34
6. References
Allen, M. (1995) "Capital Structure Determinants in Real Estate Limited Partnerships."
Financial Review, vol.30, no.3, p399-426.
Bauer, P. (2004). “Determinants of Capital Structure, Empirical Evidence from the Czech
Republic” Czech Journal of Economics and Finance, Vol. 54, No. 1, pp. 2-21
Berk, J. & DeMarzo, P. (2011). “Corporate Finance”. Third Edtition, Pearson Global Edition,
Pearson Education
Bond, S. and Scott, P. (2006) "The Capital Structure Decision for Listed Real Estate
Companies" (January 2006). http://ssrn.com/abstract=876429. [2016-12-22]
Bougheas, S. (2004). “Internal vs External Financing of R&D”. Small Business Economics,
Vol. 22, No. 1, pp. 11-17
Buser, S. and Hess, P. (1983), “The Marginal Cost of Leverage, the Tax Rate on Equity and the
Relation Between Taxable and Tax-Exempt Yields”, Ohio State University Working Paper.
Bradley, M., Jarrell, G.A. & Kim, H.E. (1983). “On the Existence of an Optimal Capital
Structure: Theory and Evidence”. The Journal of Finance, Vol. 39, No. 3, pp. 857-878
Chittenden, F., Hall, G. and Hutchinson, P. (1996), “Small Firm Growth, Access to Capital
Markets and Financial Structure: Review of Issues and Empirical Investigation”, Small
Business Economics, vol. 8, no. 1, pp. 59–67.
Copeland, T. and Weston, J. (1992). Managerial finance. 1st ed. Fort Worth: Dryden Press.
DeAngelo, H. and R. Masulis, (1980), "Optimal Capital Structure under Corporate and Personal
Taxation", Journal of Financial Economics, vol. 8, no. 1, pp. 3-29.
Donaldson, G. (1961). Corporate debt capacity. 1st ed. Boston: Division of Research, Graduate
School of Business Administration, Harvard University.

Bachelor Thesis Fall 2016
35
Fama, E. F. and French, K. R. (2002), “Testing Trade-Off and Pecking Order Predictions about
Dividends and Debt”, The Review of Financial Studies, vol. 15, no. 1, pp. 1-33.
Ghosh, C., Nag, R. and Sirmans, C. (1999) "An Analysis of Seasoned Equity Offerings by
Equity REITs." Journal of Real Estate Finance and Economics, vol.13, no.3, p.175-192.
Hall, G. C., Hutchinson, P. J. and Michaelas, N. (2004), “Determinants of the Capital Structure
of European SMEs, Journal of Business Finance & Accounting, vol. 31, no. 5-6, pp. 711-728.
Harris M. & Raviv A. (1991) The Theory of Capital Structure. The Journal of Finance, Vol.
46, No.1:297-355
Jensen, M. C. and Meckling, W. H. (1976), ”Theory of the Firm: Managerial Behavior, Agency
Costs and Ownership Structure”, Journal of Financial Economics, vol. 3, no. 4, pp. 305-360.
Jensen, M.C. (1986), “Agency Costs of Free Cash Flow, Corporate Finance, and Takeovers”,
The American Economic Review, vol. 76, no. 2, pp. 323-329.
Kester, W.C. (1986). “Capital and Ownership Structure: A Comparison of United States and
Japanese Manufacturing Corporations” Financial Management, Vol. 15, No. 1, pp. 5-16
Michaelas, N., Chittenden, F. and Poutziouris, P. (1999), “Financial Policy and Capital
Structure Choice in U.K. SMEs: Empirical Evidence from Company Panel Data”, Small
Business Economics, vol. 12, no. 2, pp. 113–130.
Michael G. Ferri and Wesley H. Jones (1979) ”Determinants of Financial Structure: A New
Methodological Approach” The Journal of Finance , Vol. 34, No. 3
Modigliani, F. and Miller, M. H. (1958), “The Cost of Capital, Corporate Finance, and the
Theory of Investment”, The American Economic Review, vol. 48, no. 3, pp. 261-297.
Modigliani, F. and Miller, M. H. (1963), “Corporate Income Taxes and the Cost of Capital: A
Correction”, The American Economic Review, vol. 53, no. 3, pp. 433-443.

Bachelor Thesis Fall 2016
36
Myers, S. C. (1984), “The Capital Structure Puzzle”, Journal of Finance, vol. 39, no. 3, pp.
575-592.
Myers, S. C. (2001). Capital Structure. The Journal of Economic Perspective , 15 (2), pp. 81-
102.
Myers, S. C. and Majluf, N. S. (1984), “Corporate Financing and Investment Decisions When
Firms Have Information that Investors Do Not Have”, Journal of Financial Economics, vol.
13, no. 2, pp. 187-221.
Myers, S. C. (1977), "Determinants of Corporate Borrowing”, Journal of Financial Economics,
vol. 5, no. 2, pp. 147-175.
Nyman, B-M, (2016), Liten risk i fasighetsbranchens skuldsättning,
http://fastighetsnytt.se/borsblogg/liten-risk-i-fastighetsbranschens-skuldsattning-2/ [2016-12-
22]
Ogden, Joseph P., Frank C. Jen, & Philip F. O'Connor. (2002) Advanced Corporate Finance:
Policies and Strategies. Pearson, First Edition.
Phillips, M, Roberts, J & Watson, Stuart (2017) “Emerging Trends in Real Estate” A
publication from PwC and the Urban Land Institute, Europe
Privataaffärer, (2016), SEB haussar fastighetsbolag - spår kraftig tillväxt,
http://www.privataaffarer.se/borsguiden/d-carnegie-kraftig-tillvaxt-i-korten-under-
kommande-ar-seb-858615 [2016-12-22]
Rajan, R. G. and Zingales, L. (1995), “What Do We Know About Capital Structure? Some
Evidence from International Data”, Journal of Finance, vol. 50, no. 5, pp. 1421-1460.
Ross, S. (1977), “The Determination of Financial Structure: The Incentive-Signaling
Approach”, Bell Journal of Economics, vol. 8, no. 1, pp. 23-40.

Bachelor Thesis Fall 2016
37
Sikich (2017), Construction Challenges,
http://www.sikich.com/find-solution/industries/construction/construction-challenges
[2017-01-03]
Sogorb-Mira, F. (2005), “How SME Uniqueness Affects Capital Structure: Evidence from a
1994-1998 Spanish Data Panel”, Small Business Economics, vol. 25, no. 5, pp. 447-457.
Titman, S. and Wessels, R. (1988), “The Determinants of Capital Structure Choice”, Journal
of Finance, vol. 43, no. 1, pp. 1–19.
Van der Wijst, N. and Thurik, R. (1993), “Determinants of Small Firm Debt Ratios: An
Analysis of Retail Panel Data”, Small Business Economics, vol. 5, no. 1, pp. 55–65.
Wald, J. K. (1999), “How Firm Characteristics Affect Capital Structure: An International
Comparison”, Journal of Financial Research, vol. 22, no. 2, pp. 161–187.
Williamson, O. E. (1988), ”Corporate Finance and Corporate Governance”, The Journal of
Finance, vol. 43, no. 3, pp. 567-591.

Bachelor Thesis Fall 2016
38
7. Appendix
Table XI. Level of Leverage
Year Real Estate Construction
Short-Term
Debt Long-Term
Debt Total
Debt Short-Term
Debt Long-Term
Debt Total
Debt 2007 26 % 36 % 60 % 60 % 4 % 64 %
2008 27 % 37 % 62 % 62 % 5 % 66 %
2009 24 % 37 % 59 % 59 % 4 % 63 %
2010 26 % 34 % 58 % 63 % 4 % 66 %
2011 25 % 35 % 58 % 60 % 5 % 65 %
2012 26 % 34 % 58 % 60 % 6 % 66 %
2013 24 % 35 % 57 % 59 % 6 % 65 %
2014 23 % 34 % 56 % 60 % 7 % 67 %
2015 24 % 31 % 52 % 60 % 5 % 65 %

Bachelor Thesis Fall 2016
39
Table XII. Regression with One Lag
Factor Short-Term Debt Long-Term Debt Total Debt
R. E C R. E C R. E C
Growth -0.002 (-0.14)
0.001 (0.36)
0.026 (1.63)
-0.003 (-2.04)
0.023 (1.86)
-0.002 (-0.66)
Profitability -0.005 (-0.37)
-0.215 (-1.65)
-0.018 (-1.08)
0.134 (2.05)
-0.035 (-2.78)
-0.081 (-0.63)
Size -0.015 (-0.73)
0.0267 (1.81)
-0.069 (-2.90)
0.005 (0.72)
-0.084 (-4.55)
0.032 (2.18)
Tangibility -0.016 (-0.34)
0.006 (0.11)
0.0136 (0.25)
-0.081 (-2.70)
0.009 (0.23)
-0.074 (-1.25)
NDTS 0.042 (0.09)
-0.496 (-1.64)
0.305 (0.58)
0.281 (1.86)
0.345 (0.85)
-0.215 (-0.72)
Tax Rate -0.024 (-3.43)
0.013 (0.62)
0.047 (5.77)
0.007 (0.68)
0.022 (3.57)
0.02 (0.96)
R2 (within) 0.058 0.031 0.215 0.327 0.246 0.115
R2 (overall) 0.098 0.001 0.064 0.001 0.000 0.029
F-statistic 2.07 1.05 9.17 15.97 10.94 4.28
Observations 237 233 237 233 237 233
Year Dummies YES YES YES YES YES YES
Fixed Effect Fixed Effect Fixed Effect Fixed Effect Fixed Effect Fixed Effect
Table XIII. Regression with Two Lags

Bachelor Thesis Fall 2016
40
Factor Short-Term Debt Long-Term Debt Total Debt
R. E C R. E C R. E C
Growth -0.008 (-0.58)
0.000 (0.09)
0.019 (1.07)
-0.003 (-1.99)
0.009 (0.69)
-0.002 (-0.91)
Profitability -0.012 (-0.72)
-0.235 (-1.80)
-0.036 (-1.79)
0.147 (2.28)
-0.063 (-4.41)
-0.088 (-0.68)
Size 0.004 (0.17)
0.027 (1.43)
-0.083 (-3.08)
0.005 (0.57)
-0.08 (-4.09)
0.032 (1.74)
Tangibility -0.024 (-0.45)
-0.01 (-0.16)
0.011 (0.17)
-0.07 (-2.42)
-0.001 (-0.03)
-0.083 (-1.38)
NDTS 0.032 (0.07)
-0.541 (-1.79)
0.028 (0.05)
0.311 (2.08)
0.058 (0.15)
-0.230 (-0.78)
Tax Rate -0.057 (-2.80)
0.017 (0.81)
0.041 (1.67)
0.005 (0.45)
-0.011 (-0.60)
0.021 (1.05)
R2 (within) 0.048 0.029 0.115 0.383 0.243 0.139
R2 (overall) 0.018 0.000 0.094 0.000 0.000 0.033
F-statistic 1.46 0.85 3.75 17.47 9.23 4.53
Observations 209 205 209 205 209 205
Year Dummies YES YES YES YES YES YES
Fixed Effect Fixed Effect Fixed Effect Fixed Effect Fixed Effect Fixed Effect