Embed Size (px)
Citation preview

1
Brief
Capital Project Planning Performance Blueprint Powered by TM1
22
Introduction
This application brief describes the purpose and content of the IBM Cognos®
Capital Project Planning Performance Blueprint Powered by TM1, a Web-based
planning solution for managing major capital expenditure projections, which
companies can use as indicators of future revenue and spending needs and to
view effects on other planning processes. The Blueprint and processes described
in this document are generic for any industry and can be configured to support the
complex capital project and requirements for many countries.
Blueprint overview
The Capital Project Planning Blueprint Powered by TM1 manages capital project
requests, their justification, the capital request approval process and depreciation
expense calculations. The Blueprint combines customized dashboards and
reports for three types of users (contributors, managers and executives) with a
flexible capital planning model that incorporates multi-national capital planning
functionality.
Because it is critical that tactical capital project decisions made at the divisional
level be aligned with corporate strategy and objectives, you can use this Blueprint
to compare capital project plans to high-level corporate targets. Several scenarios
are available to assist with the analysis of changes in timing or expenditure amounts
for the overall plan. You can adjust requested amounts either up or down; you
can reject requests entirely or you can change requested timing to either sooner
or later in the planning cycle to meet corporate spending guidelines or cash flow
considerations.
This Blueprint facilitates capital project expenditures planning over a two-year
cycle. You can adjust the cycle as needed to meet specific forward-looking client
needs. Three methods of depreciation calculations are available: straight-line,
diminishing balance and sum of years digits. Currency calculations are also
provided; you can view all outputs in either local currency or in the home-country
currency.
The Blueprint allows for the customization of depreciation calculations to support
the accounting standards of many different countries with a residual asset value, a
first year write-off percentage on new assets and the option to change asset lives by
country and asset type.

3
Blueprint objectives
The Capital Project Planning Blueprint Powered by TM1 meets a number of
objectives:
• Streamline the capital planning process.
• Provide management with justification for each capital request.
• Allow for individual expenditure planning in local currency, while consolidating in home-country
currency.
• Facilitate assessments based on capital request priorities and risk.
• Manipulate the timing or amount of capital expenditures and compare several different
adjustment scenarios.
• Tailor depreciation calculations to match accounting standards in various countries.
• Track the depreciation on existing and forecast assets to see a complete view of projected
depreciation expense.
Business intelligence model
The business intelligence components of the Capital Project Planning Blueprint
Powered by TM1 focus on providing vital information to contributors, managers and
executives. Real-time information and the features implemented provide the tools to
evaluate performance against existing plans, make decisions and view their effects
on plans and corporate strategic initiatives to drive business performance.
The business intelligence features include:
• Real-time data access
• Dashboards providing key information relevant to business function
• Drill-down from dashboards
• Cross-organizational reporting (multi-node reporting)
• Visual aids showing status, impact and evaluation of plan against performance
• Filtering options to further focus on needed information
• Ad-hoc query to slice-and-dice information to answer questions and monitor impact
These features enable informed decisions about capital project planning requests
and their relationship to strategic maps and corporate goals.

4
Workflow
Contributors in an organization’s business units input capital expenditure requests
for planned projects to meet business goals or strategies. These requests are
reviewed and adjusted as needed to fit the goals of the organization. To provide for
a feature-rich business intelligence experience, a business-centered Framework
Manager model has been developed on the IBM Cognos 8 Business Intelligence
Server.
In the Business Intelligence Server are the dashboards, reports, ad-hoc queries
and analyses built on the published Framework Manager package and grouped
according to business-function levels. There is a cost-benefit trade-off in capital
expenditure that affects the performance metrics of a business. Tactical managers
and C-level executives want BI tools to make informed decisions and adjustments
aligned with corporate goals. In keeping with this approach, three categories—C-
level management, tactical management and contributor—are typical users in the
Capital Project Planning Blueprint Powered by TM1 BI implementation.
For the corporate level there are dashboard-style reports that focus on business
perspectives, allow for drill-down to gain insight from greater detail and
filtering, which focuses the perspective on specific areas of importance such
as organization level, strategy or asset class. With real-time data, the impact of
decisions on goals and strategies can quickly be seen and responded to.
At the manager level, dashboards drillable to details, detailed reports, ad-hoc
queries and analyses permit focus on matters of tactical importance. Data and
reports are relevant to tactical managers at the business unit level or departmental
level. Typically, of interest would be capital requests, adjustments, scenarios,
request approval status and impact on that part of the organization. The BI content
readily addresses project impacts on organizational strategies and goals, and
helps proactive management to reach those goals.
With real-time throughput, one can quickly see the impact of changes on capital
expenditure requests. For contributors, focus is on tracking and monitoring capital
expenditure requests. Contributors want to know about expenditure adjustments,
scenario status and request status. Available contributor reports relate expenditure
requests to the bigger picture within the business and indicate their contribution to
corporate goals and strategies.
5
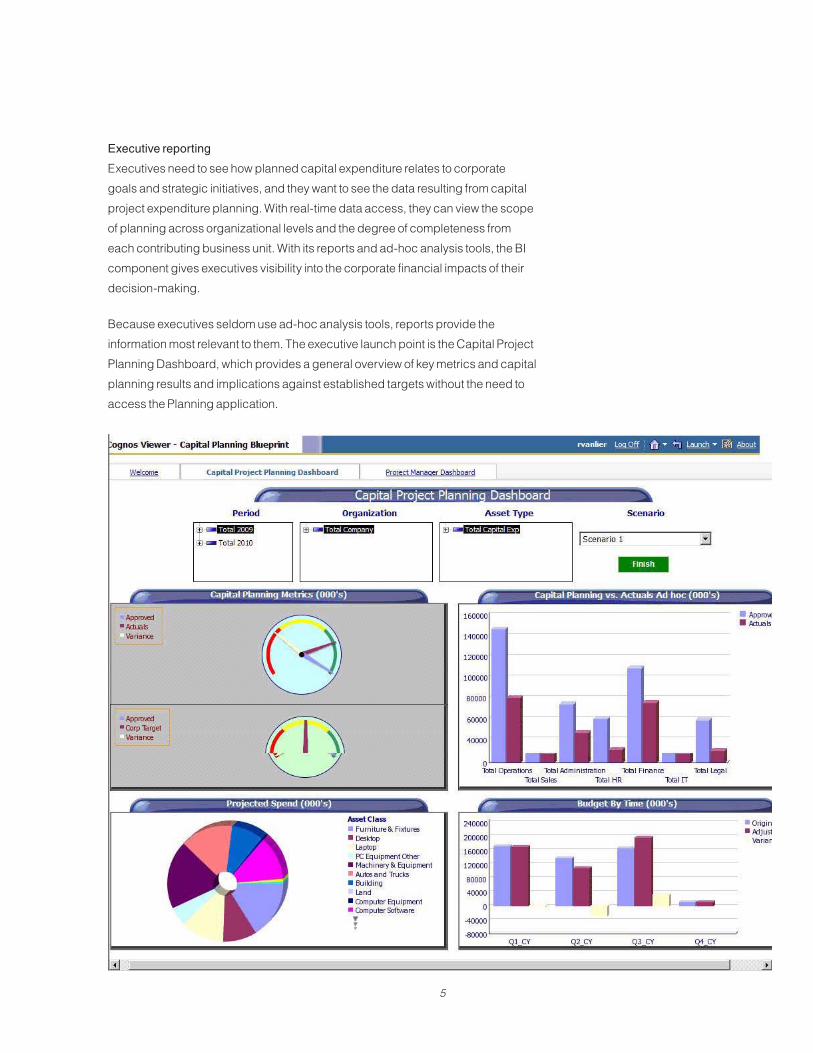
Executive reporting
Executives need to see how planned capital expenditure relates to corporate
goals and strategic initiatives, and they want to see the data resulting from capital
project expenditure planning. With real-time data access, they can view the scope
of planning across organizational levels and the degree of completeness from
each contributing business unit. With its reports and ad-hoc analysis tools, the BI
component gives executives visibility into the corporate financial impacts of their
decision-making.
Because executives seldom use ad-hoc analysis tools, reports provide the
information most relevant to them. The executive launch point is the Capital Project
Planning Dashboard, which provides a general overview of key metrics and capital
planning results and implications against established targets without the need to
access the Planning application.

6
In the dashboard, an executive can select a specific timeframe, organization, asset
type and scenario or he or she might choose to view the total Capital plan by year.
The Metric dials at the top left show variances between Approved versus Actuals
and Approved versus Corporate targets. Hovering your mouse over the dials reveals
detailed data. The bar chart on the top right compares total Approved Capital
expenditures versus total Actual expenditures by Functional Area. For executives,
this type of report shows a great deal of information about the Capital Expenditures
for all business units and provides immediate insight to any anomalies.
The pie chart on the lower left half of the dashboard shows projected spending by
Asset Type. Again, hovering your mouse over each of the slices reveals the actual
numbers projected. The bar chart on the lower right represents spending by quarter
for Original versus Adjusted amounts and the respective variances.
Gathering more detail about asset class or approved amounts versus actual or target
is similarly facilitated by viewing individual reports. Additionally, the ad-hoc section
of this dashboard provides access to views both down and up the organization
hierarchy. Using the dashboard as a launch point provides a quick executive
summary of important metrics for all organization levels. Executives can gain a focus
on higher-level data and establish the impact of that data on organizational strategies
or goals along with financial impacts of executive decision making.
With real-time data access, executives can see the consolidated results of strategic
decisions and capital project planning goals and can clearly see when a business
unit has completed its capital expenditure planning.
Management reporting
With the business intelligence model, managers make informed decisions affecting
tactical goals and strategies. A manager’s task of ensuring that departments or
organization levels contribute to achieving corporate goals and strategic initiatives
might include managing projects, adjusting capital expenditure requests, guiding
justifications and monitoring capital expenditure and asset depreciation. The BI
component provides a number of tools for reporting, analyzing and querying the
data.
Launching the Project Manager Dashboard provides a general overview of asset
classes and strategy maps tied to a project. The report gives a high-level view
of the Original and Adjusted Amounts related to each asset class and strategy
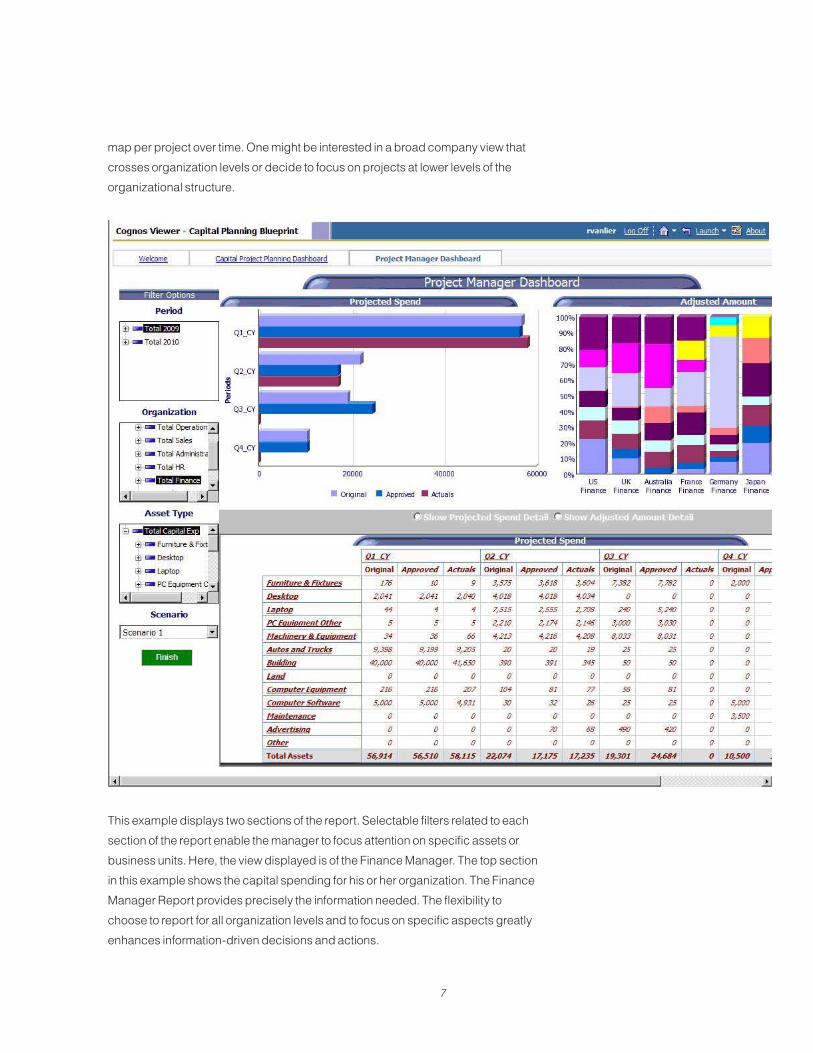
7
map per project over time. One might be interested in a broad company view that
crosses organization levels or decide to focus on projects at lower levels of the
organizational structure.
This example displays two sections of the report. Selectable filters related to each
section of the report enable the manager to focus attention on specific assets or
business units. Here, the view displayed is of the Finance Manager. The top section
in this example shows the capital spending for his or her organization. The Finance
Manager Report provides precisely the information needed. The flexibility to
choose to report for all organization levels and to focus on specific aspects greatly
enhances information-driven decisions and actions.
8
The bottom section represents spending by asset categories. The manager can
view detail to support informed decisions. With real-time data access, as planning
contributors input or modify their capital expenditure requests, changes to capital
expenditure can be quickly measured against goals and strategies. Managers
who might have to adjust and approve expenditure requests can readily see the
status of requests and consolidated results. Even though contributor inputs can
span geographic locations and organization levels, managers can monitor status of
request inputs with the BI components.
Contributor reporting
The BI implementation offers planning contributors reports to review and monitor
their contributions. Beyond the bare details of their capital expenditure requests,
contributors can see how requests contribute to the broader company goals and
strategic initiatives, and gain a sense of ownership and pride as those goals are
met. Utilizing the filtering features gives contributors visibility to all information they
might need without the risk of inadvertent data modifications. An added advantage
is the ability to see how these roll up to become a part of an asset class or interact
across organization levels.
BI summary
There is a cost-benefit tradeoff in capital expenditure that is part of the bigger
picture of business performance. The feature-rich Business Intelligence
component of the Capital Project Planning Blueprint Powered by TM1 provides
information to managers and executives so that they can make informed decisions
to drive stronger business performance. Starting from the details captured by
planning contributors from all business units and geographic locations, then
rolling up to higher organization levels, the Capital Project Planning Blueprint
Powered by TM1 with a Business Intelligence implementation delivers information
for operational, tactical, and strategic decisions that drive stronger business
performance and a sharper competitive edge.
9
Planning model
The planning model of the Blueprint is powered by Cognos TM1 9.5. The key
features of the model are:
• Flexible Blueprint development
• Web-based deployment of models for data collection and consolidation
• Real-time workflow
• Real-time consolidation
• Real-time browser-based calculations to yield immediate results
• Scalable architecture with proven deployments to thousands of users
• Linking functionality to provide collaboration between all areas of the organization
• Capability to execute form-based planning using selection boxes to drive application logic and
calculations
Workflow
As planners update department-level plans, managers and executives need
real-time visibility of the workflow status. In the Capital Project Planning Blueprint
Powered by TM1, capital plans are entered by function and by country. All countries
for each functional area roll up to functional area managers for review. Managers
can see consolidated results of capital plans and depreciation expense scenarios
for their functions. As plan reviewers, managers can see the workflow status of each
function/country under their responsibility and are co-owners of that information,
able to make edits as required.
Workflow status changes, data consolidations and aggregations occur in real-time
as contributors save information, enabling frequent planning iterations. Before data
is entered, the plan is designated Not started. Once a plan is saved, it becomes
a Work in progress and remains accessible for further editing. When an item is
submitted, the plan is Locked and no more changes can be made. The locked
state indicates that the plan is ready for review. A reviewer can review the plan in
any state, but can only reject a Locked plan item. When a Locked plan is rejected,
it reverts to a Work In Progress, making it editable once again for plan owners.
The following graphic depicts workflow that the final reviewer of Total Company
data sees, along with Total Finance or the input level of function/country (such as
Australia Finance or France Finance).

10
Capital Requests
The first Blueprint tab, Capital Requests, is the starting point for the process of
requesting a major capital project or resource. After providing a brief description of
the expenditure, users enter information required to justify the request. There is a list
of selections to be made from drop-down boxes. The data entry items are:
• Expenditure Description: Input a brief description of the expenditure.
• Project Number: Select from a drop-down list of Projects.
• Asset Class: Select from a drop-down list of Asset Types, such as Furniture & Fixtures,
Machinery and so forth.
• Priority: Select Low, Medium, High or Committed from a drop-down list.

11
• Estimated Overall Risk: Select Low, Medium or High from a drop-down list.
• Describe Problem: Enter a brief description of the need for this expenditure.
• Primary Benefit: Input a brief description of the benefits to be realized.
• Estimated Years of Benefit: Select from a drop-down list of various time spans.
• ROI: Select from a drop-down list of predefined descriptions, such as Replacement or Efficiency
Gain.
• Expected Impact: Input an expected percentage return on the expenditure.
• IT Resources Required: Select Yes or No from a drop-down list.
• IT Man-hours: Input the number of estimated IT worker-hours needed.
• Subject Matter Expert: Select internal, external, both or none.
• Strategy Map: Select from a drop-down list of predefined strategies.
• Budget Amount: Input the Budget Amount.
• Residual Value: Input the anticipated residual amount.
• Purchase Month: Select from a drop-down list of months and/years.
• In-Service Month: Select from a drop-down list of months/and years.
As changes are made, they are highlighted in blue along with any cells affected
by the change. As table content is altered, the results are automatically made
available to subsequent tabs affected by the changes. If data is missing or entered
incorrectly, a warning message appears.
Available warnings include:
12
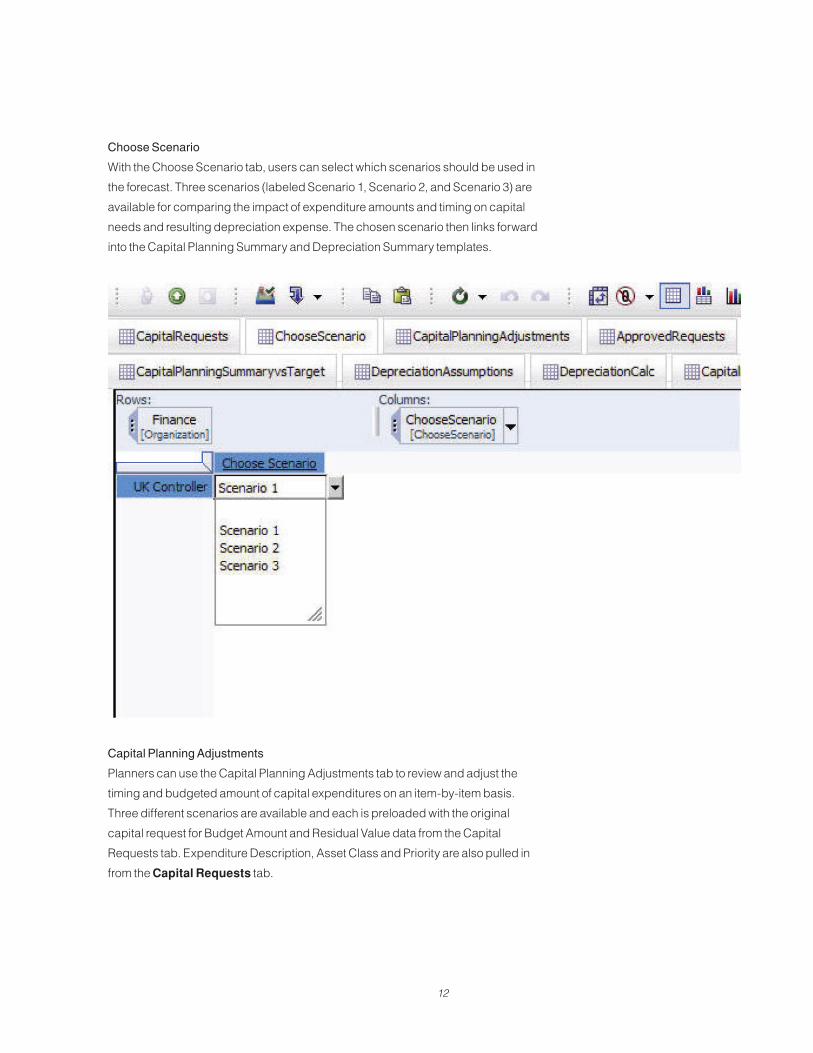
Choose Scenario
With the Choose Scenario tab, users can select which scenarios should be used in
the forecast. Three scenarios (labeled Scenario 1, Scenario 2, and Scenario 3) are
available for comparing the impact of expenditure amounts and timing on capital
needs and resulting depreciation expense. The chosen scenario then links forward
into the Capital Planning Summary and Depreciation Summary templates.
Capital Planning Adjustments
Planners can use the Capital Planning Adjustments tab to review and adjust the
timing and budgeted amount of capital expenditures on an item-by-item basis.
Three different scenarios are available and each is preloaded with the original
capital request for Budget Amount and Residual Value data from the Capital
Requests tab. Expenditure Description, Asset Class and Priority are also pulled in
from the Capital Requests tab.

13
The planner for this department—or a superior—can adjust the timing or amount of an
expenditure. He or she can even change both the timing and amount and analyze
the impact on overall capital expenditures and depreciation. The fields that you can
edit are in white. The fields in gray are either linked over from previous tabs or are
determined based upon the choices made in the white fields.
In the following screen capture, the planner increased the amount in Item 1 by 2500
more than originally requested. At the same time, the planner changed the time of
Item 1 to occur one month earlier than originally requested. To set timing so that it
occurs earlier than originally requested, you enter a negative number of months
in the Adjust Timing Later (Earlier) field. Changes are highlighted in blue, and you
make changes, capital planning impacts are extended automatically to the tabs
affected by the changes.
14
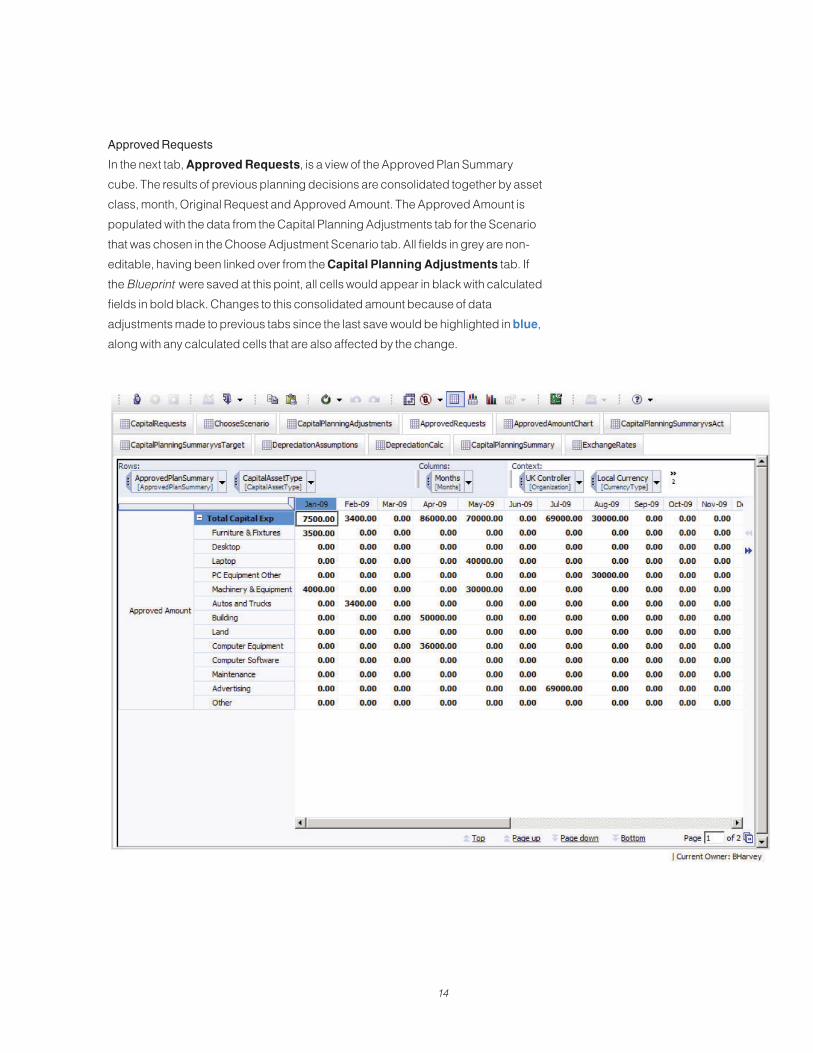
Approved Requests
In the next tab, Approved Requests, is a view of the Approved Plan Summary
cube. The results of previous planning decisions are consolidated together by asset
class, month, Original Request and Approved Amount. The Approved Amount is
populated with the data from the Capital Planning Adjustments tab for the Scenario
that was chosen in the Choose Adjustment Scenario tab. All fields in grey are non-
editable, having been linked over from the Capital Planning Adjustments tab. If
the Blueprint were saved at this point, all cells would appear in black with calculated
fields in bold black. Changes to this consolidated amount because of data
adjustments made to previous tabs since the last save would be highlighted in blue,
along with any calculated cells that are also affected by the change.

15
Approved Amount Chart
This tab is a restatement of the Approved Plan Summary cube. The total years are
shown here as well. This tab is derived from the same cube as that shown in the
Approved Requests view and demonstrates the ability to provide varying views of
the same cube.

16
Capital Planning Summary Vs Act
The Capital Planning Summary Vs Act tab affords another view of the Approved
Plan Summary cube. This view shows Approved Amounts versus Actuals by
month and includes a variance and variance percentage calculation. As actual
capital expenditure data becomes available, it is uploaded into this tab. You
can also view the data by months (Detail) or cumulated so you can see capital
expenditures to date (Cumulative YTD Spending). You can view the data in either
local currency or the home country currency.
17
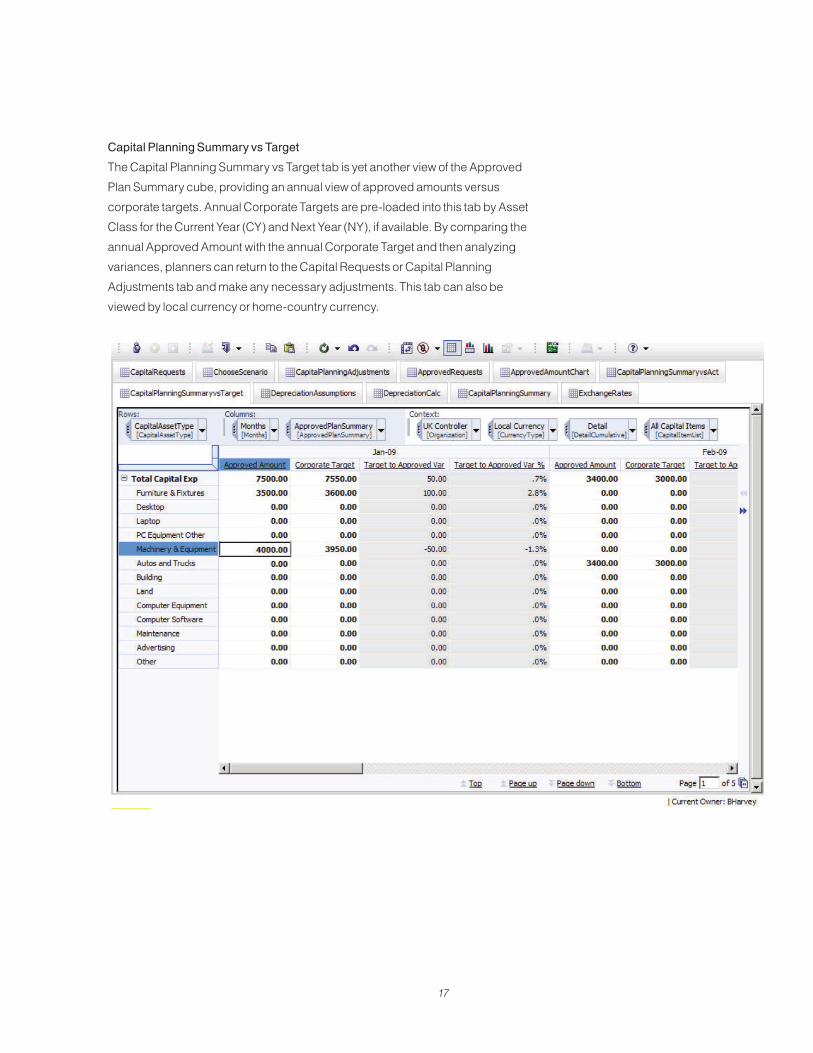
Capital Planning Summary vs Target
The Capital Planning Summary vs Target tab is yet another view of the Approved
Plan Summary cube, providing an annual view of approved amounts versus
corporate targets. Annual Corporate Targets are pre-loaded into this tab by Asset
Class for the Current Year (CY) and Next Year (NY), if available. By comparing the
annual Approved Amount with the annual Corporate Target and then analyzing
variances, planners can return to the Capital Requests or Capital Planning
Adjustments tab and make any necessary adjustments. This tab can also be
viewed by local currency or home-country currency.
18
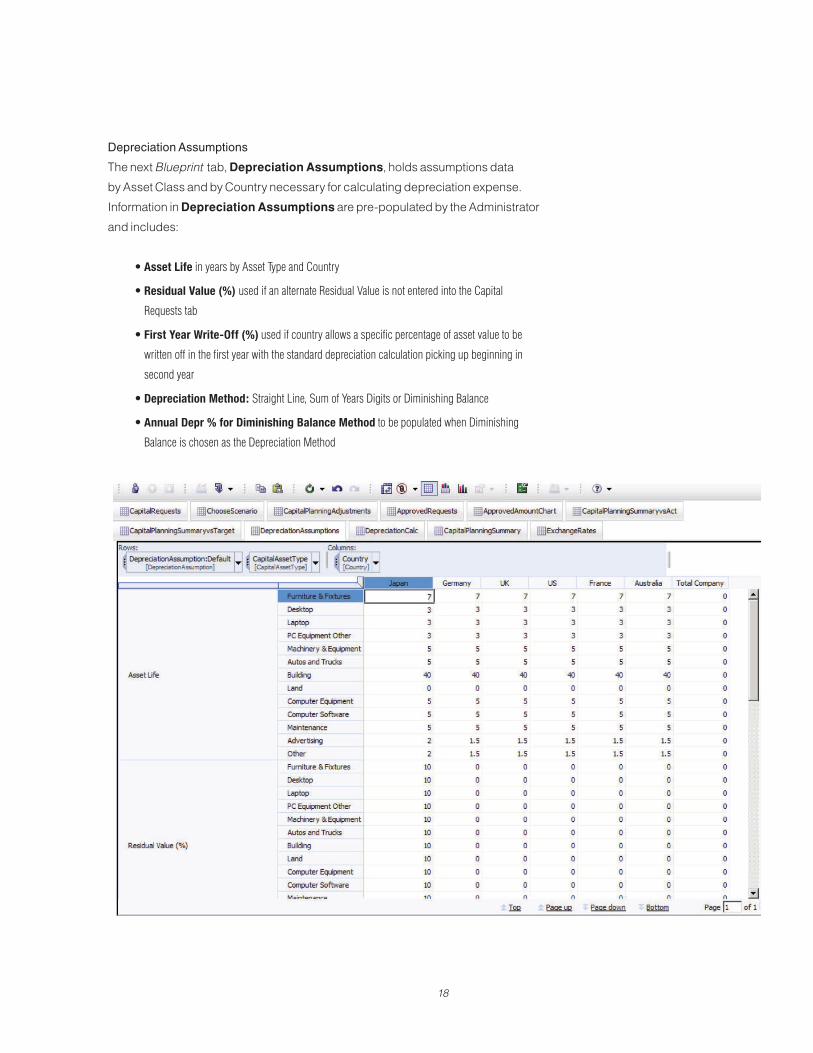
Depreciation Assumptions
The next Blueprint tab, Depreciation Assumptions, holds assumptions data
by Asset Class and by Country necessary for calculating depreciation expense.
Information in Depreciation Assumptions are pre-populated by the Administrator
and includes:
• Asset Life in years by Asset Type and Country
• Residual Value (%) used if an alternate Residual Value is not entered into the Capital
Requests tab
• First Year Write-Off (%) used if country allows a specific percentage of asset value to be
written off in the first year with the standard depreciation calculation picking up beginning in
second year
• Depreciation Method: Straight Line, Sum of Years Digits or Diminishing Balance
• Annual Depr % for Diminishing Balance Method to be populated when Diminishing
Balance is chosen as the Depreciation Method
19
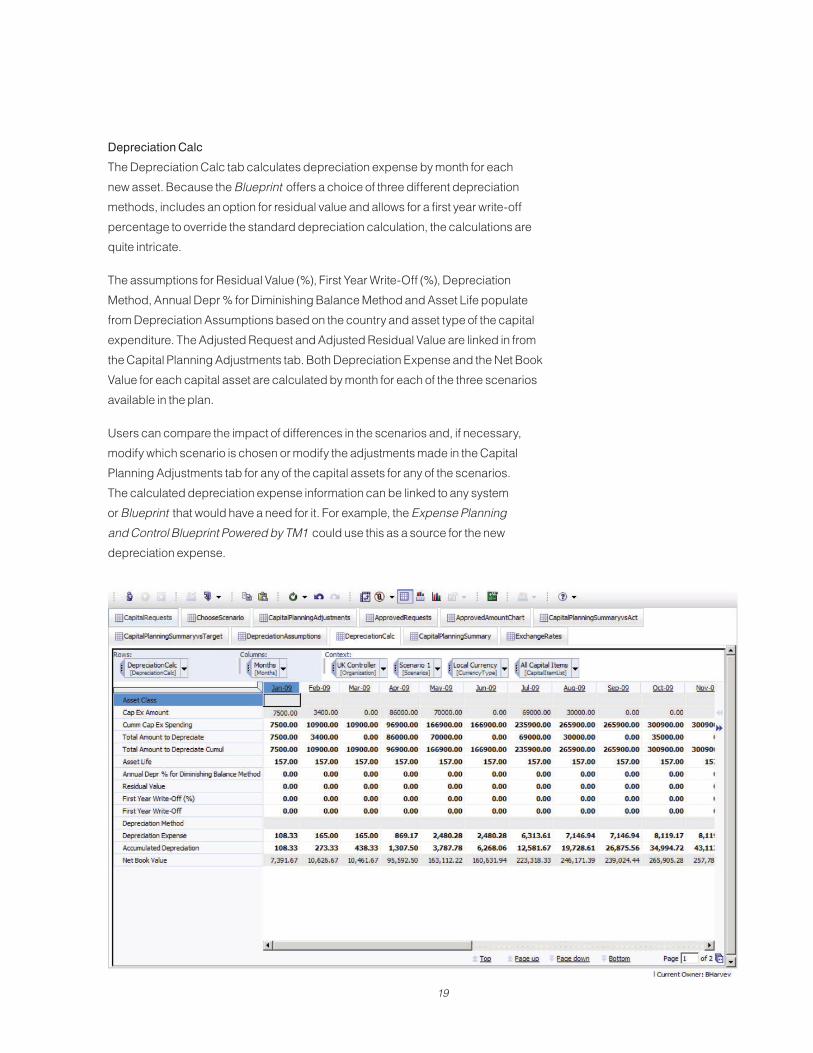
Depreciation Calc
The Depreciation Calc tab calculates depreciation expense by month for each
new asset. Because the Blueprint offers a choice of three different depreciation
methods, includes an option for residual value and allows for a first year write-off
percentage to override the standard depreciation calculation, the calculations are
quite intricate.
The assumptions for Residual Value (%), First Year Write-Off (%), Depreciation
Method, Annual Depr % for Diminishing Balance Method and Asset Life populate
from Depreciation Assumptions based on the country and asset type of the capital
expenditure. The Adjusted Request and Adjusted Residual Value are linked in from
the Capital Planning Adjustments tab. Both Depreciation Expense and the Net Book
Value for each capital asset are calculated by month for each of the three scenarios
available in the plan.
Users can compare the impact of differences in the scenarios and, if necessary,
modify which scenario is chosen or modify the adjustments made in the Capital
Planning Adjustments tab for any of the capital assets for any of the scenarios.
The calculated depreciation expense information can be linked to any system
or Blueprint that would have a need for it. For example, the Expense Planning
and Control Blueprint Powered by TM1 could use this as a source for the new
depreciation expense.

20
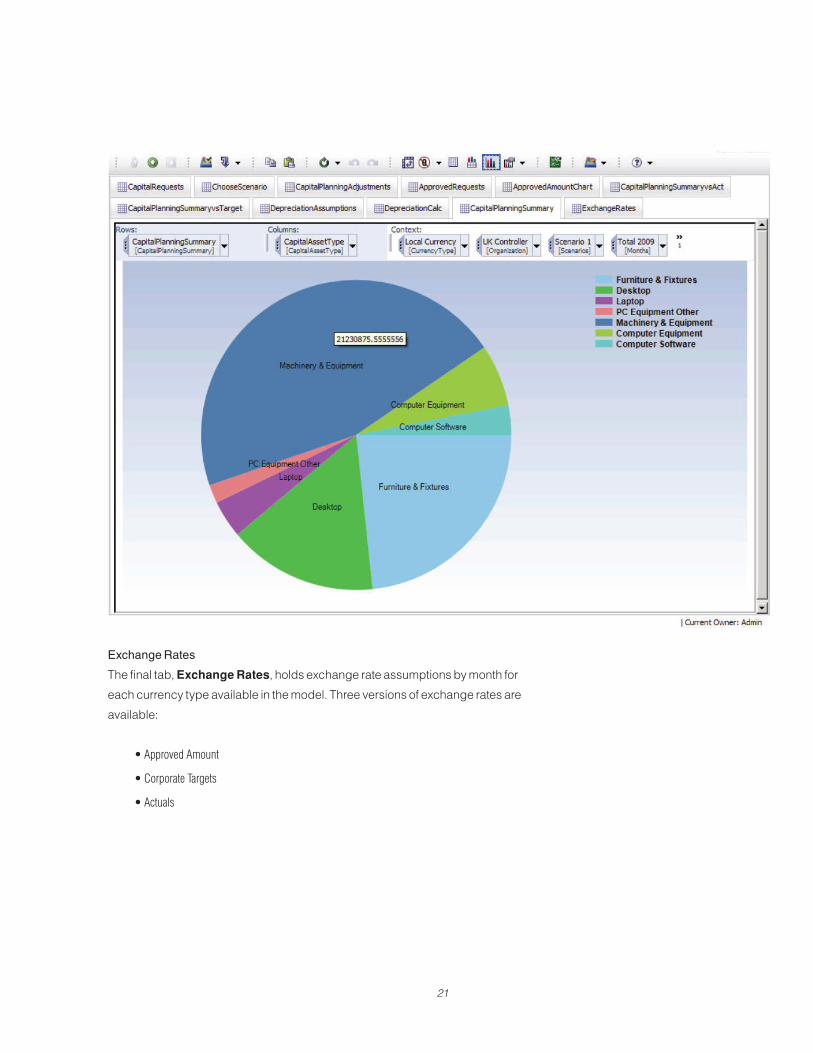
Capital Planning Summary
The Capital Planning Summary tab consolidates data into a summary view, creating
a single source for the most common items used in reports. Data items in this tab
include Total, Current and New Depreciation expense, Original Amount, Adjusted
Amount, Variance vs. Original Request, Adjustments and Variances, Chosen
Scenario (will default to ‘Yes’ for the Chosen Scenario only and will be blank for all
other scenarios). You can view data by home country or local currency, capital
asset entry number (1 through 25) and by Scenario (Scenario1, 2, or 3). This tab may
be hidden from users, but utilized as a data source for the business intelligence
dashboards and reports. It can also be used to develop on the fly graphs and
charts.
21
Exchange Rates
The final tab, Exchange Rates, holds exchange rate assumptions by month for
each currency type available in the model. Three versions of exchange rates are
available:
• Approved Amount
• Corporate Targets
• Actuals

22
The Approved Amount exchange rate applies to monthly capital planning scenarios
in the model, the Corporate Targets exchange rate applies to the Annual Corporate
Target capital numbers in the Capital Planning Summ vs Targets tab and the
Actuals Exchange rate applies to any Actual data shown in the model.

About the IBM Cognos Innovation Center for Performance Management
The IBM Cognos Innovation Center was established in North America and Europe
to advance the understanding of proven planning and performance management
techniques, technologies, and practices. The Innovation Center is dedicated to
transforming routine performance management practices into “next practices”
that help companies
cut costs•
streamline processes•
boost productivity•
enable rapid response to opportunity•
increase management visibility•
Staffed globally by experts in planning, technology, and performance and
strategy management, the Innovation Center partners with more than 600 IBM
Cognos customers, academicians, industry leaders, and others seeking to
accelerate adoption, reduce risk, and maximize the impact of technology-enabled
performance management practices.
About IBM Cognos BI and Performance Management
IBM Cognos business intelligence (BI) and performance management solutions
deliver world-leading enterprise planning, consolidation and BI software, support and
services to help companies plan, understand and manage financial and operational
performance. IBM Cognos solutions bring together technology, analytical applications,
best practices, and a broad network of partners to give customers an open, adaptive
and complete performance solution. Over 23,000 customers in more than 135
countries around the world choose IBM Cognos solutions.
For further information or to reach a representative: www.ibm.com/cognos
Request a call
To request a call or to ask a question, go to www.ibm.com/cognos/contactus.
An IBM Cognos representative will respond to your enquiry within two
business days.
© Copyright IBM Corporation 2010
IBM Canada 3755 Riverside Drive Ottawa, ON, Canada K1G 4K9
Produced in Canada January 2010 All Rights Reserved.
IBM, the IBM logo and ibm.com are trademarks or registered trademarks of International Business Machines Corporation in the United States, other countries, or both. If these and other IBM trademarked terms are marked on their first occurrence in this information with a trademark symbol (® or ™), these symbols indicate U.S. registered or common law trademarks owned by IBM at the time this information was published. Such trademarks may also be registered or common law trademarks in other countries. A current list of IBM trademarks is available on the Web at “Copyright and trademark information” at www.ibm.com/legal/copytrade.shtml.
Other company, product and service names may be trademarks or service marks of others.
References in this publication to IBM products or services do not imply that IBM intends to make them available in all countries in which IBM operates.
Any reference in this information to non-IBM Web sites are provided for convenience only and do not in any manner serve as an endorsement of those Web sites. The materials at those Web sites are not part of the materials for this IBM product and use of those Web sites is at your own risk.
IML14232-CAEN-00