Embed Size (px)
Citation preview

Table of Contents
UNITED STATES
SECURITIES AND EXCHANGE COMMISSIONWashington, D.C. 20549
FORM 10-Q
☒ QUARTERLY REPORT PURSUANT TO SECTION 13 OR 15(d) OF THE SECURITIES EXCHANGE ACT OF1934
For the quarterly period ended March 31, 2013
OR
☐ TRANSITION REPORT PURSUANT TO SECTION 13 OR 15(d) OF THE SECURITIES EXCHANGE ACT OF1934
For the transition period from to
Commission File No. 1-13300
CAPITAL ONE FINANCIAL CORPORATION(Exact name of registrant as specified in its charter)
Delaware 54-1719854(State or Other Jurisdiction ofIncorporation or Organization)
(I.R.S. EmployerIdentification No.)
1680 Capital One Drive,McLean, Virginia 22102
(Address of Principal Executive Offices) (Zip Code)
Registrant’s telephone number, including area code: (703) 720-1000
(Former name, former address and former fiscal year, if changed since last report)(Not applicable)
Indicate by check mark whether the registrant (1) has filed all reports required to be filed by Section 13 or 15(d) of the Securities Exchange Act of 1934 duringthe preceding 12 months (or for such shorter period that the registrant was required to file such reports), and (2) has been subject to such filing requirements forthe past 90 days. Yes ☒ No ☐
Indicate by check mark whether the registrant has submitted electronically and posted on its corporate Web site, if any, every Interactive Data File required to besubmitted and posted pursuant to Rule 405 of Regulation S-T (§232.405 of this chapter) during the preceding 12 months (or for such shorter period that theregistrant was required to submit and post such files). Yes ☒ No ☐
Indicate by check mark whether the registrant is a large accelerated filer, an accelerated filer, a non-accelerated filer, or a smaller reporting company. See thedefinitions of “large accelerated filer,” “accelerated filer” and “smaller reporting company” in Rule 12b-2 of the Exchange Act. Large accelerated filer ☒ Accelerated filer ☐Non-accelerated filer ☐ Smaller reporting company ☐
Indicate by check mark whether the registrant is a Shell Company (as defined in Rule 12b-2 of the Exchange Act) Yes ☐ No ☒
As of April 30, 2013, there were 584,162,780 shares of the registrant’s Common Stock, par value $.01 per share, outstanding.

Table of Contents
TABLE OF CONTENTS Page PART I—FINANCIAL INFORMATION 1 Item 1. Financial Statements 61
Condensed Consolidated Statements of Income 62 Condensed Consolidated Statements of Comprehensive Income 63 Condensed Consolidated Balance Sheets 64 Condensed Consolidated Statements of Changes in Stockholders’ Equity 65 Condensed Consolidated Statements of Cash Flows 66 Notes to Condensed Consolidated Financial Statements 67 Note 1 — Summary of Significant Accounting Policies 67 Note 2 — Discontinued Operations 69 Note 3 — Investment Securities 70 Note 4 — Loans 80 Note 5 — Allowance for Loan and Lease Losses 101 Note 6 — Variable Interest Entities and Securitizations 104 Note 7 — Goodwill and Other Intangible Assets 109 Note 8 — Deposits and Borrowings 110 Note 9 — Derivative Instruments and Hedging Activities 113 Note 10 — Stockholders’ Equity 119 Note 11 — Earnings Per Common Share 121 Note 12 — Fair Value of Financial Instruments 122 Note 13 — Business Segments 136 Note 14 — Commitments, Contingencies and Guarantees 138
Item 2. Management’s Discussion and Analysis of Financial Condition and Results of Operations (“MD&A”) 1 Summary of Selected Financial Data 1 Introduction 6 Executive Summary and Business Outlook 7 Critical Accounting Policies and Estimates 11 Accounting Changes and Developments 13 Consolidated Results of Operations 13 Business Segment Financial Performance 19 Consolidated Balance Sheet Analysis and Credit Performance 32 Off-Balance Sheet Arrangements and Variable Interest Entities 37 Capital Management 37 Risk Management 39 Credit Risk Profile 40 Liquidity Risk Profile 51 Market Risk Profile 55 Supervision and Regulation 58 Forward-Looking Statements 58 Supplemental Tables 60
Item 3. Quantitative and Qualitative Disclosures about Market Risk 151 Item 4. Controls and Procedures 151
PART II—OTHER INFORMATION 152 Item 1. Legal Proceedings 152 Item 1A. Risk factors 152 Item 2. Unregistered Sales of Equity Securities and Use of Proceeds 152
i

Table of Contents
Page Item 3. Defaults upon Senior Securities 152 Item 5. Other Information 152 Item 6. Exhibits 152
SIGNATURES 153 EXHIBIT INDEX 154
ii

Table of Contents
INDEX OF MD&A TABLES AND SUPPLEMENTAL TABLES Table Description Page
— MD&A Tables: 1 Consolidated Financial Highlights (Unaudited) 3 2 Business Segment Results 7 3 Average Balances, Net Interest Income and Net Interest Yield 14 4 Rate/Volume Analysis of Net Interest Income 15 5 Non-Interest Income 16 6 Non-Interest Expense 18 7 Credit Card Business Results 20
7.1 Domestic Card Business Results 23 7.2 International Card Business Results 24 8 Consumer Banking Business Results 26 9 Commercial Banking Business Results 29 10 “Other” Results 31 11 Investment Securities Available for Sale 33 12 Non-Agency Investment Securities Credit Ratings 34 13 Net Loans Held for Investment 34 14 Changes in Representation and Warranty Reserve 36 15 Capital Ratios Under Basel I 38 16 Loan Portfolio Composition 41 17 30+ Days Delinquencies 43 18 Aging and Geography of 30+ Days Delinquent Loans 44 19 90+ Days Delinquent Loans Accruing Interest 44 20 Nonperforming Loans and Other Nonperforming Assets 45 21 Net Charge-Offs 46 22 Loan Modifications and Restructurings 47 23 Allowance for Loan and Lease Losses Activity 49 24 Allocation of the Allowance for Loan and Lease Losses 50 25 Liquidity Reserves 51 26 Deposit Composition and Average Deposit Rates 52 27 Short-term Borrowings 53 28 Contractual Maturity Profile of Outstanding Debt 54 29 Senior Unsecured Debt Credit Ratings 55 30 Interest Rate Sensitivity Analysis 57
— Supplemental Tables: A Reconciliation of Non-GAAP Measures and Calculation of Regulatory Capital Measures under Basel I 60
iii

Table of Contents
PART I—FINANCIAL INFORMATION
Item 2. Management’s Discussion and Analysis of Financial Condition and Results of Operations (“MD&A”) This discussion contains forward-looking statements that are based upon management’s current expectations and are subject to significant uncertainties andchanges in circumstances. Please review “Forward-Looking Statements” for more information on the forward-looking statements in this Quarterly Report onForm 10-Q (“this Report”). Our actual results may differ materially from those included in these forward-looking statements due to a variety of factors including,but not limited to, those described in “Part II—Item 1A. Risk Factors” in this Report and in “Part I—Item 1A. Risk Factors” in our 2012 Annual Report on Form10-K (“2012 Form 10-K”). Unless otherwise specified, references to Notes to our consolidated financial statements are to the Notes to our unaudited condensedconsolidated financial statements as of March 31, 2013 included in this Report. Management monitors a variety of key indicators to evaluate our business results and financial condition. The following MD&A is intended to provide the readerwith an understanding of our results of operations, financial condition and liquidity by focusing on changes from year to year in certain key measures used bymanagement to evaluate performance, such as profitability, growth and credit quality metrics. MD&A is provided as a supplement to, and should be read inconjunction with, our unaudited condensed consolidated financial statements and related notes in this Report and the more detailed information contained in our2012 Form 10-K. MD&A is organized in the following sections:
• Summary of Selected Financial Data • Capital Management• Executive Summary and Business Outlook • Risk Management• Critical Accounting Policies and Estimates • Credit Risk Profile• Accounting Changes and Developments • Liquidity Risk Profile• Consolidated Results of Operations • Market Risk Profile• Business Segment Financial Performance • Supplemental Tables• Consolidated Balance Sheet Analysis • Capital Management• Off-Balance Sheet Arrangements and Variable Interest Entities
SUMMARY OF SELECTED FINANCIAL DATA The following table presents selected consolidated financial data from our results of operations for the three months ended March 31, 2013 and 2012, and selectedcomparative consolidated balance sheet data as of March 31, 2013, and December 31, 2012. We also provide selected key metrics we use in evaluating ourperformance. Certain prior period amounts have been reclassified to conform to the current period presentation. The comparability of our results of operationsbetween reported periods is impacted by the following acquisitions completed in 2012:
• On February 17, 2012, we completed the acquisition (the “ING Direct acquisition”) of substantially all of the ING Direct business in the United States
(“ING Direct”) from ING Groep N.V., ING Bank N.V., ING Direct N.V. and ING Direct Bancorp (collectively the “ING Direct Sellers”). The ING Directacquisition resulted in the addition of loans of $40.4 billion, other assets of $53.9 billion and deposits of $84.4 billion as of the acquisition date.
• On May 1, 2012, pursuant to the agreement with HSBC Finance Corporation, HSBC USA Inc. and HSBC Technology and Services (USA) Inc.(collectively, “HSBC”), we closed the acquisition of substantially all of the assets and assumed liabilities of HSBC’s credit card and private-label creditcard business in the United States (other than the HSBC Bank USA, National Association consumer credit card program and certain other retained assetsand liabilities) (the “2012 U.S. card acquisition”). The 2012 U.S. card
1

Table of Contents
acquisition included (i) the acquisition of HSBC’s U.S. credit card portfolio, (ii) its on-going private label and co-branded partnerships, and (iii) otherassets, including infrastructure and capabilities. At closing, we acquired approximately 27 million new active accounts, $27.8 billion in outstanding creditcard receivables designated as held for investment and $327 million in other net assets.
We use the term “acquired loans” to refer to a limited portion of the credit card loans acquired in the 2012 U.S. card acquisition and the substantial majority ofconsumer and commercial loans acquired in the ING Direct and Chevy Chase Bank (“CCB”) acquisitions, which were recorded at fair value at acquisition andsubsequently accounted for based on expected cash flows to be collected (under the accounting standard formerly known as “Statement of Position 03-3,Accounting for Certain Loans or Debt Securities Acquired in a Transfer,” commonly referred to as “SOP 03-3”). The period-end carrying value of acquired loansaccounted for subsequent to acquisition based on expected cash flows to be collected was $34.9 billion and $37.1 billion as of March 31, 2013 and December 31,2012, respectively. The difference between the fair value at acquisition and initial expected cash flows represents the accretable yield, which is recognized intointerest income over the life of the loans. The difference between the contractual payments on the loans and the expected cash flows represents the nonaccretabledifference or the amount not considered collectible, which approximates what we refer to as the “credit mark.” The credit mark established under the accountingfor these loans takes into consideration future expected credit losses over the life of the loans. Accordingly, there are no charge-offs or an allowance associatedwith these loans unless the estimated cash flows expected to be collected decrease subsequent to acquisition. In addition, these loans are not classified asdelinquent or nonperforming even though the customer may be contractually past due because we expect that we will fully collect the carrying value of theseloans. The accounting and classification of these loans may significantly alter some of our reported credit quality metrics. We therefore supplement certainreported credit quality metrics with metrics adjusted to exclude the impact of these acquired loans. For additional information, see “Credit Risk Profile” and“Note 4—Loans—Acquired Loans.”
2

Table of Contents
Table 1: Consolidated Financial Highlights (Unaudited) Three Months Ended March 31, (Dollars in millions, except per share data as noted) 2013 2012 Change Income statement Net interest income $ 4,570 $ 3,414 34% Non-interest income 981 1,521 (36)
Total net revenue 5,551 4,935 12 Provision for credit losses 885 573 54 Non-interest expense 3,028 2,504 21
Income from continuing operations before income taxes 1,638 1,858 (12) Income tax provision 494 353 40
Income from continuing operations, net of tax 1,144 1,505 (24) Loss from discontinued operations, net of tax (78) (102) (24)
Net income 1,066 1,403 (24) Dividends and undistributed earnings allocated to participating securities (5) (7) (29) Preferred stock dividends (13) — **
Net income available to common shareholders $ 1,048 $ 1,396 (25)%
Common share statistics Earnings per common share:
Basic earnings per common share $ 1.81 $ 2.74 (34)% Diluted earnings per common share 1.79 2.72 (34)
Weighted average common shares outstanding: Basic earnings per common share 580.5 508.7 14 Diluted earnings per common share 586.3 513.1 14
Dividends per common share 0.05 0.05 **
Average balances Loans held for investment $195,997 $152,900 28% Interest-earning assets 272,345 220,246 24 Total assets 303,223 246,384 23 Interest-bearing deposits 190,612 151,625 26 Total deposits 211,555 170,259 24 Borrowings 41,574 35,994 16 Stockholders’ equity 40,960 32,982 24 Selected performance metrics Purchase volume $ 45,098 $ 34,498 31% Total net revenue margin 8.15% 8.96% (81)bps Net interest margin 6.71 6.20 51 Net charge-offs $ 1,079 $ 780 38% Net charge-off rate 2.20% 2.04% 16bps Net charge-off rate (excluding acquired loans) 2.69 2.40 29 Return on average assets 1.51 2.44 (93) Return on average total stockholders’ equity 11.17 18.25 (708) Equity-to-assets ratio 13.51 13.39 12 Non-interest expense as a % of average loans held for investment 6.18 6.55 (37) Efficiency ratio 54.55 50.74 381 Effective income tax rate 30.2 19.0 1,120
3
(1)
(2)
(3)
(4)
(5)
(6)
(7)
(8)
(9)
(10)
(11)
(12)
(13)
(14)
(15)
(16)

Table of Contents
March 31,
2013 December 31,
2012 Change Balance sheet (period end) Loans held for investment $ 191,333 $ 205,889 (7)% Interest-earning assets 268,479 280,096 (4) Total assets 300,163 312,918 (4) Interest-bearing deposits 191,093 190,018 1 Total deposits 212,410 212,485 ** Borrowings 37,492 49,910 (25) Stockholders’ equity 41,296 40,499 2 Credit quality metrics (period end) Allowance for loan and lease losses $ 4,606 $ 5,156 (11)% Allowance as a % of loans held of investment (“allowance coverage ratio”) 2.41% 2.50% (9)bps Allowance as a % of loans held of investment (excluding acquired loans) 2.91 3.02 (11) 30+ days performing delinquency rate 2.37 2.70 (33) 30+ days performing delinquency rate (excluding acquired loans) 2.90 3.29 (39) 30+ days delinquency rate 2.74 3.09 (35) 30+ days delinquency rate (excluding acquired loans) 3.35 3.77 (42) Capital ratios Tier 1 common ratio 11.79% 10.96% 83bps Tier 1 risk-based capital ratio 12.18 11.34 84 Total risk-based capital ratio 14.43 13.56 87 Tangible common equity (“TCE”) ratio 8.61 7.90 71 Associates Full-time equivalent employees (in thousands) 39.3 39.6 (1)% ** Change is less than one percent or not meaningful.
Premium amortization related to the ING Direct and 2012 U.S. card acquisitions reduced net interest income by $111 million and $30 million in the firstquarter of 2013 and 2012, respectively.
Includes a bargain purchase gain of $594 million attributable to the ING Direct acquisition recognized in non-interest income in the first quarter of 2012. Thebargain purchase gain represents the excess of the fair value of the net assets acquired from ING Direct as of the acquisition date over the considerationtransferred.Total net revenue was reduced by $265 million and $123 million in the first quarter of 2013 and 2012, respectively, for the estimated uncollectible amount ofbilled finance charges and fees.
Includes purchased credit card relationship (“PCCR”) intangible amortization of $116 million and $4 million in the first quarter of 2013 and 2012,respectively, the substantial majority of which is attributable to the 2012 U.S. card acquisition. Also includes core deposit intangible amortization of $44million and $46 million in the first quarter of 2013 and 2012, respectively.
Discontinued operations reflect ongoing costs related to the mortgage origination operations of GreenPoint’s wholesale mortgage banking unit, GreenPointMortgage Funding, Inc. (“Greenpoint”), which we closed in 2007.Loans held for investment includes loans acquired in the CCB, ING Direct and 2012 U.S. card acquisitions. The period-end carrying value of acquired loansaccounted for subsequent to acquisition based on expected cash flows to be collected was $34.9 billion and $37.1 billion as of March 31, 2013 andDecember 31, 2012, respectively. The average carrying value of acquired loans was $35.7 billion and $23.1 billion in the first quarter of 2013 and 2012,respectively. The average balance of loans held for investment, excluding the carrying value of acquired loans, was $160.3 billion and $129.8 billion in thefirst quarter of 2013 and 2012, respectively. See “Note 4—Loans” for additional information.Consists of credit card purchase transactions, net of returns, for the period for both loans classified as held for investment and loans classified as held forsale. Excludes cash advance transactions.Calculated based on annualized total net revenue for the period divided by average interest-earning assets for the period.
4
(6)
(11)
(11)
(11)
(17)
(18)
(19)
(20)
(1)
(2)
(3)
(4)
(5)
(6)
(7)
(8)

Table of Contents
Calculated based on annualized net interest income for the period divided by average interest-earning assets for the period.Calculated based on annualized net charge-offs for the period divided by average loans held for investment for the period.Calculation of ratio adjusted to exclude from the denominator acquired loans accounted for subsequent to acquisition based on expected cash flows to becollected. See “Business Segment Financial Performance,” “Credit Risk Profile” and “Note 4—Loans—Credit Quality” for additional information on theimpact of acquired loans on our credit quality metrics.Calculated based on annualized income from continuing operations, net of tax, for the period divided by average total assets for the period.Calculated based on annualized income from continuing operations, net of tax, for the period divided by average stockholders’ equity for the period.Calculated based on average stockholders’ equity for the period divided by average total assets for the period.Calculated based on annualized non-interest expense, excluding goodwill impairment charges, for the period divided by average loans held for investmentfor the period.Calculated based on non-interest expense, excluding goodwill impairment charges, for the period divided by total net revenue for the period.Tier 1 common ratio is a regulatory capital measure calculated based on Tier 1 common equity divided by risk-weighted assets. See “MD&A—CapitalManagement” and “MD&A—Supplemental Tables—Table A: Reconciliation of Non-GAAP Measures and Calculation of Regulatory Capital MeasuresUnder Basel I” for additional information, including the calculation of this ratio.Tier 1 risk-based capital ratio is a regulatory measure calculated based on Tier 1 capital divided by risk-weighted assets. See “MD&A—CapitalManagement” and “MD&A—Supplemental Tables—Table A: Reconciliation of Non-GAAP Measures and Calculation of Regulatory Capital MeasuresUnder Basel I” for additional information, including the calculation of this ratio.Total risk-based capital ratio is a regulatory measure calculated based on total risk-based capital divided by risk-weighted assets. See “MD&A—CapitalManagement” and “MD&A—Supplemental Tables—Table A: Reconciliation of Non-GAAP Measures and Calculation of Regulatory Capital MeasuresUnder Basel I” for additional information, including the calculation of this ratio.TCE ratio is a non-GAAP measure calculated based on tangible common equity divided by tangible assets. See “MD&A—Supplemental Tables—Table A:Reconciliation of Non-GAAP Measures and Calculation of Regulatory Capital Measures Under Basel I” for the calculation of this measure andreconciliation to the comparative GAAP measure.
5
(9)
(10)
(11)
(12)
(13)
(14)
(15)
(16)
(17)
(18)
(19)
(20)
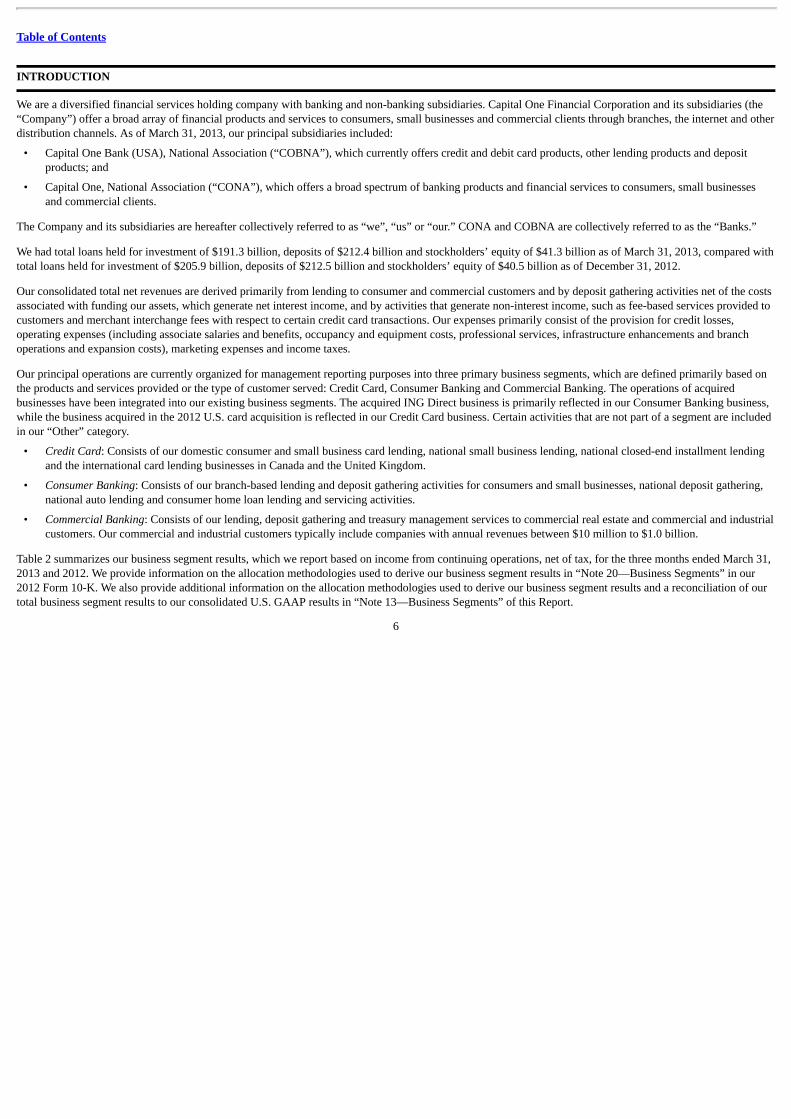
Table of Contents
INTRODUCTION We are a diversified financial services holding company with banking and non-banking subsidiaries. Capital One Financial Corporation and its subsidiaries (the“Company”) offer a broad array of financial products and services to consumers, small businesses and commercial clients through branches, the internet and otherdistribution channels. As of March 31, 2013, our principal subsidiaries included:
• Capital One Bank (USA), National Association (“COBNA”), which currently offers credit and debit card products, other lending products and deposit
products; and
• Capital One, National Association (“CONA”), which offers a broad spectrum of banking products and financial services to consumers, small businesses
and commercial clients.
The Company and its subsidiaries are hereafter collectively referred to as “we”, “us” or “our.” CONA and COBNA are collectively referred to as the “Banks.”
We had total loans held for investment of $191.3 billion, deposits of $212.4 billion and stockholders’ equity of $41.3 billion as of March 31, 2013, compared withtotal loans held for investment of $205.9 billion, deposits of $212.5 billion and stockholders’ equity of $40.5 billion as of December 31, 2012.
Our consolidated total net revenues are derived primarily from lending to consumer and commercial customers and by deposit gathering activities net of the costsassociated with funding our assets, which generate net interest income, and by activities that generate non-interest income, such as fee-based services provided tocustomers and merchant interchange fees with respect to certain credit card transactions. Our expenses primarily consist of the provision for credit losses,operating expenses (including associate salaries and benefits, occupancy and equipment costs, professional services, infrastructure enhancements and branchoperations and expansion costs), marketing expenses and income taxes.
Our principal operations are currently organized for management reporting purposes into three primary business segments, which are defined primarily based onthe products and services provided or the type of customer served: Credit Card, Consumer Banking and Commercial Banking. The operations of acquiredbusinesses have been integrated into our existing business segments. The acquired ING Direct business is primarily reflected in our Consumer Banking business,while the business acquired in the 2012 U.S. card acquisition is reflected in our Credit Card business. Certain activities that are not part of a segment are includedin our “Other” category.
• Credit Card: Consists of our domestic consumer and small business card lending, national small business lending, national closed-end installment lending
and the international card lending businesses in Canada and the United Kingdom.
• Consumer Banking: Consists of our branch-based lending and deposit gathering activities for consumers and small businesses, national deposit gathering,
national auto lending and consumer home loan lending and servicing activities.
• Commercial Banking: Consists of our lending, deposit gathering and treasury management services to commercial real estate and commercial and industrial
customers. Our commercial and industrial customers typically include companies with annual revenues between $10 million to $1.0 billion.
Table 2 summarizes our business segment results, which we report based on income from continuing operations, net of tax, for the three months ended March 31,2013 and 2012. We provide information on the allocation methodologies used to derive our business segment results in “Note 20—Business Segments” in our2012 Form 10-K. We also provide additional information on the allocation methodologies used to derive our business segment results and a reconciliation of ourtotal business segment results to our consolidated U.S. GAAP results in “Note 13—Business Segments” of this Report.
6

Table of Contents
Table 2: Business Segment Results Three Months Ended March 31, 2013 2012 Total Net Revenue Net Income (Loss) Total Net Revenue Net Income (Loss)
(Dollars in millions) Amount % ofTotal Amount
% ofTotal Amount
% ofTotal Amount
% ofTotal
Credit Card $3,651 66% $ 686 60% $2,590 53% $ 566 38% Consumer Banking 1,659 30 383 33 1,464 30 224 15 Commercial Banking 538 9 203 18 516 10 210 14 Other (297) (5) (128) (11) 365 7 505 33
Total from continuing operations $5,551 100% $1,144 100% $4,935 100% $1,505 100%
Total net revenue consists of net interest income and non-interest income. Net income for our business segments is reported based on income from continuing operations, net of tax. Includes the residual impact of the allocation of our centralized Corporate Treasury group activities, such as management of our corporate investment
portfolio and asset/liability management, to our business segments as well as other items as described in “Note 20—Business Segments” in our 2012 Form10-K.
EXECUTIVE SUMMARY AND BUSINESS OUTLOOK Each of our businesses delivered solid results in the first quarter of 2013. Our earnings for the quarter, which were led by strong profitability in our DomesticCard business and continued positive credit quality trends, added to our existing capital strength. Notable events during the quarter included the following:
• Our redemption on January 2, 2013 of $3.65 billion of our trust preferred securities, which generally carried a higher coupon than other funding sources
available to us.
• Our February 19, 2013 announcement of our agreement with Best Buy Stores, L.P. (“Best Buy”) to end our contractual credit card relationship early and tosell the Best Buy portfolio of private label and co-branded credit card accounts that we acquired in the 2012 U.S. card acquisition to Citibank, N.A. Wereclassified the assets subject to the sale agreement, which included loans of approximately $7 billion as of the date of the transfer, to the held for salecategory from the held for investment category in the first quarter. The sale of the portfolio to Citibank, which is subject to customary closing conditions,and early termination of the Best Buy partnership are expected to be finalized in the third quarter of 2013.
• In January 2013 we submitted our capital plan to the Board of Governors of the Federal Reserve as part of the 2013 Comprehensive Capital Analysis andReview (“CCAR”). On March 14, 2013, we were informed by the Board of Governors of the Federal Reserve that it had completed its review under theCCAR process and that it did not object to our proposed capital distribution plans submitted pursuant to CCAR, which included an increase in the quarterlydividend on our common stock. On May 2, 2013, our Board of Directors approved an increase in our quarterly common stock dividend per share from$0.05 per share to $0.30 per share, payable May 23, 2013 to stockholders of record as of May 13, 2013.
• Our transition from the ING Direct brand to the Capital One 360 brand, which is now the leading digital online depository bank in the U.S.
In the near term, we continue to navigate the challenges of the prolonged low interest rate environment, weak consumer demand and the planned run-off ofcertain acquired mortgage and card loans. However, the ING Direct and 2012 U.S. card acquisitions have strengthened and expanded our customer base anddriven substantial growth in our total net revenues, putting us in what we believe is a strong position to generate capital, deliver sustained shareholder value anddeepen our customer relationships with new products and services, even in the current challenging environment.
7
(1) (2) (1) (2)
(3)
(1)
(2)
(3)

Table of Contents
Financial Highlights
We reported net income of $1.1 billion ($1.79 per diluted share) on total net revenue of $5.6 billion for the first quarter of 2013, with each of our three businesssegments contributing to our earnings. In comparison, we reported net income of $1.4 billion ($2.72 per diluted share), which included a bargain purchase gain of$594 million attributable to the ING Direct acquisition, on total net revenue of $4.9 billion for the first quarter of 2012. Net income, excluding the impact of thebargain purchase gain, was $809 million ($1.56 per diluted share) for the first quarter of 2012.
Our Tier 1 common ratio, as calculated under Basel I, increased to 11.8% as of March 31, 2013, up from 11.0% as of December 31, 2012. The increase in our Tier1 common ratio reflected strong internal capital generation from earnings. See “Capital Management” below for additional information.
Below are additional highlights of our performance in the first quarter of 2013. These highlights generally are based on a comparison between our first quarter2013 and 2012 results, except as otherwise noted. The changes in our financial condition and credit performance are generally based on our financial conditionand credit performance as of March 31, 2013, compared with our financial condition and credit performance as of December 31, 2012. We provide a moredetailed discussion of our financial performance in the sections following this “Executive Summary and Business Outlook.”
Total Company
• Earnings: Our net income of $1.1 billion for the first quarter of 2013 decreased by $337 million, or 24%, from the first quarter of 2012, primarily due to theabsence of the bargain purchase gain of $594 million recorded at acquisition of ING Direct in the first quarter of 2012. Excluding the impact of the bargainpurchase gain, net income of $1.1 billion for the first quarter of 2013 increased by $257 million, or 32%, from the first quarter of 2012. The increase wasdriven by growth in net interest income of approximately $1.2 billion attributable to the substantial increase in average interest-earning assets as a result ofthe ING Direct and 2012 U.S. card acquisitions, which was partially offset by an increase in the provision for credit losses of $312 million and an increasein non-interest expense of $524 million. The increase in the provision was driven by higher net charge-offs resulting from the addition of loans from the2012 U.S. card acquisition. The increase in non-interest expense was due in part to higher operating expenses associated with the recent acquisitions as wellas an increase in intangible amortization expense. Amortization of intangibles totaled $177 million in the first quarter of 2013, compared with $62 millionin the first quarter of 2012.
• Loans Held for Investment: Period-end loans held for investment decreased by $14.6 billion, or 7%, in the first quarter of 2013, to $191.3 billion as ofMarch 31, 2013, from $205.9 billion as of December 31, 2012. The decrease was due in part to the transfer of the Best Buy loan portfolio to the held forsale category. Excluding the transfer of the Best Buy portfolio of approximately $7 billion to held for sale, period-end loans held for investment decreasedby approximately $7.6 billion, or 4%, due to typical seasonally lower credit card purchase volumes and higher pay downs in the first quarter of the year, thecontinued expected run-off of installment loans in our Credit Card business and home loans in our Consumer Banking business, as well as the expected run-off of certain other credit card loans acquired in the 2012 U.S. card acquisition. The pay downs and run-off of card balances were partially offset by higherperiod-end auto balances due to the continued high volume of auto loan originations and strong loan originations in our commercial and industrial andcommercial real estate loan portfolios.
• Charge-off and Delinquency Statistics: Our reported net charge-off rate was 2.20% in the first quarter of 2013, compared with 2.04% in the first quarter of2012. We experienced higher net charge-offs in our Domestic Card business in the first quarter of 2013 due to the addition of loans from the 2012 U.S. cardacquisition. Our reported 30+ day delinquency rate declined to 2.74% as of March 31, 2013, from 3.09% as of December 31, 2012. Delinquency rates inour consumer lending businesses have historically exhibited
8

Table of Contents
seasonal patterns, with delinquency rates generally tending to decrease in the first two quarters of the year as customers use income tax refunds to paydown outstanding loan balances. We provide information on our credit quality metrics, excluding the impact of acquired loans accounted for based onestimated cash flows expected to be collected, below under “Business Segments” and “Credit Risk Profile.”
• Allowance for Loan and Lease Losses: We reduced our allowance by $550 million to $4.6 billion as of March 31, 2013, from $5.2 billion as of
December 31, 2012. The reduction was attributable to the transfer of the Best Buy loan portfolio to held for sale and an allowance release of $261 million.The allowance coverage ratio declined to 2.41% as of March 31, 2013, from 2.50% as of December 31, 2012, due in part to an improved credit outlook.
• Representation and Warranty Reserve: We recorded a provision for mortgage representation and warranty losses of $97 million in the first quarter of 2013,
compared with a provision for mortgage representation and warranty losses of $169 million in the first quarter of 2012. Our mortgage representation andwarranty reserve increased to $994 million as of March 31, 2013, from $899 million as of December 31, 2012.
Business Segments
• Credit Card: Our Credit Card business generated net income from continuing operations of $686 million in the first quarter of 2013, an increase of $120million, or 21%, from net income from continuing operations of $566 million in the first quarter of 2012. The increase in earnings reflected the impact ofthe 2012 U.S. card acquisition, which contributed to an increase in total net revenues of $1.1 billion. The net revenue increase was partially offset by ahigher provision for credit losses and higher operating expenses, including PCCR intangible amortization expense of $113 million, resulting from the 2012U.S. card acquisition. Period-end loans held for investment in our Credit Card business decreased by $13.4 billion, or 15%, in the first quarter of 2013, to$78.4 billion as of March 31, 2013, from $91.8 billion as of December 31, 2012. The decrease was due in part to the transfer of the Best Buy portfolio tothe held for sale category. Excluding the transfer of the Best Buy portfolio, period-end loans held for investment decreased by $6.4 billion, or 7%, due inpart to typical seasonally lower purchase volumes and higher pay downs in the first quarter of the year, the expected continued run-off of our installmentloan portfolio, as well as the expected run-off of certain other credit card loans acquired in the 2012 U.S. card acquisition. We experience fluctuations inpurchase volumes and the level of outstanding receivables in our Credit Card business due to higher seasonal consumer spending and payment patternsaround the winter holiday season, summer vacations and back-to-school periods.
• Consumer Banking: Our Consumer Banking business generated net income from continuing operations of $383 million in the first quarter of 2013, anincrease of $159 million, or 71%, from net income from continuing operations of $224 million in the first quarter of 2012. The results for the first quarter of2013 reflect a full-quarter impact from ING Direct, whereas the results for the first quarter of 2012 reflect a partial-quarter impact. The increase in earningswas attributable to growth in total net revenue and a decrease in non-interest expense. Growth in net revenue was primarily due to a significant increase inaverage loan balances due to the addition of home loans from the ING Direct acquisition and higher auto loan originations over the past twelve months. Thedecrease in non-interest expense was largely due to the absence of ING Direct acquisition-related costs incurred in the first quarter of 2012, which waspartially offset by increased expenses related to the growth in our auto loan portfolio. Period-end loans held for investment in our Consumer Bankingbusiness declined by $1.5 billion, or 2%, to $73.6 billion as of March 31, 2013, from $75.1 billion as of December 31, 2012, due to the continued run-off ofacquired home loans, which was partially offset by higher period-end auto balances due to the continued portfolio growth.
• Commercial Banking: Our Commercial Banking business generated net income from continuing operations of $203 million in the first quarter of 2013, adecrease of $7 million, or 3%, from net income from continuing operations of $210 million in the first quarter of 2012. Growth in commercial real estateand commercial and industrial loans and higher deposit balances contributed to an increase in total net revenues. The favorable impact from higher netrevenue was offset by a lower negative provision for credit losses of
9

Table of Contents
$35 million recorded in the first quarter of 2013, compared with a negative provision of $69 million recorded in the first quarter of 2012. Period-end loansheld for investment in our Commercial Banking business increased by $330 million, or 1%, in the first quarter of 2013 to $39.2 billion as of March 31,2013, from $38.8 billion as of December 31, 2012. The increase was driven by stronger loan originations in the commercial and industrial and commercialreal estate businesses, which was partially offset by the continued run-off of the small-ticket commercial real estate loan portfolio.
Business Outlook
We discuss below our current expectations regarding our total company performance and the performance of each of our business segments over the near-termbased on market conditions, the regulatory environment and our business strategies as of the time we filed this Quarterly Report on Form 10-Q. The statementscontained in this section are based on our current expectations regarding our outlook for our financial results and business strategies. Our expectations take intoaccount, and should be read in conjunction with, our expectations regarding economic trends and analysis of our business as discussed in “Part I—Item 1.Business” and “Part I—Item 7. Management’s Discussion and Analysis of Financial Condition and Results of Operations” in our 2012 Form 10-K. Certainstatements are forward-looking statements within the meaning of the Private Securities Litigation Reform Act of 1995. Actual results could differ materially fromthose in our forward-looking statements. Forward-looking statements do not reflect: (i) any change in current dividend or repurchase strategies, (ii) the effect ofany acquisitions, divestitures or similar transactions that have not been previously disclosed, or (iii) any changes in laws, regulations or regulatory interpretations,in each case after the date as of which such statements are made. See “Forward-Looking Statements” in this Quarterly Report on Form 10-Q for more informationon the forward-looking statements in this report and “Item 1A. Risk Factors” in our 2012 Form 10-K for factors that could materially influence our results.
Total Company Expectations
Our strategies and actions are designed to deliver and sustain strong returns and capital generation through the acquisition and retention of franchise-enhancingcustomer relationships across our businesses. We believe that franchise-enhancing customer relationships create and sustain significant long-term value throughlow credit costs, long and loyal customer relationships and a gradual build in loan balances and revenues over time. Examples of franchise-enhancing customerrelationships include rewards customers and new partnerships in our Credit Card business, retail deposit customers in our Consumer Banking business andprimary banking relationships with commercial customers in our Commercial Banking business. We intend to grow these customer relationships by continuing toinvest in scalable infrastructure and operating platforms that are appropriate for a bank of our size and business mix so that we can meet the rising regulatory andcompliance expectations facing all banks and deliver a “brand-defining” customer experience that builds and sustains a valuable, long-term customer franchise.The ING Direct and 2012 U.S. card acquisitions strengthened and expanded our customer base and over time, we expect these acquisitions to expand and deepenour customer relationships with new products and services.
We expect average interest-earning assets to decline in 2013. We expect average loan balances for full-year 2013 to decline from average loan balances for full-year 2012, as significant run-off of certain mortgage and card loans we acquired, coupled with the sale of the Best Buy portfolio expected to be finalized in thethird quarter of 2013, is partially offset by growth in our businesses. We expect run-off and sales of approximately $19 billion in ending loan balances in 2013,primarily comprised of approximately $10 billion in run-off of mortgage loans acquired from ING Direct and CCB, approximately $2 billion in run-off of certainother credit card loans purchased in the 2012 U.S. card acquisition and approximately $7 billion from the sale of the Best Buy portfolio. We expect this decline tobe partially offset by growth in certain of our businesses, including Auto, Commercial Banking and parts of Domestic Card. However, we expect continued weakconsumer demand across our Credit Card and Auto lending businesses, as well as intensifying competition in several businesses, particularly Auto andcommercial and industrial lending.
10

Table of Contents
We continue to expect total net revenue in 2013 to be approximately $22.5 billion. We also expect non-interest expense in 2013 to total approximately $12.5billion, comprised of operating expense of approximately $11 billion and marketing expense of approximately $1.5 billion. We expect these estimates to varywithin a reasonable margin, and they do not contemplate the potential impact of non-recurring items.
We believe our actions have created a well-positioned balance sheet with strong capital and liquidity levels, and a strong capital generation trajectory. Weexceeded an assumed Basel III Tier 1 common ratio internal target of 8% in the first quarter. Our estimated Basel III capital trajectory includes the estimatedimpact of implementing the Basel II Advanced Approaches to calculate regulatory capital, which we expect will apply to us in 2016 or later. The assumed 8%Basel III Tier 1 common ratio target assumes a buffer of 50 basis points for a systemically important financial institution under applicable rules and regulationsand a further buffer of 50 basis points to cover potential volatility in both the numerator and denominator of the Tier 1 common ratio. Our actual operating levelsfor capital will vary over time depending on our outlook for near-to-medium term growth, our view of where we are in the economic cycle and our resilienceunder ongoing stress-testing processes. The assumed Basel III Tier 1 common level is estimated based on our current interpretation, expectations andunderstanding of the Basel III capital rules and other capital regulations proposed by U.S. regulators and the application of such rules to our businesses ascurrently conducted. Basel III calculations are necessarily subject to change based on, among other things, the scope and terms of the final rules and regulations,model calibration and other implementation guidance, changes in our businesses and certain actions of management, including those affecting the composition ofour balance sheet. We believe this ratio provides useful information to investors and others by measuring our progress against expected future regulatory capitalstandards.
Business Segment Expectations
Credit Card Business
As noted above, in Domestic Card, the closing of the 2012 U.S. card acquisition has impacted and will continue to affect quarterly trends in loan growth, revenuemargin and credit metrics. We anticipate that the run-off of parts of the portfolio acquired in the 2012 U.S. card acquisition, the sale of the Best Buy portfolio aswell as anticipated run-off in our installment loan portfolio will result in a decline in full-year average loan balances in 2013 from average loan balances in 2012.
Consumer Banking Business
In our Consumer Banking business, we expect the ING Direct acquisition to continue to have a significant impact on Consumer Banking loan volumes as weanticipate that run-off in the acquired home loan portfolios will more than offset growth in auto loans.
Commercial Banking Business
Our Commercial Banking business continues to grow loans, deposits, and revenues as we attract new customers and deepen relationships with existing customers.We expect our Commercial Banking business to continue to deliver steady growth. CRITICAL ACCOUNTING POLICIES AND ESTIMATES The preparation of financial statements in accordance with U.S. GAAP requires management to make a number of judgments, estimates and assumptions thataffect the reported amount of assets, liabilities, income and expenses in the consolidated financial statements. Understanding our accounting policies and theextent to which we use management judgment and estimates in applying these policies is integral to understanding our financial statements. We provide asummary of our significant accounting policies under “Note 1—Summary of Significant Accounting Policies” in our 2012 Form 10-K.
11

Table of Contents
We have identified the following accounting policies as critical because they require significant judgments and assumptions about highly complex and inherentlyuncertain matters and the use of reasonably different estimates and assumptions could have a material impact on our reported results of operations or financialcondition. These critical accounting policies govern:
• Loan loss reserves • Asset impairment • Fair value • Representation and warranty reserve • Customer rewards reserve • Income taxes
We evaluate our critical accounting estimates and judgments on an ongoing basis and update them, as necessary, based on changing conditions. We discuss belowchanges we made in the first quarter of 2013 in estimating the allowance for loan and lease losses and reserve for unfunded lending commitments for ourcommercial loan portfolio. Management has discussed our critical accounting policies and estimates with the Audit and Risk Committee of the Board ofDirectors.
Allowance for Loan and Lease Losses and Reserve for Unfunded Lending Commitments—Commercial Loans
Our commercial loan portfolio is primarily composed of larger-balance, non-homogeneous loans. We determine the allowance for loan and lease losses(“allowance”) and reserve for unfunded lending commitments for our commercial loan portfolio by evaluating loans with similar risk characteristics and applyinginternal risk ratings. We use these risk ratings to assess credit quality and derive a total loss estimate based on an estimated probability of default and loss givendefault. Factors we consider in determining risk ratings and deriving loss estimates include historical loss experience for loans with similar risk characteristics, thefinancial condition of the borrower, geography, collateral performance, and industry-specific information that management believes is relevant in determining theoccurrence of a loss event and measuring impairment. Management may also apply judgment to adjust the derived loss factors, taking into consideration bothquantitative and qualitative factors, including general economic conditions, specific industry and geographic trends, portfolio concentrations, trends in internalcredit quality indicators and current and past underwriting standards that have occurred but are not yet reflected in the historical data underlying our lossestimates.
In the first quarter of 2013, we changed our process for estimating the allowance and reserve for unfunded lending commitments for our commercial loanportfolio. First, we extended our internal historical credit loss experience period back to at least 2008 and incorporated external industry loss data over a longerhorizon to derive our loss estimates. We previously generally used the most recent three-year period of internal historical loss experience to derive our lossestimates. Second, we incorporated more borrower-specific and loan-specific risk factors into our analysis and established a statistically-based internal risk ratingsystem. Based on this statistically-based risk rating system, we now apply an estimated probability of default and loss given default for nearly each loan in ourportfolio to derive the total loss estimate for our commercial loan portfolio. These changes, which were supplemented by management judgment, resulted in a netincrease in the combined allowance and reserve for unfunded lending commitments of $37 million as of March 31, 2013 and a corresponding increase in theprovision for credit losses of $37 million in the first quarter of 2013. The gross impact of these changes resulted in a decrease in the allowance of $2 million andan increase in the reserve for unfunded lending commitments of $39 million as of March 31, 2013. We do not expect these changes to have a material futureimpact on our allowance and reserve for unfunded lending commitments for our commercial loan portfolio. See “Note 5—Allowance for Loan and Lease Losses”in this Report for additional information.
We provide additional information on our critical accounting policies and estimates under “MD&A—Critical Accounting Policies and Estimates” in our 2012Form 10-K.
12

Table of Contents
ACCOUNTING CHANGES AND DEVELOPMENTS See “Note 1—Summary of Significant Accounting Policies” for information on accounting standards adopted in 2013, as well as recently issued accountingstandards not yet required to be adopted and the expected impact of these changes in accounting standards. To the extent we believe the adoption of newaccounting standards has had or will have a material impact on our results of operations, financial condition or liquidity, we discuss the impacts in the applicablesections(s) of MD&A. CONSOLIDATED RESULTS OF OPERATIONS The section below provides a comparative discussion of our consolidated financial performance for the three months ended March 31, 2013 and 2012. Followingthis section, we provide a discussion of our business segment results. You should read this section together with our “Executive Summary and Business Outlook,”where we discuss trends and other factors that we expect will affect our future results of operations.
Net Interest Income
Net interest income represents the difference between the interest income and applicable fees earned on our interest-earning assets, which primarily include loansheld for investment and investment securities, and the interest expense on our interest-bearing liabilities, which include interest-bearing deposits, senior andsubordinated notes, securitized debt and other borrowings. We include in interest income any past due fees on loans that we deem are collectible. Our net interestmargin based on our consolidated results represents the difference between the yield on our interest-earning assets and the cost of our interest-bearing liabilities,including the impact of non-interest bearing funding. We expect net interest income and our net interest margin to fluctuate based on changes in interest rates andchanges in the amount and composition of our interest-earning assets and interest-bearing liabilities.
Table 3 below presents, for each major category of our interest-earning assets and interest-bearing liabilities, the average outstanding balances, interest incomeearned or interest expense incurred, and average yield or cost for the three months ended March 31, 2013 and 2012.
13

Table of Contents
Table 3: Average Balances, Net Interest Income and Net Interest Yield Three Months Ended March 31, 2013 2012
(Dollars in millions) AverageBalance
InterestIncome/
Expense Yield/Rate
AverageBalance
InterestIncome/
Expense Yield/Rate
Assets: Interest-earning assets:
Credit card: Domestic $ 78,985 $ 2,816 14.26% $ 54,131 $ 1,910 14.11% International 8,238 329 15.97 8,301 340 16.38
Credit card 87,223 3,145 14.42 62,432 2,250 14.41 Consumer banking 74,456 1,102 5.92 56,482 1,015 7.19 Commercial banking 38,579 377 3.91 34,245 380 4.44 Other 183 25 54.64 173 12 27.75
Total loans, including loans held for sale 200,441 4,649 9.28 153,332 3,657 9.54 Investment securities 64,798 374 2.31 50,543 298 2.36 Cash equivalents and other interest-earning assets 7,106 28 1.58 16,371 24 0.59
Total interest-earning assets $272,345 $ 5,051 7.42% $220,246 $ 3,979 7.23%
Cash and due from banks 2,642 12,540 Allowance for loan and lease losses (4,954) (4,334) Premises and equipment, net 3,682 2,898 Other assets 29,508 15,034
Total assets $303,223 $246,384
Liabilities and stockholders’ equity: Interest-bearing liabilities:
Deposits $190,612 $ 326 0.68% $151,625 $ 311 0.82% Securitized debt obligations 11,758 56 1.91 16,185 80 1.98 Senior and subordinated notes 11,984 82 2.74 10,268 88 3.43 Other borrowings 17,832 17 0.38 9,541 86 3.61
Total interest-bearing liabilities $232,186 $ 481 0.83% $187,619 $ 565 1.20%
Non-interest bearing deposits 20,943 18,634 Other liabilities 9,134 7,149
Total liabilities 262,263 213,402 Stockholders’ equity 40,960 32,982
Total liabilities and stockholders’ equity $303,223 $246,384
Net interest income/spread $ 4,570 6.59% $ 3,414 6.03%
Impact of non-interest bearing funding 0.12 0.17
Net interest margin 6.71% 6.20%
Certain prior period amounts have been reclassified to conform to the current period presentation. Past due fees included in interest income totaled approximately $480 million and $283 million in the first quarter of 2013 and 2012, respectively. Premium amortization related to the ING Direct and 2012
U.S. card acquisitions reduced net interest income by $111 million and $30 million in the first quarter of 2013 and 2012, respectively. Credit card loans consist of domestic and international credit card loans and installment loans. Consumer banking loans consist of auto, home and retail banking loans.
14
(1)
(2) (2)
(3)
(4)
(1)(2)
(3)(4)

Table of Contents
Table 4 displays the change in our net interest income between periods and the extent to which the variance is attributable to: (i) changes in the volume of ourinterest-earning assets and interest-bearing liabilities or (ii) changes in the interest rates of these assets and liabilities.
Table 4: Rate/Volume Analysis of Net Interest Income
Three Months Ended March 31,
2013 vs. 2012 Total
Variance Variance Due to
(Dollars in millions) Volume Rate Interest income: Loans:
Credit card $ 895 $ 894 $ 1 Consumer banking 87 286 (199) Commercial banking (3) 45 (48) Other 13 1 12
Total loans, including loans held for sale 992 1,226 (234)
Investment securities 76 82 (6) Cash equivalents and other interest-earning assets 4 (19) 23
Total interest income 1,072 1,289 (217)
Interest expense: Deposits 15 72 (57) Securitized debt obligations (24) (21) (3) Senior and subordinated notes (6) 13 (19) Other borrowings (69) 42 (111)
Total interest expense (84) 106 (190)
Net interest income $ 1,156 $ 1,183 $ (27)
We calculate the change in interest income and interest expense separately for each item. The change in net interest income attributable to both volume and rates is allocated based on the relative dollar
amount of each item.
Net interest income of $4.6 billion in the first quarter of 2013 increased by $1.2 billion, or 34%, from the first quarter of 2012, driven by a 24% increase inaverage interest-earning assets and an 8% (51 basis point) expansion of the net interest margin to 6.71%.
• Average Interest-Earning Assets: The increase in average interest-earning assets reflects the full-quarter impact of the addition of loans and investmentsecurities from the acquisition of ING Direct in the first quarter of 2012 and the addition of loans from the 2012 U.S. card acquisition in the second quarterof 2012. Growth in average-interest earning assets also was driven by strong commercial loan growth and continued growth in auto loans, which waspartially offset by the transfer of the Best Buy loan portfolio of approximately $7 billion to the held for sale category in the first quarter of 2013, thecontinued run-off of installment loans in our Credit Card business and home loans in our Consumer Banking business, as well as the expected run-off ofcertain other credit card loans acquired in the 2012 U.S. card acquisition.
15
(1)
(1)

Table of Contents
• Net Interest Margin: The 51 basis point improvement in our net interest margin was primarily attributable to a reduction in our cost of funds of 37 basispoints to 0.83% for the first quarter of 2013. The redemption on January 2, 2013 of $3.65 billion of our trust preferred securities, which generally carried ahigher coupon than other funding sources available to us, accounted for approximately 11 basis points of the reduction in our funding costs. The remainingreduction reflects the continued benefit from the shift in the mix of our funding to lower cost consumer and commercial banking deposits from higher costwholesale sources and a decline in deposit interest rates as a result of the continued overall low interest rate environment.
Non-Interest Income
Non-interest income primarily consists of service charges and other customer-related fees, interchange income (net of rewards expense), other non-interestincome and, in 2012, the bargain purchase gain attributable to the ING Direct acquisition. The “other” component of non-interest income includes the pre-taxprovision for mortgage representation and warranty losses related to continuing operations. Other also includes gains and losses from the sale of investmentsecurities, gains and losses on derivatives not accounted for in hedge accounting relationships and hedge ineffectiveness, which we generally do not allocate toour business segments because they relate to centralized asset/liability and market risk management activities undertaken by our Corporate Treasury group.
Table 5 displays the components of non-interest income for the first quarter of 2013 and 2012.
Table 5: Non-Interest Income Three Months Ended March 31, (Dollars in millions) 2013 2012 Service charges and other customer-related fees $ 550 $ 415 Interchange fees, net 445 328 Bargain purchase gain — 594 Net other-than-temporary impairment (“OTTI”) (25) (14) Other non-interest income:
Provision for mortgage representation and warranty losses 9 (17) Net gains from the sale of investment securities 2 11 Net fair value losses on free-standing derivatives (5) (86) Other 5 290
Other non-interest income 11 198
Total non-interest income $ 981 $ 1,521
Represents the amount by which the fair value of the net assets acquired in the ING Direct acquisition, as of the acquisition date of February 17, 2012, exceeded the consideration transferred. We recorded a total provision for mortgage representation and warranty losses of $97 million and $169 million in the first quarter of 2013 and 2012, respectively. The remaining portion of the provision for
mortgage representation and warranty losses is included, net of tax, in discontinued operations. Excludes changes in cumulative credit risk valuation adjustments related to derivatives in a gain position. Credit risk valuation adjustments for derivative assets totaled $8 million and $9 million as of
March 31, 2013 and December 31, 2012, respectively. See “Note 9—Derivative Instruments and Hedging Activities” for additional information.
Non-interest income of $981 million in the first quarter of 2013 decreased by $540 million, or 36%, from non-interest income of $1.5 billion in the first quarter of2012.
The decrease in non-interest income reflected the combined unfavorable impact of (i) the absence of the bargain purchase gain of $594 million recognized atacquisition of ING Direct in the first quarter of 2012 and (ii) the absence of income of $162 million from the sale of Visa stock shares in the first quarter of 2012.
16
(1)
(2)
(3)
(1)(2)
(3)

Table of Contents
The unfavorable impact of these items was partially offset by the favorable impact of (i) increased net interchange and other fees resulting from continued growthand market share from new account originations, due in part to the ING Direct and the 2012 U.S. card acquisitions; (ii) the absence of expense of $75 million forexpected customer refunds attributable to credit card cross-selling issues and (iii) the absence of a mark-to-market derivative loss of $78 million recognized in thefirst quarter of 2012 related to the settlement of interest-rate swaps we entered into in 2011 to partially hedge the interest rate risk of the net assets associated withthe ING Direct acquisition.
We recorded net OTTI losses of $25 million in the first quarter of 2013, compared with $14 million in the first quarter of 2012. The OTTI losses in each periodwere attributable to deterioration in the credit performance of loans underlying certain non-agency mortgage-backed securities. Our portfolio of non-agencymortgage backed securities significantly increased as a result of our acquisition of ING Direct in the first quarter of 2012, which contributed to the increase inOTTI losses in the first quarter of 2013. We provide additional information on other-than-temporary impairment recognized on our securities available for sale in“Note 3—Investment Securities.”
Provision for Credit Losses
We build our allowance for loan and lease losses and unfunded lending commitment reserves through the provision for credit losses. Our provision for creditlosses in each period is driven by charge-offs and the level of allowance for loan and lease losses that we determine is necessary to provide for probable loan andlease losses incurred that are inherent in our loan portfolio as of each balance sheet date.
We recorded a provision for credit losses of $885 million in the first quarter of 2013, compared with $573 million in the first quarter of 2012. The increase in theprovision for credit losses in the first quarter of 2013 from the first quarter of 2012 was driven by higher net charge-offs resulting from the addition of loans fromthe 2012 U.S. card acquisition, coupled with growth in auto loan balances and commercial loan originations.
We provide additional information on the provision for credit losses and changes in the allowance for loan and lease losses under the “Credit Risk Profile—Summary of Allowance for Loan and Lease Losses” and “Note 5—Allowance for Loan and Lease Losses.” For information on the allowance methodology foreach of our loan categories, see “Note 1—Summary of Significant Accounting Policies” in our 2012 Form 10-K.
Non-Interest Expense
Non-interest expense consists of ongoing operating costs, such as salaries and associate benefits, occupancy and equipment costs, professional services,communications and data processing technology expenses, and other miscellaneous expenses. Non-interest expense also includes marketing costs, merger-relatedexpense and amortization of intangibles. Table 6 displays the components of non-interest expense for the first quarter of 2013 and 2012.
17

Table of Contents
Table 6: Non-Interest Expense Three Months Ended March 31, (Dollars in millions) 2013 2012 Salaries and associate benefits $ 1,080 $ 864 Occupancy and equipment 350 270 Marketing 317 321 Professional services 307 293 Communications and data processing 210 172 Amortization of intangibles 177 62 Acquisition-related 46 86 Other non-interest expense:
Collections 129 137 Fraud losses 52 40 Bankcard, regulatory and other fee assessments 138 110 Other 222 149
Other non-interest expense 541 436
Total non-interest expense $ 3,028 $ 2,504
Includes PCCR intangible amortization of $116 million and $4 million in the first quarter of 2013 and 2012, respectively, the substantial majority of which is attributable to the 2012 U.S. card acquisition.
Also includes core deposit intangible amortization of $44 million and $46 million in the first quarter of 2013 and 2012, respectively.
Non-interest expense of $3.0 billion in the first quarter of 2013 increased by $524 million, or 21%, from the first quarter of 2012. The increase reflected higheroperating expenses, increased salaries and associate benefits and infrastructure costs attributable to acquired businesses, amortization of intangibles resulting fromthe ING Direct and 2012 U.S. card acquisitions and expenses related to the growth in our auto loan portfolio, which was partially offset by a reduction inacquisition-related costs.
Income Taxes
We recorded an income tax provision on income from continuing operations of $494 million (30.2% effective income tax rate) in the first quarter of 2013,compared with an income tax provision of $353 million (19.0% effective income tax rate) in the first quarter of 2012. Our effective tax rate varies betweenperiods due, in part, to fluctuations in our pre-tax earnings, which affects the relative tax benefit of tax-exempt income, tax credits and other permanent tax items.
The increase in our effective tax rate in the first quarter of 2013 from the first quarter of 2012 was primarily attributable to the absence of the non-taxable bargainpurchase gain of $594 million recorded in the first quarter of 2012 related to the ING Direct acquisition, which substantially reduced our effective tax rate in firstquarter of 2012.
Our effective income tax rate excluding the impact of the non-taxable bargain purchase gain was 30.2% and 28.1% in the first quarter of 2013 and 2012,respectively. The increase in the effective tax rate in the first quarter of 2013 was primarily due to higher pre-tax earnings in the first quarter of 2013 comparedwith the first quarter of 2012, which diluted the relative tax benefit from tax credits and tax-exempt income.
We provide additional information on items affecting our income taxes and effective tax rate in our 2012 Form 10-K under “Note 18—Income Taxes.”
18
(1)
(1)

Table of Contents
Loss from Discontinued Operations, Net of Tax
Loss from discontinued operations reflects ongoing costs, which primarily consist of mortgage loan repurchase representation and warranty charges related to themortgage origination operations of GreenPoint’s wholesale mortgage banking unit, which we closed in 2007.
We recorded a loss from discontinued operations, net of tax, of $78 million and $102 million in the first quarter of 2013 and 2012, respectively. The variance inthe loss from discontinued operations between the first quarter of 2013 and the first quarter of 2012 is attributable to the provision for mortgage representationand warranty losses. We recorded a total pre-tax provision for mortgage representation and warranty losses of $97 million in the first quarter of 2013, comparedwith a total pre-tax provision of $169 million in the first quarter of 2012. The portion of these amounts included in loss from discontinued operations totaled $107million ($67 million net of tax) and $153 million ($97 million, net of tax) in the first quarter of 2013 and 2012, respectively.
We provide additional information on the provision for mortgage representation and warranty losses and the related reserve for potential representation andwarranty claims in “Consolidated Balance Sheet Analysis—Potential Mortgage Representation and Warranty Liabilities” and “Note 14—Commitments,Contingencies and Guarantees.” BUSINESS SEGMENT FINANCIAL PERFORMANCE The results of our individual businesses, which we report on a continuing operations basis, reflect the manner in which management evaluates performance andmakes decisions about funding our operations and allocating resources. Our business segment results are intended to reflect each segment as if it were a stand-alone business. We use an internal management accounting and reporting process to derive our business segment results. Our internal management accountingand reporting process employs various allocation methodologies, including funds transfer pricing, to assign certain balance sheet assets, deposits and otherliabilities and their related revenue and expenses directly or indirectly attributable to each business segment. Total interest income and net fees are directlyattributable to the segment in which they are reported. The net interest income of each segment reflects the results of our funds transfer pricing process, which isprimarily based on a matched maturity method that takes into consideration market rates. Our funds transfer pricing process provides a funds credit for sources offunds, such as deposits generated by our Consumer Banking and Commercial Banking businesses, and a funds charge for the use of funds by each segment. Theallocation process is unique to each business segment and acquired businesses. We provide additional information on the allocation methodologies used to deriveour business segment results in “Note 20—Business Segments” in our 2012 Form 10-K.
We refer to the business segment results derived from our internal management accounting and reporting process as our “managed” presentation, which differs insome cases from our reported results prepared based on U.S. GAAP. There is no comprehensive, authoritative body of guidance for management accountingequivalent to U.S. GAAP; therefore, the managed basis presentation of our business segment results may not be comparable to similar information provided byother financial service companies. In addition, our individual business segment results should not be used as a substitute for comparable results determined inaccordance with U.S. GAAP. See “Note 13—Business Segments” of this Report for a reconciliation of our total business segment results to our reportedconsolidated results.
Below we summarize our business segment results for the first quarter of 2013 and 2012 and provide a comparative discussion of these results. We also discusschanges in our financial condition and credit performance statistics as of March 31, 2013, compared with December 31, 2012. Information on the outlook for eachof our business segments is presented above under “Executive Summary and Business Outlook.”
19

Table of Contents
Credit Card Business
Our Credit Card business generated net income from continuing operations of $686 million in the first quarter of 2013, an increase of $120 million, or 21%, fromnet income from continuing operations of $566 million in the first quarter of 2012. The primary sources of revenue for our Credit Card business are interestincome and non-interest income from customers and interchange fees. Expenses primarily consist of ongoing operating costs, such as salaries and associatebenefits, occupancy and equipment, professional services, communications and data processing technology expenses, as well as marketing expenses.
On February 1, 2013, we transferred the Best Buy loan portfolio, which had loan balances of approximately $7 billion as of the date of the transfer, to held forsale from held for investment. While the transfer of this portfolio reduced period-end loans held for investment for Domestic Card, the accounting for held forsale loans had a favorable impact on Domestic Card total net revenue and the provision for credit losses, as charge-offs of finance charges, fees and principal arereflected in the carrying value of loans classified as held for sale.
Table 7 summarizes the financial results of our Credit Card business, which is comprised of Domestic Card, including installment loans, and International Card,and displays selected key metrics for the periods indicated.
Table 7: Credit Card Business Results Three Months Ended March 31, (Dollars in millions) 2013 2012 Change Selected income statement data: Net interest income $ 2,830 $ 1,992 42% Non-interest income 821 598 37
Total net revenue 3,651 2,590 41 Provision for credit losses 743 458 62 Non-interest expense 1,848 1,268 46
Income from continuing operations before income taxes 1,060 864 23 Income tax provision 374 298 26
Income from continuing operations, net of tax $ 686 $ 566 21%
Selected performance metrics: Average loans held for investment $ 82,952 $ 62,432 33% Average yield on loans held for investment 15.16% 14.41% 75bps Total net revenue margin 17.61 16.59 102 Net charge-offs $ 922 $ 645 43% Net charge-off rate 4.45% 4.14% 31bps PCCR intangible amortization $ 116 $ 4 **% Purchase volume 45,098 34,498 31
(Dollars in millions) March 31,
2013 December 31,
2012 Change Selected period-end data: Loans held for investment $ 78,397 $ 91,755 (15)%30+ days performing delinquency rate 3.44% 3.61% (17)bps 30+ days delinquency rate 3.53 3.69 (16) 30+ days delinquency rate (excluding acquired loans) 3.54 3.70 (16) Nonperforming loan rate 0.12 0.11 1 Allowance for loan and lease losses $ 3,494 $ 3,979 (12)% Allowance coverage ratio 4.46% 4.34% 12bps
20
(1)
(2)
(3)
(4)
(5)
(6)
(7)
(3)
(8)
(4)
(9)
(10)
(11)
(12)
(13)

Table of Contents
** Change is less than one percent or not meaningful.
Includes premium amortization related to the 2012 U.S. card acquisition of $43 million in the first quarter of 2013. We recognize billed finance charges and fee income on open-ended loans in accordance with the contractual provisions of the credit arrangements and
estimate the uncollectible amount on a quarterly basis. The estimated uncollectible amount of billed finance charges and fees is reflected as a reduction inrevenue and is not included in our net charge-offs. Total net revenue was reduced by $265 million and $123 million in the first quarter of 2013 and 2012,respectively, for the estimated uncollectible amount of billed finance charges and fees.
Includes PCCR intangible amortization expense of $116 million and $4 million in the first quarter of 2013 and 2012, respectively, of which $113 million inthe first quarter of 2013 is attributable to the PCCR intangible asset of $2.2 billion recorded in connection with the closing on May 1, 2012 of the 2012 U.S.card acquisition.
Credit card period-end loans held for investment and average loans held for investment include accrued finance charges and fees, net of the estimateduncollectible amount.
Calculated by dividing annualized interest income for the period by average loans held for investment during the period for the specified loan category. Thetransfer of the Best Buy loan portfolio to held for sale resulted in an increase in the average yield for Total Credit Card of 97 basis points in the first quarterof 2013.
Calculated by dividing annualized total net revenue for the period by average loans held for investment during the period for the specified loan category. Thetransfer of the Best Buy portfolio to held for sale resulted in an increase in the net revenue margin for Total Card of 112 basis points in the first quarter of2013.
Calculated by dividing annualized net charge-offs for the period by average loans held for investment during the period for the specified loan category. Consists of purchase transactions for the period, net of returns. Excludes cash advance transactions. Calculated by loan category by dividing 30+ day performing delinquent loans as of the end of the period by period-end loans held for investment for the
specified loan category. Calculated by loan category by dividing 30+ day delinquent loans as of the end of the period by period-end loans held for investment for the specified loan
category. Calculation of ratio adjusted to exclude from the denominator acquired loans accounted for subsequent to acquisition based on expected cash flows to be
collected. See “Summary of Selected Financial Data,” “Credit Risk Profile” and “Note 4—Loans—Credit Quality” for additional information on the impactof acquired loans on our credit quality metrics.
Calculated by loan category by dividing nonperforming loans as of the end of the period by period-end loans held for investment for the specified loancategory. Nonperforming credit card loans generally include international card loans that are 90 or 120 days delinquent.
Calculated by dividing the allowance for loan and lease losses as of the end of the period by period-end loans held for investment.
Key factors affecting the results of our Credit Card business for the first quarter of 2013, compared with the first quarter of 2012, and changes in financialcondition and credit performance between March 31, 2013 and December 31, 2012 include the following:
• Net Interest Income: Net interest income increased by $838 million, or 42%, in the first quarter of 2013 to $2.8 billion, attributable to the substantialincrease in average loans held for investment resulting from the 2012 U.S. card acquisition in the second quarter of 2012 and higher average yields on loansheld for investment. The increase in average loan yields was largely due to the transfer of the Best Buy loan portfolio, which generally had lower yieldsrelative to our overall loan portfolio, to the held for sale category in the first quarter of 2013.
• Non-Interest Income: Non-interest income increased by $223 million, or 37%, in the first quarter of 2013 to $821 million. The increase was primarilydriven by higher net interchange fees generated from purchase volume growth and customer-related fees resulting from the addition of customer accountsassociated with the 2012 U.S. card acquisition. Purchase volume increased by $10.6 billion, or 31%, in the first quarter of 2013. Excluding purchasevolume attributable to loans from the 2012 U.S. card acquisition, purchase volume increased by approximately 5% in the first quarter of 2013.
• Provision for Credit Losses: The provision for credit losses related to our Credit Card business increased to $743 million in the first quarter of 2013, from
$458 million in the first quarter of 2012. The increase in the provision was primarily driven by higher net charge-offs resulting from the addition of loansfrom the 2012 U.S. card acquisition, which more than offset the impact of an improving credit outlook . Although higher
21
(1)
(2)
(3)
(4)
(5)
(6)
(7)
(8)
(9)
(10)
(11)
(12)
(13)

Table of Contents
net charge-offs drove an increase in the provision for credit losses, we reduced the allowance related to our Credit Card business by $485 million in the firstquarter of 2013 to $3.5 billion as of March 31, 2013. The reduction was attributable to the transfer of the Best Buy loan portfolio to held for sale, as well asan allowance release of $196 million. In comparison, our Credit Card business recorded an allowance release of $176 million in the first quarter of 2012.
• Non-Interest Expense: Non-interest expense increased by $580 million, or 46%, in the first quarter of 2013 to $1.8 billion. The increase was largely due to
higher operating expenses resulting from the 2012 U.S. card acquisition and the amortization of intangibles and other assets associated with the 2012 U.S.card acquisition, including PCCR intangible amortization expense of $113 million in the first quarter of 2013.
• Loans Held for Investment: Period-end loans held for investment in our Credit Card business decreased by $13.4 billion, or 15%, in the first quarter of2013, to $78.4 billion as of March 31, 2013. The decrease was due in part to the transfer of the Best Buy loan portfolio to the held for sale category.Excluding the transfer of the Best Buy loan portfolio of approximately $7 billion to held for sale, period-end loans held for investment decreased by $6.4billion, or 7%, due in part to typical seasonally lower purchase volumes and higher pay downs in the first quarter of the year, the continued run-off of ourinstallment loan portfolio, as well as the expected run-off of certain other credit card loans acquired in the 2012 U.S. card acquisition.
• Charge-off and Delinquency Statistics: Our reported net charge-off rate increased to 4.45% in the first quarter of 2013, from 4.14% in the first quarter of
2012. The increase was primarily driven by higher net charge-offs resulting from the addition of loans from the 2012 U.S. card acquisition. The 30+ daydelinquency rate decreased to 3.53% as of March 31, 2013, from 3.69% as of December 31, 2012.
Domestic Card Business
Domestic Card generated net income from continuing operations of $644 million in the first quarter of 2013, an increase of $129 million, or 25%, from netincome from continuing operations of $515 million in the first quarter of 2012. Domestic Card accounted for 90% of total net revenues for our Credit Cardbusiness in the first quarter of 2013, compared with 85% in the first quarter of 2012. Income attributable to Domestic Card represented 94% of income for ourCredit Card business in the first quarter of 2013, compared with 91% in the first quarter of 2012.
22

Table of Contents
Table 7.1 summarizes the financial results for Domestic Card and displays selected key metrics for the periods indicated.
Table 7.1: Domestic Card Business Results Three Months Ended March 31, (Dollars in millions) 2013 2012 Change Selected income statement data: Net interest income $ 2,556 $ 1,713 49% Non-interest income 724 497 46
Total net revenue 3,280 2,210 48 Provision for credit losses 647 361 79 Non-interest expense 1,633 1,052 55
Income from continuing operations before income taxes 1,000 797 25 Income tax provision 356 282 26
Income from continuing operations, net of tax $ 644 $ 515 25%
Selected performance metrics: Average loans held for investment $ 74,714 $ 54,131 38% Average yield on loans held for investment 15.07% 14.11% 96bps Total net revenue margin 17.56 16.33 123 Net charge-offs $ 827 $ 531 56% Net charge-off rate 4.43% 3.92% 51bps PCCR intangible amortization $ 116 $ 4 **% Purchase volume 41,831 31,417 33
(Dollars in millions) March 31,
2013 December 31,
2012 Change Selected period-end data: Loans held for investment $ 70,361 $ 83,141 (15)%30+ days delinquency rate 3.37% 3.61% (24)bps 30+ days delinquency rate (excluding acquired loans) 3.38 3.62 (24) Allowance for loan and lease losses $ 3,057 $ 3,526 (13)% ** Change is less than one percent or not meaningful.
Includes premium amortization related to the 2012 U.S. card acquisition of $43 million in the first quarter of 2013.Includes amortization expense of $113 million in the first quarter of 2013 related to the PCCR intangible asset of $2.2 billion recorded in connection with theclosing on May 1, 2012 of the 2012 U.S. card acquisition.
Credit card period-end loans held for investment and average loans held for investment include accrued finance charges and fees, net of the estimateduncollectible amount.
Calculated by dividing annualized interest income for the period by average loans held for investment during the period for the specified loan category. Thetransfer of the Best Buy loan portfolio to held for sale resulted in an increase in the average yield for Domestic Card of 107 basis points in the first quarter of2013.
Calculated by dividing annualized total net revenue for the period by average loans held for investment during the period for the specified loan category. Thetransfer of the Best Buy portfolio to held for sale resulted in an increase in the net revenue margin for Domestic Card of 123 basis points in the first quarterof 2013.
Calculated by dividing annualized net charge-offs for the period by average loans held for investment during the period for the specified loan category.Consists of credit card purchase transactions, net of returns, for the period for both loans classified as held for investment and loans classified as held forsale. Excludes cash advance transactions.
Calculated by loan category by dividing 30+ day delinquent loans as of the end of the period by period-end loans held for investment for the specified loancategory.
Calculation of ratio adjusted to exclude from the denominator acquired loans accounted for subsequent to acquisition based on expected cash flows to becollected. See “Summary of Selected Financial Data,” “Credit Risk Profile” and “Note 4—Loans—Credit Quality” for additional information on the impactof acquired loans on our credit quality metrics.
23
(1)
(2)
(3)
(4)
(5)
(6)
(2)
(7)
(3)
(8)
(9)
(1)
(2)
(3)
(4)
(5)
(6)
(7)
(8)
(9)

Table of Contents
Because our Domestic Card business accounts for the substantial majority of our Credit Card business, the key factors driving the results for this division aresimilar to the key factors affecting our total Credit Card business. The increase in Domestic Card net income from continuing operations in the first quarter of2013, compared with the first quarter of 2012 reflected the impact of the following items: (i) an increase in net interest income and non-interest income, primarilyattributable to the substantial increase in average loans held for investment, higher average loan yields and increased fees resulting from the 2012 U.S. cardacquisition; (ii) an increase in the provision for credit losses, driven by higher net charge-offs resulting from the addition of loans from the 2012 U.S. cardacquisition; and (iii) an increase in non-interest expense, also largely due to operating expenses related to the 2012 U.S. card acquisition as well as amortization ofintangibles and other assets associated with the 2012 U.S. card acquisition.
International Card Business
International Card generated net income from continuing operations of $42 million in the first quarter of 2013, a decrease of $9 million, or 18%, from net incomefrom continuing operations of $51 million in the first quarter of 2012. International Card accounted for 10% of total net revenues for our Credit Card business inthe first quarter of 2013, compared with 15% in the first quarter of 2012. Income attributable to International Card represented 6% of income for our Credit Cardbusiness in the first quarter of 2013, compared with 9% in the first quarter of 2012. Table 7.2 summarizes the financial results for International Card and displaysselected key metrics for the periods indicated.
Table 7.2: International Card Business Results Three Months Ended March 31, (Dollars in millions) 2013 2012 Change Selected income statement data: Net interest income $ 274 $ 279 (2)%Non-interest income 97 101 (4)
Total net revenue 371 380 (2) Provision for credit losses 96 97 (1) Non-interest expense 215 216 **
Income from continuing operations before income taxes 60 67 (10) Income tax provision 18 16 13
Income from continuing operations, net of tax $ 42 $ 51 (18)%
Selected performance metrics: Average loans held for investment $ 8,238 $ 8,301 (1)%Average yield on loans held for investment 15.97% 16.38% (41)bps Total net revenue margin 18.01 18.31 (30) Net charge-offs $ 95 $ 114 (17)%Net charge-off rate 4.59% 5.52% (93)bps Purchase volume $ 3,267 $ 3,081 6%
(Dollars in millions) March 31,
2013 December 31,
2012 Change Selected period-end data: Loans held for investment $ 8,036 $ 8,614 (7)%30+ days performing delinquency rate 4.04% 3.58% 46bps 30+ days delinquency rate 4.93 4.49 44 Nonperforming loan rate 1.13 1.16 (3) Allowance for loan and lease losses $ 437 $ 453 (4)% ** Change is less than one percent or not meaningful.
24
(1)
(2)
(3)
(4)
(5)
(1)
(6)
(7)
(8)

Table of Contents
Credit card period-end loans held for investment and average loans held for investment include accrued finance charges and fees, net of the estimateduncollectible amount.
Calculated by dividing annualized interest income for the period by average loans held for investment during the period for the specified loan category. Calculated by dividing annualized total net revenue for the period by average loans held for investment during the period for the specified loan category. Calculated by dividing annualized net charge-offs for the period by average loans held for investment during the period for the specified loan category. Consists of purchase transactions for the period, net of returns. Excludes cash advance transactions.
Calculated by loan category by dividing 30+ day performing delinquent loans as of the end of the period by period-end loans held for investment for thespecified loan category.Calculated by loan category by dividing 30+ day delinquent loans as of the end of the period by period-end loans held for investment for the specified loancategory.Calculated by loan category by dividing nonperforming loans as of the end of the period by period-end loans held for investment for the specified loancategory. Nonperforming credit card loans generally include international card loans that are 90 or 120 days delinquent.
The results for International Card in the first quarter of 2013 were comparable to the first quarter of 2012, as average loan balances, yields and expenses remainedrelatively stable.
Consumer Banking Business
Our Consumer Banking business generated net income from continuing operations of $383 million in the first quarter of 2013, an increase of $159 million, or71%, from net income from continuing operations of $224 million in the first quarter of 2012. The primary sources of revenue for our Consumer Bankingbusiness are net interest income from loans and deposits and non-interest income from customer fees. Expenses primarily consist of ongoing operating costs, suchas salaries and associate benefits, occupancy and equipment, professional services and communications and data processing technology expenses, as well asmarketing expenditures.
On February 17, 2012, we acquired ING Direct, which resulted in the addition of loans with carrying value of $40.4 billion and deposits of $84.4 billion atacquisition. The substantial majority of the lending and retail deposit businesses acquired are reported in our Consumer Banking business; however, the results ofour Consumer Banking business for the first quarter of 2012 reflect only a partial-quarter impact from the operations of ING Direct.
25
(1)
(2)
(3)
(4)
(5)
(6)
(7)
(8)

Table of Contents
Table 8 summarizes the financial results of our Consumer Banking business and displays selected key metrics for the periods indicated.
Table 8: Consumer Banking Business Results Three Months Ended March 31, (Dollars in millions) 2013 2012 Change Selected income statement data: Net interest income $ 1,478 $ 1,288 15%Non-interest income 181 176 3
Total net revenue 1,659 1,464 13 Provision for credit losses 175 174 1 Non-interest expense 890 943 (6)
Income from continuing operations before income taxes 594 347 71 Income tax provision 211 123 72
Income from continuing operations, net of tax $ 383 $ 224 71%
Selected performance metrics: Average loans held for investment:
Auto $ 27,477 $ 22,582 22%Home loan 43,023 29,502 46 Retail banking 3,786 4,179 (9)
Total consumer banking $ 74,286 $ 56,263 32%
Average yield on loans held for investment 5.93% 7.20% (127)bps Average deposits $171,089 $ 129,915 32%Average deposit interest rate 0.64% 0.73% (9)bps Core deposit intangible amortization $ 37 $ 37 **%Net charge-offs 143 109 (31)Net charge-off rate 0.78% 0.77% 1bps Net charge-off rate (excluding acquired loans) 1.47 1.29 18 Automobile loan originations $ 3,789 $ 4,270 (11)%
(Dollars in millions) March 31,
2013 December 31,
2012 Change Selected period-end data: Loans held for investment:
Auto $ 27,940 $ 27,123 3%Home loan 41,931 44,100 (5) Retail banking 3,742 3,904 (4)
Total consumer banking $ 73,613 $ 75,127 (2)%
30+ days performing delinquency rate 2.24% 2.65% (41)bps 30+ days performing delinquency rate (excluding acquired loans) 4.20 5.14 (94)30+ days delinquency rate 2.81 3.34 (53)30+ days delinquency rate (excluding acquired loans) 5.27 6.49 (122)Nonperforming loans rate 0.74 0.85 (11)Nonperforming loans rate (excluding acquired loans) 1.39 1.66 (27)Nonperforming asset rate 0.80 0.91 (11)Nonperforming asset rate (excluding acquired loans) 1.49 1.76 (27)Allowance for loan and lease losses $ 743 $ 711 5% Allowance coverage ratio 1.01% 0.95% 6bps Deposits $172,605 $ 172,396 **%Loans serviced for others 14,869 15,333 (3)
26
(1)
(2)
(3)
(4)
(1)
(5)
(4)
(6)
(4)
(7)
(4)
(8)
(4)
(9)

Table of Contents
** Change is less than one percent or not meaningful.
Loans held for investment includes loans acquired in the ING Direct and Chevy Chase Bank acquisitions. The carrying value of consumer banking acquired loans accounted for subsequent to acquisitionbased on expected cash flows to be collected was $34.4 billion and $36.5 billion as of March 31, 2013 and December 31, 2012, respectively. The average balance of consumer banking loans held forinvestment, excluding the carrying value of acquired loans, was $39.2 billion and $33.7 billion in the first quarter of 2013 and 2012, respectively.
Calculated by dividing interest income for the period by average loans held for investment during the period for the specified loan category.Calculated by dividing annualized net charge-offs for the period by average loans held for investment during the period for the specified loan category.
Calculation of ratio adjusted to exclude from the denominator acquired loans accounted for subsequent to acquisition based on expected cash flows to be collected. See “Credit Risk Profile” and “Note 4—Loans—Credit Quality” for additional information on the impact of acquired loans on our credit quality metrics.
Calculated by loan category by dividing 30+ days performing delinquent loans as of the end of the period by period-end loans held for investment for the specified loan category.Calculated by loan category by dividing 30+ days delinquent loans as of the end of the period by period-end loans held for investment for the specified loan category.
Calculated by loan category by dividing nonperforming loans as of the end of the period by period-end loans held for investment. Calculated by loan category by dividing nonperforming assets as of the end of the period by period-end loans held for investment, REO, and other foreclosed assets for the specified loan category.
Calculated by dividing the allowance for loan and lease losses as of the end of the period by period-end loans held for investment.
Key factors affecting the results of our Consumer Banking business for the first quarter of 2013, compared with the first quarter of 2012, and changes in financialcondition and credit performance between March 31, 2013 and December 31, 2012 include the following:
• Net Interest Income: Net interest income increased by $190 million, or 15%, in the first quarter of 2013 to $1.5 billion. The increase was primarilyattributable to a significant increase in average loans held for investment due to the addition of home loans from the ING Direct acquisition and higher autoloan originations over the past twelve months, which was partially offset by the continued expected run-off of acquired home loans. The favorable impactof the increase in average loan balances more than offset the decrease in average loans yields due to the shift in the composition of our consumer loanportfolio from the addition of the acquired ING Direct loans, which generally had lower yields.
• Non-Interest Income: Non-interest income increased slightly by $5 million, or 3%, in the first quarter 2013 to $181 million.
• Provision for Credit Losses: The provision for credit losses related to our Consumer Banking business of $175 million in the first quarter of 2013, wascomparable to the provision of $174 million in the first quarter of 2012, reflecting modestly higher auto loan charge-offs attributable to the continued highvolume of auto loan originations, which was offset by an allowance release for our home loan portfolio. As discussed above under “Summary of SelectedFinancial Data,” the substantial majority of the ING Direct home loan portfolio is accounted for based on estimated cash flows expected to be collectedover the life of the loans. Because the credit mark established at acquisition for these loans takes into consideration future credit losses expected to beincurred, there are no charge-offs or an allowance associated with these loans unless the estimated cash flows expected to be collected decrease subsequentto acquisition.
• Non-Interest Expense: Non-interest expense decreased by $53 million, or 6%, in the first quarter of 2013 to $890 million. The decrease was largely due to
the absence of ING Direct acquisition-related costs incurred in the first quarter of 2012, which was partially offset by increased expenses related to thegrowth in our auto loan portfolio.
• Loans Held for Investment: Period-end loans held for investment in our Consumer Banking business declined by $1.5 billion, or 2%, in the first quarter of
2013, to $73.6 billion as of March 31, 2013, due to the continued expected run-off of acquired home loans, which was partially offset by higher period-endauto balances due to the continued high volume of auto loan originations.
27
(1)
(2)(3)(4)
(5)(6)(7)(8)(9)

Table of Contents
• Deposits: Period-end deposits in our Consumer Banking business of $172.6 billion as of March 31, 2013, remained relatively stable compared with period-
end deposits of $172.4 billion as of December 31, 2012.
• Charge-off and Delinquency Statistics: The reported net charge-off rate of 0.78% in the first quarter of 2013 was relatively unchanged from 0.77% in thefirst quarter of 2012. However, the 30+ day delinquency rate decreased to 2.81% as of March 31, 2013, from 3.34% as of December 31, 2012. As discussedabove under “Summary of Selected Financial Data,” the addition of the ING Direct home loan portfolio affects our reported credit metrics, as the creditmark established at acquisition for these loans takes into consideration future credit losses expected to be incurred. Accordingly, there are no charge-offs oran allowance associated with these loans unless the estimated cash flows expected to be collected decrease subsequent to acquisition. In addition, theseloans are not classified as delinquent or nonperforming even though the customer may be contractually past due because we expect that we will fully collectthe carrying value of these loans. The overall improvement in delinquency rates reflects improved credit performance in our legacy consumer loanportfolios.
Commercial Banking Business
Our Commercial Banking business generated net income from continuing operations of $203 million in the first quarter of 2013, a decrease of $7 million, or 3%,from net income from continuing operations of $210 million in the first quarter of 2012. The primary sources of revenue for our Commercial Banking businessare net interest income from loans and deposits and non-interest income from customer fees. Because we have some affordable housing tax-related investmentsthat generate tax-exempt income or tax credits, we make certain reclassifications to our Commercial Banking business results to present revenues on a taxable-equivalent basis. Expenses primarily consist of ongoing operating costs, such as salaries and associate benefits, occupancy and equipment, professional servicesand communications and data processing technology expenses, as well as marketing expenditures.
28

Table of Contents
Table 9 summarizes the financial results of our Commercial Banking business and displays selected key metrics for the periods indicated.
Table 9: Commercial Banking Business Results Three Months Ended March 31, (Dollars in millions) 2013 2012 Change Selected income statement data: Net interest income $ 454 $ 431 5%Non-interest income 84 85 (1)
Total net revenue 538 516 4 Provision for credit losses (35) (69) (49) Non-interest expense 258 261 (1)
Income from continuing operations before income taxes 315 324 (3) Income tax provision 112 114 (2)
Income from continuing operations, net of tax $ 203 $ 210 (3)%
Selected performance metrics: Average loans held for investment:
Commercial and multifamily real estate $ 17,454 $ 15,514 13%Commercial and industrial 19,949 17,038 17
Total commercial lending 37,403 32,552 15 Small-ticket commercial real estate 1,173 1,480 (21)
Total commercial banking $ 38,576 $ 34,032 13%
Average yield on loans held for investment 3.91% 4.47% (56)bps Average deposits $ 30,335 $ 27,569 10%Average deposit interest rate 0.28% 0.37% (9)bps Core deposit intangible amortization $ 7 $ 9 (22)%Net charge-offs 7 16 (56) Net charge-off rate 0.07% 0.19% (12)bps Net charge-off rate (excluding acquired loans) 0.07 0.19 (12)
(Dollars in millions) March 31,
2013 December 31,
2012 Change Selected period-end data: Loans held for investment:
Commercial and multifamily real estate $ 17,878 $ 17,732 1%Commercial and industrial 20,127 19,892 1
Total commercial lending 38,005 37,624 1 Small-ticket commercial real estate 1,145 1,196 (4)
Total commercial banking $ 39,150 $ 38,820 1%
Nonperforming loans rate 0.71% 0.73% (2)bps Nonperforming loans rate (excluding acquired loans) 0.71 0.73 (2)Nonperforming asset rate 0.74 0.77 (3)Nonperforming asset rate (excluding acquired loans) 0.75 0.78 (3)Allowance for loan and lease losses $ 342 $ 433 (21)% Allowance coverage ratio 0.87% 1.12% (25)bps Deposits $ 30,275 $ 29,866 1% ** Change is less than one percent or not meaningful.
29
(1)
(2)
(3)
(3)
(5)
(4)
(6)
(4)
(7)

Table of Contents
Loans held for investment includes loans acquired in the ING Direct and Chevy Chase Bank acquisitions. The carrying value of commercial banking acquired loans accounted for subsequent to acquisitionbased on expected cash flows to be collected was $323 million and $359 million as of March 31, 2013 and December 31, 2012, respectively. The average balance of commercial banking loans held forinvestment, excluding the carrying value of acquired loans, was $38.2 billion and $33.5 billion in the first quarter of 2013 and 2012, respectively.Calculated by dividing annualized interest income for the period by average loans held for investment during the period for the specified loan category.
Calculated by dividing annualized net charge-offs for the period by average loans held for investment during the period for the specified loan category. Calculation of ratio adjusted to exclude from the denominator acquired loans accounted for subsequent to acquisition based on expected cash flows to be collected. See “Summary of Selected Financial
Data,” “Credit Risk Profile” and “Note 4—Loans—Credit Quality” for additional information on the impact of acquired loans on our credit quality metrics. Calculated by loan category by dividing nonperforming loans as of the end of the period by period-end loans held for investment for the specified loan category. Nonperforming loans generally include
loans that have been placed on nonaccrual status and certain restructured loans whose contractual terms have been restructured in a manner that grants a concession to a borrower experiencing financialdifficulty.
Calculated by loan category by dividing nonperforming assets as of the end of the period by period-end loans held for investment, REO, and other foreclosed assets for the specified loan category.Calculated by dividing the allowance for loan and lease losses as of the end of the period by period-end loans held for investment.
Key factors affecting the results of our Commercial Banking business for the first quarter of 2013, compared with the first quarter of 2012, and changes infinancial condition and credit performance between March 31, 2013 and December 31, 2012 include the following:
• Net Interest Income: Net interest income increased by $23 million, or 5%, in the first quarter of 2013 to $454 million. The increase was primarily driven by
higher deposit balances and growth in commercial real estate and commercial and industrial loans.
• Non-Interest Income: Non-interest income of $84 million in the first quarter of 2013 was relatively flat compared with non-interest income of $85 million in
the first quarter of 2012, as lower revenues from investment banking activities were offset by increases in other customer fees.
• Provision for Credit Losses: The Commercial Banking business recorded a negative provision for credit losses of $35 million in the first quarter of 2013,compared with a negative provision of $69 million in the first quarter of 2012. The negative provision for credit losses in the first quarter of 2013 reflectedthe continued improvement in the underlying credit performance of our commercial loan portfolio and the impact of a change in the process for estimatingthe combined allowance for loan losses and reserve for unfunded lending commitments for our commercial loan portfolio. This change in process resultedin a net increase in the combined allowance and reserve for unfunded lending commitments as of March 31, 2013. See “Critical Accounting Policies andEstimates—Allowance for Loan Losses and Reserve for Unfunded Lending Commitments—Commercial Loans” above for additional information on thischange. The negative provision of $69 million in the first quarter of 2012 reflected improvement in underlying credit performance trends, which resulted ina release in the combined allowance and reserve of $85 million in the first quarter of 2012.
• Non-Interest Expense: Non-interest expense of $258 million in the first quarter of 2013 remained relatively comparable to non-interest expense of $261
million in the first quarter of 2012.
• Loans Held for Investment: Period-end loans held for investment in our Commercial Banking business increased by $330 million, or 1%, in the first quarter
of 2013, to $39.2 billion as of March 31, 2013. The increase was driven by stronger loan originations in the commercial and industrial and commercial realestate businesses, which was partially offset by the continued run-off of the small-ticket commercial real estate loan portfolio.
• Deposits: Period-end deposits in the Commercial Banking business increased by $409 million, or 1%, to $30.3 billion as of March 31, 2013, from $29.9
billion as of December 31, 2012, driven by our strategy to strengthen existing relationships and increase liquidity from commercial customers.
30
(1)
(2)(3)(4)
(5)
(6)(7)

Table of Contents
• Charge-off Statistics: The net charge-off rate decreased to 0.07% in the first quarter of 2013, from 0.19% in the first quarter of 2012. The nonperforming
loan rate decreased to 0.71% as of March 31, 2013, from 0.73% as of December 31, 2012. The improvement in the credit metrics in our CommercialBanking business reflected a continued improvement in credit trends and strengthening of underlying collateral values, resulting in lower loss severities.
“Other” Category
Net loss from continuing operations recorded in Other was $128 million in the first quarter of 2013, compared with net income from continuing operations of$505 million in the first quarter of 2012. Other includes the residual impact of the allocation of our centralized Corporate Treasury group activities, such asmanagement of our corporate investment portfolio and asset/liability management, to our business segments. Accordingly, net gains and losses on our investmentsecurities portfolio and certain trading activities are included in the Other category. The Other category also includes foreign exchange-rate fluctuations related tothe revaluation of foreign currency-denominated investments; certain gains (losses) on the sale and securitization of loans; unallocated corporate expenses that donot directly support the operations of the business segments or for which the business segments are not considered financially accountable in evaluating theirperformance, such as acquisition and restructuring charges; provisions for representation and warranty reserves related to continuing operations; certain materialitems that are non-recurring in nature; and offsets related to certain line-item reclassifications.
Table 10: “Other” Results Three Months Ended March 31, (Dollars in millions) 2013 2012 Change Selected income statement data: Net interest income (expense) $ (192) $ (297) (35)%Non-interest income (105) 662 (116)
Total net revenue (297) 365 (181) Provision for credit losses 2 10 (80) Non-interest expense 32 32 **
Income from continuing operations before income taxes (331) 323 (202) Income tax benefit (203) (182) 12
Income from continuing operations, net of tax $ (128) $ 505 (125)%
** Change is less than one percent or not meaningful.
The shift in the Other category to a net loss from continuing operations of $128 million in the first quarter of 2013, from net income from continuing operationsof $505 million in the first quarter of 2012 was primarily due to the recognition of the bargain purchase gain of $594 million related to the ING Direct acquisitionin the first quarter of 2012, which was partially offset by a derivative loss of $78 million recognized in the first quarter of 2012 related to the interest rate swapswe entered into in 2011 to partially hedge the interest rate risk of the net assets associated with the expected ING Direct acquisition.
31

Table of Contents
CONSOLIDATED BALANCE SHEET ANALYSIS AND CREDIT PERFORMANCE Total assets of $300.2 billion as of March 31, 2013 decreased by $12.7 billion, or 4%, from $312.9 billion as of December 31, 2012. Total liabilities of $258.9billion as of March 31, 2013, decreased by $13.5 billion, or 5%, from $272.4 billion as of December 31, 2012. Stockholders’ equity increased by $797 million inthe first quarter of 2013, to $41.3 billion as of March 31, 2013. The increase in stockholders’ equity was primarily attributable to our net income of $1.1 billion inthe first quarter of 2013.
Following is a discussion of material changes in the major components of our assets and liabilities in the first quarter of 2013. Period-end balance sheet amountsmay vary from average balance sheet amounts due to liquidity and balance sheet management activities that are intended to ensure the adequacy of capital whilemanaging our ability to manage liquidity requirements for the company and our customers and our market risk exposure in accordance with our risk appetite.
Investment Securities
Substantially all of our investment securities were classified as available for sale as of March 31, 2013 and December 31, 2012. Investment securities classified asavailable for sale are reported in our condensed consolidated balance sheets at fair value. Our investment securities portfolio, which had a fair value of $64.0billion as of both March 31, 2013 and December 31, 2012, consisted primarily of the following: U.S. Treasury debt, U.S. agency debt and corporate debtsecurities guaranteed by U.S. government agencies; agency and non-agency mortgage-backed securities (“MBS”); other asset-backed securities and otherinvestments. Based on fair value, investments in U.S. Treasury, agency securities and other securities explicitly or implicitly guaranteed by the U.S. governmentrepresented 78% of our total investment securities available for sale as of March 31, 2013, compared with 77% as of December 31, 2012.
We had investment securities designated as held to maturity reported at amortized cost of $2 million and $9 million as of March 31, 2013 and December 31, 2012,respectively. These investment securities are included in other assets in our condensed consolidated balance sheets.
32

Table of Contents
Table 11 presents the amortized cost and fair value for the major categories of our portfolio of investment securities available for sale as of March 31, 2013 andDecember 31, 2012.
Table 11: Investment Securities Available for Sale March 31, 2013 December 31, 2012
(Dollars in millions) Amortized
Cost Fair
Value Amortized
Cost Fair
Value U.S. Treasury debt obligations $ 1,043 $ 1,046 $ 1,548 $ 1,552 U.S. agency debt obligations 301 301 301 302 Corporate debt securities guaranteed by U.S. government agencies 1,117 1,128 1,003 1,012 Residential mortgage-backed securities (“RMBS”):
Agency 40,413 40,749 39,408 40,002 Non-agency 3,499 3,868 3,607 3,871
Total RMBS 43,912 44,617 43,015 43,873
Commercial mortgage-backed securities (“CMBS”): Agency 6,322 6,393 6,045 6,144 Non-agency 1,686 1,730 1,425 1,485
Total CMBS 8,008 8,123 7,470 7,629
Other asset-backed securities 7,298 7,357 8,393 8,458 Other securities 1,369 1,396 1,120 1,153
Total securities available for sale $ 63,048 $63,968 $ 62,850 $63,979
Includes debt securities issued by Fannie Mae and Freddie Mac with an amortized cost of $300 million as of both March 31, 2013 and December 31, 2012, and a fair value of $300 million and $302
million as of March 31, 2013 and December 31, 2012, respectively. Consists of corporate debt securities guaranteed by U.S. government agencies, such as the Export-Import Bank of the United States. Includes MBS issued by Fannie Mae, Freddie Mac and Ginnie Mae, each of which individually exceeded 10% of our stockholders’ equity as of the end of each reported period. Fannie Mae MBS had an
amortized cost of $24.8 billion and $22.9 billion as of March 31, 2013 and December 31, 2012, respectively, and a fair value of $25.0 billion and $23.2 billion as of March 31, 2013 and December 31,2012, respectively. Freddie Mac MBS had an amortized cost of $12.6 billion as of both March 31, 2013 and December 31, 2012, and a fair value of $12.7 billion and $12.9 billion as of March 31, 2013 andDecember 31, 2012, respectively. Ginnie Mae MBS had an amortized cost of $9.0 billion and $9.9 billion as of March 31, 2013 and December 31, 2012, respectively, and a fair value of $9.1 billion and$10.0 billion as of March 31, 2013 and December 31, 2012, respectively.
The other asset-backed securities portfolio was collateralized by approximately 68% credit card loans, 18% auto dealer floor plan inventory loans and leases, 6% auto loans, 1% student loans, 5%equipment loans and 2% of other assets as of March 31, 2013. In comparison, the distribution was approximately 64% credit card loans, 18% auto dealer floor plan inventory loans and leases, 6% autoloans, 1% student loans, 5% equipment loans, 2% commercial paper and 4% of other assets as of December 31, 2012. Approximately 88% of the securities in our other asset-backed security portfolio wererated AAA or its equivalent as of March 31, 2013, compared with 82% as of December 31, 2012.
Includes foreign government/agency bonds, covered bonds, corporate securities, municipal securities and equity investments primarily related to activities under the Community Reinvestment Act(“CRA”).
Our portfolio of investment securities available for sale had a fair value of approximately $64.0 billion as of both March 31, 2013 and December 31, 2012. Wehad purchases during the quarter totaling approximately $6.0 billion, which were offset by pay downs and maturities of $4.9 billion, sales of $720 million and adecrease in fair value of $209 million.
Unrealized gains and losses on our portfolio of investment securities available for sale are recorded net of tax as a component of accumulated othercomprehensive income (“AOCI”). We had gross unrealized gains of $1.2 billion and gross unrealized losses of $258 million on available-for sale securities as ofMarch 31, 2013, compared with gross unrealized gains of $1.2 billion and gross unrealized losses of $120 million on available-for sale securities as ofDecember 31, 2012. The increase in gross unrealized losses in the first quarter of 2013 was primarily driven by an increase in interest rates, which resulted in adecrease in fair value of certain securities. Of
33
(1)
(2)
(3)
(3)
(4)
(5)
(1)
(2)(3)
(4)
(5)

Table of Contents
the $258 million in gross unrealized losses as of March 31, 2013, $29 million related to securities that had been in a loss position for 12 months or longer.
We provide information on OTTI losses recognized in earnings on our investment securities above under “Consolidated Results of Operations—Non-InterestIncome.”
Credit Ratings
Our portfolio of investment securities available for sale continues to be concentrated in securities that generally have low credit risk and high credit ratings, suchas securities issued and guaranteed by the U.S. Treasury and other government sponsored enterprises or agencies. Approximately 92% of our total investmentsecurities portfolio was rated AA+ or its equivalent, or better as of March 31, 2013 and December 31, 2012, while approximately 6% were below investmentgrade as of both March 31, 2013 and December 31, 2012. We categorize the credit ratings of our investment securities based on the lowest credit rating as issuedby the rating agencies Standard & Poor’s Ratings Services (“S&P”), Moody’s Investors Service (“Moody’s”) and Fitch Ratings (“Fitch”).
Table 12 provides information on the credit ratings of our non-agency RMBS, non-agency CMBS, other asset-backed securities and other securities in ourportfolio as of March 31, 2013 and December 31, 2012.
Table 12: Non-Agency Investment Securities Credit Ratings March 31, 2013 December 31, 2012
(Dollars in millions) Amortized
Cost AAA
OtherInvestment
Grade
BelowInvestment
Grade or NotRated
AmortizedCost AAA
OtherInvestment
Grade
BelowInvestment
Grade or NotRated
Non-agency RMBS $ 3,499 —% 5% 95% $ 3,607 —% 5% 95% Non-agency CMBS 1,686 98 2 — 1,425 97 3 — Other asset-backed securities 7,298 88 11 1 8,393 82 17 1 Other securities 1,369 46 44 10 1,120 67 24 9
Includes foreign government/agency bonds, covered bonds, corporate securities, municipal securities and equity investments primarily related to activities under the CRA.
For additional information on our investment securities, see “Note 3—Investment Securities.”
Loans Held for Investment
Total loans that we manage consist of held-for-investment loans recorded on our consolidated balance sheets and loans held in our securitization trusts. Loansunderlying our securitization trusts are reported on our consolidated balance sheets in restricted loans for securitization investors. Table 13 summarizes ourportfolio of loans held for investment by business segment, net of the allowance for loan and lease losses, as of March 31, 2013 and December 31, 2012.
Table 13: Net Loans Held for Investment March 31, 2013 December 31, 2012
(Dollars in millions)
Total LoansHeld For
Investment Allowance
Net LoansHeld For
Investment
Total LoansHeld For
Investment Allowance
Net LoansHeld For
Investment Credit Card $ 78,397 $ 3,494 $ 74,903 $ 91,755 $ 3,979 $ 87,776 Consumer Banking 73,613 743 72,870 75,127 711 74,416 Commercial Banking 39,150 342 38,808 38,820 433 38,387 Other 173 27 146 187 33 154
Total $ 191,333 $ 4,606 $ 186,727 $ 205,889 $ 5,156 $ 200,733
34
(1)
(1)

Table of Contents
Period-end loans held for investment decreased by $14.6 billion, or 7%, in the first quarter of 2013, to $191.3 billion as of March 31, 2013. The decrease was duein part to the transfer of the loans in the Best Buy portfolio to the held for sale category. Excluding the transfer of the Best Buy portfolio of approximately$7 billion to held for sale, period-end loans held for investment decreased by approximately $7.6 billion, or 4%. This decrease reflected typical seasonally lowercredit card purchase volumes and higher pay downs in the first quarter of the year, the continued expected run-off of installment loans in our Credit Card businessand home loans in our Consumer Banking business, as well as the expected run-off of certain other credit card loans acquired in the 2012 U.S. card acquisition.The pay downs and run-off of card balances were partially offset by higher period-end auto balances due to the continued high volume of auto loan originationsand strong loan originations in our commercial and industrial and commercial real estate loan portfolios.
We provide additional information on the composition of our loan portfolio and credit quality below in “Credit Risk Profile” and in “Note 4—Loans.”
Loans Held for Sale
Loans held for sale, which are carried at lower of cost or fair value, increased to $6.4 billion as of March 31, 2013, from $201 million as of December 31, 2012.The increase was due to the transfer of the Best Buy loan portfolio to held for sale from held for investment in the first quarter of 2013. At the time of the transfer,the portfolio had loan balances of approximately $7 billion. The Best Buy portfolio had outstanding loan balances of $6.3 billion as of March 31, 2013.
Customer Deposits
Our customer deposits have become our largest source of funding for our operations and asset growth, providing a sizeable and consistent source of low-costfunds. Total customer deposits of $212.4 billion as of March 31, 2013 were relatively unchanged from $212.5 billion as of December 31, 2012. We provideinformation on the composition of our deposits, average outstanding balances, interest expense and yield below in “Liquidity Risk Profile.”
Securitized Debt Obligations
Borrowings due to securitization investors decreased by $352 million to $11.0 billion as of March 31, 2013, from $11.4 billion as of December 31, 2012. Thisdecrease was attributable to the scheduled maturities of debt within our credit card securitization trusts, which was partially offset by the February 1, 2013execution of our first credit securitization transaction since 2009 in which Capital One Multi-Asset Execution Trust issued $750 million of 3-year, AAA-ratedfixed-rate notes from our credit card securitization trust.
Other Debt
Other debt, which consists of federal funds purchased and securities loaned or sold under agreements to repurchase, senior and subordinated notes and otherborrowings, including junior subordinated debt and FHLB advances, but exclude securitized debt obligations, totaled $26.4 billion as of March 31, 2013, ofwhich $12.2 billion represented short-term borrowings and $14.2 billion represented long-term debt. Other debt decreased $12.1 billion in the first quarter of2013 from a total $38.5 billion as of December 31, 2012, of which $21.1 billion represented short-term borrowings and $17.4 billion represented long-termborrowings.
During the first quarter, we exchanged $1.2 billion of outstanding 8.80% subordinated notes due 2019. The transaction involved offering current holders marketvalue plus an exchange premium for these outstanding notes, which consideration was paid through a combination of $1.4 billion of new 3.375% subordinatednotes due 2023 and cash of $209 million. The exchange was accounted for as a modification of debt.
35

Table of Contents
In addition, other debt decreased as a result of our redemption of $3.65 billion of our junior subordinated debt on January 2, 2013 in connection with ourredemption of our outstanding trust preferred securities. This decrease was partially offset by the issuance of $850 million in new unsecured senior bank notes.The remaining decrease was due to the maturities of short-term FHLB advances of $12.4 billion, which was partially offset by $3.8 billion of new FHLBborrowings during the quarter. We provide additional information on our borrowings in “Note 8—Deposits and Borrowings.”
Potential Mortgage Representation & Warranty Liabilities
We acquired three subsidiaries that originated residential mortgage loans and sold them to various purchasers, including purchasers who created securitizationtrusts. These subsidiaries are Capital One Home Loans, which was acquired in February 2005; GreenPoint Mortgage Funding, Inc. (“GreenPoint”), which wasacquired in December 2006 as part of the North Fork acquisition; and CCB, which was acquired in February 2009 and subsequently merged into CONA.
We have established representation and warranty reserves for losses associated with the mortgage loans sold by each subsidiary that we consider to be bothprobable and reasonably estimable, including both litigation and non-litigation liabilities. These reserves are reported in our condensed consolidated balancesheets as a component of other liabilities. The aggregate reserves for all three subsidiaries totaled $994 million as of March 31, 2013, compared with $899 millionas of December 31, 2012, and $1.1 billion as of March 31, 2012.
The table below summarizes changes in our representation and warranty reserves in first quarter of 2013 and 2012, and for full year 2012.
Table 14: Changes in Representation and Warranty Reserve Three Months Ended March 31, Full
Year2012 (Dollars in millions) 2013 2012
Representation and warranty repurchase reserve, beginning of period $ 899 $ 943 $ 943 Provision for mortgage representation and warranty losses 97 169 349 Net realized losses (2) (11) (393)
Representation and warranty repurchase reserve, end of period $ 994 $ 1,101 $ 899
Reported in our consolidated balance sheets as a component of other liabilities. The pre-tax portion of the provision for mortgage representation and warranty losses recognized in our condensed consolidated statements of income as a component of non-interest income was negative
$10 million in the first quarter of 2013, compared with expense of $16 million in the first quarter of 2012. The pre-tax portion of the provision for mortgage representation and warranty losses recognizedin our consolidated statements of income as a component of discontinued operations totaled $107 million and $153 million in the first quarter of 2013 and 2012, respectively.
As part of our business planning processes, we have considered various outcomes relating to the potential future representation and warranty liabilities of oursubsidiaries that are possible but do not rise to the level of being both probable and reasonably estimable outcomes justifying an incremental accrual underapplicable accounting standards. Our current best estimate of reasonably possible future losses from representation and warranty claims beyond what was in ourreserve as of March 31, 2013, is approximately $2.7 billion, unchanged from our estimate of $2.7 billion as of December 31, 2012.
We provide additional information related to the representation and warranty reserve, including factors that may impact the adequacy of the reserves and theultimate amount of losses incurred by our subsidiaries, in “Note 14—Commitments, Contingencies and Guarantees.”
36
(1)
(2)
(1)
(1)(2)

Table of Contents
OFF-BALANCE SHEET ARRANGEMENTS AND VARIABLE INTEREST ENTITIES In the ordinary course of business, we are involved in various types of arrangements with limited liability companies, partnerships or trusts that often involvespecial purpose entities and variable interest entities (“VIEs”). Some of these arrangements are not recorded on our consolidated balance sheets or may berecorded in amounts different from the full contract or notional amount of the arrangements, depending on the nature or structure of, and accounting required tobe applied to, the arrangement. These arrangements may expose us to potential losses in excess of the amounts recorded in the consolidated balance sheets. Ourinvolvement in these arrangements can take many forms, including securitization and servicing activities, the purchase or sale of mortgage-backed or other asset-backed securities in connection with our home loan portfolio and loans to VIEs that hold debt, equity, real estate or other assets.
Our continuing involvement in unconsolidated VIEs primarily consists of certain mortgage loan trusts and community reinvestment and development entities.The carrying amount of assets and liabilities of these unconsolidated VIEs was $2.8 billion and $401 million, respectively, as of March 31, 2013, and ourmaximum exposure to loss was $2.8 billion. We provide a discussion of our activities related to these VIEs in “Note 6—Variable Interest Entities andSecuritizations.” CAPITAL MANAGEMENT The level and composition of our equity capital are determined by multiple factors, including our consolidated regulatory capital requirements and an internalrisk-based capital assessment, and may also be influenced by rating agency guidelines, subsidiary capital requirements, the business environment, conditions inthe financial markets and assessments of potential future losses due to adverse changes in our business and market environments.
Capital Standards and Prompt Corrective Action
Bank holding companies and national banks are subject to capital adequacy standards adopted by the Federal Reserve and the Office of the Comptroller of theCurrency (“OCC”), respectively. The capital adequacy standards set forth minimum risk-based and leverage capital requirements that are based on quantitativeand qualitative measures of assets and off-balance sheet items. Under the capital adequacy standards, bank holding companies and banks currently are required tomaintain a total risk-based capital ratio of at least 8%, a Tier 1 risk-based capital ratio of at least 4%, and a Tier 1 leverage capital ratio of at least 4% (3% forbanks that meet certain specified criteria, including excellent asset quality, high liquidity, low interest rate exposure and the highest regulatory rating) in order tobe considered adequately capitalized.
National banks also are subject to prompt corrective action capital regulations. Under prompt corrective action regulations, a bank is considered to be wellcapitalized if it maintains a Tier 1 risk-based capital ratio of at least 6% (200 basis points higher than the above minimum capital standard), a total risk-basedcapital ratio of at least 10% (200 basis points higher than the above minimum capital standard), a Tier 1 leverage capital ratio of at least 5% and is not subject toany supervisory agreement, order or directive to meet and maintain a specific capital level for any capital reserve. A bank is considered to be adequatelycapitalized if it meets these minimum capital ratios and does not otherwise meet the well capitalized definition. Currently, prompt corrective action capitalrequirements do not apply to bank holding companies. We also disclose a Tier 1 common ratio for our bank holding company, which is a regulatory capitalmeasure widely used by investors, analysts, rating agencies and bank regulatory agencies to assess the capital position of financial services companies. There iscurrently no mandated minimum or “well capitalized” standard for the Tier 1 common ratio; instead the risk-based capital rules state that voting commonstockholders’ equity should be the dominant element within Tier 1 common capital. In addition, we disclose a non-GAAP TCE ratio in “Summary of SelectedFinancial Data.” While the
37

Table of Contents
Tier 1 common and TCE ratios are capital measures widely used by investors, analysts and bank regulatory agencies to assess the capital position of financialservices companies, they may not be comparable to similarly titled measures reported by other companies. We provide information on the calculation of theseratios in “Supplemental Tables—Table A: Reconciliation of Non-GAAP Measures and Calculation of Regulatory Capital Measures Under Basel I.”
Table 15 provides a comparison of our capital ratios under the Federal Reserve’s capital adequacy standards; and the capital ratios of the Banks under the OCC’scapital adequacy standards as of March 31, 2013 and December 31, 2012.
Table 15: Capital Ratios Under Basel I March 31, 2013 December 31, 2012
(Dollars in millions) CapitalRatio
MinimumCapital
Adequacy Well
Capitalized CapitalRatio
MinimumCapital
Adequacy Well
Capitalized Capital One Financial Corp: Tier 1 common 11.79% N/A N/A 10.96% N/A N/A Tier 1 risk-based capital 12.18 4.00% 6.00% 11.34 4.00% 6.00% Total risk-based capital 14.43 8.00 10.00 13.56 8.00 10.00 Tier 1 leverage 9.15 4.00 N/A 8.66 4.00 N/A Capital One Bank (USA) N.A. (“COBNA”): Tier 1 risk-based capital 11.91% 4.00% 6.00% 11.32% 4.00% 6.00% Total risk-based capital 15.43 8.00 10.00 14.74 8.00 10.00 Tier 1 leverage 10.16 4.00 5.00 10.43 4.00 5.00 Capital One, N.A. (“CONA”): Tier 1 risk-based capital 13.45% 4.00% 6.00% 13.59% 4.00% 6.00% Total risk-based capital 14.60 8.00 10.00 14.85 8.00 10.00 Tier 1 leverage 9.01 4.00 5.00 9.15 4.00 5.00
Calculated under capital standards and regulations based on the international capital framework commonly known as Basel I. Capital ratios that are not applicable are denoted by “N/A.” Tier 1 common ratio is a regulatory capital measure calculated based on Tier 1 common capital divided by risk-weighted assets. Tier 1 risk-based capital ratio is a regulatory capital measure calculated based on Tier 1 capital divided by risk-weighted assets. Total risk-based capital ratio is a regulatory capital measure calculated based on total risk-based capital divided by risk-weighted assets. Tier 1 leverage ratio is calculated based on Tier 1 capital divided by quarterly average total assets, after certain adjustments.
Our Tier 1 common ratio, as calculated under Basel I, increased to 11.79% as of March 31, 2013, up from 10.96% as of December 31, 2012. The increase in ourTier 1 common ratio reflected strong internal capital generation from earnings. We exceeded minimum capital requirements and would meet the “wellcapitalized” ratio levels specified under prompt corrective action for Tier 1 risk-based capital, total risk-based capital and Tier 1 leverage under Federal Reservecapital standards for bank holding companies as of both March 31, 2013 and December 31, 2012. The Banks also exceeded minimum regulatory requirementsunder the OCC’s applicable capital adequacy guidelines and were “well capitalized” under prompt corrective action requirements as of both March 31, 2013 andDecember 31, 2012.
Recent Developments in Capital Requirements
As of December 31, 2012, we had outstanding trust preferred securities with a combined aggregate principal amount of $3.65 billion that previously qualified asTier 1 capital. On January 2, 2013, we redeemed all of our outstanding trust preferred securities, which generally carried a higher coupon cost, ranging from3.36% to 10.25%, than other funding sources available to us. Pursuant to the Dodd-Frank Act, the Tier 1 capital treatment of trust preferred securities is to bephased out over a three year period starting on January 1, 2013.
38
(1)
(2)
(3)
(4)
(5)
(3)
(4)
(5)
(3)
(4)
(5)
(1)(2)(3)(4)(5)

Table of Contents
In January 2013 we submitted our capital plan to the Board of Governors of the Federal Reserve as part of the 2013 Comprehensive Capital Analysis and Review(“CCAR”). On March 14, 2013, we were informed by the Board of Governors of the Federal Reserve that it had completed its review under the CCAR processand that it did not object to our proposed capital distribution plans submitted pursuant to CCAR.
Dividends
On May 2, 2013, our Board of Directors approved an increase in our quarterly common stock dividend per share from $0.05 per share to $0.30 per share, payableMay 23, 2013 to stockholders of record as of May 13, 2013. The Board of Directors also declared a quarterly dividend on the outstanding shares of our 6.00%fixed rate non-cumulative perpetual preferred stock, Series B (the “Series B Preferred Stock”). Each outstanding share of the Series B Preferred Stock isrepresented by depository shares, each representing a 1/40th interest in a share of Series B Preferred Stock. The dividend of $15.00 per share (equivalent to$0.375 per outstanding depository share) will be paid on June 3, 2013 to stockholders of record at the close of business on May 17, 2013.
On January 31, 2013, our Board of Directors declared a quarterly common stock dividend of $0.05 per share, which was payable on February 22, 2013 tostockholders of record as of February 11, 2013, and a quarterly dividend on the outstanding Series B Preferred Stock. The dividend of $15.00 per share(equivalent to $0.375 per outstanding depository share) was paid on March 1, 2013 to stockholders of record at the close of business on February 14, 2013.
The declaration and payment of dividends to our stockholders, as well as the amount thereof, are subject to the discretion of our Board of Directors and dependupon our results of operations, financial condition, capital levels, cash requirements, future prospects and other factors deemed relevant by the Board of Directors.As a bank holding company, our ability to pay dividends is largely dependent upon the receipt of dividends or other payments from our subsidiaries. Fundsavailable for dividend payments from COBNA and CONA were $4.3 billion and $791 million, respectively, as of March 31, 2013. There can be no assurance thatwe will declare and pay any dividends. For additional information on dividends, see “Item 1. Business—Supervision and Regulation—Dividends, StockPurchases and Transfer of Funds” in our 2012 Form 10-K. RISK MANAGEMENT Overview
Risk management is a critical part of our business model, as all financial institutions are exposed to a variety of risks that can significantly affect their financialperformance. Our business activities expose us to eight major categories of risk: credit risk, liquidity risk, market risk, compliance risk, operational risk, legalrisk, reputational risk and strategic risk. Our risk management framework is intended to identify, assess and mitigate risks that affect or have the potential to affectour business. We target financial returns that compensate us for the amount of risk that we take and avoid excessive risk-taking.
39

Table of Contents
We use a consistent risk management framework to manage risk. This framework applies at all levels, from the development of the Enterprise Risk ManagementProgram itself to the tactical operations of the front-line business team. We are continuing to make changes to our risk management framework as we enhance ourenterprise-wide compliance risk management programs, including further expanding the “Three Lines of Defense” model referenced under the “RiskManagement Principles” set forth under “MD&A—Risk Management—Risk Management Principles” in our 2012 Form 10-K. Our risk management framework,which is built around governance, processes and people, currently consists of the following six key elements:
• Objective Setting • Risk Assessment • Control Activities • Communication and Information • Program Monitoring • Organization and Culture
We provide additional discussion of our risk management principles, roles and responsibilities, framework and risk appetite under “MD&A—Risk Management”in our 2012 Form 10-K. CREDIT RISK PROFILE Our loan portfolio accounts for the substantial majority of our credit risk exposure. Below we provide information about the composition of our loan portfolio,key concentrations and credit performance metrics.
We also engage in certain non-lending activities that may give rise to credit and counterparty settlement risk, including the purchase of securities for ourinvestment securities portfolio, entering into derivative transactions to manage our market risk exposure and to accommodate customers, foreign exchangetransactions and deposit overdrafts. We provide additional information on credit risk related to our investment securities portfolio under “Consolidated BalanceSheet Analysis—Investment Securities” and credit risk related to derivative transactions in “Note 9—Derivative Instruments and Hedging Activities.”
Loan Portfolio Composition
We provide a variety of lending products. Our primary products include credit cards, auto loans, home loans and commercial loans. For information on ourlending policies and procedures, including our underwriting criteria, for our primary loan products, please refer to the “MD&A—Credit Risk Profile” section inour 2012 Form 10-K.
Total loans that we manage consist of held-for-investment loans recorded on our balance sheet and loans held in our securitization trusts. Loans underlying oursecuritization trusts are reported on our consolidated balance sheets under restricted loans for securitization investors. Table 16 presents the composition of ourtotal loan portfolio, by business segments, as of March 31, 2013 and December 31, 2012. Table 16 also displays acquired loans accounted for based on estimatedcash flows expected to be collected, which consists of a limited portion of the credit card loans acquired in the 2012 U.S. card acquisition and the substantialmajority of consumer and commercial loans acquired in the ING Direct and Chevy Chase Bank acquisitions. For additional information on the accounting foracquired loans, see “MD&A—Credit Risk Profile—Loan Portfolio Composition—Loans Acquired” and “Note 1—Summary of Significant Accounting Policies—Loan” in our 2012 Form 10-K. Table 16 and the credit metrics presented in this section exclude loans held for sale, which are carried at lower of cost or fairvalue and totaled $6.4 billion and $201 million as of March 31, 2013 and December 31, 2012, respectively.
40
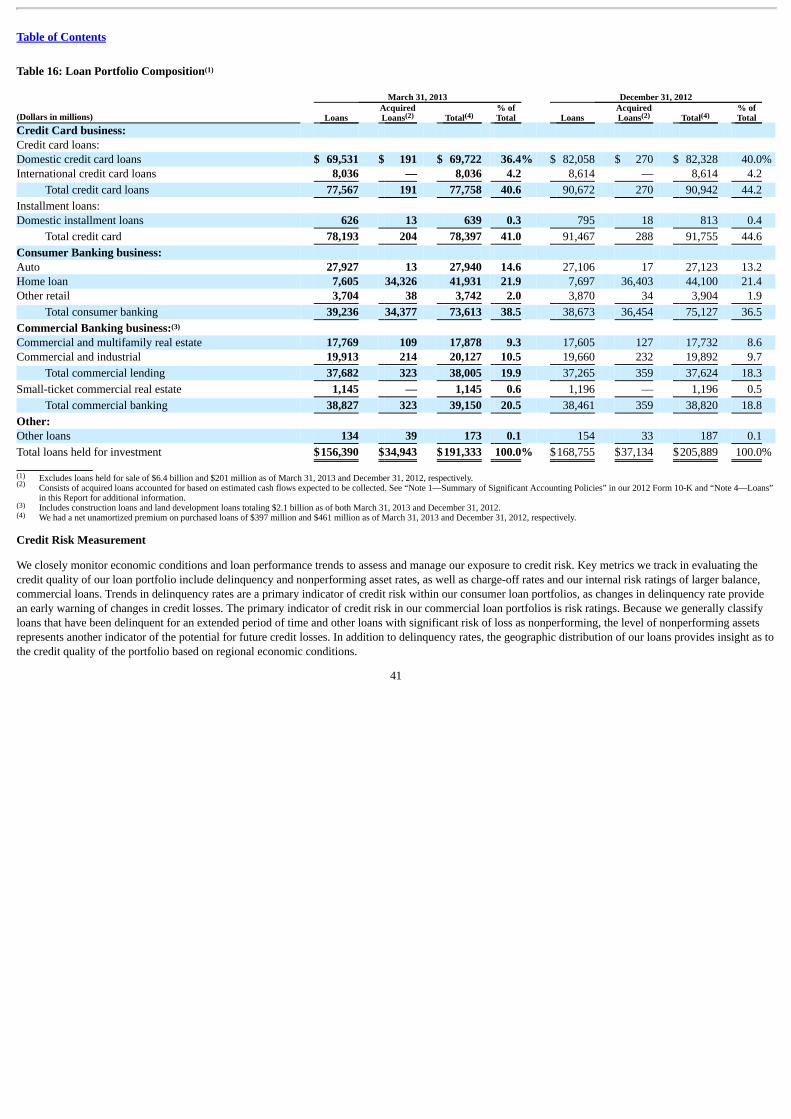
Table of Contents
Table 16: Loan Portfolio Composition March 31, 2013 December 31, 2012
(Dollars in millions) Loans AcquiredLoans Total
% ofTotal Loans
AcquiredLoans Total
% ofTotal
Credit Card business: Credit card loans: Domestic credit card loans $ 69,531 $ 191 $ 69,722 36.4% $ 82,058 $ 270 $ 82,328 40.0% International credit card loans 8,036 — 8,036 4.2 8,614 — 8,614 4.2
Total credit card loans 77,567 191 77,758 40.6 90,672 270 90,942 44.2
Installment loans: Domestic installment loans 626 13 639 0.3 795 18 813 0.4
Total credit card 78,193 204 78,397 41.0 91,467 288 91,755 44.6
Consumer Banking business: Auto 27,927 13 27,940 14.6 27,106 17 27,123 13.2 Home loan 7,605 34,326 41,931 21.9 7,697 36,403 44,100 21.4 Other retail 3,704 38 3,742 2.0 3,870 34 3,904 1.9
Total consumer banking 39,236 34,377 73,613 38.5 38,673 36,454 75,127 36.5
Commercial Banking business: Commercial and multifamily real estate 17,769 109 17,878 9.3 17,605 127 17,732 8.6 Commercial and industrial 19,913 214 20,127 10.5 19,660 232 19,892 9.7
Total commercial lending 37,682 323 38,005 19.9 37,265 359 37,624 18.3
Small-ticket commercial real estate 1,145 — 1,145 0.6 1,196 — 1,196 0.5
Total commercial banking 38,827 323 39,150 20.5 38,461 359 38,820 18.8
Other: Other loans 134 39 173 0.1 154 33 187 0.1
Total loans held for investment $156,390 $34,943 $191,333 100.0% $168,755 $37,134 $205,889 100.0%
Excludes loans held for sale of $6.4 billion and $201 million as of March 31, 2013 and December 31, 2012, respectively.
Consists of acquired loans accounted for based on estimated cash flows expected to be collected. See “Note 1—Summary of Significant Accounting Policies” in our 2012 Form 10-K and “Note 4—Loans”in this Report for additional information.
Includes construction loans and land development loans totaling $2.1 billion as of both March 31, 2013 and December 31, 2012. We had a net unamortized premium on purchased loans of $397 million and $461 million as of March 31, 2013 and December 31, 2012, respectively.
Credit Risk Measurement
We closely monitor economic conditions and loan performance trends to assess and manage our exposure to credit risk. Key metrics we track in evaluating thecredit quality of our loan portfolio include delinquency and nonperforming asset rates, as well as charge-off rates and our internal risk ratings of larger balance,commercial loans. Trends in delinquency rates are a primary indicator of credit risk within our consumer loan portfolios, as changes in delinquency rate providean early warning of changes in credit losses. The primary indicator of credit risk in our commercial loan portfolios is risk ratings. Because we generally classifyloans that have been delinquent for an extended period of time and other loans with significant risk of loss as nonperforming, the level of nonperforming assetsrepresents another indicator of the potential for future credit losses. In addition to delinquency rates, the geographic distribution of our loans provides insight as tothe credit quality of the portfolio based on regional economic conditions.
41
(1)
(2) (4) (2) (4)
(3)
(1)(2)
(3)(4)

Table of Contents
We use borrower credit scores in underwriting for most consumer loans. We do not use credit scores as a primary indicator of credit quality, because productdifferences, loan structure, and other factors drive large differences in credit quality for a given credit score, and because a borrower’s credit score tends to be alagging indicator of credit quality. We continuously adjust our credit line management of credit lines and collection strategies based on customer behavior and riskprofile changes.
As noted above, our Credit Card business accounted for $78.4 billion, or 41%, of our total loan portfolio as of March 31, 2013, with Domestic Card accountingfor $70.4 billion, or 37%, of our total loan portfolio as of March 31, 2013. In comparison, our Credit Card business accounted for $91.8 billion, or 45%, of ourtotal loan portfolio as of December 31, 2012, with Domestic Card accounting for $83.1 billion, or 40%, of our total loan portfolio as of December 31, 2012.Based on our most recent data, we estimate that approximately one-third of our Domestic Card portfolio had credit scores less than 660 or no score, based on loanbalances, as of March 31, 2013, relatively consistent with the proportion of the Domestic Card portfolio with credit scores below 660 or no score as ofDecember 31, 2012. For loans related to the 2012 U.S. card acquisition and certain other partnerships, data is obtained on a lagged basis.
We present information in the section below on the credit performance of our loan portfolio, including the key metrics we use in tracking changes in the creditquality of our loan portfolio. Loans acquired as part of the CCB, ING Direct and 2012 U.S. card acquisitions are included in the denominator used in calculatingthe credit quality metrics presented below. Because some of these loans are accounted for based on expected cash flows to be collected, which takes intoconsideration future credit losses expected to be incurred, there are no charge-offs or an allowance associated with these loans unless the estimated cash flowsexpected to be collected decrease subsequent to acquisition. In addition, these loans are not classified as delinquent or nonperforming even though the customermay be contractually past due because we expect that we will fully collect the carrying value of these loans. The accounting and classification of these loans maysignificantly alter some of our reported credit quality metrics. We therefore supplement certain reported credit quality metrics with metrics adjusted to exclude theimpact of these acquired loans.
See “Note 4—Loans” in this Report for additional credit quality information. See “Note 1—Summary of Significant Accounting Policies” in our 2012 Form 10-Kfor information on our accounting policies for delinquent, nonperforming loans, charge-offs and troubled debt restructurings (“TDRs”) for each of our loancategories.
Delinquency Rates
We consider the entire balance of an account to be delinquent if the minimum required payment is not received by the first statement cycle date equal to orfollowing the due date specified on the customer’s billing statement. Table 17 compares 30+ day performing and total 30+ day delinquency rates, by loancategory, as of March 31, 2013 and December 31, 2012. Table 17 also presents these metrics adjusted to exclude from the denominator acquired loans accountedfor based on estimated cash flows expected to be collected over the life of the loans.
Our 30+ day delinquency metrics include all held-for-investment loans that are 30 or more days past due, whereas our 30+ day performing delinquency metricsinclude loans that are 30 or more days past due and that are also currently classified as performing and accruing interest. The 30+ day delinquency and 30+ dayperforming delinquency metrics are generally the same for credit card loans, as we continue to classify the substantial majority of credit card loans as performinguntil the account is charged-off, typically when the account is 180 days past due. See “Note 1—Summary of Significant Accounting Policies—Loans” in our2012 Form 10-K for information on our policies for classifying loans as nonperforming for each of our loan categories.
42

Table of Contents
Table 17: 30+ days Delinquencies March 31, 2013 December 31, 2012 30+ Day Performing 30+ Day Total 30+ Day Performing 30+ Day Total
(Dollars in millions) Amount Rate AdjustedRate Amount Rate
AdjustedRate Amount Rate
AdjustedRate Amount Rate
AdjustedRate
Credit Card business: Domestic credit card and
installment loans $2,374 3.37% 3.38% $2,374 3.37% 3.38% $3,001 3.61% 3.62% $3,001 3.61% 3.62% International credit card 325 4.04 4.04 396 4.93 4.93 308 3.58 3.58 387 4.49 4.49
Total credit card 2,699 3.44 3.45 2,770 3.53 3.54 3,309 3.61 3.62 3,388 3.69 3.70
Consumer Banking business: Automobile 1,560 5.58 5.59 1,655 5.92 5.93 1,900 7.00 7.01 2,049 7.55 7.56 Home loan 57 0.14 0.75 352 0.84 4.63 59 0.13 0.77 380 0.86 4.94 Retail banking 32 0.83 0.84 59 1.58 1.59 30 0.76 0.77 81 2.07 2.09
Total consumer banking 1,649 2.24 4.20 2,066 2.81 5.27 1,989 2.65 5.14 2,510 3.34 6.49
Commercial Banking business: Commercial and multifamily
real estate 107 0.60 0.60 207 1.16 1.17 140 0.79 0.79 248 1.40 1.41 Commercial and industrial 57 0.28 0.29 122 0.60 0.61 73 0.37 0.37 135 0.68 0.69
Total commercial lending 164 0.43 0.43 329 0.87 0.87 213 0.57 0.57 383 1.02 1.03
Small-ticket commercial realestate 18 1.56 1.56 42 3.68 3.68 33 2.74 2.74 43 3.60 3.60
Total commercial banking 182 0.46 0.47 371 0.95 0.96 246 0.63 0.64 426 1.10 1.11
Other: Other loans 8 4.75 6.09 29 16.54 21.22 11 5.72 6.95 36 19.25 23.38
Total $4,538 2.37% 2.90% $5,236 2.74% 3.35% $5,555 2.70% 3.29% $6,360 3.09% 3.77%
Calculated by loan category by dividing 30+ day delinquent loans as of the end of the period by period-end loans held for investment for the specified loan
category, including acquired loans as applicable. Calculated by excluding acquired loans accounted for based on estimated cash flows expected to be collected from the denominator.
43
(1) (2) (1) (2) (1) (2) (1) (2)
(1)
(2)

Table of Contents
Table 18 presents an aging of 30+ days delinquent loans included in the above table.
Table 18: Aging and Geography of 30+ Days Delinquent Loans March 31, 2013 December 31, 2012
(Dollars in millions) Amount % of
Total Loans Amount % of
Total Loans Total loan portfolio $191,333 100.0% $205,889 100.0%
Delinquency status: 30 – 59 days $ 2,241 1.17% $ 2,664 1.29% 60 – 89 days 1,079 0.57 1,440 0.70 90 + days 1,916 1.00 2,256 1.10
Total $ 5,236 2.74% $ 6,360 3.09%
Geographic region: Domestic $ 4,840 2.53% $ 5,973 2.90% International 396 0.21 387 0.19
Total $ 5,236 2.74% $ 6,360 3.09%
Calculated by dividing loans in each delinquency status category or geographic region as of the end of the period by the total held-for-investment loanportfolio, including acquired loans.
Table 19 summarizes loans that were 90 days or more past due as to interest or principal and still accruing interest as of March 31, 2013 and December 31, 2012.These loans consist primarily of credit card accounts between 90 days and 179 days past due. As permitted by regulatory guidance issued by the Federal FinancialInstitutions Examination Council (“FFIEC”), we generally continue to accrue interest and fees on domestic credit card loans through the date of charge-off, whichis typically in the period the account becomes 180 days past due. While domestic credit card loans typically remain on accrual status until the loan is charged-off,we reduce the balance of our credit card receivables by the amount of finance charges and fees billed but not expected to be collected and exclude this amountfrom revenue.
Table 19: 90+ Days Delinquent Loans Accruing Interest March 31, 2013 December 31, 2012
(Dollars in millions) Amount % of
Total Loans Amount % of
Total Loans Loan category: Credit card $1,275 1.63% $1,510 1.65% Consumer 1 0.00 1 0.00 Commercial 33 0.08 16 0.04
Total $1,309 0.68% $1,527 0.74%
Geographic region: Domestic $1,205 0.63% $1,427 0.69% International 104 0.05 100 0.05
Total $1,309 0.68% $1,527 0.74%
Delinquency rates are calculated by loan category by dividing 90+ day delinquent loans accruing interest as of the end of the period by period-end loans held
for investment for the specified loan category, including acquired loans as applicable. Calculated by dividing loans in each geographic region as of the end of the period by the total loan portfolio.
44
(1) (1)
(1)
(1)
(2)
(1)
(2)
Table of Contents
Nonperforming Assets
Nonperforming assets consist of nonperforming loans and foreclosed property and repossessed assets. Nonperforming loans generally include loans that havebeen placed on nonaccrual status and certain restructured loans whose contractual terms have been restructured in a manner that grants a concession to a borrowerexperiencing financial difficulty. We separately track and report acquired loans accounted for based on expected cash flows and disclose our delinquency andnonperforming loan rates with and without acquired loans. See “Note 1—Summary of Significant Accounting Policies—Loans” in our 2012 Form 10-K forinformation on our policies for classifying loans as nonperforming for each of our loan categories.
Table 20 presents comparative information on nonperforming loans, by loan category, as of March 31, 2013 and December 31, 2012, and the ratio ofnonperforming loans to our total loans. We do not classify loans held for sale as nonperforming, as they are recorded at the lower of cost or fair value.
Table 20: Nonperforming Loans and Other Nonperforming Assets March 31, 2013 December 31, 2012
(Dollars in millions) Amount
% ofTotalHFI
Loans Amount
% ofTotalHFI
Loans Nonperforming loans held for investment: Credit card business: International credit card $ 90 1.13% $ 100 1.16%
Total credit card 90 0.12 100 0.11
Consumer Banking business: Auto 95 0.34 149 0.55 Home loan 403 0.96 422 0.96 Retail banking 46 1.23 71 1.82
Total consumer banking 544 0.74 642 0.85
Commercial Banking business: Commercial and multifamily real estate 127 0.71 137 0.77 Commercial and industrial 122 0.60 133 0.67
Total commercial lending 249 0.66 270 0.72 Small-ticket commercial real estate 28 2.41 12 0.97
Total commercial banking 277 0.71 282 0.73
Other: Other loans 25 14.42 30 15.85
Total nonperforming loans held for investment $ 936 0.49% $1,054 0.51%
Other nonperforming assets: Foreclosed property $ 198 0.10% $ 204 0.10% Repossessed assets 18 0.01 22 0.01
Total other nonperforming assets 216 0.11 226 0.11
Total nonperforming assets $1,152 0.60% $1,280 0.62%
The ratio of nonperforming loans as a percentage of total loans held for investment is calculated based on the nonperforming loans in each loan category
divided by the total outstanding unpaid principal balance of loans held for investment in each loan category. The denominator used in calculating thenonperforming asset ratios consists of total loans held for investment and other nonperforming assets.
45
(1)(2)
(3)
(4)
(5)
(1)

Table of Contents
The nonperforming loan ratio, excluding acquired loans from the denominator, for home loan, retail banking, total consumer banking, commercial andmultifamily real estate, commercial and industrial, total commercial banking and total nonperforming loans held for investment was 5.30%, 1.24%, 1.39%,0.72%, 0.61%, 0.71% and 0.60%, respectively, as of March 31, 2013, compared with 5.48%, 1.83%, 1.66%, 0.78%, 0.68%, 0.73% and 0.62%, respectively,as of December 31, 2012. The nonperforming asset ratio, excluding acquired loans from the denominator, was 0.74% and 0.76% as of March 31, 2013 andDecember 31, 2012, respectively.
We recognized interest income for loans classified as nonperforming of $10 million and $12 million in the first quarter of 2013 and 2012, respectively.Interest income foregone related to nonperforming loans was $22 million in the first quarter of both 2013 and 2012. Foregone interest income represents theamount of interest income that would have been recorded during the period for nonperforming loans as of the end of the period had the loans performedaccording to their contractual terms.
Nonperforming loans as a percentage of loans held for investment, excluding credit card loans from the denominator, was 0.83% and 0.92% as of March 31,2013 and December 31, 2012, respectively.
Includes foreclosed properties related to acquired loans of $157 million and $167 million as of March 31, 2013 and December 31, 2012, respectively.
Net Charge-Offs
Net charge-offs consist of the unpaid principal balance of loans held for investment that we determine are uncollectible, net of recovered amounts. We excludeaccrued and unpaid finance charges and fees and fraud losses from charge-offs. Costs incurred to recover charged-off loans are recorded as collection expense andincluded in our consolidated statements of income as a component of other non-interest expense. Our charge-off time frame for loans varies based on the loantype. See “Note 1—Summary of Significant Accounting Policies—Loans” in our 2012 Form 10-K for information on our charge-off policy for each of our loancategories.
Table 21 presents our net charge-off amounts and rates, by business segment, in the first quarter of 2013 and 2012. We provide information on charge-off amountsby loan category below in Table 23.
Table 21: Net Charge-Offs Three Months Ended March 31, 2013 2012
(Dollars in millions) Amount Rate AdjustedRate Amount Rate
AdjustedRate
Credit card $ 922 4.45% 4.46% $ 645 4.14% 4.14% Consumer banking 143 0.78 1.47 109 0.77 1.29 Commercial banking 7 0.07 0.07 16 0.19 0.19 Other 7 14.53 18.47 10 23.30 23.30
Total $ 1,079 2.20% 2.69% $ 780 2.04% 2.40%
Average loans held for investment $195,997 $152,900 Average loans held for investment (excluding acquired loans) 160,291 129,833
Calculated for each loan category by dividing annualized net charge-offs for the period by average loans held for investment during the period. Calculated by excluding acquired loans accounted for based on estimated cash flows expected to be collected from the denominator.
46
(2)
(3)
(4)
(5)
(1) (2) (1) (2)
(1)
(2)

Table of Contents
Loan Modifications and Restructurings
As part of our customer retention efforts, we may modify loans for certain borrowers who have demonstrated performance under the previous terms. As part ofour loss mitigation efforts, we may make loan modifications to a borrower experiencing financial difficulty that are intended to minimize our economic loss andavoid the need for foreclosure or repossession of collateral. We may provide short-term (three to twelve months) or long-term (greater than twelve months)modifications to improve the long-term collectability of the loan. Our most common types of modifications include a reduction in the borrower’s monthly orquarterly principal and interest payment through an extension of the loan term, a reduction in the interest rate, or a combination of both. These modifications mayresult in our receiving the full amount due, or certain installments due, under the loan over a period of time that is longer than the period of time originallyprovided for under the terms of the loan. In limited cases, we may curtail the amount of principal owed by the borrower. Loan modifications in which aconcession has been granted to a borrower experiencing financial difficulty are accounted for and reported as TDRs. We also classify loan modifications thatinvolve a trial period as TDRs.
Table 22 presents the loan balances as of March 31, 2013 and December 31, 2012 of loan modifications made as part of our loss mitigation efforts, all of whichare considered to be TDRs. Table 22 excludes loan modifications that do not meet the definition of a TDR and acquired loans accounted for based on expectedcash flows, which we track and report separately.
Table 22: Loan Modifications and Restructurings March 31, 2013 December 31, 2012
(Dollars in millions) Amount
% ofTotal
Modifications Amount
% ofTotal
Modifications Modified and restructured loans: Credit card $ 839 47.4% $ 873 48.7% Auto 326 18.5 328 18.3 Home loan 168 9.5 145 8.1 Retail banking 59 3.3 65 3.6 Commercial banking 377 21.3 383 21.3
Total $1,769 100% $1,794 100.0%
Status of modified and restructured loans: Performing $1,344 76.0% $1,419 79.1% Nonperforming 425 24.0 375 20.9
Total $1,769 100% $1,794 100.0%
Amount reported reflects the total outstanding customer balance, which consists of unpaid principal balance, accrued interest and fees.
The vast majority of our credit card TDR loan modifications involve a reduction in the interest rate on the account and placing the customer on a fixed paymentplan not exceeding 60 months. We determine the effective interest rate for purposes of measuring impairment on modified loans that involve a reduction and areconsidered to be a TDR based on the interest rate in effect immediately prior to the loan entering the modification program. In some cases, the interest rate on acredit card account is automatically increased due to non-payment, late payment or similar events. In all cases, we cancel the customer’s available line of crediton the credit card. If the cardholder does not comply with the modified payment terms, then the credit card loan agreement may revert to its original paymentterms, with the amount of any loan outstanding reflected in the appropriate delinquency category. The loan amount may then be charged-off in accordance withour standard charge-off policy.
47
(1)
(1)

Table of Contents
The majority of our modified home loans involve a combination of an interest rate reduction, term extension or principal reduction. The vast majority of modifiedcommercial loans include a reduction in interest rate or a term extension.
We provide additional information on modified loans accounted for as TDRs, including the performance of those loans subsequent to modification, in “Note 4—Loans.”
Impaired Loans
A loan is considered impaired when, based on current information and events, it is probable that we will be unable to collect all amounts due from the borrower inaccordance with the original contractual terms of the loan. Loans defined as individually impaired, based on applicable accounting guidance, include largerbalance commercial nonperforming loans and TDR loans. We do not report nonperforming consumer loans that have not been modified in a TDR as individuallyimpaired, as we collectively evaluate these smaller-balance homogenous loans for impairment in accordance with applicable accounting guidance. Loans held forsale are also not reported as impaired, as these loans are recorded at lower of cost or fair value. Impaired loans also exclude acquired loans accounted for based onexpected cash flows because this accounting methodology takes into consideration future credit losses expected to be incurred, as discussed above under“Summary of Selected Financial Data.”
Impaired loans, including TDRs, totaled $2.0 billion as of both March 31, 2013 and December 31, 2012. TDRs accounted for $1.8 billion of impaired loans as ofboth March 31, 2013 and December 31, 2012. We provide additional information on our impaired loans, including the allowance established for these loans, in“Note 4—Loans” and “Note 5—Allowance for Loan and Lease Losses.”
Allowance for Loan and Lease Losses
Our allowance for loan and lease losses represents management’s best estimate of incurred loan and lease credit losses inherent in our held-for-investmentportfolio as of each balance sheet date. We do not maintain an allowance for held-for-sale loans or acquired loans that are performing in accordance with or betterthan our expectations as of the date of acquisition, as the fair values of these loans already reflect a credit component. See “Note 1—Summary of SignificantAccounting Policies—Allowance for Loan and Lease Losses” in our 2012 Form 10-K for information on the methodology for determining our allowance for loanand lease losses for each of our loan categories.
48

Table of Contents
Table 23 displays changes in our allowance for loan and lease losses in the first quarter of 2013 and 2012, details, by loan type, the provision for credit lossesrecognized in our consolidated statements of income each period and charge-offs recorded against the allowance for loan and lease losses.
Table 23: Allowance for Loan and Lease Losses Activity Three Months Ended March 31, (Dollars in millions) 2013 2012 Balance at beginning of period, as reported $ 5,156 $ 4,250 Provision for credit losses 835 579 Charge-offs: Credit Card business: Domestic credit card and installment loans (1,119) (788) International credit card (143) (167)
Total credit card (1,262) (955)
Consumer Banking business: Auto (182) (140) Home loan (7) (24) Retail banking (25) (20)
Total consumer banking (214) (184)
Commercial Banking business: Commercial and multifamily real estate (2) (9) Commercial and industrial (4) (11)
Total commercial lending (6) (20) Small-ticket commercial real estate (6) (16)
Total commercial banking (12) (36) Other loans (8) (11)
Total charge-offs (1,496) (1,186)
Recoveries: Credit Card business: Domestic credit card and installment loans 292 257 International credit card 48 52
Total credit card 340 309
Consumer Banking business: Auto 60 61 Home loan 3 9 Retail banking 8 6
Total consumer banking 71 76
Commercial Banking business: Commercial and multifamily real estate 1 5 Commercial and industrial 2 14
Total commercial lending 3 19 Small-ticket commercial real estate 2 1
Total commercial banking 5 20
Other loans 1 1
Total recoveries 417 406
Net charge-offs (1,079) (780) Impact of loan transfers, sales and other changes (306) 11
Balance at end of period $ 4,606 $ 4,060
Allowance for loan and lease losses as a percentage of loans held for investment 2.41% 2.34%
49
(1) (2)
(3)
(2)

Table of Contents
The total provision for credit losses reported in our consolidated statements of income of $885 million and $573 million in the first quarter of 2013 and 2012,
respectively, consists of a provision for loan and lease losses and a provision for unfunded lending commitments. The provision for credit losses reported inthe above table relates only to the provision for loan and lease losses. It does not include the provision for unfunded lending commitments of $50 million inthe first quarter of 2013 and the negative provision for unfunded lending commitments of $6 million in the first quarter of 2012.
Consists of a reduction in the allowance of $289 million, which was attributable to the transfer of the Best Buy loan portfolio to held for sale from held forinvestment in the first quarter of 2013, and a foreign translation gain of $17 million as of March 31, 2013. Consists of a foreign translation loss of $11million as of March 31, 2012.
Table 24 presents an allocation of our allowance for loan and lease losses by loan category as of March 31, 2013 and December 31, 2012.
Table 24: Allocation of the Allowance for Loan and Lease Losses March 31, 2013 December 31, 2012
(Dollars in millions) Amount
% ofTotal
HFI Loans Amount
% ofTotal
HFI Loans Credit Card business: Domestic credit card and installment loans $ 3,057 4.34% $ 3,526 4.24% International credit card 437 5.44 453 5.26
Total credit card 3,494 4.46 3,979 4.34
Consumer Banking business: Auto 528 1.89 486 1.79 Home loan 103 0.25 113 0.26 Retail banking 112 2.99 112 2.87
Total consumer banking 743 1.01 711 0.95
Commercial Banking business: Commercial and multifamily real estate 140 0.78 239 1.35 Commercial and industrial 145 0.72 116 0.58
Total commercial lending 285 0.75 355 0.94 Small-ticket commercial real estate 57 4.98 78 6.52
Total commercial banking 342 0.87 433 1.12
Other loans 27 15.61 33 17.65
Total $ 4,606 2.41% $ 5,156 2.50%
Total allowance coverage ratios: Period-end loans held for investment $191,333 2.41% $205,889 2.50% Period-end loans held for investment (excluding acquired loans) 156,390 2.95 168,755 3.02 Nonperforming loans 936 492.09 1,054 489.18 Allowance coverage ratios by loan category: Credit card (30 + day delinquent loans) $ 2,770 126.14% $ 3,388 117.44%Consumer banking (30 + day delinquent loans) 2,066 35.96 2,510 28.33 Commercial banking (nonperforming loans) 277 123.47 282 153.55
Calculated based on the allowance for loan and lease losses attributable to each loan category divided by the outstanding balance of loans within thespecified loan category.
As permitted by regulatory guidance issued by the FFIEC, our policy is generally not to classify domestic credit card loans as nonperforming. We generallyaccrue interest on domestic credit card loans through the date of charge-off, which is typically in the period that the loan becomes 180 days past due. Theallowance for loan and lease losses as a percentage of nonperforming loans, excluding the allowance related to our credit card loans, was 118.80% as ofMarch 31, 2013 and 111.67% as of December 31, 2012.
50
(1)
(2)
(1) (1)
(2)
(1)
(2)

Table of Contents
Our allowance decreased by $550 million to $4.6 billion as of March 31, 2013, from $5.2 billion as of December 31, 2012. The reduction reflected an allowancereversal of $289 million related to the Best Buy loan portfolio transferred to held for sale and an allowance release of $261 million. The allowance coverage ratiodeclined to 2.41% as of March 31, 2013, from 2.50% as of December 31, 2012, due in part to an improved credit outlook. LIQUIDITY RISK PROFILE We have established liquidity guidelines that are intended to ensure that we have sufficient asset-based liquidity to withstand the potential impact of depositattrition or diminished liquidity in the funding markets. Our guidelines include maintaining an adequate liquidity reserve to cover our potential fundingrequirements and diversified funding sources to avoid over-dependence on volatile, less reliable funding markets. Our liquidity reserves consist of cash and cashequivalents and unencumbered investment securities available for sale.
Table 25 below presents the composition of our liquidity reserves as of March 31, 2013 and December 31, 2012.
Table 25: Liquidity Reserves
(Dollars in millions) March 31,
2013 December 31,
2012 Cash and cash equivalents $ 6,746 $ 11,058 Investment securities available for sale 63,968 63,979 Less: Pledged investment securities available for sale (11,515) (13,811)
Unencumbered investment securities available for sale 52,453 50,168
Total liquidity reserves $ 59,199 $ 61,226
The weighted average life of our available-for-sale securities was approximately 5.2 and 4.3 years as of March 31, 2013 and December 31, 2012,
respectively.
See “MD&A—Risk Management” in our 2012 Form 10-K for additional information on our management of liquidity risk.
Funding
Our funding objective is to establish an appropriate maturity profile using a cost-effective mix of both short-term and long-term funds. We use a variety offunding sources, including deposits, short-term borrowings, the issuance of senior and subordinated notes and other borrowings, and, loan securitizationtransactions. In addition, we utilize FHLB advances, which are secured by certain portions of our loan and investment securities portfolios, for our funding needs.
51
(1)
(1)

Table of Contents
Deposits
Our deposits provide a stable and relatively low cost of funds and are our largest source of funding. Table 26 provides a comparison of the composition of ourdeposits, average balances, interest expense and average deposit rates for the first quarter of 2013 and full year 2012.
Table 26: Deposit Composition and Average Deposit Rates Three Months Ended March 31, 2013
(Dollars in millions) Period End
Balance AverageBalance
InterestExpense
% ofAverageDeposits
AverageDeposit
Rate Non-interest bearing $ 21,317 $ 20,943 N/A 9.9% N/A Negotiable order of withdrawal (“NOW”) accounts 43,290 42,213 $ 64 20.0 0.61% Money market deposit accounts 104,415 104,085 163 49.2 0.63 Savings accounts 27,765 27,902 16 13.2 0.23 Other consumer time deposits 10,053 10,658 50 5.0 1.88
Total core deposits 206,840 205,801 293 97.3 0.57 Public fund certificates of deposit of $100,000 or more 48 51 — — — Certificates of deposit of $100,000 or more 4,275 4,344 32 2.1 2.95 Foreign time deposits 1,247 1,359 1 0.6 0.29
Total customer deposits $212,410 $ 211,555 $ 326 100.0% 0.62%
Twelve Months Ended December 31, 2012
(Dollars in millions) Period End
Balance AverageBalance
InterestExpense
% ofAverageDeposits
AverageDeposit
Rate Non-interest bearing $ 22,467 $ 19,741 N/A 9.7% N/A Negotiable order of withdrawal (“NOW”) accounts 40,591 34,179 $ 212 16.8 0.62% Money market deposit accounts 104,540 99,734 684 49.1 0.69 Savings accounts 28,285 30,457 101 15.0 0.33 Other consumer time deposits 11,028 12,762 258 6.4 2.02
Total core deposits 206,911 196,873 1,255 97.0 0.64 Public fund certificates of deposit of $100,000 or more 51 70 — — — Certificates of deposit of $100,000 or more 4,444 4,806 144 2.4 3.00 Foreign time deposits 1,079 1,305 4 0.6 0.31
Total customer deposits $212,485 $203,054 $1,403 100.0% 0.69%
Total customer deposits of $212.4 billion as of March 31, 2013 were relatively unchanged from $212.5 billion as of December 31, 2012. Our deposits includebrokered deposits, which we obtained through the use of third-party intermediaries. Brokered deposits are reported in money market deposit accounts and otherconsumer time deposits in the above table. Brokered deposits totaled $9.3 billion, or 4% of total deposits, as of March 31, 2013. Brokered deposits totaled $10.0billion, or 5% of total deposits, as of December 31, 2012.
The Federal Deposit Insurance Corporation Improvement Act of 1991 limits the use of brokered deposits to “well-capitalized” insured depository institutions and,with a waiver from the Federal Deposit Insurance Corporation, to “adequately capitalized” institutions. COBNA and CONA were “well-capitalized,” as definedunder the federal banking regulatory guidelines, as of both March 31, 2013 and December 31, 2012, and therefore permitted to maintain brokered deposits. Weexpect to replace maturing brokered deposits with new brokered deposits or other sources of funding, which may include branch or direct deposits.
52

Table of Contents
Other Funding Sources
We also access the capital markets to meet our funding needs through the use of federal funds purchased and securities loaned or sold under agreements torepurchase, the issuance of senior and subordinated notes and loan securitization transactions. We regularly participate in the federal funds market daily to takeadvantage of attractive offers and to keep a visible presence in the market, which is intended to ensure that we are able to access the federal funds market in a timeof need. We expect monthly fluctuations in our borrowings, as borrowing amounts are highly dependent on the cash positions of our counterparties. In addition,we may utilize short-term as well as long-term FHLB advances for our funding needs. FHLB advances are secured by certain of our loan portfolios andinvestment securities.
Other debt, which consists of federal funds purchased and securities loaned or sold under agreements to repurchase, senior and subordinated notes and otherborrowings, including junior subordinated debt and FHLB advances, but exclude securitized debt obligations, totaled $26.4 billion as of March 31, 2013, ofwhich $12.2 billion represented short-term borrowings and $14.2 billion represented long-term debt. Other debt decreased $12.1 billion in the first quarter of2013 from a total $38.5 billion as of December 31, 2012, of which $21.1 billion represented short-term borrowings and $17.4 billion represented long-termborrowings.
In the first quarter of 2013, we exchanged $1.2 billion of outstanding 8.80% subordinated notes due 2019. The transaction involved offering current holdersmarket value plus an exchange premium for these outstanding notes, which consideration was paid through a combination of $1.4 billion of new 3.375%subordinated notes due in 2023 and $209 million in cash. The exchange was accounted for as a modification of debt.
In addition, other debt decreased as a result of our redemption of $3.65 billion of our junior subordinated debt on January 2, 2013 in connection with ourredemption of our outstanding trust preferred securities. This decrease was partially offset by the issuance of $850 million in new unsecured senior bank notes.The remaining decrease was due to the maturities of short-term FHLB advances of $12.4 billion, which was partially offset by $3.8 billion of new FHLBborrowings during the quarter.
Table 27 provides information on short-term borrowings, which consist of borrowings with an original contractual maturity of one year or less and, therefore,does not include the current portion of long-term debt. Our short-term borrowings typically have not represented a significant portion of our overall funding.
Table 27: Short-Term Borrowings Three Months Ended March 31, 2013 2012
(Dollars in millions) Outstanding
Amount Interest
Rate
MaximumMonth-EndOutstanding
Amount Outstanding
Amount Interest
Rate
MaximumMonth-EndOutstanding
Amount Average during the period: Federal funds purchased and resale agreements $ 1,109 0.18% $ 1,797 $ 1,335 0.13% $ 1,228 FHLB advances 15,647 0.27 16,600 3,508 0.16 4,500
Total short-term borrowings $ 16,756 0.26% $ 4,843 0.15%
53

Table of Contents
March 31, 2013 December 31, 2012
(Dollars in millions) Amount
WeightedAverageInterest
Rate Amount
WeightedAverageInterest
Rate Period-end balance: Federal funds purchased and resale agreements $ 855 0.31% $ 1,248 0.28% FHLB advances 11,301 0.27 19,900 0.27
Total short-term borrowings $12,156 0.27% $21,148 0.27%
Table 28 displays the maturity profile, based on contractual maturities, of our securitized debt obligations and other debt as of March 31, 2013.
Table 28: Contractual Maturity Profile of Outstanding Debt March 31, 2013
(Dollars in millions) Up to1 Year
> 1 Yearto 2
Years
> 2 Yearsto 3
Years
> 3 Yearsto 4
Years
> 4 Yearsto 5
Years > 5 Years Total Short-term borrowings: Federal funds purchased and securities loaned or
sold under agreements to repurchase $ 855 $ — $ — $ — $ — $ — $ 855 FHLB advances 11,301 — — — — — 11,301
Total short-term borrowings 12,156 — — — — — 12,156
Long-term debt: Securitized debt obligations 3,028 1,598 1,657 2,678 1,837 248 11,046 Senior and subordinated notes:
Unsecured senior debt 2,588 1,661 2,000 252 2,126 1,298 9,925 Unsecured subordinated debt 606 — — 1,162 — 1,562 3,330
Total senior and subordinated notes 3,194 1,661 2,000 1,414 2,126 2,860 13,255
Other long-term borrowings: FHLB advances 32 931 18 20 25 9 1,035
Total long-term debt 6,254 4,190 3,675 4,112 3,988 3,117 25,336
Total short-term borrowings and long-term debt $18,410 $4,190 $ 3,675 $ 4,112 $ 3,988 $ 3,117 $37,492
Percentage of total 49% 11% 10% 11% 11% 8% 100%
Includes unamortized discounts, premiums and other cost basis adjustments, which together result in a net reduction of $254 million as of March 31, 2013.
We provide additional information on our short-term borrowings and long-term debt in “Note 8—Deposits and Borrowings.”
Borrowing Capacity
Under our shelf registration filed with the U.S. Securities and Exchange Commission (“SEC”) on April 30, 2012, from time to time, we may offer and sell anindeterminate aggregate amount of senior or subordinated debt securities, preferred stock, depository shares, common stock, purchase contracts, warrants andunits. There is no limit under this shelf registration statement to the amount or number of such securities that we may offer and sell, subject to market conditions.Our current shelf registration will expire three years from the filing date.
54
(1)
(1)

Table of Contents
In addition to issuance capacity under the shelf registration statement, we also have access to FHLB Advances with a maximum borrowing capacity of $39.6billion as of March 31, 2013. This borrowing capacity was secured by posting $32.0 billion of loans and $7.6 billion of securities as collateral. We had $12.6billion outstanding as of March 31, 2013, and $27.0 billion still available to us to borrow against under this program. This funding source is non-revolving andfunding availability is subject to market conditions. Our FHLB membership and borrowings are secured by our investment in FHLB stock, which totaled $819million and $1.3 billion as of March 31, 2013 and December 31, 2012, respectively.
Credit Ratings
Our credit ratings have a significant impact on our ability to access capital markets and our borrowing costs. Rating agencies base their ratings on numerousfactors, including liquidity, capital adequacy, asset quality, quality of earnings and the probability of systemic support. Significant changes in these factors couldresult in different ratings. Such ratings help to support our cost effective unsecured funding as part of our overall financing programs. Table 29 provides asummary of the credit ratings for the senior unsecured debt of Capital One Financial Corporation, COBNA and CONA as of March 31, 2013 and December 31,2012.
Table 29: Senior Unsecured Debt Credit Ratings March 31, 2013 December 31, 2012
Capital OneFinancial
Corporation
Capital OneBank (USA),
N.A. Capital One,
N.A.
Capital OneFinancial
Corporation
Capital OneBank (USA),
N.A. Capital One,
N.A. Moody’s Baa1 A3 A3 Baa1 A3 A3 S&P BBB BBB+ BBB+ BBB BBB+ BBB+ Fitch A- A- A- A- A- A-
As of April 30, 2013, Moody’s and Fitch had us on a stable outlook, while S&P had us on negative outlook. MARKET RISK PROFILE Market risk is inherent in the financial instruments associated with our operations and activities, including loans, deposits, securities, short-term borrowings, long-term debt and derivatives. Below we provide additional information about our primary sources of market risk, our market risk management strategies andmeasures used to evaluate our market risk exposure.
Primary Market Risk Exposures
Our primary sources of market risk include interest rate risk and foreign exchange risk.
Interest Rate Risk
Interest rate risk, which represents exposure to instruments whose yield or price varies with the level or volatility of interest rates, is our most significant source ofmarket risk exposure. Banks are inevitably exposed to interest rate risk due to differences in the timing between the maturities or repricing of assets and liabilities.
Foreign Exchange Risk
Foreign exchange risk represents exposure to changes in the values of current holdings and future cash flows denominated in other currencies. We are exposed tochanges in foreign exchange rates, which may impact the earnings of our foreign operations. We monitor and manage our material foreign currency denominated
55

Table of Contents
transactions and exposures through the use of derivatives to limit our earnings sensitivity exposure to foreign exchange risk. The estimated reduction in our 12-month earnings due to adverse foreign exchange rate movements corresponding to a 95% probability was less than 2.0% as of March 31, 2013 and December 31,2012. The precision of this estimate is limited due to the inherent uncertainty of the underlying forecast assumptions.
Market Risk Management
We employ several techniques to manage our interest rate and foreign exchange risk, which include, but are not limited to, changing the maturity and re-pricingcharacteristics of our various assets and liabilities. Derivatives are one of the primary tools we use in managing interest rate and foreign exchange risk. Ourcurrent asset/liability management policy includes the use of derivatives to hedge material foreign currency denominated transactions to limit our earningsexposure to foreign exchange risk. We execute our derivative contracts in both over-the-counter and exchange-traded derivative markets. Although the majority ofour derivatives are interest rate swaps, we also use a variety of other derivative instruments, including caps, floors, options, futures and forward contracts, tomanage our interest rate and foreign currency risk. The outstanding notional amount of our derivative contracts totaled $59.6 billion as of March 31, 2013,compared with $57.8 billion as of December 31, 2012.
Market Risk Measurement
We have prescribed risk management policies and limits established by our Asset/Liability Management Committee and approved by the Finance Committee ofthe Board. Our objective is to manage our asset/liability risk position and exposure to market risk in accordance with these policies and prescribed limits based onprevailing market conditions and long-term expectations. Because no single measure can reflect all aspects of market risk, we use various industry standardmarket risk measurement techniques and analyses to measure, assess and manage the impact of changes in interest rates and foreign exchange rates on ourearnings and the economic value of equity.
We consider the impact on both earnings and economic value of equity in measuring and managing our interest rate risk. In December 2008, the federal funds ratewas lowered to near zero and it has remained in a target range of zero to 0.25%. In 2008, we temporarily revised our customary declining interest rate scenario of200 basis points to a 50 basis point decrease, except in scenarios where a 50 basis point decline would result in a rate less than 0% (in which case we assume arate scenario of 0%), in response to the low rate environment because a scenario where interest rates would decline by 200 basis points was not plausible. Belowwe discuss the assumptions used in calculating each of these measures.
Earnings Sensitivity
Our earnings sensitivity measure estimates the impact on our projected 12-month base-line adjusted net interest income resulting from movements in interestrates. Adjusted net interest income consists of net interest income adjusted to include changes in the fair value of mortgage servicing rights, including relatedderivative hedging activity, and changes in the fair value of free-standing interest rate swaps. We recently revised two assumptions used to calculate our earningssensitivity measures. First, in addition to our existing assets and liabilities, we now incorporate expected future business growth assumptions, such as loan anddeposit growth and pricing, and plans for projected changes in our funding mix in our baseline forecast. We previously based our earnings sensitivity measure onthe anticipated run-off of our existing assets and liabilities. Second, we revised the interest rate scenario used to measure and evaluate the impact on the baselineforecast to assess our earnings sensitivity. In measuring the sensitivity of interest rate movements on our adjusted projected net interest income, we assume aninstantaneous plus or minus 200 basis point shock, with the lower rate scenario limited to zero as described above. We previously assumed a hypothetical gradualincrease or decrease of 200 basis points relative to implied forward rates over the next twelve months with the lower rate scenario limited as discussed above.
56

Table of Contents
Economic Value of Equity
Our economic value of equity sensitivity measure estimates the impact on the net present value of our assets and liabilities, including derivative hedging activity,resulting from movements in interest rates. Our economic value of equity sensitivity measures are calculated based on our existing assets and liabilities, includingderivatives, and do not incorporate business growth assumptions or projected plans for funding mix changes. In measuring the sensitivity of interest ratemovements on our economic value of equity, we assume a hypothetical instantaneous parallel shift in the level of interest rates of plus 200 basis points and minus50 basis points to spot rates.
Table 30 shows the estimated percentage impact on our projected base-line adjusted net interest income and economic value of equity, calculated under thehypothetical interest rate scenarios described above, as of March 31, 2013 and December 31, 2012. We will continue to factor into our interest rate riskmanagement decisions the potential impact of alternative interest rate scenarios, such as stressed rate shocks as well as steepening and flattening yield curvescenarios, for our sensitivity measures.
Table 30: Interest Rate Sensitivity Analysis
(Dollars in millions) March 31,
2013 December 31,
2012 Impact on projected base-line adjusted net interest income:
+200 basis points 2.3% 2.7% –50 basis points (1.6) (1.7)
Impact on economic value of equity: +200 basis points (3.7) (3.1) –50 basis points (0.6) (1.4)
Our interest rate sensitivity measures reflect that we became less asset sensitive between December 31, 2012 and March 31, 2013. Our projected net interestincome and economic value of equity sensitivity measures were within our prescribed asset/liability policy limits as of March 31, 2013 and December 31, 2012.
Limitations of Market Risk Measures
The interest rate risk models that we use in deriving these measures incorporate contractual information, internally-developed assumptions and proprietarymodeling methodologies, which project borrower and deposit behavior patterns in certain interest rate environments. Other market inputs, such as interest rates,market prices and interest rate volatility, are also critical components of our interest rate risk measures. We regularly evaluate, update and enhance theseassumptions, models and analytical tools as we believe appropriate to reflect our best assessment of the market environment and the expected behavior patterns ofour existing assets and liabilities.
There are inherent limitations in any methodology used to estimate the exposure to changes in market interest rates. The above sensitivity analyses contemplateonly certain movements in interest rates and are performed at a particular point in time based on the existing balance sheet and, in some cases, expected futurebusiness growth and funding mix assumptions. The strategic actions that management may take to manage our balance sheet may differ significantly from ourprojections, which could cause our actual earnings and economic value of equity sensitivities to differ substantially from the above sensitivity analyses.
57

Table of Contents
SUPERVISION AND REGULATION In January 2013, the Consumer Finance Protection Bureau (“CFPB”) issued several final rules pursuant to the Dodd-Frank Act that provide additional disclosurerequirements and substantive limitations on our mortgage lending activities. These rules, including the Ability-to-Repay and Qualified Mortgage Standards Underthe Truth in Lending Act (Regulation Z), could impact the type and amount of mortgage loans we offer, though we do not expect the regulations to have amaterial financial impact on us.
We provide information on our supervision and regulation in our 2012 Form 10-K under “Part I—Item 1. Business—Supervision and Regulation.” FORWARD-LOOKING STATEMENTS From time to time, we have made and will make forward-looking statements, including those that discuss, among other things, strategies, goals, outlook or othernon-historical matters; projections, revenues, income, expenses, capital measures, returns, accruals for claims in litigation and for other claims against us;earnings per share or other financial measures for us; future financial and operating results; our plans, objectives, expectations and intentions; the projectedimpact and benefits of the ING Direct and 2012 U.S. card acquisitions (collectively, the “Acquisitions”) and the sale of the Best Buy loan portfolio (the “SaleTransaction”); and the assumptions that underlie these matters.
To the extent that any such information is forward-looking, it is intended to fit within the safe harbor for forward-looking information provided by the PrivateSecurities Litigation Reform Act of 1995. Numerous factors could cause our actual results to differ materially from those described in such forward-lookingstatements, including, among other things:
• general economic and business conditions in the U.S., the U.K., Canada and our local markets, including conditions affecting employment levels, interest
rates, consumer income and confidence, spending and savings that may affect consumer bankruptcies, defaults, charge-offs and deposit activity;
• an increase or decrease in credit losses (including increases due to a worsening of general economic conditions in the credit environment);
• financial, legal, regulatory, tax or accounting changes or actions, including the impact of the Dodd-Frank Wall Street Reform and Consumer Protection Act
and the regulations promulgated thereunder, regulations governing bank capital and liquidity standards, including Basel-related initiatives and potentialchanges to financial accounting and reporting standards;
• the possibility that we may not fully realize the projected cost savings and other projected benefits of the Acquisitions;
• difficulties and delays in integrating the assets and businesses acquired in the Acquisitions;
• business disruption following the Acquisitions;
• diversion of management time on issues related to the Acquisitions, including integration of the assets and businesses acquired;
• reputational risks and the reaction of customers and counterparties to the Acquisitions;
• disruptions relating to the Acquisitions negatively impacting our ability to maintain relationships with customers, employees and suppliers;
• changes in asset quality and credit risk as a result of the Acquisitions;
• the possibility that conditions to the Sale Transaction are not received or satisfied on a timely basis or at all;
58

Table of Contents
• the possibility that modifications to the terms of the Sale Transaction may be required in order to obtain or satisfy such conditions;
• changes in the anticipated timing for closing the Sale Transaction;
• developments, changes or actions relating to any litigation matter involving us;
• the inability to sustain revenue and earnings growth;
• increases or decreases in interest rates;
• our ability to access the capital markets at attractive rates and terms to capitalize and fund our operations and future growth;
• the success of our marketing efforts in attracting and retaining customers;
• increases or decreases in our aggregate loan balances or the number of customers and the growth rate and composition thereof, including increases or
decreases resulting from factors such as shifting product mix, amount of actual marketing expenses we incur and attrition of loan balances;
• the level of future repurchase or indemnification requests we may receive, the actual future performance of mortgage loans relating to such requests, the
success rates of claimants against us, any developments in litigation and the actual recoveries we may make on any collateral relating to claims against us;
• the amount and rate of deposit growth;
• changes in the reputation of or expectations regarding the financial services industry or us with respect to practices, products or financial condition;
• any significant disruption in our operations or technology platform;
• our ability to maintain a compliance infrastructure suitable for the nature of our business;
• our ability to control costs;
• the amount of, and rate of growth in, our expenses as our business develops or changes or as it expands into new market areas;
• our ability to execute on our strategic and operational plans;
• any significant disruption of, or loss of public confidence in, the United States Mail service affecting our response rates and consumer payments;
• any significant disruption of, or loss of public confidence in, the internet affecting the ability of our customers to access their accounts and conduct banking
transactions;
• our ability to recruit and retain experienced personnel to assist in the management and operations of new products and services;
• changes in the labor and employment markets;
• fraud or misconduct by our customers, employees or business partners;
• competition from providers of products and services that compete with our businesses; and
• other risk factors listed from time to time in reports that we file with the SEC.
Any forward-looking statements made by us or on our behalf speak only as of the date they are made or as of the date indicated, and we do not undertake anyobligation to update forward-looking statements as a result of new information, future events or otherwise. You should carefully consider the factors discussedabove in evaluating these forward-looking statements. For additional information on factors that could materially influence forward-looking statements includedin this Report, see the risk factors set forth under “Part II—Item 1A. Risk Factors” in this Report and in “Part I—Item 1A. Risk Factors” in our 2012 Form 10-K.
59

Table of Contents
SUPPLEMENTAL TABLES Table A—Reconciliation of Non-GAAP Measures and Calculation of Regulatory Capital Measures Under Basel I
March 31,2013
December 31,
2012 (Dollars in millions) Stockholders’ equity to non-GAAP tangible common equity Total stockholders’ equity $ 41,296 $ 40,499 Less: Goodwill and other intangible assets (15,992) (16,224) Noncumulative perpetual preferred stock (853) (853)
Tangible common equity $ 24,451 $ 23,422
Total assets to tangible assets Total assets $300,163 $312,918 Less: Assets from discontinued operations (309) (309)
Total assets from continuing operations 299,854 312,609 Less: Goodwill and other intangible assets (15,992) (16,224)
Tangible assets $283,862 $296,385
Non-GAAP TCE ratio Tangible common equity $ 24,451 $ 23,422 Tangible assets 283,862 296,385 TCE ratio 8.61% 7.90%Regulatory capital ratios Total stockholders’ equity $ 41,296 $ 40,499 Less: Net unrealized gains on investment securities available for sale recorded in AOCI (583) (712) Net losses on cash flow hedges recorded in AOCI 15 2 Disallowed goodwill and other intangible assets (14,361) (14,428) Disallowed deferred tax assets — — Noncumulative perpetual preferred stock (853) (853) Other (4) (12)
Tier 1 common capital 25,510 24,496 Plus: Noncumulative perpetual preferred stock 853 853 Tier 1 restricted core capital items 1 2
Tier 1 capital 26,364 25,351
Plus: Long-term debt qualifying as Tier 2 capital 2,121 2,119 Qualifying allowance for loan and lease losses 2,738 2,830 Other Tier 2 components 11 13
Tier 2 capital 4,870 4,962
Total risk-based capital $ 31,234 $ 30,313
Risk-weighted assets $216,458 $223,472
Tier 1 common ratio 11.79% 10.96%Tier 1 risk-based capital ratio 12.18 11.34 Total risk-based capital ratio 14.43 13.56
Includes impact from related deferred taxes. Noncumulative perpetual preferred stock qualifies as Tier 1 capital; however, it does not qualify as Tier 1 common capital. Calculated based on tangible common equity divided by tangible assets. Amounts presented are net of tax. Disallowed goodwill and other intangible assets are net of related deferred tax liability. Consists primarily of trust preferred securities. Total risk-based capital equals the sum of Tier 1 capital and Tier 2 capital. Calculated based on prescribed regulatory guidelines. Tier 1 common ratio is a regulatory capital measure calculated based on Tier 1 common capital divided by risk-weighted assets. Tier 1 risk-based capital ratio is a regulatory capital measure calculated based on Tier 1 capital divided by risk-weighted assets. Total risk-based capital ratio is a regulatory capital measure calculated based on total risk-based capital divided by risk-weighted assets.
60
(1)
(1)
(3)
(4)
(4)
(5)
(2)
(2)
(6)
(7)
(8)
(9)
(10)
(11)
(1)(2)(3)(4)(5)(6)(7)(8)(9)(10)(11)

Table of Contents
Item 1. Financial Information and Supplementary Data Page Financial Statements 61
Condensed Consolidated Statements of Income 62 Condensed Consolidated Statements of Comprehensive Income 63 Condensed Consolidated Balance Sheets 64 Condensed Consolidated Statements of Changes in Stockholders’ Equity 65 Condensed Consolidated Statements of Cash Flows 66 Notes to Condensed Consolidated Financial Statements 67
Note 1 — Summary of Significant Accounting Policies 67 Note 2 — Discontinued Operations 69 Note 3 — Investment Securities 70 Note 4 — Loans 80 Note 5 — Allowance for Loan and Lease Losses 101 Note 6 — Variable Interest Entities and Securitizations 104 Note 7 — Goodwill and Other Intangible Assets 109 Note 8 — Deposits and Borrowings 110 Note 9 — Derivative Instruments and Hedging Activities 113 Note 10 — Stockholders’ Equity 119 Note 11 — Earnings Per Common Share 121 Note 12 — Fair Value of Financial Instruments 122 Note 13 — Business Segments 136 Note 14 — Commitments, Contingencies and Guarantees 138
61

Table of Contents
CAPITAL ONE FINANCIAL CORPORATIONCONDENSED CONSOLIDATED STATEMENTS OF INCOME (UNAUDITED)
Three Months Ended March 31, (Dollars in millions, except per share-related data) 2013 2012 Interest income: Loans, including loans held for sale $ 4,649 $ 3,657 Investment securities 374 298 Other 28 24
Total interest income 5,051 3,979
Interest expense: Deposits 326 311 Securitized debt obligations 56 80 Senior and subordinated notes 82 88 Other borrowings 17 86
Total interest expense 481 565
Net interest income 4,570 3,414 Provision for credit losses 885 573
Net interest income after provision for credit losses 3,685 2,841
Non-interest income: Service charges and other customer-related fees 550 415 Interchange fees, net 445 328 Total other-than-temporary impairment (6) (4) Less: Portion of other-than-temporary impairment recorded in AOCI (19) (10)
Net other-than-temporary impairment recognized in earnings (25) (14) Bargain purchase gain 0 594 Other 11 198
Total non-interest income 981 1,521
Non-interest expense: Salaries and associate benefits 1,080 864 Occupancy and equipment 350 270 Marketing 317 321 Professional services 307 293 Communications and data processing 210 172 Amortization of intangibles 177 62 Acquisition-related 46 86 Other 541 436
Total non-interest expense 3,028 2,504
Income from continuing operations before income taxes 1,638 1,858 Income tax provision 494 353
Income from continuing operations, net of tax 1,144 1,505 Loss from discontinued operations, net of tax (78) (102)
Net income 1,066 1,403 Dividends and undistributed earnings allocated to participating securities (5) (7) Preferred stock dividends (13) 0
Net income available to common stockholders $ 1,048 $ 1,396
Basic earnings per common share: Income from continuing operations $ 1.94 $ 2.94 Loss from discontinued operations (0.13) (0.20)
Net income per basic common share $ 1.81 $ 2.74
Diluted earnings per common share: Income from continuing operations $ 1.92 $ 2.92 Loss from discontinued operations (0.13) (0.20)
Net income per diluted common share $ 1.79 $ 2.72
Dividends paid per common share $ 0.05 $ 0.05
See Notes to Condensed Consolidated Financial Statements.
62
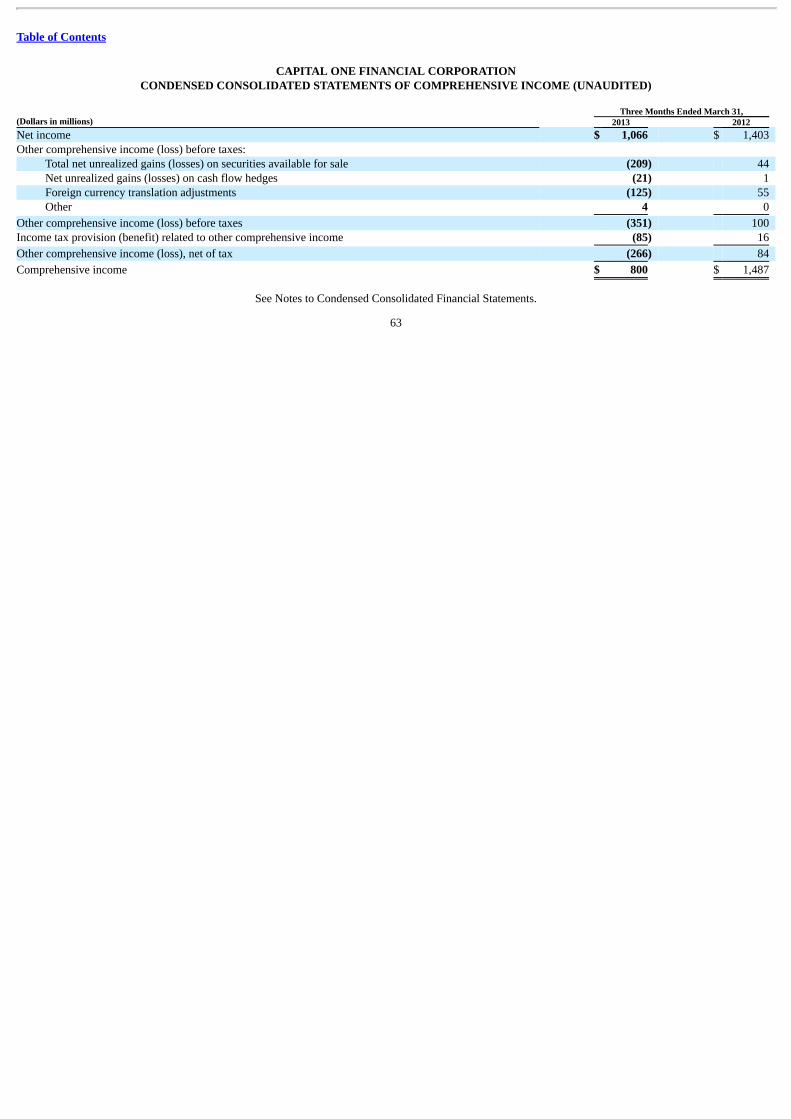
Table of Contents
CAPITAL ONE FINANCIAL CORPORATIONCONDENSED CONSOLIDATED STATEMENTS OF COMPREHENSIVE INCOME (UNAUDITED)
Three Months Ended March 31, (Dollars in millions) 2013 2012 Net income $ 1,066 $ 1,403 Other comprehensive income (loss) before taxes:
Total net unrealized gains (losses) on securities available for sale (209) 44 Net unrealized gains (losses) on cash flow hedges (21) 1 Foreign currency translation adjustments (125) 55 Other 4 0
Other comprehensive income (loss) before taxes (351) 100 Income tax provision (benefit) related to other comprehensive income (85) 16
Other comprehensive income (loss), net of tax (266) 84
Comprehensive income $ 800 $ 1,487
See Notes to Condensed Consolidated Financial Statements.
63

Table of Contents
CAPITAL ONE FINANCIAL CORPORATIONCONDENSED CONSOLIDATED BALANCE SHEETS (UNAUDITED)
March 31, December 31, (Dollars in millions, except per share data) 2013 2012 Assets: Cash and cash equivalents:
Cash and due from banks $ 1,947 $ 3,440 Interest-bearing deposits with banks 4,563 7,617 Federal funds sold and securities purchased under agreements to resell 236 1
Total cash and cash equivalents 6,746 11,058 Restricted cash for securitization investors 1,018 428 Securities available for sale, at fair value 63,968 63,979 Loans held for investment:
Unsecuritized loans held for investment, at amortized cost 150,721 162,059 Restricted loans for securitization investors 40,612 43,830
Total loans held for investment 191,333 205,889 Less: Allowance for loan and lease losses (4,606) (5,156)
Net loans held for investment 186,727 200,733 Loans held for sale, at lower of cost or fair value 6,410 201 Premises and equipment, net 3,736 3,587 Interest receivable 1,378 1,694 Goodwill 13,900 13,904 Other 16,280 17,334
Total assets $300,163 $ 312,918
Liabilities: Interest payable $ 310 $ 450 Customer deposits:
Non-interest bearing deposits 21,317 22,467 Interest bearing deposits 191,093 190,018
Total customer deposits 212,410 212,485 Securitized debt obligations 11,046 11,398 Other debt:
Federal funds purchased and securities loaned or sold under agreements to repurchase 855 1,248 Senior and subordinated notes 13,255 12,686 Other borrowings 12,336 24,578
Total other debt 26,446 38,512 Other liabilities 8,655 9,574
Total liabilities 258,867 272,419
Commitments, contingencies and guarantees (see Note 14) Stockholders’ equity: Preferred stock, par value $.01 per share; 50,000,000 shares authorized; 875,000 shares issued and outstanding as of
March 31, 2013 and December 31, 2012 0 0 Common stock, par value $.01 per share; 1,000,000,000 shares authorized; 634,080,553 and 631,806,585 shares issued as of
March 31, 2013 and December 31, 2012, respectively, and 583,982,235 and 582,207,133 shares outstanding as ofMarch 31, 2013 and December 31, 2012, respectively 6 6
Additional paid-in capital, net 26,256 26,188 Retained earnings 17,876 16,853 Accumulated other comprehensive income 473 739 Less: Treasury stock, at cost; par value $.01 per share; 50,098,318 and 49,599,452 shares as of March 31, 2013 and
December 31, 2012, respectively (3,315) (3,287)
Total stockholders’ equity 41,296 40,499
Total liabilities and stockholders’ equity $300,163 $ 312,918
See Notes to Condensed Consolidated Financial Statements.
64
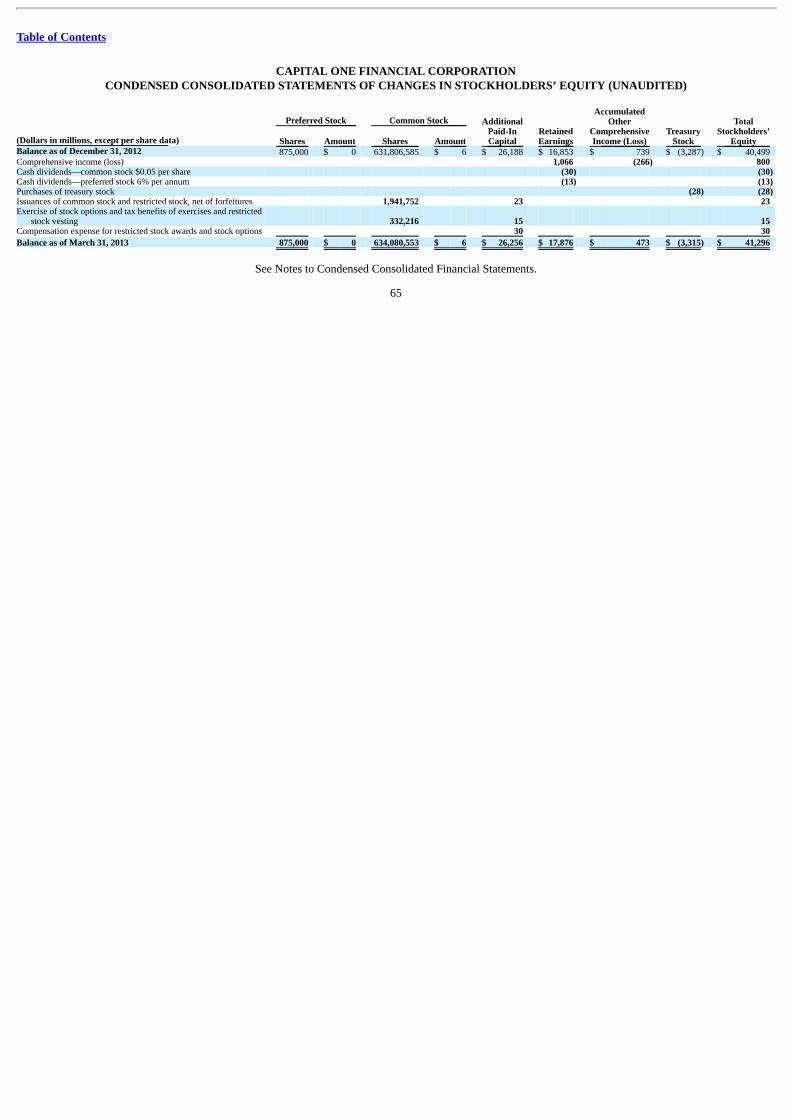
Table of Contents
CAPITAL ONE FINANCIAL CORPORATIONCONDENSED CONSOLIDATED STATEMENTS OF CHANGES IN STOCKHOLDERS’ EQUITY (UNAUDITED)
(Dollars in millions, except per share data)
Preferred Stock Common Stock AdditionalPaid-InCapital
RetainedEarnings
Accumulated
OtherComprehensiveIncome (Loss)
Treasury
Stock
TotalStockholders’
Equity Shares Amount Shares Amount Balance as of December 31, 2012 875,000 $ 0 631,806,585 $ 6 $ 26,188 $ 16,853 $ 739 $ (3,287) $ 40,499 Comprehensive income (loss) 1,066 (266) 800 Cash dividends—common stock $0.05 per share (30) (30) Cash dividends—preferred stock 6% per annum (13) (13) Purchases of treasury stock (28) (28) Issuances of common stock and restricted stock, net of forfeitures 1,941,752 23 23 Exercise of stock options and tax benefits of exercises and restricted
stock vesting 332,216 15 15 Compensation expense for restricted stock awards and stock options 30 30
Balance as of March 31, 2013 875,000 $ 0 634,080,553 $ 6 $ 26,256 $ 17,876 $ 473 $ (3,315) $ 41,296
See Notes to Condensed Consolidated Financial Statements.
65

Table of Contents
CAPITAL ONE FINANCIAL CORPORATIONCONDENSED CONSOLIDATED STATEMENTS OF CASH FLOWS (UNAUDITED)
Three Months Ended March 31, (Dollars in millions) 2013 2012 Operating activities: Income from continuing operations, net of tax $ 1,144 $ 1,505 Loss from discontinued operations, net of tax (78) (102)
Net income 1,066 1,403
Adjustments to reconcile net income to cash provided by operating activities: Provision for credit losses 885 573 Depreciation and amortization, net 341 220 Net gains on sales of securities available for sale (2) (11) Impairment losses on securities available for sale 25 14 Bargain purchase gain 0 (594) Loans held for sale:
Originations (266) (489) (Gains) losses on sales (10) (16) Proceeds from sales and paydowns 803 450
Stock plan compensation expense 54 63 Changes in operating assets and liabilities, net of effects of acquisitions:
(Increase) decrease in interest receivable 316 42 (Increase) decrease in other assets 608 684 Increase (decrease) in interest payable (140) (82) Increase (decrease) in other liabilities (778) (572)
Net cash (used in) provided by operating activities attributable to discontinued operations (108) 152
Net cash provided by operating activities 2,794 1,837
Investing activities: Increase in restricted cash for securitization investors (590) (299) Purchases of securities available for sale (5,921) (4,007) Proceeds from paydowns and maturities of securities available for sale 4,877 4,839 Proceeds from sales of securities available for sale 720 7,337 Net (increase) decrease in loans held for investment 5,875 904 Principal recoveries of loans previously charged off 417 406 Additions of premises and equipment (236) (156) Net cash paid for acquisitions 0 13,740
Net cash provided by (used in) investing activities 5,142 22,764
Financing activities: Net increase in deposits (76) 3,877 Issuance of securitized debt obligation 750 0 Maturities and paydowns of securitized debt obligations (1,102) (1,053) Issuance of senior and subordinated notes 638 1,250 Redemption of junior subordinated debentures (3,641) 0 Maturities and redemptions of senior and subordinate notes 210 (282) Net increase (decrease) in other borrowings (8,994) (6,713) Net proceeds from issuances of common stock 23 3,188 Proceeds from share-based payment activities 15 16 Dividends paid on common stock (30) (24) Dividends paid on preferred stock (13) 0 Purchases of treasury stock (28) (42)
Net cash provided by (used in) financing activities (12,248) 217
Increase (decrease) in cash and cash equivalents (4,312) 24,818 Cash and cash equivalents at beginning of the period 11,058 5,838
Cash and cash equivalents at end of the period $ 6,746 $ 30,656
Supplemental cash flow information: Non-cash items:
Fair value of common stock issued in business acquisition $ 0 $ 2,638 Net transfers of loans held for investment to loans held for sale 6,738 4 Redemption of subordinated note (1,206) 0 Issuance of subordinated note 1,206 0
See Notes to Condensed Consolidated Financial Statements.
66

Table of Contents
CAPITAL ONE FINANCIAL CORPORATIONNOTES TO CONDENSED CONSOLIDATED FINANCIAL STATEMENTS (UNAUDITED)
NOTE 1—SUMMARY OF SIGNIFICANT ACCOUNTING POLICIES The Company
Capital One Financial Corporation, a Delaware Corporation established in 1995 and headquartered in McLean, Virginia, is a diversified financial services holdingcompany with banking and non-banking subsidiaries. Capital One Financial Corporation and its subsidiaries (the “Company”) offer a broad array of financialproducts and services to consumers, small businesses and commercial clients through branches, the internet and other distribution channels. As of March 31,2013, our principal subsidiaries included:
• Capital One Bank (USA), National Association (“COBNA”), which currently offers credit and debit card products, other lending products and depositproducts; and
• Capital One, National Association (“CONA”), which offers a broad spectrum of banking products and financial services to consumers, small businessesand commercial clients.
The Company and its subsidiaries are hereafter collectively referred to as “we”, “us” or “our.” CONA and COBNA are collectively referred to as the “Banks.”
We also offer products outside of the United States principally through Capital One (Europe) plc (“COEP”), an indirect subsidiary of COBNA organized andlocated in the United Kingdom (the “U.K.”), and through a branch of COBNA in Canada. COEP has authority, among other things, to provide credit card andinstallment loans. Our branch of COBNA in Canada has the authority to provide credit card loans.
On February 17, 2012, we completed the acquisition (the “ING Direct acquisition”) of substantially all of the ING Direct business in the United States (“INGDirect”) from ING Groep N.V., ING Bank N.V., ING Direct N.V. and ING Direct Bancorp. The ING Direct acquisition resulted in the addition of loans of$40.4 billion, other assets of $53.9 billion and deposits of $84.4 billion as of the acquisition date.
On May 1, 2012, pursuant to the agreement with HSBC Finance Corporation, HSBC USA Inc. and HSBC Technology and Services (USA) Inc. (collectively,“HSBC”), we closed the acquisition of substantially all of the assets and assumed liabilities of HSBC’s credit card and private-label credit card business in theUnited States (other than the HSBC Bank USA, National Association consumer credit card program and certain other retained assets and liabilities) (the “2012U.S. card acquisition,” which we sometimes refer to as the “HSBC U.S. card acquisition”). The 2012 U.S. card acquisition included (i) the acquisition of HSBC’sU.S. credit card portfolio, (ii) its on-going private label and co-branded partnerships, and (iii) other assets, including infrastructure and capabilities. At closing, weacquired approximately 27 million new active accounts, $27.8 billion in outstanding credit card receivables designated as held for investment and $327 million inother net assets.
Operations and Business Segments
Our principal operations are currently organized for management reporting purposes into three primary business segments, which are defined primarily based onthe products and services provided or the type of customer served: Credit Card, Consumer Banking and Commercial Banking. The operations of acquiredbusinesses have been integrated into our existing business segments. See “Note 13—Business Segments” for additional information.
67

Table of Contents
CAPITAL ONE FINANCIAL CORPORATIONNOTES TO CONDENSED CONSOLIDATED FINANCIAL STATEMENTS (UNAUDITED)—(Continued)
Basis of Presentation and Use of Estimates
The accompanying unaudited condensed consolidated financial statements have been prepared in accordance with generally accepted accounting principles in theU.S. (“U.S. GAAP”) for interim financial information and should be read in conjunction with the audited consolidated financial statements in our Annual Reporton Form 10-K for the year ended December 31, 2012 (the “2012 Form 10-K”). Certain financial information that is normally included in the annual financialstatements in accordance with U.S. GAAP, but is not required for interim reporting purposes, has been condensed or omitted. In the opinion of management, alladjustments necessary for a fair presentation of our interim unaudited financial statements are reflected.
The preparation of financial statements in conformity with U.S. GAAP requires management to make estimates and assumptions that affect the amounts reportedin the unaudited condensed consolidated financial statements and related disclosures. These estimates are based on information available as of the date of theunaudited condensed consolidated financial statements. While management makes its best judgment, actual amounts or results could differ from these estimates.Interim period results may not be indicative of results for the full year.
Principles of Consolidation
The unaudited condensed consolidated financial statements include the accounts of Capital One Financial Corporation and all other entities in which we have acontrolling financial interest. All significant intercompany accounts and transactions have been eliminated. Certain prior period amounts have been reclassified toconform to the current period presentation.
Significant Accounting Policies
We provide a summary of our significant accounting policies in our 2012 Form 10-K under “Notes to Consolidated Financial Statements—Note 1—Summary ofSignificant Accounting Policies.” There have been no significant changes to these policies during 2013 other than as disclosed in “Note 5—Allowance for Loanand Lease Losses,” which provides details on our change in our process for estimating the allowance for loan losses and reserve for unfunded lendingcommitments for our commercial loan portfolio. Below we describe accounting standards that we adopted in 2013 and recently issued accounting standards thatwe have not yet adopted.
Accounting Standards Adopted in 2013
Comprehensive Income: Reporting of Amounts Reclassified Out of Accumulated Other Comprehensive Income
In February 2013, the Financial Accounting Standards Board (“FASB”) issued new guidance requiring an entity to report the effect of significant reclassificationsout of accumulated other comprehensive income on the respective line items in net income if the amount being reclassified is required under U.S. GAAP to bereclassified in its entirety to net income. For other amounts that are not required under U.S. GAAP to be reclassified in their entirety to net income in the samereporting period, an entity is required to cross-reference other disclosures required under U.S. GAAP that provide additional detail about those amounts. The newguidance does not change the items which must be reported in other comprehensive income, how such items are measured or when they must be reclassified fromother comprehensive income to net income. The information must be presented either on the face of the consolidated statement of comprehensive income or in thenotes. The guidance was effective for reporting periods beginning after December 15, 2012. Our adoption of the guidance on January 1, 2013 had no impact onour financial condition, results of operations or liquidity as it only affects our disclosures. See “Note 10—Stockholders’ Equity” for further details.
68

Table of Contents
CAPITAL ONE FINANCIAL CORPORATIONNOTES TO CONDENSED CONSOLIDATED FINANCIAL STATEMENTS (UNAUDITED)—(Continued)
Offsetting Financial Assets and Liabilities
In December 2011, the FASB issued guidance intended to enhance current disclosure requirements on offsetting financial assets and liabilities. The newdisclosures will enable financial statement users to compare balance sheets prepared under U.S. GAAP and IFRS, which are subject to different offsetting models.Upon adoption, entities will be required to disclose both gross and net information about instruments and transactions eligible for offset in the balance sheet aswell as instruments and transactions subject to an agreement similar to a master netting arrangement. The disclosures will be required irrespective of whether suchinstruments are presented gross or net on the balance sheet. The guidance was effective for annual and interim reporting periods beginning on or after January 1,2013, with comparative retrospective disclosures required for all periods presented. Our adoption of the guidance had no effect on our financial condition, resultsof operations or liquidity as it only affects our disclosures. See “Note 9—Derivatives Instruments and Hedging Activities” for further details.
Recently Issued but Not Yet Adopted Accounting Standards
Obligations Resulting from Joint and Several Liability Arrangements
In February 2013, the FASB issued guidance for the recognition, measurement, and disclosure of obligations resulting from joint and several liabilityarrangements for which the total amount of the obligation within the scope of this guidance is fixed at the reporting date, except for obligations addressed withinexisting guidance in U.S. GAAP. The guidance requires an entity to measure obligations as the sum of the amount the reporting entity agreed to pay on the basisof its arrangement among its co-obligors and any additional amount the reporting entity expects to pay on behalf of its co-obligors. The guidance also requires anentity to disclose the nature and amount of the obligation as well as other information about those obligations. The guidance is effective for annual and interimperiods beginning after December 15, 2013, with early adoption permitted. We are currently evaluating the impact of the guidance. NOTE 2—DISCONTINUED OPERATIONS Shutdown of Mortgage Origination Operations of our Wholesale Mortgage Banking Unit
In the third quarter of 2007, we closed the mortgage origination operations of our wholesale mortgage banking unit, GreenPoint Mortgage Funding Inc.(“GreenPoint”), which was acquired by us in December 2006 as part of the North Fork acquisition. The results of the wholesale banking unit have been accountedfor as a discontinued operation and are therefore not included in our results from continuing operations for the three months ended March 31, 2013 and 2012. Wehave no significant continuing involvement in these operations.
The following table summarizes the results from discontinued operations related to the closure of our wholesale mortgage banking unit: Three Months Ended March 31, (Dollars in millions) 2013 2012 Non-interest expense, net $ (125) $ (161)
Loss from discontinued operations before taxes (125) (161) Income tax benefit (47) (59)
Loss from discontinued operations $ (78) $ (102)
69

Table of Contents
CAPITAL ONE FINANCIAL CORPORATIONNOTES TO CONDENSED CONSOLIDATED FINANCIAL STATEMENTS (UNAUDITED)—(Continued)
The loss from discontinued operations includes an expense of $107 million ($67 million net of tax) and $153 million ($97 million net of tax) for the three monthsended March 31, 2013 and 2012, respectively, attributable to provisions for mortgage loan repurchase losses related to representations and warranties provided onloans previously sold to third parties by the wholesale mortgage banking unit. See “Note 14—Commitments, Contingencies and Guarantees” for further details.
The discontinued mortgage origination operations of our wholesale mortgage banking unit had remaining assets, which consisted primarily of income taxreceivables, of $309 million as of both March 31, 2013 and December 31, 2012. Liabilities, which primarily consisted of reserves for representations andwarranties on loans previously sold to third parties, totaled $752 million and $644 million as of March 31, 2013 and December 31, 2012, respectively. NOTE 3—INVESTMENT SECURITIES Our portfolio of investment securities available for sale, which had a fair value of $64.0 billion as of both March 31, 2013 and December 31, 2012, consistedprimarily of the following: U.S. Treasury debt, U.S. agency debt and corporate debt securities guaranteed by U.S. government agencies; agency and non-agencymortgage-backed securities (“MBS”); other asset-backed securities and other investments. Based on fair value, investments in U.S. Treasury, agency securitiesand other securities explicitly or implicitly guaranteed by the U.S. government represented 78% of our total investment securities available for sale as ofMarch 31, 2013, compared with 77% as of December 31, 2012.
Securities at Amortized Cost and Fair Value
Substantially all of our investment securities were classified as available for sale as of March 31, 2013 and December 31, 2012 and reported in our condensedconsolidated balance sheets at fair value. We had investment securities designated as held to maturity reported at amortized cost of $2 million and $9 million as ofMarch 31, 2013 and December 31, 2012, respectively. These investment securities are included in other assets in our condensed consolidated balance sheets.
70

Table of Contents
CAPITAL ONE FINANCIAL CORPORATIONNOTES TO CONDENSED CONSOLIDATED FINANCIAL STATEMENTS (UNAUDITED)—(Continued)
The following tables present the amortized cost, fair value and corresponding gross unrealized gains (losses), by major security type, for our investment securitiesas of March 31, 2013 and December 31, 2012. The gross unrealized gains (losses) related to our available-for-sale investment securities are recorded, net of tax,as a component of accumulated other comprehensive income (“AOCI”). March 31, 2013
(Dollars in millions) Amortized
Cost
TotalGross
UnrealizedGains
GrossUnrealized
Losses-OTTI
GrossUnrealized
Losses-Other
TotalGross
UnrealizedLosses
FairValue
Securities available for sale: U.S. Treasury debt obligations $ 1,043 $ 3 $ 0 $ 0 $ 0 $ 1,046 U.S. agency debt obligations 301 1 0 (1) (1) 301 Corporate debt securities guaranteed by U.S. government agencies
1,117 12 0 (1) (1) 1,128 Residential mortgage-backed securities (“RMBS”):
Agency 40,413 545 0 (209) (209) 40,749 Non-agency 3,499 384 (12) (3) (15) 3,868
Total RMBS 43,912 929 (12) (212) (224) 44,617
Commercial mortgage-backed securities (“CMBS”): Agency 6,322 91 0 (20) (20) 6,393 Non-agency 1,686 51 0 (7) (7) 1,730
Total CMBS 8,008 142 0 (27) (27) 8,123
Other asset-backed securities (“ABS”) 7,298 62 0 (3) (3) 7,357 Other securities 1,369 29 0 (2) (2) 1,396
Total securities available for sale $ 63,048 $ 1,178 $ (12) $ (246) $ (258) $63,968
71
(1) (2)
(3)
(4)
(5)
(5)
(6)
(7)

Table of Contents
CAPITAL ONE FINANCIAL CORPORATIONNOTES TO CONDENSED CONSOLIDATED FINANCIAL STATEMENTS (UNAUDITED)—(Continued)
December 31, 2012
(Dollars in millions) Amortized
Cost
Total Gross
UnrealizedGains
Gross Unrealized
Losses-OTTI
Gross Unrealized
Losses-Other
Total Gross
UnrealizedLosses
FairValue
Securities available for sale: U.S. Treasury debt obligations $ 1,548 $ 4 $ 0 $ 0 $ 0 $ 1,552 U.S. agency debt obligations 301 2 0 (1) (1) 302 Corporate debt securities guaranteed by U.S. government
agencies 1,003 10 0 (1) (1) 1,012 Residential mortgage-backed securities (“RMBS”):
Agency 39,408 652 0 (58) (58) 40,002 Non-agency 3,607 312 (38) (10) (48) 3,871
Total RMBS 43,015 964 (38) (68) (106) 43,873
Commercial mortgage-backed securities (“CMBS”): Agency 6,045 103 0 (4) (4) 6,144 Non-agency 1,425 62 0 (2) (2) 1,485
Total CMBS 7,470 165 0 (6) (6) 7,629
Other asset-backed securities (“ABS”) 8,393 70 0 (5) (5) 8,458 Other securities 1,120 34 0 (1) (1) 1,153
Total securities available for sale $ 62,850 $ 1,249 $ (38) $ (82) $ (120) $63,979
Represents the amount of cumulative non-credit other-than-temporary impairment (“OTTI”) losses recorded in AOCI. These losses are included in total gross unrealized losses.
Represents the amount of cumulative gross unrealized losses on securities for which we have not recognized OTTI. Includes debt securities issued by Fannie Mae and Freddie Mac with an amortized cost of $300 million as of both March 31, 2013 and December 31, 2012, and fair value of $300 million and $302 as of
March 31, 2013 and December 31, 2012, respectively. Consists of corporate debt securities guaranteed by other U.S. government agencies, such as the Export-Import Bank of the United States. Includes MBS issued by Fannie Mae, Freddie Mac and Ginnie Mae, each of which individually exceeded 10% of our stockholders’ equity as of the end of each reported period. Fannie Mae MBS had an
amortized cost of $24.8 billion and $22.9 billion as of March 31, 2013 and December 31, 2012, respectively, and a fair value of $25.0 billion and $23.2 billion as of March 31, 2013 and December 31,2012, respectively. Freddie Mac MBS had an amortized cost of $12.6 billion as of both March 31, 2013 and December 31, 2012, and a fair value of $12.7 billion and $12.9 billion as of March 31, 2013 andDecember 31, 2012, respectively. Ginnie Mae MBS had an amortized cost of $9.0 billion and $9.9 billion as of March 31, 2013 and December 31, 2012, respectively, and a fair value of $9.1 billion and$10.0 billion as of March 31, 2013 and December 31, 2012, respectively.
The other asset-backed securities portfolio was collateralized by approximately 68% credit card loans, 18% auto dealer floor plan inventory loans and leases, 6% auto loans, 1% student loans, 5%equipment loans, and 2% of other assets as of March 31, 2013. In comparison, the distribution was approximately 64% credit card loans, 18% auto dealer floor plan inventory loans and leases, 6% autoloans, 1% student loans, 5% equipment loans, 2% commercial paper, and 4% of other assets as of December 31, 2012. Approximately 88% of the securities in our other asset-backed security portfolio wererated AAA or its equivalent as of March 31, 2013, compared with 82% as of December 31, 2012.
Includes foreign government/agency bonds, covered bonds, municipal securities and equity investments primarily related to activities under the Community Reinvestment Act (“CRA”).
72
(1) (2)
(3)
(4)
(5)
(5)
(6)
(7)
(1)(2)(3)
(4)(5)
(6)
(7)

Table of Contents
CAPITAL ONE FINANCIAL CORPORATIONNOTES TO CONDENSED CONSOLIDATED FINANCIAL STATEMENTS (UNAUDITED)—(Continued)
Securities Available for Sale in a Gross Unrealized Loss Position
The table below provides, by major security type, information about our available-for-sale investment securities in a gross unrealized loss position and the lengthof time that individual securities have been in a continuous unrealized loss position as of March 31, 2013 and December 31, 2012. March 31, 2013 Less than 12 Months 12 Months or Longer Total
(Dollars in millions) Fair Value
GrossUnrealized
Losses Fair Value
GrossUnrealized
Losses Fair Value
GrossUnrealized
Losses Securities available for sale: U.S. agency debt obligations $ 199 $ (1) $ 0 $ 0 $ 199 $ (1) Corporate debt securities guaranteed by U.S. government
agencies 327 (1) 0 0 327 (1) RMBS:
Agency 16,143 (196) 852 (13) 16,995 (209) Non-agency 117 (2) 249 (13) 366 (15)
Total RMBS 16,260 (198) 1,101 (26) 17,361 (224)
CMBS: Agency 1,910 (20) 6 0 1,916 (20) Non-agency 513 (6) 40 (1) 553 (7)
Total CMBS 2,423 (26) 46 (1) 2,469 (27)
Other ABS 1,114 (1) 181 (2) 1,295 (3) Other securities 242 (2) 13 0 255 (2)
Total securities available for sale in a gross unrealized lossposition $ 20,565 $ (229) $ 1,341 $ (29) $ 21,906 $ (258)
73
(1)
(2)
(3)
(3)

Table of Contents
CAPITAL ONE FINANCIAL CORPORATIONNOTES TO CONDENSED CONSOLIDATED FINANCIAL STATEMENTS (UNAUDITED)—(Continued)
December 31, 2012 Less than 12 Months 12 Months or Longer Total
(Dollars in millions) Fair Value
GrossUnrealized
Losses Fair Value
GrossUnrealized
Losses Fair Value
GrossUnrealized
Losses Securities available for sale: U.S. agency debt obligations $ 199 $ (1) $ 0 $ 0 $ 199 $ (1) Corporate debt securities guaranteed by U.S. government
agencies 172 (1) 0 0 172 (1) RMBS:
Agency 8,720 (46) 884 (12) 9,604 (58) Non-agency 196 (19) 471 (29) 667 (48)
Total RMBS 8,916 (65) 1,355 (41) 10,271 (106)
CMBS: Agency 1,009 (4) 0 0 1,009 (4) Non-agency 201 (2) 0 0 201 (2)
Total CMBS 1,210 (6) 0 0 1,210 (6)
Other ABS 1,102 (4) 99 (1) 1,201 (5) Other securities 103 0 13 (1) 116 (1)
Total securities available for sale in a gross unrealized lossposition $ 11,702 $ (77) $ 1,467 $ (43) $ 13,169 $ (120)
Includes debt securities issued by Fannie Mae and Freddie Mac. Includes corporate debt securities guaranteed by other U.S. government agencies, such as the Export-Import Bank of the United States. Includes mortgage-backed securities issued by Fannie Mae, Freddie Mac and Ginnie Mae.
The gross unrealized losses on our available-for-sale securities investment of $258 million as of March 31, 2013 relate to 605 individual securities. Ourinvestments in non-agency MBS and non-agency asset-backed securities accounted for $25 million, or 10%, of total gross unrealized losses as of March 31,2013. Of the $258 million gross unrealized losses as of March 31, 2013, $29 million related to investment securities that had been in a loss position for 12 monthsor longer. As discussed in more detail below, we conduct periodic reviews of all investment securities with unrealized losses to assess whether the impairment isother-than-temporary. Based on our assessments, we have recorded OTTI for a portion of our non-agency residential MBS, which is discussed in more detail inthe “Other-Than-Temporary Impairment” section of this footnote.
74
(1)
(2)
(3)
(3)
(1)(2)(3)

Table of Contents
CAPITAL ONE FINANCIAL CORPORATIONNOTES TO CONDENSED CONSOLIDATED FINANCIAL STATEMENTS (UNAUDITED)—(Continued)
Maturities and Yields of Securities Available for Sale
The following table summarizes the remaining scheduled contractual maturities, assuming no prepayments, of our investment securities as of March 31, 2013: March 31, 2013
(Dollars in millions) Amortized
Cost Fair Value Due in 1 year or less $ 1,510 $ 1,514 Due after 1 year through 5 years 6,790 6,825 Due after 5 years through 10 years 4,863 4,918 Due after 10 years 49,885 50,711
Total $ 63,048 $ 63,968
Investments with no stated maturities, which consist of equity securities, are included with contractual maturities due after 10 years.
75
(1)
(1)

Table of Contents
CAPITAL ONE FINANCIAL CORPORATIONNOTES TO CONDENSED CONSOLIDATED FINANCIAL STATEMENTS (UNAUDITED)—(Continued)
Because borrowers may have the right to call or prepay certain obligations, the expected maturities of our securities are likely to differ from the scheduledcontractual maturities presented above. The table below summarizes, by major security type, the expected maturities and the weighted average yields of ourinvestment securities as of March 31, 2013. Actual calls or prepayment rates may differ from our estimates, which may cause the actual maturities of ourinvestment securities to differ from the expected maturities presented below. March 31, 2013
Due in 1 Year
or Less
Due > 1 Year through5 Years
Due > 5 Years through10 Years Due > 10 Years Total
(Dollars in millions) Amount AverageYield Amount
AverageYield Amount
AverageYield Amount
AverageYield Amount
AverageYield
Fair value of securities available for sale: U.S. Treasury debt obligations $ 200 0.23% $ 846 0.50% $ 0 0.00% $ 0 0.00% $ 1,046 0.45% U.S. agency debt obligations 102 4.59 0 0.00 199 1.63 0 0.00 301 2.62 Corporate debt securities guaranteed by U.S.
government agencies 0 0.00 216 1.92 897 1.78 15 3.48 1,128 1.83 RMBS:
Agency 948 3.14 16,094 2.85 22,684 2.45 1,023 2.79 40,749 2.63 Non-agency 80 8.14 1,726 7.77 1,829 7.93 233 10.02 3,868 7.98
Total RMBS 1,028 3.52 17,820 3.30 24,513 2.82 1,256 3.96 44,617 3.06 CMBS:
Agency 213 1.52 3,574 1.96 2,597 2.32 9 6.85 6,393 2.10 Non-agency 254 3.83 261 3.25 1,195 3.12 20 3.04 1,730 3.24
Total CMBS 467 2.77 3,835 2.04 3,792 2.57 29 4.11 8,123 2.34
Other ABS 1,181 1.34 5,555 1.04 528 3.33 93 6.76 7,357 1.31 Other securities 566 0.70 487 1.77 185 2.29 158 0.76 1,396 1.31
Total securities available for sale $3,544 2.10% $28,759 2.57% $30,114 2.75% $1,551 3.79% $63,968 2.66%
Amortized cost of securities available for sale $3,537 $28,212 $29,808 $1,491 $63,048
Yields are calculated based on the amortized cost of each security. Includes debt securities issued by Fannie Mae and Freddie Mac. Includes corporate debt securities guaranteed by other U.S. government agencies, such as the Export-Import Bank of the United States. Includes mortgage-backed securities issued by Fannie Mae, Freddie Mac and Ginnie Mae. Yields of tax-exempt securities are calculated on a fully taxable-equivalent (“FTE”) basis.
76
(1) (1) (1) (1) (1)
(2)
(3)
(4)
(4)
(5)
(1)(2)(3)(4)(5)

Table of Contents
CAPITAL ONE FINANCIAL CORPORATIONNOTES TO CONDENSED CONSOLIDATED FINANCIAL STATEMENTS (UNAUDITED)—(Continued)
Other-Than-Temporary Impairment
We evaluate all securities in an unrealized loss position at least quarterly, and more often as market conditions require, to assess whether the impairment is other-than-temporary. Our OTTI assessment is a subjective process requiring the use of judgments and assumptions. Accordingly, we consider a number of qualitativeand quantitative criteria in our assessment, including the extent and duration of the impairment; recent events specific to the issuer and/or industry to which theissuer belongs; the payment structure of the security; external credit ratings and the failure of the issuer to make scheduled interest or principal payments; thevalue of underlying collateral; our intent and ability to hold the security; and current market conditions.
We assess and recognize OTTI in accordance with the accounting guidance for recognition and presentation of OTTI. Under this guidance, if we determine thatimpairment on our debt securities is other-than-temporary and we have made the decision to sell the security or it is more likely than not that we will be requiredto sell the security prior to recovery of its amortized cost basis, we recognize the entire portion of the impairment in earnings. If we have not made a decision tosell the security and we do not expect that we will be required to sell the security prior to recovery of the amortized cost basis, we recognize only the creditcomponent of OTTI in earnings. The remaining unrealized loss due to factors other than credit, or the non-credit component, is recorded in AOCI. We determinethe credit component based on the difference between the security’s amortized cost basis and the present value of its expected future cash flows, discounted basedon the effective yield. The non-credit component represents the difference between the security’s fair value and the present value of expected future cash flows.
We recorded net OTTI in earnings totaling $25 million and $14 million for the three months ended March 31, 2013 and 2012, respectively. The cumulative non-credit related portion of OTTI on these securities recorded in AOCI totaled $36 million of unrealized gain and $116 million of unrealized loss as of March 31,2013 and 2012, respectively. We estimate the portion of losses attributable to credit using a discounted cash flow model and we estimate the expected cash flowsfrom the underlying collateral using internal information to derive key assumptions. This tool takes into consideration security specific delinquencies, productspecific delinquency roll rates and expected severities. Key assumptions used in estimating the expected cash flows include default rates, loss severity andprepayment rates. Assumptions used can vary widely based on the collateral underlying the securities and are influenced by factors such as collateral type, loaninterest rate, geographical location of the borrower, and borrower characteristics.
We believe the gross unrealized losses related to securities for which we have not recognized an OTTI on of $246 million as of March 31, 2013, is attributable toissuer specific credit spreads and changes in market interest rates and asset spreads. Therefore, we currently do not expect to incur credit losses related to thesesecurities. In addition, we have no intent to sell these securities with unrealized losses and it is not more likely than not that we will be required to sell thesesecurities prior to recovery of their amortized cost. Accordingly, we have concluded that the impairment on these securities is not other-than-temporary.
77

Table of Contents
CAPITAL ONE FINANCIAL CORPORATIONNOTES TO CONDENSED CONSOLIDATED FINANCIAL STATEMENTS (UNAUDITED)—(Continued)
The table below presents activity for the three months ended March 31, 2013 and 2012, related to the credit component of OTTI recognized in earnings oninvestment debt securities:
Three Months Ended
March 31, (Dollars in millions) 2013 2012 Credit loss component, beginning of period $ 120 $ 68 Additions:
Initial credit impairment 8 1 Subsequent credit impairment 17 13
Total additions 25 14
Reductions: Sales of credit-impaired securities 0 0
Total reductions 0 0
Credit loss component, end of period $ 145 $ 82
AOCI Related to Securities Available for Sale
The table below presents for the three months ended March 31, 2013 and 2012, the changes in AOCI, net of tax, related to our available-for-sale securities. Thenet unrealized gains (losses) represent the fair value adjustments recorded on available-for-sale securities, net of tax, during the period. The net reclassificationadjustment for net realized losses (gains) represents the amount of those fair value adjustments, net of tax, that were recognized in earnings due to the sale of anavailable-for-sale security.
Three Months Ended
March 31, 2013
(Dollars in millions) Before
Tax Tax AfterTax
Beginning balance AOCI related to securities available for sale $1,129 $426 $ 703 Net unrealized losses (207) (78) (129)Net realized gains reclassified from AOCI into earnings (2) (1) (1)
Ending balance AOCI related to securities available for sale $ 920 $347 $ 573
Three Months Ended
March 31, 2012
(Dollars in millions) Before
Tax Tax AfterTax
Beginning balance AOCI related to securities available for sale $ 443 $157 $ 286 Net unrealized gains 22 8 14 Net realized losses reclassified from AOCI into earnings 15 5 10
Ending balance AOCI related to securities available for sale $ 480 $170 $ 310
78

Table of Contents
CAPITAL ONE FINANCIAL CORPORATIONNOTES TO CONDENSED CONSOLIDATED FINANCIAL STATEMENTS (UNAUDITED)—(Continued)
Realized Gains and Losses on Securities Available for Sale
The following table presents the gross realized gains and losses on the sale and redemption of available-for-sale securities recognized in earnings for the threemonths ended March 31, 2013 and 2012. The gross realized investment losses presented below exclude credit losses recognized in earnings attributable toOTTI. We also present the proceeds from the sale of available-for-sale investment securities for the periods presented. The investment securities we sold consistspredominantly agency MBS.
Three Months Ended
March 31, (Dollars in millions) 2013 2012 Gross realized investment gains $ 3 $ 17 Gross realized investment losses (1) (6)
Net realized gains $ 2 $ 11
Total proceeds from sales $ 720 $ 7,337
Securities Pledged
As part of our liquidity management strategy, we pledge securities to secure borrowings from counterparties including the Federal Home Loan Bank (“FHLB”)and the Federal Reserve Bank. We also pledge securities to secure trust and public deposits and for other purposes as required or permitted by law. We pledgedsecurities with a fair value of $11.5 billion and $13.8 billion as of March 31, 2013 and December 31, 2012, respectively, primarily related to FHLB transactionand Public Fund deposits. We accepted securities with a fair value of $398 million and $238 million as of March 31, 2013 and December 31, 2012, respectively,primarily related to our derivative transactions.
Securities Acquired
Our investment portfolio includes securities acquired in the ING Direct acquisition, as well as other securities that were deemed to be credit impaired at the timeof purchase. These securities were recorded at fair value as of the date purchase. In accounting for acquired credit-impaired debt securities, we first determine thecontractually required payments due, which represent the total undiscounted amount of all uncollected principal and interest payments, adjusted for the effect ofestimated prepayments. We then estimate the undiscounted cash flows we expect to collect. The difference between the contractually required payments due andthe cash flows we expect to collect at acquisition, considering the impact of prepayments, is referred to as the nonaccretable difference. The nonaccretabledifference, which is neither accreted into income nor recorded on our consolidated balance sheet, reflects estimated future credit losses expected to be incurredover the life of the security. The excess of cash flows expected to be collected over the estimated fair value of credit-impaired debt securities at acquisition isreferred to as the accretable yield, which is accreted into interest income over the remaining life of the security using the effective interest method. Subsequent toacquisition, we complete quarterly evaluations of expected cash flows. Decreases in expected cash flows attributable to credit result in the recognition of other-than-temporary impairment. Increases in expected cash flows are recognized prospectively over the remaining life of the security as an adjustment to theaccretable yield.
79

Table of Contents
CAPITAL ONE FINANCIAL CORPORATIONNOTES TO CONDENSED CONSOLIDATED FINANCIAL STATEMENTS (UNAUDITED)—(Continued)
Outstanding Balance and Carrying Value of Acquired Securities
The table below presents the outstanding contractual balance and the carrying value of the acquired credit-impaired investment debt securities as of March 31,2013: March 31, 2013
(Dollars in millions)
PurchasedCredit-Impaired
Securities Contractual principal and interest $ 5,135
Carrying value $ 2,561
Changes in Accretable Yield of Acquired Securities
The following table presents changes in the accretable yield related to the acquired credit-impaired investment debt securities:
(Dollars in millions)
PurchasedCredit-Impaired
Securities Accretable yield as of December 31, 2011 $ 0 Additions from new acquisitions 1,743 Accretion recognized in earnings (202) Reductions due to disposals, transfers, and other non-credit related changes 0 Net reclassifications (to)/from nonaccretable difference (29)
Accretable yield as of December 31, 2012 $ 1,512 Additions from new acquisitions 40 Accretion recognized in earnings (60) Reductions due to disposals, transfers, and other non-credit related changes 0 Net reclassifications (to)/from nonaccretable difference (116)
Accretable yield as of March 31, 2013 $ 1,376
Includes securities acquired from ING Direct as well as other securities purchased.
NOTE 4—LOANS Loan Portfolio Composition
Our total loan portfolio consists of held-for-investment loans and loans held in our securitization. Our loan portfolio, by business segment, consists of credit card,consumer banking and commercial banking loans. Credit card loans consist of domestic and international credit card loans as well as installment loans. Consumerbanking loans consist of auto, home, and retail banking loans. Commercial banking loans consist of commercial and multifamily real estate, commercial andindustrial, and small-ticket commercial real estate loans.
Loans Acquired in Business Acquisitions
Our portfolio of loans held for investment includes loans acquired in the Chevy Chase Bank (“CCB”), ING Direct and 2012 U.S. card acquisitions. These loanswere recorded at fair value as of the date of each acquisition.
80
(1)
(1)
(1)

Table of Contents
CAPITAL ONE FINANCIAL CORPORATIONNOTES TO CONDENSED CONSOLIDATED FINANCIAL STATEMENTS (UNAUDITED)—(Continued)
Acquired Loans Accounted for Based on Expected Cash Flows
We use the term “acquired loans” to refer to a limited portion of the credit card loans acquired in the 2012 U.S. card acquisition and the substantial majority ofconsumer and commercial loans acquired in the ING Direct and CCB acquisitions, which are accounted for based on expected cash flows to be collected.Acquired loans accounted for based on expected cash flows to be collected was $35.0 billion as of March 31, 2013, compared with $37.1 billion as ofDecember 31, 2012.
We regularly update our estimate of the amount of expected principal and interest to be collected from these loans and evaluate the results on an aggregated poolbasis for loans with common risk characteristics. Probable decreases in expected loan principal cash flows would trigger the recognition of impairment throughour provision for credit losses. Probable and significant increases in expected cash flows would first reverse any previously recorded allowance for loan and leaselosses established subsequent to acquisition, with any remaining increase in expected cash flows recognized prospectively in interest income over the remainingestimated life of the underlying loans. We increased the allowance and recorded a provision for credit losses of $1 million for three months ended March 31, 2013related to certain pools of acquired loans. The cumulative impairment recognized on acquired loans totaled $58 million and $57 million as of March 31, 2013 andDecember 31, 2012, respectively. The credit performance of the remaining pools has generally been in line with our expectations, and, in some cases, morefavorable than expected, which has resulted in the reclassification of amounts from the nonaccretable difference to the accretable yield.
The table below presents the composition of our held-for-investment loan portfolio, including restricted loans for securitization investors, as of March 31, 2013and December 31, 2012.
(Dollars in millions) March 31,
2013 December 31,
2012 Credit Card business: Domestic credit card loans $ 69,722 $ 82,328 International credit card loans 8,036 8,614
Total credit card loans 77,758 90,942
Domestic installment loans 639 813
Total credit card 78,397 91,755
Consumer Banking business: Auto 27,940 27,123 Home loan 41,931 44,100 Other retail 3,742 3,904
Total consumer banking 73,613 75,127
Commercial Banking business: Commercial and multifamily real estate 17,878 17,732 Commercial and industrial 20,127 19,892
Total commercial lending 38,005 37,624 Small-ticket commercial real estate 1,145 1,196
Total commercial banking 39,150 38,820 Other: Other loans 173 187
Total loans $191,333 $ 205,889
Includes construction loans and land development loans totaling $2.1 billion as of both March 31, 2013 and December 31, 2012.
81
(1)
(1)

Table of Contents
CAPITAL ONE FINANCIAL CORPORATIONNOTES TO CONDENSED CONSOLIDATED FINANCIAL STATEMENTS (UNAUDITED)—(Continued)
On February 19, 2013, we announced our agreement with Best Buy Stores, L.P. (“Best Buy”) to end our contractual credit card relationship early and to sell theBest Buy portfolio of private label and co-branded credit card accounts that we acquired in the 2012 U.S. card acquisition to Citibank, N.A. We reclassified theassets subject to the sale agreement, which included loans of approximately $7 billion as of the date of the transfer, to the held for sale category from the held forinvestment category in the first quarter. The sale of the portfolio to Citibank, which is subject to customary closing conditions, and early termination of the BestBuy partnership are expected to be finalized in the third quarter of 2013.
We transferred the net assets subject to the sale agreement to the held for sale category upon meeting the pertinent criteria for this classification during the firstquarter of 2013. The loan portfolio was transferred to held for sale based upon the carrying value of the loans, including the transfer of the allowance for loanlosses. All other net assets subject to the sale agreement were transferred to held for sale at fair value less costs to sell. We had total loans held for sale of $6.4billion and $201 million as of March 31, 2013 and December 31, 2012, respectively. We will continue to recognize interest and fee income on the transferredloans, but will not recognize any impacts from charge-offs and recoveries unless these net charge-offs exceed the associated transferred allowance for loan losses.The amortization and accretion on the related intangibles ceased upon the transfer to the held for sale category.
Credit Quality
We closely monitor economic conditions and loan performance trends to manage and evaluate our exposure to credit risk. Trends in delinquency ratios are anindicator, among other considerations, of credit risk within our loan portfolios. The level of nonperforming assets represents another indicator of the potential forfuture credit losses. Accordingly, key metrics we track and use in evaluating the credit quality of our loan portfolio include delinquency and nonperforming assetrates, as well as charge-off rates and our internal risk ratings of larger balance, commercial loans.
The following table summarizes the payment status of loans in our total loan portfolio, including an aging of delinquent loans, loans 90 days or more past duecontinuing to accrue interest and loans classified as nonperforming. We present the information below on the credit performance of our loan portfolio, by majorloan category, including key metrics that we use in tracking changes in the credit quality of each of our loan portfolios. The delinquency aging includes all pastdue loans, both performing and nonperforming, as of March 31, 2013 and December 31, 2012.
Loans 90 days or more past due totaled approximately $1.9 billion and $2.3 billion as of March 31, 2013 and December 31, 2012, respectively. Loans classifiedas nonperforming totaled $936 million and $1.1 billion as of March 31, 2013 and December 31, 2012, respectively.
82

Table of Contents
CAPITAL ONE FINANCIAL CORPORATIONNOTES TO CONDENSED CONSOLIDATED FINANCIAL STATEMENTS (UNAUDITED)—(Continued)
March 31, 2013
(Dollars in millions) Current 30-59Days
60-89Days
> 90Days
TotalDelinquent
Loans AcquiredLoans
TotalLoans
> 90 Daysand
Accruing Nonperforming
Loans Credit Card: Domestic credit card $ 67,783 $ 701 $ 502 $1,171 $ 2,374 $ 204 $ 70,361 $ 1,171 $ 0 International credit card 7,640 154 90 152 396 0 8,036 104 90
Total credit card 75,423 855 592 1,323 2,770 204 78,397 1,275 90
Consumer Banking: Auto 26,272 1,165 395 95 1,655 13 27,940 0 95 Home loan 7,253 60 26 266 352 34,326 41,931 0 403 Retail banking 3,645 24 11 24 59 38 3,742 1 46
Total consumer banking 37,170 1,249 432 385 2,066 34,377 73,613 1 544
Commercial Banking: Commercial and multifamily real estate 17,562 47 34 126 207 109 17,878 31 127 Commercial and industrial 19,791 62 8 52 122 214 20,127 1 122
Total commercial lending 37,353 109 42 178 329 323 38,005 32 249
Small-ticket commercial real estate 1,103 20 10 12 42 0 1,145 1 28
Total commercial banking 38,456 129 52 190 371 323 39,150 33 277
Other: Other loans 105 8 3 18 29 39 173 0 25
Total $151,154 $2,241 $1,079 $1,916 $ 5,236 $ 34,943 $191,333 $ 1,309 $ 936
% of Total loans 79.0% 1.2% 0.6% 1.0% 2.7% 18.3% 100.0% 0.7% 0.5%
83
(1) (2) (2)

Table of Contents
CAPITAL ONE FINANCIAL CORPORATIONNOTES TO CONDENSED CONSOLIDATED FINANCIAL STATEMENTS (UNAUDITED)—(Continued)
December 31, 2012
(Dollars in millions) Current 30-59Days
60-89Days
> 90Days
TotalDelinquent
Loans AcquiredLoans
TotalLoans
> 90 Daysand
Accruing Nonperforming
Loans Credit Card: Domestic credit card $ 79,852 $ 932 $ 659 $1,410 $ 3,001 $ 288 $ 83,141 $ 1,410 $ 0 International credit card 8,227 145 89 153 387 0 8,614 100 100
Total credit card 88,079 1,077 748 1,563 3,388 288 91,755 1,510 100
Consumer Banking: Auto 25,057 1,341 559 149 2,049 17 27,123 0 149 Home loan 7,317 63 29 288 380 36,403 44,100 0 422 Retail banking 3,789 26 10 45 81 34 3,904 1 71
Total consumer banking 36,163 1,430 598 482 2,510 36,454 75,127 1 642
Commercial Banking: Commercial and multifamily real estate 17,357 64 77 107 248 127 17,732 2 137 Commercial and industrial 19,525 57 3 75 135 232 19,892 14 133
Total commercial lending 36,882 121 80 182 383 359 37,624 16 270
Small-ticket commercial real estate 1,153 28 9 6 43 0 1,196 0 12
Total commercial banking 38,035 149 89 188 426 359 38,820 16 282
Other: Other loans 118 8 5 23 36 33 187 0 30
Total $162,395 $2,664 $1,440 $2,256 $ 6,360 $ 37,134 $205,889 $ 1,527 $ 1,054
% of Total loans 78.9% 1.3% 0.7% 1.1% 3.1% 18.0% 100.0% 0.7% 0.5%
Acquired loans include loans acquired and accounted for under the accounting guidance for loans acquired in a transfer including business combinations. These loans are subsequently accounted for based
on the acquired loans’ expected cash flows. Excludes loans subsequently accounted for based on the acquired loans’ contractual cash flows. Acquired loans are excluded from loans reported as 90 days and still accruing interest and nonperforming loans.
Credit Card
Our credit card loan portfolio is generally highly diversified across millions of accounts and multiple geographies without significant individual exposures. Wetherefore generally manage credit risk on a portfolio basis. The risk in our credit card portfolio is correlated with broad economic trends, such as unemploymentrates, gross domestic product (“GDP”), and home values, as well as customer liquidity, which can have a material effect on credit performance. The primaryfactors we assess in monitoring the credit quality and risk of our credit card portfolio are delinquency and charge-off trends, including an analysis of the migrationof loans between delinquency categories over time. The table below displays the geographic profile of our credit card loan portfolio and delinquency statistics asof as of March 31, 2013 and December 31, 2012. We also present comparative net charge-offs for the first quarter of 2013 and 2012.
84
(1) (2) (2)
(1)
(2)

Table of Contents
CAPITAL ONE FINANCIAL CORPORATIONNOTES TO CONDENSED CONSOLIDATED FINANCIAL STATEMENTS (UNAUDITED)—(Continued)
Credit Card: Risk Profile by Geographic Region and Delinquency Status March 31, 2013
(Dollars in millions) Loans % of
Total Acquired
Loans % of
Total Total % of
Total Domestic credit card and installment loans: California $ 7,645 9.7% $ 21 0.1% $ 7,666 9.8% New York 5,048 6.4 17 0.0 5,065 6.5 Texas 4,795 6.1 16 0.0 4,811 6.1 Florida 4,117 5.3 12 0.0 4,129 5.3 Illinois 3,442 4.4 10 0.0 3,452 4.4 Pennsylvania 3,296 4.2 10 0.0 3,306 4.2 Ohio 2,830 3.6 9 0.0 2,839 3.6 New Jersey 2,626 3.4 7 0.0 2,633 3.4 Michigan 2,475 3.2 8 0.0 2,483 3.2 Other 33,883 43.2 94 0.1 33,977 43.3
Total domestic credit card and installment loans 70,157 89.5 204 0.2 70,361 89.7
International credit card: United Kingdom 3,319 4.2 0 0.0 3,319 4.2 Canada 4,717 6.1 0 0.0 4,717 6.1
Total international credit card 8,036 10.3 0 0.0 8,036 10.3
Total credit card and installment loans $78,193 99.8% $ 204 0.2% $78,397 100.0%
Selected credit metrics: 30+ day delinquencies $ 2,734 3.49 % $ 36 0.04% $ 2,770 3.53% 90+ day delinquencies 1,306 1.67 17 0.02 1,323 1.69
85
(1) (1) (1)
(2)
(2)

Table of Contents
CAPITAL ONE FINANCIAL CORPORATIONNOTES TO CONDENSED CONSOLIDATED FINANCIAL STATEMENTS (UNAUDITED)—(Continued)
December 31, 2012
(Dollars in millions) Loans % of
Total Acquired
Loans % of
Total Total % of
Total Domestic credit card and installment loans: California $ 9,245 10.0% $ 31 0.1% $ 9,276 10.1% Texas 5,910 6.5 23 0.0 5,933 6.5 New York 5,846 6.4 23 0.0 5,869 6.4 Florida 4,835 5.3 17 0.0 4,852 5.3 Illinois 4,100 4.5 15 0.0 4,115 4.5 Pennsylvania 3,861 4.2 14 0.0 3,875 4.2 Ohio 3,351 3.6 12 0.0 3,363 3.6 New Jersey 3,060 3.3 10 0.0 3,070 3.3 Michigan 2,917 3.2 11 0.0 2,928 3.2 Other 39,728 43.3 132 0.2 39,860 43.5
Total domestic credit card and installment loans 82,853 90.3 288 0.3 83,141 90.6
International credit card: United Kingdom 3,678 4.0 0 0.0 3,678 4.0 Canada 4,936 5.4 0 0.0 4,936 5.4
Total international credit card 8,614 9.4 0 0.0 8,614 9.4
Total credit card and installment loans $91,467 99.7% $ 288 0.3% $91,755 100.0%
Selected credit metrics: 30+ day delinquencies $ 3,326 3.62% $ 62 0.07% $ 3,388 3.69% 90+ day delinquencies 1,530 1.67 33 0.03 1,563 1.70 March 31, 2013 2012 (Dollars in millions) Amount Rate Amount Rate Net charge-offs: Domestic credit card $ 827 4.43% $ 531 3.92% International credit card 95 4.59 114 5.52
Total $ 922 4.45% $ 645 4.14%
Percentages by geographic region within the domestic and international credit card portfolios are calculated based on the total held-for-investment credit card loans as of the end of the reported period. Delinquency rates calculated by dividing delinquent credit card loans by the total balance of credit card loans held for investment as of the end of the reported period. Calculated by dividing annualized net charge-offs by average credit card loans held for investment during 2013 and 2012.
The 30+ day delinquency rate for our entire credit card loan portfolio decreased to 3.53% as of March 31, 2013, from 3.69% as of December 31, 2012, reflectingunderlying credit improvement trends.
86
(1) (1) (1)
(2)
(2)
(3)
(1)(2)(3)
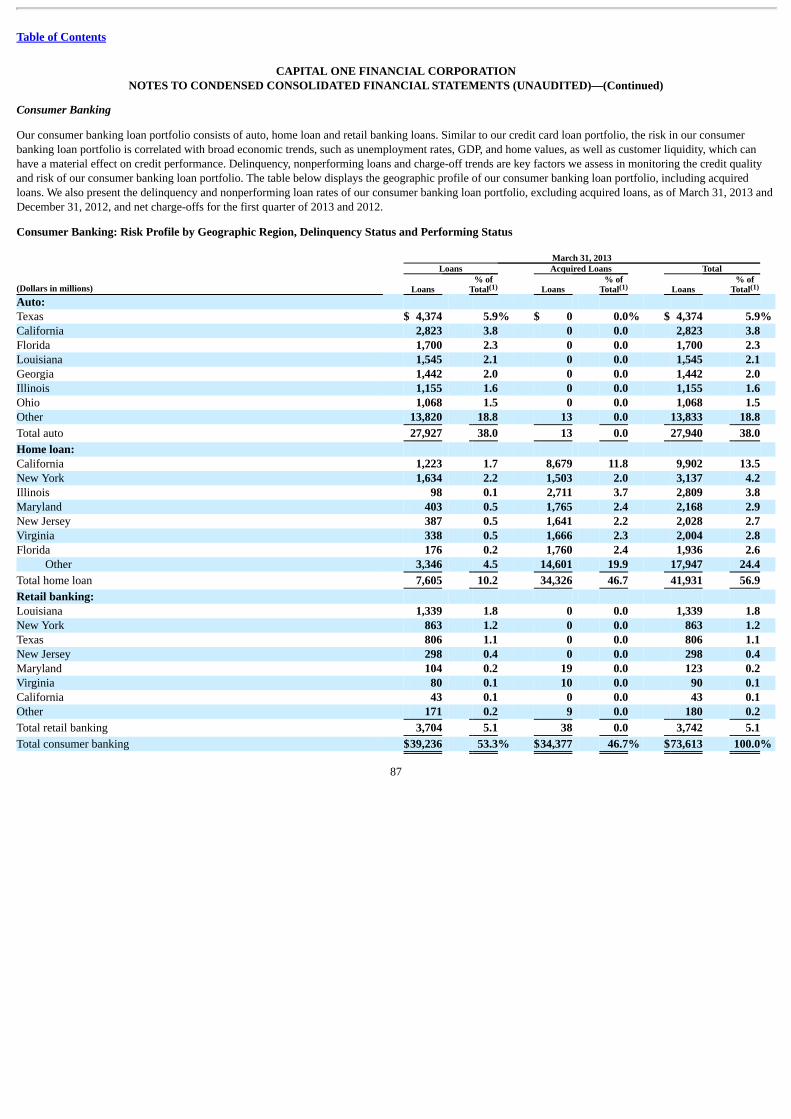
Table of Contents
CAPITAL ONE FINANCIAL CORPORATIONNOTES TO CONDENSED CONSOLIDATED FINANCIAL STATEMENTS (UNAUDITED)—(Continued)
Consumer Banking
Our consumer banking loan portfolio consists of auto, home loan and retail banking loans. Similar to our credit card loan portfolio, the risk in our consumerbanking loan portfolio is correlated with broad economic trends, such as unemployment rates, GDP, and home values, as well as customer liquidity, which canhave a material effect on credit performance. Delinquency, nonperforming loans and charge-off trends are key factors we assess in monitoring the credit qualityand risk of our consumer banking loan portfolio. The table below displays the geographic profile of our consumer banking loan portfolio, including acquiredloans. We also present the delinquency and nonperforming loan rates of our consumer banking loan portfolio, excluding acquired loans, as of March 31, 2013 andDecember 31, 2012, and net charge-offs for the first quarter of 2013 and 2012.
Consumer Banking: Risk Profile by Geographic Region, Delinquency Status and Performing Status March 31, 2013 Loans Acquired Loans Total
(Dollars in millions) Loans % of
Total Loans % of
Total Loans % of
Total Auto: Texas $ 4,374 5.9% $ 0 0.0% $ 4,374 5.9% California 2,823 3.8 0 0.0 2,823 3.8 Florida 1,700 2.3 0 0.0 1,700 2.3 Louisiana 1,545 2.1 0 0.0 1,545 2.1 Georgia 1,442 2.0 0 0.0 1,442 2.0 Illinois 1,155 1.6 0 0.0 1,155 1.6 Ohio 1,068 1.5 0 0.0 1,068 1.5 Other 13,820 18.8 13 0.0 13,833 18.8
Total auto 27,927 38.0 13 0.0 27,940 38.0
Home loan: California 1,223 1.7 8,679 11.8 9,902 13.5 New York 1,634 2.2 1,503 2.0 3,137 4.2 Illinois 98 0.1 2,711 3.7 2,809 3.8 Maryland 403 0.5 1,765 2.4 2,168 2.9 New Jersey 387 0.5 1,641 2.2 2,028 2.7 Virginia 338 0.5 1,666 2.3 2,004 2.8 Florida 176 0.2 1,760 2.4 1,936 2.6
Other 3,346 4.5 14,601 19.9 17,947 24.4
Total home loan 7,605 10.2 34,326 46.7 41,931 56.9
Retail banking: Louisiana 1,339 1.8 0 0.0 1,339 1.8 New York 863 1.2 0 0.0 863 1.2 Texas 806 1.1 0 0.0 806 1.1 New Jersey 298 0.4 0 0.0 298 0.4 Maryland 104 0.2 19 0.0 123 0.2 Virginia 80 0.1 10 0.0 90 0.1 California 43 0.1 0 0.0 43 0.1 Other 171 0.2 9 0.0 180 0.2
Total retail banking 3,704 5.1 38 0.0 3,742 5.1
Total consumer banking $39,236 53.3% $34,377 46.7% $73,613 100.0%
87
(1) (1) (1)

Table of Contents
CAPITAL ONE FINANCIAL CORPORATIONNOTES TO CONDENSED CONSOLIDATED FINANCIAL STATEMENTS (UNAUDITED)—(Continued)
March 31, 2013
Auto Home Loan Retail Banking Total Consumer
Banking (Dollars in millions) Amount Rate Amount Rate Amount Rate Amount Rate Credit performance: 30+ day delinquencies $1,655 5.92% $ 352 0.84% $ 59 1.58% $2,066 2.81% 90+ day delinquencies 95 0.34 266 0.63 24 0.65 385 0.52 Nonperforming loans 95 0.34 403 0.96 46 1.23 544 0.74 December 31, 2012 Loans Acquired Loans Total
(Dollars in millions) Loans % of
Total Loans % of
Total Loans % of
Total Auto: Texas $ 4,317 5.7% $ 0 0.0% $ 4,317 5.7% California 2,676 3.6 0 0.0 2,676 3.6 Florida 1,621 2.1 0 0.0 1,621 2.1 Louisiana 1,504 2.0 0 0.0 1,504 2.0 Georgia 1,404 1.9 0 0.0 1,404 1.9 Illinois 1,134 1.5 0 0.0 1,134 1.5 Ohio 1,032 1.4 0 0.0 1,032 1.4 Other 13,418 17.8 17 0.1 13,435 17.9
Total auto $27,106 36.0% $ 17 0.1% $27,123 36.1%
Home loan: California $ 1,168 1.6% $ 9,098 12.1% $10,266 13.7% New York 1,678 2.2 1,598 2.1 3,276 4.3 Illinois 102 0.1 2,875 3.8 2,977 3.9 Maryland 403 0.5 1,878 2.5 2,281 3.0 New Jersey 402 0.5 1,717 2.3 2,119 2.8 Virginia 342 0.5 1,748 2.3 2,090 2.8 Florida 183 0.3 1,863 2.5 2,046 2.8 Other 3,419 4.6 15,626 20.8 19,045 25.4
Total home loan $ 7,697 10.3% $36,403 48.4% $44,100 58.7%
Retail banking: Louisiana $ 1,447 1.9% $ 0 0.0% $ 1,447 1.9% New York 864 1.2 0 0.0 864 1.2 Texas 844 1.1 0 0.0 844 1.1 New Jersey 312 0.4 0 0.0 312 0.4 Maryland 96 0.1 20 0.1 116 0.2 Virginia 78 0.1 9 0.0 87 0.1 California 47 0.1 0 0.0 47 0.1 Other 182 0.2 5 0.0 187 0.2
Total retail banking $ 3,870 5.1% $ 34 0.1% $ 3,904 5.2%
Total consumer banking $38,673 51.4% $36,454 48.6% $75,127 100.0%
88
(2)
(1) (1) (1)

Table of Contents
CAPITAL ONE FINANCIAL CORPORATIONNOTES TO CONDENSED CONSOLIDATED FINANCIAL STATEMENTS (UNAUDITED)—(Continued)
December 31, 2012
Auto Home Loan Retail Banking Total Consumer
Banking (Dollars in millions) Amount Rate Amount Rate Amount Rate Amount Rate Credit performance: 30+ day delinquencies $2,049 7.55% $ 380 0.86% $ 81 2.07% $2,510 3.34% 90+ day delinquencies 149 0.55 288 0.65 45 1.15 482 0.64 Nonperforming loans 149 0.55 422 0.96 71 1.82 642 0.85 March 31, 2013
Auto Home Loan Retail Banking Total Consumer
Banking (Dollars in millions) Amount Rate Amount Rate Amount Rate Amount Rate Net charge-offs $ 122 1.78% $ 4 0.04% $ 17 1.85% $ 143 0.78% March 31, 2012
Auto Home Loan Retail Banking Total Consumer
Banking (Dollars in millions) Amount Rate Amount Rate Amount Rate Amount Rate Net charge-offs $ 80 1.41% $ 14 0.20% $ 15 1.39% $ 109 0.77%
Percentages by geographic region are calculated based on the total held-for-investment consumer banking loans as of the end of the reported period. Credit performance statistics exclude acquired loans, which were recorded at fair value at acquisition. Although acquired loans may be contractually delinquent, we separately track these loans and do not
include them in our delinquency and nonperforming loan statistics as the fair value recorded at acquisition included an estimate of credit losses expected to be realized over the remaining lives of the loans. Calculated by dividing annualized net charge-offs by average loans held for investment during 2013 and 2012.
Home Loan
Our home loan portfolio consists of both first-lien and second-lien residential mortgage loans. In evaluating the credit quality and risk of our home loan portfolio,we continually monitor a variety of mortgage loan characteristics that may affect the default experience on our overall home loan portfolio, such as vintage,geographic concentrations, lien priority and product type. Certain loan concentrations have experienced higher delinquency rates as a result of the significantdecline in home prices since the home price peak in 2006 and the rise in unemployment. These loan concentrations include loans originated between 2006 and2008 in an environment of decreasing home sales, broadly declining home prices and more relaxed underwriting standards and loans on properties in Arizona,California, Florida and Nevada, which have experienced the most severe decline in home prices. The following table presents the distribution of our home loanportfolio as of March 31, 2013 and December 31, 2012, based on selected key risk characteristics.
89
(2)
(3)
(3)
(1)(2)
(3)

Table of Contents
CAPITAL ONE FINANCIAL CORPORATIONNOTES TO CONDENSED CONSOLIDATED FINANCIAL STATEMENTS (UNAUDITED)—(Continued)
Home Loan: Risk Profile by Vintage, Geography, Lien Priority and Interest Rate Type March 31, 2013 Loans Acquired Loans Total Home Loans
(Dollars in millions) Amount % of
Total Amount % of
Total Amount % of
Total Origination year:
< = 2005 $3,327 8.0% $ 4,679 11.2% $ 8,006 19.2% 2006 597 1.4 2,788 6.6 3,385 8.0 2007 425 1.0 6,023 14.3 6,448 15.3 2008 244 0.6 4,980 11.9 5,224 12.5 2009 155 0.4 3,191 7.6 3,346 8.0 2010 177 0.4 5,517 13.2 5,694 13.6 2011 305 0.7 6,070 14.5 6,375 15.2 2012 2,191 5.2 1,038 2.5 3,229 7.7 2013 184 0.4 40 0.1 224 0.5
Total $7,605 18.1% $34,326 81.9% $41,931 100.0%
Geographic concentration: California $1,223 2.9% $ 8,679 20.7% $ 9,902 23.6% New York 1,634 3.9 1,503 3.6 3,137 7.5 Illinois 98 0.2 2,711 6.5 2,809 6.7 Maryland 403 1.0 1,765 4.2 2,168 5.2 New Jersey 387 0.9 1,641 3.9 2,028 4.8 Virginia 338 0.8 1,666 4.0 2,004 4.8 Florida 176 0.4 1,760 4.2 1,936 4.6 Arizona 92 0.2 1,719 4.1 1,811 4.3 Washington 108 0.3 1,645 3.9 1,753 4.2 Colorado 119 0.3 1,482 3.5 1,601 3.8 Other 3,027 7.2 9,755 23.3 12,782 30.5
Total $7,605 18.1% $34,326 81.9% $41,931 100.0%
Lien type: 1 lien $6,445 15.3% $33,850 80.8% $40,295 96.1% 2 lien 1,160 2.8 476 1.1 1,636 3.9
Total $7,605 18.1% $34,326 81.9% $41,931 100.0%
Interest rate type: Fixed rate $2,465 5.9% $ 3,772 9.0% $ 6,237 14.9% Adjustable rate 5,140 12.2 30,554 72.9 35,694 85.1
Total $7,605 18.1% $34,326 81.9% $41,931 100.0%
90
(1) (1) (1)
(2)
st
nd

Table of Contents
CAPITAL ONE FINANCIAL CORPORATIONNOTES TO CONDENSED CONSOLIDATED FINANCIAL STATEMENTS (UNAUDITED)—(Continued)
December 31, 2012 Loans Acquired Loans Total Home Loans
(Dollars in millions) Amount % of
Total Amount % of
Total Amount % of
Total Origination year:
< = 2005 $3,483 7.9% $ 4,858 11.0% $ 8,341 18.9% 2006 621 1.4 2,865 6.5 3,486 7.9 2007 446 1.0 6,189 14.0 6,635 15.0 2008 257 0.6 5,210 11.8 5,467 12.4 2009 167 0.4 3,438 7.8 3,605 8.2 2010 188 0.4 6,024 13.7 6,212 14.1 2011 324 0.7 6,705 15.2 7,029 15.9 2012 2,211 5.1 1,114 2.5 3,325 7.6
Total $7,697 17.5% $36,403 82.5% $44,100 100.0%
Geographic concentration: California $1,168 2.7% $ 9,098 20.6% $10,266 23.3% New York 1,678 3.8 1,598 3.6 3,276 7.4 Illinois 102 0.2 2,875 6.5 2,977 6.7 Maryland 403 0.9 1,878 4.3 2,281 5.2 New Jersey 402 0.9 1,717 3.9 2,119 4.8 Virginia 342 0.8 1,748 4.0 2,090 4.8 Florida 183 0.4 1,863 4.2 2,046 4.6 Arizona 95 0.2 1,828 4.1 1,923 4.3 Washington 113 0.3 1,766 4.0 1,879 4.3 Colorado 126 0.3 1,594 3.6 1,720 3.9 Other 3,085 7.0 10,438 23.7 13,523 30.7
Total $7,697 17.5% $36,403 82.5% $44,100 100.0%
Lien type: 1 lien $6,502 14.8% $35,905 81.4% $42,407 96.2% 2 lien 1,195 2.7 498 1.1 1,693 3.8
Total $7,697 17.5% $36,403 82.5% $44,100 100.0%
Interest rate type: Fixed rate $2,534 5.8% $ 4,037 9.1% $ 6,571 14.9% Adjustable rate 5,163 11.7 32,366 73.4 37,529 85.1
Total $7,697 17.5% $36,403 82.5% $44,100 100.0%
Percentages within each risk category calculated based on total held-for-investment home loans. Represents the ten states in which we have the highest concentration of home loans.
91
(1) (1) (1)
(2)
st
nd
(1)(2)

Table of Contents
CAPITAL ONE FINANCIAL CORPORATIONNOTES TO CONDENSED CONSOLIDATED FINANCIAL STATEMENTS (UNAUDITED)—(Continued)
Commercial Banking
We evaluate the credit risk of commercial loans individually and use a risk-rating system to determine the credit quality of our commercial loans. We assigninternal risk ratings to loans based on relevant information about the ability of borrowers to service their debt. In determining the risk rating of a particular loan,among the factors considered are the borrower’s current financial condition, historical credit performance, projected future credit performance, prospects forsupport from financially responsible guarantors, the estimated realizable value of any collateral and current economic trends. The ratings scale based on ourinternal risk-rating system is as follows:
• Noncriticized: Loans that have not been designated as criticized, frequently referred to as “pass” loans.
• Criticized performing: Loans in which the financial condition of the obligor is stressed, affecting earnings, cash flows or collateral values. The borrower
currently has adequate capacity to meet near-term obligations; however, the stress, left unabated, may result in deterioration of the repayment prospects atsome future date.
• Criticized nonperforming: Loans that are not adequately protected by the current sound worth and paying capacity of the obligor or the collateral pledged, ifany. Loans classified as criticized nonperforming have a well-defined weakness, or weaknesses, which jeopardize the repayment of the debt. These loansare characterized by the distinct possibility that we will sustain a credit loss if the deficiencies are not corrected and are generally placed on nonaccrualstatus.
We use our internal risk-rating system for regulatory reporting, determining the frequency of review of the credit exposures and evaluation and determination ofthe allowance for commercial loans. Loans of $1 million or more designated as criticized performing and criticized nonperforming are reviewed quarterly bymanagement for further deterioration or improvement to determine if they are appropriately classified/graded and whether impairment exists. Noncriticized loansgreater than $1 million are specifically reviewed, at least annually, to determine the appropriate loan grading. In addition, during the renewal process of any loanor if a loan becomes past due, we evaluate the risk rating.
92

Table of Contents
CAPITAL ONE FINANCIAL CORPORATIONNOTES TO CONDENSED CONSOLIDATED FINANCIAL STATEMENTS (UNAUDITED)—(Continued)
The following table presents the geographic distribution and internal risk ratings of our commercial loan portfolio as of March 31, 2013 and December 31, 2012.
Commercial Banking: Risk Profile by Geographic Region and Internal Risk Rating March 31, 2013
(Dollars in millions)
Commercial&
MultifamilyReal Estate
% ofTotal
Commercialand
Industrial % of
Total
Small-ticketCommercialReal Estate
% ofTotal
TotalCommercial
% ofTotal
Geographic concentration: Loans: Northeast $ 13,224 73.9% $ 5,443 27.0% $ 699 61.1% $ 19,366 49.5% Mid-Atlantic 1,462 8.2 1,170 5.8 45 3.9 2,677 6.8 South 2,124 11.9 9,197 45.7 69 6.0 11,390 29.1 Other 959 5.4 4,103 20.4 332 29.0 5,394 13.8
Loans 17,769 99.4 19,913 98.9 1,145 100.0 38,827 99.2 Acquired loans 109 0.6 214 1.1 0 0.0 323 0.8
Total $ 17,878 100.0% $ 20,127 100.0% $ 1,145 100.0% $ 39,150 100.0%
Internal risk rating: Loans: Noncriticized $ 17,022 95.2% $ 19,238 95.6% $ 1,099 96.0% $ 37,359 95.4% Criticized performing 620 3.5 553 2.8 18 1.6 1,191 3.1 Criticized nonperforming 127 0.7 122 0.6 28 2.4 277 0.7
Loans 17,769 99.4 19,913 99.0 1,145 100.0 38,827 99.2
Acquired loans: Noncriticized 75 0.4 211 1.0 0 0.0 286 0.7 Criticized performing 34 0.2 3 0.0 0 0.0 37 0.1
Total acquired loans 109 0.6 214 1.0 0 0.0 323 0.8
Total $ 17,878 100.0% $ 20,127 100.0% $ 1,145 100.0% $ 39,150 100.0%
93
(1)
(2) (2) (2) (2)
(3)
(4)

Table of Contents
CAPITAL ONE FINANCIAL CORPORATIONNOTES TO CONDENSED CONSOLIDATED FINANCIAL STATEMENTS (UNAUDITED)—(Continued)
December 31, 2012
(Dollars in millions)
Commercial&
MultifamilyReal Estate
% ofTotal
Commercialand
Industrial % of
Total
Small-ticketCommercialReal Estate
% ofTotal
TotalCommercial
% ofTotal
Geographic concentration: Loans: Northeast $ 13,299 75.0% $ 5,460 27.4% $ 723 60.5% $ 19,482 50.2% Mid-Atlantic 1,398 7.9 1,149 5.8 47 3.9 2,594 6.7 South 2,055 11.6 9,182 46.2 72 6.0 11,309 29.1 Other 853 4.8 3,869 19.4 354 29.6 5,076 13.1
Loans 17,605 99.3 19,660 98.8 1,196 100.0 38,461 99.1 Acquired loans 127 0.7 232 1.2 0 0.0 359 0.9
Total $ 17,732 100.0% $ 19,892 100.0% $ 1,196 100.0% $ 38,820 100.0%
Internal risk rating: Loans: Noncriticized $ 16,614 93.7% $ 19,073 95.9% $ 1,152 96.3% $ 36,839 94.9% Criticized performing 853 4.8 454 2.3 33 2.8 1,340 3.5 Criticized nonperforming 138 0.8 133 0.6 11 0.9 282 0.7
Loans 17,605 99.3 19,660 98.8 1,196 100.0 38,461 99.1
Acquired loans: Noncriticized 77 0.4 228 1.2 0 0.0 305 0.8 Criticized performing 50 0.3 4 0.0 0 0.0 54 0.1
Total acquired loans 127 0.7 232 1.2 0 0.0 359 0.9
Total $ 17,732 100.0% $ 19,892 100.0% $ 1,196 100.0% $ 38,820 100.0%
Amounts based on total loans as of March 31, 2013 and December 31, 2012. Percentages calculated based on total held-for-investment commercial loans in each respective loan category as of the end of the reported period. Northeast consists of CT, ME, MA, NH, NJ, NY, PA and VT. Mid-Atlantic consists of DE, DC, MD, VA and WV. South consists of AL, AR, FL, GA, KY, LA, MS, MO, NC, SC, TN and TX. Criticized exposures correspond to the “Special Mention,” “Substandard” and “Doubtful” asset categories defined by banking regulatory authorities.
94
(2) (2) (2) (2)
(3)
(4)
(1)(2)(3)(4)

Table of Contents
CAPITAL ONE FINANCIAL CORPORATIONNOTES TO CONDENSED CONSOLIDATED FINANCIAL STATEMENTS (UNAUDITED)—(Continued)
The following table presents information about our impaired loans, excluding acquired loans, which are reported separately and discussed below as of March 31,2013 and December 31, 2012: March 31, 2013
(Dollars in millions) With an
Allowance
Withoutan
Allowance
TotalRecorded
Investment Related
Allowance
NetRecorded
Investment
Unpaid PrincipalBalance
AverageRecorded
Investment
Interest Income
Recognized Credit card and installment loans: Domestic credit card and
installment loans $ 669 $ 0 $ 669 $ 226 $ 443 $ 649 $ 685 $ 17 International credit card and installment
loans 170 0 170 101 69 162 167 3
Total credit card and installment loans 839 0 839 327 512 811 852 20
Consumer banking: Auto 164 162 326 18 308 543 327 15 Home loan 168 0 168 13 155 196 156 2 Retail banking 78 17 95 11 84 104 96 1
Total consumer banking 410 179 589 42 547 843 579 18
Commercial banking: Commercial and multifamily real estate 170 107 277 17 260 319 279 1 Commercial and industrial 129 105 234 22 212 292 238 1
Total commercial lending 299 212 511 39 472 611 517 2
Small-ticket commercial real estate 5 28 33 2 31 59 24 0
Total commercial banking 304 240 544 41 503 670 541 2
Total $ 1,553 $ 419 $ 1,972 $ 410 $ 1,562 $ 2,324 $ 1,972 $ 40
95
(1)

Table of Contents
CAPITAL ONE FINANCIAL CORPORATIONNOTES TO CONDENSED CONSOLIDATED FINANCIAL STATEMENTS (UNAUDITED)—(Continued)
December 31, 2012
(Dollars in millions) With an
Allowance
Withoutan
Allowance
TotalRecorded
Investment Related
Allowance
NetRecorded
Investment
Unpaid PrincipalBalance
AverageRecorded
Investment
Interest Income
Recognized Credit card and installment loans: Domestic credit card and installment loans $ 701 $ 0 $ 701 $ 230 $ 471 $ 678 $ 687 $ 70 International credit card and installment loans 172 0 172 101 71 164 192 11
Total credit card and installment loans 873 0 873 331 542 842 879 81
Consumer banking: Auto 169 159 328 20 308 606 130 31 Home loan 145 0 145 13 132 167 120 4 Retail banking 61 35 96 7 89 118 88 3
Total consumer banking 375 194 569 40 529 891 338 38
Commercial banking: Commercial and multifamily real estate 168 112 280 32 248 315 353 8 Commercial and industrial 152 92 244 22 222 277 227 6
Total commercial lending 320 204 524 54 470 592 580 14
Small-ticket commercial real estate 3 11 14 1 13 21 23 0
Total commercial banking 323 215 538 55 483 613 603 14
Total $ 1,571 $ 409 $ 1,980 $ 426 $ 1,554 $ 2,346 $ 1,820 $ 133
Credit card and installment loans include finance charges and fees.
Troubled debt restructuring (“TDR”) loans accounted for $1.8 billion of impaired loans as of both March 31, 2013 and December 31, 2012, respectively.Consumer TDR loans classified as performing totaled $1.1 billion and $1.2 billion as of March 31, 2013 and December 31, 2012, respectively. Commercial TDRloans classified as performing totaled $267 million and $253 million as of March 31, 2013 and December 31, 2012, respectively.
96
(1)
(1)

Table of Contents
CAPITAL ONE FINANCIAL CORPORATIONNOTES TO CONDENSED CONSOLIDATED FINANCIAL STATEMENTS (UNAUDITED)—(Continued)
As part of our loan modifications to borrowers experiencing financial difficulty, we may provide multiple concessions to minimize our economic loss andimprove long-term loan performance and collectability. The following tables present the types, amounts and financial effects of loans modified and accounted foras troubled debt restructurings during the period:
TotalLoans
Modified
Three Months Ended March 31, 2013 Reduced Interest Rate Term Extension Balance Reduction
(Dollars in millions)
% ofTDR
Activity
AverageRate
Reduction % of TDR
Activity
AverageTerm
Extension(Months)
% ofTDR
Activity
GrossBalance
Reduction Credit card: Domestic credit card $ 76 100% 12.26% 0% 0 0% $ 0 International credit card 51 100 24.53 0 0 0 0
Total credit card 127 100 17.17 0 0 0 0
Consumer banking: Auto 63 73 6.72 78 9 44 24 Home loan 11 61 2.20 49 133 18 1 Retail banking 10 3 3.34 51 8 0 0
Total consumer banking 84 63 6.14 71 20 35 25
Commercial banking: Commercial and multifamily real estate 17 0 0 100 8 0 0 Commercial and industrial 1 0 0 100 9 0 0
Total commercial lending 18 0 0 100 8 0 0 Small-ticket commercial real estate 3 0 0 0 0 0 0
Total commercial banking 21 0 0 82 8 0 0
Total $ 232 77% 13.93% 33% 17 13% $ 25
97
(1) (2)(8) (3) (4)(8) (5) (6)(8) (7)

Table of Contents
CAPITAL ONE FINANCIAL CORPORATIONNOTES TO CONDENSED CONSOLIDATED FINANCIAL STATEMENTS (UNAUDITED)—(Continued)
(Dollars in millions)
TotalLoans
Modified
Three Months Ended March 31, 2012 Reduced Interest Rate Term Extension Balance Reduction
% ofTDR
Activity
AverageRate
Reduction % of TDR
Activity
AverageTerm
Extension(Months)
% ofTDR
Activity
GrossBalance
Reduction Credit card: Domestic credit card $ 57 100% 10.45% 0% 0 0% $ 0 International credit card 64 99 24.05 0 0 0 0
Total credit card 121 100 17.58 0 0 0 0
Consumer banking: Auto 25 71 1.41 100 10 0 0 Home loan 5 29 0.91 50 139 4 0 Retail banking 7 1 3.00 99 11 0 0
Total consumer banking 37 51 1.37 93 20 1 0
Commercial banking: Commercial and multifamily real estate 21 2 1.38 100 7 0 0 Commercial and industrial 34 11 7.25 97 14 0 0
Total commercial lending 55 7 6.63 98 11 0 0 Small-ticket commercial real estate 0 0 0.00 0 0 0 0
Total commercial banking 55 7 6.63 98 11 0 0
Total $ 213 67% 15.15% 42% 15 0% $ 0
Represents total loans modified and accounted for as a TDR during the period. Paydowns, charge-offs and any other changes in the loan carrying value subsequent to the loan entering TDR status are not
reflected. Percentage of loans modified and accounted for as a TDR during the period that were granted a reduced interest rate. Weighted average interest rate reduction for those loans that received an interest rate concession. Percentage of loans modified and accounted for as a TDR during the period that were granted a maturity date extension. Weighted average change in maturity date for those loans that received a maturity date extension. Percentage of loans modified and accounted for as a TDR during the period that were granted forgiveness or forbearance of a portion of their balance. Total amount represents the gross balance forgiven. For loans modified in bankruptcy, the gross balance reduction represents collateral value write downs associated with the discharge of the borrower’s
obligations. Due to multiple concessions granted to some troubled borrowers, percentages may total more than 100% for certain loan types.
98
(1) (2)(8) (3) (4)(8) (5) (6)(8) (7)
(1)
(2)(3)(4)(5)(6)(7)
(8)
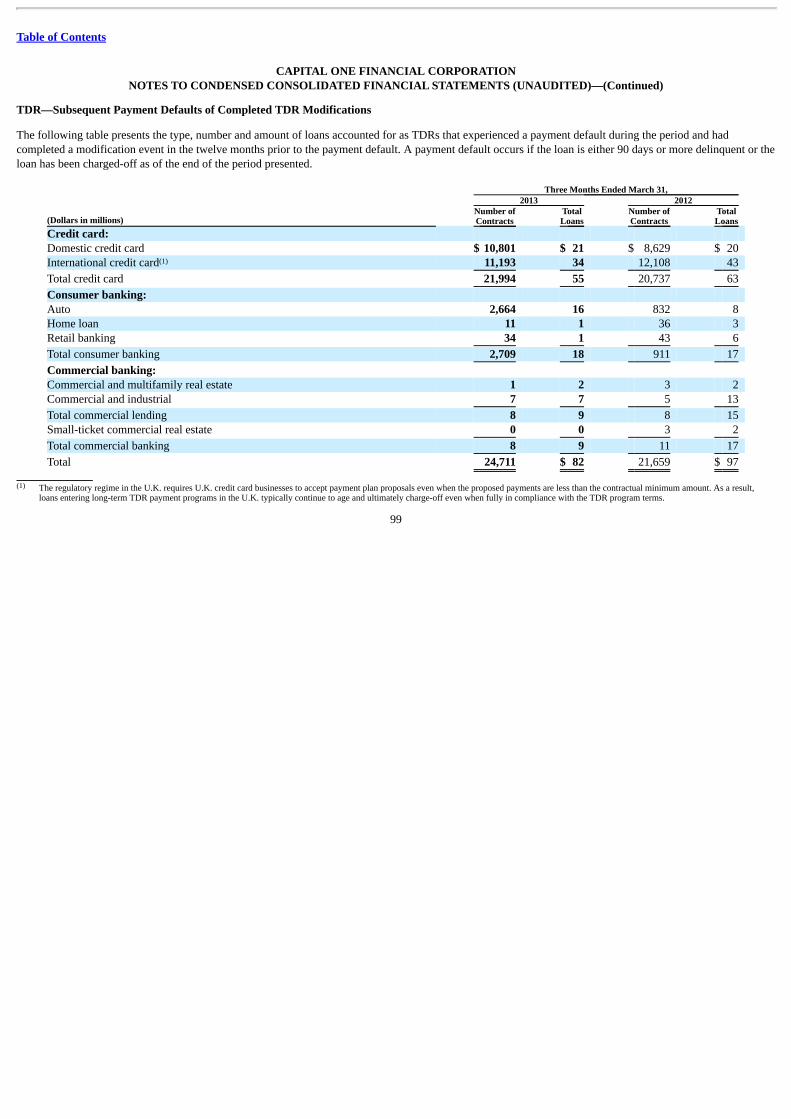
Table of Contents
CAPITAL ONE FINANCIAL CORPORATIONNOTES TO CONDENSED CONSOLIDATED FINANCIAL STATEMENTS (UNAUDITED)—(Continued)
TDR—Subsequent Payment Defaults of Completed TDR Modifications
The following table presents the type, number and amount of loans accounted for as TDRs that experienced a payment default during the period and hadcompleted a modification event in the twelve months prior to the payment default. A payment default occurs if the loan is either 90 days or more delinquent or theloan has been charged-off as of the end of the period presented.
Three Months Ended March 31, 2013 2012
(Dollars in millions) Number ofContracts
TotalLoans
Number ofContracts
TotalLoans
Credit card: Domestic credit card $ 10,801 $ 21 $ 8,629 $ 20 International credit card 11,193 34 12,108 43
Total credit card 21,994 55 20,737 63
Consumer banking: Auto 2,664 16 832 8 Home loan 11 1 36 3 Retail banking 34 1 43 6
Total consumer banking 2,709 18 911 17
Commercial banking: Commercial and multifamily real estate 1 2 3 2 Commercial and industrial 7 7 5 13
Total commercial lending 8 9 8 15 Small-ticket commercial real estate 0 0 3 2
Total commercial banking 8 9 11 17
Total 24,711 $ 82 21,659 $ 97
The regulatory regime in the U.K. requires U.K. credit card businesses to accept payment plan proposals even when the proposed payments are less than the contractual minimum amount. As a result,
loans entering long-term TDR payment programs in the U.K. typically continue to age and ultimately charge-off even when fully in compliance with the TDR program terms.
99
(1)
(1)

Table of Contents
CAPITAL ONE FINANCIAL CORPORATIONNOTES TO CONDENSED CONSOLIDATED FINANCIAL STATEMENTS (UNAUDITED)—(Continued)
Outstanding Balance and Carrying Value of Acquired Loans
The table below presents the outstanding contractual balance and the carrying value of loans from the CCB, ING Direct and 2012 U.S. card acquisitionsaccounted for based on expected cash flows, as of March 31, 2013 and December 31, 2012. The table displays separately loans considered credit-impaired atacquisition and loans not considered credit-impaired at acquisition. March 31, 2013 December 31, 2012
(Dollars in millions) Total Impaired
Loans
Non-Impaired
Loans Total Impaired
Loans
Non-Impaired
Loans Contractual balance $37,124 $ 5,885 $31,239 $39,321 $ 6,195 $33,126
Carrying value $34,966 $ 3,872 $31,095 $37,109 $ 4,069 $33,040
Includes $58 million and $57 million of cumulative impairment recognized as of March 31, 2013 and December 31, 2012, respectively.
Changes in Accretable Yield
We increased the allowance related to these loans by $1 million for the three months ended March 31, 2013. We recorded impairment through our provision forcredit losses of $1 million and $13 million for the first three months of 2013 and 2012, respectively. The cumulative impairment recognized on these totaled $58million and $57 million as of March 31, 2013 and December 31, 2012, respectively.
The following table presents changes in the accretable yield on loans related to the CCB, ING Direct, and 2012 U.S. card acquisitions:
(Dollars in millions) TotalLoans
ImpairedLoans
Non-Impaired
Loans Accretable yield as of December 31, 2011 $ 1,752 $ 1,566 $ 186 Acquired loans accretable yield 5,616 306 5,310 Accretion recognized in earnings (1,316) (390) (926)Reclassifications from nonaccretable difference for loans with improving cash flows 860 448 412 Reductions in accretable yield for non-credit related changes in expected cash flows (704) (31) (673)
Accretable yield as of December 31, 2012 $ 6,208 $ 1,899 $ 4,309
Accretion recognized in earnings (300) (100) (200)Reclassifications from nonaccretable difference for loans with improving cash flows 100 94 6 Reductions in accretable yield for non-credit related changes in expected cash flows (174) (31) (143)
Accretable yield as of March 31, 2013 $ 5,834 $ 1,862 $ 3,972
Includes revised acquisition date accretable yield for ING Direct acquired loans. Represents increases in accretable yields for those pools with increases that are primarily the result of improved credit performance. Reflects the implementation of the 2012 OCC update to the Bank Accounting Advisory Series, which requires write-down of performing consumer loans restructured in bankruptcy to collateral value.
Includes reductions of $28 million and $44 million for purchased credit-impaired loans and non-impaired loans, respectively. Represents changes in accretable yields for those pools with reductions that are driven primarily by changes in actual and estimated prepayments.
100
(1)
(1)
(1)
(2) (3)
(4)
(2)
(4)
(1)(2)(3)
(4)

Table of Contents
CAPITAL ONE FINANCIAL CORPORATIONNOTES TO CONDENSED CONSOLIDATED FINANCIAL STATEMENTS (UNAUDITED)—(Continued)
Unfunded Lending Commitments
We manage the potential risk in credit commitments by limiting the total amount of arrangements, both by individual customer and in total, by monitoring the sizeand maturity structure of these portfolios and by applying the same credit standards for all of our credit activities. Unused credit card lines available to ourcustomers totaled $303.2 billion and $298.9 billion as of March 31, 2013 and December 31, 2012, respectively. While these amounts represented the totalavailable unused credit card lines, we have not experienced and do not anticipate that all of our customers will access their entire available line at any given pointin time.
In addition to available unused credit card lines, we enter into commitments to extend credit that are legally binding conditional agreements having fixedexpirations or termination dates and specified interest rates and purposes. These commitments generally require customers to maintain certain credit standards.Collateral requirements and loan-to-value ratios are the same as those for funded transactions and are established based on management’s credit assessment of thecustomer. These commitments may expire without being drawn upon; therefore, the total commitment amount does not necessarily represent future fundingrequirements. The outstanding unfunded commitments to extend credit, other than credit card lines, were approximately $18.2 billion and $17.5 billion as ofMarch 31, 2013 and December 31, 2012, respectively.
We maintain a reserve for unfunded loan commitments and letters of credit to absorb estimated probable losses related to these unfunded credit facilities in otherliabilities on our consolidated balance sheets. Our reserve for unfunded loan commitments and letters of credit was $85 million and $35 million as of March 31,2013 and December 31, 2012, respectively. See “Note 5—Allowance for Loan and Lease Losses” below for additional information. NOTE 5—ALLOWANCE FOR LOAN AND LEASE LOSSES We maintain an allowance for loan and lease losses that represents management’s best estimate of incurred loan and lease losses inherent in our held-for-investment portfolio as of each balance sheet date. We do not maintain an allowance for held-for-sale loans or acquired loans that are performing, in accordancewith or better than our expectations, as of the date of acquisition, as the fair value of these loans already reflect a credit component.
In addition to the allowance for loan and lease losses, we also estimate probable losses related to unfunded lending commitments, such as letters of credit,financial guarantees, and binding unfunded loan commitments. The provision for unfunded lending commitments is included in the provision for credit losses onour consolidated statements of income and the related reserve for unfunded lending commitments is included in other liabilities on our consolidated balancesheets.
In the first quarter of 2013, we changed our process for estimating the allowance and reserve for unfunded lending commitments for our commercial loanportfolio. First, we extended our internal historical credit loss experience period back to at least 2008 and incorporated external industry loss data over a longerhorizon to derive our loss estimates. We previously generally used the most recent three-year period of internal historical loss experience to derive our lossestimates. Second, we incorporated more borrower-specific and loan-specific risk factors into our analysis and established a statistically-based internal risk ratingsystem. Based on this statistically-based risk rating system, we now apply an estimated probability of default and loss given default for nearly each loan in ourportfolio to derive the total loss estimate for our commercial loan portfolio. These changes, which were supplemented by management judgment, resulted in a netincrease in the combined allowance losses and reserve for unfunded lending commitments of $37 million as of March 31, 2013 and a corresponding increase inthe provision for credit losses of $37 million in the first quarter of 2013. The gross impact of these changes resulted in a decrease in the allowance of $2 millionand an increase in the reserve for
101

Table of Contents
CAPITAL ONE FINANCIAL CORPORATIONNOTES TO CONDENSED CONSOLIDATED FINANCIAL STATEMENTS (UNAUDITED)—(Continued)
unfunded lending commitments of $39 million as of March 31, 2013. We do not expect these changes to have a material future impact on our allowance andreserve for unfunded lending commitments for our commercial loan portfolio.
See “Note 1—Summary of Significant Accounting Policies” of our 2012 Form 10-K” for further discussion on the methodologies and policies for determiningour allowance for loan and lease losses for each of our loan portfolio segments.
Allowance for Loan and Lease Losses Activity
The allowance for loan and lease losses is increased through the provision for credit losses and reduced by net charge-offs. The provision for credit losses, whichis charged to earnings, reflects credit losses we believe have been incurred and will eventually be reflected over time in our charge-offs. Charge-offs ofuncollectible amounts are deducted from the allowance and subsequent recoveries are included. The table below summarizes changes in the allowance for loanand lease losses, by portfolio segment, for the three months ended March 31, 2013 and 2012: Three Months Ended March 31, 2013
CreditCard
Consumer
Commercial
Other
TotalAllowance
UnfundedLending
CommitmentsReserve
CombinedAllowance
&UnfundedReserve (Dollars in millions) Auto
HomeLoan
RetailBanking
TotalConsumer
Balance as of December 31, 2012 $ 3,979 $ 486 $ 113 $ 112 $ 711 $ 433 $ 33 $ 5,156 $ 35 $ 5,191 Provision for credit losses 743 164 (6) 17 175 (85) 2 835 50 885 Charge-offs (1,262) (182) (7) (25) (214) (12) (8) (1,496) 0 (1,496) Recoveries 340 60 3 8 71 5 1 417 0 417
Net charge-offs (922) (122) (4) (17) (143) (7) (7) (1,079) 0 (1,079) Other changes (306) 0 0 0 0 1 (1) (306) 0 (306)
Balance as of March 31, 2013 $ 3,494 $ 528 $ 103 $ 112 $ 743 $ 342 $ 27 $ 4,606 $ 85 $ 4,691
Three Months Ended March 31, 2012
CreditCard
Consumer
Commercial
Other
TotalAllowance
UnfundedLending
CommitmentsReserve
CombinedAllowance
&UnfundedReserve (Dollars in millions) Auto
HomeLoan
RetailBanking
TotalConsumer
Balance as of December 31, 2011 $2,847 $ 391 $ 98 $ 163 $ 652 $ 715 $ 36 $ 4,250 $ 66 $ 4,316 Provision for credit losses 459 147 19 8 174 (63) 9 579 (6) 573 Charge-offs (955) (140) (24) (20) (184) (36) (11) (1,186) 0 (1,186) Recoveries 309 61 9 6 76 20 1 406 0 406
Net charge-offs (646) (79) (15) (14) (108) (16) (10) (780) 0 (780)Other changes 11 0 0 0 0 0 0 11 0 11
Balance as of March 31, 2012 $2,671 $ 459 $ 102 $ 157 $ 718 $ 636 $ 35 $ 4,060 $ 60 $ 4,120
Other consists of our discontinued GreenPoint mortgage operations loan portfolio and our community redevelopment loan portfolio.
102
(1)
(1)
(1)

Table of Contents
CAPITAL ONE FINANCIAL CORPORATIONNOTES TO CONDENSED CONSOLIDATED FINANCIAL STATEMENTS (UNAUDITED)—(Continued)
Components of Allowance for Loan and Lease Losses by Impairment Methodology
The table below presents the components of our allowance for loan and lease losses, by loan category and impairment methodology, and the recorded investmentof the related loans as of March 31, 2013 and December 31, 2012: March 31, 2013 Consumer
(Dollars in millions) CreditCard Auto
HomeLoan
RetailBanking
TotalConsumer Commercial Other Total
Allowance for loan and lease losses by impairment methodology: Collectively evaluated $ 3,167 $ 510 $ 36 $ 100 $ 646 $ 298 $ 27 $ 4,138 Asset-specific 327 18 13 11 42 41 0 410 Acquired loans 0 0 54 1 55 3 0 58
Total allowance for loan and lease losses $ 3,494 $ 528 $ 103 $ 112 $ 743 $ 342 $ 27 $ 4,606
Held-for-investment loans by impairment methodology: Collectively evaluated $77,354 $27,601 $ 7,437 $ 3,609 $ 38,647 $ 38,283 $ 134 $154,418 Asset-specific 839 326 168 95 589 544 0 1,972 Acquired loans 204 13 34,326 38 34,377 323 39 34,943
Total held-for-investment loans $78,397 $27,940 $41,931 $ 3,742 $ 73,613 $ 39,150 $ 173 $191,333
Allowance as a percentage of period-end held-for-investment loans 4.46% 1.89% 0.25% 2.99% 1.01% 0.87% 15.61% 2.41% December 31, 2012 Consumer
(Dollars in millions) CreditCard Auto
HomeLoan
RetailBanking
TotalConsumer Commercial Other Total
Allowance for loan and lease losses byimpairment methodology:
Collectively evaluated $ 3,648 $ 466 $ 47 $ 104 $ 617 $ 376 $ 32 $ 4,673 Asset-specific 331 20 13 7 40 54 1 426 Acquired loans 0 0 53 1 54 3 0 57
Total allowance for loan and lease losses $ 3,979 $ 486 $ 113 $ 112 $ 711 $ 433 $ 33 $ 5,156
Held-for-investment loans by impairmentmethodology:
Collectively evaluated $90,594 $26,778 $ 7,552 $3,774 $ 38,104 $ 37,923 $ 154 $166,775 Asset-specific 873 328 145 96 569 538 0 1,980 Acquired loans 288 17 36,403 34 36,454 359 33 37,134
Total held-for-investment loans $91,755 $27,123 $44,100 $3,904 $ 75,127 $ 38,820 $ 187 $205,889
Allowance as a percentage of period-end held-for-investment loans 4.34% 1.79% 0.26% 2.87% 0.95% 1.12% 17.65% 2.50%
The component of the allowance for credit card and other consumer loans that we collectively evaluate for impairment is based on a statistical calculation. The component of the allowance for commercial
loans, which we collectively evaluate for impairment, is based on historical loss experience for loans with similar characteristics and consideration of credit quality supplemented by management judgmentand interpretation.
The asset-specific component of the allowance for smaller-balance impaired loans is calculated on a pool basis using historical loss experience for the respective class of assets. The asset-specificcomponent of the allowance for larger-balance commercial loans is individually calculated for each loan.
The acquired loans component of the allowance is accounted for based on expected cash flows. See “Note 4—Loans” for details on these loans.
103
(1)(2)
(3)
(1)(2)
(3)
(1)
(2)
(3)
(1)
(2)
(3)
(1)
(2)
(3)

Table of Contents
CAPITAL ONE FINANCIAL CORPORATIONNOTES TO CONDENSED CONSOLIDATED FINANCIAL STATEMENTS (UNAUDITED)—(Continued)
NOTE 6—VARIABLE INTEREST ENTITIES AND SECURITIZATIONS In the normal course of business, we enter into various types of transactions with entities that are considered to be VIEs. Historically, our primary involvementwith VIEs has been related to our securitization transactions in which we transferred assets from our balance sheet to securitization trusts. These securitizationtrusts typically meet the definition of a VIE. We have generally securitized credit card loans, auto loans, home loans and installment loans, which have provided asource of funding for us and enabled us to transfer a certain portion of the economic risk of the loans or debt securities to third parties.
The entity that has a controlling financial interest in a VIE is referred to as the primary beneficiary and is required to consolidate the VIE. The vast majority of theVIEs in which we are involved have been consolidated in our financial statements.
Summary of Consolidated and Unconsolidated VIEs
The table below presents a summary of VIEs, aggregated based on VIEs with similar characteristics, in which we had continuing involvement or held a variableinterest as of March 31, 2013 and December 31, 2012. We separately present information for consolidated and unconsolidated VIEs.
For consolidated VIEs, we present the carrying amount of assets and liabilities reflected on our consolidated balance sheets. The assets of consolidated VIEsprimarily consist of cash and loans, which we report on our consolidated balance sheets under restricted cash and restricted loans, respectively, for securitizationinvestors. The assets of a particular VIE are the primary source of funds to settle its obligations. The creditors of the VIEs typically do not have recourse to thegeneral credit of our company. The liabilities primarily consist of debt securities issued by the VIEs, which we report under securitized debt obligations. Forunconsolidated VIEs, we present the carrying amount of assets and liabilities reflected on our consolidated balance sheets and our maximum exposure to loss.Our maximum exposure to loss is estimated based on the unlikely event that all of the assets in the VIEs became worthless and we were required to meet ourmaximum remaining funding obligations. March 31, 2013 Consolidated Unconsolidated
(Dollars in millions)
CarryingAmountof Assets
CarryingAmount ofLiabilities
CarryingAmountof Assets
CarryingAmount ofLiabilities
Maximum Exposure
toLoss
Securitization-related VIEs: Credit card loan securitizations $41,629 $ 12,756 $ 0 $ 0 $ 0 Home loan securitizations 38 34 201 17 225 Other asset securitizations 0 0 0 0 0
Total securitization-related VIEs 41,667 12,790 201 17 225
Other VIEs: Affordable housing entities 0 0 2,473 380 2,473 Entities that provide capital to low-income and rural communities 388 97 6 4 6 Other 1 0 110 0 110
Total other VIEs 389 97 2,589 384 2,589
Total VIEs $42,056 $ 12,887 $ 2,790 $ 401 $ 2,814
104
(4)
(1)
(2) (3)
(1)
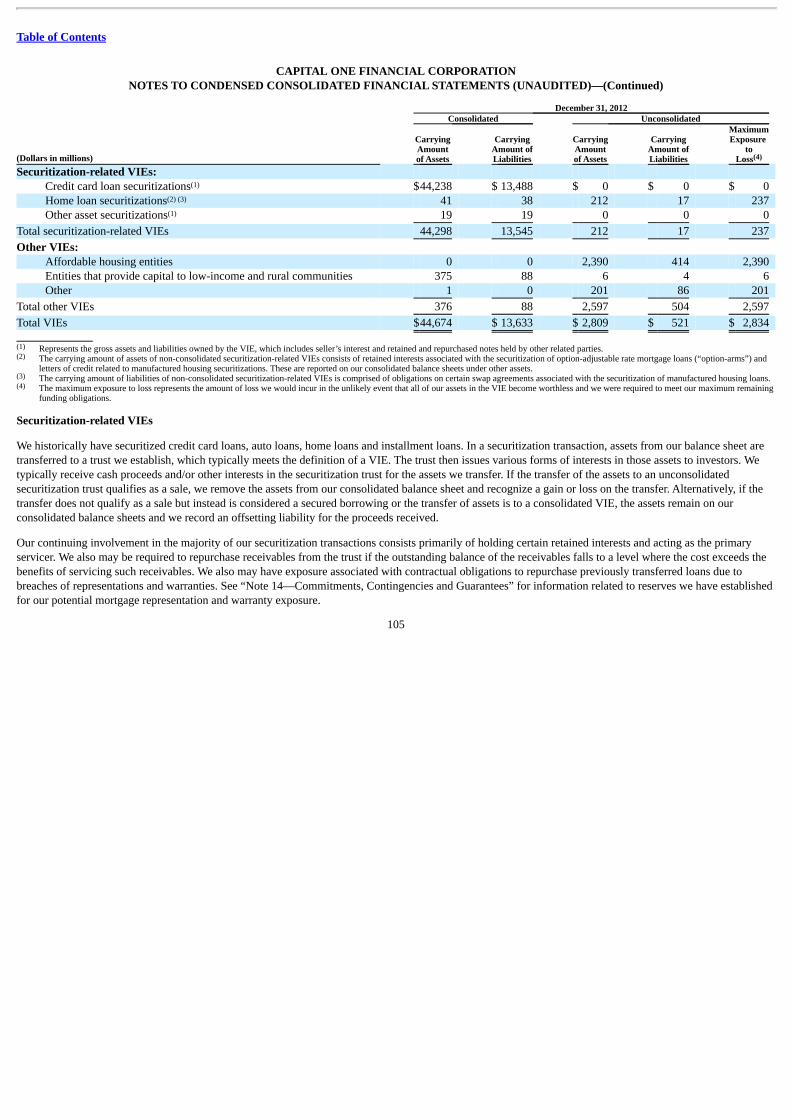
Table of Contents
CAPITAL ONE FINANCIAL CORPORATIONNOTES TO CONDENSED CONSOLIDATED FINANCIAL STATEMENTS (UNAUDITED)—(Continued)
December 31, 2012 Consolidated Unconsolidated
(Dollars in millions)
CarryingAmountof Assets
CarryingAmount ofLiabilities
CarryingAmountof Assets
CarryingAmount ofLiabilities
MaximumExposure
toLoss
Securitization-related VIEs: Credit card loan securitizations $44,238 $ 13,488 $ 0 $ 0 $ 0 Home loan securitizations 41 38 212 17 237 Other asset securitizations 19 19 0 0 0
Total securitization-related VIEs 44,298 13,545 212 17 237
Other VIEs: Affordable housing entities 0 0 2,390 414 2,390 Entities that provide capital to low-income and rural communities 375 88 6 4 6 Other 1 0 201 86 201
Total other VIEs 376 88 2,597 504 2,597
Total VIEs $44,674 $ 13,633 $ 2,809 $ 521 $ 2,834
Represents the gross assets and liabilities owned by the VIE, which includes seller’s interest and retained and repurchased notes held by other related parties. The carrying amount of assets of non-consolidated securitization-related VIEs consists of retained interests associated with the securitization of option-adjustable rate mortgage loans (“option-arms”) and
letters of credit related to manufactured housing securitizations. These are reported on our consolidated balance sheets under other assets. The carrying amount of liabilities of non-consolidated securitization-related VIEs is comprised of obligations on certain swap agreements associated with the securitization of manufactured housing loans. The maximum exposure to loss represents the amount of loss we would incur in the unlikely event that all of our assets in the VIE become worthless and we were required to meet our maximum remaining
funding obligations.
Securitization-related VIEs
We historically have securitized credit card loans, auto loans, home loans and installment loans. In a securitization transaction, assets from our balance sheet aretransferred to a trust we establish, which typically meets the definition of a VIE. The trust then issues various forms of interests in those assets to investors. Wetypically receive cash proceeds and/or other interests in the securitization trust for the assets we transfer. If the transfer of the assets to an unconsolidatedsecuritization trust qualifies as a sale, we remove the assets from our consolidated balance sheet and recognize a gain or loss on the transfer. Alternatively, if thetransfer does not qualify as a sale but instead is considered a secured borrowing or the transfer of assets is to a consolidated VIE, the assets remain on ourconsolidated balance sheets and we record an offsetting liability for the proceeds received.
Our continuing involvement in the majority of our securitization transactions consists primarily of holding certain retained interests and acting as the primaryservicer. We also may be required to repurchase receivables from the trust if the outstanding balance of the receivables falls to a level where the cost exceeds thebenefits of servicing such receivables. We also may have exposure associated with contractual obligations to repurchase previously transferred loans due tobreaches of representations and warranties. See “Note 14—Commitments, Contingencies and Guarantees” for information related to reserves we have establishedfor our potential mortgage representation and warranty exposure.
105
(4)
(1)
(2) (3)
(1)
(1)(2)
(3)(4)

Table of Contents
CAPITAL ONE FINANCIAL CORPORATIONNOTES TO CONDENSED CONSOLIDATED FINANCIAL STATEMENTS (UNAUDITED)—(Continued)
The table below presents the securitization-related VIEs in which we had continuing involvement as of March 31, 2013 and December 31, 2012: Non-Mortgage Mortgage
(Dollars in millions) CreditCard
OtherLoan
OptionArm
GreenPointHELOCs
GreenPointManufactured
Housing March 31, 2013: Securities held by third-party investors $ 11,011 $ 0 $2,616 $ 147 $ 1,086 Receivables in the trust 40,612 0 2,706 140 1,093 Cash balance of spread or reserve accounts 0 0 8 0 159 Retained interests Yes Yes Yes Yes Yes Servicing retained Yes Yes Yes Yes No Amortization event No No No Yes No December 31, 2012: Securities held by third-party investors $11,347 $ 13 $2,702 $ 158 $ 1,117 Receivables in the trust 43,811 19 2,794 151 1,123 Cash balance of spread or reserve accounts 0 0 8 0 164 Retained interests Yes Yes Yes Yes Yes Servicing retained Yes Yes Yes Yes No Amortization event No No No Yes No
We continue to service some of the outstanding balance of securitized mortgage receivables. See the information below regarding our on-going involvement in the GreenPoint Home Equity Line of Credit (“HELOC”) securitizations. The manufactured housing securitizations are serviced by a third party. For two of the deals, that third party works in the capacity of subservicer with Capital One being the Master Servicer. Amortization events vary according to each specific trust agreement but generally are triggered by declines in performance or credit metrics such as charge-off rates or delinquency rates below certain
predetermined thresholds. Generally, the occurrence of an amortization event changes the sequencing and amount of trust-related cash flows to the benefit of senior noteholders.
Non-Mortgage Securitizations
As of March 31, 2013 and December 31, 2012, we were deemed to be the primary beneficiary of all of our non-mortgage securitization trusts. Accordingly, all ofthese trusts have been consolidated in our financial statements. For additional information on our principal involvement with non-mortgage securitization trustsand the impact of the consolidation of these trusts on our financial statements, see “Note 1—Summary of Significant Accounting Policies” and “Note 6—VariableInterest Entities and Securitizations” of our 2012 Form 10-K.
Mortgage Securitizations
Option-ARM Loans
We had previously securitized option-ARM mortgage loans by transferring the mortgage loans to securitization trusts that had issued mortgage-backed securitiesto investors. The outstanding balance of debt securities held by third-party investors related to our mortgage loan securitization trusts was $2.6 billion and $2.7billion as of March 31, 2013 and December 31, 2012, respectively.
We continue to service some of the outstanding balance of securitized mortgage receivables. We also retain rights to future cash flows arising from thereceivables, the most significant being certificated interest-only bonds issued by the trusts. We generally estimate the fair value of these retained interests basedon the estimated
106
(1) (1) (3)
(4) (2)
(1) (1) (3)
(4) (2)
(1)(2)(3)(4)

Table of Contents
CAPITAL ONE FINANCIAL CORPORATIONNOTES TO CONDENSED CONSOLIDATED FINANCIAL STATEMENTS (UNAUDITED)—(Continued)
present value of expected future cash flows from securitized and sold receivables, using our best estimates of the key assumptions which include credit losses,prepayment speeds and discount rates commensurate with the risks involved. We do not consolidate these trusts because we do not have the right to receivebenefits that could potentially be significant nor the obligation to absorb losses that could potentially be significant to the trusts.
In connection with the securitization of certain option-ARM loans, a third party is obligated to advance a portion of any “negative amortization” resulting frommonthly payments that are less than the interest accrued for that payment period. We have an agreement in place with the third party that mirrors this advancerequirement. The amount advanced is tracked through mortgage-backed securities retained as part of the securitization transaction. As the borrowers makeprincipal payments, these securities receive their net pro rata portion of those payments in cash and advances of negative amortization are refunded accordingly.As advances occur, we record an asset in the form of negative amortization bonds, which are held at fair value in other assets on our consolidated balance sheets.We have also entered into certain derivative contracts related to the securitization activities. These are classified as free standing derivatives, with fair valueadjustments recorded in non-interest income. See “Note 9—Derivative Instruments and Hedging Activities” for further details on these derivatives.
GreenPoint Mortgage HELOCs
Our discontinued wholesale mortgage banking unit, GreenPoint, previously sold home equity lines of credit in whole loan sales and subsequently acquiredresidual interests in certain trusts which securitized some of those loans. As the residual interest holder, GreenPoint is required to fund advances on the homeequity lines of credit when certain performance triggers are met due to deterioration in asset performance. As of March 31, 2013 we funded $29 million inadvances, which are generally expensed as funded. We also have unfunded commitments of $8 million related to those interests for both our consolidated andnon-consolidated VIEs as of March 31, 2013.
GreenPoint Mortgage Manufactured Housing
We retain the primary obligation for certain provisions of corporate guarantees, recourse sales and clean-up calls related to the discontinued manufacturedhousing operations of GreenPoint Credit LLC (“GPC”), which was sold to a third party in 2004. Although we are the primary obligor, recourse obligations relatedto former GPC whole loan sales, commitments to exercise mandatory clean-up calls on certain GPC securitization transactions and servicing were transferred to athird party in the sale transaction. We do not consolidate the trusts used for the securitization of manufactured housing loans because we do not have the power todirect the activities that most significantly impact the economic performance of the trusts since we no longer service the loans.
We were required to fund letters of credit in 2004 to cover losses and are obligated to fund future amounts under swap agreements for certain transactions. Wehave the right to receive any funds remaining in the letters of credit after the securities are released. The amount available under the letters of credit was $159million and $164 million as of March 31, 2013 and December 31, 2012, respectively. The fair value of the expected residual balances on the funded letters ofcredit was $38 million and $50 million as of March 31, 2013 and December 31, 2012, respectively, and is included in other assets on the consolidated balancesheets.
The unpaid principal balance of manufactured housing securitization transactions where we are the residual interest holder was $1.1 billion as of March 31, 2013and December 31, 2012. In the event the third party servicer does not fulfill on its option to exercise the clean-up calls on certain transactions, the option revertsto us and we would assume approximately $420 million of loans receivable upon our execution of the clean-up call with the requirement to absorb any losses onthe loans receivable.
107

Table of Contents
CAPITAL ONE FINANCIAL CORPORATIONNOTES TO CONDENSED CONSOLIDATED FINANCIAL STATEMENTS (UNAUDITED)—(Continued)
We monitor the underlying assets for trends in delinquencies and related losses and review the purchaser’s financial strength as well as servicing performance.These factors are considered in assessing the adequacy of the liabilities established for these obligations and the valuations of the assets.
Other VIEs
Affordable Housing Entities
As part of our community reinvestment initiatives, we invest in private investment funds that make equity investments in multi-family affordable housingproperties. We receive affordable housing tax credits for these investments. The activities of these entities are financed with a combination of invested equitycapital and debt. For those investment funds considered to be VIEs, we are not required to consolidate them if we do not have the power to direct the activitiesthat most significantly impact the economic performance of those entities. We record our interests in these unconsolidated VIEs in loans held for investment,other assets and other liabilities on our consolidated balance sheets. As of March 31, 2013 and December 31, 2012 our interests consisted of assets ofapproximately $2.5 billion and $2.4 billion, respectively. Our maximum exposure to these entities is limited to our variable interests in the entities and was $2.5billion as of March 31, 2013. The creditors of the VIEs have no recourse to our general credit and we do not provide additional financial or other support duringthe period that we were not previously contractually required to provide. The total assets of the unconsolidated investment funds that were VIEs as of March 31,2013 and December 31, 2012 were approximately $8.0 billion and $7.7 billion, respectively.
Entities that Provide Capital to Low-Income and Rural Communities
We hold variable interests in entities (“Investor Entities”) that invest in community development entities (“CDEs”) that provide debt financing to businesses andnon-profit entities in low-income and rural communities. Variable interests in the CDEs held by the consolidated Investor Entities are also our variable interests.The activities of the Investor Entities are financed with a combination of invested equity capital and debt. The activities of the CDEs are financed solely withinvested equity capital. We receive federal and state tax credits for these investments. We consolidate the VIEs in which we have the power to direct the activitiesthat most significantly impact the VIE’s economic performance and the obligation to absorb losses or right to receive benefits that could be potentially significantto the VIE. We have also consolidated other investments and CDEs that we do not consider VIEs. The assets of the VIEs that we consolidated as of March 31,2013 and as of December 31, 2012 totaled approximately $388 million and $375 million, respectively. The assets of the consolidated VIEs are reflected on ourconsolidated balance sheets in cash, loans held for investment, interest receivable and other assets. The liabilities are reflected in other liabilities.
The total assets of the VIEs that we held an interest in but were not required to consolidate as of March 31, 2013 and December 31, 2012 totaled approximately$6 million. Our interests in these unconsolidated VIEs are reflected on our consolidated balance sheets in loans held for investment and other assets. Ourmaximum exposure to these entities is limited to our variable interest of $6 million as of March 31, 2013. The creditors of the VIEs have no recourse to ourgeneral credit. We have not provided additional financial or other support during the period that we were not previously contractually required to provide.
108
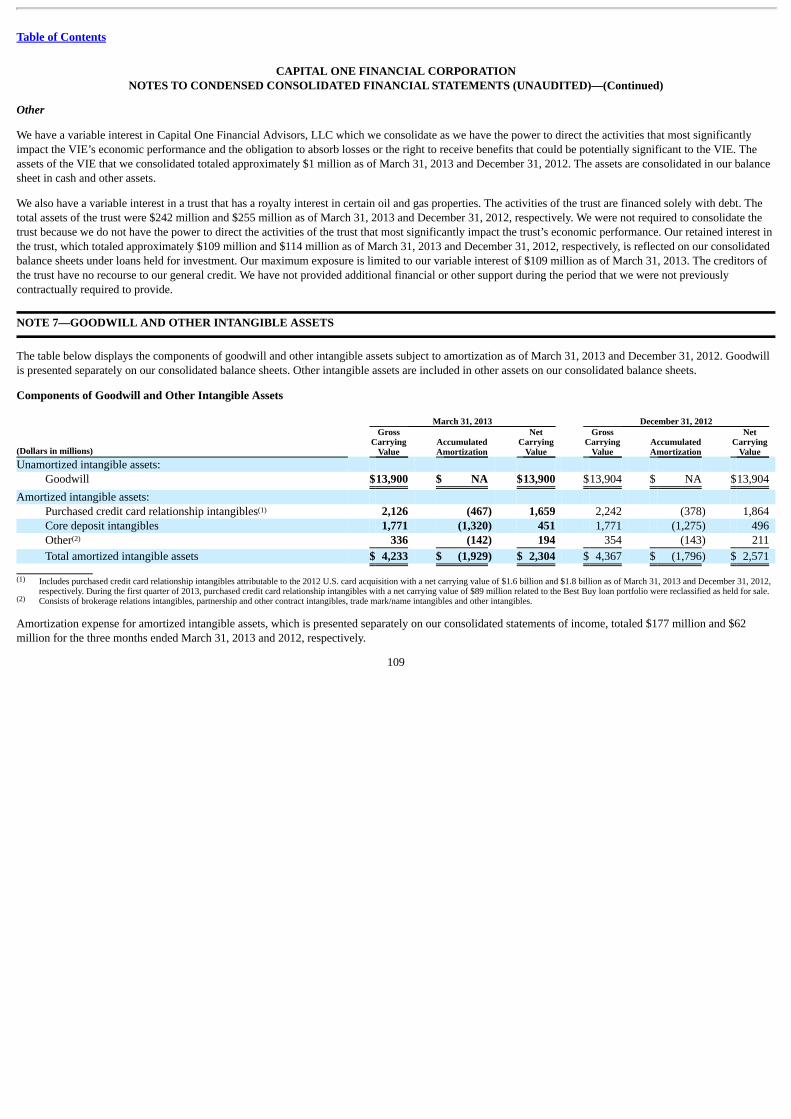
Table of Contents
CAPITAL ONE FINANCIAL CORPORATIONNOTES TO CONDENSED CONSOLIDATED FINANCIAL STATEMENTS (UNAUDITED)—(Continued)
Other
We have a variable interest in Capital One Financial Advisors, LLC which we consolidate as we have the power to direct the activities that most significantlyimpact the VIE’s economic performance and the obligation to absorb losses or the right to receive benefits that could be potentially significant to the VIE. Theassets of the VIE that we consolidated totaled approximately $1 million as of March 31, 2013 and December 31, 2012. The assets are consolidated in our balancesheet in cash and other assets.
We also have a variable interest in a trust that has a royalty interest in certain oil and gas properties. The activities of the trust are financed solely with debt. Thetotal assets of the trust were $242 million and $255 million as of March 31, 2013 and December 31, 2012, respectively. We were not required to consolidate thetrust because we do not have the power to direct the activities of the trust that most significantly impact the trust’s economic performance. Our retained interest inthe trust, which totaled approximately $109 million and $114 million as of March 31, 2013 and December 31, 2012, respectively, is reflected on our consolidatedbalance sheets under loans held for investment. Our maximum exposure is limited to our variable interest of $109 million as of March 31, 2013. The creditors ofthe trust have no recourse to our general credit. We have not provided additional financial or other support during the period that we were not previouslycontractually required to provide. NOTE 7—GOODWILL AND OTHER INTANGIBLE ASSETS The table below displays the components of goodwill and other intangible assets subject to amortization as of March 31, 2013 and December 31, 2012. Goodwillis presented separately on our consolidated balance sheets. Other intangible assets are included in other assets on our consolidated balance sheets.
Components of Goodwill and Other Intangible Assets March 31, 2013 December 31, 2012
(Dollars in millions)
GrossCarrying
Value AccumulatedAmortization
NetCarrying
Value
GrossCarrying
Value AccumulatedAmortization
NetCarrying
Value Unamortized intangible assets:
Goodwill $13,900 $ NA $13,900 $13,904 $ NA $13,904
Amortized intangible assets: Purchased credit card relationship intangibles 2,126 (467) 1,659 2,242 (378) 1,864 Core deposit intangibles 1,771 (1,320) 451 1,771 (1,275) 496 Other 336 (142) 194 354 (143) 211
Total amortized intangible assets $ 4,233 $ (1,929) $ 2,304 $ 4,367 $ (1,796) $ 2,571
Includes purchased credit card relationship intangibles attributable to the 2012 U.S. card acquisition with a net carrying value of $1.6 billion and $1.8 billion as of March 31, 2013 and December 31, 2012,
respectively. During the first quarter of 2013, purchased credit card relationship intangibles with a net carrying value of $89 million related to the Best Buy loan portfolio were reclassified as held for sale. Consists of brokerage relations intangibles, partnership and other contract intangibles, trade mark/name intangibles and other intangibles.
Amortization expense for amortized intangible assets, which is presented separately on our consolidated statements of income, totaled $177 million and $62million for the three months ended March 31, 2013 and 2012, respectively.
109
(1)
(2)
(1)
(2)
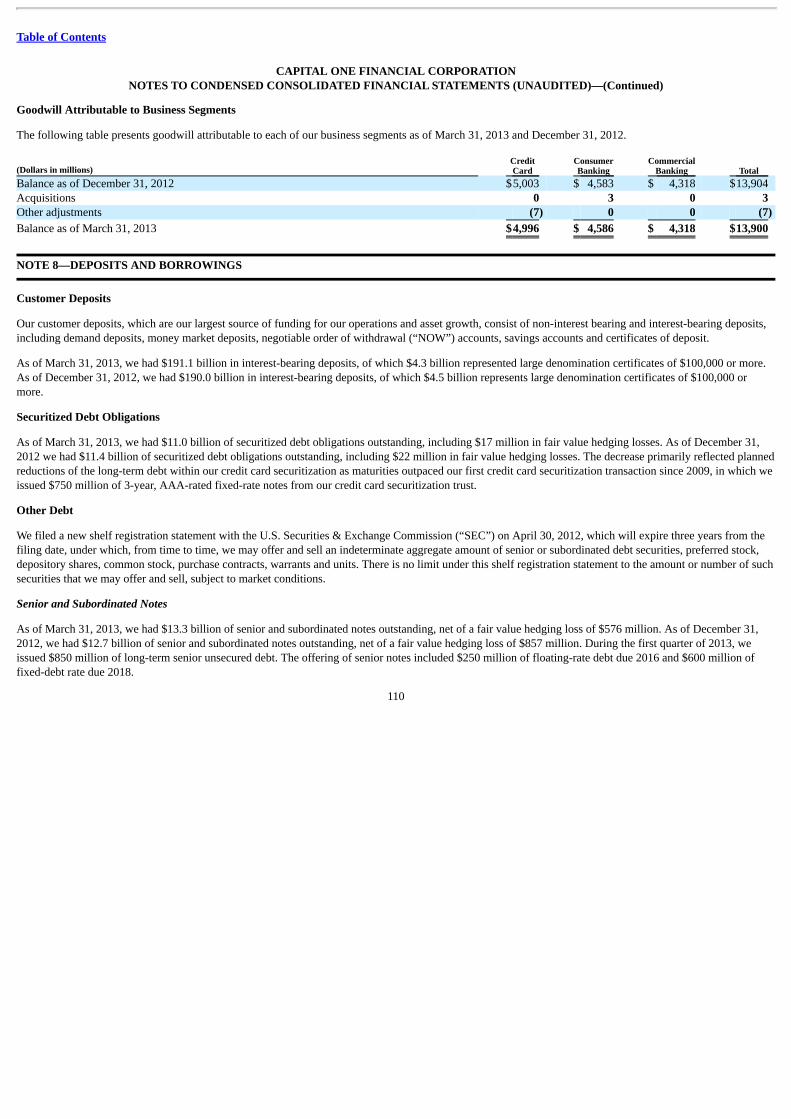
Table of Contents
CAPITAL ONE FINANCIAL CORPORATIONNOTES TO CONDENSED CONSOLIDATED FINANCIAL STATEMENTS (UNAUDITED)—(Continued)
Goodwill Attributable to Business Segments
The following table presents goodwill attributable to each of our business segments as of March 31, 2013 and December 31, 2012.
(Dollars in millions) CreditCard
ConsumerBanking
CommercialBanking Total
Balance as of December 31, 2012 $5,003 $ 4,583 $ 4,318 $13,904 Acquisitions 0 3 0 3 Other adjustments (7) 0 0 (7)
Balance as of March 31, 2013 $4,996 $ 4,586 $ 4,318 $13,900
NOTE 8—DEPOSITS AND BORROWINGS Customer Deposits
Our customer deposits, which are our largest source of funding for our operations and asset growth, consist of non-interest bearing and interest-bearing deposits,including demand deposits, money market deposits, negotiable order of withdrawal (“NOW”) accounts, savings accounts and certificates of deposit.
As of March 31, 2013, we had $191.1 billion in interest-bearing deposits, of which $4.3 billion represented large denomination certificates of $100,000 or more.As of December 31, 2012, we had $190.0 billion in interest-bearing deposits, of which $4.5 billion represents large denomination certificates of $100,000 ormore.
Securitized Debt Obligations
As of March 31, 2013, we had $11.0 billion of securitized debt obligations outstanding, including $17 million in fair value hedging losses. As of December 31,2012 we had $11.4 billion of securitized debt obligations outstanding, including $22 million in fair value hedging losses. The decrease primarily reflected plannedreductions of the long-term debt within our credit card securitization as maturities outpaced our first credit card securitization transaction since 2009, in which weissued $750 million of 3-year, AAA-rated fixed-rate notes from our credit card securitization trust.
Other Debt
We filed a new shelf registration statement with the U.S. Securities & Exchange Commission (“SEC”) on April 30, 2012, which will expire three years from thefiling date, under which, from time to time, we may offer and sell an indeterminate aggregate amount of senior or subordinated debt securities, preferred stock,depository shares, common stock, purchase contracts, warrants and units. There is no limit under this shelf registration statement to the amount or number of suchsecurities that we may offer and sell, subject to market conditions.
Senior and Subordinated Notes
As of March 31, 2013, we had $13.3 billion of senior and subordinated notes outstanding, net of a fair value hedging loss of $576 million. As of December 31,2012, we had $12.7 billion of senior and subordinated notes outstanding, net of a fair value hedging loss of $857 million. During the first quarter of 2013, weissued $850 million of long-term senior unsecured debt. The offering of senior notes included $250 million of floating-rate debt due 2016 and $600 million offixed-debt rate due 2018.
110

Table of Contents
CAPITAL ONE FINANCIAL CORPORATIONNOTES TO CONDENSED CONSOLIDATED FINANCIAL STATEMENTS (UNAUDITED)—(Continued)
In the first quarter of 2013, we also exchanged $1.2 billion of outstanding 8.80% subordinated notes due 2019. The transaction involved offering current holdersmarket value plus an exchange premium for these outstanding notes, which consideration was paid through a combination of $1.4 billion of new 3.375%subordinated notes due 2023 and cash of $209 million. The exchange was accounted for as a modification of debt.
See “Note 9—Derivative Instruments and Hedging Activities” for information about our fair value hedging activities.
Junior Subordinated Debentures
In the first quarter of 2013, in connection with our redemption of our trust preferred securities, we redeemed our junior subordinated debt with an aggregatecarrying value of $3.65 billion, resulting in a $65 million loss on extinguishment of debt.
FHLB Advances
In addition to issuance capacity under the shelf registration statement, we have access to other borrowing programs, including advances from the FHLB. OurFHLB membership is secured by our investment in FHLB stock which totaled $819 million and $1.3 billion as of March 31, 2013 and December 31, 2012,respectively, and is included in other assets on our consolidated balance sheets.
We had outstanding FHLB advances, which were secured by our investment securities, residential home loans, multifamily loans, commercial real-estate loansand home equity lines of credit, totaling $12.3 billion and $20.9 billion as of March 31, 2013 and December 31, 2012, respectively.
Composition of Customer Deposits, Short-term Borrowings and Long-term Debt
The table below summarizes the components of our deposits, short-term borrowings and long-term debt as of March 31, 2013 and December 31, 2012. Our totalshort-term borrowings consist of federal funds purchased and securities loaned and sold under agreements to repurchase and other short-term borrowings with anoriginal contractual maturity of one year or less. Our long-term debt consists of borrowings with an original contractual maturity of greater than one year. Theamounts presented for outstanding borrowings include unamortized debt premiums and discounts, net of fair value hedge accounting adjustments.
(Dollars in millions) March 31,
2013 December 31,
2012 Deposits: Non-interest bearing deposits $ 21,317 $ 22,467 Interest-bearing deposits 191,093 190,018
Total deposits $212,410 $ 212,485
Short-term borrowings: Federal funds purchased and securities loaned or sold under agreements to repurchase $ 855 $ 1,248 FHLB advances 11,301 19,900
Total short-term borrowings $ 12,156 $ 21,148
111

Table of Contents
CAPITAL ONE FINANCIAL CORPORATIONNOTES TO CONDENSED CONSOLIDATED FINANCIAL STATEMENTS (UNAUDITED)—(Continued)
March 31, 2013
(Dollars in millions) Maturity
Date Interest Rate
WeightedAverage
Interest Rate December 31,
2012 Long-term debt: Securitized debt obligations 2013 - 2030 0.24% - 6.40% 1.76% $11,046 $ 11,398 Senior and subordinated notes:
Fixed unsecured senior debt 2013 - 2021 1.00% - 7.38% 4.19% 9,175 8,623 Floating unsecured senior debt 2014 - 2016 0.73% - 1.45% 1.04% 750 500
Total unsecured senior debt 3.94% 9,925 9,123 Fixed unsecured subordinated debt 2013 - 2023 3.38% - 8.80% 5.21% 3,330 3,563
Total senior and subordinated notes 13,255 12,686 Other long-term borrowings:
Fixed junior subordinated debt N/A N/A N/A 0 3,641 FHLB advances 2013 - 2023 0.36% - 6.88% 0.85% 1,035 1,037
Total other long-term borrowings 1,035 4,678 Total long-term debt $25,336 $ 28,762
Total short-term borrowings and long-term debt $37,492 $ 49,910
Components of Interest Expense
The following table displays interest expense attributable to short-term borrowings and long-term debt for the three months ended March 31, 2013 and 2012:
Three Months Ended
March 31, (Dollars in millions) 2013 2012 Short-term borrowings: Federal funds purchased and securities loaned or sold under agreements to
repurchase $ 0 $ 1 FHLB advances 11 1
Total short-term borrowings 11 2
Long-term debt: Securitized debt obligations 56 80 Senior and subordinated notes:
Unsecured senior debt 56 58 Unsecured subordinated debt 26 30
Total senior and subordinated notes 82 88
Other long-term borrowings: Junior subordinated debt 1 79 FHLB advances 2 3 Other 3 2
Total long-term debt 144 252
Total short-term borrowings and long-term debt $ 155 $ 254
112

Table of Contents
CAPITAL ONE FINANCIAL CORPORATIONNOTES TO CONDENSED CONSOLIDATED FINANCIAL STATEMENTS (UNAUDITED)—(Continued)
NOTE 9—DERIVATIVE INSTRUMENTS AND HEDGING ACTIVITIES Use of Derivatives
We manage our asset/liability position and market risk exposure in accordance with prescribed risk management policies and limits established by our AssetLiability Management Committee and approved by our Board of Directors. Our primary market risk stems from the impact on our earnings and economic valueof equity from changes in interest rates, and to a lesser extent, changes in foreign exchange rates. We manage our interest rate sensitivity through severalapproaches, which include, but are not limited to, changing the maturity and re-pricing characteristics of various balance sheet categories and by entering intointerest rate derivatives. Derivatives are also utilized to manage our exposure to changes in foreign exchange rates. Derivative instruments may be privatelynegotiated contracts, which are often referred to as over-the-counter (“OTC”) derivatives, or they may be listed and traded on an exchange. We execute ourderivative contracts in both the OTC and exchange-traded derivative markets. In addition to interest rate swaps, we use a variety of other derivative instruments,including caps, floors, options, futures and forward contracts, to manage our interest rate and foreign currency risk. On a regular basis, we enter into customer-accommodation derivative transactions. We engage in these transactions as a service to our commercial banking customers to facilitate their risk managementobjectives. We typically offset the market risk exposure to our customer-accommodation derivatives through derivative transactions with other counterparties.
Accounting for Derivatives
We account for derivatives pursuant to the accounting standards for derivatives and hedging activities. The outstanding notional amount of our derivativecontracts totaled $59.6 billion as of March 31, 2013, compared with $57.8 billion as of December 31, 2012. The notional amount provides an indication of thevolume of our derivatives activity and is used as the basis on which interest and other payments are determined; however, it is generally not the amountexchanged. Derivatives are recorded at fair value in our consolidated balance sheets. The fair value of a derivative represents our estimate of the amount at whicha derivative could be exchanged in an orderly transaction between market participants. We report derivatives in a gain position, or derivative assets, in ourconsolidated balance sheets as a component of other assets. We report derivatives in a loss position, or derivative liabilities, in our consolidated balance sheets asa component of other liabilities. We report derivative asset and liability amounts on a gross basis based on individual contracts, which does not take intoconsideration the effects of master netting agreements or collateral netting. The fair value of derivative assets and derivative liabilities reported in ourconsolidated balance sheets was $1.6 billion and $370 million, respectively, as of March 31, 2013, compared with $1.8 billion and $400 million, respectively, asof December 31, 2012.
Our derivatives are designated as either qualifying accounting hedges or free-standing derivatives. Free-standing derivatives consist of customer-accommodationderivatives and economic hedges that we enter into for risk management purposes that are not linked to specific assets or liabilities or to forecasted transactionsand, therefore, do not qualify for hedge accounting. Qualifying accounting hedges are designated as fair value hedges, cash flow hedges or net investment hedges.
• Fair Value Hedges: We designate derivatives as fair value hedges to manage our exposure to changes in the fair value of certain financial assets andliabilities, which fluctuate in value as a result of movements in interest rates. Changes in the fair value of derivatives designated as fair value hedges arerecorded in earnings together with offsetting changes in the fair value of the hedged item and any resulting ineffectiveness. Our fair value hedges consist ofinterest rate swaps that are intended to modify our exposure
113

Table of Contents
CAPITAL ONE FINANCIAL CORPORATIONNOTES TO CONDENSED CONSOLIDATED FINANCIAL STATEMENTS (UNAUDITED)—(Continued)
to interest rate risk on various fixed rate senior notes, subordinated notes, securitization debt, and brokered certificates of deposits. These hedges havematurities through 2023 and have the effect of converting some of our fixed rate debt and deposits to variable rate.
• Cash Flow Hedges: We designate derivatives as cash flow hedges to manage our exposure to variability in cash flows related to forecasted transactions.Changes in the fair value of derivatives designated as cash flow hedges are recorded as a component of AOCI, to the extent that the hedge relationships areeffective, and amounts are reclassified from AOCI to earnings as the forecasted transactions occur. To the extent that any ineffectiveness exists in the hedgerelationships, the amounts are recorded in current period earnings. Our cash flow hedges consist of interest rate swaps that are intended to hedge thevariability in interest payments on some of our variable rate assets through 2018. These hedges have the effect of converting some of our variable rateassets to a fixed rate. We also have entered into forward foreign currency derivative contracts to hedge our exposure to variability in cash flows related toforeign currency denominated intercompany borrowings.
• Free-Standing Derivatives: We use free-standing derivatives, to hedge the risk of changes in the fair value of residential mortgage servicing rights(“MSRs”), mortgage loan origination and purchase commitments and other interests held. We also categorize our customer-accommodation derivatives andthe related offsetting contracts as free-standing derivatives. Changes in the fair value of free-standing derivatives are recorded in earnings as a component ofother non-interest income.
Balance Sheet Presentation
The following table summarizes the fair value and related outstanding notional amounts of derivative instruments reported in our consolidated balance sheets asof March 31, 2013 and December 31, 2012. The fair value amounts are segregated by derivatives that are designated as accounting hedges and those that are not,and are further segregated by type of contract within those two categories.
114

Table of Contents
CAPITAL ONE FINANCIAL CORPORATIONNOTES TO CONDENSED CONSOLIDATED FINANCIAL STATEMENTS (UNAUDITED)—(Continued)
March 31, 2013 December 31, 2012
Notional orContractual
Amount
Derivatives at Fair Value Notional orContractual
Amount
Derivatives at Fair Value (Dollars in millions) Assets Liabilities Assets Liabilities Derivatives designated as accounting hedges: Interest rate contracts:
Fair value interest rate contracts $ 17,081 $ 717 $ 0 $ 15,902 $ 1,020 $ 0 Cash flow interest rate contracts 13,025 98 19 13,025 116 14
Total interest rate contracts 30,106 815 19 28,927 1,136 14
Foreign exchange contracts: Cash flow foreign exchange contracts 4,844 102 7 5,212 18 40
Total foreign exchange contracts 4,844 102 7 5,212 18 40
Total derivatives designated as accounting hedges 34,950 917 26 34,139 1,154 54
Derivatives not designated as accounting hedges: Interest rate contracts covering:
MSRs 150 11 0 147 12 2 Customer accommodation 19,943 444 244 18,900 479 273 Other interest rate exposures 2,345 41 20 2,553 45 22
Total interest rate contracts 22,438 496 264 21,600 536 297
Foreign exchange contracts 1,322 172 68 1,372 158 46 Other contracts 850 0 12 701 0 3
Total derivatives not designated as accounting hedges 24,610 668 344 23,673 694 346
Total derivatives $ 59,560 $ 1,585 $ 370 $ 57,812 $ 1,848 $ 400
115
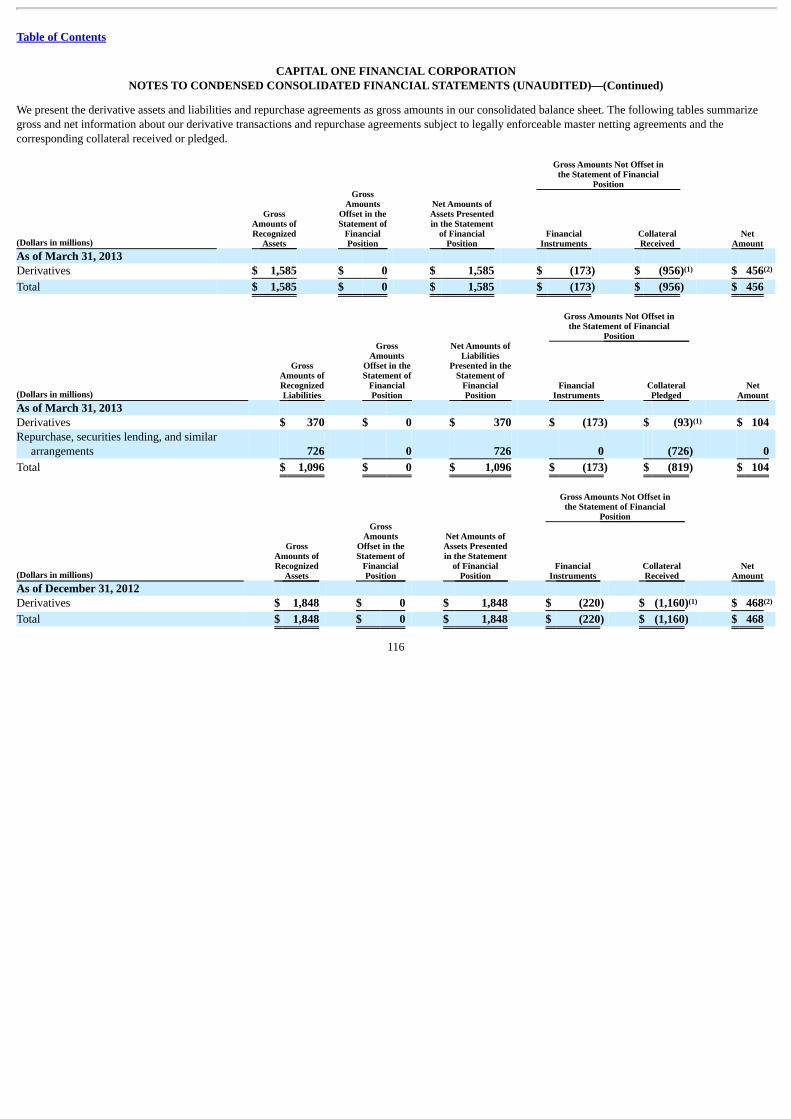
Table of Contents
CAPITAL ONE FINANCIAL CORPORATIONNOTES TO CONDENSED CONSOLIDATED FINANCIAL STATEMENTS (UNAUDITED)—(Continued)
We present the derivative assets and liabilities and repurchase agreements as gross amounts in our consolidated balance sheet. The following tables summarizegross and net information about our derivative transactions and repurchase agreements subject to legally enforceable master netting agreements and thecorresponding collateral received or pledged.
Gross Amounts Not Offset inthe Statement of Financial
Position
(Dollars in millions)
GrossAmounts ofRecognized
Assets
GrossAmounts
Offset in theStatement of
FinancialPosition
Net Amounts ofAssets Presentedin the Statement
of FinancialPosition
FinancialInstruments
CollateralReceived
NetAmount
As of March 31, 2013 Derivatives $ 1,585 $ 0 $ 1,585 $ (173) $ (956) $ 456
Total $ 1,585 $ 0 $ 1,585 $ (173) $ (956) $ 456
Gross Amounts Not Offset inthe Statement of Financial
Position
(Dollars in millions)
GrossAmounts ofRecognizedLiabilities
GrossAmounts
Offset in theStatement of
FinancialPosition
Net Amounts ofLiabilities
Presented in theStatement of
FinancialPosition
FinancialInstruments
CollateralPledged
NetAmount
As of March 31, 2013 Derivatives $ 370 $ 0 $ 370 $ (173) $ (93) $ 104 Repurchase, securities lending, and similar
arrangements 726 0 726 0 (726) 0
Total $ 1,096 $ 0 $ 1,096 $ (173) $ (819) $ 104
Gross Amounts Not Offset inthe Statement of Financial
Position
(Dollars in millions)
GrossAmounts ofRecognized
Assets
GrossAmounts
Offset in theStatement of
FinancialPosition
Net Amounts ofAssets Presentedin the Statement
of FinancialPosition
FinancialInstruments
CollateralReceived
NetAmount
As of December 31, 2012 Derivatives $ 1,848 $ 0 $ 1,848 $ (220) $ (1,160) $ 468
Total $ 1,848 $ 0 $ 1,848 $ (220) $ (1,160) $ 468
116
(1) (2)
(1)
(1) (2)

Table of Contents
CAPITAL ONE FINANCIAL CORPORATIONNOTES TO CONDENSED CONSOLIDATED FINANCIAL STATEMENTS (UNAUDITED)—(Continued)
Gross Amounts NotOffset in the Statement
of Financial Position
(Dollars in millions)
GrossAmounts ofRecognizedLiabilities
GrossAmounts
Offset in theStatement of
FinancialPosition
Net Amounts ofLiabilities
Presented in theStatement of
FinancialPosition
FinancialInstruments
CollateralPledged
NetAmount
As of December 31, 2012 Derivatives $ 400 $ 0 $ 400 $ (220) $ (98) $ 82 Repurchase, securities lending, and similar
arrangements 1,235 0 1,235 0 (1,235) 0
Total $ 1,635 $ 0 $ 1,635 $ (220) $ (1,333) $ 82
(1) When we receive or pledge collateral, we factor in accrued interest when calculating net positions with counterparties.(2) The majority of the net asset position relates to customer swaps. Customer swaps are cross-collateralized by the associated commercial loans and we do not require additional collateral on these
transactions.
Under our existing enforceable master netting arrangements, we have the right to offset contracts with the same counterparty. Under these arrangements, eithercounterparty can request the net settlement of all contracts through a single payment upon default on or termination of any one contract.
Income Statement Presentation and AOCI
The following tables summarize the impact of derivatives and the related hedged items on our consolidated statements of income and AOCI.
Fair Value Hedges and Free-Standing Derivatives
The net gains (losses) recognized in earnings related to derivatives in fair value hedging relationships and free-standing derivatives are presented below for thethree months ended March 31, 2013 and 2012: Three Months Ended March 31, (Dollars in millions) 2013 2012 Derivatives designated as accounting hedges : Fair value interest rate contracts:
Gain (loss) recognized in earnings on derivatives $ (95) $ (68) Gain (loss) recognized in earnings on hedged items 90 59
Net fair value hedge ineffectiveness gain (loss) (5) (9)
Derivatives not designated as accounting hedges : Interest rate contracts covering:
MSRs 0 (2) Customer accommodation 9 11 Other interest rate exposures (1) (81)
Total 8 (72)
Foreign exchange contracts (2) (13) Other contracts (11) (1)
Total gain (loss) on derivatives not designated as accounting hedges (5) (86) Net derivatives gain (loss) recognized in earnings $ (10) $ (95)
Amounts are recorded in our consolidated statements of income in other non-interest income.
117
(1) (1)
(1)
(1)
(1)
(1)

Table of Contents
CAPITAL ONE FINANCIAL CORPORATIONNOTES TO CONDENSED CONSOLIDATED FINANCIAL STATEMENTS (UNAUDITED)—(Continued)
Cash Flow Hedges
The table below shows the net gains (losses) related to derivatives designated as cash flow hedges for the three months ended March 31, 2013 and 2012:
Three Months Ended
March 31, (Dollars in millions) 2013 2012 Gain (loss) recorded in AOCI: Cash flow hedges:
Interest rate contracts $ (1) $ 6 Foreign exchange contracts (5) (6)
Subtotal (6) 0
Net derivatives gain (loss) recognized in AOCI $ (6) $ 0
Gain (loss) recorded in earnings: Cash flow hedges:
Gain (loss) reclassified from AOCI into earnings: Interest rate contracts $ 12 $ 9 Foreign exchange contracts (5) (6)
Subtotal 7 3
Gain (loss) recognized in earnings due to ineffectiveness: Interest rate contracts 0 0 Foreign exchange contracts 0 0
Subtotal 0 0
Net derivatives gain (loss) recognized in earnings $ 7 $ 3
Amounts represent the effective portion. Amounts reclassified are recorded in our consolidated statements of income in interest income or interest expense. Amounts reclassified are recorded in our consolidated statements of income in other non-interest income.
We expect to reclassify net after-tax gains of $67.4 million recorded in AOCI as of March 31, 2013, related to derivatives designated as cash flow hedges toearnings over the next 12 months, which we expect to offset against the cash flows associated with the hedged forecasted transactions. The maximum length oftime over which forecasted transactions were hedged was five years as of March 31, 2013. The amount we expect to reclassify into earnings may change as aresult of changes in market conditions and ongoing actions taken as part of our overall risk management strategy.
Credit Risk-Related Contingency Features
Certain of our derivative contracts include provisions requiring that our debt maintain a credit rating of investment grade or above by each of the major creditrating agencies. In the event of a downgrade of our debt credit rating below investment grade, some of our derivative counterparties would have the right toterminate the derivative contract and close-out the existing positions. Other derivative contracts include provisions that would, in the event of a downgrade of ourdebt credit rating below investment grade, allow our derivative counterparties to demand immediate and ongoing full overnight collateralization on derivativeinstruments in a net liability position. Certain of our derivative contracts may allow, in the event of a downgrade of our debt credit rating of
118
(1)
(2)
(3)
(3)
(3)
(1)(2)(3)

Table of Contents
CAPITAL ONE FINANCIAL CORPORATIONNOTES TO CONDENSED CONSOLIDATED FINANCIAL STATEMENTS (UNAUDITED)—(Continued)
any kind, our derivative counterparties to demand additional collateralization on such derivative instruments in a net liability position. The fair value of derivativeinstruments with credit-risk-related contingent features in a net liability position was $10 million and $7 million as of March 31, 2013 and December 31, 2012,respectively. We were required to post collateral, consisting of a combination of cash and securities, totaling $101 million and $109 million as of March 31, 2013and December 31, 2012, respectively. If our debt credit rating had fallen below investment grade, we would have been required to post additional collateral of $2million and $4 million as of March 31, 2013 and December 31, 2012, respectively.
Derivative Counterparty Credit Risk
Derivative instruments contain an element of credit risk that arises from the potential failure of a counterparty to perform according to the contractual terms of thecontract. Our exposure to derivative counterparty credit risk, at any point in time, is represented by the fair value of derivatives in a gain position, or derivativeassets, assuming no recoveries of underlying collateral. To mitigate the risk of counterparty default, we maintain collateral agreements with certain derivativecounterparties. These agreements typically require both parties to maintain collateral in the event the fair values of derivative financial instruments exceedestablished thresholds. We received cash collateral from derivatives counterparties totaling $558 million and $922 million as of March 31, 2013 andDecember 31, 2012, respectively. We also received securities from derivatives counterparties totaling $398 million and $239 million as of March 31, 2013 andDecember 31, 2012, respectively, which we have the ability to repledge. We posted cash collateral of $103 million and $111 million as of March 31, 2013 andDecember 31, 2012, respectively. The portion of this collateral that related to our derivative transactions was $93 million and $98 million as of March 31, 2013and December 31, 2012, respectively.
We record counterparty credit risk valuation adjustments on our derivative assets to properly reflect the credit quality of the counterparty. We consider collateraland legally enforceable master netting agreements that mitigate our credit exposure to each counterparty in determining the counterparty credit risk valuationadjustment, which may be adjusted in future periods due to changes in the fair value of the derivative contract, collateral and creditworthiness of the counterparty.The cumulative counterparty credit risk valuation adjustment recorded on our consolidated balance sheets as a reduction in the derivative asset balance was $8million and $9 million as of March 31, 2013 and December 31, 2012, respectively. We also adjust the fair value of our derivative liabilities to reflect the impact ofour credit quality. We calculate this adjustment by comparing the spreads on our credit default swaps to the discount benchmark curve. The cumulative credit riskvaluation adjustment related to our credit quality recorded on our consolidated balance sheets as a reduction in the derivative liability balance was $1 million as ofMarch 31, 2013 and December 31, 2012, respectively. NOTE 10—STOCKHOLDERS’ EQUITY The following table presents the components of accumulated other comprehensive income as of March 31, 2013 and December 31, 2012, as well as the currentperiod activity related to our other comprehensive income. AOCI is presented net of deferred tax of $358 million and $443 million, as of March 31, 2013 andDecember 31, 2012, respectively.
119
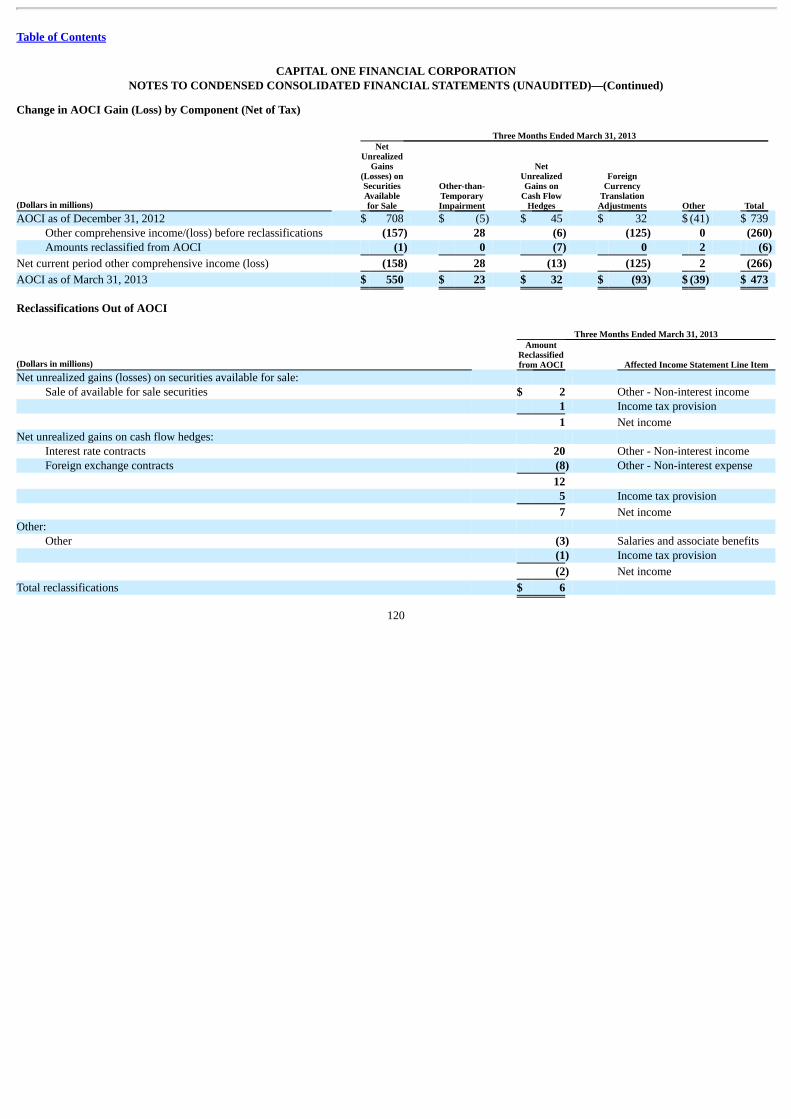
Table of Contents
CAPITAL ONE FINANCIAL CORPORATIONNOTES TO CONDENSED CONSOLIDATED FINANCIAL STATEMENTS (UNAUDITED)—(Continued)
Change in AOCI Gain (Loss) by Component (Net of Tax) Three Months Ended March 31, 2013
(Dollars in millions)
NetUnrealized
Gains(Losses) onSecuritiesAvailablefor Sale
Other-than-TemporaryImpairment
NetUnrealizedGains on
Cash FlowHedges
ForeignCurrency
TranslationAdjustments Other Total
AOCI as of December 31, 2012 $ 708 $ (5) $ 45 $ 32 $ (41) $ 739 Other comprehensive income/(loss) before reclassifications (157) 28 (6) (125) 0 (260) Amounts reclassified from AOCI (1) 0 (7) 0 2 (6)
Net current period other comprehensive income (loss) (158) 28 (13) (125) 2 (266)
AOCI as of March 31, 2013 $ 550 $ 23 $ 32 $ (93) $ (39) $ 473
Reclassifications Out of AOCI Three Months Ended March 31, 2013
(Dollars in millions)
AmountReclassifiedfrom AOCI Affected Income Statement Line Item
Net unrealized gains (losses) on securities available for sale: Sale of available for sale securities $ 2 Other - Non-interest income
1 Income tax provision
1 Net incomeNet unrealized gains on cash flow hedges:
Interest rate contracts 20 Other - Non-interest incomeForeign exchange contracts (8) Other - Non-interest expense
12 5 Income tax provision
7 Net incomeOther:
Other (3) Salaries and associate benefits (1) Income tax provision
(2) Net income
Total reclassifications $ 6
120

Table of Contents
CAPITAL ONE FINANCIAL CORPORATIONNOTES TO CONDENSED CONSOLIDATED FINANCIAL STATEMENTS (UNAUDITED)—(Continued)
The table below summarizes other comprehensive income activity and the related tax impact for the three months ended March 31, 2013 and 2012: Three Months Ended March 31, 2013 2012
(Dollars in millions) Before
Tax Provision(Benefit)
AfterTax
BeforeTax
Provision(Benefit)
AfterTax
Other comprehensive income: Net unrealized gains (losses) on securities available for sale $(254) $ (96) $(158) $ (10) $ (4) $ (6) Other-than-temporary impairment not recognized in earnings 45 17 28 54 20 34 Net unrealized gains (losses) on cash flow hedges (21) (8) (13) 1 0 1 Foreign currency translation adjustments (125) 0 (125) 55 0 55 Other 4 2 2 0 0 0
Other comprehensive income (loss) $(351) $ (85) $(266) $ 100 $ 16 $ 84
NOTE 11—EARNINGS PER COMMON SHARE The following table sets forth the computation of basic and diluted earnings per common share: Three Months Ended March 31, (Dollars and shares in millions, except per share data) 2013 2012 Basic earnings per share Income from continuing operations, net of tax $ 1,144 $ 1,505 Loss from discontinued operations, net of tax (78) (102)
Net income 1,066 1,403 Dividends and undistributed earnings allocated to participating securities (5) (7) Preferred stock dividends (13) 0
Net income available to common stockholders $ 1,048 $ 1,396
Total weighted-average basic shares outstanding 581 509
Net income per share $ 1.81 $ 2.74
Three Months Ended March 31, (Dollars and shares in millions, except per share data) 2013 2012 Diluted earnings per share Net income available to common stockholders $ 1,048 $ 1,396
Total weighted-average basic shares outstanding 581 509 Stock options, warrants, contingently issuable shares, and other 5 4
Total weighted-average diluted shares outstanding 586 513
Net income per share $ 1.79 $ 2.72
Includes undistributed earnings allocated to participating securities using the two-class method under the accounting guidance for computing earnings per share. Excluded from the computation of diluted earnings per share was 6 million and 9 million of awards, options or warrants, for the three months ended March 31, 2013 and 2012, respectively, because their
inclusion would be anti-dilutive.
121
(1)
(2)
(1)(2)

Table of Contents
CAPITAL ONE FINANCIAL CORPORATIONNOTES TO CONDENSED CONSOLIDATED FINANCIAL STATEMENTS (UNAUDITED)—(Continued)
NOTE 12—FAIR VALUE OF FINANCIAL INSTRUMENTS Fair value is defined as the price that would be received for an asset or paid to transfer a liability in an orderly transaction between market participants on themeasurement date (also referred to as an exit price). The fair value accounting guidance provides a three-level fair value hierarchy for classifying financialinstruments. This hierarchy is based on whether the inputs to the valuation techniques used to measure fair value are observable or unobservable. Fair valuemeasurement of a financial asset or liability is assigned to a level based on the lowest level of any input that is significant to the fair value measurement in itsentirety. The three levels of the fair value hierarchy are described below:
Level 1: Quoted prices (unadjusted) in active markets for identical assets or liabilities
Level 2: Observable market-based inputs, other than quoted prices in active markets for identical assets or liabilities
Level 3: Unobservable inputs
The accounting guidance for fair value measurements requires that we maximize the use of observable inputs and minimize the use of unobservable inputs indetermining fair value. The accounting guidance provides for the irrevocable option to elect, on a contract-by-contract basis, to measure certain financial assetsand liabilities at fair value at inception of the contract and record any subsequent changes in fair value into earnings. We have not made any material fair valueoption elections as of March 31, 2013 and December 31, 2012.
Level 1, 2 and 3 Valuation Techniques
Financial instruments are considered Level 1 when the valuation is based on quoted prices in active markets for identical assets or liabilities. Level 2 financialinstruments are valued using quoted prices for similar assets or liabilities, quoted prices in markets that are not active, or models using inputs that are observableor can be corroborated by observable market data of substantially the full term of the assets or liabilities. Financial instruments are considered Level 3 when theirvalues are determined using pricing models, discounted cash flow methodologies or similar techniques and at least one significant model assumption or input isunobservable and when the determination of the fair value requires significant management judgment or estimation.
The following table displays our assets and liabilities measured on our condensed consolidated balance sheets at fair value on a recurring basis as of March 31,2013 and December 31, 2012:
122

Table of Contents
CAPITAL ONE FINANCIAL CORPORATIONNOTES TO CONDENSED CONSOLIDATED FINANCIAL STATEMENTS (UNAUDITED)—(Continued)
Assets and Liabilities Measured at Fair Value on a Recurring Basis March 31, 2013 Fair Value Measurements Using (Dollars in millions) Level 1 Level 2 Level 3 Total Assets Securities available for sale:
U.S. Treasury debt obligations $1,046 $ 0 $ 0 $ 1,046 U.S. agency debt obligations 0 301 0 301 Corporate debt securities guaranteed by U.S. government agencies 0 360 768 1,128 Residential mortgage-backed securities 0 43,127 1,490 44,617 Commercial mortgage-backed securities 0 7,419 704 8,123 Other asset-backed securities 0 7,286 71 7,357 Other 139 1,241 16 1,396
Total securities available for sale 1,185 59,734 3,049 63,968 Other assets:
Mortgage servicing rights 0 0 58 58 Derivative assets 0 1,502 83 1,585 Retained interests in securitizations and other 0 0 201 201
Total assets $1,185 $61,236 $3,391 $65,812
Liabilities Other liabilities:
Derivative liabilities $ 1 $ 327 $ 42 $ 370
Total liabilities $ 1 $ 327 $ 42 $ 370
December 31, 2012 Fair Value Measurements Using (Dollars in millions) Level 1 Level 2 Level 3 Total Assets Securities available for sale:
U.S. Treasury debt obligations $1,552 $ 0 $ 0 $ 1,552 U.S. agency debt obligations 0 302 0 302 Corporate debt securities guaranteed by U.S. government agencies 0 362 650 1,012 Residential mortgage-backed securities 0 42,538 1,335 43,873 Commercial mortgage-backed securities 0 7,042 587 7,629 Other asset-backed securities 0 8,356 102 8,458 Other 145 993 15 1,153
Total securities available for sale 1,697 59,593 2,689 63,979 Other assets:
Mortgage servicing rights 0 0 55 55 Derivative assets 1 1,757 90 1,848 Retained interests in securitizations and other 0 0 204 204
Total assets $1,698 $61,350 $3,038 $66,086
Liabilities Other liabilities:
Derivative liabilities $ 1 $ 361 $ 38 $ 400
Total liabilities $ 1 $ 361 $ 38 $ 400
123
(1)(2)
(1)(2)
(1)(2)
(1)(2)

Table of Contents
CAPITAL ONE FINANCIAL CORPORATIONNOTES TO CONDENSED CONSOLIDATED FINANCIAL STATEMENTS (UNAUDITED)—(Continued)
We do not offset the fair value of derivative contracts in a loss position against the fair value of contracts in a gain position. We also do not offset fair value amounts recognized for derivative instrumentsand fair value amounts recognized for the right to reclaim cash collateral or the obligation to return cash collateral arising from derivative instruments executed with the same counterparty under a masternetting arrangement.
Does not reflect $8 million and $9 million recognized as a net valuation allowance on derivative assets and liabilities for non-performance risk as of March 31, 2013 and December 31, 2012, respectively.Non-performance risk is reflected in other assets/liabilities on the balance sheet and offset through the income statement in other income.
The determination of the classification of financial instruments in Level 2 or Level 3 of the fair value hierarchy is performed at the end of each reporting period.We consider all available information, including observable market data, indications of market liquidity and orderliness, and our understanding of the valuationtechniques and significant inputs. Based upon the specific facts and circumstances of each instrument or instrument category, judgments are made regarding thesignificance of the Level 3 inputs to the instruments’ fair value measurement in its entirety. If Level 3 inputs are considered significant, the instrument isclassified as Level 3. The process for determining fair value using unobservable inputs is generally more subjective and involves a high degree of managementjudgment and assumptions. During the first quarter of 2013, we had minimal movements between Levels 1 and 2.
Level 3 Instruments Only
Financial instruments are considered Level 3 when their values are determined using pricing models, which include comparison of prices from multiple sources,discounted cash flow methodologies or similar techniques and at least one significant model assumption or input is unobservable or there is significant variabilityamong pricing sources. Level 3 financial instruments also include those for which the determination of fair value requires significant management judgment orestimation. The tables below present a reconciliation for all assets and liabilities measured and recognized at fair value on a recurring basis using significantunobservable inputs (Level 3). When assets and liabilities are transferred between levels, we recognize the transfer as of the end of the period.
124
(1)
(2)

Table of Contents
CAPITAL ONE FINANCIAL CORPORATIONNOTES TO CONDENSED CONSOLIDATED FINANCIAL STATEMENTS (UNAUDITED)—(Continued)
Fair Value Measurements Using Significant Unobservable Inputs (Level 3)
Three Months Ended March 31, 2013
Total Gains or (Losses)(Realized/Unrealized)
NetUnrealized
Gains(Losses)Included
in NetIncome
Related toAssets andLiabilities
Still Held as ofMarch 31,
2013 (Dollars in millions)
Balance,January 1,
2013
Includedin Net
Income
Included inOther
ComprehensiveIncome Purchases Sales Issuances Settlements
TransfersInto
Level 3
TransfersOut of
Level 3
Balance,March 31,
2013 Assets: Securities available-for-sale: Corporate debt securities guaranteed by
U.S. government agencies $ 650 $ 0 $ 1 $ 88 $ 0 $ 0 $ (10) $ 39 $ 0 $ 768 $ 0 Residential mortgage-backed securities 1,335 (9) 76 98 0 0 (56) 269 (223) 1,490 (9)Commercial mortgage-backed securities 587 0 (7) 381 0 0 (19) 49 (287) 704 0 Other asset-backed securities 102 (1) 9 0 (41) 0 (1) 6 (3) 71 (1) Other 15 0 0 0 0 0 0 1 0 16 0
Total securities available for sale 2,689 (10) 79 567 (41) 0 (86) 364 (513) 3,049 (10)Other assets: Mortgage servicing rights 55 2 0 0 0 2 (1) 0 0 58 2 Derivative assets 90 0 0 0 0 1 (6) 0 (2) 83 0 Retained interest in securitizations and
other 204 (3) 0 0 0 0 0 0 0 201 (3) Liabilities: Other liabilities: Derivative liabilities 38 9 0 0 0 0 (4) 0 (1) 42 9
125
(3)(1) (2) (2)

Table of Contents
CAPITAL ONE FINANCIAL CORPORATIONNOTES TO CONDENSED CONSOLIDATED FINANCIAL STATEMENTS (UNAUDITED)—(Continued)
Fair Value Measurements Using Significant Unobservable Inputs (Level 3)
Three Months Ended March 31, 2012
Total Gains or (Losses)(Realized/Unrealized)
NetUnrealized
Gains(Losses)Included
in NetIncome
Related toAssets andLiabilities
Still Held as ofMarch 31,
2012 (Dollars in millions)
Balance,January 1,
2012
Includedin Net
Income
Included inOther
ComprehensiveIncome Purchases Sales Issuances Settlements
TransfersInto
Level 3
TransfersOut of
Level 3
Balance,March 31,
2012 Assets: Securities available-for-sale: Residential mortgage-backed
securities $ 195 $ (10) $ (26) $ 2,279 $(640) $ 0 $ (16) $ 98 $ (59) $ 1,821 $ (10)Commercial mortgage-backed
securities 274 4 3 297 (76) 0 (3) 13 (125) 387 0 Other asset-backed securities 32 0 5 105 0 0 (2) 132 (31) 241 4 Other 12 0 0 0 0 0 (5) 6 (6) 7 0
Total securities available-for-sale 513 (6) (18) 2,681 (716) 0 (26) 249 (221) 2,456 (6)Other assets: Mortgage servicing rights 93 1 0 0 0 4 (3) 0 0 95 1 Derivative assets 103 (3) 0 0 0 2 (49) 13 (1) 65 (3)Retained interest in securitization
and other 145 (5) 0 0 0 0 0 0 0 140 (5)Liabilities: Other liabilities Derivative liabilities 279 (5) 0 0 0 32 (259) (8) (3) 36 (5)
Gains (losses) related to Level 3 mortgage servicing rights are reported in other non-interest income, which is a component of non-interest income. Gains (losses) related to Level 3 derivative receivablesand derivative payables are reported in other non-interest income, which is a component of non-interest income. Gains (losses) related to Level 3 retained interests in securitizations are reported inservicing and securitizations income, which is a component of non-interest income.
The transfers out of Level 3 for the quarters ended March 31, 2013 and 2012 were primarily driven by greater consistency among multiple pricing sources. The transfers into Level 3 were primarily drivenby less consistency among vendor pricing on individual securities.
The amount presented for unrealized gains (loss) for assets still held as of the reporting date primarily represents impairments for available-for-sale securities, accretion on certain fixed maturity securities,change in fair value of derivative instruments and mortgage servicing rights. The impairments are reported in total other-than-temporary losses as a component of non-interest income.
Significant Level 3 Fair Value Asset and Liability Input Sensitivity
Changes in unobservable inputs may have a significant impact on fair value. Certain of these unobservable inputs will (in isolation) have a directionally consistentimpact on the fair value of the instrument for a given change in that input. Alternatively, the fair value of the instrument may move in an opposite direction for agiven change in another input. In general, an increase in the discount rate, default rates, loss severity and credit spreads, in isolation, would result in a decrease inthe fair value measurement. In addition, an increase in default rates would generally be accompanied by a decrease in recovery rates, slower prepayment rates andan increase in liquidity spreads.
126
(3)(1) (2) (2)
(1)
(2)
(3)

Table of Contents
CAPITAL ONE FINANCIAL CORPORATIONNOTES TO CONDENSED CONSOLIDATED FINANCIAL STATEMENTS (UNAUDITED)—(Continued)
Fair Value Governance and Control
We have a governance framework and a number of key controls that are intended to ensure that our fair value measurements are appropriate and reliable. Ourgovernance framework provides for independent oversight and segregation of duties. Our control processes include review and approval of new transaction types,price verification and review of valuation judgments, methods, models, process controls and results. Groups independent from our trading and investingfunctions, including our Valuations Group, Model Validation Group and Fair Value Committee (“FVC”), participate in the review and validation process. The fairvaluation governance process is set up in a manner that allows the Chairperson of the FVC to escalate valuation disputes that cannot be resolved at the FVC to amore senior committee called the Valuations Advisory Committee (“VAC”) for resolution. The VAC is chaired by the Chief Financial Officer. Membership of theVAC includes the Chief Risk Officer.
Our Valuations Group performs periodic independent verification of fair value measurements by using independent analytics and other available market data todetermine if assigned fair values are reasonable. For example, in cases where we rely on third party pricing services to obtain fair value measures, we analyzepricing variances among different pricing sources and validate the final price used by comparing the information to additional sources, including dealer pricingindications in transaction results and other internal sources, where necessary. Additional validation procedures performed by the Valuations Group includereviewing (either directly or indirectly through the reasonableness of assigned fair values) valuation inputs and assumptions, and monitoring acceptable variancesbetween recommended prices and validation prices. The Valuations Group periodically evaluates alternative methodologies and recommends improvements tovaluation techniques. We perform due diligence reviews of the third party pricing services by comparing their prices with prices from other sources and reviewingother control documentation. Additionally, when necessary, we challenge prices from third party vendors to ensure reasonableness of prices through a pricingchallenge process. This may include a request for a transparency of the assumptions used by the third party.
The FVC, which includes representation from business areas, our Risk Management division and our Finance division, is a forum for discussing fair valuations,inputs, assumptions, methodologies, variance thresholds, valuation control environment and material risks or concerns related to fair valuations. Additionally, theFVC is empowered to resolve valuation disputes between the primary valuation providers and the valuations control group. It provides guidance and oversight toensure an appropriate valuation control environment. The FVC regularly reviews and approves our valuation methodologies to ensure that our methodologies andpractices are consistent with industry standards and adhere to regulatory and accounting guidance. The Chief Financial Officer determines when material issues orconcerns regarding valuations shall be raised to the Audit and Risk Committee or other delegated committee of the Board of Directors.
We have a model policy, established by an independent Model Risk Office, which governs the validation of models and related supporting documentation toensure the appropriate use of models for pricing.
Assets and Liabilities Measured at Fair Value on a Recurring Basis
The following table presents the significant unobservable inputs relied upon to determine the fair values of our recurring Level 3 financial instruments. We utilizemultiple third party pricing services to obtain fair value measures for our securities. Several of our third party pricing services are only able to provideunobservable input information for a limited number of securities due to software licensing restrictions. Other third party pricing services are able to provideunobservable input information for all securities for which they provide a valuation. As a result, the unobservable input information for the available-for-salesecurities presented below
127

Table of Contents
CAPITAL ONE FINANCIAL CORPORATIONNOTES TO CONDENSED CONSOLIDATED FINANCIAL STATEMENTS (UNAUDITED)—(Continued)
represents a composite summary of all information we are able to obtain for a majority of our securities. The unobservable input information for all other Level 3financial instruments is based on the assumptions used in our internal valuation models.
Quantitative Information about Level 3 Fair Value Measurements
(Dollars in millions)
FairValue atMarch
31, 2013
SignificantValuation
Techniques
SignificantUnobservable
Inputs Range WeightedAverage
Assets:
Securities available for sale:
Residential mortgage-backed securities
$1,490
Discounted cashflows (3 partypricing)
YieldConstant prepayment rateDefault rateLoss severity
0-25%0-28%0-22%0-75%
5%6%9%51%
Commercial mortgage-backed securities
704
Discounted cashflows (3 partypricing)
YieldConstant prepayment rate
1-3%0-6%
2%1%
Other asset-backed securities
71
Discounted cashflows (3 partypricing)
YieldConstant prepayment rateDefault rateLoss severity
4-23%0-7%3-28%46-88%
5%3%14%70%
U.S. government guaranteed debt and other
784
Discounted cashflows (3 partypricing)
YieldConstant prepayment rate
0-2%N/A
2%N/A
Other assets:
Mortgage servicing rights
58
Discounted cashflows
Total prepayment rateDiscount rateServicing cost ($ per loan)
10.08-32.52%9.96-21.10%$82-$852
18.68%12.91%$295
Derivative assets
83
Discounted cashflows Swap rates 2.01-2.79% 2.67%
Retained interests in securitization and other
201
Discounted cashflows
Life of receivables (months)Constant prepayment rateDiscount rateDefault rateLoss severity
33-871.22-15.00%3.56-13.57%1.98-9.82%18.33-86.34%
716.02%13.22%6.42%29.26%
Liabilities: Other liabilities:
Derivative liabilities
42
Discounted cashflows Swap rates 2.01-2.75% 2.62%
128
rd
rd
rd
rd
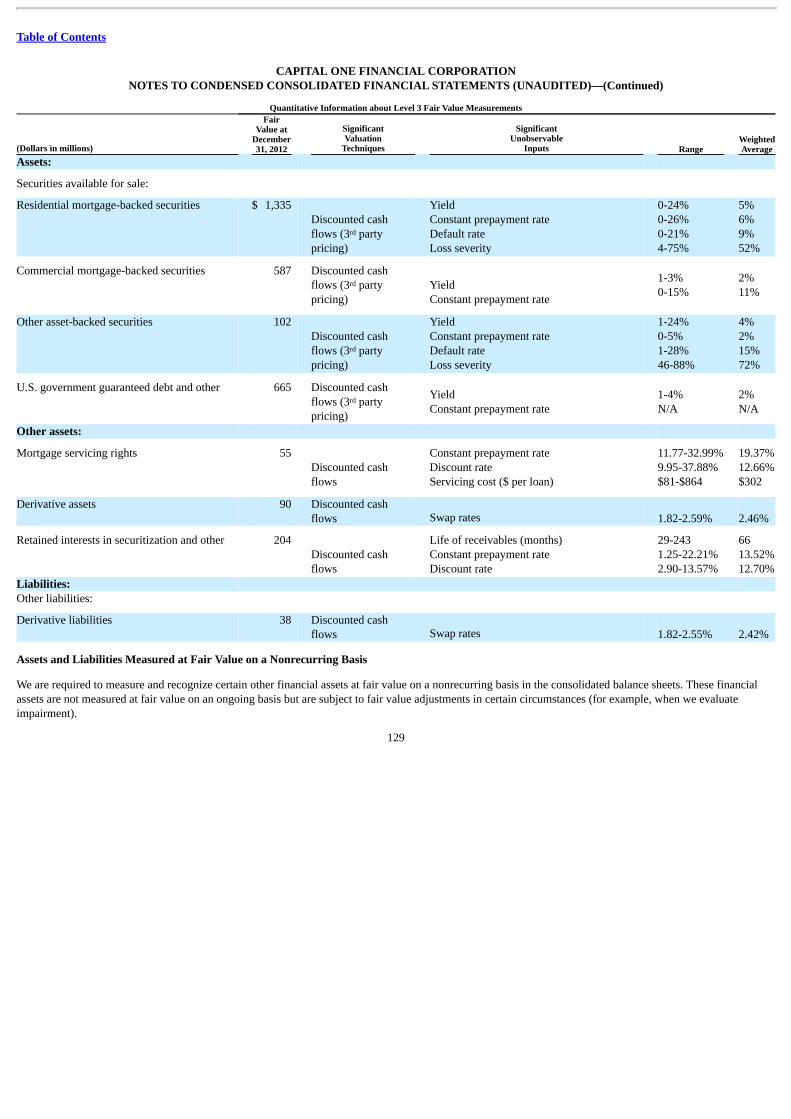
Table of Contents
CAPITAL ONE FINANCIAL CORPORATIONNOTES TO CONDENSED CONSOLIDATED FINANCIAL STATEMENTS (UNAUDITED)—(Continued)
Quantitative Information about Level 3 Fair Value Measurements
(Dollars in millions)
FairValue at
December31, 2012
SignificantValuation
Techniques
SignificantUnobservable
Inputs Range WeightedAverage
Assets:
Securities available for sale:
Residential mortgage-backed securities
$ 1,335
Discounted cashflows (3 partypricing)
YieldConstant prepayment rateDefault rateLoss severity
0-24%0-26%0-21%4-75%
5%6%9%52%
Commercial mortgage-backed securities
587
Discounted cashflows (3 partypricing)
YieldConstant prepayment rate
1-3%0-15%
2%11%
Other asset-backed securities
102
Discounted cashflows (3 partypricing)
YieldConstant prepayment rateDefault rateLoss severity
1-24%0-5%1-28%46-88%
4%2%15%72%
U.S. government guaranteed debt and other
665
Discounted cashflows (3 partypricing)
YieldConstant prepayment rate
1-4%N/A
2%N/A
Other assets:
Mortgage servicing rights
55
Discounted cashflows
Constant prepayment rateDiscount rateServicing cost ($ per loan)
11.77-32.99%9.95-37.88%$81-$864
19.37%12.66%$302
Derivative assets
90
Discounted cashflows Swap rates 1.82-2.59% 2.46%
Retained interests in securitization and other
204
Discounted cashflows
Life of receivables (months)Constant prepayment rateDiscount rate
29-2431.25-22.21%2.90-13.57%
6613.52%12.70%
Liabilities: Other liabilities:
Derivative liabilities
38
Discounted cashflows Swap rates 1.82-2.55% 2.42%
Assets and Liabilities Measured at Fair Value on a Nonrecurring Basis
We are required to measure and recognize certain other financial assets at fair value on a nonrecurring basis in the consolidated balance sheets. These financialassets are not measured at fair value on an ongoing basis but are subject to fair value adjustments in certain circumstances (for example, when we evaluateimpairment).
129
rd
rd
rd
rd

Table of Contents
CAPITAL ONE FINANCIAL CORPORATIONNOTES TO CONDENSED CONSOLIDATED FINANCIAL STATEMENTS (UNAUDITED)—(Continued)
Loans Held For Sale
Loans held for sale are carried at the lower of aggregate cost, net of deferred fees and deferred origination costs, or fair value. The fair value of loans held for saleis determined using a discounted cash flow model or the fair value of the underlying collateral, less the estimated cost to sell. Held-for-sale loans that are valuedusing a discounted cash flow model are classified as level 2. Loans that are valued using fair value less the estimated cost to sell have significant unobservableinputs and are classified as Level 3 under the fair value hierarchy. Fair value adjustments to loans held for sale are recorded in other non-interest expense in ourconsolidated statements of income.
Loans Held For Investment, Net
Loans held for investment that are individually impaired are carried at the lower of cost or fair value of the underlying collateral, less the estimated cost to sell.Due to the use of unobservable inputs, loans held for investment are classified as Level 3 under the fair value hierarchy. Fair value adjustments for loans held forinvestment are recorded in provision for credit losses in the consolidated statement of income.
Foreclosed Property and Other Repossessed Assets
Foreclosed property and other repossessed assets are carried at the lower of the carrying amount or fair value less costs to sell. Due to the use of significantunobservable inputs, foreclosed property is classified as Level 3 under the fair value hierarchy. Fair value adjustments for foreclosed property are recorded inother non-interest expense in the consolidated statement of income.
Other Assets
Nonrecurring other assets measured at fair value consist of long-lived assets held for sale. These assets are recorded in other assets in our consolidated balancesheets. These assets are carried at the lower of their carrying amount or fair value less costs to sell. Due to the use of unobservable inputs, long-lived assets heldfor sale are classified as Level 3 under the fair value hierarchy. Fair value adjustments for other assets are recorded in other non-interest expense in theconsolidated statement of income.
For assets measured at fair value on a nonrecurring basis and still held on the consolidated balance sheet, the following table provides the fair value measures bylevel of valuation assumptions used and the gains or losses recognized for these assets as a result of fair value measurements.
130

Table of Contents
CAPITAL ONE FINANCIAL CORPORATIONNOTES TO CONDENSED CONSOLIDATED FINANCIAL STATEMENTS (UNAUDITED)—(Continued)
The following table presents the carrying amounts of all assets that were still held as of March 31, 2013 and December 31, 2012, and for which a nonrecurringfair value measurement was recorded during the three and twelve months then ended. March 31, 2013
Fair Value Measurements Using Assetsat FairValue
SignificantValuation
Techniques
SignificantUnobservable
Inputs
Range Weighted
Average(Dollars in millions) Level 1 Level 2 Level 3 Assets Loans held for sale $ 0 $ 35 $ 0 $ 35 N/A N/A N/A N/ALoans held for investment
0
0
41
41
AppraisalValue
Non-recoverable rate
0-16%
11%
Foreclosed property
0
0
79
79
AppraisalValue
Cost to Sell
10-14%
10%
Other
0
0
1
1
AppraisalValue
Cost to Sell
6%
6%
Total $ 0 $ 35 $ 121 $ 156
December 31, 2012
Fair Value Measurements Using Assetsat FairValue
SignificantValuation
Techniques
SignificantUnobservable
Inputs
Range Weighted
Average(Dollars in millions) Level 1 Level 2 Level 3 Assets Loans held for sale $ 0 $ 201 $ 0 $ 201 N/A N/A N/A N/ALoans held for investment
0
0
162
162
AppraisalValue
Non-recoverable rate
0-100%
13%
Foreclosed property
0
0
50
50
AppraisalValue
Cost to Sell
10-14%
11%
Other
0
0
59
59
AppraisalValue
Cost to Sell
6%
6%
Total $ 0 $ 201 $ 271 $ 472
The following table presents total nonrecurring fair value measurements for the period, included in earnings, attributable to the change in fair value relating toassets that are still held at March 31, 2013 and 2012.
Total Gains (Losses)
Three Months Ended March 31, (Dollars in millions) 2013 2012 Assets Loans held for sale $ 0 $ 16 Loans held for investment (10) (25) Foreclosed property (2) (8) Other 0 (2)
Total $ (12) $ (19)
Represents the fair value and related losses of foreclosed properties that were written down subsequent to their initial classification as foreclosed properties. Consists of long lived assets classified as held for sale.
131
(1)
(2)
(1)
(2)
(1)
(2)
(1)
(2)

Table of Contents
CAPITAL ONE FINANCIAL CORPORATIONNOTES TO CONDENSED CONSOLIDATED FINANCIAL STATEMENTS (UNAUDITED)—(Continued)
Fair Value of Financial Instruments
The following reflects the fair value of financial instruments, whether or not recognized on the condensed consolidated balance sheets at fair value, as ofMarch 31, 2013 and December 31, 2012: March 31, 2013 Fair Value Measurements Using
(Dollars in millions) CarryingAmount
EstimatedFair Value Level 1 Level 2 Level 3
Financial assets Cash and cash equivalents $ 6,746 $ 6,746 $ 6,746 $ 0 $ 0 Restricted cash for securitization investors 1,018 1,018 1,018 0 0 Securities available for sale 63,968 63,968 1,185 59,734 3,049 Loans held for sale 6,410 6,627 0 6,627 0 Net loans held for investment 186,727 191,297 0 0 191,297 Interest receivable 1,378 1,378 0 1,378 0 Derivative assets 1,585 1,585 0 1,502 83 Mortgage servicing rights 58 58 0 0 58
Financial liabilities Non-interest bearing deposits $ 21,317 $ 21,317 $21,317 $ 0 $ 0 Interest-bearing deposits 191,093 190,864 0 20,842 170,022 Securitized debt obligations 11,046 11,216 0 10,894 322 Senior and subordinated notes 13,255 13,875 0 13,875 0 Federal funds purchased and securities loaned or sold under agreements to
repurchase 855 855 855 0 0 Other borrowings 12,336 12,347 0 12,347 0 Interest payable 310 310 0 310 0 Derivative liabilities 370 370 1 327 42 December 31, 2012 Fair Value Measurements Using
(Dollars in millions) CarryingAmount
EstimatedFair Value Level 1 Level 2 Level 3
Financial assets Cash and cash equivalents $ 11,058 $ 11,058 $11,058 $ 0 $ 0 Restricted cash for securitization investors 428 428 428 0 0 Securities available for sale 63,979 63,979 1,697 59,593 2,689 Loans held for sale 201 201 0 201 0 Net loans held for investment 200,733 205,000 0 0 205,000 Interest receivable 1,694 1,694 0 1,694 0 Derivatives 1,848 1,848 1 1,757 90 Mortgage servicing rights 55 55 0 0 55
Financial liabilities Non-interest bearing deposits $ 22,467 $ 22,467 $22,467 $ 0 $ 0 Interest-bearing deposits 190,018 189,423 0 22,216 167,207 Securitized debt obligations 11,398 11,590 0 11,252 338 Senior and subordinated notes 12,686 13,312 0 13,312 0 Federal funds purchased and securities loaned or sold under agreements to
repurchase 1,248 1,248 1,248 0 0 Other borrowings 24,578 24,616 346 24,215 55 Interest payable 450 450 0 450 0 Derivatives 400 400 1 361 38
132

Table of Contents
CAPITAL ONE FINANCIAL CORPORATIONNOTES TO CONDENSED CONSOLIDATED FINANCIAL STATEMENTS (UNAUDITED)—(Continued)
The following describes the valuation techniques used in estimating the fair value of our financial instruments as of March 31, 2013 and December 31, 2012. Weapplied the fair value provisions, to the financial instruments not recognized on the consolidated balance sheet at fair value, which include loans held forinvestment, interest receivable, non-interest bearing and interest bearing deposits, other borrowings, senior and subordinated notes, and interest payable. Theprovisions requiring us to maximize the use of observable inputs and to measure fair value using a notion of exit price were factored into our selection of inputs ofour established valuation techniques.
Cash and Cash Equivalents
The carrying amounts of cash and due from banks, federal funds sold and securities purchased under agreements to resell and interest-bearing deposits with banksapproximate fair value.
Restricted Cash for Securitization Investors
The carrying amounts of restricted cash for securitization investors approximate their fair value due to their relatively short-term nature.
Securities Available For Sale
Quoted prices in active markets are used to measure the fair value of U.S. Treasury securities. For other investment categories, we utilize multiple third-partypricing services to obtain fair value measures for the large majority of our securities. A pricing service may be considered as the primary pricing provider forcertain types of securities, and the designation of the primary pricing provider may vary depending on the type of securities. The determination of the primarypricing provider is based on our experience and validation benchmark of the pricing service’s performance in terms of providing fair value measurement for thevarious types of securities.
Certain securities available for sale are classified as Level 2 and 3, the majority of which are collateralized mortgage obligations and mortgage-backed securities.Level 2 and 3 classifications indicate that significant valuation assumptions are not consistently observable in the market. When significant assumptions are notconsistently observable, fair values are derived using the best available data. Such data may include quotes provided by a dealer, the use of external pricingservices, independent pricing models, or other model-based valuation techniques such as calculation of the present values of future cash flows incorporatingassumptions such as benchmark yields, spreads, prepayment speeds, credit ratings, and losses. The techniques used by the pricing services utilize observablemarket data to the extent available. Pricing models may be used, which can vary by asset class and may incorporate available trade, bid and other marketinformation. Across asset classes, information such as trader/dealer input, credit spreads, forward curves, and prepayment speeds are used to help determineappropriate valuations. Because many fixed income securities do not trade on a daily basis, the evaluated pricing applications may apply available informationthrough processes such as benchmarking curves, like securities, sector groupings, and matrix pricing to prepare valuations. In addition, model processes are usedby the pricing services to develop prepayment and interest rate scenarios.
We validate the pricing obtained from the primary pricing providers through comparison of pricing to additional sources, including other pricing services, dealerpricing indications in transaction results, and other internal sources. Pricing variances among different pricing sources are analyzed and validated. Additionally,on an on-going basis we may select a sample of securities and test the third-party valuation by obtaining more detailed information about the pricingmethodology, sources of information, and assumptions used to value the securities.
133

Table of Contents
CAPITAL ONE FINANCIAL CORPORATIONNOTES TO CONDENSED CONSOLIDATED FINANCIAL STATEMENTS (UNAUDITED)—(Continued)
The significant unobservable inputs used in the fair value measurement of our residential, asset-backed and commercial securities include yield, prepayment rate,default rate and loss severity in the event of default. Significant increases (decreases) in any of those inputs in isolation or combination would result in asignificant change in fair value measurement. Generally, an increase in the yield assumption will result in a decrease in fair value measurement, however, anincrease or decrease in prepayment rate, default rate or loss severity may have a different impact on the fair value given various characteristics of the securityincluding the capital structure of the deal, credit enhancement for the security or other factors.
There was little change in the market value of our portfolio holdings as of March 31, 2013, compared with December 31, 2012 due to the offsetting effect ofhigher interest rates and reduced risk premiums.
Loans Held For Sale
We determined the fair value of the Best Buy loan portfolio, which was transferred to held for sale, based upon the purchase price specified in the purchase andsale agreement, which is deemed to be representative of a market price. See “Note 4—Loans” for further discussion on the Best Buy portfolio transferred to heldfor sale from held for investment in the first quarter of 2013. Our estimation of the fair value of the remaining loans classified as held for sale was determinedusing current secondary market prices for loan pools with similar characteristics. The carrying amount of these remaining loans held for sale as of March 31, 2013and December 31, 2012 approximates fair value.
Loans Held For Investment, Net
The fair values of credit card loans, installment loans, auto loans, home loans and commercial loans were estimated using a discounted cash flow method, a formof the income approach. Discount rates were determined considering rates at which similar portfolios of loans would be made under current conditions andconsidering liquidity spreads applicable to each loan portfolio based on the secondary market. The fair value of credit card loans excluded any value related tocustomer account relationships. The increase in fair value above carrying amount as of March 31, 2013 was primarily due to a tightening of liquidity spreads andimproved credit performance noted in our mortgage and commercial loan portfolios.
Interest Receivable
The carrying amount of interest receivable approximates the fair value of this asset due to its relatively short-term nature.
Derivative Assets and Liabilities
We use both exchange-traded derivatives and over-the-counter (“OTC”) derivatives to manage our interest rate and foreign currency risk exposure. Quotedmarket prices are available and used for our exchange-traded derivatives, which we classify as Level 1. However, substantially all of our derivatives are traded inOTC markets where quoted market prices are not always readily available. Therefore, we value most OTC derivatives using valuation techniques, which includeinternally-developed models. We primarily rely on market observable inputs for our models, such as interest rate yield curves, credit curves, option volatility andcurrency rates, that vary depending on the type of derivative and nature of the underlying rate, price or index upon which the derivative’s value is based. Wheremodel inputs can be observed in a liquid market and the model does not require significant judgment, such derivatives are typically classified as Level 2 of thefair value hierarchy. When instruments are traded in less liquid markets and significant inputs are unobservable, such as interest rate swaps whose remainingterms do not correlate with market observable interest rate yield curves, the derivatives are classified as Level 3.
134

Table of Contents
CAPITAL ONE FINANCIAL CORPORATIONNOTES TO CONDENSED CONSOLIDATED FINANCIAL STATEMENTS (UNAUDITED)—(Continued)
The impact of counterparty non-performance risk is considered when measuring the fair value of derivative receivables. These derivatives are included in otherassets on the balance sheet.
We validate the pricing obtained from the internal models through comparison of pricing to additional sources, including external valuation agents and otherinternal sources. Pricing variances among different pricing sources are analyzed and validated.
Mortgage Servicing Rights
Mortgage Servicing Rights (“MSRs”) do not trade in an active market with readily observable prices. Accordingly, we determine the fair value of MSRs using avaluation model that calculates the present value of estimated future net servicing income. The model incorporates assumptions that market participants use inestimating future net servicing income, including estimates of prepayment speeds, discount rate, cost to service, contractual servicing fee income, ancillaryincome and late fees. We record MSRs at fair value on a recurring basis. Fair value measurements of MSRs use significant unobservable inputs and, accordingly,are classified as Level 3.
Non-Interest Bearing Deposits
The carrying amount of non-interest bearing deposits approximates fair value.
Interest-Bearing Deposits
The fair value of interest-bearing deposits was determined based on discounted expected cash flows using discount rates consistent with current market rates forsimilar products with similar remaining terms.
Securitized Debt Obligations
We utilized multiple third party pricing services to obtain fair value measures for the large majority of our securitized debt obligations. The techniques used by thepricing services utilize observable market data to the extent available; and pricing models may be used which incorporate available trade, bid and other marketinformation as described in the above section. We used internal pricing models, discounted cash flow models or similar techniques to estimate the fair value ofcertain securitization trusts where third-party pricing was not available.
Senior and Subordinated Notes
We engage multiple third party pricing services in order to estimate the fair value of senior and subordinated notes. The pricing service utilizes a pricing modelthat incorporates available trade, bid and other market information. It also incorporates spread assumptions, volatility assumptions and relevant credit informationinto the pricing models.
Federal Funds Purchased and Securities Loaned or Sold under Agreements to Repurchase and Other Borrowings
The carrying amount of federal funds purchased and repurchase agreements approximates fair value. The fair value of FHLB advances was determined based ondiscounted expected cash flows using discount rates consistent with current market rates for FHLB advances with similar remaining terms. We engage multiplethird party pricing services in order to estimate the fair value of junior subordinated borrowings. The pricing service utilizes a pricing model that incorporatesavailable trade information. It also incorporates available market and credit information into the pricing process. The increase in fair value of our otherborrowings above carrying values at March 31, 2013 was primarily due to market interest rates being slightly lower than the interest rates on the debt we own.
135

Table of Contents
CAPITAL ONE FINANCIAL CORPORATIONNOTES TO CONDENSED CONSOLIDATED FINANCIAL STATEMENTS (UNAUDITED)—(Continued)
Interest Payable
The carrying amount of interest payable approximates the fair value of this liability due to its relatively short-term nature.
Commitments
We provide commitments that include extending credit and letters of credit. These financial instruments are generally not sold or traded. The fair values of thefinancial guarantees outstanding and included in other liabilities as of March 31, 2013 and December 31, 2012 were $3 million and $4 million, respectively. Theestimated fair values of extensions of credit and letters of credit are not readily available. However, the fair value of commitments to extend credit and letters ofcredit is based on fees currently charged to enter into similar agreements with comparable credit risks and the current creditworthiness of the counterparties.Commitments to extend credit issued by us are generally short-term in nature and, if drawn upon, are issued under current market terms and conditions for creditswith comparable risks. As of March 31, 2013 and December 31, 2012, there was no material unrealized appreciation or depreciation on these financialinstruments. NOTE 13—BUSINESS SEGMENTS Our principal operations are currently organized for management reporting purposes into three primary business segments, which are defined primarily based onthe products and services provided or the type of customer served: Credit Card, Consumer Banking and Commercial Banking. The operations of acquiredbusinesses have been integrated into our existing business segments. Certain activities that are not part of a segment, such as management of our corporateinvestment portfolio and asset/liability management by our centralized Corporate Treasury group, are included in the “Other” category.
Basis of Presentation
The results of our individual businesses, which we report on a continuing operations basis, reflect the manner in which management evaluates performance andmakes decisions about funding our operations and allocating resources. Our business segment results are intended to reflect each segment as if it were a stand-alone business. We use an internal management accounting and reporting process to derive our business segment results. Our internal management accountingand reporting process employs various allocation methodologies, including funds transfer pricing, to assign certain balance sheet assets, deposits and otherliabilities and their related revenue and expenses directly or indirectly attributable to each business segment. Total interest income and net fees are directlyattributable to the segment in which they are reported. The net interest income of each segment reflects the results of our funds transfer pricing process, which isprimarily based on a matched maturity method that takes into consideration market rates. Our funds transfer pricing process provides a funds credit for sources offunds, such as deposits generated by our Consumer Banking and Commercial Banking businesses, and a funds charge for the use of funds by each segment. Theallocation process is unique to each business segment and acquired businesses. We provide additional information on the allocation methodologies used to deriveour business segment results in “Note 20—Business Segments” in our 2012 Form 10-K.
Segment Results and Reconciliation
The following tables present our business segment results for the three months ended March 31, 2013 and 2012, selected balance sheet data as of March 31, 2013and December 31, 2012 and a reconciliation of our total business segment results to our reported consolidated income from continuing operations, assets anddeposits. Prior period amounts have been recast to conform to the current period presentation.
136

Table of Contents
CAPITAL ONE FINANCIAL CORPORATIONNOTES TO CONDENSED CONSOLIDATED FINANCIAL STATEMENTS (UNAUDITED)—(Continued)
Three Months Ended March 31, 2013
(Dollars in millions) CreditCard
ConsumerBanking
CommercialBanking Other
ConsolidatedTotal
Net interest income $2,830 $ 1,478 $ 454 $(192) $ 4,570 Non-interest income 821 181 84 (105) 981
Total net revenue 3,651 1,659 538 (297) 5,551 Provision for credit losses 743 175 (35) 2 885 Non-interest expense:
Amortization of intangibles: PCCR intangible amortization 116 0 0 0 116 Core deposit intangible amortization 0 37 7 0 44
Total amortization of intangibles 116 37 7 0 160
Other non-interest expense 1,732 853 251 32 2,868
Total non-interest expense 1,848 890 258 32 3,028
Income (loss) from continuing operations before income taxes 1,060 594 315 (331) 1,638 Income tax provision (benefit) 374 211 112 (203) 494
Income from continuing operations, net of tax $ 686 $ 383 $ 203 $(128) $ 1,144
Three Months Ended March 31, 2012
(Dollars in millions) CreditCard
ConsumerBanking
CommercialBanking Other
ConsolidatedTotal
Net interest income $1,992 $ 1,288 $ 431 $(297) $ 3,414 Non-interest income 598 176 85 662 1,521
Total net revenue 2,590 1,464 516 365 4,935 Provision for credit losses 458 174 (69) 10 573 Non-interest expense:
Amortization of intangibles: PCCR intangible amortization 4 0 0 0 4 Core deposit intangible amortization 0 37 9 0 46
Total amortization of intangibles 4 37 9 0 50
Other non-interest expense 1,264 906 252 32 2,454
Total non-interest expense 1,268 943 261 32 2,504
Income from continuing operations before income taxes 864 347 324 323 1,858 Income tax provision (benefit) 298 123 114 (182) 353
Income from continuing operations, net of tax $ 566 $ 224 $ 210 $ 505 $ 1,505
137

Table of Contents
CAPITAL ONE FINANCIAL CORPORATIONNOTES TO CONDENSED CONSOLIDATED FINANCIAL STATEMENTS (UNAUDITED)—(Continued)
Business Segment Loans Held for Investment and Deposits
The total loans held for investment and customer deposits attributable to each of our reportable business segments as of March 31, 2013 and December 31, 2012are presented in the tables below. March 31, 2013
(Dollars in millions) CreditCard
ConsumerBanking
CommercialBanking Other
ConsolidatedTotal
Total loans held for investment $78,397 $ 73,613 $ 39,150 $ 173 $ 191,333 Total customer deposits 0 172,605 30,275 9,530 212,410 December 31, 2012
(Dollars in millions) CreditCard
ConsumerBanking
CommercialBanking Other
ConsolidatedTotal
Total loans held for investment $91,755 $ 75,127 $ 38,820 $ 187 $ 205,889 Total customer deposits 0 172,396 29,866 10,223 212,485 NOTE 14—COMMITMENTS, CONTINGENCIES AND GUARANTEES Letters of Credit
We issue letters of credit (financial standby, performance standby and commercial) to meet the financing needs of our customers. Standby letters of credit areconditional commitments issued by us to guarantee the performance of a customer to a third party in a borrowing arrangement. Commercial letters of credit areshort-term commitments issued primarily to facilitate trade finance activities for customers and are generally collateralized by the goods being shipped to theclient. Collateral requirements are similar to those for funded transactions and are established based on management’s credit assessment of the customer.Management conducts regular reviews of all outstanding letters of credit and customer acceptances, and the results of these reviews are considered in assessingthe adequacy of our allowance for loan and lease losses.
We had standby letters of credit and commercial letters of credit with contractual amounts of $2.0 billion and $1.9 billion as of March 31, 2013 and December 31,2012, respectively. The fair value of outstanding financial guarantees, which we include in other liabilities in our consolidated balance sheets, was $3 million asof March 31, 2013. These financial guarantees had expiration dates ranging from 2013 to 2018 as of March 31, 2013.
Contingent Payments Related to Acquisitions and Partnership Agreements
Certain of our acquisition and partnership agreements include contingent payment provisions in which we agree to provide future payments, up to a maximumamount, based on certain performance criteria. Our contingent payment arrangements are generally based on the difference between the expected creditperformance of specified loan portfolios as of the date of the applicable agreement and the actual future performance. To the extent that actual losses associatedwith these portfolios are less than the expected level, we agree to share a portion of the benefit with the seller. The maximum contingent payment amount relatedto our acquisitions totaled $30 million as of March 31, 2013. The actual payment amount related to $30 million will be determined as of September 30, 2013. Werecognized expense related to contingent payment arrangements of $1 million during the first quarter of 2013. As such, we had a liability for contingent paymentsrelated to these arrangements of $30 million and $165 million as of March 31, 2013 and December 31, 2012, respectively. On January 4, 2013, we settled one ofour existing contingent payment arrangements for $135 million.
138

Table of Contents
CAPITAL ONE FINANCIAL CORPORATIONNOTES TO CONDENSED CONSOLIDATED FINANCIAL STATEMENTS (UNAUDITED)—(Continued)
Guarantees
We have credit exposure on agreements that we entered into to absorb a portion of the risk of loss on certain manufactured housing securitizations issued by GPCin 2000. Our maximum credit exposure related to these agreements totaled $19 million as of March 31, 2013 and December 31, 2012. These agreements arerecorded in our consolidated balance sheets as a component of other liabilities. Our recorded liability under these agreements was $17 million as of March 31,2013 and December 31, 2012. See “Note 6—Variable Interest Entities and Securitizations” for additional information about our manufactured housingsecuritization transactions.
Payment Protection Insurance
In the U.K., we previously sold payment protection insurance (“PPI”). In response to an elevated level of customer complaints across the industry, heightenedmedia coverage and pressure from consumer advocacy groups, the U.K. Financial Services Authority (“FSA”) investigated and raised concerns about the waysome companies have handled complaints related to the sale of these insurance policies. In connection with this matter, we have established a reserve related toPPI, which totaled $175 million and $220 million as of March 31, 2013 and December 31, 2012, respectively.
Potential Mortgage Representation & Warranty Liabilities
In recent years, we acquired three subsidiaries that originated residential mortgage loans and sold them to various purchasers, including purchasers who createdsecuritization trusts. These subsidiaries are Capital One Home Loans, which was acquired in February 2005; GreenPoint Mortgage Funding, Inc. (“GreenPoint”),which was acquired in December 2006 as part of the North Fork acquisition; and CCB, which was acquired in February 2009 and subsequently merged intoCONA.
In connection with their sales of mortgage loans, the subsidiaries entered into agreements containing varying representations and warranties about, among otherthings, the ownership of the loan, the validity of the lien securing the loan, the loan’s compliance with any applicable loan criteria established by the purchaser,including underwriting guidelines and the ongoing existence of mortgage insurance, and the loan’s compliance with applicable federal, state and local laws. Therepresentations and warranties do not address the credit performance of the mortgage loans, but mortgage loan performance often influences whether a claim forbreach of representation and warranty will be asserted and has an effect on the amount of any loss in the event of a breach of a representation or warranty.
Each of these subsidiaries may be required to repurchase mortgage loans in the event of certain breaches of these representations and warranties. In the event of arepurchase, the subsidiary is typically required to pay the then unpaid principal balance of the loan together with interest and certain expenses (including, incertain cases, legal costs incurred by the purchaser and/or others). The subsidiary then recovers the loan or, if the loan has been foreclosed, the underlyingcollateral. The subsidiary is exposed to any losses on the repurchased loans after giving effect to any recoveries on the collateral. In some instances, rather thanrepurchase the loans, a subsidiary may agree to make cash payments to make an investor whole on losses or to settle repurchase claims, possibly including, claimsfor attorneys’ fees and interest. In addition, our subsidiaries may be required to indemnify certain purchasers and others against losses they incur as a result ofcertain breaches of representations and warranties.
These subsidiaries, in total, originated and sold to non-affiliates approximately $111 billion original principal balance of mortgage loans between 2005 and 2008,which are the years (or “vintages”) with respect to which our subsidiaries have received the vast majority of the repurchase requests and other related claims.
139

Table of Contents
CAPITAL ONE FINANCIAL CORPORATIONNOTES TO CONDENSED CONSOLIDATED FINANCIAL STATEMENTS (UNAUDITED)—(Continued)
The following table presents the original principal balance of mortgage loan originations, by vintage for 2005 through 2008, for the three general categories ofpurchasers of mortgage loans and the estimated outstanding principal balance as of March 31, 2013 and December 31, 2012:
Unpaid Principal Balance of Mortgage Loans Originated and Sold to Third Parties Based on Category of Purchaser (UPB is estimated) Unpaid Principal Balance March 31, December 31, Original Unpaid Principal Balance (Dollars in billions) 2013 2012 Total 2008 2007 2006 2005 Government sponsored enterprises (“GSEs”) $ 4 $ 4 $ 11 $ 1 $ 4 $ 3 $ 3 Insured Securitizations 5 5 20 0 2 8 10 Uninsured Securitizations and Other 23 23 80 3 15 30 32
Total $ 32 $ 32 $111 $ 4 $21 $41 $45
GSEs include Fannie Mae and Freddie Mac.
Between 2005 and 2008, our subsidiaries sold an aggregate amount of $11 billion in original principal balance mortgage loans to the GSEs.
Of the $20 billion in original principal balance of mortgage loans sold directly by our subsidiaries to private-label purchasers who placed the loans intosecuritizations supported by bond insurance (“Insured Securitizations”), approximately 48% of the original principal balance was covered by the bond insurance.Further, approximately $16 billion original principal balance was placed in securitizations as to which the monoline bond insurers have made repurchase requestsor loan file requests to one of our subsidiaries (“Active Insured Securitizations”), and the remaining approximately $4 billion original principal balance wasplaced in securitizations as to which the monoline bond insurers have not made repurchase requests or loan file requests to one of our subsidiaries (“InactiveInsured Securitizations”). Insured Securitizations often allow the monoline bond insurer to act independently of the investors. Bond insurers typically haveindemnity agreements directly with both the mortgage originators and the securitizers, and they often have super-majority rights within the trust documentationthat allow them to direct trustees to pursue mortgage repurchase requests without coordination with other investors.
Because we do not service most of the loans our subsidiaries sold to others, we do not have complete information about the current ownership of a portion of the$80 billion in original principal balance of mortgage loans not sold directly to GSEs or placed in Insured Securitizations. We have determined based oninformation obtained from third-party databases that about $48 billion original principal balance of these mortgage loans are currently held by private-labelpublicly issued securitizations not supported by bond insurance (“Uninsured Securitizations”). An additional approximately $22 billion original principal balanceof mortgage loans were initially sold to private investors as whole loans. Various known and unknown investors purchased $10 billion original principal balanceof mortgage loans in this category.
With respect to the $111 billion in original principal balance of mortgage loans originated and sold to others between 2005 and 2008, we estimate thatapproximately $32 billion in unpaid principal balance remains outstanding as of March 31, 2013, approximately $18 billion in losses have been realized andapproximately $8 billion in unpaid principal balance is at least 90 days delinquent. Because we do not service most of the loans we sold to others, we do not havecomplete information about the underlying credit performance levels for some of these mortgage loans. These amounts reflect our best estimates, includingextrapolations of underlying credit performance where necessary. These estimates could change as we get additional data or refine our analysis.
140
(1)
(1)

Table of Contents
CAPITAL ONE FINANCIAL CORPORATIONNOTES TO CONDENSED CONSOLIDATED FINANCIAL STATEMENTS (UNAUDITED)—(Continued)
The subsidiaries had open repurchase requests relating to approximately $2.6 billion original principal balance of mortgage loans as of March 31, 2013, comparedwith $2.4 billion as of December 31, 2012. As of March 31, 2013, the majority of new repurchase demands received over the last year and, as discussed below,the majority of our $994 million reserve relates to the $27 billion of original principal balance of mortgage loans originally sold to the GSEs or to Active InsuredSecuritizations. Currently, repurchase demands predominantly relate to the 2006 and 2007 vintages. We have received relatively few repurchase demands fromthe 2008 and 2009 vintages, mostly because GreenPoint ceased originating mortgages in August 2007.
The following table presents information on pending repurchase requests by counterparty category and timing of initial repurchase request. The amountspresented are based on original loan principal balances.
Open Pipeline All Vintages (all entities)
(Dollars in millions) (All amounts are Original Principal Balance) GSEs Insured
Securitizations
UninsuredSecuritizations
and Other Total Open claims as of December 31, 2011 $ 176 $ 1,243 $ 672 $2,091 Gross new demands received 189 366 291 846 Loans repurchased/made whole (233) (3) (138) (374) Demands rescinded (75) (30) (40) (145) Reclassifications 2 3 (4) 1
Open claims as of December 31, 2012 $ 59 $ 1,579 $ 781 $2,419
Gross new demands received 38 29 138 205 Loans repurchased/made whole (5) 0 (2) (7) Demands rescinded (24) 0 (4) (28)
Open claims as of March 31, 2013 $ 68 $ 1,608 $ 913 $2,589
The open pipeline includes all repurchase requests ever received by our subsidiaries where either the requesting party has not formally rescinded the
repurchase request and where our subsidiary has not agreed to either repurchase the loan at issue or make the requesting party whole with respect to itslosses. Accordingly, repurchase requests denied by our subsidiaries and not pursued by the counterparty remain in the open pipeline. Moreover, repurchaserequests submitted by parties without contractual standing to pursue repurchase requests are included within the open pipeline unless the requesting party hasformally rescinded its repurchase request. Finally, the amounts reflected in this chart are the original principal balance amounts of the mortgage loans at issueand do not correspond to the losses our subsidiary would incur upon the repurchase of these loans.
Represents adjustments to correct the counterparty category as of December 31, 2012 for amounts that were misclassified. The reclassification had no impacton the total pending repurchase requests; however, it resulted in an increase in open claims attributable to GSEs and Insured Securitizations and a decrease inopen claims attributable to Uninsured Securitizations and Other.
141
(1)
(2)
(1)
(2)

Table of Contents
CAPITAL ONE FINANCIAL CORPORATIONNOTES TO CONDENSED CONSOLIDATED FINANCIAL STATEMENTS (UNAUDITED)—(Continued)
The following table summarizes changes in our representation and warranty reserves for the three months ended March 31, 2013 and 2012, and for full year 2012:
Changes in Representation and Warranty Reserves
Three Months Ended
March 31, Full Year (Dollars in millions) 2013 2012 2012 Representation and warranty repurchase reserve, beginning of period $ 899 $ 943 $ 943 Provision for mortgage representation and warranty losses 97 169 349 Net realized losses (2) (11) (393)
Representation and warranty repurchase reserve, end of period $ 994 $ 1,101 $ 899
Reported in our consolidated balance sheets as a component of other liabilities. The pre-tax portion of the provision for mortgage representation and warranty recognized in our condensed consolidated statements of income as a component of non-interest income was negative $10
million in the first quarter of 2013, compared with expense of $16 million in the first quarter of 2012. The pre-tax portion of the provision for mortgage representation and warranty recognized in ourconsolidated statements of income as a component of discontinued operations totaled $107 million and $153 million in the first quarter of 2013 and 2012, respectively.
As indicated in the table below, most of the reserves relate to the $27 billion in original principal balance of mortgage loans sold directly to the GSEs or to theActive Insured Securitizations.
Allocation of Representation and Warranty Reserves Reserve Liability
(Dollars in millions, except for loans sold) March 31,
2013 December 31,
2012 Loans Sold
2005 to 2008 Selected period-end data: GSEs and Active Insured Securitizations $ 827 $ 817 $ 27 Inactive Insured Securitizations and Others 167 82 84
Total $ 994 $ 899 $ 111
Reflects, in billions, the total original principal balance of mortgage loans originated by our subsidiaries and sold to third party investors between 2005 and 2008.
In establishing reserves for the $11 billion original principal balance of GSE loans, we rely on the historical relationship between GSE loan losses and repurchaseoutcomes for each GSE, adjusted for any settlements, to estimate: (1) the percentage of current and future GSE loan defaults that we anticipate will result inrepurchase requests from the GSEs over the lifetime of the GSE loans; and (2) the percentage of those repurchase requests that we anticipate will result in actualrepurchases. We also rely on estimated collateral valuations and loss forecast models to estimate our lifetime liability on GSE loans. This reserving approach tothe GSE loans reflects the historical interaction with the GSEs around repurchase requests, and also includes anticipated repurchases resulting from mortgageinsurance rescissions. Although our assumed future claims rate considers the most recent claims experience and actual repurchases, an increase in GSE claimsand or repurchases could result in an increase in our reserve. We have entered into and completed repurchase or settlement agreements with respect to themajority of our exposure within this category.
For the $16 billion original principal balance in Active Insured Securitizations, our reserving approach also reflects our historical interaction with monoline bondinsurers around repurchase requests. Typically, monoline
142
(1)
(2)
(1)
(1)(2)
(1)
(1)

Table of Contents
CAPITAL ONE FINANCIAL CORPORATIONNOTES TO CONDENSED CONSOLIDATED FINANCIAL STATEMENTS (UNAUDITED)—(Continued)
bond insurers allege a very high repurchase rate with respect to the mortgage loans in the Active Insured Securitization category. In response to these repurchaserequests, our subsidiaries typically request information from the monoline bond insurers demonstrating that the contractual requirements around a validrepurchase request have been satisfied. In response to these requests for supporting documentation, monoline bond insurers typically initiate litigation.Accordingly, our reserves within the Active Insured Securitization segment are not based upon the historical repurchase rate with monoline bond insurers, butrather upon the expected resolution of litigation with the monoline bond insurers. Every bond insurer within this category is pursuing a substantially similarlitigation strategy either through active or probable litigation. Accordingly, our representation and warranty reserves for this category are litigation reserves.
In establishing litigation reserves for this category, we consider the current and future monoline insurer losses inherent within the securitization and apply legaljudgment to the anticipated factual and legal record to estimate the lifetime legal liability for each securitization. In calculating our reserves, we have assumed wewill pay at least a certain percentage of the monoline insurer’s losses, as alleged in each litigation. We rely on our own past monoline settlement ratios in additionto considering publicly available industry monoline settlement ratios to establish these calculations. We have observed court rulings against other mortgageoriginators that, if upheld on appeal, would create negative precedent for lawsuits involving our collateral; however, the probable impact of these specific rulingsto our litigation reserves cannot be determined at this time. Our reserves with respect to the U.S. Bank Litigation, the DBSP Litigation, and the Ambac Litigation,in each case as referenced below, are contained within the Active Insured Securitization reserve category. Further, to the extent we have litigation reserves withrespect to indemnification risks from certain representation and warranty lawsuits brought by monoline bond insurers against third-party securitizations sponsors,where one of our subsidiaries provided some or all of the mortgage collateral within the securitization but is not a defendant in the litigation, such reserves arealso contained within this category.
For the $4 billion original principal balance of mortgage loans in the Inactive Insured Securitizations category and the $48 billion original principal balance ofmortgage loans in the Uninsured Securitizations category, we establish reserves for grounded claims by parties with standing (as determined by the controllinglegal contracts), utilizing both our own experience and publicly available industry settlement information to estimate lifetime liability. In contrast with the bondinsurers in Insured Securitizations, investors in Uninsured Securitizations often face a number of legal and logistical hurdles before they can force a securitizationtrustee to pursue mortgage repurchases, including the need to coordinate with a certain percentage of investors holding the securities and to indemnify the trusteefor any litigation it undertakes. Despite these legal and logistical hurdles, there is a risk that securitization trustees will pursue mortgage repurchase litigationunilaterally or in coordination with investors. There is also a risk that investors will be able to successfully pursue repurchase litigation independently and withoutthe involvement of the trustee as a party. We do not believe these risks are probable of occurrence based on recent history, and as such we have not provided forsuch risks in our reserve. Some Uninsured Securitization investors from this category are currently suing investment banks and securitization sponsors underfederal and/or state securities laws. Although we face some direct and indirect indemnity risks from these litigations, we have not established reserves withrespect to these indemnity risks because we do not consider them to be both probable and reasonably estimable liabilities.
For the $32 billion original principal balance of mortgage loans sold to private investors as whole loans, we establish reserves by relying on our historical andanticipated claims and repurchase rates to estimate lifetime liability.
143

Table of Contents
CAPITAL ONE FINANCIAL CORPORATIONNOTES TO CONDENSED CONSOLIDATED FINANCIAL STATEMENTS (UNAUDITED)—(Continued)
The aggregate reserves for all three subsidiaries totaled $994 million as of March 31, 2013, compared with $899 million as of December 31, 2012. We recorded atotal provision for mortgage representation and warranty losses for our representation and warranty repurchase exposure of $97 million in the first quarter of2013, which was primarily driven by increased counterparty activity with respect to GreenPoint loans. During the quarter, we had settlements of repurchaserequests totaling $2 million that were charged against the reserves.
As part of our business planning processes, we have considered various outcomes relating to the potential future representation and warranty liabilities of oursubsidiaries that are possible but do not rise to the level of being both probable and reasonably estimable outcomes justifying an incremental accrual underapplicable accounting standards. Our current best estimate of reasonably possible future losses from representation and warranty claims beyond what was in ourreserve as of March 31, 2013 is approximately $2.7 billion, unchanged from our estimate of $2.7 billion as of December 31, 2012. The estimate as of March 31,2013 covers all reasonably possible losses relating to representation and warranty claim activity, including those relating to the US Bank Litigation, the DBSPLitigation, the Ambac Litigation, the LXS Trusts Litigation, and the FHLB of Boston Litigation.
In estimating reasonably possible future losses in excess of our current reserves, we assume a portion of the inactive securitizations become active and for allInsured Securitizations, we assume loss rates on the high end of those observed in monoline settlements or court rulings. For our remaining GSE exposures,Uninsured Securitizations and whole loan exposures, our reasonably possible risk estimates assume lifetime loss rates and claims rates at the highest levels of ourpast experience and also consider the limited instances of observed settlements. We do not assume claim rates or loss rates for these risk categories will be similarto those assumed for the Active Insured Securitizations, however, based on industry precedent. Should the number of claims or the loss rates on these claimsincrease significantly, our estimate of reasonably possible risk would increase materially. We also assume that we will resolve any loan repurchase requestsrelating to loans originated more than six years ago at a discount as compared to those originated within six years of a repurchase claim because of the pendinglegal arguments in various matters around the applicable statute of limitations.
Notwithstanding our ongoing attempts to estimate a reasonably possible amount of future losses beyond our current accrual levels based on current information, itis possible that actual future losses will exceed both the current accrual level and our current estimate of the amount of reasonably possible losses. Our reserveand reasonably possible estimates involve considerable judgment and reflect that there is still significant uncertainty regarding numerous factors that may impactthe ultimate loss levels, including, but not limited to: anticipated litigation outcomes; future repurchase and indemnification claim levels; securitization trusteespursuing mortgage repurchase litigation unilaterally or in coordination with investors; investors successfully pursuing repurchase litigation independently andwithout the involvement of the trustee as a party; ultimate repurchase and indemnification rates; future mortgage loan performance levels; actual recoveries on thecollateral; and macroeconomic conditions (including unemployment levels and housing prices). In light of the significant uncertainty as to the ultimate liabilityour subsidiaries may incur from these matters, an adverse outcome in one or more of these matters could be material to our results of operations or cash flows forany particular reporting period.
Litigation
In accordance with the current accounting standards for loss contingencies, we establish reserves for litigation related matters when it is probable that a lossassociated with a claim or proceeding has been incurred and the amount of the loss can be reasonably estimated. Litigation claims and proceedings of all types aresubject to many uncertain factors that generally cannot be predicted with assurance. Below we provide a description of material legal proceedings and claims.
144

Table of Contents
CAPITAL ONE FINANCIAL CORPORATIONNOTES TO CONDENSED CONSOLIDATED FINANCIAL STATEMENTS (UNAUDITED)—(Continued)
For some of the matters disclosed below, we are able to determine estimates of potential future outcomes that are not probable and reasonably estimable outcomesjustifying either the establishment of a reserve or an incremental reserve build, but which are reasonably possible outcomes. For other disclosed matters, such anestimate is not possible at this time. For those matters below where an estimate is possible, excluding the reasonably possible future losses relating to the U.S.Bank Litigation, the DBSP Litigation, the Ambac Litigation, the LXS Trusts Litigation, and the FHLB of Boston Litigation because reasonably possible losseswith respect to those litigations are included within the reasonably possible representation and warranty liabilities discussed above, management currentlyestimates the reasonably possible future losses could be approximately $150 million. Notwithstanding our attempt to estimate a reasonably possible range of lossbeyond our current accrual levels for some litigation matters based on current information, it is possible that actual future losses will exceed both the currentaccrual level and the range of reasonably possible losses disclosed here. Given the inherent uncertainties involved in these matters, and the very large orindeterminate damages sought in some of these matters, there is significant uncertainty as to the ultimate liability we may incur from these litigation matters andan adverse outcome in one or more of these matters could be material to our results of operations or cash flows for any particular reporting period.
Interchange Litigation
In 2005, a number of entities, each purporting to represent a class of retail merchants, filed antitrust lawsuits (the “Interchange Lawsuits”) against MasterCard andVisa and several member banks, including our subsidiaries and us, alleging among other things, that the defendants conspired to fix the level of interchange fees.The complaints seek injunctive relief and civil monetary damages, which could be trebled. Separately, a number of large merchants have asserted similar claimsagainst Visa and MasterCard only. In October 2005, the class and merchant Interchange Lawsuits were consolidated before the U.S. District Court for the EasternDistrict of New York for certain purposes, including discovery. On July 13, 2012, the parties executed and filed with the court a Memorandum of Understandingagreeing to resolve the litigation on certain terms set forth in a settlement agreement attached to the Memorandum. This agreement is contingent on final courtapproval of the class settlement. In November 2012, the court granted preliminary approval of the class settlement. The court is scheduled to consider finalapproval of the class settlement in September, 2013. The class settlement provides for, among other things, (i) payments by defendants to the class and individualplaintiffs totaling approximately $6.6 billion; (ii) a distribution to the class merchants of an amount equal to 10 basis points of certain interchange transactions fora period of eight months; and (iii) modifications to certain Visa and MasterCard rules regarding point of sale practices.
As members of Visa, our subsidiary banks have indemnification obligations to Visa with respect to final judgments and settlements, including the InterchangeLawsuits. In the first quarter of 2008, Visa completed an IPO of its stock. With IPO proceeds, Visa established an escrow account for the benefit of member banksto fund certain litigation settlements and claims, including the Interchange Lawsuits. As a result, in the first quarter of 2008, we reduced our Visa-relatedindemnification liabilities of $91 million recorded in other liabilities with a corresponding reduction of other non-interest expense. We made an election inaccordance with the accounting guidance for fair value option for financial assets and liabilities on the indemnification guarantee to Visa, and the fair value of theguarantee at December 31, 2011 and December 31, 2012 was zero. Separately, in January 2011, we entered into a MasterCard Settlement and Judgment SharingAgreement, along with other defendant banks, which apportions between MasterCard and its member banks the costs and liabilities of any judgment or settlementarising from the Interchange Lawsuits.
In March 2011, a furniture store owner named Mary Watson filed a proposed class action in the Supreme Court of British Columbia against Visa, MasterCard,and several banks, including Capital One (the “Watson Litigation”). The lawsuit asserts, among other things, that the defendants conspired to fix the merchantdiscount fees that merchants pay on credit card transactions in violation of Section 45 of the Competition Act and seeks
145

Table of Contents
CAPITAL ONE FINANCIAL CORPORATIONNOTES TO CONDENSED CONSOLIDATED FINANCIAL STATEMENTS (UNAUDITED)—(Continued)
unspecified damages and injunctive relief. In addition, Capital One has been named as a defendant in similar proposed class action claims filed in otherjurisdictions in Canada. The Court heard oral argument on plaintiffs’ motion for class certification in the Watson Litigation in April, 2013, and the parties await aruling.
Late Fees Litigation
In 2007, a number of individual plaintiffs, each purporting to represent a class of cardholders, filed antitrust lawsuits in the U.S. District Court for the NorthernDistrict of California against several issuing banks, including us. These lawsuits allege, among other things, that the defendants conspired to fix the level of latefees and over-limit fees charged to cardholders, and that these fees are excessive. In May 2007, the cases were consolidated for all purposes, and a consolidatedamended complaint was filed alleging violations of federal statutes and state law. The amended complaint requests civil monetary damages, which could betrebled, and injunctive relief. In November 2007, the court dismissed the amended complaint. Plaintiffs appealed that order to the Ninth Circuit Court of Appeals.The plaintiffs’ appeal challenges the dismissal of their claims under the National Bank Act, the Depository Institutions Deregulation Act of 1980 and theCalifornia Unfair Competition Law (the “UCL”), but not their antitrust conspiracy claims. In June 2009, the Ninth Circuit Court of Appeals stayed the matterpending the bankruptcy proceedings of one of the defendant financial institutions. After numerous stays since 2009, the Ninth Circuit entered an order lifting thestay on August 29, 2012, and will now hear the appeal. The Ninth Circuit held oral argument on February 11, 2013, and the parties await the court’s decision.
Credit Card Interest Rate Litigation
In July 2010, the U.S. Court of Appeals for the Ninth Circuit reversed a dismissal entered in favor of COBNA in Rubio v. Capital One Bank, which was filed inthe U.S. District Court for the Central District of California in 2007. The plaintiff in Rubio alleges in a putative class action that COBNA breached its contractualobligations and violated the Truth In Lending Act (the “TILA”) and the California Unfair Competition Law (“UCL”) when it raised interest rates on certain creditcard accounts. In May, 2012, the parties agreed to a California-only settlement for a non-material amount, and the Court stayed the case for all purposes exceptfor approval of the settlement. On April 1, 2013, the court granted final approval of the class settlement, and Capital One will begin making payments requiredunder the class settlement agreement.
The Capital One Bank Credit Card Interest Rate Multi-district Litigation matter was created as a result of a June 2010 transfer order issued by the United StatesJudicial Panel on Multi-district Litigation (“MDL”), which consolidated for pretrial proceedings in the U.S. District Court for the Northern District of Georgiatwo pending putative class actions against COBNA—Nancy Mancuso, et al. v. Capital One Bank (USA), N.A., et al., (E.D. Virginia); and Kevin S. Barker, et al.v. Capital One Bank (USA), N.A., (N.D. Georgia), A third action, Jennifer L. Kolkowski v. Capital One Bank (USA), N.A., (C.D. California) was subsequentlytransferred into the MDL. On August 2, 2010, the plaintiffs in the MDL filed a Consolidated Amended Complaint. The Consolidated Amended Complaint allegesin a putative class action that COBNA breached its contractual obligations, and violated the TILA, the California Consumers Legal Remedies Act, the UCL, theCalifornia False Advertising Act, the New Jersey Consumer Fraud Act, and the Kansas Consumer Protection Act when it raised interest rates on certain creditcard accounts. The MDL plaintiffs seek statutory damages, restitution, attorney’s fees and an injunction against future rate increases. Fact discovery is nowclosed. On August 8, 2011, Capital One filed a motion for summary judgment, which remains pending with the court. As a result of the settlement in Rubio v.Capital One Bank, the California-based UCL and TILA claims in the MDL are extinguished.
146

Table of Contents
CAPITAL ONE FINANCIAL CORPORATIONNOTES TO CONDENSED CONSOLIDATED FINANCIAL STATEMENTS (UNAUDITED)—(Continued)
Mortgage Repurchase Litigation
On February 5, 2009, GreenPoint was named as a defendant in a lawsuit commenced in the New York County Supreme Court, by U.S. Bank, N. A., SyncoraGuarantee Inc. and CIFG Assurance North America, Inc. (the “U.S. Bank Litigation”). Plaintiffs allege, among other things, that GreenPoint breached certainrepresentations and warranties in two contracts pursuant to which GreenPoint sold approximately 30,000 mortgage loans having an aggregate original principalbalance of approximately $1.8 billion to a purchaser that ultimately transferred most of these mortgage loans to a securitization trust. Some of the securities issuedby the trust were insured by two of the plaintiffs – Syncora and CIFG. Plaintiffs seek unspecified damages and an order compelling GreenPoint to repurchase theentire portfolio of 30,000 mortgage loans based on alleged breaches of representations and warranties relating to a limited sampling of loans in the portfolio, or,alternatively, the repurchase of specific mortgage loans to which the alleged breaches of representations and warranties relate. On March 3, 2010, the Courtgranted GreenPoint’s motion to dismiss with respect to plaintiffs Syncora and CIFG and denied the motion with respect to U.S. Bank. GreenPoint subsequentlyanswered the complaint with respect to U.S. Bank, denying the allegations, and filed a counterclaim against U.S. Bank alleging breach of covenant of good faithand fair dealing. On February 28, 2012, the Court denied plaintiffs’ motion for leave to file an amended complaint and dismissed Syncora and CIFG from thecase. Syncora and CIFG appealed their dismissal to the New York Supreme Court, Appellate Division, First Department (the “First Department”). In April, 2013,the First Department affirmed the dismissal of Syncora and CIFG from the case.
In September, 2010, DB Structured Products, Inc. (“DBSP”) named GreenPoint in a third-party complaint, filed in the New York County Supreme Court, allegingbreach of contract and seeking indemnification (the “DBSP Litigation”). In the underlying suit, Assured Guaranty Municipal Corp. (“AGM”) sued DBSP foralleged breaches of representations and warranties made by DBSP with respect to certain residential mortgage loans that collateralize a securitization insured byAGM and sponsored by DBSP (the “Underlying Lawsuit”). DBSP purchased the HELOC loans from GreenPoint in 2006. The entire securitization, almost all ofwhich is insured by AGM, is comprised of about 6,200 mortgage loans with an aggregate original principal balance of approximately $353 million. DBSP assertsthat any liability it faces lies with GreenPoint, alleging that DBSP’s representations and warranties to AGM are substantially similar to the representations andwarranties made by GreenPoint to DBSP. GreenPoint filed a motion to dismiss the complaint in October 2010, which the court denied on July 25, 2011. Theparties are currently engaged in discovery.
On October 24, 2012, Capital One, N.A., (“CONA”) as successor to Chevy Chase Bank, F.S.B. (“CCB”), was named as a defendant in a lawsuit filed in theSouthern District of New York by Ambac Assurance Corporation and the Segregated Account of Ambac Assurance Corporation (the “Ambac Litigation”).Plaintiffs allege, among other things, that CONA (as successor to CCB) breached certain representations and warranties in contracts relating to six securitizationswith an aggregate original principal balance of approximately $5.2 billion which were sponsored by a CCB affiliate in 2006 and 2007 and backed by loansoriginated by CCB. Almost half of the securities issued by the six trusts are insured by Ambac. Plaintiffs seek unspecified damages, an order compelling CONAto indemnify Ambac for all accrued and future damages based on alleged breaches of representations and warranties relating to a limited sampling of loans in theportfolio, the repurchase of specific mortgage loans to which the alleged breaches of representations and warranties relate, and all related fees, costs, and interest.CONA moved to dismiss the complaint on January 14, 2013.
On May 30, June 29, and July 30, 2012, FHFA (acting as conservator for Freddie Mac) filed three summons with notice in the New York state court againstGreenPoint, on behalf of the trustees for three RMBS trusts backed by 9,594 loans originated by GreenPoint with an aggregate original principal balance of $3.4billion. On January 25, 2013, the plaintiffs filed an amended consolidated complaint in the name of the three trusts, acting by the respective trustees, allegingbreaches of contractual representations and warranties regarding compliance with
147

Table of Contents
CAPITAL ONE FINANCIAL CORPORATIONNOTES TO CONDENSED CONSOLIDATED FINANCIAL STATEMENTS (UNAUDITED)—(Continued)
GreenPoint underwriting guidelines relating to 1,808 loans. (the “LXS Trusts Litigation”). Plaintiffs seek specific performance of the repurchase obligations withrespect to the loans for which they have provided notice of alleged breaches as well as all other allegedly breaching loans, rescissory damages, indemnification,costs and interest.
As noted above in the section entitled Potential Mortgage Representation & Warranty Liabilities, the Company’s subsidiaries establish reserves with respect torepresentation and warranty litigation matters, where appropriate, within the Company’s overall representation and warranty reserves. Please see above for moredetails.
FHLB Securities Litigation
On April 20, 2011, the Federal Home Loan Bank of Boston (the “FHLB of Boston”) filed suit against dozens of mortgage industry participants in MassachusettsSuperior Court, alleging, among other things, violations of Massachusetts state securities laws in the sale and marketing of certain residential mortgage-backedsecurities (the “FHLB of Boston Litigation”). Capital One Financial Corporation and Capital One, National Association are named in the complaint as allegedsuccessors in interest to Chevy Chase Bank, which allegedly marketed some of the mortgage-backed securities at issue in the litigation. The FHLB of Bostonseeks rescission, unspecified damages, attorneys’ fees, and other unspecified relief. The case was removed to the United States District Court for the District ofMassachusetts in May 2011. FHLB of Boston filed an Amended Complaint on June 29, 2012, and the Company filed a motion to dismiss on October 11, 2012,which is pending.
SEC Investigation
Since July 2009, we have been providing documents and information in response to an inquiry by the Staff of the SEC. In the first quarter of 2010, the SECissued a formal order of investigation with respect to this inquiry. Although the order, as is generally customary, authorized a broader inquiry by the Staff, theinvestigation focused largely on the loan loss reserves for our auto finance business for the second and third quarters of 2007. In April 2013, in order to resolvethe investigation, the Company agreed to the entry of an Administrative Proceeding Order with the SEC in which the SEC found that the Company violatedSections 13(a) and 13(b) of the Exchange Act. The Company also agreed to pay $3.5 million in penalties. The Order does not make any finding with respect toyear-end 2007 loan loss reserves, nor does the resolution of the matter require a restatement of Capital One’s financial results for any prior period.
Checking Account Overdraft Litigation
In May 2010, Capital One Financial Corporation and COBNA were named as defendants in a putative class action named Steen v. Capital One FinancialCorporation, et al., filed in the U.S. District Court for the Eastern District of Louisiana. Plaintiff challenges our practices relating to fees for overdraft and non-sufficient funds fees on consumer checking accounts. Plaintiff alleges that our methodology for posting transactions to customer accounts is designed tomaximize the generation of overdraft fees, supporting claims for breach of contract, breach of the covenant of good faith and fair dealing, unconscionability,conversion, unjust enrichment and violations of state unfair trade practices laws. Plaintiff seeks a range of remedies, including restitution, disgorgement,injunctive relief, punitive damages and attorneys’ fees. In May 2010, the case was transferred to the Southern District of Florida for coordinated pre-trialproceedings as part of a multi-district litigation (MDL) involving numerous defendant banks, In re Checking Account Overdraft Litigation. In January 2011,plaintiffs filed a second amended complaint against CONA in the MDL court. In February 2011, CONA filed a motion to dismiss the second amended complaint.On March 21, 2011, the MDL court granted CONA’s motion to dismiss claims of breach of the covenant of good faith and fair dealing under Texas law, butdenied the motion to dismiss in all other respects. The parties have been engaged in discovery since May, 2011. On June 21, 2012, the MDL
148

Table of Contents
CAPITAL ONE FINANCIAL CORPORATIONNOTES TO CONDENSED CONSOLIDATED FINANCIAL STATEMENTS (UNAUDITED)—(Continued)
court granted plaintiff’s motion for class certification. The modified scheduling order entered by the MDL court on April 1, 2013, contemplates the conclusion ofdiscovery in the third quarter 2013 and we anticipate a remand to the Eastern District of Louisiana in the first quarter 2014.
Hawaii, Mississippi, Missouri and New Mexico State Attorney General Payment Protection Matters
On April 12, 2012, the Attorney General of Hawaii filed a lawsuit in First Circuit Court in Hawaii against Capital One Bank (USA) N.A., and Capital OneServices, LLC. The case is one of several similar lawsuits filed by the Attorney General of Hawaii against various banks challenging the marketing and sale ofpayment protection and credit monitoring products. On June 28, 2012, the Attorney General of Mississippi filed substantially similar suits against Capital Oneand several other banks. On April 17, 2013, the Attorney General of New Mexico also filed substantially similar suits against Capital One and several otherbanks. All three state attorney general complaints allege that Capital One enrolls customers in such programs without their consent and that Capital One enrollscustomers in such programs even in circumstances in which the customer is not eligible to receive benefits for the product in question. Both suits allege violationsof its state Unfair and Deceptive Practices Act and unjust enrichment. The remedies sought in the lawsuits include an injunction prohibiting the Company fromengaging in the alleged violations, restitution for all persons allegedly injured by the complained of practices, civil penalties and costs. On May 18, 2012, CapitalOne removed the Hawaii AG case to U.S. District Court, District of Hawaii. On November 30, 2012, the court denied the Hawaii AG’s motion to remand. TheHawaii AG petitioned to appeal the District Court’s decision to the Ninth Circuit Court of Appeals, which was granted by the Ninth Circuit on April 1, 2013. TheDistrict Court case is now stayed pending the parties’ briefing and decision by the Ninth Circuit. On August 10, 2012 Capital One removed the Mississippi AGcase to U.S. District Court, Southern District of Mississippi. The parties have briefed the Mississippi AG’s motion to remand and await the court’s decision.Capital One has not yet been served with the New Mexico AG lawsuit. Relatedly, Capital One has provided information to the Attorney General of Missouri aspart of an industry-wide informal inquiry initiated in August, 2011, relating to the marketing of payment protection products.
Derivative Actions
On August 17, 2012, a derivative action, titled Iron Workers Mid-South Pension Fund v. Fairbank, et al., Case No. 2012 14130 (“Iron Workers Action”), was filedby a putative stockholder on behalf of the Company in Virginia Circuit Court of Fairfax County (hereafter “Virginia Circuit Court”) against certain current andformer directors and officers of the Company, alleging breach of the fiduciary duty of loyalty, gross mismanagement, corporate waste, and unjust enrichment. Thecomplaint’s allegations stem from the Company’s entering into consent orders with the Office of the Comptroller of the Currency and the Consumer FinancialProtection Bureau regarding vendor sales practices of payment protection and credit monitoring products. Plaintiff shareholder generally alleges that the allegedfailure of the Company’s officers and directors to oversee certain practices between 2010 and early 2012 caused harm to the Company, which is named as a“nominal defendant.” The action includes claims for, among other things, damages in favor of the Company, certain corporate actions to purportedly improve theCompany’s corporate governance and internal procedures, and an award of costs and expenses to the putative plaintiff stockholder, including attorneys’ fees. OnSeptember 19, 2012, a second derivative complaint, titled Barovic v. Fairbank, et al., Case No. 2012 14130, was filed by another putative stockholder on behalf ofthe Company also in the Virginia Circuit Court. The Barovic derivative complaint is substantially identical to the Iron Workers’ Action (collectively “DerivativeActions”). The defendants removed the Derivative Actions from Virginia Circuit Court to the U. S. District Court for the Eastern District of Virginia and filed amotion to dismiss the complaints. The plaintiffs moved to remand the cases back to Virginia Circuit Court. On November 30, 2012, the court denied the motionsto remand and took the motions to dismiss under advisement.
149

Table of Contents
CAPITAL ONE FINANCIAL CORPORATIONNOTES TO CONDENSED CONSOLIDATED FINANCIAL STATEMENTS (UNAUDITED)—(Continued)
Other Pending and Threatened Litigation
In addition, we are commonly subject to various pending and threatened legal actions relating to the conduct of our normal business activities. In the opinion ofmanagement, the ultimate aggregate liability, if any, arising out of all such other pending or threatened legal actions will not be material to our consolidatedfinancial position or our results of operations.
150

Table of Contents
Item 3. Quantitative and Qualitative Disclosures about Market Risk
For a discussion of the quantitative and qualitative disclosures about market risk, see “Part I—Item 2. MD&A—Market Risk Management.”
Item 4. Controls and Procedures
Overview
We are required under applicable laws and regulations to maintain controls and procedures, which include disclosure controls and procedures as well as internalcontrol over financial reporting, as further described below.
(a) Disclosure Controls and Procedures
Disclosure Controls and Procedures
Disclosure controls and procedures refer to controls and other procedures designed to provide reasonable assurance that information required to be disclosed inour financial reports is recorded, processed, summarized and reported within the time periods specified by SEC rules and forms and that such information isaccumulated and communicated to management, including our Chief Executive Officer and Chief Financial Officer, as appropriate, to allow timely decisionsregarding our required disclosure. In designing and evaluating our disclosure controls and procedures, we recognize that any controls and procedures, no matterhow well designed and operated, can provide only reasonable assurance of achieving the desired control objectives, and we must apply judgment in evaluatingand implementing possible controls and procedures.
Evaluation of Disclosure Controls and Procedures
As required by Rule 13a-15 of the Securities Exchange Act of 1934 (the “Exchange Act”), our management, including the Chief Executive Officer and ChiefFinancial Officer, conducted an evaluation of the effectiveness of our disclosure controls and procedures (as that term is defined in Rules 13a-15(e) and 15d-15(e)of the Exchange Act) as of March 31, 2013, the end of the period covered by this Report. Based upon that evaluation, the Chief Executive Officer and ChiefFinancial Officer concluded that our disclosure controls and procedures were effective as of March 31, 2013, at a reasonable level of assurance, in recording,processing, summarizing and reporting information required to be disclosed within the time periods specified by the SEC rules and forms.
(b) Changes in Internal Control Over Financial Reporting
We regularly review our disclosure controls and procedures and make changes intended to ensure the quality of our financial reporting. During the first quarter of2013, we continued to evaluate and implement changes to processes, information technology systems and other components of internal control over financialreporting related to the ING Direct and 2012 U.S. card acquisitions. Significant changes during the quarter included the migration of the ING Direct home loanportfolios to our servicing systems and the transition of data center support services related to the 2012 U.S. card acquisition from HSBC to us. Otherwise, therewere no changes in our internal control over financial reporting during the first quarter of 2013 which have materially affected, or are reasonably likely tomaterially affect, our internal control over financial reporting.
151

Table of Contents
PART II—OTHER INFORMATION
Item 1. Legal Proceedings
The information required by Item 1 is included in “Notes to the Consolidated Financial Statements—Note 14—Commitments, Contingencies and Guarantees.”
Item 1A. Risk Factors
We are not aware of any material changes from the risk factors set forth under “Part I—Item 1A. Risk Factors” in our 2012 Form 10-K.
Item 2. Unregistered Sales of Equity Securities and Use of Proceeds
The following table shows shares of our common stock we repurchased during the first quarter of 2013:
(Dollars in millions, except per share information)
TotalNumber
ofShares
Purchased
AveragePrice Paidper Share
Total Number ofShares Purchased as
Part of PubliclyAnnounced
Plans
MaximumAmount That MayYet be PurchasedUnder the Plan
or Program January 1-31, 2013 217,146 $ 56.50 — $ — February 1-28, 2013 174,988 57.12 — — March 1-31, 2013 106,732 55.06 — —
Total 498,866 $ 56.41 — —
Shares purchased represent shares purchased and share swaps made in connection with stock option exercises and the withholding of shares to cover taxes on restricted stock lapses.
Item 3. Defaults upon Senior Securities
None.
Item 5. Other Information
None.
Item 6. Exhibits
An index to exhibits has been filed as part of this report beginning on page 154 and is incorporated herein by reference.
152
(1)
(1)

Table of Contents
SIGNATURES
Pursuant to the requirements of Section 13 of the Securities Exchange Act of 1934, the registrant has duly caused this report to be signed on its behalf by theundersigned, thereunto duly authorized.
CAPITAL ONE FINANCIAL CORPORATION
Date: May 9, 2013 By: /s/ GARY L. PERLIN
Gary L. Perlin Chief Financial Officer
153

Table of Contents
EXHIBIT INDEXCAPITAL ONE FINANCIAL CORPORATION
QUARTERLY REPORT ON FORM 10-QDATED MARCH 31, 2013
Commission File No. 1-13300
The following exhibits are incorporated by reference or filed herewith. References to (i) the “2003 Form 10-K” are to the Corporation’s Annual Report on Form10-K for the year ended December 31, 2003, filed on March 5, 2004; (ii) the “2004 Form 10-K” are to the Corporation’s Annual Report on Form 10-K for theyear ended December 31, 2004, filed on March 9, 2005; (iii) the “2008 Form 10-K” are to the Corporation’s Annual Report on Form 10-K for the year endedDecember 31, 2008, filed on February 26, 2009; and (iv) the “2011 Form 10-K” are to the Corporation’s Annual Report on Form 10-K for the year endedDecember 31, 2011, filed on February 29, 2012. Exhibit No. Description 2.1
Stock Purchase Agreement, dated as of December 3, 2008, by and among Capital One Financial Corporation, B.F. Saul Real EstateInvestment Trust, Derwood Investment Corporation, and B.F. Saul Company Employee’s Profit Sharing and Retirement Trust(incorporated by reference to Exhibit 2.4 of the Corporation’s 2008 Form 10-K).
2.2.1
Purchase and Sale Agreement, dated as of June 16, 2011, by and among Capital One Financial Corporation, ING Groep N.V., INGBank N.V., ING Direct N.V. and ING Direct Bancorp (incorporated by reference to Exhibit 2.1 of the Corporation’s Current Report onForm 8-K, filed on June 22, 2011).
2.2.2
First Amendment to the Purchase and Sale Agreement by and among Capital One Financial Corporation, ING Groep N.V., ING BankN.V., ING Direct N.V. and ING Direct Bancorp, dated as of February 17, 2012 (incorporated by reference to Exhibit 2.2.2 of theCorporation’s 2011 Form 10-K).
2.3.1
Purchase and Assumption Agreement, dated as of August 10, 2011, by and among Capital One Financial Corporation, HSBC FinanceCorporation, HSBC USA Inc. and HSBC Technology and Services (USA) Inc. (incorporated by reference to Exhibit 2.1 of theCorporation’s Current Report on Form-8-K, filed on August 12, 2011).
2.3.2
Purchaser Transition Services Agreement between HSBC Technology and Services (USA) Inc. and Capital One Services, LLC, datedas of May 1, 2012 (incorporated by reference to Exhibit 10.1 of the Corporation’s Quarterly Report on Form 10-Q for the period endedJune 30, 2012).
3.1
Restated Certificate of Incorporation of Capital One Financial Corporation, (as amended and restated May 16, 2011) (incorporated byreference to Exhibit 3.4 of the Corporation’s Current Report on Form 8-K, filed on May 17, 2011).
3.2
Amended and Restated Bylaws of Capital One Financial Corporation (incorporated by reference to Exhibit 3.2 of the Corporation’sCurrent Report on Form 8-K, filed on May 17, 2011).
3.3
Certificate of Designations of Fixed Rate Non-Cumulative Perpetual Preferred Stock, Series B, dated August 16, 2012 (incorporated byreference to Exhibit 3.1 of the Corporation’s Current Report on Form 8-K on August 20, 2012).
4.1.1
Specimen certificate representing the common stock of Capital One Financial Corporation (incorporated by reference to Exhibit 4.1 ofthe Corporation’s 2003 Form 10-K).
4.1.2
Warrant Agreement, dated December 3, 2009, between Capital One Financial Corporation and Computershare Trust Company, N.A.(incorporated by reference to the Exhibit 4.1 of the Corporation’s Form 8-A filed on December 4, 2009).
154

Table of Contents
Exhibit No. Description
4.1.3
Deposit Agreement, dated August 20, 2012 (incorporated by reference to Exhibit 4.1 of the Corporation’s Current Report on Form 8-Kfiled on August 20, 2012).
4.2.1
Senior Indenture dated as of November 1, 1996 between Capital One Financial Corporation and The Bank of New York Mellon TrustCompany, N.A., formerly known as The Bank of New York Trust Company, N.A. (as successor to Harris Trust and Savings Bank), astrustee (incorporated by reference to Exhibit 4.1 of the Corporation’s Report on Form 8-K, filed on November 13, 1996).
4.2.2
Copy of 6.25% Notes, due 2013, of Capital One Financial Corporation (incorporated by reference to Exhibit 4.5.5 of the 2003 Form 10-K).
4.2.3
Copy of 5.25% Notes, due 2017, of Capital One Financial Corporation (incorporated by reference to Exhibit 4.5.6 of the 2004 Form 10-K).
4.2.4
Copy of 5.50% Senior Notes, due 2015, of Capital One Financial Corporation (incorporated by reference to Exhibit 4.1 of theCorporation’s Quarterly Report on Form 10-Q for the period ending June 30, 2005).
4.2.5
Specimen of 6.750% Senior Note, due 2017, of Capital One Financial Corporation (incorporated by reference to Exhibit 4.1 of theCorporation’s Report on Form 8-K, filed on September 5, 2007).
4.2.6
Specimen of 7.375% Senior Note, due 2014, of Capital One Financial Corporation (incorporated by reference to Exhibit 4.1 of theCorporation’s Report on Form 8-K, filed on May 22, 2009).
4.2.7
Specimen of Floating Rate Senior Note due 2014, of Capital One Financial Corporation (incorporated by reference to Exhibit 4.3 of theCorporation’s Current Report on Form 8-K, filed on July 19, 2011).
4.2.8
Specimen of 2.125% Senior Note due 2014, of Capital One Financial Corporation (incorporated by reference to Exhibit 4.4 of theCorporation’s Current Report on Form 8-K, filed on July 19, 2011).
4.2.9
Specimen of 3.150% Senior Note due 2016, of Capital One Financial Corporation (incorporated by reference to Exhibit 4.5 of theCorporation’s Current Report on Form 8-K, filed on July 19, 2011).
4.2.10
Specimen of 4.750% Senior Note due 2021, of Capital One Financial Corporation (incorporated by reference to Exhibit 4.6 of theCorporation’s Current Report on Form 8-K, filed on July 19, 2011).
4.2.11
Specimen of Floating Rate Senior Note due 2015, of Capital One Financial Corporation (incorporated by reference to Exhibit 4.2 of theCorporation’s Current Report on Form 8-K, filed on November 6, 2012).
4.2.12
Specimen of 1.000% Senior Note due 2015, of Capital One Financial Corporation (incorporated by reference to Exhibit 4.3 of theCorporation’s Current Report on Form 8-K, filed on November 6, 2012).
4.3.1
Indenture, dated as of August 29, 2006, between Capital One Financial Corporation and The Bank of New York Mellon Trust Company,N.A., as indenture trustee (incorporated by reference to Exhibit 4.1 of the Corporation’s Current Report on Form 8-K, filed onAugust 31, 2006).
4.3.2
Copy of Subordinated Note Certificate (incorporated by reference to Exhibit 4.2 of the Corporation’s Current Report on Form 8-K, filedon August 31, 2006).
155

Table of Contents
Exhibit No. Description
10.1* Special Agreement and Release by and between Capital One Financial Corporation and Gary L. Perlin dated February 1, 2013.
12.1* Computation of Ratio of Earnings to Fixed Charges.
12.2* Computation of Ratio of Earnings to Combined Fixed Charges and Preferred Stock Dividends.
31.1* Certification of Richard D. Fairbank.
31.2* Certification of Gary L. Perlin.
32.1* Certification** of Richard D. Fairbank.
32.2* Certification** of Gary L. Perlin.
101.INS* XBRL Instance Document.
101.SCH* XBRL Taxonomy Extension Schema Document.
101.CAL* XBRL Taxonomy Extension Calculation Linkbase Document.
101.DEF* XBRL Taxonomy Extension Definition Linkbase Document.
101.LAB* XBRL Taxonomy Extension Label Linkbase Document.
101.PRE* XBRL Taxonomy Extension Presentation Linkbase Document. * Indicates a document being filed with this Form 10-Q.** Information in this Form 10-Q furnished herewith shall not be deemed to be “filed” for the purposes of Section 18 of the 1934 Act or otherwise subject to the
liabilities of that section.
156

Exhibit 10.1
SPECIAL AGREEMENT AND RELEASE
This Special Agreement and Release (“Agreement”) is made by and between Gary L. Perlin (“you” or “your”) and Capital One Financial Corporation, includingany of its subsidiaries (referred to collectively as “Capital One”) effective as of February 1, 2013.
Reason for Agreement
You have decided to retire from Capital One and you and Capital One desire to set forth the final terms relating to your continued employment with Capital One,your role with Capital One during that time, and your separation therefrom. In exchange for your execution of this Agreement and your agreement to execute a“Supplemental General Release” after your Termination Date (as defined below) (which form of agreement is attached hereto as Exhibit A), Capital One willcontinue your employment through the Termination Date, subject to the terms below. Your separation from service with Capital One will be effective on theTermination Date.
Your Provision of Services to Capital One
You shall continue as Capital One’s Chief Financial Officer through May 24, 2013 and a non-executive senior advisor (“Senior Advisor”) from such date throughFebruary 1, 2014. The period during which you serve as a Senior Advisor is referred to herein as the “Advisory Period”. Capital One reserves the right to removeyou as Chief Financial Officer prior to May 24, 2013, in Capital One’s sole discretion. For the avoidance of doubt, Capital One shall not terminate youremployment without Cause (as defined in the Change of Control Employment Agreement between you and Capital One dated as of March 1, 2010 (the “Changein Control Agreement”)). Your employment with Capital One shall end on the earliest of (i) February 1, 2014, (ii) your resignation, (iii) when Capital Oneterminates your employment for Cause, or (iv) upon your death or your Disability (as defined in the Change in Control Agreement) (the date of your termination,the “Termination Date”).
During the Advisory Period, you agree that you shall make yourself available for consultation with Capital One’s chief executive officer (“CEO”), chief financialofficer (“CFO”), and such other individuals as directed by the CEO, the CFO or others per the CEO or the CFO’s request, to provide advice and counsel. Duringthe Advisory Period, (i) it is anticipated that you will provide services to Capital One at a rate of no less than fifty percent (50%) of the average level of bona fideservices you performed for Capital One over the 36-month period immediately preceding the commencement of the Advisory Period, and (ii) you will not acceptemployment with or otherwise provide services to any other person or entity during the Advisory Period except that you may engage in any activities that areallowed under Capital One’s Code of Business Conduct and Ethics or as otherwise agreed in writing by the CEO.
Consideration for Signing this Agreement and Exhibit A
If you agree to the terms set forth in this Agreement, specifically, but without limitation, your agreement to the provisions under “General Release of Claims,”Capital One will continue your employment from the date hereof through the Termination Date as described above. You will be entitled to continue to receivestandard compensation items (cash salary, RSU salary, equity grants, etc.) and employee benefits consistent with compensation and benefit programs offered toExecutive Committee members through the Termination Date. You shall be eligible to earn the total compensation targets for the 2013 performance year that wereestablished for you by the Compensation Committee of Capital One’s Board of Directors (“Compensation Committee”) at its January 2013 meeting. Any actualmid-term and long-term equity awards granted in 2014 for the 2013 performance year shall be determined by the Compensation Committee in its discretion andshall be subject to all

standard program terms, including, without limitation, continued employment through the date of grant. If you continue to remain employed in January 2014, youshall continue to receive a pro-rated cash salary and RSU salary established for performance year 2013, but you shall not receive any mid-term or long-termincentive awards for the 2014 performance year.
General Release of Claims
In consideration of the continued employment provided for in this Agreement, which you agree is good, valuable, adequate and sufficient consideration under thisAgreement, you acknowledge and agree that, you and your agents, representatives, and heirs, do hereby fully release (i.e., give up) and forever discharge CapitalOne and its parent, subsidiary and affiliated corporations, organizations and entities, including without limitation CAPITAL ONE FINANCIAL CORPORATION,CAPITAL ONE SERVICES, INC., CAPITAL ONE SERVICES, LLC, CAPITAL ONE, NATIONAL ASSOCIATION, CAPITAL ONE AUTO FINANCE, INC.,CAPITAL ONE BANK (USA), NATIONAL ASSOCIATION, CHEVY CHASE BANK, F.S.B. and each of them, and all of their respective past, present andfuture affiliates, partners, joint ventures, stockholders, predecessors, successors, assigns, insurers, officers, directors, employees, agents, representatives, attorneysand independent contractors of all such released corporations, organizations and entities, as well as their employee benefit plans, and the trustees, administrators,fiduciaries and insurers of such plans (collectively, the “Released Parties”), and each of them, jointly and severally, from any and all claims, causes of action,charges, suits, controversies, and demands of any kind, whether known or unknown, whether for injunctive relief, back pay, fringe benefits, reinstatement,reemployment, or compensatory, punitive or any other kind of damages, which you ever have had in the past or presently have against the Released Partiesthrough the date of this Agreement, arising from or relating to your employment with Capital One or the termination of that employment or any circumstancesrelated thereto.
Types of Claims Waived
Such claims, causes of action, charges or similar actions include but are not limited to claims arising under or relating to employment, employment contracts,employee benefits or purported employment discrimination or violations of civil rights of whatever kind or nature, including without limitation all claims arisingunder Title VII of the Civil Rights Act of 1964, the Civil Rights Act of 1991, the Civil Rights Acts of 1866 and/or 1871, 42 U.S.C. Section 1981, the AmericansWith Disabilities Act of 1990, the Age Discrimination in Employment Act (“ADEA”), the Family Medical Leave Act, Executive Order 11246, the RehabilitationAct of 1973, the Employee Retirement Income Security Act of 1974, any state human rights act, or any other applicable federal, state or local employment statute,law or ordinance. Except as provided herein, all claims for incentive compensation awards under any Capital One plan or payroll practice, along with any claimsunder any state wage and hour laws, are specifically subject to this release of claims. You further agree that you will not file or permit to be filed, initiated orprosecuted on your behalf any such claim this Agreement purports to waive.
Claims Not Waived
Notwithstanding the preceding provision or any other provision of the Agreement, your agreement to the provisions under “General Release of Claims” is notintended to prohibit you from bringing an action to challenge the validity of your release of claims under the ADEA.
This Agreement is not intended to interfere with your right to file a charge with an administrative agency in connection with any claim you believe you may haveagainst any of the Released Parties. However, by executing this Agreement, you hereby waive the right to recover, and agree not to seek any damages, remediesor other relief for yourself personally in any proceeding you may bring before such agency or in any proceeding brought by such agency on your behalf. ThisAgreement is also not intended to apply to claims under ERISA Section 502(a)(1)(B) for benefits that are vested and accrued (other than claims for severance andseverance-related benefits) under any qualified employee benefit plan of Capital One pursuant to the terms of any such plan or to claims under any non-qualifiedor other compensation or employee benefit plan of Capital One for accrued and vested benefits pursuant to the terms of any such plan.

Further, you understand that you are not releasing your rights under this Agreement, that any claims which cannot be lawfully waived are excluded from thisAgreement and that by executing this Agreement you are not waiving any such claims. In addition, you are not releasing any rights you may have toindemnification under applicable corporate law, under the by-laws or certificate of incorporation of Capital One or any of its affiliates or as an insured under anydirectors’ and officers’ liability insurance policy now or previously in force, or any rights you may have under Capital One’s equity award plans or rights as astockholder of Capital One.
Likewise, you are not releasing any rights or claims that may arise after the date on which you sign this Agreement. In addition, while this Agreement requiresyou to waive any and all claims against Capital One arising under workers’ compensation laws (e.g., claims of retaliation for filing a workers’ compensationclaim), it is not intended to prohibit you from filing in good faith for and from receiving any workers’ compensation benefits from Capital One’s workers’compensation carrier for compensable injuries incurred during your employment. Accordingly, pursuit of any such workers’ compensation benefits with CapitalOne’s workers’ compensation carrier will not be considered a violation of this Agreement.
Notification of ADEA Rights and Claims/Opportunity for Review
As outlined above in the General Release of Claims provision, you understand that this Agreement specifically releases and waives all claims you may have forage discrimination under the ADEA, except for those that may arise after the date this Agreement is executed by you. Likewise, you understand that thisAgreement does not prohibit you from challenging the validity of your release of claims under the ADEA. Understanding the above, you agree and acknowledgethat your execution of this Agreement is completely voluntary and that you have been advised to consult with an attorney prior to executing this Agreement toensure that you fully and thoroughly understand its legal significance. You acknowledge that you have at least twenty-one (21) days from receipt of thisAgreement to consider the provisions of this Agreement during which time you can consult with counsel concerning its terms. You acknowledge that if youexecute this Agreement prior to the expiration of the twenty-one (21) days, your execution is completely voluntary and done with the knowledge that you arewaiving your entitlement to this review period. You acknowledge that any changes negotiated by the parties shall not re-start the consideration period.
You further acknowledge and understand that you may revoke this Agreement within seven (7) days after its execution by you by sending a written letter ofrevocation post-marked no later than seven (7) days after your execution of this Agreement to John Finneran at the address below. You further acknowledge andunderstand that this Agreement is not effective or enforceable until the revocation period has expired.
Acknowledgement
You acknowledge that as of the time of the execution of this Agreement by you, you are unaware of or have already fully disclosed to Capital One pursuant toCapital One’s policies or Capital One is otherwise aware of any facts or conduct that would tend to establish or in any way support an allegation that Capital Oneor any of the Released Parties or their employees or agents have engaged in conduct that you believe would constitute a violation of any statute, rule or regulationof the Securities and Exchange Commission or any provision of federal law relating to fraud against shareholders pursuant to the Sarbanes-Oxley Act or any stateor local counterpart and are unaware of or have already fully disclosed to Capital One or Capital One is otherwise aware of any facts or conduct that would giverise to a claim by you or by any other party against Capital One of the type or sort referenced in this section.
Effect of Pursuing Released Claims
Except to the extent such agreement is prohibited by applicable law or regulation, you understand and agree that if you file a lawsuit for claims released by thisAgreement, such action shall further require you to reimburse Capital One for any compensation provided to you during the period of time you work as a SeniorAdvisor and to

pay all reasonable costs and attorneys’ fees incurred by Capital One in defending any such action brought by you in violation of this Agreement, in addition toany other damages or relief to which Capital One may be entitled.
Notwithstanding the above or any other provision to the contrary, the above will not apply to any action brought by you to challenge the validity of your waiver ofany ADEA claims under this Agreement.
Modification
This Agreement may be modified only in writing, signed by both parties. E-mail communication does not modify this agreement.
No Admission
This Agreement does not constitute an admission of liability or wrongdoing of any kind by Capital One or its affiliates or you.
Severability
It is the intent of the parties that the provisions of this Agreement be enforced to the fullest extent permissible under applicable law. If any provision of thisAgreement shall be adjudged by any court of competent jurisdiction to be invalid or unenforceable, such judgment shall not invalidate any other provision of thisAgreement, except that Capital One shall not be obligated to continue your employment should the General Release of Claims be invalidated. The parties agreethat if a court of competent jurisdiction adjudges any provision of this Agreement to be invalid or unenforceable; such court shall modify such provision so that itis enforceable to the extent permitted by applicable law consistent with the parties’ intent.
Successor
This Agreement is personal to you and shall not be assignable by you other than by will or the laws of descent and distribution. This Agreement shall inure to thebenefit of and be enforceable by your heirs and legal representatives. The rights and obligations of Capital One under this Agreement shall be binding on andinure to the benefit of Capital One, its successors and assigns.
No Further Payments, Benefits, Attorneys’ Fees or Costs
You understand and agree that you will not receive any payments or benefits from Capital One or its affiliates after the Termination Date, except under applicablebenefit or equity plans and arrangements. You acknowledge that you are not entitled to any payment in the nature of severance or termination pay from CapitalOne or its affiliates.
Confidentiality and Non-Competition Agreement
You acknowledge and agree that the Confidentiality, Work Product and Non-Solicitation of Employee Agreement (“CWP+NS Agreement”), effective as ofJanuary 1, 2009 and the Non-Competition Agreement effective as of January 1, 2009 (as amended March 1, 2010), both between you and Capital One, shallremain in force pursuant to their terms and that you shall comply with your obligations under such Agreements. Pursuant to paragraph 4 of your Non-CompetitionAgreement, Capital One will advise you in writing if it determines that a waiver of the second year of your Non-Competition Period is appropriate no later than30 days following your Termination Date.

Indemnification
All rights to indemnification and exculpation from liability for acts or omissions occurring on or prior to the Termination Date existing in your favor underCapital One’s Certificate of Incorporation and Bylaws and Delaware law and otherwise shall continue in full force and effect subsequent to the Termination Date.Capital One will ensure that you remain covered under its directors and officers insurance policy at least to the extent then provided for other directors andofficers of Capital One with respect to all acts, omissions and/or events relating to or arising out of your being an employee, officer, director, representative ortrustee/administrator or other fiduciary with Capital One or any of its affiliates, subsidiaries or employee benefit plans or any third party with respect to whichyou were acting as a representative of Capital One or any of its affiliates or subsidiaries.
Section 409A
All payments and benefits to be paid or provided to you pursuant to this Agreement are intended to comply with or be exempt from section 409A of the InternalRevenue Code of 1986 as amended, the regulations promulgated thereunder, and the rulings, notices and other guidance issued by the Internal Revenue Serviceinterpreting the same (“Section 409A”), and the provisions of this Agreement shall be administered, interpreted and construed in accordance with and toimplement such intent. In implementation of the foregoing, it is agreed as follows:
(a) Your termination of employment with Capital One on the Termination Date for any reason other than death shall be treated as a “separation fromservice” within the meaning of Treas. Reg. §1.409A-1(n)(1).
(b) To the extent that the reimbursement of any expenses or the provision of any in-kind benefits under any provision of the Agreements is subject toSection 409A (after taking into account all applicable exclusions and exemptions), (i) the amount of such expenses eligible for reimbursement or in-kind benefitsto be provided during any one calendar year shall not affect the amount of such expenses eligible for reimbursement, or in-kind benefits to be provided, in anyother calendar year, (ii) reimbursement of any such expenses shall be made by no later than December 31 of the year next following the calendar year in whichsuch expense is incurred, and (iii) your right to receive such reimbursement or in-kind benefits shall not be subject to liquidation or exchange for another benefit.
Choice of Law
To ensure uniformity of the enforcement of this Agreement, and irrespective of the fact that either of the parties now is or may become, a resident of a differentstate, this Agreement shall be governed by and construed in accordance with the laws of the Commonwealth of Virginia without regard to any principles ofconflicts of law.
No Waiver
Any waiver by Capital One of any provision of this Agreement in any instance shall not be deemed a waiver of such provision in the future.
Headings
The headings in this Agreement are included for convenience only and shall not constitute a part of the Agreement nor shall they affect its meaning, constructionor effect.
Integration
This Agreement, together with the Non-Competition Agreement, CWP+NS Agreement and the Supplemental General Release (collectively, the “Agreements”),constitute the final and complete agreement between the parties relating to the subject matter hereof, and you agree and stipulate that no other representationshave been

made by Capital One to you except those expressly set forth herein, and the Agreements resolve all outstanding issues arising from or relating to youremployment with Capital One, and that you will not receive anything further from Capital One except as provided herein; provided, however, thatnotwithstanding any provision of the Agreements to the contrary, any agreements containing confidentiality, intellectual property, non-solicitation provisions orsimilar agreements to which you are a party, your award agreements regarding outstanding equity awards, and applicable benefit plans and agreements, shallexpressly remain in full force and effect according to their terms.
Opportunity for Review
You agree and acknowledge that your execution of this Agreement is completely voluntary and that you have been advised to consult with an attorney prior toexecuting this Agreement to ensure that you fully and thoroughly understand its legal significance.
If the terms of this Agreement are acceptable to you, please indicate your agreement by signing below and returning two originals to:
John FinneranCapital One Financial Corporation
1680 Capital One DriveMcLean, VA 22102-3491
[remainder of page intentionally left blank]

You are advised to discuss the benefits and obligations outlined in this Agreement, including the provision relating to your general release of claims, with anattorney or advisor of your choice.
The Parties have read this Agreement, understand it, and accept all of its terms: /s/ Gary L. Perlin February 1, 2013Gary L. Perlin Date
Authorized Capital One Representative:
/s/ Jory A. Berson February 1, 2013Jory A. Berson DateChief Human Resources Officer

Exhibit A
SUPPLEMENTAL GENERAL RELEASE TEMPLATE
This Supplemental General Release (“Supplemental Release”) is made by and between Gary L. Perlin (“you” or “your”) and Capital One Financial Corporation,including any of its subsidiaries (referred to collectively as “Capital One”) effective as of .
Reason for Agreement
The purpose of this Supplemental Release is to supplement, but not supersede that certain Special Agreement and Release that you executed as of January __,2013 (the “Special Agreement”), by and between you and Capital One, which is incorporated herein by reference. In the event that any inconsistencies occurbetween this Supplemental Release and the Special Agreement, you agree that the terms of this Supplemental Release shall govern and be given full and bindingeffect. You further agree that to the extent not specifically set forth in this Supplemental Release the provisions set forth in the Special Agreement shall beenforceable in their entirety and are fully incorporated herein by reference. Capitalized terms not specifically defined herein have the meanings specified in theSpecial Agreement.
General Release of Claims
In consideration of the payments and other benefits provided for in this Supplemental Release, which you agree is good, valuable, adequate and sufficientconsideration under this Supplemental Release, you acknowledge and agree that, you and your agents, representatives, and heirs, do hereby fully release (i.e., giveup) and forever discharge Capital One and its parent, subsidiary and affiliated corporations, organizations and entities, including without limitation CAPITALONE FINANCIAL CORPORATION, CAPITAL ONE SERVICES, INC., CAPITAL ONE SERVICES, LLC, CAPITAL ONE, NATIONAL ASSOCIATION,CAPITAL ONE AUTO FINANCE, INC., CAPITAL ONE BANK (USA), NATIONAL ASSOCIATION, CHEVY CHASE BANK, F.S.B. and each of them, andall of their respective past, present and future affiliates, partners, joint ventures, stockholders, predecessors, successors, assigns, insurers, officers, directors,employees, agents, representatives, attorneys and independent contractors of all such released corporations, organizations and entities, as well as their employeebenefit plans, and the trustees, administrators, fiduciaries and insurers of such plans (collectively, the “Released Parties”), and each of them, jointly and severally,from any and all claims, causes of action, charges, suits, controversies, and demands of any kind, whether known or unknown, whether for injunctive relief, backpay, fringe benefits, reinstatement, reemployment, or compensatory, punitive or any other kind of damages, which you ever have had in the past or presently haveagainst the Released Parties through the date of this Supplemental Release, arising from or relating to your employment with Capital One or the termination ofthat employment or any circumstances related thereto.
Types of Claims Waived
Such claims, causes of action, charges or similar actions include but are not limited to claims arising under or relating to employment, employment contracts,employee benefits or purported employment discrimination or violations of civil rights of whatever kind or nature, including without limitation all claims arisingunder Title VII of the Civil Rights Act of 1964, the Civil Rights Act of 1991, the Civil Rights Acts of 1866 and/or 1871, 42 U.S.C. Section 1981, the AmericansWith Disabilities Act of 1990, the Age Discrimination in Employment Act (“ADEA”), the Family Medical Leave Act, Executive Order 11246, the RehabilitationAct of 1973, the Employee Retirement Income Security Act of 1974, any state human rights act, or any other applicable federal, state or local employment statute,law or ordinance. Except as provided herein, all claims for incentive compensation awards under any Capital One plan or payroll practice, along with any claimsunder any state wage and hour laws, are specifically subject to this release of claims. You further agree that you will not file or permit to be filed, initiated orprosecuted on your behalf any such claim this Supplemental Release purports to waive.

Claims Not Waived
Notwithstanding the preceding provision or any other provision of the Agreement, your agreement to the provisions under “General Release of Claims” is notintended to prohibit you from bringing an action to challenge the validity of your release of claims under the ADEA.
This Supplemental Release is not intended to interfere with your right to file a charge with an administrative agency in connection with any claim you believe youmay have against any of the Released Parties. However, by executing this Supplemental Release, you hereby waive the right to recover, and agree not to seek anydamages, remedies or other relief for yourself personally in any proceeding you may bring before such agency or in any proceeding brought by such agency onyour behalf. This Supplemental Release is also not intended to apply to claims under ERISA Section 502(a)(1)(B) for benefits that are vested and accrued (otherthan claims for severance and severance-related benefits) under any qualified employee benefit plan of Capital One pursuant to the terms of any such plan or toclaims under any non-qualified or other compensation or employee benefit plan of Capital One for accrued and vested benefits pursuant to the terms of any suchplan.
Further, you understand that you are not releasing your rights under this Supplemental Release, that any claims which cannot be lawfully waived are excludedfrom this Supplemental Release and that by executing this Supplemental Release you are not waiving any such claims. In addition, you are not releasing anyrights you may have to indemnification under applicable corporate law, under the by-laws or certificate of incorporation of Capital One or any of its affiliates oras an insured under any directors’ and officers’ liability insurance policy now or previously in force, or any rights you may have under Capital One’s equity awardplans or rights as a stockholder of Capital One.
Likewise, you are not releasing any rights or claims that may arise after the date on which you sign this Supplemental Release. In addition, while thisSupplemental Release requires you to waive any and all claims against Capital One arising under workers’ compensation laws (e.g., claims of retaliation for filinga workers’ compensation claim), it is not intended to prohibit you from filing in good faith for and from receiving any workers’ compensation benefits fromCapital One’s workers’ compensation carrier for compensable injuries incurred during your employment. Accordingly, pursuit of any such workers’compensation benefits with Capital One’s workers’ compensation carrier will not be considered a violation of this Supplemental Release.
Notification of ADEA Rights and Claims/Opportunity for Review
As outlined above in the General Release of Claims provision, you understand that this Supplemental Release specifically releases and waives all claims you mayhave for age discrimination under the ADEA, except for those that may arise after the date this Supplemental Release is executed by you. Likewise, youunderstand that this Supplemental Release does not prohibit you from challenging the validity of your release of claims under the ADEA. Understanding theabove, you agree and acknowledge that your execution of this Supplemental Release is completely voluntary and that you have been advised to consult with anattorney prior to executing this Supplemental Release to ensure that you fully and thoroughly understand its legal significance. You acknowledge that you have atleast twenty-one (21) days from receipt of this Supplemental Release to consider the provisions of this Supplemental Release during which time you can consultwith counsel concerning its terms. You acknowledge that if you execute this Supplemental Release prior to the expiration of the twenty-one (21) days, yourexecution is completely voluntary and done with the knowledge that you are waiving your entitlement to this review period. You acknowledge that any changesnegotiated by the parties shall not re-start the consideration period.
You further acknowledge and understand that you may revoke this Supplemental Release within seven (7) days after its execution by you by sending a writtenletter of revocation post-marked no later than seven (7) days after your execution of this Supplemental Release to John Finneran at the address below. You furtheracknowledge and understand that this Supplemental Release is not effective or enforceable until the revocation period has expired.

Acknowledgment
You acknowledge that as of the time of the execution of this Agreement by you, you are unaware of or have already fully disclosed to Capital One pursuant toCapital One’s policies or Capital One is otherwise aware of any facts or conduct that would tend to establish or in any way support an allegation that Capital Oneor any of the Released Parties or their employees or agents have engaged in conduct that you believe would constitute a violation of any statute, rule or regulationof the Securities and Exchange Commission or any provision of federal law relating to fraud against shareholders pursuant to the Sarbanes-Oxley Act or any stateor local counterpart and are unaware of or have already fully disclosed to Capital One or Capital One is otherwise aware of any facts or conduct that would giverise to a claim by you or by any other party against Capital One of the type or sort referenced in this section.
Return of Capital One Assets
All assets of Capital One and its affiliates (including, but not limited to confidential information, telephones, fax machines, personal computers, Blackberries,corporate credit cards and phone cards) must be returned to Capital One in their current condition upon your Termination Date. By signing and returning thisSupplemental Release, you represent that you have left with, or returned to, or agree to leave with or return to Capital One and/or destroyed (where applicable)and no longer possess or control, any memoranda, notes, documents, business plans, customer lists, computer programs and any other records, or any kind, andany and all copies (either written or electronic) thereof, made or compiled, in whole or in part, by you or made available to you, during the course of youremployment with Capital One which are in your possession as of the Termination Date. Nothing herein shall prohibit you from retaining (i) your personal effects(including, but not limited to, personal cell phones, Blackberry devices, photographs, diaries, rolodexes, Outlook contacts and calendars); (ii) information relatingto your compensation as reasonably needed for tax purposes; and (iii) your copies of plans, programs and agreements relating specifically to the terms andconditions of your employment.
Effect of Pursuing Released Claims
Except to the extent such agreement is prohibited by applicable law or regulation, you understand and agree that if you file a lawsuit for claims released by thisAgreement, such action shall further require you to reimburse Capital One for any compensation provided to you during the period of time you work as a SeniorAdvisor and to pay all reasonable costs and attorneys’ fees incurred by Capital One in defending any such action brought by you in violation of this Agreement,in addition to any other damages or relief to which Capital One may be entitled.
Notwithstanding the above or any other provision to the contrary, the above will not apply to any action brought by you to challenge the validity of your waiver ofany ADEA claims under this Agreement.
Modification
This Supplemental Release may be modified only in writing, signed by both parties. E-mail communication does not modify this agreement.
No Admission
This Supplemental Release does not constitute an admission of liability or wrongdoing of any kind by Capital One or its affiliates.

Severability
It is the intent of the parties that the provisions of this Agreement be enforced to the fullest extent permissible under applicable law. If any provision of thisAgreement shall be adjudged by any court of competent jurisdiction to be invalid or unenforceable, such judgment shall not invalidate any other provision of thisAgreement, except that Capital One shall not be obligated to continue your employment should the General Release of Claims be invalidated. The parties agreethat if a court of competent jurisdiction adjudges any provision of this Agreement to be invalid or unenforceable; such court shall modify such provision so that itis enforceable to the extent permitted by applicable law consistent with the parties’ intent.
Successor
This Supplemental Release is personal to you and shall not be assignable by you other than by will or the laws of descent and distribution. This SupplementalRelease shall inure to the benefit of and be enforceable by your heirs and legal representatives. The rights and obligations of Capital One under this SupplementalRelease shall be binding on and inure to the benefit of Capital One, its successors and assigns.
No Further Payments, Benefits, Attorney’s Fees or Costs
You understand and agree that you will not receive any payments or benefits from Capital One or its affiliates after the Termination Date, except under applicablebenefit and equity plans and arrangements. You acknowledge that you are not entitled to any payment in the nature of severance or termination pay from CapitalOne or its affiliates.
Confidentiality and Non-Competition Agreements
You acknowledge and agree that the Confidentiality, Work Product and Non-Solicitation of Employee Agreement (“CWP+NS Agreement”), effective as ofJanuary 1, 2009 and the Non-Competition Agreement effective as of January 1, 2009 (as amended March 1, 2010), both between you and Capital One, shallremain in force pursuant to their terms and that you shall comply with your obligations under such Agreements. Pursuant to paragraph 4 of your Non-CompetitionAgreement, Capital One will advise you in writing if it determines that a waiver of the second year of your Non-Competition Period is appropriate no later than30 days following your Termination Date.
Choice of Law
To ensure uniformity of the enforcement of this Supplemental Release, and irrespective of the fact that either of the parties now is or may become, a resident of adifferent state, this Supplemental Release shall be governed by and construed in accordance with the laws of the Commonwealth of Virginia without regard to anyprinciples of conflicts of law.
Full Cooperation
At all times until and for five years after your Termination Date, you agree to take all reasonable actions requested by Capital One to assist in any threatened orpending litigation involving Capital One. Notwithstanding the foregoing, in carrying out the provisions of this paragraph, you shall not be required to take anyaction that could result in any type of criminal liability on your part. Capital One will make reasonable efforts to limit your participation under this paragraph toregular business hours and will also make reasonable efforts to accommodate your personal and business commitments. Capital One shall reimburse you for yourreasonable expenses incurred in carrying out the provisions of this paragraph, including demonstrably lost wages and, if reasonably deemed necessary by you,legal fees for separate counsel.

Indemnification
All rights to indemnification and exculpation from liability for acts or omissions occurring on or prior to the Termination Date existing in your favor underCapital One’s Certificate of Incorporation and Bylaws and Delaware law and otherwise shall continue in full force and effect subsequent to the Termination Date.Capital One will ensure that you remain covered under its directors and officers insurance policy at least to the extent then provided for other directors andofficers of Capital One with respect to all acts, omissions and/or events relating to or arising out of your being an employee, officer, director, representative ortrustee/administrator or other fiduciary with Capital One or any of its affiliates, subsidiaries or employee benefit plans or any third party with respect to whichyou were acting as a representative of Capital One or any of its affiliates or subsidiaries.
No Waiver
Any waiver by Capital One of any provision of this Supplemental Release in any instance shall not be deemed a waiver of such provision in the future.
Headings
The headings in this Supplemental Release are included for convenience only and shall not constitute a part of the Agreement nor shall they affect its meaning,construction or effect.
Integration
This Supplemental Release, together with the Special Agreement and Release, the CWP+NS Agreement and the Non-Competition Agreement (collectively, the“Agreements”), constitute the final and complete agreement between the parties relating to the subject matter hereof, and you agree and stipulate that no otherrepresentations have been made by Capital One to you except those expressly set forth herein, and the Agreements resolve all outstanding issues arising from orrelating to your employment with Capital One, and that you will not receive anything further from Capital One except as provided herein; provided, however, thatnotwithstanding any provision of the Agreements to the contrary, any agreements containing confidentiality, intellectual property, non-solicitation provisions orsimilar agreements to which you are a party, your award agreements regarding outstanding equity awards, and applicable benefit plans and agreements, shallexpressly remain in full force and effect according to their terms.
Opportunity for Review
You agree and acknowledge that your execution of this Supplemental Release is completely voluntary and that you have been advised to consult with an attorneyprior to executing this Supplemental Release to ensure that you fully and thoroughly understand its legal significance.
If the terms of this Supplemental Release are acceptable to you, please indicate your agreement by signing below and returning two originals to:
John FinneranCapital One Financial Corporation
1680 Capital One DriveMcLean, VA 22102-3491
[remainder of page intentionally left blank]

You are advised to discuss the benefits and obligations outlined in this Supplemental Release, including the provision relating to your general release of claims,with an attorney or advisor of your choice.
The Parties have read this Supplemental Release, understand it, and accept all of its terms: Gary L. Perlin Date
Authorized Capital One Representative:
Jory A. Berson DateChief Human Resources Officer

Exhibit 12.1
COMPUTATION OF RATIO OF EARNINGS TO FIXED CHARGES
Three MonthsEnded
March 31,2013
Year Ended December 31,
(Dollars in millions) 2012 2011 2010 2009 2008 Ratio (including interest expense on deposits): Earnings:
Income from continuing operations before income taxes $ 1,638 $5,035 $4,587 $4,330 $1,336 $ 582 Fixed charges 482 2,377 2,251 2,903 2,975 3,985 Equity in undistributed loss of unconsolidated subsidiaries 34 127 112 49 60 55
Earnings available for fixed charges, as adjusted $ 2,154 $7,539 $6,950 $7,282 $4,371 $4,622
Fixed charges: Interest expense on deposits and borrowings $ 481 $2,375 $2,246 $2,896 $2,967 $3,963 Interest factor in rent expense 1 2 5 7 8 22
Total fixed charges $ 482 $2,377 $2,251 $2,903 $2,975 $3,985
Ratio of earnings to fixed charges 4.47 3.17 3.09 2.51 1.47 1.16 Ratio (excluding interest expense on deposits): Earnings:
Income from continuing operations before income taxes $ 1,638 $5,035 $4,587 $4,330 $1,336 $ 582 Fixed charges 156 974 1,064 1,438 882 1,473 Equity in undistributed loss of unconsolidated subsidiaries 34 127 112 49 60 55
Earnings available for fixed charges, as adjusted $ 1,828 $6,136 $5,763 $5,817 $2,278 $ 2,110
Fixed charges: Interest expense on borrowings $ 155 $ 972 $1,059 $1,431 $ 874 $1,451 Interest factor in rent expense 1 2 5 7 8 22
Total fixed charges $ 156 $ 974 $1,064 $1,438 $ 882 $1,473
Ratio of earnings to fixed charges, excluding interest on deposits 11.74 6.30 5.42 4.05 2.58 1.43
On February 27, 2009, we acquired Chevy Chase Bank, fsb. On February 17, 2012, we acquired ING Direct. On May 1, 2012, we closed the U.S. card acquisition. Each of these transactions was accountedfor under the acquisition method of accounting, and their respective results of operations are included in our results from each respective transaction date.Represents total interest expense reported in our consolidated statements of income, excluding interest on deposits of $326 million for the first quarter of 2013, and $1.4 billion, $1.2 billion, $1.5 billion,$2.1 billion, and $2.5 billion for the years ended December 31, 2012, 2011, 2010, 2009 and 2008, respectively.
(1)
(1)
(2)
(1)
(2)

Exhibit 12.2
COMPUTATION OF RATIO OF EARNINGS TO COMBINED FIXED CHARGES ANDPREFERRED STOCK DIVIDENDS
Three Months
EndedMarch 31,
2013
Year Ended December 31,
(Dollars in millions) 2012 2011 2010 2009 2008 Ratio (including interest expense on deposits): Earnings:
Income from continuing operations before income taxes $ 1,638 $5,035 $4,587 $4,330 $1,336 $ 582 Fixed charges 482 2,377 2,251 2,903 2,975 3,985 Equity in undistributed loss of unconsolidated subsidiaries 34 127 112 49 60 55
Earnings available for fixed charges, as adjusted $ 2,154 $7,539 $6,950 $7,282 $4,371 $4,622
Fixed charges: Interest expense on deposits and borrowings $ 481 $2,375 $2,246 $2,896 $2,967 $3,963 Interest factor in rent expense 1 2 5 7 8 22
Total fixed charges $ 482 $2,377 $2,251 $2,903 $2,975 $3,985 Preferred stock dividend requirements 19 20 — — 188 16
Total combined fixed charges and preferred stock dividends $ 501 $2,397 $2,251 $2,903 $3,163 $4,001
Ratio of earnings to combined fixed charges and preferred stock 4.30 3.15 3.09 2.51 1.38 1.16 Ratio (excluding interest expense on deposits): Earnings:
Income from continuing operations before income taxes $ 1,638 $5,035 $4,587 $4,330 $1,336 $ 582 Fixed charges 156 974 1,064 1,438 882 1,473 Equity in undistributed loss of unconsolidated subsidiaries 34 127 112 49 60 55
Earnings available for fixed charges, as adjusted $ 1,828 $6,136 $5,763 $5,817 $2,278 $ 2,110
Fixed charges: Interest expense on borrowings $ 155 $ 972 $1,059 $1,431 $ 874 $1,451 Interest factor in rent expense 1 2 5 7 8 22
Total fixed charges $ 156 $ 974 $1,064 $1,438 $ 882 $1,473 Preferred stock dividend requirements 19 20 — — 188 16
Total combined fixed charges and preferred stock dividends $ 175 $ 994 $1,064 $1,438 $1,070 $1,489
Ratio of earnings to combined fixed charges, excluding interest on deposits, andpreferred stock dividends 10.46 6.17 5.42 4.05 2.13 1.42
On February 27, 2009, we acquired Chevy Chase Bank, fsb. On February 17, 2012, we acquired ING Direct. On May 1, 2012, we closed the U.S. card acquisition. Each of these transactions was accountedfor under the acquisition method of accounting, and their respective results of operations are included in our results from each respective transaction date.Represents total interest expense reported in our consolidated statements of income, excluding interest on deposits of $326 million for the first quarter of 2013, and $1.4 billion, $1.2 billion, $1.5 billion,$2.1 billion, and $2.5 billion for the years ended December 31, 2012, 2011, 2010, 2009 and 2008, respectively.Preferred stock dividends represent pre-tax earnings that would be required to cover any preferred stock dividends requirements, computed using our effective tax rate, whenever there is an income taxprovision, for the relevant periods.
(1)
(1)
(3)
(2)
(3)
(1)
(2)
(3)

Exhibit 31.1
CERTIFICATION FOR QUARTERLY REPORT ON FORM 10-Q OF CAPITAL ONE FINANCIALCORPORATION AND CONSOLIDATED SUBSIDIARIES
I, Richard D. Fairbank, certify that:
1. I have reviewed this quarterly report on Form 10-Q of Capital One Financial Corporation;
2. Based on my knowledge, this report does not contain any untrue statement of a material fact or omit to state a material fact necessary to make thestatements made, in light of the circumstances under which such statements were made, not misleading with respect to the period covered by this report;
3. Based on my knowledge, the financial statements, and other financial information included in this report, fairly present in all material respects the financialcondition, results of operations and cash flows of the registrant as of, and for, the periods presented in this report;
4. The registrant’s other certifying officer and I are responsible for establishing and maintaining disclosure controls and procedures (as defined in ExchangeAct Rules 13a-15(e) and 15d-15(e)) and internal control over financial reporting (as defined in Exchange Act Rules 13a-15(f) and 15d-15(f)) for theregistrant and have:
(a) Designed such disclosure controls and procedures, or caused such disclosure controls and procedures to be designed under our supervision, to ensure
that material information relating to the registrant, including its consolidated subsidiaries, is made known to us by others within those entities,particularly during the period in which this report is being prepared;
(b) Designed such internal control over financial reporting, or caused such internal control over financial reporting to be designed under our supervision,
to provide reasonable assurance regarding the reliability of financial reporting and the preparation of financial statements for external purposes inaccordance with generally accepted accounting principles;
(c) Evaluated the effectiveness of the registrant’s disclosure controls and procedures and presented in this report our conclusions about the effectiveness
of the disclosure controls and procedures, as of the end of the period covered by this report based on such evaluation; and
(d) Disclosed in this report any change in the registrant’s internal control over financial reporting that occurred during the registrant’s most recent fiscal
quarter (the registrant’s fourth fiscal quarter in the case of an annual report) that has materially affected, or is reasonably likely to materially affect,the registrant’s internal control over financial reporting; and
5. The registrant’s other certifying officer and I have disclosed, based on our most recent evaluation of internal control over financial reporting, to theregistrant’s auditors and the audit committee of the registrant’s board of directors (or persons performing the equivalent functions):
(a) All significant deficiencies and material weaknesses in the design or operation of internal control over financial reporting which are reasonably likely
to adversely affect the registrant’s ability to record, process, summarize and report financial information; and
(b) Any fraud, whether or not material, that involves management or other employees who have a significant role in the registrant’s internal control over
financial reporting. Date: May 9, 2013 By: /s/ RICHARD D. FAIRBANK
Richard D. FairbankChairman of the Board, Chief Executive Officer and President
Exhibit 31.2
CERTIFICATION FOR QUARTERLY REPORT ON FORM 10-Q OF CAPITAL ONE FINANCIALCORPORATION AND CONSOLIDATED SUBSIDIARIES
I, Gary L. Perlin, certify that:
1. I have reviewed this quarterly report on Form 10-Q of Capital One Financial Corporation;
2. Based on my knowledge, this report does not contain any untrue statement of a material fact or omit to state a material fact necessary to make thestatements made, in light of the circumstances under which such statements were made, not misleading with respect to the period covered by this report;
3. Based on my knowledge, the financial statements, and other financial information included in this report, fairly present in all material respects the financialcondition, results of operations and cash flows of the registrant as of, and for, the periods presented in this report;
4. The registrant’s other certifying officer and I are responsible for establishing and maintaining disclosure controls and procedures (as defined in ExchangeAct Rules 13a-15(e) and 15d-15(e)) and internal control over financial reporting (as defined in Exchange Act Rules 13a-15(f) and 15d-15(f)) for theregistrant and have:
(a) Designed such disclosure controls and procedures, or caused such disclosure controls and procedures to be designed under our supervision, to ensure
that material information relating to the registrant, including its consolidated subsidiaries, is made known to us by others within those entities,particularly during the period in which this report is being prepared;
(b) Designed such internal control over financial reporting, or caused such internal control over financial reporting to be designed under our supervision,
to provide reasonable assurance regarding the reliability of financial reporting and the preparation of financial statements for external purposes inaccordance with generally accepted accounting principles;
(c) Evaluated the effectiveness of the registrant’s disclosure controls and procedures and presented in this report our conclusions about the effectiveness
of the disclosure controls and procedures, as of the end of the period covered by this report based on such evaluation; and
(d) Disclosed in this report any change in the registrant’s internal control over financial reporting that occurred during the registrant’s most recent fiscal
quarter (the registrant’s fourth fiscal quarter in the case of an annual report) that has materially affected, or is reasonably likely to materially affect,the registrant’s internal control over financial reporting; and
5. The registrant’s other certifying officer and I have disclosed, based on our most recent evaluation of internal control over financial reporting, to theregistrant’s auditors and the audit committee of the registrant’s board of directors (or persons performing the equivalent functions):
(a) All significant deficiencies and material weaknesses in the design or operation of internal control over financial reporting which are reasonably likely
to adversely affect the registrant’s ability to record, process, summarize and report financial information; and
(b) Any fraud, whether or not material, that involves management or other employees who have a significant role in the registrant’s internal control over
financial reporting. Date: May 9, 2013 By: /s/ GARY L. PERLIN
Gary L. PerlinChief Financial Officer

Exhibit 32.1
CertificationPursuant to Section 906 of the Sarbanes-Oxley Act of 2002
(Subsections (a) and (b) of Section 1350, Chapter 63 of Title 18, United States Code)
Pursuant to Section 906 of the Sarbanes-Oxley Act of 2002 (Subsections (a) and (b) of Section 1350, Chapter 63 of Title 18, United States Code), I, Richard D.Fairbank, Chairman of the Board, Chief Executive Officer and President of Capital One Financial Corporation, a Delaware corporation (“Capital One”), dohereby certify that:
1. The Quarterly Report on Form 10-Q for the period ended March 31, 2013 (the “Form 10-Q”) of Capital One fully complies with the requirements ofSection 13(a) or 15(d) of the Securities Exchange Act of 1934; and
2. The information contained in the Form 10-Q fairly presents, in all material respects, the financial condition and results of operations of Capital One. Date: May 9, 2013 By: /s/ RICHARD D. FAIRBANK
Richard D. FairbankChairman of the Board, Chief Executive Officer and President
A signed original of this written statement required by Section 906 has been provided to Capital One and will be retained by Capital One and furnished to theSecurities and Exchange Commission or its staff upon request.

Exhibit 32.2
CertificationPursuant to Section 906 of the Sarbanes-Oxley Act of 2002
(Subsections (a) and (b) of Section 1350, Chapter 63 of Title 18, United States Code)
Pursuant to Section 906 of the Sarbanes-Oxley Act of 2002 (Subsections (a) and (b) of Section 1350, Chapter 63 of Title 18, United States Code), I, Gary L.Perlin, Chief Financial Officer of Capital One Financial Corporation, a Delaware corporation (“Capital One”), do hereby certify that:
1. The Quarterly Report on Form 10-Q for the period ended March 31, 2013 (the “Form 10-Q”) of Capital One fully complies with the requirements ofSection 13(a) or 15(d) of the Securities Exchange Act of 1934; and
2. The information contained in the Form 10-Q fairly presents, in all material respects, the financial condition and results of operations of Capital One. Date: May 9, 2013 By: /S/ GARY L. PERLIN
Gary L. PerlinChief Financial Officer
A signed original of this written statement required by Section 906 has been provided to Capital One and will be retained by Capital One and furnished to theSecurities and Exchange Commission or its staff upon request.