Embed Size (px)
Citation preview

7/27/2019 capital markket theory2.pptx
http://slidepdf.com/reader/full/capital-markket-theory2pptx 1/20
CAPITAL MARKET THEORY
SUBMITTED TO: Dr. BHANU PARTAP SINGHSUBMITTED BY: VARUN

7/27/2019 capital markket theory2.pptx
http://slidepdf.com/reader/full/capital-markket-theory2pptx 2/20
Chapter Outline
Returns
Holding-Period Returns
Return StatisticsAverage Stock Returns and Risk-Free Returns
Risk Statistics
Summary and Conclusions
7/27/2019 capital markket theory2.pptx
http://slidepdf.com/reader/full/capital-markket-theory2pptx 3/20
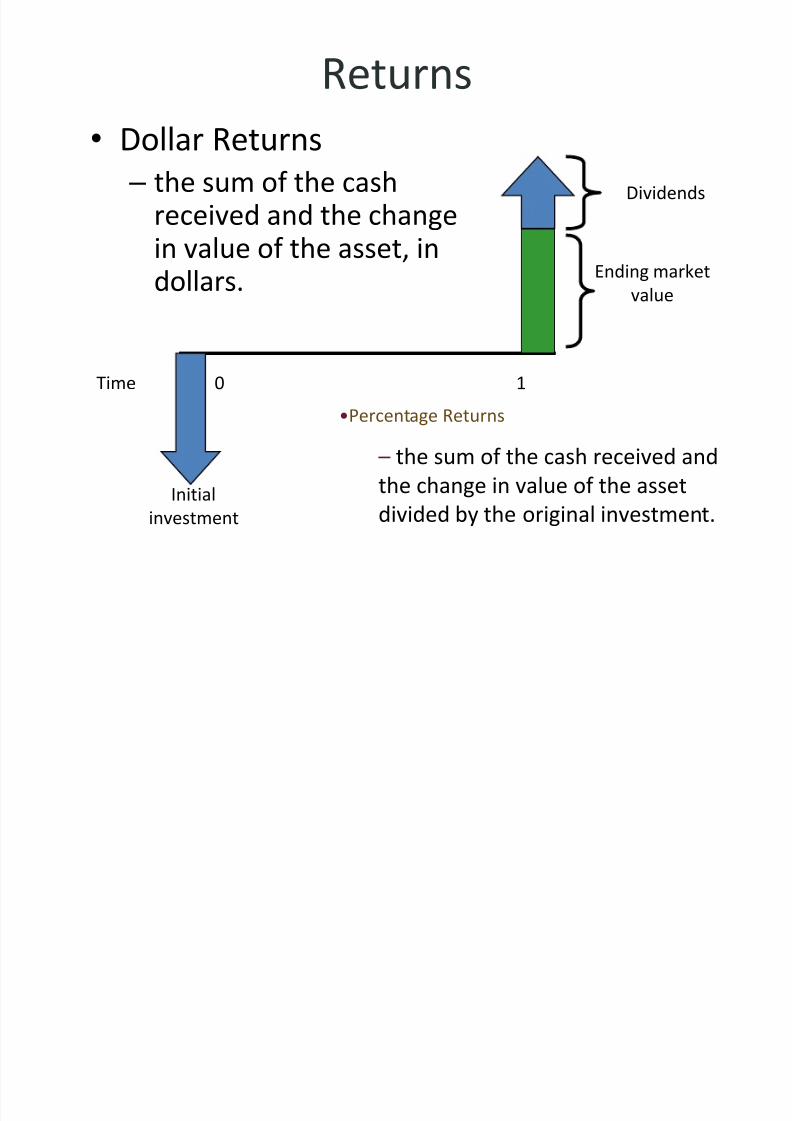
Returns
• Dollar Returns – the sum of the cash
received and the changein value of the asset, in
dollars.
Time 0 1
Initial
investment
Ending marketvalue
Dividends
•Percentage Returns
– the sum of the cash received and
the change in value of the asset
divided by the original investment.

7/27/2019 capital markket theory2.pptx
http://slidepdf.com/reader/full/capital-markket-theory2pptx 4/20
Returns
Dollar Return = Dividend + Change in Market Value
yieldgainscapitalyielddividend
uemarket val beginning
uemarket valinchangedividend
uemarket val beginning
returndollar return percentage

7/27/2019 capital markket theory2.pptx
http://slidepdf.com/reader/full/capital-markket-theory2pptx 5/20
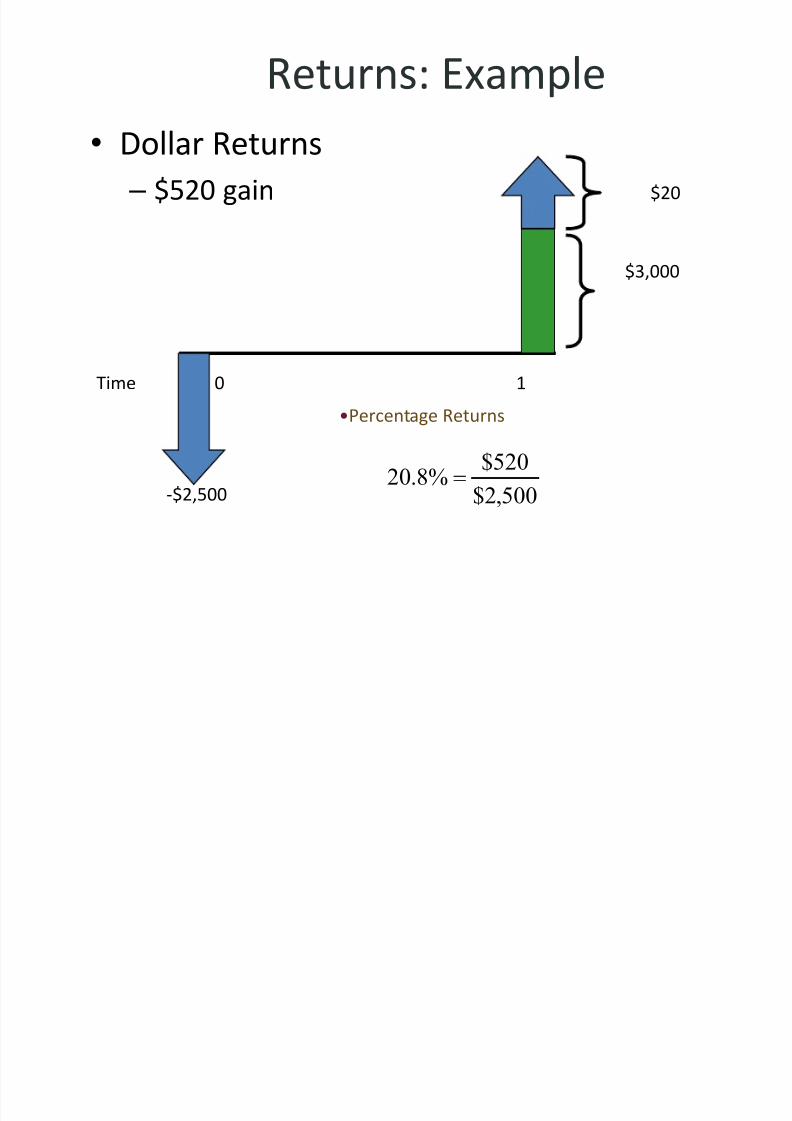
Returns: Example• Suppose you bought 100 shares of BCE one year
ago today at $25. Over the last year, you received
$20 in dividends (= 20 cents per share × 100
shares). At the end of the year, the stock sells for
$30. How did you do?• Quite well. You invested $25 × 100 = $2,500. At the
end of the year, you have stock worth $3,000 and
cash dividends of $20. Your dollar gain was $520 =
$20 + ($3,000 – $2,500).
• Your percentage gain for the year is500,2$
520$%8.20
7/27/2019 capital markket theory2.pptx
http://slidepdf.com/reader/full/capital-markket-theory2pptx 6/20
Returns: Example
• Dollar Returns – $520 gain
Time 0 1
-$2,500
$3,000
$20
•Percentage Returns
500,2$
520$%8.20

7/27/2019 capital markket theory2.pptx
http://slidepdf.com/reader/full/capital-markket-theory2pptx 7/20
Holding Period Returns
• The holding period return is the return that an
investor would get when holding an investment over
a period of n years, when the return during year i is
given as r i :
1)1()1()1(
return periodholding
21
nr r r

7/27/2019 capital markket theory2.pptx
http://slidepdf.com/reader/full/capital-markket-theory2pptx 8/20
Holding Period Return: Example
• Suppose your investment provides the followingreturns over a four-year period:
Year Retur n
1 10%
2 -5%
3 20%
4 15% %21.444421.
1)15.1()20.1()95(.)10.1(1)1()1()1()1(
return periodholdingYour
4321
r r r r

7/27/2019 capital markket theory2.pptx
http://slidepdf.com/reader/full/capital-markket-theory2pptx 9/20
Holding Period Return: Example
An investor who held this investment would haveactually realized an annual return of 9.58%:
Year Retur n
1 10%
2 -5%
3 20%
4 15% %58.9095844.
1)15.1()20.1()95(.)10.1()1()1()1()1()1(
returnaverageGeometric
4
4321
4
g
g
r r r r r r
• So, our investor made 9.58% on his money for fouryears, realizing a holding period return of 44.21%
4)095844.1(4421.1

7/27/2019 capital markket theory2.pptx
http://slidepdf.com/reader/full/capital-markket-theory2pptx 10/20
Holding Period Return: Example
• Note that the geometric average is not the samething as the arithmetic average:
Year Retur n
1 10%
2 -5%
3 20%
4 15%
%10
4
%15%20%5%10
4return averageArithmetic 4321
r r r r

7/27/2019 capital markket theory2.pptx
http://slidepdf.com/reader/full/capital-markket-theory2pptx 11/20
Return Statistics
• The history of capital market returns can besummarized by describing the – average return
– the standard deviation of those returns
– the frequency distribution of the returns.
T R R R T )( 1
1
)()()( 222
21
T
R R R R R RVARSD T

7/27/2019 capital markket theory2.pptx
http://slidepdf.com/reader/full/capital-markket-theory2pptx 12/20
Average Stock Returns and Risk-Free Returns
The Risk Premium is the additional return (over andabove the risk-free rate) resulting from bearing risk.
One of the most significant observations of stockand bond market data is this long-run excess of
security return over the risk-free return.The average excess return from Canadian large-companycommon stocks for the period 1948 through 2000 was
6.89% = 13.09% – 6.20%
The average excess return from Canadian long-termbonds for the period 1948 through 2000 was
1.58% = 7.78% – 6.20%

7/27/2019 capital markket theory2.pptx
http://slidepdf.com/reader/full/capital-markket-theory2pptx 13/20
Risk Premia
• Suppose that The National Post announced thatthe current rate for one-year Treasury bills is 5%.
• What is the expected return on the market of
Canadian large-company stocks?• Recall that the average excess return from
Canadian large-company common stocks for theperiod 1948 through 2000 was 6.89%
• Given a risk-free rate of 5%, we have an expectedreturn on the market of Canadian large-companycommon stocks of 11.89% = 6.89% + 5%

7/27/2019 capital markket theory2.pptx
http://slidepdf.com/reader/full/capital-markket-theory2pptx 14/20
Rates of Return 1948-2000
-30
-20
-10
0
10
20
30
40
50
60
1945 1955 1965 1975 1985 1995
Common Stocks
Long Bonds
T-Bills

7/27/2019 capital markket theory2.pptx
http://slidepdf.com/reader/full/capital-markket-theory2pptx 15/20
Risk Premiums
• Rate of return on T-bills is essentially risk-free.
• Investing in stocks is risky, but there are
compensations.
• The difference between the return on T-bills andstocks is the risk premium for investing in stocks.
• An old saying on Bay Street is “You can either sleep
well or eat well.”

7/27/2019 capital markket theory2.pptx
http://slidepdf.com/reader/full/capital-markket-theory2pptx 16/20
Risk Statistics
• There is no universally agreed-upon definition
of risk.
• The measures of risk that we discuss are
variance and standard deviation.
– The standard deviation is the standard statistical
measure of the spread of a sample, and it will be
the measure we use most of this time. – Its interpretation is facilitated by a discussion of
the normal distribution.

7/27/2019 capital markket theory2.pptx
http://slidepdf.com/reader/full/capital-markket-theory2pptx 17/20
Normal Distribution
• A large enough sample drawn from a normal
distribution looks like a bell-shaped curve.
– 3
– 36.35%
– 2
– 19.87%
– 1
– 3.39%
0
13.09%
+ 1
29.57%
+ 2
46.05%
+ 3
62.53%
Probability
Return on
large companycommon
stocks
68%
95%
> 99%
The probability that a yearly return will fall within 16.48-percent of the mean of
13.09-percent will be approximately 2/3.

7/27/2019 capital markket theory2.pptx
http://slidepdf.com/reader/full/capital-markket-theory2pptx 18/20
Normal Distribution
• The 16.48-percent standard deviation we
found for stock returns from 1948 through
2000 can now be interpreted in the following
way: if stock returns are approximatelynormally distributed, the probability that a
yearly return will fall within 16.48-percent of
the mean of 13.09-percent will beapproximately 2/3.

7/27/2019 capital markket theory2.pptx
http://slidepdf.com/reader/full/capital-markket-theory2pptx 19/20
Normal DistributionS&P 500 Return Frequencies
0
2
5
11
16
9
1212
1
2
11
00
2
4
6
8
10
12
14
16
62%52%42%32%22%12%2%-8%-18%-28%-38%-48%-58%
Annual returns
R e t u r n f r e q u e n c y
Normal
approximation
Mean = 12.8%
Std. Dev. = 20.4%
Source: © Stocks , Bon ds, Bi l ls, and Inf lat ion 2000 Yearbook™, Ibbotson Associates, Inc., Chicago (annually updates work by
Roger G. Ibbotson and Rex A. Sinquefield). All rights reserved.

7/27/2019 capital markket theory2.pptx
http://slidepdf.com/reader/full/capital-markket-theory2pptx 20/20
![[MS-PPTX]: PowerPoint (.pptx) Extensions to the Office ...MS-PPTX].pdf · [MS-PPTX]: PowerPoint (.pptx) Extensions to the Office Open XML File Format ... PowerPoint (.pptx) Extensions](https://img.dokumen.tips/doc/110x75/5ae7f6357f8b9a6d4f8ed3a1/ms-pptx-powerpoint-pptx-extensions-to-the-office-ms-pptxpdfms-pptx.jpg)


![Fundamentos de investigación1.pptx [Autoguardado].pptx](https://img.dokumen.tips/doc/110x75/56d6bd6c1a28ab30168deddb/fundamentos-de-investigacion1pptx-autoguardadopptx.jpg)