Embed Size (px)
Citation preview

Capital Markets Presentation16 February 2018
Kitron Group

2
DisclaimerThis presentation contains certain forward-looking information and statements. Such forward-looking information and statements are based on the current, estimates and projections of the Company or assumptions based on information currently available to the Company. Such forward-looking information and statements reflect current views with respect to future events and are subject to risks, uncertainties and assumptions. The Company cannot give assurance to the correctness of such information and statements. These forward-looking information and statements can generally be identified by the fact that they do not relate only to historical or current facts. Forward-looking statements sometimes use terminology such as "targets", "believes", "expects", "aims", "assumes", "intends", "plans", "seeks", "will", "may", "anticipates", "would", "could", "continues", "estimate", "milestone" or other words of similar meaning and similar expressions or the negatives thereof.
By their nature, forward-looking information and statements involve known and unknown risks, uncertainties and other important factors that could cause the actual results, performance or achievements of the Company to differ materially from any future results, performance or achievements that may be expressed or implied by the forward-looking information and statements in this presentation. Should one or more of these risks or uncertainties materialize, or should any underlying assumptions prove to be incorrect, the Company's actual financial condition or results of operations could differ materially from that or those described herein as anticipated, believed, estimated or expected.
Any forward-looking information or statements in this presentation speak only as at the date of this presentation. Except as required by the Oslo Stock Exchange rules or applicable law, the Company does not intend, and expressly disclaims any obligation or undertaking, to publicly update, correct or revise any of the information included in this presentation, including forward-looking information and statements, whether to reflect changes in the Company's expectations with regard thereto or as a result of new information, future events, changes in conditions, currency development or circumstances or otherwise on which any statement in this presentation is based.
Given the aforementioned uncertainties, prospective investors are cautioned not to place undue reliance on any of these forward-looking statements.

3
Capital Markets
Presentation
Strategy and MarketsOperationsFinancialsSummary
Speakers
Peter NilssonChief Executive Officer2018

4
The essence of Kitron
Kitron is a leading Electronics Manufacturing Services company in Scandinavia, delivering improved flexibility, cost efficiency, and innovation power throughout the value chain.
5
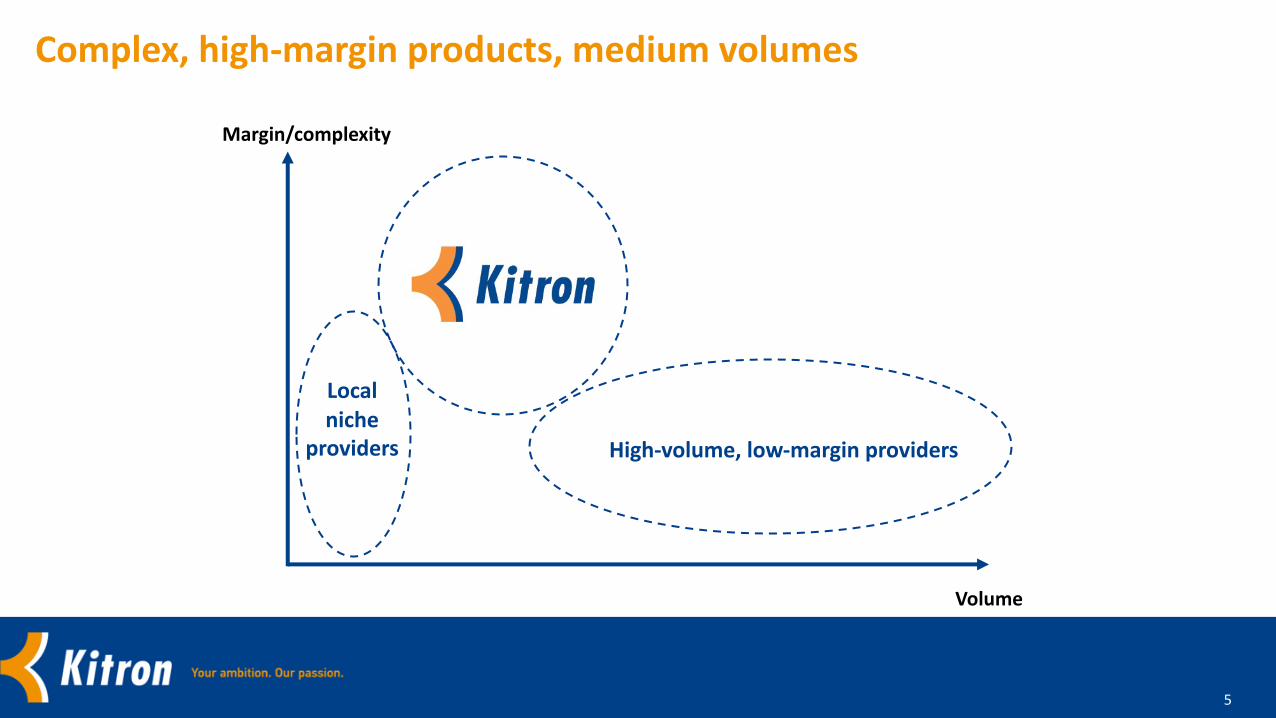
Complex, high-margin products, medium volumes
Margin/complexity
Volume
Local niche
providers High-volume, low-margin providers

6
Customers and market sectors
Defence/Aerospace
Energy/Telecoms
Medical devices IndustryOffshore/
Marine
§ Relevant photo/graphic, illustrating ARC and/or Work
Station
7
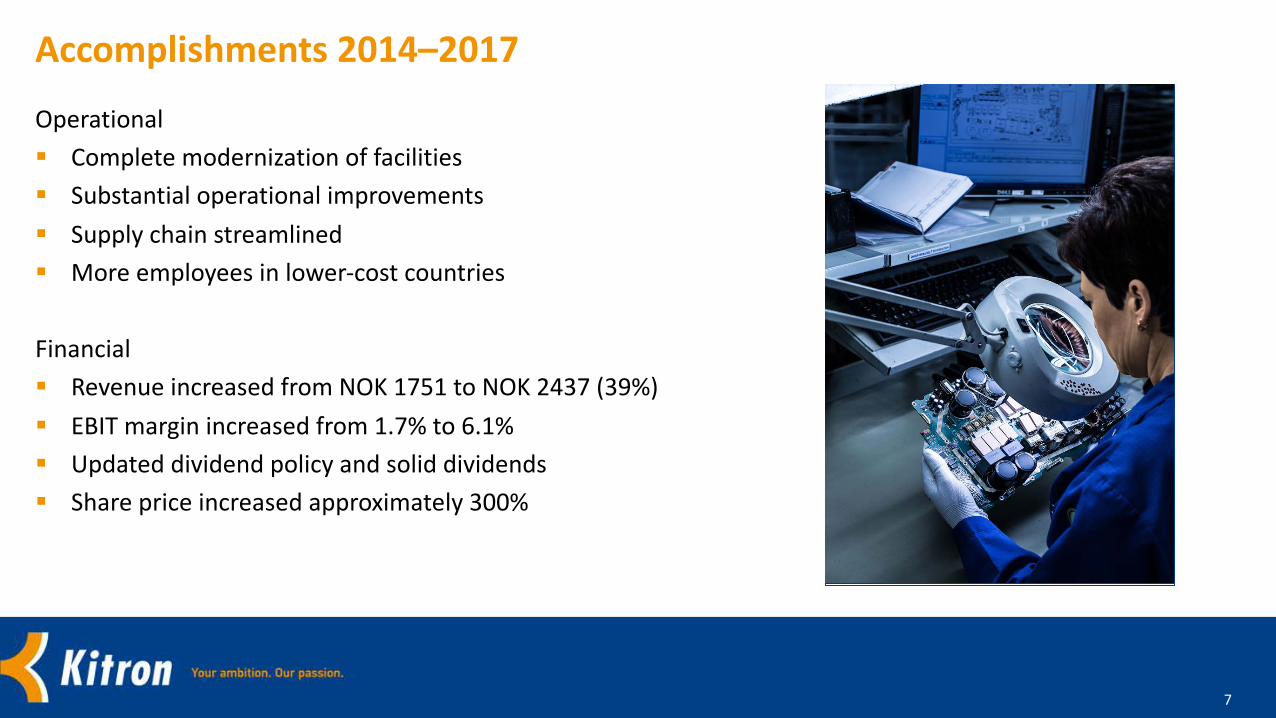
Accomplishments 2014–2017Operational§ Complete modernization of facilities§ Substantial operational improvements§ Supply chain streamlined§ More employees in lower-cost countries
Financial§ Revenue increased from NOK 1751 to NOK 2437 (39%)§ EBIT margin increased from 1.7% to 6.1%§ Updated dividend policy and solid dividends§ Share price increased approximately 300%
Photo illustrating opening of new facility, etc.
8
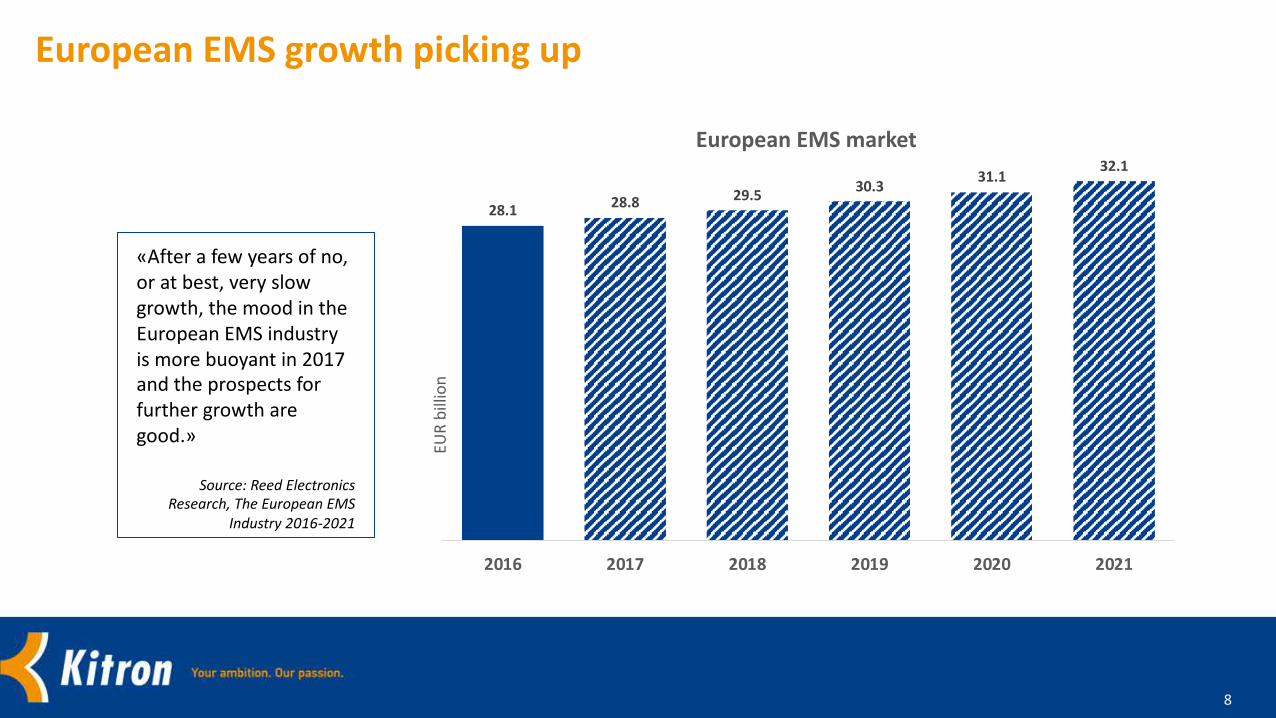
European EMS growth picking up
«After a few years of no, or at best, very slow growth, the mood in the European EMS industry is more buoyant in 2017 and the prospects for further growth are good.»
Source: Reed Electronics Research, The European EMS
Industry 2016-2021
28.1 28.8 29.5 30.3 31.1 32.1
2016 2017 2018 2019 2020 2021
EUR
billi
on
European EMS market

9
Kitron’s sector outlookSector Market Development Sales outlookKey products
§ Protection and control systems for power
transmission
§ Smart grid/automatic meter reading
systems
§ Power system relays for energy
transmission and distribution
§ Power transmission and
smart grid systems are
important growth drivers
§ Share of Kitron’s revenue
expected to be little
changed in 2020
ENERGY/
TELECOMS18%
Expected share of2020 revenue
§ European EMS revenue EUR 5.8 billion
in 2017
§ Expected European growth rate 2.8%
10
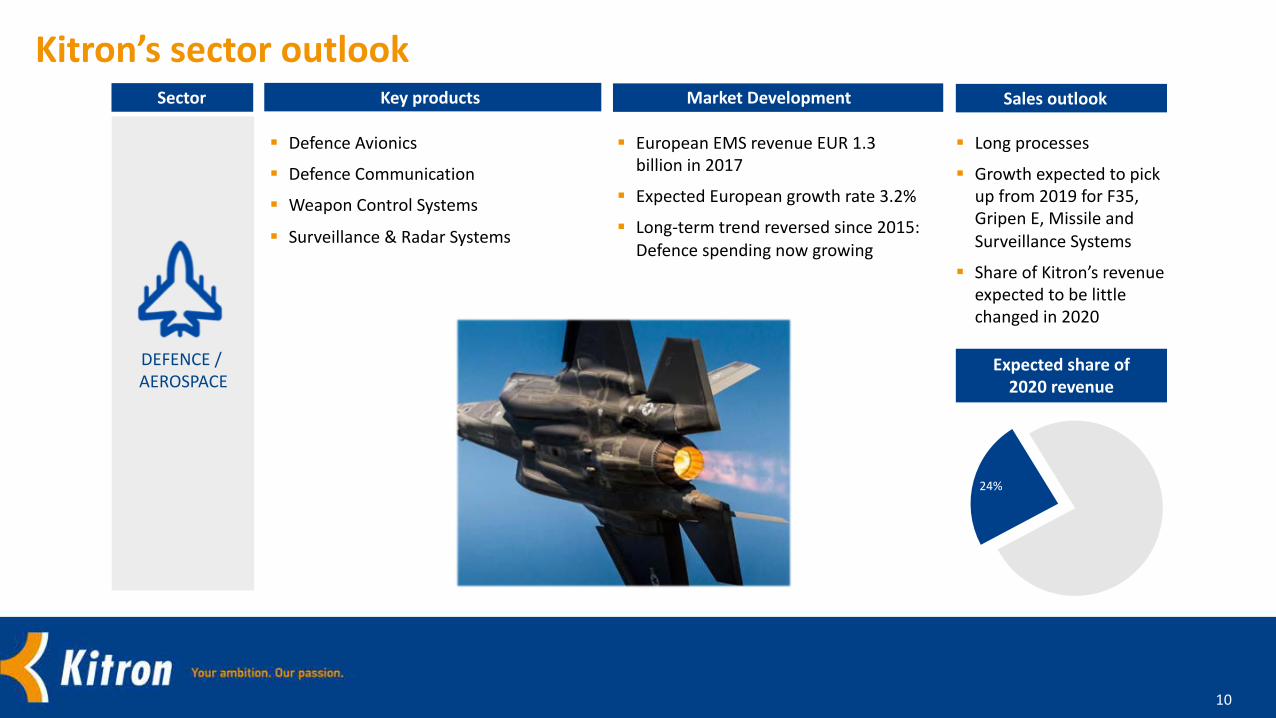
Sector Sales outlook
DEFENCE / AEROSPACE
§ Defence Avionics
§ Defence Communication
§ Weapon Control Systems
§ Surveillance & Radar Systems
§ Long processes
§ Growth expected to pick up from 2019 for F35, Gripen E, Missile and Surveillance Systems
§ Share of Kitron’s revenue expected to be little changed in 2020
Kitron’s sector outlook
24%
Expected share of2020 revenue
Market DevelopmentKey products
§ European EMS revenue EUR 1.3 billion in 2017
§ Expected European growth rate 3.2%
§ Long-term trend reversed since 2015: Defence spending now growing
11
§ Defence Avionics
§ Defence
Communication
§ Weapon Control
Systems & Ammunition
§ Growth expected in-line
with market
development around 3%
per year
§ Expected to be slightly
lower share of revenue
in 2020
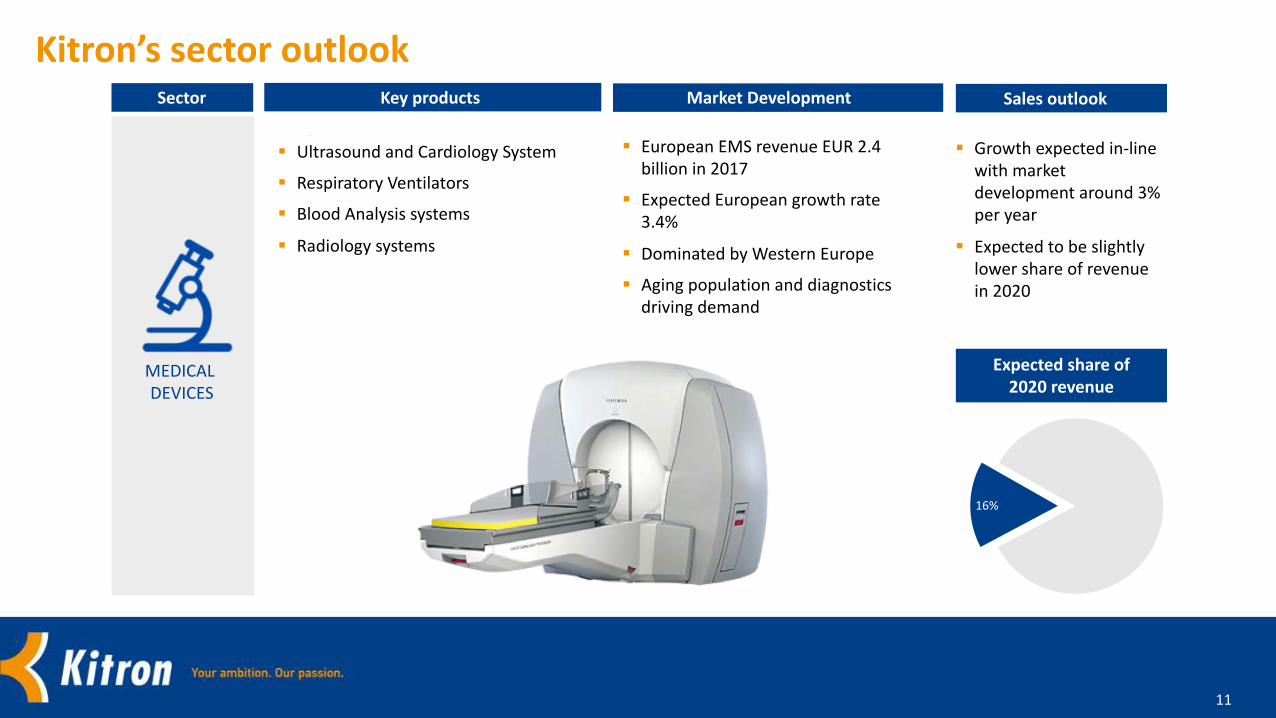
MEDICAL
DEVICES
§ Ultrasound and Cardiology System
§ Respiratory Ventilators
§ Blood Analysis systems
§ Radiology systems
Sector Sales outlook
Kitron’s sector outlook
16%
Expected share of2020 revenue
Market DevelopmentKey products
§ European EMS revenue EUR 2.4
billion in 2017
§ Expected European growth rate
3.4%
§ Dominated by Western Europe
§ Aging population and diagnostics
driving demand
12
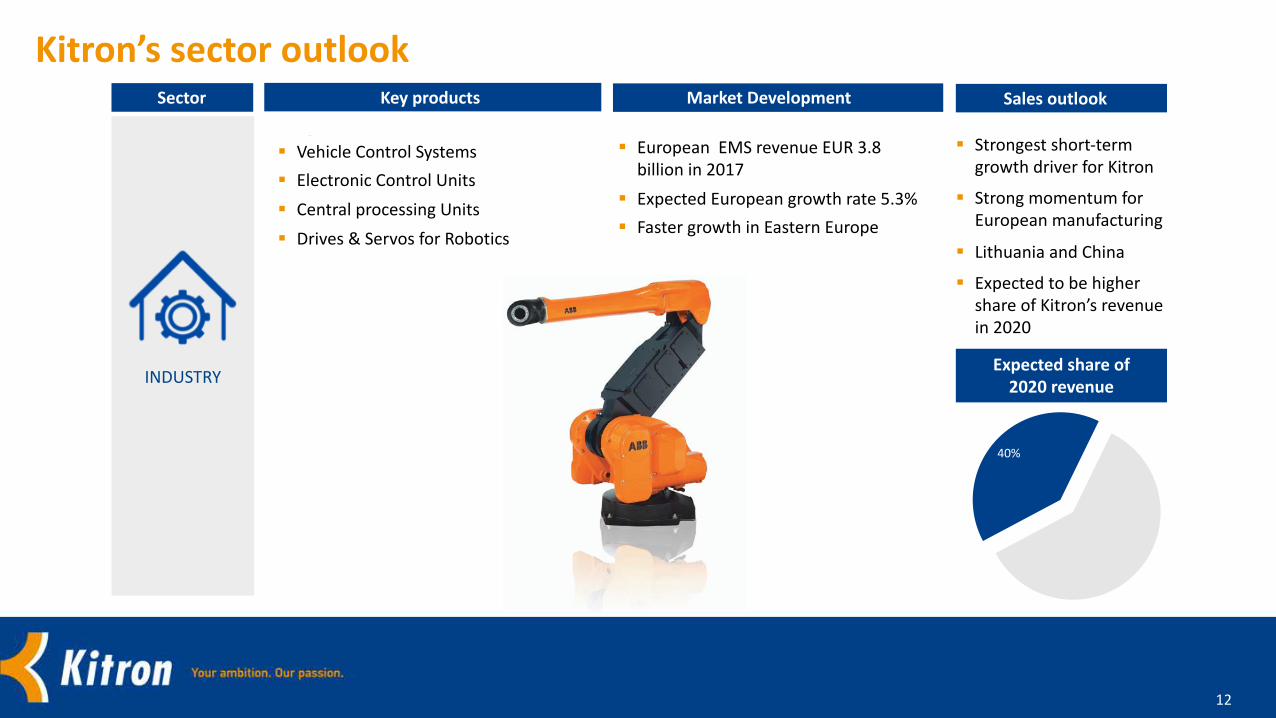
§ Defence Avionics
§ DefenceCommunication
§ Weapon ControlSystems & Ammunition
§ Strongest short-term growth driver for Kitron
§ Strong momentum for European manufacturing
§ Lithuania and China
§ Expected to be higher share of Kitron’s revenue in 2020
§ Vehicle Control Systems§ Electronic Control Units § Central processing Units§ Drives & Servos for Robotics
Sector Sales outlook
Kitron’s sector outlook
INDUSTRY
40%
Expected share of2020 revenue
Market DevelopmentKey products
§ European EMS revenue EUR 3.8 billion in 2017
§ Expected European growth rate 5.3%§ Faster growth in Eastern Europe
13
Sector Sales outlook
§ Upside potential from very low level
§ Kitron in talks with potential new customers
§ But no material improvement budgeted
§ Subsea control systems§ Seismic sensors and equipment§ Wireless sensors
§ Surveillance systems
OFFSHORE /MARINE
Kitron’s sector outlook
2%
Expected share of2020 revenue
Market DevelopmentKey products
§ Highly dependent on Norwegian offshore market
§ Industry analysts forecast growing investments in 2018
14
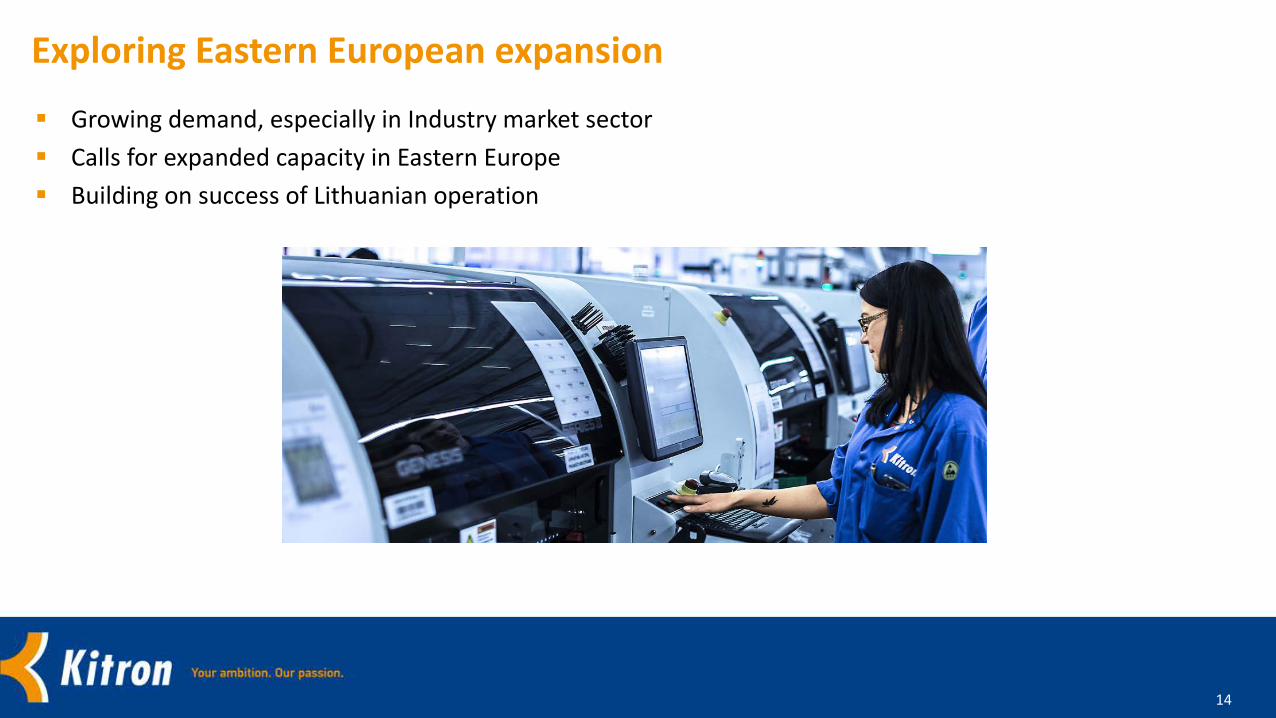
Exploring Eastern European expansion§ Growing demand, especially in Industry market sector§ Calls for expanded capacity in Eastern Europe§ Building on success of Lithuanian operation

15
Capital Markets
Presentation
Strategy and MarketsOperationsFinancialsSummary
Speakers
Israel Losada SalvadorCOO & Sales Director2018

16
Overview of operations§ Modern highly competitive facilities globally§ Investments in new technology§ Increasingly offering advanced services

17
3 main topics
Innovation Automation Operational excellence
Photo Photo Photo

18
Innovation
§ Relevant photo/graphic, illustrating ARC and/or Work Station
§ Augmented reality: Combines live view and computer graphics in work instructions§ Reduce quality defects§ Support traceability§ Distance support and training
§ Augmented Reality Creator:Kitron has developed application for creating augmented reality work instructions§ Live in 2018
§ Augmented Reality Work Station:Taking advantaged of ARC instructions§ Can be used by any operator from day one
§ Kitron explores ways to commercialize the technology and has a patent pending.
§ Relevant photo/graphic, illustrating ARC and/or Work Station
19
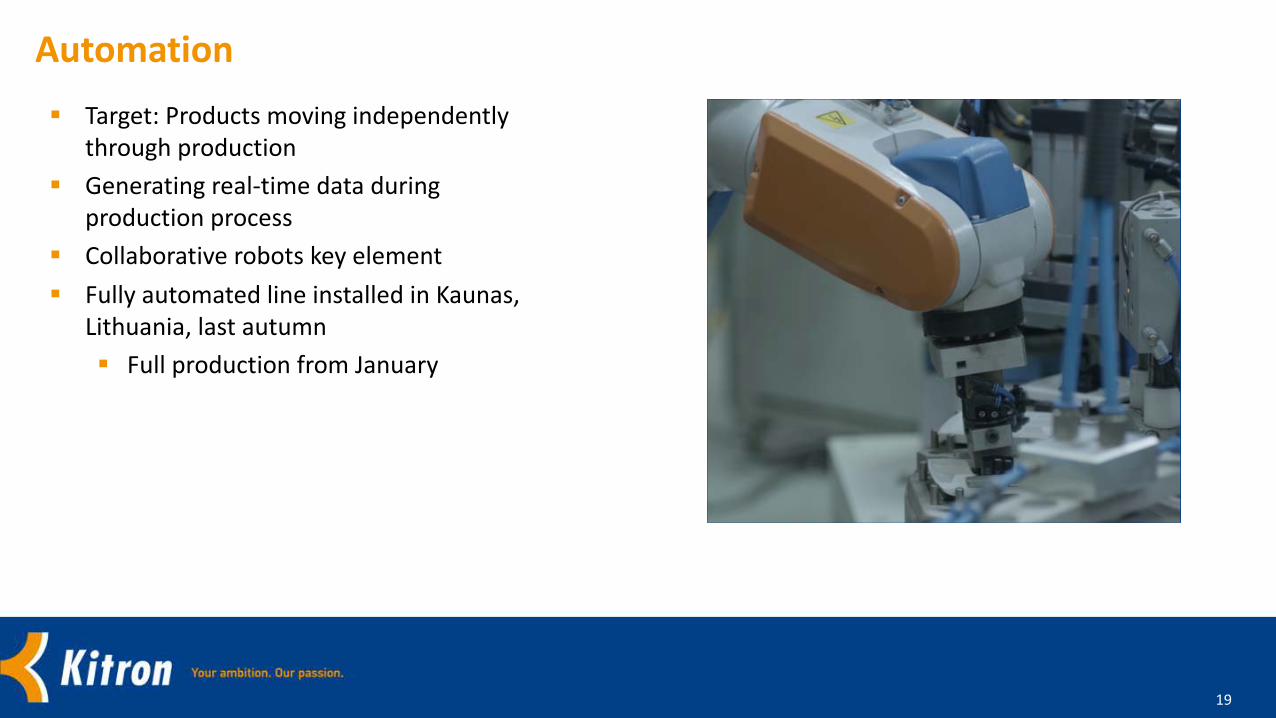
Automation§ Target: Products moving independently
through production§ Generating real-time data during
production process§ Collaborative robots key element§ Fully automated line installed in Kaunas,
Lithuania, last autumn§ Full production from January
20
Operational excellence
§ Relevant photo
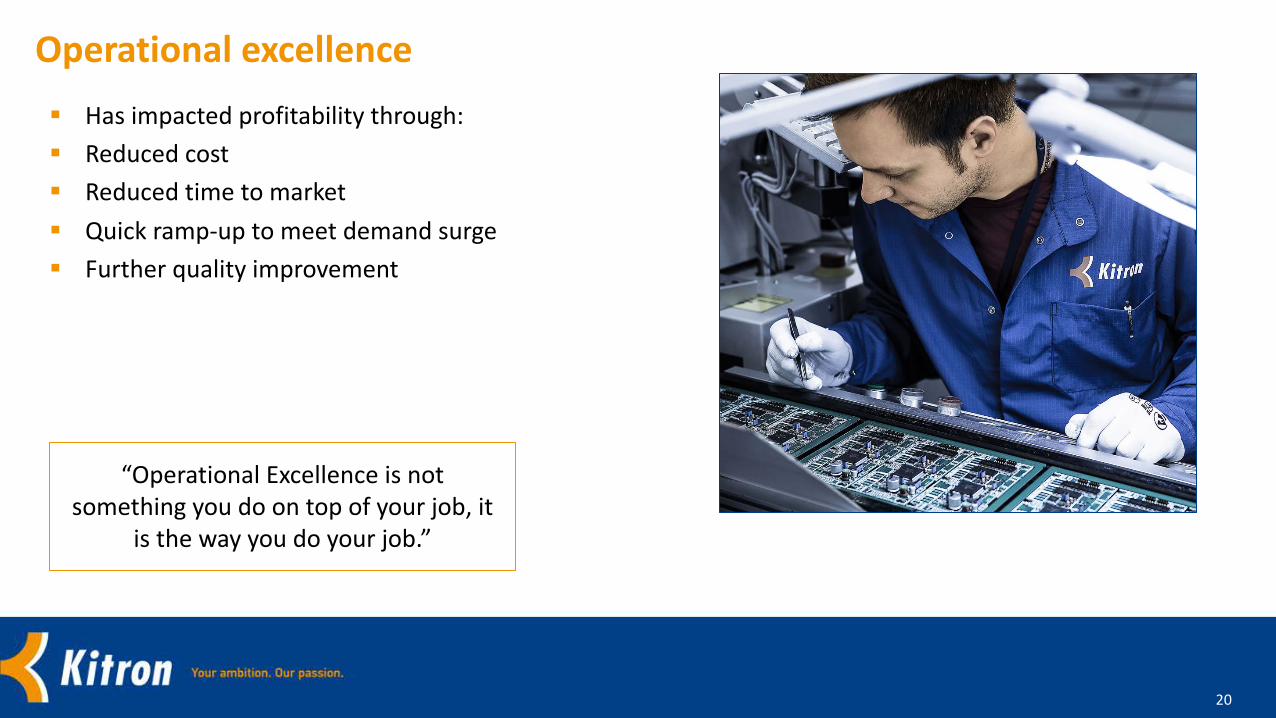
§ Has impacted profitability through:
§ Reduced cost
§ Reduced time to market
§ Quick ramp-up to meet demand surge
§ Further quality improvement
“Operational Excellence is not something you do on top of your job, it
is the way you do your job.”

21
Capital Markets
Presentation
Strategy and MarketsOperationsFinancialsSummary
Speakers
Cathrin NylanderCFO2018
22
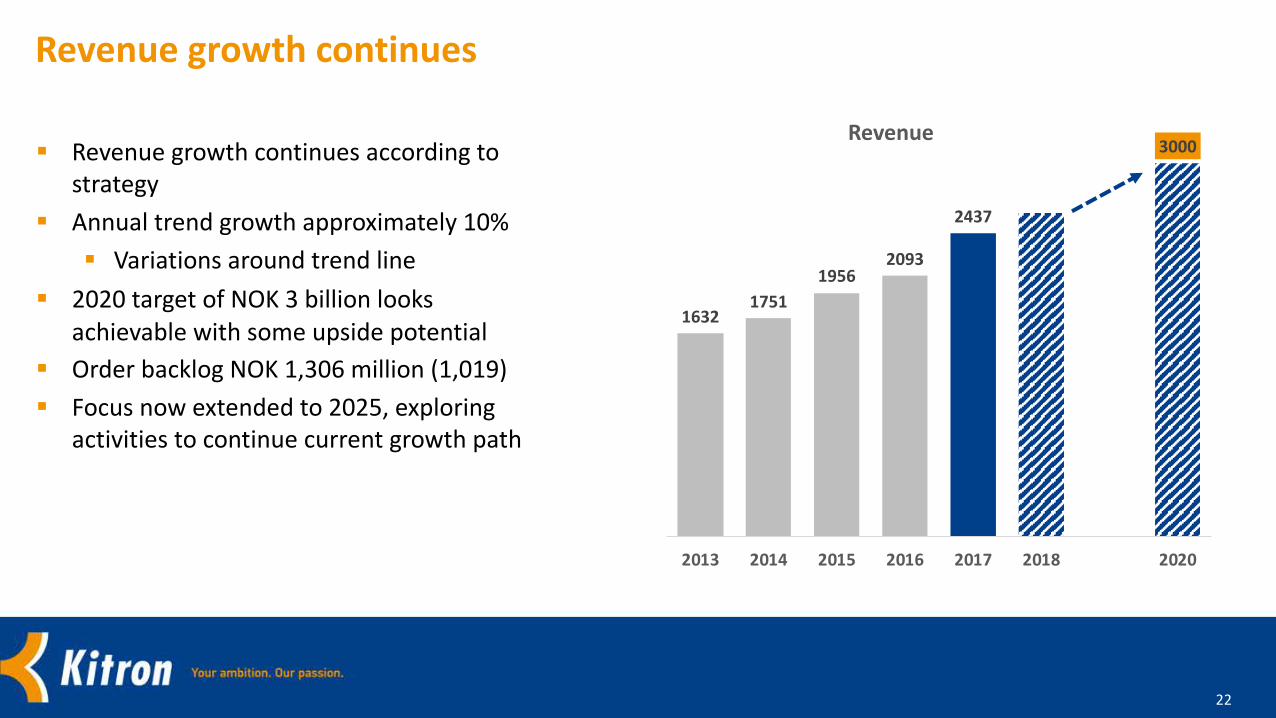
Revenue growth continues
16321751
19562093
2437
3000
2013 2014 2015 2016 2017 2018 2020
Revenue§ Revenue growth continues according to
strategy§ Annual trend growth approximately 10%
§ Variations around trend line§ 2020 target of NOK 3 billion looks
achievable with some upside potential§ Order backlog NOK 1,306 million (1,019)§ Focus now extended to 2025, exploring
activities to continue current growth path

23
On track for 7% EBIT margin in 2020
1.5 % 1.7 %
5.3 %5.6 %
6.1 %
7.0 %
2013 2014 2015 2016 2017 2018 2020
EBIT margin§ Operational improvements continued in 2017§ Expect 6.1-6.5% EBIT margin in 2018§ Maintain 2020 target of 7% EBIT margin§ Key elements:
§ Revenue growth§ Improved operational efficiency§ Growth of life cycle services§ Larger share of cost in lower cost countries
42%
58%
2013 Low costcountries
Employees
70%
30%2017

24
Improved capital efficiency
522 566 508 512 486
32% 32%
26% 24%20%
2013 2014 2015 2016 2017 2018 2020
NOK
mill
ion
Net working capital
Net working capital NWC as % of revenue
§ Lower NWC as % of revenue due to inventory efficiency and improved payment terms
§ Target of <20% achieved in 2017
100106
9079
6150
2013 2014 2015 2016 2017 2018 2020
Cash conversion cycle
§ Cash conversion cycle is a key metric§ Target 50 days
Cash Conversion Cycle (CCC) = Days inventory outstanding + days sales outstanding - days payable outstanding.CCC is calculated as a 3 months rolling average

25
Improving return on capital
5%8%
18% 19%
23%25%
2013 2014 2015 2016 2017 2020
Return on operating capital§ Increase in return on operating capital due to higher EBIT and disciplined use of capital
§ Improvement expected to continue:§ Higher profit§ Capital efficiency
§ Long-term target 25%
• Return On Operating Capital (ROOC) = EBIT / (Intangible and tangible fixed assets + Inventory + Trade receivables – Trade payables)
• ROOC is calculated based on 3 months rolling average
26
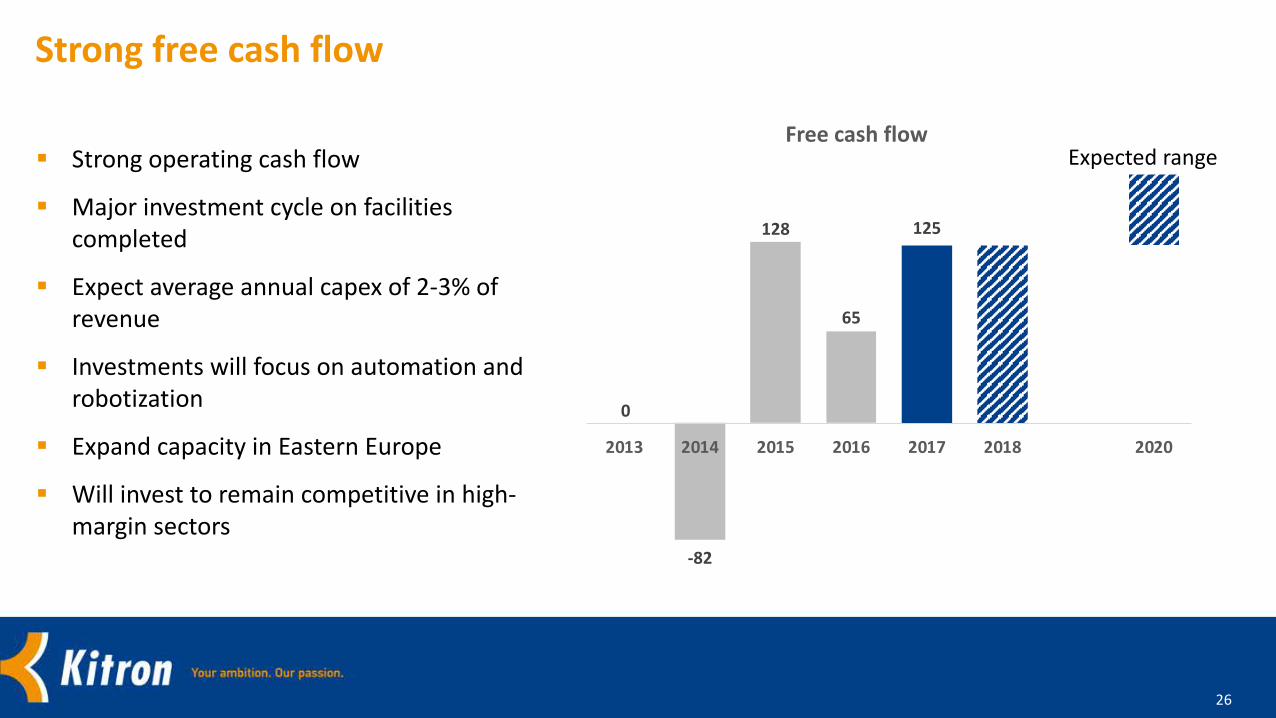
Strong free cash flow
0
-82
128
65
125
2013 2014 2015 2016 2017 2018 2020
Free cash flowExpected range§ Strong operating cash flow
§ Major investment cycle on facilities completed
§ Expect average annual capex of 2-3% of revenue
§ Investments will focus on automation and robotization
§ Expand capacity in Eastern Europe
§ Will invest to remain competitive in high-margin sectors
27
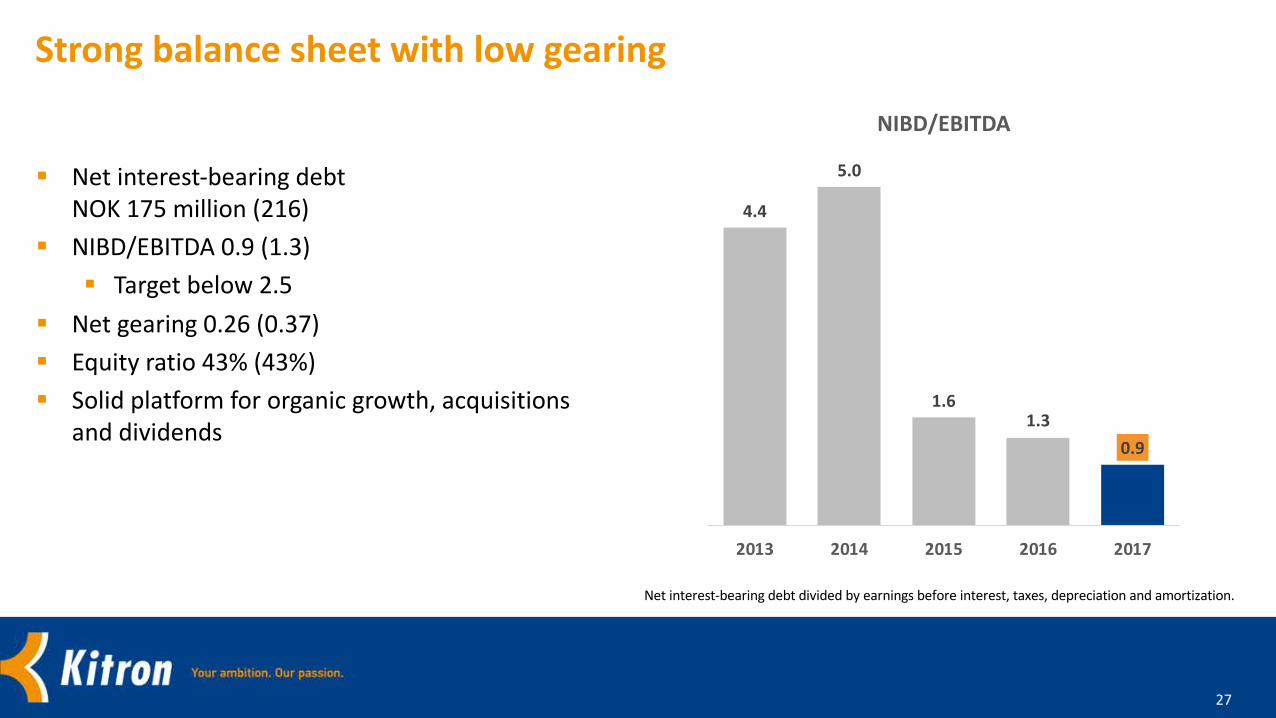
Strong balance sheet with low gearing
Net interest-bearing debt divided by earnings before interest, taxes, depreciation and amortization.
4.4
5.0
1.61.3
0.9
2013 2014 2015 2016 2017
NIBD/EBITDA
§ Net interest-bearing debtNOK 175 million (216)
§ NIBD/EBITDA 0.9 (1.3)
§ Target below 2.5
§ Net gearing 0.26 (0.37)
§ Equity ratio 43% (43%)
§ Solid platform for organic growth, acquisitions and dividends
28
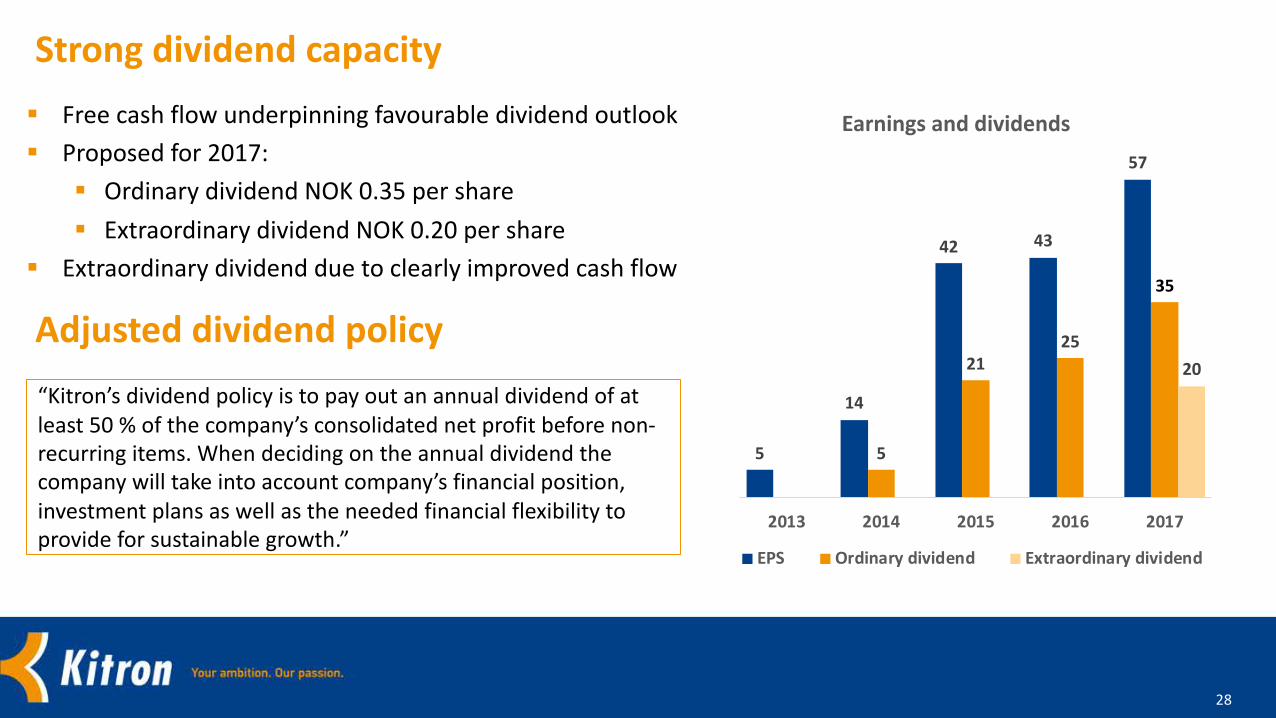
Strong dividend capacity
“Kitron’s dividend policy is to pay out an annual dividend of at least 50 % of the company’s consolidated net profit before non-recurring items. When deciding on the annual dividend the company will take into account company’s financial position, investment plans as well as the needed financial flexibility to provide for sustainable growth.”
5
14
42 43
57
5
2125
35
20
2013 2014 2015 2016 2017
Earnings and dividends
EPS Ordinary dividend Extraordinary dividend
§ Free cash flow underpinning favourable dividend outlook§ Proposed for 2017:
§ Ordinary dividend NOK 0.35 per share§ Extraordinary dividend NOK 0.20 per share
§ Extraordinary dividend due to clearly improved cash flow
Adjusted dividend policy

29
Capital Markets
Presentation
Strategy and MarketsOperationsFinancialsSummary
Speakers
Peter NilssonChief Executive Officer2018

30
Summary
§ On track towards 2020 strategic ambitions§ Much stronger operational platform§ Investing in robots and automation§ Innovations add upside to growth and margins§ Exploring Eastern European expansion
31
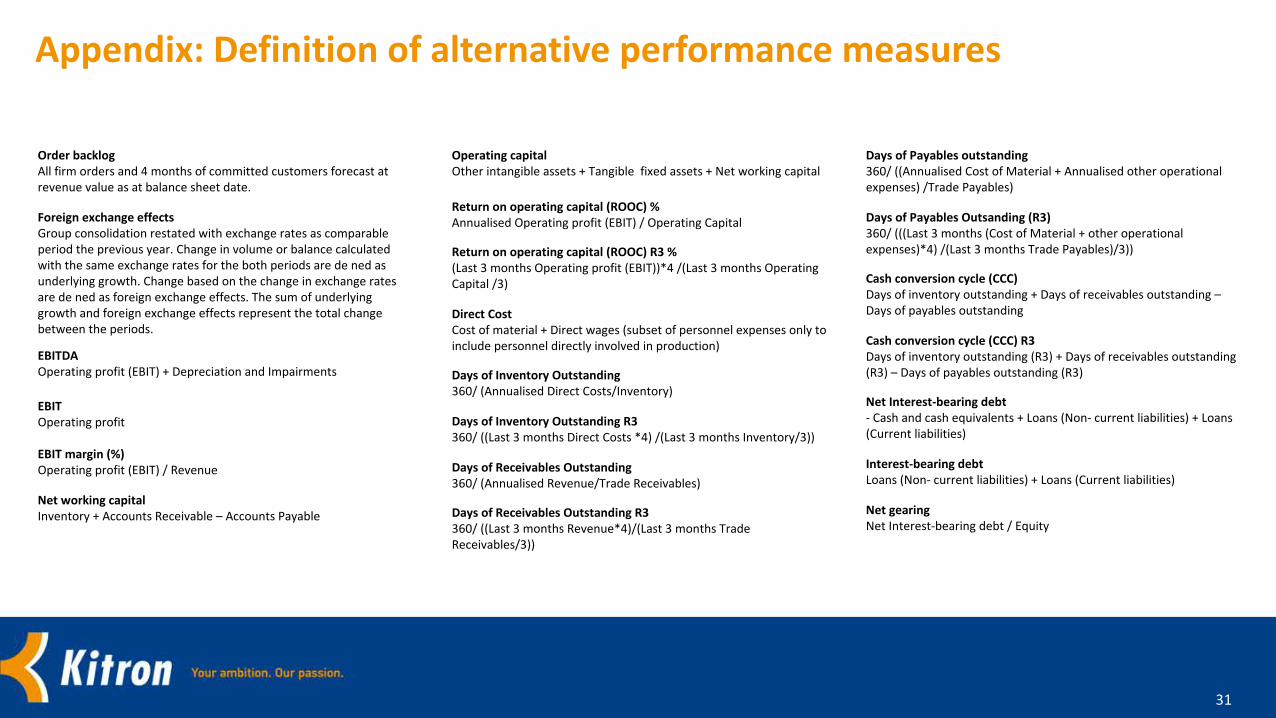
Appendix: Definition of alternative performance measures
Order backlogAll firm orders and 4 months of committed customers forecast at revenue value as at balance sheet date.
Foreign exchange effectsGroup consolidation restated with exchange rates as comparable period the previous year. Change in volume or balance calculated with the same exchange rates for the both periods are de ned as underlying growth. Change based on the change in exchange rates are de ned as foreign exchange effects. The sum of underlying growth and foreign exchange effects represent the total change between the periods.
EBITDAOperating profit (EBIT) + Depreciation and Impairments
EBIT Operating profit
EBIT margin (%)Operating profit (EBIT) / Revenue
Net working capitalInventory + Accounts Receivable – Accounts Payable
Operating capital Other intangible assets + Tangible fixed assets + Net working capital
Return on operating capital (ROOC) %Annualised Operating profit (EBIT) / Operating Capital
Return on operating capital (ROOC) R3 %(Last 3 months Operating profit (EBIT))*4 /(Last 3 months Operating Capital /3)
Direct CostCost of material + Direct wages (subset of personnel expenses only to include personnel directly involved in production)
Days of Inventory Outstanding360/ (Annualised Direct Costs/Inventory)
Days of Inventory Outstanding R3360/ ((Last 3 months Direct Costs *4) /(Last 3 months Inventory/3))
Days of Receivables Outstanding360/ (Annualised Revenue/Trade Receivables)
Days of Receivables Outstanding R3360/ ((Last 3 months Revenue*4)/(Last 3 months Trade Receivables/3))
Days of Payables outstanding360/ ((Annualised Cost of Material + Annualised other operational expenses) /Trade Payables)
Days of Payables Outsanding (R3)360/ (((Last 3 months (Cost of Material + other operational expenses)*4) /(Last 3 months Trade Payables)/3))
Cash conversion cycle (CCC)Days of inventory outstanding + Days of receivables outstanding –Days of payables outstanding
Cash conversion cycle (CCC) R3Days of inventory outstanding (R3) + Days of receivables outstanding (R3) – Days of payables outstanding (R3)
Net Interest-bearing debt- Cash and cash equivalents + Loans (Non- current liabilities) + Loans (Current liabilities)
Interest-bearing debtLoans (Non- current liabilities) + Loans (Current liabilities)
Net gearingNet Interest-bearing debt / Equity