Embed Size (px)
Citation preview

CAPITAL MARKETS DAY| AMSTERDAM | 29 SEPTEMBER 2016
CAPITAL MARKETS DAY 2016 PANALPINA GROUP

THE NEW CEO
Swiss citizen, born 1973
Married, two children
Began freight forwarding career in 1991 with roles at Danzas and Nedlloyd Lines in Switzerland and U.K.
1997: Joined Panalpina, held various management positions in Europe, Africa, Central Asia and Asia Pacific
2013: Regional CEO Asia Pacific
International executive MBA from I.E. Business School in Madrid
Bachelor degree in International Trade and Freight Forwarding from EIAB, Basel
CAPITAL MARKETS DAY | 29 SEPTEMBER 2016 |
Stefan Karlen – President and CEO
2

CAPITAL MARKETS DAY | 29 SEPTEMBER 2016 |
Panalpina Executive Board and selected Executive Committee members
SENIOR MANAGEMENT ATTENDING CAPITAL MARKETS DAY
Robert Erni Chief Financial Officer
Karl Weyeneth Chief Commercial Officer
Karsten Breum Chief Human
Resources Officer
Ralf Morawietz Chief Information
Officer
Christoph Hess Chief Legal Officer and
Corporate Secretary
Andy Weber Chief Operating Officer
Rafic Mecattaf Head of Corporate
Development
Lucas Kuehner Global Head of Air Freight
Daryl Ridgway Global Head
of Ocean Freight
Mike Wilson Global Head of Logistics
3

OBJECTIVES OF TODAY’S CAPITAL MARKETS DAY
Demonstrate how we have de-risked the business and laid foundations for future growth
Share strategic priorities for the coming years
Engage with the leadership team
CAPITAL MARKETS DAY | 29 SEPTEMBER 2016 |
4

AGENDA
CAPITAL MARKETS DAY | 29 SEPTEMBER 2016 |
Part I: Key achievements since last Capital Markets Day and Q&A
Lunch
Part II: Deep-dive sessions – Strategic priorities Session 1 - Ocean Freight and Productivity
Daryl Ridgeway, Ralf Morawietz, Andy Weber Session 2 - Sales Growth
Karl Weyeneth, Stefan Karlen Session 3 - Air Freight and Perishables
Lucas Kuehner, Colin Wells Session 4 - Logistics and Innovation
Mike Wilson, Peter Weijmarshausen (CEO Shapeways)
Break All groups reconvene in the main room
Wrap-up and conclusions
10:15 – 11:50
11:50 – 12:50
12:50 – 15:20
15:20 – 15:30
15:30 – 16:00
5

CAPITAL MARKETS DAY | 29 SEPTEMBER 2016 |
THE PANALPINA JOURNEY - KEY ACHIEVEMENTS SINCE 2013 CAPITAL MARKETS DAY
6

DILIGENT STRATEGY EXECUTION
CAPITAL MARKETS DAY | 29 SEPTEMBER 2016 |
We have laid the foundation to steadily reach best-in-class profitability and are now focusing on top line growth
2013 AND EARLIER 2016 AND BEYOND
Unclear strategy
Inefficient structure
Operations Transformation Program (OTP) at risk
High volatility in GP and profitability
Low EBIT conversion
Continue operational improvement
Accelerate growth:
Accelerate organic growth
Drive selective bolt-on M&A
Support growth through innovation
Clear and focused strategy Coherent organization and
management upgrade Centralization and offshoring of
functions Roll-out of Finance and
Operational IT systems Increase of return on sales Turnaround of loss-making
operations Cost control Selected market entries and
2 bolt-on acquisitions
2014 + 2015
7

OPERATIONAL IMPROVEMENT
CAPITAL MARKETS DAY | 29 SEPTEMBER 2016 |
It has been hard work….but now we are harvesting the results
Coherent organization and
management upgrade
Centralization and offshoring of functions (GBS)
Roll-out of Finance and
Operational IT systems
Increase of Return on Sales
Turnaround of loss-making operations
Cost control
8

AN EFFECTIVE MANAGEMENT PLATFORM
CAPITAL MARKETS DAY | 29 SEPTEMBER 2016 |
Simplified and accountable senior management structure in place
We have:
A matrix organization that works well
Significantly strengthened our top 100 population (64% new since 2013)
A strong Executive Board, well aligned with the Board of Directors
Appointed CEO and 4 ExCom members via internal talents in 2016
A stable organization and are ready to grow Executive Board (EB)
+ Executive Committee (ExCom)
Board of Directors Peter Ulber
Corporate Development Rafic Mecattaf
Chief Operating Officer
Andy Weber
Ocean Freight Daryl Ridgway
Logistics Mike Wilson
Europe Volker Böhringer
Americas Frank Hercksen
Asia Pacific Sven Raudszus
MEAC Peter Triebel
Chief Financial Officer
Robert Erni
Chief Legal Officer
Christoph Hess
Chief Commercial
Officer Karl Weyeneth
Chief HR Officer
Karsten Breum
Chief Information
Officer Ralf Morawietz
Chief Executive Officer Stefan Karlen
Air Freight Lucas Kuehner
Energy Solutions Michel Dubois
9
CENTRALIZATION AND OFFSHORING OF FUNCTIONS
CAPITAL MARKETS DAY | 29 SEPTEMBER 2016 |
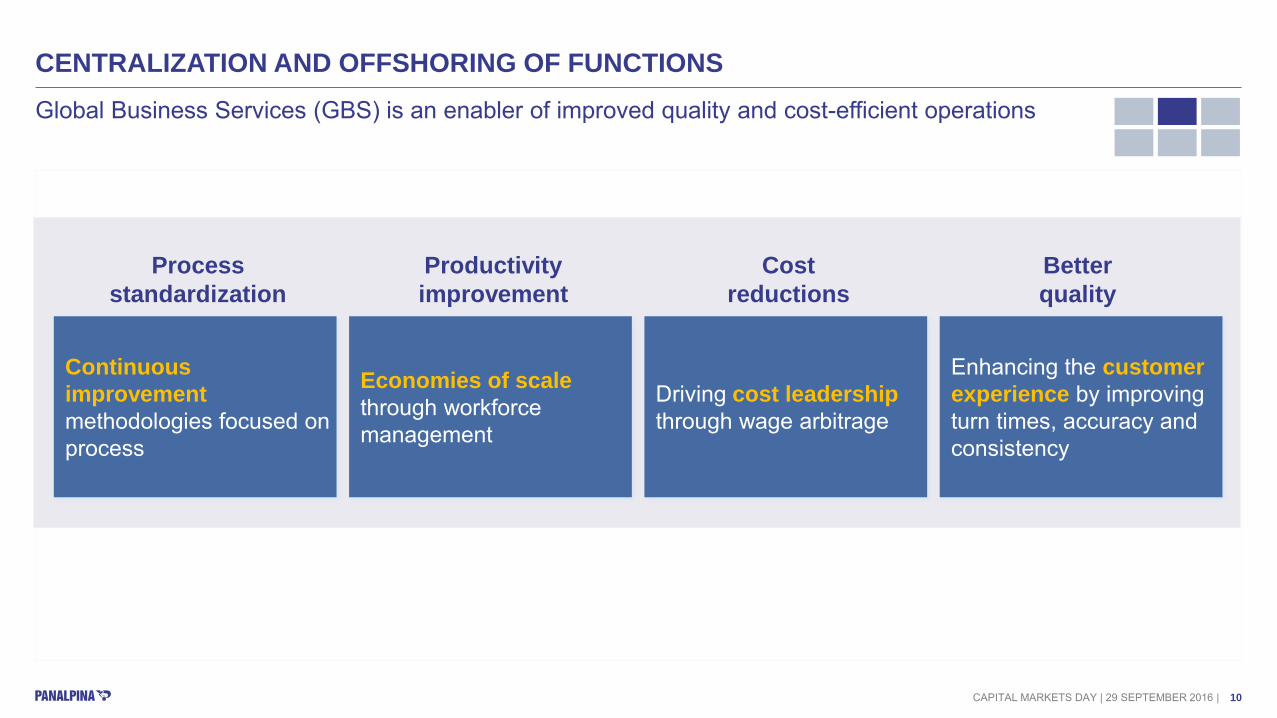
Global Business Services (GBS) is an enabler of improved quality and cost-efficient operations
Continuous improvement methodologies focused on process
Economies of scale through workforce management
Driving cost leadership through wage arbitrage
Enhancing the customer experience by improving turn times, accuracy and consistency
Process standardization
Productivity improvement
Cost reductions
Better quality
10

CENTRALIZATION AND OFFSHORING OF FUNCTIONS
CAPITAL MARKETS DAY | 29 SEPTEMBER 2016 |
The offshoring initiatives are on-track according to the revised plan
400+
400+ FTEs offshored (excl. outsourced F&A
jobs)
24 hour
Round-the-clock coverage & global reach
3 sites
GBS sites in Manila, Prague & Wuhan
1 network
One globally-integrated GBS network
Off-shore 20% of Air and Ocean freight processes by 2020 Centralization of processes should deliver up to 10% productivity increase annually
within GBS sites
Targets for upcoming years
11

ROLL-OUT OF FINANCE AND OPERATIONAL IT SYSTEMS
CAPITAL MARKETS DAY | 29 SEPTEMBER 2016 |
OTP is a complex and costly program (total spending of CHF 250m) but also a prerequisite for future profitable growth and a key competitive edge to increase the gap with competitors
1) Switzerland, Germany, Italy, Singapore, China, USA, Canada, Argentina, Uruguay, Chile, Egypt
OTP Operations Transformation Program
ERP SC - Finance SAP TM - Operations
What is it? Consolidation of disparate environments into one Single Client SAP system
Replacing old legacy system and implementing global processes for Air & Ocean
Why are we doing it?
Transparency: standardized finance processes, improved reporting quality Scalability for new businesses & acquisitions
Operational leverage, streamlined processes Scalability for new businesses & acquisitions Entry ticket for future digitization opportunities
Current Status
Deployment on track Live in 11 countries 1) and Head Office
(55% of total transactions)
SAP TM live in Switzerland and Singapore Italy and Canada completed configuration phase, on
track for go-live in 2016
Outlook Next wave (mostly Western European countries)
to go-live in Q1 2017 Roll-out expected to be finished end 2017
Concept to be proven in a large country in 2017 Target to finalize 60% of transactions by 2017-18 Costs to be kept under control
12

Switzerland Germany Remaining countries
Singapore US
Italy (Q4) China / Hong-Kong
Canada (Q4) Selected Western Europe countries
2016 2017 & 2018 Beyond
ROLL-OUT OF FINANCE AND OPERATIONAL IT SYSTEMS
CAPITAL MARKETS DAY | 29 SEPTEMBER 2016 |
SAP TM works well and we are on track to continue with a successful implementation
10%
60% 100%
Share of total shipments
Live in Singapore and Switzerland with ~125’000 shipments executed
No business interruptions
No customer complaints
Positive feedback from our operational users
Confident with our business case
Temporary roll back to old systems seamlessly possible
SAP TM (Operations)
13

Sales academy & induction program
CAPITAL MARKETS DAY | 29 SEPTEMBER 2016 |
INCREASE OF RETURN ON SALES All objectives set in 2013 to increase sales efficiency & effectiveness successfully implemented
890
1,070 1,200
FY 13 FY 14 FY 15
* Energy & Project Solutions
GP per Sales FTE (in CHF k, currency adj., excl. EPS*)
Increased sales efficiency at stable costs
Rebalanced organizational structure
One single CRM tool to drive opportunities
Industry vertical & account growth plans
Automated reporting incl. pipeline & performance visibility
Global incentive & bonus program
Standardized Sales process
14

CAPITAL MARKETS DAY | 29 SEPTEMBER 2016 |
We know how to turn around loss-making operations
TURNAROUND OF LOSS MAKING OPERATIONS
2.9
(49.5)
26.6
14.0
5.8
3.3 2.7 Evolution of 2013’s top 5 loss-making countries’ EBIT in CHFm*
* EBIT per Country after Allocations and management fees
End 2013 End 2015
We have achieved full P&L visibility at regional, country, business unit and department level allowing us to take the right management decision
Country #1
Country #2
Country #3
Country #4 Country #5
15

TURNAROUND OF LOSS MAKING OPERATIONS
CAPITAL MARKETS DAY | 29 SEPTEMBER 2016 |
Case study of a successful country turnaround – Example of Country #4
INITIAL SITUATION WHAT WAS ACHIEVED
Ranked top 5 player in Air and Ocean
Negative Direct Contribution paired with a continuing economic downtrend
Need for drastic turnaround measures signed off by the Executive Board in 2013
GP margin increased by 4 percentage points
Overhead expenses reduced drastically
EBIT improvement of CHF 3.3 m
Market reputation restored
Increase staff satisfaction
Improvement and elimination of unprofitable business
Rebalancing of sales resources on attractive industry verticals and improvement of sales efficiency
Right-sizing of management and support functions
Centralization of operations
WHAT WAS DONE
Complete “reboot” of the country organization
16

TURNAROUND OF LOSS MAKING OPERATIONS
CAPITAL MARKETS DAY | 29 SEPTEMBER 2016 |
Logistics business has been profitable for the last 6 quarters and our Energy & Project Solutions set-up is now prepared to take advantage of any sector rebound
~70 site closures and 35 sites transformed into Value-added services
(8.9) (9.2)
(12.5)
(5.5)
1.1
(2.6) (1.3)
1.2 0.3 0.5 0.1
1.8 2.3
2Q13 3Q13 4Q13 1Q14 2Q14 3Q14 4Q14 1Q15 2Q15 3Q15 4Q15 1Q16 2Q16
Quarterly EBIT in MCHF
LOGISTICS ENERGY & PROJECT SOLUTIONS
Oil & Gas and Projects divisions successfully merged in 2014, creating synergies
Dedicated management represented at all organizational levels
Own P&L down to business unit level in relevant countries
Rightsizing of workforce (-25% since January 2015) to reflect recent business decline due to low oil price environment
In progress Done
17

in CHF m Reported FY 2013
Currency impact
Incremental IT project
costs
Other costs increase
/ (decrease)
Reported FY 2015
CAGR FY’13-15
Extrapolation of FY 2016, excl. restructuring 1)
Personnel expenses 960 (85) 4 16 896 (3.4%) ~ 890
Other operating expenses 440 (44) 18 (5) 409 (3.6%) ~ 400
Total costs 1,400 (128) 22 11 1,305 (3.4%) ~ 1,290
COST DEVELOPMENT 2013-2015
CAPITAL MARKETS DAY | 29 SEPTEMBER 2016 |
We have our operational costs under control
1) Corresponding to 2x H1 2016 Reported figures, excluding restructuring expenses
We have maintained our costs at 2013 level and will strive to continue this trend in 2016 and beyond
18
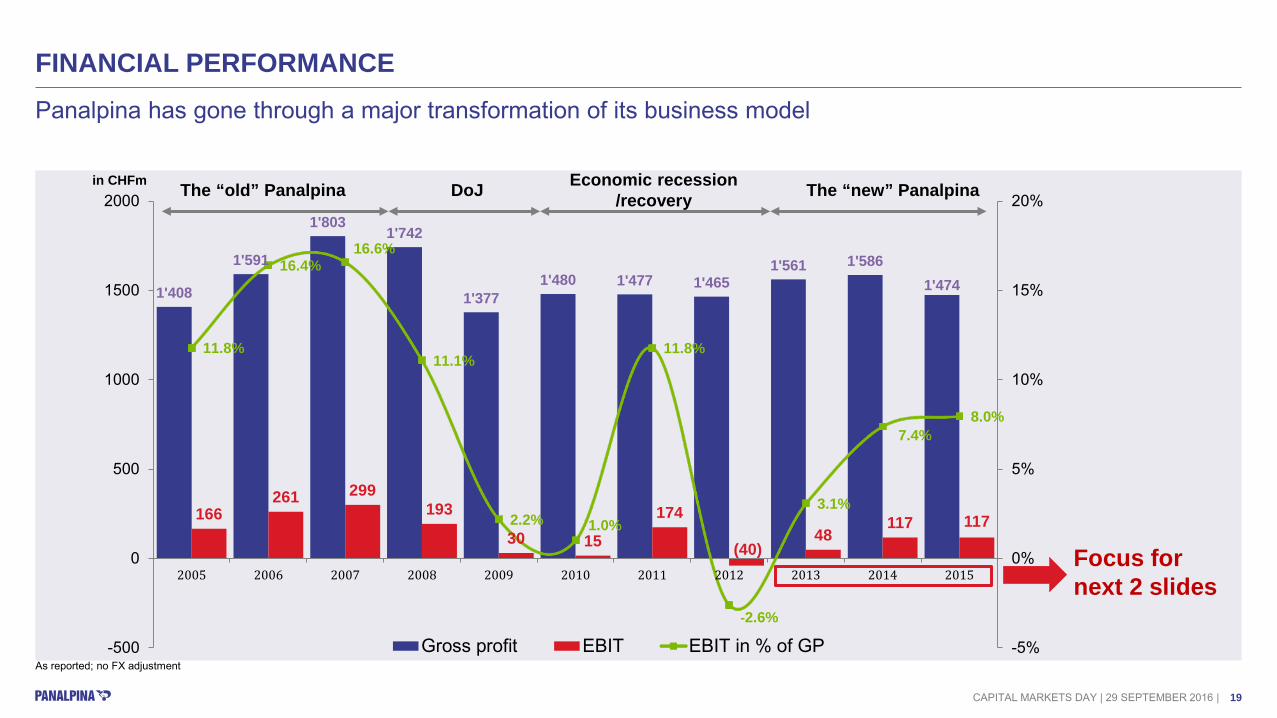
1'408
1'591
1'803 1'742
1'377 1'480 1'477 1'465
1'561 1'586 1'474
166 261 299
193
30 15
174
(40) 48
117 117
11.8%
16.4% 16.6%
11.1%
2.2% 1.0%
11.8%
-2.6%
3.1%
7.4% 8.0%
-5%
0%
5%
10%
15%
20%
-500
0
500
1000
1500
2000
2005 2006 2007 2008 2009 2010 2011 2012 2013 2014 2015
Gross profit EBIT EBIT in % of GP
FINANCIAL PERFORMANCE
CAPITAL MARKETS DAY | 29 SEPTEMBER 2016 |
Panalpina has gone through a major transformation of its business model
As reported; no FX adjustment
in CHFm The “old” Panalpina DoJ Economic recession /recovery The “new” Panalpina
Focus for next 2 slides
19
EBIT BRIDGE 2013 - 2015 IN CHF MILLIONS
CAPITAL MARKETS DAY | 29 SEPTEMBER 2016 |
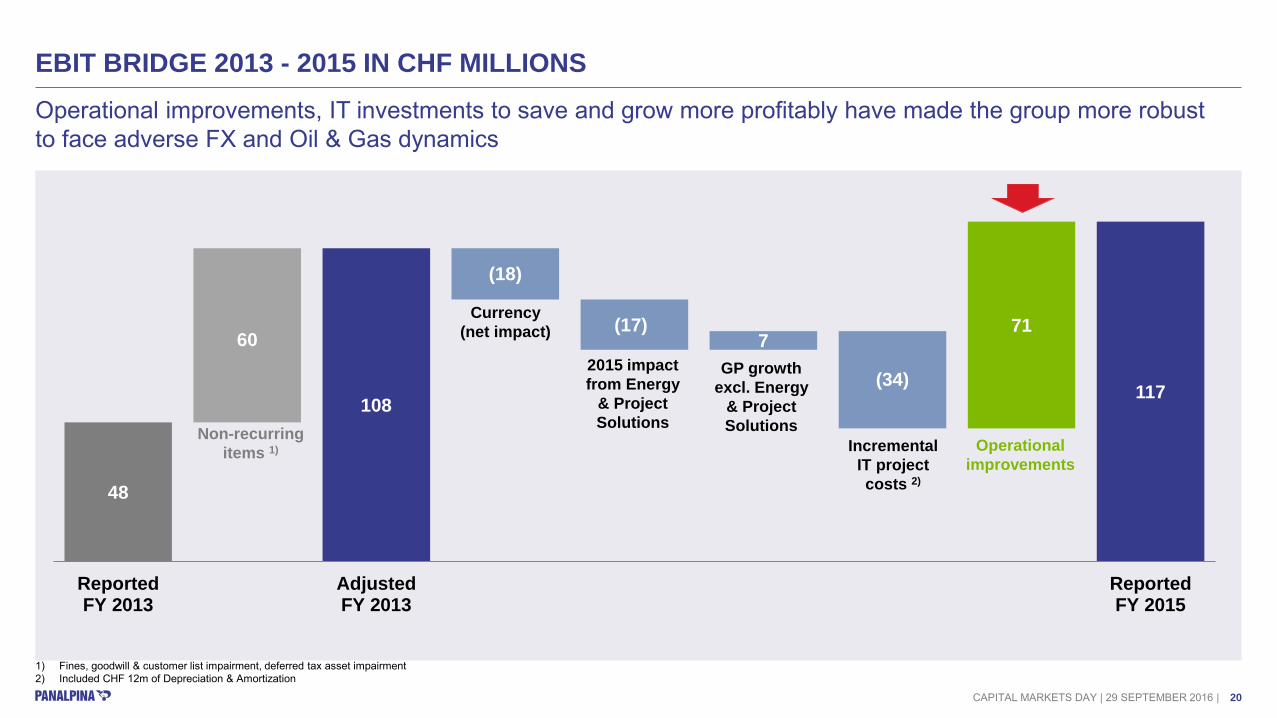
Operational improvements, IT investments to save and grow more profitably have made the group more robust to face adverse FX and Oil & Gas dynamics
1) Fines, goodwill & customer list impairment, deferred tax asset impairment 2) Included CHF 12m of Depreciation & Amortization
48 48
108 90
62 62
35 35
117
60
(18)
(17) 7
(34)
71
ReportedFY 2013
AdjustedFY 2013
ReportedFY 2015
Incremental IT project costs 2)
GP growth excl. Energy
& Project Solutions
2015 impact from Energy
& Project Solutions
Currency (net impact)
Operational improvements
Non-recurring items 1)
20
LATEST FINANCIAL RESULTS (P&L IN CHF MILLION)
CAPITAL MARKETS DAY | 29 SEPTEMBER 2016 |
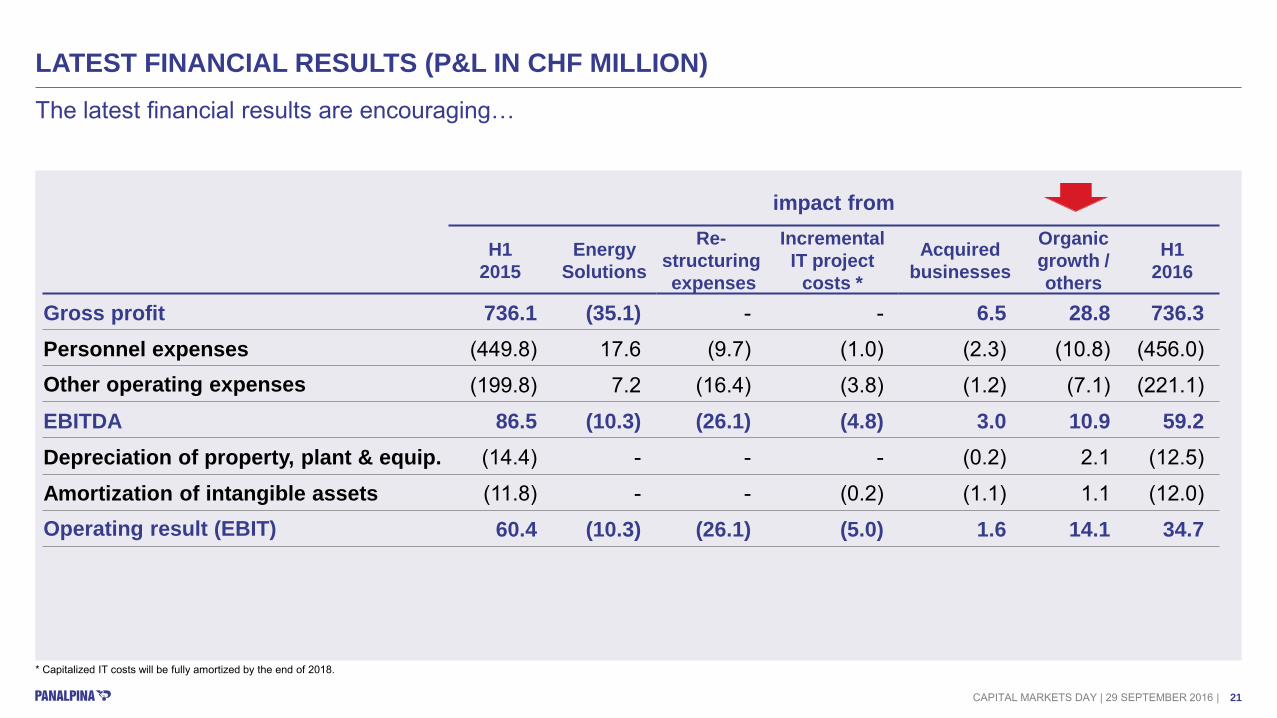
The latest financial results are encouraging…
* Capitalized IT costs will be fully amortized by the end of 2018.
impact from
H1
2015 Energy
Solutions
Re-structuring expenses
Incremental IT project
costs *
Acquired businesses
Organic growth / others
H1 2016
Gross profit 736.1 (35.1) - - 6.5 28.8 736.3 Personnel expenses (449.8) 17.6 (9.7) (1.0) (2.3) (10.8) (456.0) Other operating expenses (199.8) 7.2 (16.4) (3.8) (1.2) (7.1) (221.1)
EBITDA 86.5 (10.3) (26.1) (4.8) 3.0 10.9 59.2 Depreciation of property, plant & equip. (14.4) - - - (0.2) 2.1 (12.5)
Amortization of intangible assets (11.8) - - (0.2) (1.1) 1.1 (12.0) Operating result (EBIT) 60.4 (10.3) (26.1) (5.0) 1.6 14.1 34.7
21

LATEST FINANCIAL RESULTS (STOCK PRICE INDEX)
CAPITAL MARKETS DAY | 29 SEPTEMBER 2016 |
… and have been rewarded by the stock market
1) Total shareholder return (over the period 01/01/2016 to 15/09/16) with dividends reinvested ; Source: Bloomberg
120
101
113 119
75
80
85
90
95
100
105
110
115
120
125
Jan-16 Feb-16 Mar-16 Apr-16 May-16 Jun-16 Jul-16 Aug-16 Sep-16
+26%
+8%
+15% +24%
Index as of 15/09/16
Shareholder return 1)
PWTN
KNIN
EXPD DSV
Index (basis 100 = price on 02/01/16)
22
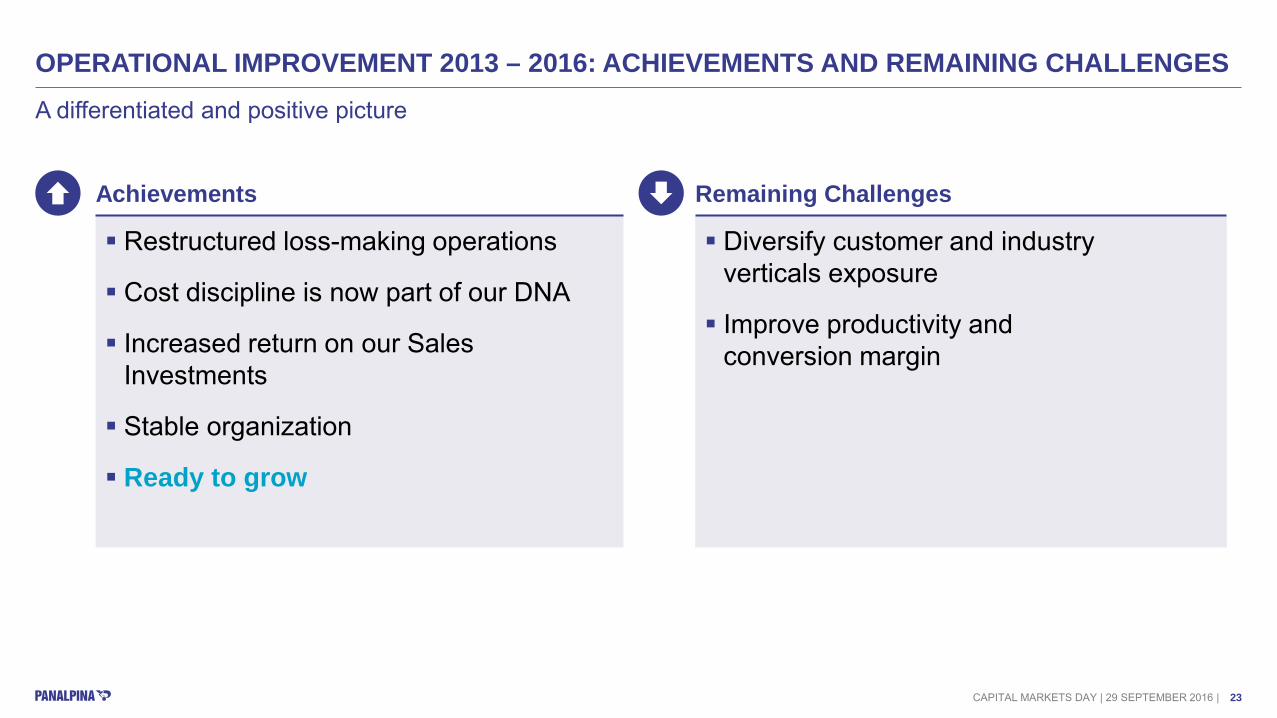
OPERATIONAL IMPROVEMENT 2013 – 2016: ACHIEVEMENTS AND REMAINING CHALLENGES
CAPITAL MARKETS DAY | 29 SEPTEMBER 2016 |
A differentiated and positive picture
Achievements Remaining Challenges
Restructured loss-making operations
Cost discipline is now part of our DNA
Increased return on our Sales Investments
Stable organization
Ready to grow
Diversify customer and industry verticals exposure
Improve productivity and conversion margin
23

A HIGHLY CASH GENERATIVE BUSINESS MODEL
Cash conversion and return on capital employed (ROCE)
Dividends and earnings per share
CAPITAL MARKETS DAY | 29 SEPTEMBER 2016 |
Future cash generation will reward shareholders and be invested in growth
1) ROCE after Tax calculated as: (EBIT - Tax) / (Equity - Cash + External Debt)
75%
122%
24% 28%
2014 2015Free cash flow as % of EBIT ROCE after Tax
2.5
3.50 3.68 3.69
2014 2015Dividends per Share (CHF) Earnings per Share (CHF)1)
24
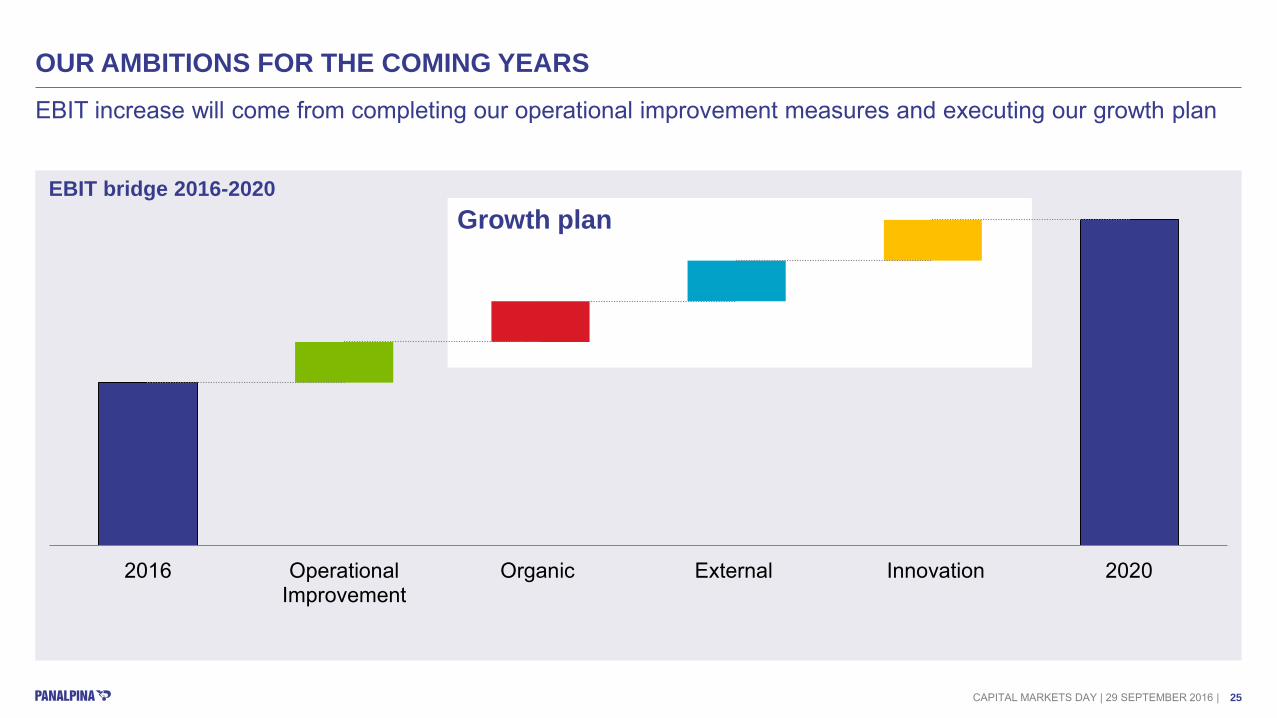
Growth plan
2016 OperationalImprovement
Organic External Innovation 2020
OUR AMBITIONS FOR THE COMING YEARS
CAPITAL MARKETS DAY | 29 SEPTEMBER 2016 |
EBIT increase will come from completing our operational improvement measures and executing our growth plan
EBIT bridge 2016-2020
25

WRAP-UP AND STRATEGIC PRIORITIES
CAPITAL MARKETS DAY | 29 SEPTEMBER 2016 |
While we will diligently continue to improve our operations, we are now focusing on growth
Organic growth External growth Growth through Innovation
Increase share of wallet with existing customers
Rebalance our Industry Vertical mix
Develop new business in existing / new verticals
Expand footprint in selected geographies
Expand service portfolio
Explore opportunities from new supply chain trends
Strategic partnerships
Bolt-on M&A
Operational improvement
Restructure loss-making operations
Optimize Charter Network
Optimize GP margin, maintain costs under control
Centralize and offshore functions
Roll-out SAP TM
26

THE AFTERNOON SESSION
CAPITAL MARKETS DAY | 29 SEPTEMBER 2016 |
Four interactive deep-dive sessions to illustrate how we execute our strategy
Ocean Freight and Productivity deep-dive
Logistics & Innovation deep-dive
Sales Growth deep-dive
Focus on productivity Focus on organic growth
Focus on Innovation
D. Ridgway – Global Head of Ocean Freight R. Morawietz – Chief Information Officer A. Weber – Chief Operations Officer
M. Wilson – Global Head of Logistics P. Weijmarshausen – CEO Shapeways Group
K. Weyeneth – Chief Commercial Officer S. Karlen – Chief Executive Officer
Air Freight and Perishables deep-dive
Focus on Perishables / Bolt-on M&A
L. Kuehner – Global Head of Air Freight C. Wells – Global Head of Perishables
Organic growth External growth Growth through Innovation
Operational improvement
27

CAPITAL MARKETS DAY | 29 SEPTEMBER 2016 |
Q&A
28

AGENDA
CAPITAL MARKETS DAY | 29 SEPTEMBER 2016 |
Part I: Key achievements since last Capital Markets Day and Q&A
Lunch in the Patio Restaurant
Part II: Deep-dive sessions – Strategic priorities Session 1 - Ocean Freight and Productivity - Olive
Daryl Ridgeway, Ralf Morawietz, Andy Weber Session 2 - Sales Growth - Beech
Karl Weyeneth, Stefan Karlen Session 3 - Air Freight and Perishables - Lime
Lucas Kuehner, Colin Wells Session 4 - Logistics and Innovation - Sequoia
Mike Wilson, Peter Weijmarshausen (CEO Shapeways)
Break All groups reconvene in the main room
Wrap-up and conclusions
10:15 – 11:50
11:50 – 12:50
12:50 – 15:20
15:20 – 15:30
15:30 – 16:00
29

THE AFTERNOON SESSION
CAPITAL MARKETS DAY | 29 SEPTEMBER 2016 |
Groups rotate to their next respective workshop
13:30- 14:00 14:10- 14:40 14:50- 15:20 12:50 -13:20
Logistics and Innovation Sequoia Room
Air Freight and Perishables Lime Room
Sales Growth Beech Room
Ocean Freight and Productivity Olive Room
Group Session
1 2 3 4
30

CAPITAL MARKETS DAY | 29 SEPTEMBER 2016 |
OCEAN FREIGHT AND PRODUCTIVITY
31
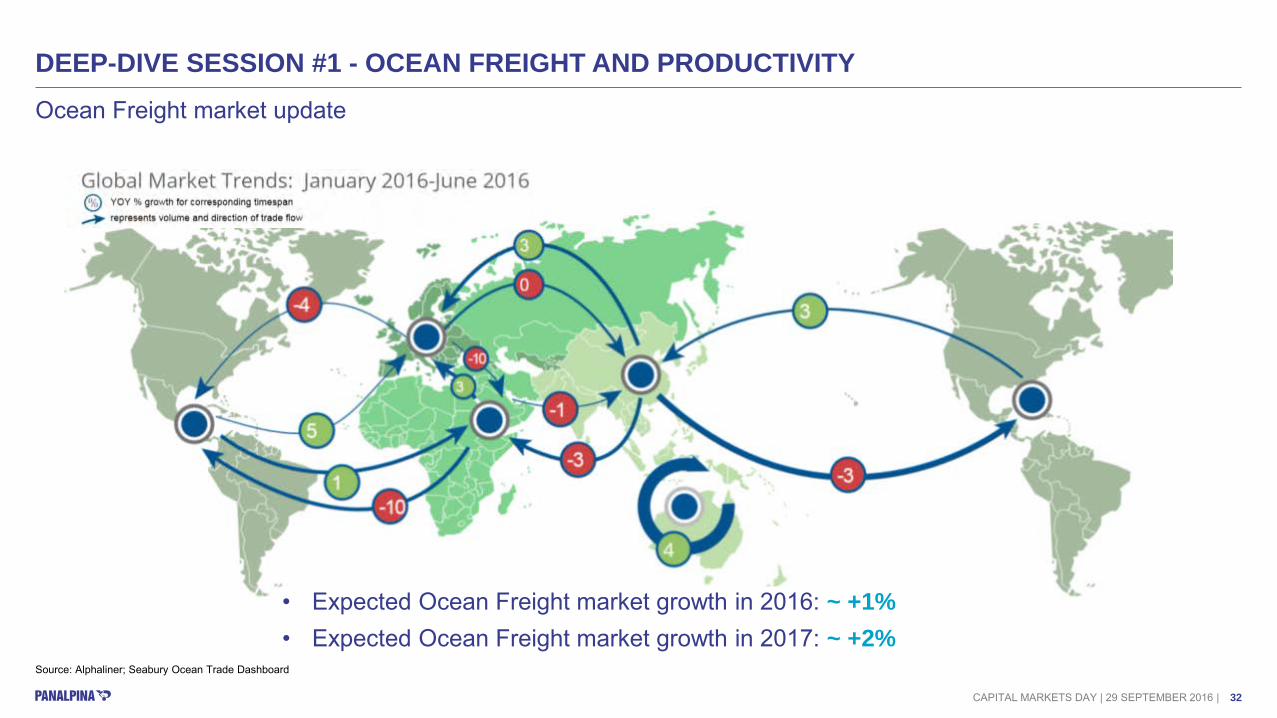
DEEP-DIVE SESSION #1 - OCEAN FREIGHT AND PRODUCTIVITY
CAPITAL MARKETS DAY | 29 SEPTEMBER 2016 |
Ocean Freight market update
• Expected Ocean Freight market growth in 2016: ~ +1% • Expected Ocean Freight market growth in 2017: ~ +2%
Source: Alphaliner; Seabury Ocean Trade Dashboard
32

DEEP-DIVE SESSION #1 - OCEAN FREIGHT AND PRODUCTIVITY
CAPITAL MARKETS DAY | 29 SEPTEMBER 2016 |
Ocean Freight market update
Source: Alphaliner; Seabury Ocean Trade Dashboard
Market outlook – Volume growth January ‘16 to July ‘16
PERISHABLES
5%
TECHNOLOGY
0%
HEALTHCARE
-3%
GOV. AID & RELIEF 6%
C&R and FASHION
0%
CHEMICALS
0%
AUTO & MANUFACT
-4%
33

DEEP-DIVE SESSION #1 - OCEAN FREIGHT AND PRODUCTIVITY
CAPITAL MARKETS DAY | 29 SEPTEMBER 2016 |
Freight Rates & Bunker: still no sustainable levels
‒ SCFI Main Ports fell by almost 50% over the last 3 years
‒ Bunker prices followed the severe drop in crude oil prices
Carriers: merger / alliance activities and bankruptcies
‒ The acquisition of UASC takes Hapag Lloyd to #5 of Top Carrier rank
‒ Hyundai MM joining 2M alliance
‒ Bankruptcy of Hanjin Shipping
SOURCE: ALPHALINER; SEABURY OCEAN TRADE DASHBOARD
Ocean Freight market update
34

OCEAN FREIGHT FY 2013 FY 2015 H1 2016
Net forwarding revenue 2’781 2’587 1’026 Forwarding expenses (2’289) (2’107) (793) Gross profit 492 480 232 in % of NFR 17.7% 18.6% 22.6% Personnel expenses (323) (314) (154) in % of gross profit 65.8% 64.6% 66.4% Other operating expenses (123) (122) (59) in % of gross profit 25% 28.6% 25.4% EBITDA 45 45 19 in % of gross profit 9.2% 9.3% 8.2% D&A (17) (18) (8) EBIT 28 27 11 in % of gross profit 5.7% 5.5% 4.7% Total FTE 3’412 3’383 3’176 OF volumes ('000 TEUs) 1’495 1’593 721 % change YoY 8% (0.8)% (9.1)% GP/TEU (CHF) 329 306 323 % change YoY (1.0)% 3.0% 8.0%
DEEP-DIVE SESSION #1 - OCEAN FREIGHT AND PRODUCTIVITY
CAPITAL MARKETS DAY | 29 SEPTEMBER 2016 |
Our journey since last Capital Markets Day
Strategy & objectives set in 2013 What has been achieved
Volume growth and improved procurement
Volume growth: below expectations Diversified carrier, optimized procurement &
allocation management
Additional revenue and profit margin through Managed Solutions
Acquired and implemented significant and complex Managed Solutions customers
Discipline to exit unprofitable business Promising recent business wins & pipeline
Productivity and quality improvement Productivity stagnating and still significantly below target
Maintain position among Top 5 Position #4 defended
Turn around loss-making operations and increase EBIT/GP margin
Turnaround of loss-making operations largely completed
EBIT conversion below expectations
35

DEEP-DIVE SESSION #1 - OCEAN FREIGHT AND PRODUCTIVITY
1. Productivity Improvement: further operational restructuring
and GBS acceleration aiming at a 20% EBIT / GP margin
2. Grow organically and through acquisitions
3. Further diversify Industry Verticals exposure
CAPITAL MARKETS DAY | 29 SEPTEMBER 2016 |
Our 3 strategic priorities for the coming years
36

DEEP-DIVE SESSION #1 - OCEAN FREIGHT AND PRODUCTIVITY
CAPITAL MARKETS DAY | 29 SEPTEMBER 2016 |
Focus on productivity - There are several levers for Panalpina to trigger in order to increase productivity
Other technology enablers • Robotic Process Automation • Unstructured to structured data • Contextual search • Probabilistic pricing
Non-technology enablers • Continuous adjustment of the operations • Organization & process improvements • Centralization of functions • Business outsourcing (GBS)
272 262 273
H1 2014 H1 2015 H1 2016
Ocean Freight Productivity – # shipments per FTE
Focus for the rest of the session
SAP TM as the main technology enabler 3 enablers for productivity
improvement
37
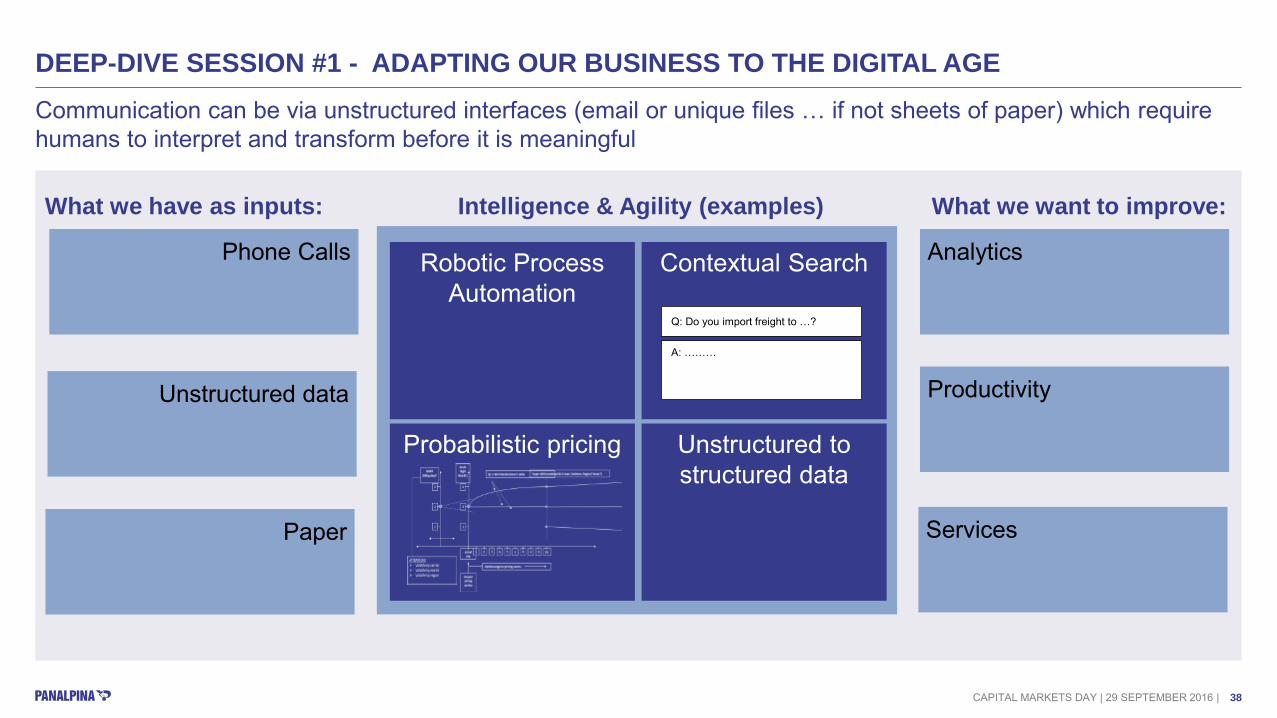
DEEP-DIVE SESSION #1 - ADAPTING OUR BUSINESS TO THE DIGITAL AGE
CAPITAL MARKETS DAY | 29 SEPTEMBER 2016 |
Communication can be via unstructured interfaces (email or unique files … if not sheets of paper) which require humans to interpret and transform before it is meaningful What we have as inputs: What we want to improve:
Analytics
Productivity
Intelligence & Agility (examples)
Robotic Process Automation
Probabilistic pricing
Contextual Search
Unstructured to structured data
Q: Do you import freight to …?
A: ………
Phone Calls
Unstructured data
Paper
Services
38

CAPITAL MARKETS DAY | 29 SEPTEMBER 2016 |
SALES GROWTH
39

DEEP-DIVE SESSION #2: SALES GROWTH
Our Vision
We want to be the most customer focused global provider of freight forwarding and logistics solutions – a trusted, valued and respected partner
We will not rely on market growth but instead:
1. Continue to increase sales efficiency and effectiveness
2. Diversify our Industry Verticals
3. Deliver organic growth through focused resource allocation and innovative solution selling
CAPITAL MARKETS DAY | 29 SEPTEMBER 2016 |
We have the right strategy and structure to drive organic growth in a stagnant market
Source: Seabury
Global growth p.a. 2000-08 2008-14 2014-2016
Ocean Freight +8% +3% +1%
Air Freight +4% +2% -1%
FORWARDING MARKETS ARE STAGNANT OUR ANSWER
40

Sales academy & induction program
CAPITAL MARKETS DAY | 29 SEPTEMBER 2016 |
INCREASE OF RETURN ON SALES ( REMINDER OF MORNING SESSION) All objectives set in 2013 to increase sales efficiency & effectiveness successfully implemented
* Energy & Project Solutions
GP per Sales FTE (in CHF k, currency adj., excl. EPS*) Rebalanced organizational structure
One single CRM tool to drive opportunities
Industry vertical & account growth plans
Automated reporting incl. pipeline & performance visibility
Global incentive & bonus program
Standardized Sales process
890
1,070 1'200
FY 13 FY 14 FY 15Increased sales efficiency at stable costs
41

MANUFACTURING
< 10% of NFR
PERISHABLES
< 10% of NFR
HEALTHCARE
< 10% of NFR
We are de-risking our exposure to cyclical industry verticals such as Energy & Project Solutions, Hi-Tech and Automotive by increasing our exposure to Perishables and Chemicals
• Focus our sales approach on 10 strategic industry verticals (90% of our revenues) • Increase share of wallet with existing customers • Accelerate growth in selected, non-cyclical industry verticals
CAPITAL MARKETS DAY | 29 SEPTEMBER 2016 |
ENERGY & PROJECT SOLUTIONS
> 10% of NFR
CHEMICALS
< 10% of NFR
AUTOMOTIVE
> 10% of NFR
FASHION
< 10% of NFR
TELECOM
< 10% of NFR
DEEP-DIVE SESSION #2: SALES GROWTH
HI-TECH
> 10% of NFR
CONSUMER AND RETAIL
> 10% of NFR
Note: breakdown of Net Forwarding Revenue (NFR) for YTD August 2016
42

We have a great blue chip customer base to increase our share of wallet…
CAPITAL MARKETS DAY | 29 SEPTEMBER 2016 |
DEEP-DIVE SESSION #2: SALES GROWTH
Customer Segmentation Achieved growth from key accounts, compensating GP loss from Energy Project Solutions (EPS)1) :
‒ Dedicated key account management structure and executive sponsorships
‒ Value added solution selling
Increase in return on sales investments (GP increase per sales FTE)
Global Accounts
Country Accounts
Country Key Accounts
1) Gross Profit YTD July 2016: Energy & Project Solutions CHF -35M resp. All other Industry Verticals CHF +29M (excluding M&A)
43

DEEP-DIVE SESSION #2: SALES GROWTH
CAPITAL MARKETS DAY | 29 SEPTEMBER 2016 |
… enabling us to win major business over competition
Strategic CRF wins
New markets in Europe and South Africa
myPanalpina+ Innovative IT
platform
25,000 m3 LCL freight
TEU over 12 months
31,887 300,000 m3
Two major contracts with adidas
Carrier ocean freight
3PL international freight consolidation
Freight consolidation PO management Vendor management Buyer management
10,000
Increased AF business with adidas
Doubled business Year on Year
Carry 1/3 of adidas’ AF
business
Tons in total award
44

CAPITAL MARKETS DAY | 29 SEPTEMBER 2016 |
AIR FREIGHT AND PERISHABLES
45

DEEP-DIVE SESSION #3 – AIR FREIGHT AND PERISHABLES
CAPITAL MARKETS DAY | 29 SEPTEMBER 2016 |
Air Freight market update
Source: Seabury
Capacity outgrowing demand Soft market environment Continuous pressure on rates
Capacity outgrows demand by > 5% Surcharge
Net Yield
46

Market outlook – Volume growth January ‘16 to July ‘16
DEEP-DIVE SESSION #3 – AIR FREIGHT AND PERISHABLES Air Freight market update - Differentiated dynamics across industry verticals
CAPITAL MARKETS DAY | 29 SEPTEMBER 2016 |
HEALTHCARE
1%
AUTO & MANUFACT - 6%
PERISHABLES
8%
C&R and FASHION
2%
CHEMICALS
-1%
TECHNOLOGY
-11%
ENERGY & PROJECT SOLN - 44%
GOV. AID & RELIEF -1%
47

DEEP-DIVE SESSION #3 – AIR FREIGHT AND PERISHABLES
CAPITAL MARKETS DAY | 29 SEPTEMBER 2016 |
Our journey since last Capital Markets Day
AIR FREIGHT FY 2013 FY 2015 H1 2016
Net forwarding revenue 3'055.6 2'645.6 1'269.1 Forwarding expenses (2'424.2) (2'061.5) (964.6) Gross profit 631.4 584.1 304.5 in % of NFR 20.7% 22.1% 24.0% Personnel expenses (351.0) (341.3) (175.4) in % of gross profit 55.6% 58.4% 57.6% Other operating expenses (143.1) (135.4) (73.0) in % of gross profit 22.7% 23.2% 24.0% EBITDA adjusted 137.3 107.4 56.1 in % of gross profit 21.7% 18.4% 18.4% D&A (18.0) (18.9) (10.3) EBIT adjusted 119.3 88.5 45.7 in % of gross profit 18.9% 15.2% 15.0% Total FTE 3'493 3'378 3'466 AF volumes ('000 tons) 825.1 836.2 441.2 % change YoY 3.0% -2.5% 8.2% GP/ton (CHF) 765 699 690 % change YoY -2.0% -5.8% -4.1%
Strategy & objectives set in 2013
What has been achieved
Volume growth through development of 5 strategic trade lanes and backhaul lanes
Volume growth: CAGR of +3% (2013-16) Expansion/optimization of Charter Network
(> 200 scheduled charters)
Additional revenue and profit margin through end-to-end value added services
Ongoing insourcing of customs clearance in selected countries
Certifications (GDP for pharma)
Productivity and quality improvement Digitization (paperless flights on ACMI, 1st forwarder to handle 50% of transactions using e-AWB)
Productivity below target
Maintain position among Top 5 Position #4 defended
Turn around loss-making operations and increase EBIT/GP margin
Turnaround of loss-making operations largely completed
EBIT conversion below expectations
48

DEEP-DIVE SESSION #3 – AIR FREIGHT AND PERISHABLES
1. Grow organically and through acquisitions, eg Perishables
2. Further diversify Industry Verticals exposure
3. Keep cost steady and harvest productivity (centralization of
functions, roll-out of SAP TM, deployment of new technologies
in operations) to reach EBIT / GP margin of 25%
CAPITAL MARKETS DAY | 29 SEPTEMBER 2016 |
Our 3 strategic priorities for the coming years
49

DEEP-DIVE SESSION #3 – AIR FREIGHT AND PERISHABLES
CAPITAL MARKETS DAY | 29 SEPTEMBER 2016 |
The perishables markets provides attractive growth opportunities …
Note: World map based on the official UN published maps. Source: Seabury
MEST
CIS
ASIA
+3% / +6%
+6% / +6%
+4% / +3%
Global future perishables growth 2016-2020: • Air Freight: +3-4% per year • Ocean Freight: +4-5% per year
+9% / +6%
+3% / +6% +7% / +3%
+7% / +1% +2% / +1%
+3% / +7%
+2% / +2%
+1% / +7% +6%
Perishables - An attractive industry vertical
High volumes
Constant growth of ~5%
Counter-cyclical
Complementary trade lanes (north-bound)
Access to major consumer goods & retail customers
Good EBIT conversion
EUROPE
NORTH AMERICA
SOUTH AMERICA
AUSTRALIA
50
CAPITAL MARKETS DAY | 29 SEPTEMBER 2016 |
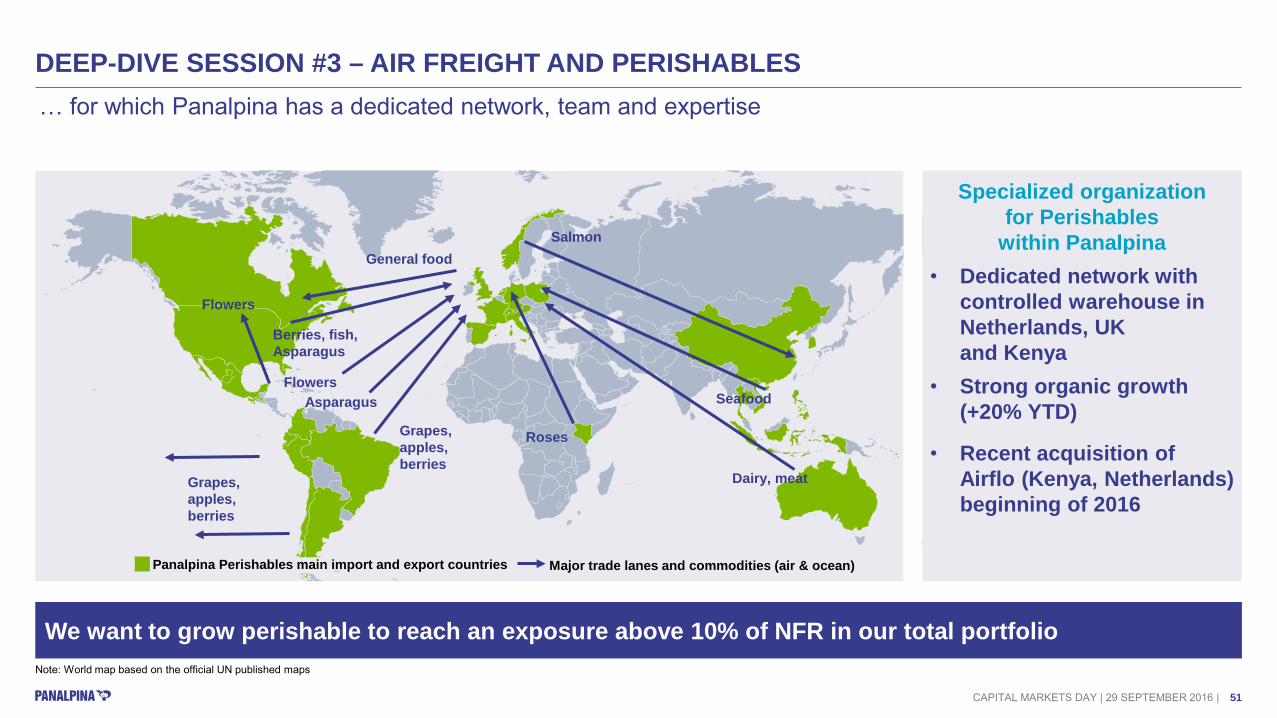
DEEP-DIVE SESSION #3 – AIR FREIGHT AND PERISHABLES … for which Panalpina has a dedicated network, team and expertise
Major trade lanes and commodities (air & ocean)
Grapes, apples, berries
Asparagus
Roses
Salmon General food
Berries, fish, Asparagus
Flowers
Flowers
Grapes, apples, berries
Dairy, meat
Seafood
Specialized organization for Perishables
within Panalpina • Dedicated network with
controlled warehouse in Netherlands, UK and Kenya
• Strong organic growth (+20% YTD)
• Recent acquisition of Airflo (Kenya, Netherlands) beginning of 2016
Note: World map based on the official UN published maps
We want to grow perishable to reach an exposure above 10% of NFR in our total portfolio
Panalpina Perishables main import and export countries
51
DEEP-DIVE SESSION #3 – AIR FREIGHT AND PERISHABLES
CAPITAL MARKETS DAY | 29 SEPTEMBER 2016 |
Perishable value chain demands high diligence at every stage; Panalpina has developed such expertise to serve its perishables customers and be competitive in the perishables market
Step-by-step illustration of perishable value chain (example with Panalpina
Airflo movie)
52

CAPITAL MARKETS DAY | 29 SEPTEMBER 2016 |
LOGISTICS AND INNOVATION
53

DEEP-DIVE SESSION #4 – LOGISTICS AND INNOVATION
CAPITAL MARKETS DAY | 29 SEPTEMBER 2016 |
The supply chain of our customers is changing …
Large batch units made in low cost geographies Modular products, personalised close to demand
Linear manufacturing
Linear Supply Chains Circular Supply Chains
Distributed manufacturing
TODAY TOMORROW
54

DEEP-DIVE SESSION #4 – LOGISTICS AND INNOVATION
CAPITAL MARKETS DAY | 29 SEPTEMBER 2016 |
… enabling us to expand our service offer and generate additional profit
Component manufacture
Finished goods assembly
Finished goods storage
$10 $20 $50 -$10 -$5
Transport
$
Trad
ition
al li
near
bu
sine
ss m
odel
End consumer Raw materials
Component manufacture
Production of modules Final Assembly End consumer
$10 $20 $40 -$10 $10
Transport
$
$
PLCE
$10
Dis
trib
uted
, ci
rcul
ar m
odel
Raw materials
55

DEEP-DIVE SESSION #4 – LOGISTICS AND INNOVATION
CAPITAL MARKETS DAY | 29 SEPTEMBER 2016 |
Our journey since the last Capital Markets Day
LOGISTICS FY 2013 FY 2015 H1 2016
Net revenue 920.6 622.5 301.5
Expenses (482.9) (213.2) (102.7)
Gross profit 437.7 409.3 198.9
in % of NFR 47.5% 65.8% 66.0%
Personnel expenses (285.6) (240.7) (116.6)
in % of gross profit 65.3% 58.8% 58.6%
Other operating expenses (174.2) (152.2) (72.3)
in % of gross profit 39.8% 37.2% 36.3%
EBITDA (22.1) 16.4 10.0
in % of gross profit -5.0% 4.0% 5.0%
D&A (17.2) (14.2) (5.8)
EBIT (39.3) 2.1 4.1
in % of gross profit -9.0% 0.5% 2.1%
Strategy & objectives set in 2013 What has been achieved
Turn around loss-making operations for sustainable EBIT
~70 site closures and 35 site transformed into value-added services
Positive EBIT since Q1 2015
Productivity and margin increase through continuous improvement (LogEx) and Best-in-class IT platform
LogEx program delivered > 2500 improvement projects and multi-million profit improvements
> 500 employees certified since the launch of the program
E2E offering and customer retention through selective Value Added Services and focused business development
Successful development of a manufacturing solution (LMS)
Successful design and implementation of innovative solutions (D2ID, e-commerce)
56
DEEP-DIVE SESSION #4 – LOGISTICS AND INNOVATION
1. Continue optimization & turnaround of the exiting Contract Logistics portfolio
2. Grow Logistics Manufacturing Services (LMS)
3. Develop new revenue streams through innovation
CAPITAL MARKETS DAY | 29 SEPTEMBER 2016 |
Our 3 strategic priorities for the coming years
57
DEEP-DIVE SESSION #4 – LOGISTICS AND INNOVATION
CAPITAL MARKETS DAY | 29 SEPTEMBER 2016 |
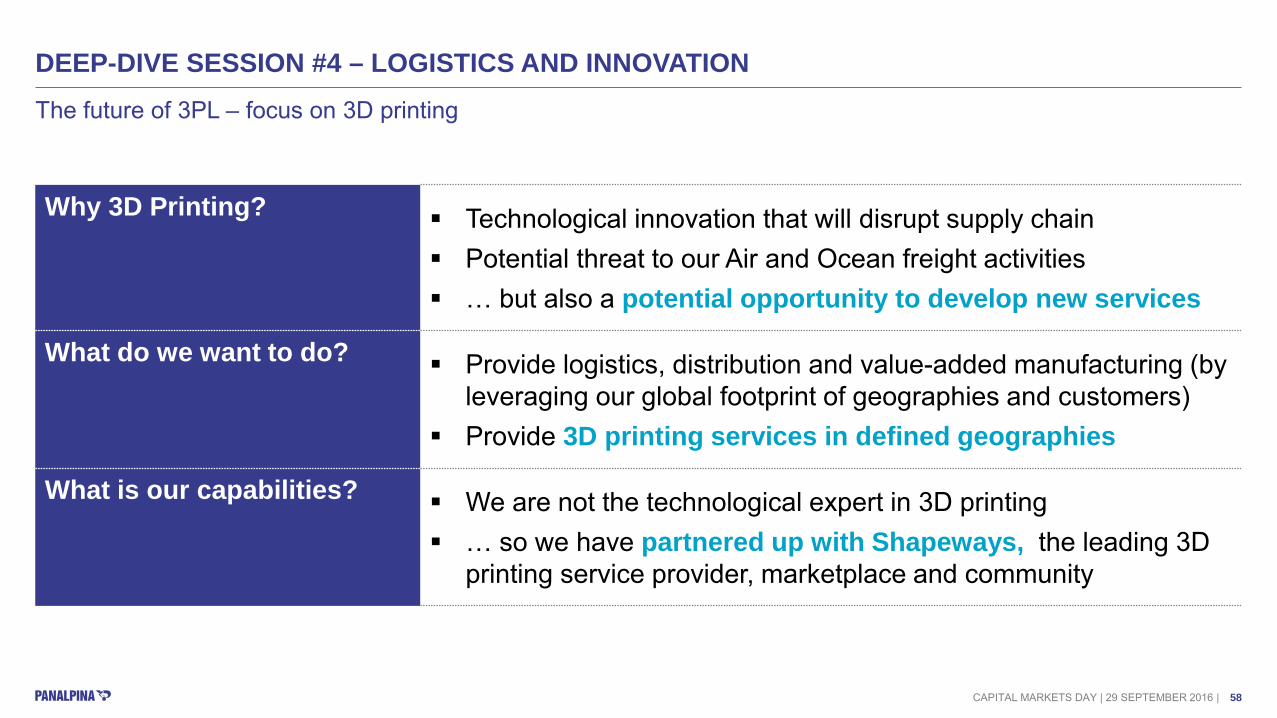
The future of 3PL – focus on 3D printing
Why 3D Printing?
Technological innovation that will disrupt supply chain Potential threat to our Air and Ocean freight activities … but also a potential opportunity to develop new services
What do we want to do?
Provide logistics, distribution and value-added manufacturing (by leveraging our global footprint of geographies and customers)
Provide 3D printing services in defined geographies
What is our capabilities?
We are not the technological expert in 3D printing … so we have partnered up with Shapeways, the leading 3D
printing service provider, marketplace and community
58

Redefining Product Creation
Peter Weijmarshausen – CEO / CO-Founder @Weijmarshausen

Bridging the gap between the digital and the physical worlds
60

Who
61

What
62

Where
63

When
64

3D Printing is Redefining Product Creation
Who
What
How
Where
When
Companies
Mass Market
Controlled
Centralized
Months
Today + Future
Individuals
Infinite tail
Networked
Localized
Hours
Historically
65


Localized 3D printers reducing environmental impact
Ever more, ever easier apps for creating products
Leading library of 3D printable consumer products
Software innovations running 3D printers more efficiently

Unboxing sensation Physical experience
Reviews & Feedback
Customization Easy Creators & API 3D model files
Social content discovery Forums & Blogs
Marketplace
Best industry grade 3D printers, materials, and
technologies.
Offer for sale Post to your followers
Spread via social media
3D printing Post production
Quality Assurance
Instant pricing 3D printability checks Tutorials & Lessons Community support
Examples of possibilities Products photos Community stories
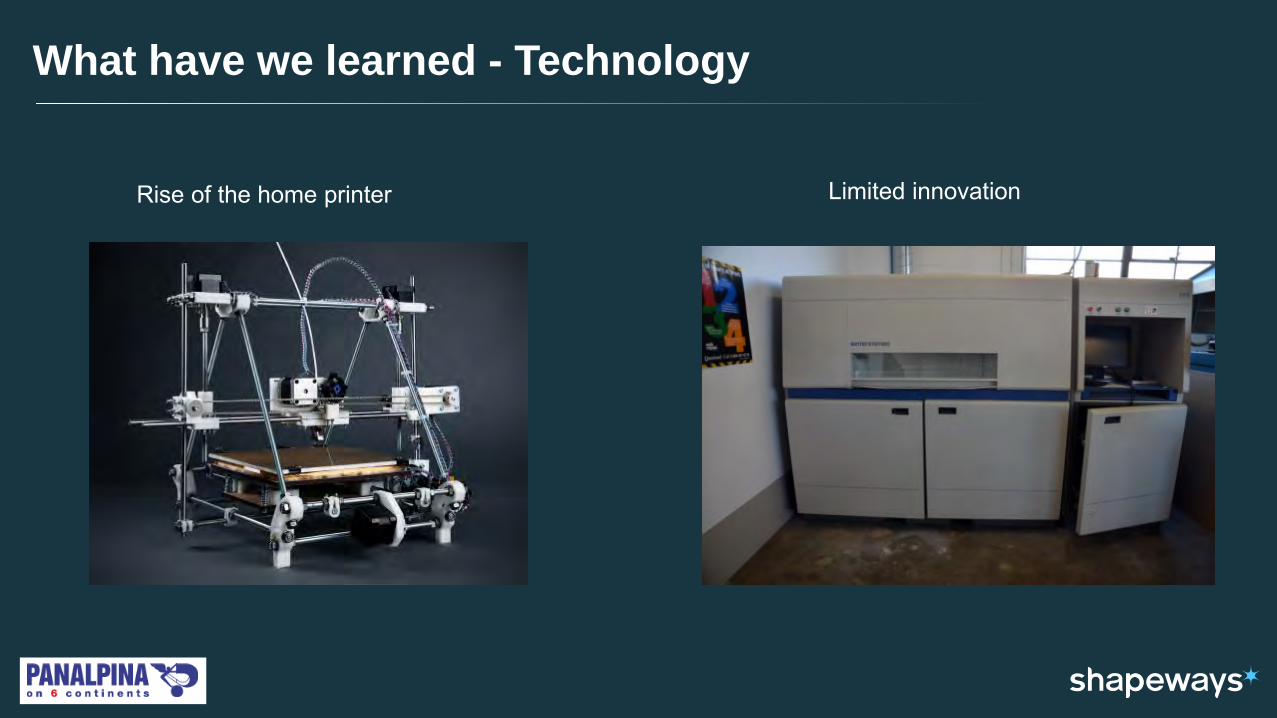
What have we learned - Technology
Rise of the home printer Limited innovation

What have we learned – Supply Chain Today: Family owned business Tomorrow: World Class Manufacturing
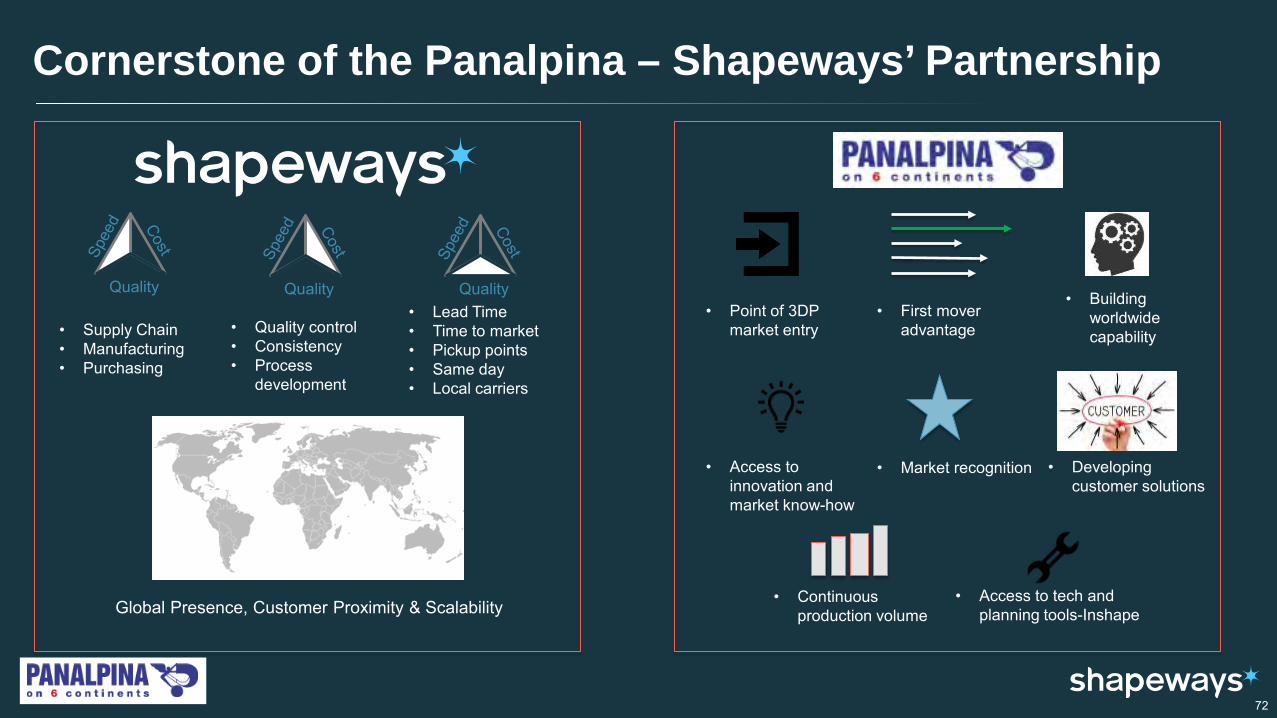
Cornerstone of the Panalpina – Shapeways’ Partnership
Quality Quality Quality • Lead Time • Time to market • Pickup points • Same day • Local carriers
• Supply Chain • Manufacturing • Purchasing
• Quality control • Consistency • Process
development
Global Presence, Customer Proximity & Scalability
• Point of 3DP market entry
• First mover advantage
• Building worldwide capability
• Access to innovation and market know-how
• Market recognition • Developing customer solutions
• Continuous production volume
• Access to tech and planning tools-Inshape
72

Innovation Center
Co-located pilot production & qualification
Co-located pilot production & qualification
Innovation Center
“Learn Locally, Scale Globally”
Roll out plan
Customers want solutions and convenience
Customers want technology and
performance
73


CAPITAL MARKETS DAY | 29 SEPTEMBER 2016 |
WRAP-UP AND CONCLUSIONS
75
100
150
200
250
2000 2002 2004 2006 2008 2010 2012 2014 2016
World GDP Ocean Freight (TEUs) Air Freight (tons)
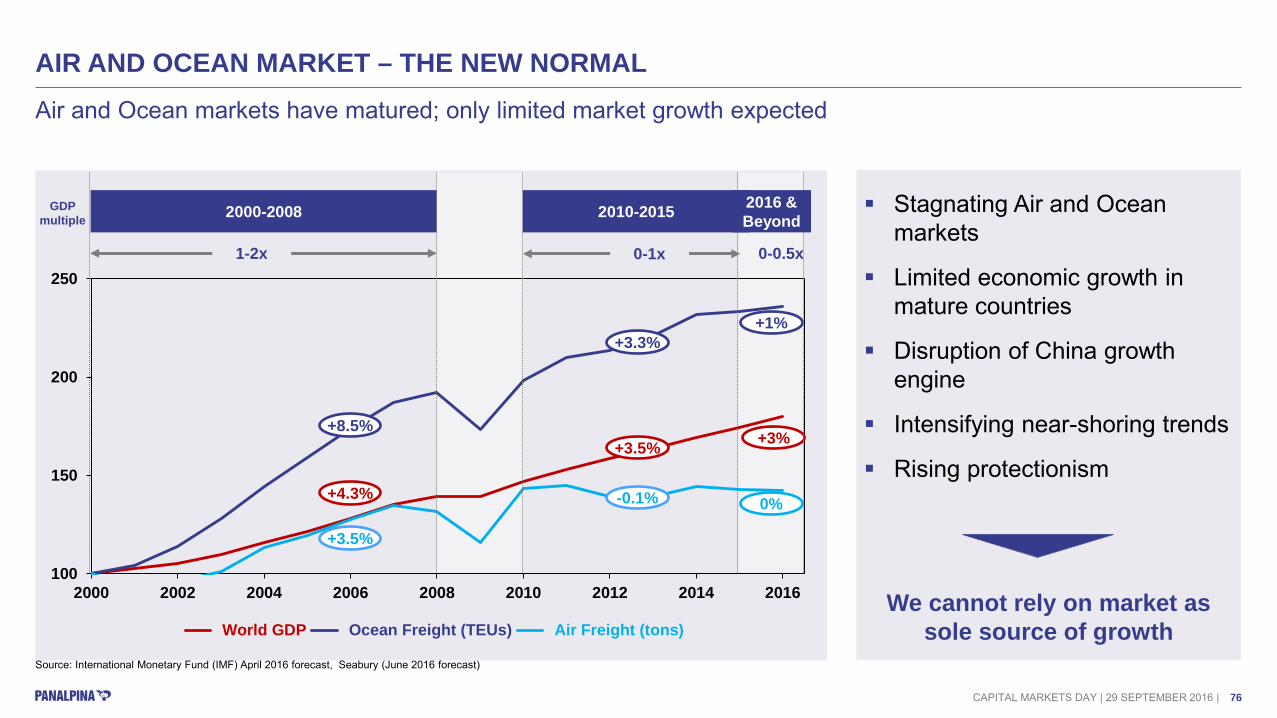
Source: International Monetary Fund (IMF) April 2016 forecast, Seabury (June 2016 forecast)
AIR AND OCEAN MARKET – THE NEW NORMAL
CAPITAL MARKETS DAY | 29 SEPTEMBER 2016 |
Air and Ocean markets have matured; only limited market growth expected
2000-2008 GDP multiple
1-2x 0-1x 0-0.5x
2010-2015
+8.5%
+4.3%
+3.5%
+3.3%
-0.1%
+3.5%
+1%
+3%
0%
Stagnating Air and Ocean markets
Limited economic growth in mature countries
Disruption of China growth engine
Intensifying near-shoring trends
Rising protectionism
We cannot rely on market as sole source of growth
2016 & Beyond
76

Growth plan
2016 OperationalImprovement
Organic External Innovation 2020
OUR AMBITIONS FOR THE COMING YEARS
CAPITAL MARKETS DAY | 29 SEPTEMBER 2016 |
EBIT increase will come from completing our operational improvement measures and executing our growth plan
EBIT bridge 2016-2020
77
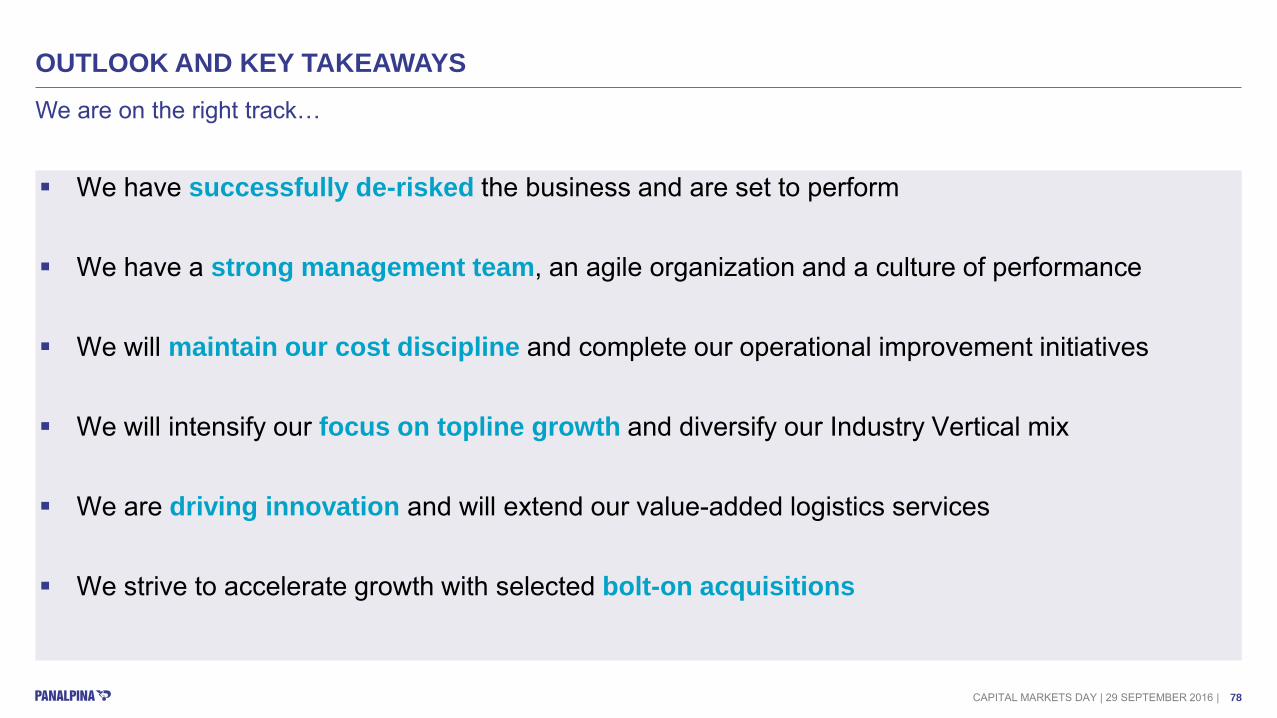
OUTLOOK AND KEY TAKEAWAYS
We have successfully de-risked the business and are set to perform
We have a strong management team, an agile organization and a culture of performance
We will maintain our cost discipline and complete our operational improvement initiatives
We will intensify our focus on topline growth and diversify our Industry Vertical mix
We are driving innovation and will extend our value-added logistics services
We strive to accelerate growth with selected bolt-on acquisitions
CAPITAL MARKETS DAY | 29 SEPTEMBER 2016 |
We are on the right track…
78

CAPITAL MARKETS DAY | 29 SEPTEMBER 2016 |
THANK YOU! NEXT RESULTS: NINE-MONTHS RESULTS ON OCTOBER 25, 2016
79

DISCLAIMER
Investing in the shares of Panalpina World Transport Holding Ltd involves risks. Prospective investors are strongly requested to consult their investment advisors and tax advisors prior to investing in shares of Panalpina World Transport Holding Ltd.
This document contains forward-looking statements which involve risks and uncertainties. These statements may be identified by such words as “may”, “plans”, “expects”, “believes” and similar expressions, or by their context. These statements are made on the basis of current knowledge and assumptions. Various factors could cause actual future results, performance or events to differ materially from those described in these statements. No obligation is assumed to update any forward-looking statements. Potential risks and uncertainties include such factors as general economic conditions, foreign exchange fluctuations, competitive product and pricing pressures and regulatory developments.
The information contained in this document has not been independently verified and no representation or warranty, express or implied, is made to, and no reliance should be placed on, the fairness, accuracy, completeness or correctness of the information or opinions contained herein. The information in this presentation is subject to change without notice, it may be incomplete or condensed, and it may not contain all material information concerning the Panalpina Group. None of Panalpina World Transport Holding Ltd or their respective affiliates shall have any liability whatsoever for any loss whatsoever arising from any use of this document, or its content, or otherwise arising in connection with this document.
This document does not constitute, or form part of, an offer to sell or a solicitation of an offer to purchase any shares and neither it nor any part of it shall form the basis of, or be relied upon in connection with, any contract or commitment whatsoever. This information does neither constitute an offer to buy shares of Panalpina World Transport Holding Ltd nor a prospectus within the meaning of the applicable Swiss law.
CAPITAL MARKETS DAY | 29 SEPTEMBER 2016 | 80