Embed Size (px)
Citation preview

Capital Market Line (CML) 31 December 2010
PineBridge Investments Global Asset Allocation Team
MICHAEL J. KELLY, CFA Managing Director Global Head of Asset Allocation & Structured Equities +1 646.857.8156 [email protected] MAGALI AZEMA-BARAC.PhD. CFA Managing Director, Head of Investment Strategies, Research and Development +61 2 9969 9949 [email protected] TATSUSHI MAENO, CFA Vice President, Balanced Accounts +81 3 52085843 [email protected] PETER HU, CFA Vice President, Sr. Analyst, Asset Allocation + 1 646.857.8155 [email protected] CHRIS DELANEY Analyst, Asset Allocation +1 646.857.8154 [email protected]

Capital Market Line
TABLE OF CONTENTS
I. EXECUTIVE SUMMARY ................................................................................................................. 3 ABOUT THE CAPITAL MARKET LINE ............................................................................................... 6
INSIGHTS FROM TODAY’S CML ...................................................................................................... 8
THE CONVICTIONS DRIVING OUR CML REFLECT .......................................................................10
II. ASSET CLASS UPDATES ...........................................................................................................12 EQUITY .............................................................................................................................................13
FIXED INCOME ................................................................................................................................15
CURRENCY ......................................................................................................................................18
ALTERNATIVES ................................................................................................................................19
INDICES THAT THE FORECASTS PERTAIN TO .............................................................................22
Note: A unabridged report that explores in greater detail the models and assumptions is available by visiting www.pinebridge.com/commentary. Importantly, the full report also shows CML’s from different investor’s perspectives, as risk return is different from a USD investor’s perspective, than from a EURO, Yen, or AUD perspective. Finally, the full report shows each of these perspectives, both hedged and unhedged.
2

Capital Market Line
I. Executive Summary
3

Capital Market Line
CAPITAL MARKET LINE AS OF 12/31/2010 (LOCAL CURRENCY)
Dot Size: Depicts the degree of correlation of the asset class to most others. Large dots are more correlated with most others. Color: Shows liquidity of the asset class. Green is the most liquid, orange may be less liquid in times of market stress, and red represents the least liquid.
4

Capital Market Line
CAPITAL MARKET LINE AS OF 12/31/2010 (USD VIEW: UNHEDGED)
5

Capital Market Line
ABOUT THE CAPITAL MARKET LINE
The Capital Market Line (CML) is a tool developed and maintained by PineBridge’s Global Asset Allocation team. It has served as the team’s key decision-support tool in the management of many of our asset allocation products. In recent years, it has also been introduced into the Global Asset Allocation Committee to provide a common language for discussion across asset classes. It is not intended to represent the return prospects of any PineBridge products, only the attractiveness of asset class indices, compared across the capital markets. The CML quantifies several key fundamental judgments per asset class, which when combined with current pricing, results in our annualized expected return forecast for that asset class over the next five years. These are compared to our view of the asset class’ risk, as defined by volatility. Together, these risk/return parameters per asset class form our CML. The key drivers of the CML are top-down judgments, made by the Global Asset Allocation team, about the fundamentals it believes to be the largest determinants of each asset class’ returns over time. While top-down, these judgments are influenced by the interactions and debates with our bottom-up asset class specialists and Global Asset Allocation Committee, thus benefiting from PineBridge’s multi-asset class, multi-geographic platform. The models themselves are intentionally simple to focus attention and facilitate a transparent and inclusive debate on the key drivers for each asset class. The slope of the CML indicates the risk/return profile of the capital markets. In most instances, the CML slopes upward and to the right, indicating a positive expected relationship between return and risk. However, our CML has, at times, become inverted (as it did in 2007), sloping downward from the upper left to the lower right, indicating risk-seeking capital markets that were not adequately compensating investors for risk.We believe that the asset classes that lie near the line are close to fair value. Asset classes well above the line are attractive (over an intermediate-term perspective) and those well beneath the line are deemed unattractive. We have been utilizing this approach for quite some time, and have learned that, if our judgments are reasonably accurate, then asset classes likely will converge most of the way towards fair value much sooner than the 5 year forecasts upon which the CML is built. Usually, most of this convergence happens over one to two years. This matches up well with our preferred intermediate-term perspective in making asset allocation decisions.
6

Capital Market Line
EXPECTED ANNUALIZED RETURNS OVER NEXT 5 YEARS
Note: The table to the left expresses returns as if currencies are frozen at today’s levels. To view returns that account for future currency movements, see the tables in the full report. CML’s are produced from a USD, EUR, Yen, and AUD perspectives. Each of the currency perspectives also constructs a CML in both currencies unhedged, and fully hedged using today’s currency forward curves.
7

Capital Market Line
INSIGHTS FROM TODAY’S CML
At the time of our last publication, expected returns for government securities were quite low. One of the major messages from that very steep third quarter CML, was the high risk embodied in the so-called “risk free rate.” As a result of the lagged effects of policy actions intended to help us out of the Great Recession, the secular trend towards disinflation in developed economies has likely come to an end. At the same time, many emerging economies are showing early signs of overheating. In total, we have probably just witnessed the end of a massive, 30-year bull market in US Treasuries. Even after the government bond sell-off that occurred during the fourth quarter of 2010, which was accompanied by a rally in risk assets, today’s CML still remains quite steep, even if a bit less so. Since the beginning of the market recovery in early 2009, we have used the language ‘moving out’ to describe the unfolding pattern of how our CML was evolving. With memories of the Financial Crisis still top-of-mind, a lingering crisis of investor confidence resulted in tremendous liquidity still huddling in the less risky and more liquid asset classes, but gradually shifting out on the CML curve to embrace the next most risky asset class as confidence was restored. Credit was first to benefit, when private funds began ‘moving out’ of overnight USD’s seeking higher returns, yet still within asset classes perceived to be safe. The reluctance to let go of this capital preservation mode has resulted in today’s unusual shape. During the fourth quarter, double dip fears faded and safe haven money finally began rotating out the curve more aggressively. Yet, judging by the enourmous size of capital preservation orientated flows that preceeded this rotation, much more lies ahead. With respect to ‘moving out’, the liquid US equities and commodities asset classes were next in line. Today’s shape still depicts several expected decouplings. Financial assets, whether risk or risk-free orientated, have been highly correlated since 1980. Yet, with disinflation over, these will tend to now go more their separate ways. Also, both developed and emerging stock markets have seen nearly equivalent P/E compression, compared to pre-crisis levels. While growth and profitability is likely to be impaired this cycle in developed markets (delevering, re-regulation, etc.), we expect most emerging markets to experience growth and profitability similar to their previous cycle. Thus EM equities should recoup most of their prior cycle’s P/E’s, but developed markets are not expected to. Such decoupling will require further progress towards global rebalancing. EM currency appreciation remains one of the important enablers. It will help EM economies, which are currently “too hot,” not to run out of slack too early in this business expansion. DM economies need to grow faster to service their debt loads without the need to curtail their imports from EM countries. A new currency regime between largely floating DM currencies, and largely EM managed floats may be necessary to facilitate global rebalancing.
8

Capital Market Line
As an early warning sign that more global rebalancing is required, inflation spiked quite early in many EM expansions. The slow pace of Chinese renmimbi (RMB) appreciation remains a source of global risk. Other EM currencies moved sharply higher in 2010 and will now stand in protest until the RMB catches up. We’re hopeful that the RMB will appreciate at a 6% to 8% pace in 2011, with some front-loading. An overall upward revaluation of EM will be a multi-year process. Yet we expect enough begruding progress to contain EM inflationary pressures, thus relieving deflationary DM pressures and contributing towards their reflation. In alternatives, the unwillingness of post-Financial Crisis investors to increase allocations to investments in the alternatives asset class is resulting in a restoration of their liquidity premiums. While much repricing has occurred, correlation benefits have less appeal today than the desire to remain flexible. As such, more repricing could lie ahead.
9

Capital Market Line
THE CONVICTIONS DRIVING OUR CML REFLECT:
Our belief is that developed market (DM) de-leveraging, de-risking and re-regulation will slow from here, but still continue for several more years, even if at the expense of profitability and growth. Global growth will motor through, however, with the major drivers shifting from developed market consumption to emerging market self-generated growth. The latter will entail infrastructure build-outs, a gradual emergence of new and enormous middle classes, and policy reorientations away from over-reliance on exporting, towards more emphasis on domestic consumption. Gradual, yet elongated, fiscal and monetary restraint will eventually act as headwinds in many economies and markets, particularly in those countries (mostly developed economies) that used expansionary policies most aggressively to find their way out of the Great Recession. Investors as a group are apolitical, and tend to vote for accomodative policy when economies are well below their normal operating rates, and for restraint when economies move above normal operating metrics. The European Sovereign crisis pulled forward fiscal austerity, prematurely in the eyes of investors. Most of the European continent remains both an income statement and balance sheet work-out. These will take quite some time to fix. The prospect of eventual “haircuts” on peripheral European sovereign debt will make it difficult for these countries to fund growth in the interim, and possibly for some “penalty box” period after such “haircuts” as well. Most economic cycles have had at least one region sitting out the global expansion (Latin America in the mid-late 1980’s, Japan’s lost decade, 1998 Asian Financial Crisis). Yet, these regional mishaps have not resulted in the short-circuiting of the global expansion. Global growth continued, pulled along by the large growth engine that existed in the US Economy. We believe that, while Europe’s troubles will continue, this will not short circuit today’s global expansion. China, India, and Brazil are now large and successful enough to pull global growth. The BRIC’s, not Greece or European sovereign debt issues, will set the tone for other economies and markets. The successful emerging economies are now large enough to create self-generated growth, and to pull along the world’s. Despite a lack of success in gatherings such as the G20, global rebalancing is of greater mutual interest than a return to protectionism. We believe that just enough EM currency realignment (strength) will happen (in the managed floats and pegged currencies) to keep the EM camp away from being “too hot” while the DM camp is kept away from being “too cold”. Despite today’s deflationary tone in developed countries, and a sudden burst of inflation in emerging ones, a path back towards just barely enough global cooperation is likely only in that it’s a matter of mutual self interest. Given such a delicate balance, uncertainty will only fade slowly. We have been in a high volatility and correlation period. These should slowly recede with success in global rebalancing and as economic growth moves us further away from the Great Recession.
10

Capital Market Line
While it will take time, liquidity preferences and risk premiums will move back towards ‘typical’ levels as we get further away from the Financial Crisis. Differentiated exit strategies (monetary and fiscal), will create differentiated regional financial market performances.
11

Capital Market Line
II. Asset Class Updates
12

Capital Market Line
EQUITY
We continue to expect that developed equity ROE and growth will lag their historical levels as a result of headwinds lingering from the Financial Crisis (more regulation, higher taxes), while emerging equity ROE and growth are likely to be on par with last cycle’s norm. Our numbers for developed economies have moved up very slightly since mid-year, when double dip risks appeared higher than they do now. Developed economy policies continue to be geared towards de-risking the environment, even if at the expense of profitability and growth. Therefore, today’s high volatility regime in the developed markets should eventually converge back towards more normal levels. However in Europe, we assume volatility will remain slightly above long-term averages. Its slow moving sovereign debt restructuring will continue to pose elevated risks to their business cycle. Emerging economies have stronger balance sheets to finance their current cycle’s growth than last cycle’s. They are attempting to steer policy towards self generated growth (infrastructure, emphasizing less export dependance/more domestic consumption). The EM middle income consumer will continue to grow at a rapid rate, which is this decade’s number one investment theme. Yet, most EM managed floats (or pegs) have not adjusted fast enough to pre-empt their own inflationary pressures. Inflation is likely to stay a bit higher than we previously assumed within EM and, as a result, we lowered, very slightly, our P/E expectations. Despite this, we still expect EM P/E’s to climb most of the way back towards pre-Financial Crisis levels even though we do not expect the same for the P/E’s of most developed markets. Professor Kenneth Rogoff of Harvard University argues that, empirically speaking, in the wake of prior Financial Crisis’s, (1) debt/GDP tends to rise for several subsequent years, and (2) slower secular GDP growth unfolds if debt/GDP goes beyond a 90% tipping point. Europe is right on this edge. Austerity policy is best aimed into overheating economies. Europe is the region that has recovered the least, but is politically on course for the most severe pull-back of fiscal policy. Should this slow its growth too much, it could then push Europe over the edge into a slower secular growth mode until after its peripheral sovereign debt has been restructured and until after a sufficiently long penalty box period occurs before capital is willing to return to the region without onerous conditions. In contrast, as the US approaches this 90% tipping point, policy there is attempting to grow its way out of its debt load via QEII, as well as the cessation of an US $800 billion+tax increase. Should this create sustainable growth, which looks to be happening, this would then lower the risk of being forced into a slower growth mode. However, at the same time, this raises this cycle’s inflationary risks. Therefore, today’s accomodative policy will still need to be paid for down the road with tighter monetary and fiscal policies. Such tighter, future money, will serve to restore real interest rates and thus to keep P/E’s below last cycle’s levels. Japan remains a contrast between its stagnant internal dynamics caused by its demographic shock and its exposure to rapidly growing Asian neighbors. China may be crossing the Lewisian Turning
13

Capital Market Line
Point, where developing countries' industrial wages begin to rise quickly, enabling a rapid expansion of their middle class and domestic consumption. As the largest exporter to China, Japan stands to benefit. Also, Japan’s deflationary prone economy would also benefit from inflationary forces brought in from their Asian imports. We have raised ever so slightly Japan’s inflation and JGB targets. We may, in subsequent periods, have to lower this country’s P/E target as a result (while raising its growth rate), but chose not to do so at this point. Emerging Asia is well positioned for continued growth over the next cycle. As a result of de-levering (post its own 1998 Financial Crisis) ROE’s did not keep up with Asia’s rising ROA’s. These are now expected to rise more in lock-step. The largest challenge ahead is reducing the region’s over-reliance on exports and fostering more balance in domestic consumption. This will take considerable time, yet markets are about change on the margin and will discount visible and credible trends in advance. We believe the EMEA region’s fundamentals are being pulled in different directions. Depressing the region will be its link to developed Europe. However, we see this offset with its exposure to the strong energy environment ahead in the Middle East and Russia. In Latin America, ROE stands on the high side of its very long-term historical average. This is consistent with our belief in a strong commodity cycle. Policy success has also helped mitigate these economies away from their prior boom and bust cycles. Funding has changed from external reliance to internal capability. The integration of exchanges in the Andes countries (Chile, Peru, Columbia) next year, should raise liquidity and reduce volatility. Since LatAm’s mid-80’s defaults, credit has not been readily available to the region, which has restrained growth. Now, with much more credible finances, financial flows into the region are back, which will facilitate faster and sturdier growth.
14

Capital Market Line
FIXED INCOME
Beyond the reach of QEII, the long end of the US Treasury yield curve has by now priced in a future scenario much closer to what we have been assuming based on modest reflation and real interest rates that are restored to historic norms. From 10 years inward, upward ratcheting of yields still needs to occur, likely in the second half of 2011. Such instruments dominate most fixed income benchmarks, so duration will continue to drag many traditional industry products for some time to come. While floating rate instruments, such as bank loans, have been unpopular, they are now beginning to be seen as a way to benefit from an upward trend in shorter rates. This while avoiding potential (and by now widely feared) further deterioration in fixed maturity instruments. US TREASURY YIELD CURVE AS OF 12/31/2010
Most developed market sovereign instruments have little potential room for credit upgrades. While their credit quality looks poised to cyclically recover, this should be seen in the context of continued structural deterioration. This seems likely as the aging of these societies retirement and healtcare safety nets swell government spending. The tremendous growth of monetary bases during the
15

Capital Market Line
financial crisis will not easily be reversed. As they are addressed, we expect most sovereign yields to continue rising. Servicing today’s debt loads will be that much tougher with higher rates. Emerging market sovereign and corporate debt looks poised for continued structural upgrading. Begrudgingly, more flexible EM currencies will also help to rebalance inflationary pressures by spreading them away from EM towards DM. Appreciating emerging market currencies will make EM’s local currency debt more attractive than the more commonly issued USD and EUR denominated EM debt. Locally issued EM debt is also of shorter duration, which will also be a benefit in the rising rate environement that we forsee. Euro area sovereign debt problems are not short-term liquidity issues. These solvency questions will linger well into our 5-year CML horizon. While our main scenario is survival of the euro, this does not have to occur in its present form. After 2011’s massive refinancing bulge, “haircuts” on sovereign exposures will likely be addressed in 2012 to 2013. The size of these “haircuts” will also determine the magnitude and mechanism by which core euro countries like Germany will provide financial support to the structurally weaker peripheral countries. To the degree they do, Bund yields should converge upward to the level of the hypothetical E-Bond yield. With the austere Germany in the driver seat, we do not see inflation being as much of a threat within Europe as in the US. German real yields were high for an extended period following Germany’s reunification, as they pulled back that excess liquidity. Given the German anchor, the ECB will not have as big of a monetary pullback in the years ahead as the Fed. Therefore, its real interest rates do not have to average at higher levels than they did last cycle. We do presume that US real yields will have to average at a higher level once QEII begins to be reined in. Credit spreads are still a bit above their historic averages, yet are only attractive in comparison to developed sovereign debt, which by and large, are still very overvalued. Consensus expectations for most fixed maturity returns have been skewed and distorted by the tailwind from the 30 year bull market in duration (see chart below). Inflation and, therefore, yield curves are still likely to back up more over our five-year horizon. Most credit spreads are not wide enough offsets to produce attractive total returns. Within credit, we believe financials still appear quite attractive. These spreads appear wide, especially when considering that policy will continue forcing many of these credits to de-risk with higher required capital retention in the years immediately ahead
16

Capital Market Line
30 YEAR BULL MARKET DISTORTING TODAY’S EXPECTATIONS
QE II aims to end disinflation
Unprecedented 30 yr bull market
Source: Board of Governors of the Federal Reserve System
17

Capital Market Line
CURRENCY
Among the developed market currencies, either Europe’s austerity or the US’s Keynseism approach will prove more successful in restoring growth. This will be the main driver of the dollar/euro exchange rate over a several year period. We see the dollar as undervalued versus the euro over this time horizon. However, the major currency issue of the day is that most movements historically took place between the core country currencies, with peripheral country currencies not adjusting to the same extent. This was a non-issue when what are still called emerging or peripheral countries were small in comparison to what are still called developed, or core countries. Adjustment between these two cohorts still took place. First by peripheral currencies adjusting their pegs to core currency and then in more modern times by managing their floats versus core currencies. Yet, the more successful peripheral countries have emerged and, based upon their sizes and growth rates, are already part of the economically relevant core. Given these changing relationships, a new regime between developed (currently core) and emerging (still acting as peripheral from an FX perspective) is likely to be come about. We believe it will pay to own EM currencies during this transition. The RMB looks poised to begin a slow, yet eventually meaningful, appreciation over time versus a basket of developed currencies. This will provide space for other EM currencies to reboot their appreciations vs. DM currencies. DM investors in EM equity have always invested in local EM currencies un-hedged and will now enjoy an added 1% to 2% per year over time. In contrast, most DM fixed income investors have made their EM fixed income investments in USD or EUR denominated issuance. They should now consider local currency denominated EM fixed income. This will expose them to more volatile instruments, due to currency volatility. Yet in a low return environment for fixed income, this extra risk/return will be worthwhile in our view.
18
Capital Market Line
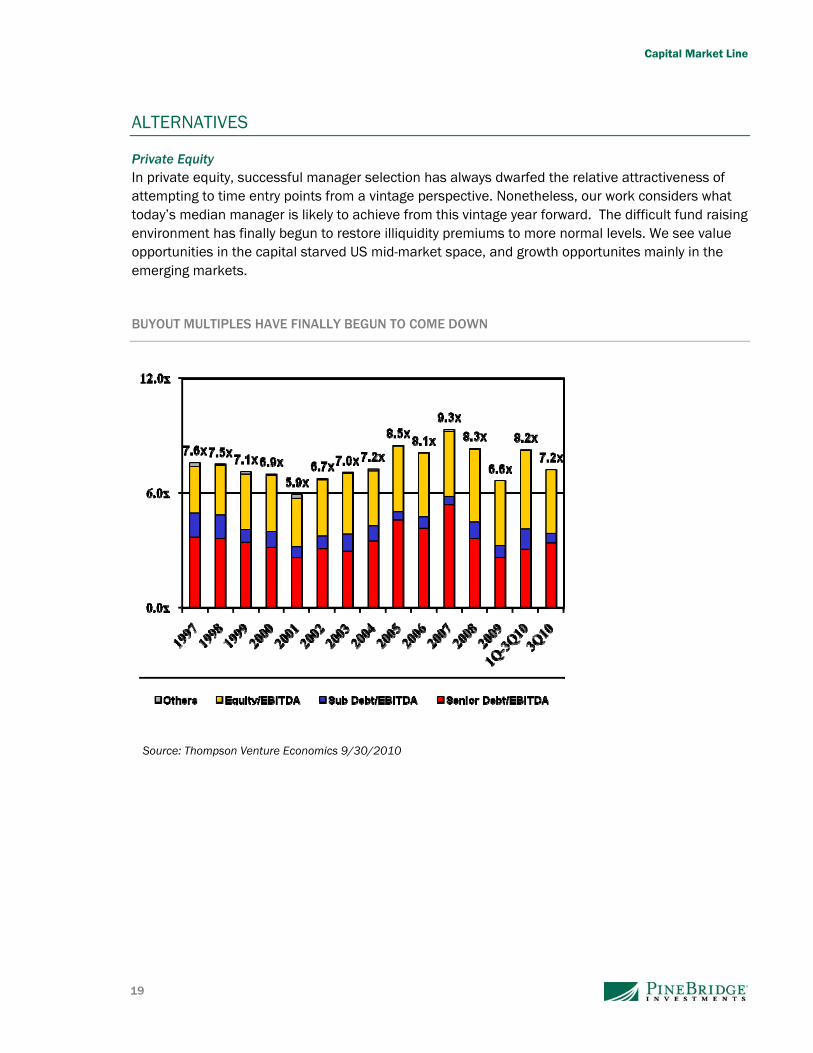
ALTERNATIVES
Private Equity In private equity, successful manager selection has always dwarfed the relative attractiveness of attempting to time entry points from a vintage perspective. Nonetheless, our work considers what today’s median manager is likely to achieve from this vintage year forward. The difficult fund raising environment has finally begun to restore illiquidity premiums to more normal levels. We see value opportunities in the capital starved US mid-market space, and growth opportunites mainly in the emerging markets. BUYOUT MULTIPLES HAVE FINALLY BEGUN TO COME DOWN
Source: Thompson Venture Economics 9/30/2010
19

Capital Market Line
Hedge Funds As a universe, there is a structural net long residual beta in most hedge fund indices. They perform best in periods in which higher risk assets, like equities, high yield, etc. perform well and where risk spreads (credit, M&A, etc) narrow. We expect such beta orientated risks to do well over our investment horizon. Therefore, despite a mediocre 2010, the environment seems conducive to better results over the next few years. The Volcker rule is leading to less proprietary trading inside the world’s largest and most systemically important financial institutions. This is boosting the talent pool available to hedge funds while removing much of the capital these institutions put behind their proprietary activities.
Real Estate Our real estate model and expected returns deal only with US Commercial real estate. Transaction volumes have remained constrained and capitalization rates (as quoted by RCA Analytics) are still not as high as one would expect. Yet, net absorption of US commercial real estate just went positive and the worse is likely behind us. While a wall of refinancing, and risk, still lies ahead – liquidity is trickling back, aided by the CMBS market.
20

Capital Market Line
Commodity Index Futures EM remains focused on infrastructure spending. A country’s infrastructure build-out phase is the most commodity intensive stage of economic life. Such periods often persist for some time and often more than one economic cycle. In addition, the emergence of middle classes in the hot frontier countries like Indonesia, Philippine and Vietnam, as well as BRICS, has resulted in a shortage of agricultural commodities. As a result, this cycle (like the last one) should witness high and rising commodity prices. Given the predominance of energy weightings in most commodity indices, the reaction function of OPEC to oil over US $100/barrel will be a key issue for commodity futures. We would expect to see OPEC supply creeping back as prices rise above this level.
21

Capital Market Line
INDICES THAT THE FORECASTS PERTAIN TO
Equities US Equity: MSCI USA Index
Europe Equity: MSCI Europe Index
Japan Equity: MSCI Japan Index
ISC: MSCI All Country World ex-USA Index
EM Equity: MCSI Emerging Markets Index
EM Asia Equity: MSCI Emerging Markets Asia Index
EM EMEA Equity: MSCI Europe, Middle East and Africa Index
EM Latam: MSCI Latin America Index
Fixed Income 3 Month Treasury: US 3 month Treasury Bill
5-7 year Treasuries: Barclays Capital U.S. Government 5-7 Year Bond Index
US Core: Barclays Capital US Aggregate Bond Index
Inter Corp: Barclays Capital Intermediate Corporate Bond Index
US High Yield: Barclays Capital US Corporate High Yield Bond Index
Long Credit: Barclays Capital US Long Credit Bond Index
Muni: Barclays Capital 8-12 Year Municipal Bond Index
TIPS: Barclays Capital US Treasury: US TIPS Index
JGB: Barclays Capital Asian-Pacific Japan Treasury Index
Bund: Barclays Capital Euro Aggregate Treasury Germany
EM Corporate: JP Morgan Corporate Emerging Markets Bond Index (CEMBI) Broad Diversified
EM Sovereign: JP Morgan Emerging Markets Bond Plus Index (EMBI+)
EM Local Currency: JP Morgan Government Bond Index - Emerging Markets Diversified
Bank Loans: S&P/LSTA Leveraged Loan Index
Alternatives Fund of Hedge Funds: HFRI FOF Index
Private Equity: Thompson Venture Economics - Pooled internal rate of return of all US Private Equity funds that report returns to Thompson Venture Economics.
Commodities: DJUBS Index
Real Estate: National Council of Real Estate Investment Fiduciaries (NCREIF) Index
22

Capital Market Line
Disclosure Statement
PineBridge Investments is a group of international companies acquired by Pacific Century Group from American International Group, Inc. in March 2010. PineBridge companies provide investment advice and market asset management products and services to clients around the world.
PineBridge Investments is a service mark proprietary to PineBridge Investments IP Holding Company Limited. Services and products are provided by one or more affiliates of PineBridge Investments. Certain middle and back office functions incidental to the services and products provided by PineBridge Investments and its affiliates may be outsourced to third parties.
Readership: This document is intended solely for the addressee(s). Its content may be legally privileged and/or confidential.
Opinions: Any opinions expressed in this document may be subject to change without notice. We are not soliciting or recommending any action based on this material.
Risk Warning: Past performance is not indicative of future results. Our investment management services relate to a variety of investments, each of which can fluctuate in value. The value of portfolios we manage may fall as well as rise, and the investor may not get back the full amount originally invested. The investment risks vary between different types of instruments. For example, for investments involving exposure to a currency other than that in which the portfolio is denominated, changes in the rate of exchange may cause the value of investments, and consequently the value of the portfolio, to go up or down. In the case of a higher volatility portfolio the loss on realization or cancellation may be very high (including total loss of investment), as the value of such an investment may fall suddenly and substantially.
In making an investment decision, prospective investors must rely on their own examination of the merits and risks involved.
Unless otherwise noted, all information contained herein is sourced from PineBridge Investments internal data.
The content included herein has been shared with various in-house departments within the member companies of PineBridge Investments, in the ordinary course of completion. All PineBridge Investments member companies comply with the confidentiality requirements of their respective jurisdictions.
Parts of this presentation may be based on information received from sources we consider reliable. We do not represent that all of this information is accurate or complete, however, and it may not be relied upon as such.
PineBridge Investments Europe Limited is authorised and regulated by the Financial Services Authority ("FSA"). In the UK this communication is a financial promotion solely intended for professional clients as defined in the FSA Handbook and has been approved by PineBridge Investments Europe Limited.
Approved by PineBridge Investments Ireland Limited. This entity is authorised and regulated by the Central Bank of Ireland.
In Australia, this document is intended for a limited number of wholesale clients as such term is defined in chapter 7 of the Corporations Act 2001 (CTH). The entity receiving this
23

Capital Market Line
24
document represents that if it is in Australia, it is a wholesale client and it will not distribute this document to any other person whether in or outside of Australia.
In Hong Kong, in relation to collective investment schemes which are subject to the Advertising Guidelines Applicable to Collective Investment Schemes Authorized under the Product Codes issued by the Securities and Futures Commission (SFC), the issuer of this document is PineBridge Investments Hong Kong Limited, licensed and regulated by the SFC. It has not been reviewed by the SFC.
PineBridge Investments Singapore Limited is licensed and regulated by the Monetary Authority of Singapore (the”MAS”). In Singapore, this material is intended for an institutional investor as defined in Section 4A of the Securities and Futures Act (Chapter289). This material is not reviewed or endorsed by the MAS.
PineBridge Investments Middle East Limited is regulated by the Dubai Financial Services Authority. When being offered by PineBridge Investments Middle East Limited this document is intended for Professional Clients only and no other person should act upon it. The financial products and services to which this material relates will only be made available to persons who meet the regulatory criteria to be treated as Professional Clients of PineBridge Investments Middle East Limited.
Rev November 29, 2010
PineBridge Investments Web Address: www. pinebridge.com