Embed Size (px)
Citation preview

I X F f c o t & t d
Capital Market Developments
F e b r u a r y 3 , 1 9 7 5
Prepared by the CAPITAL MARKETS SECTION in conjunction with the MORTGAGE, AGRICULTURAL, and CONSUMER FINANCE SECTION
DIVISION OF RESEARCH AND STATISTICS
BOARD OF GOVERNORS F E D E R A L RESERVE SYSTEM Washington, D.C. 20551
Digitized for FRASER http://fraser.stlouisfed.org/ Federal Reserve Bank of St. Louis

Index
T A B L E S
1 - 6 S E C U R I T Y V O L U M E A N D Y I E L D S
7, 8 S T O C K M A R K E T AND S E C U R I T Y C R E D I T
9 - 1 6 M O R T G A G E M A R K E T
SYMBOLS
e ESTIMATE P PRELIMINARY r REVISED n.a. NOT AVAILABLE
DATA DO NOT EXIST
Digitized for FRASER http://fraser.stlouisfed.org/ Federal Reserve Bank of St. Louis

T a b l e 1
YIELDS, VOLUME AND RECEPTION 3
CORPORATE BOND MARKET
YIELDS VOLUME WEEK ENDING NEW ISSUE 1 RECENTLY 2 G R O S S 3 P E R C E N T N E W I S S U E S 4
A a a UTILITY O F F E R E D O F F E R I N G S SOLD BY END IN SYNDICATE A a a UTILITY ( $ MILLIONS) O F WEEK ( $ MILLIONS)
1974 - Dec. 6 9 .50 9 .39 676 93 171 13 9 .59 9 .57 925 85 175 20 9 .52 9 .59 605 92 178 27 — 9 . 6 4 — — 177
1975 - Jan. 3 9 .67 mm — — — 163 10 9.62 9.45 699 98 14 17 9 .38 9 .55 l , 4 9 4 r 96 174 24 9 .45 9 . 4 7 r 474 92 130 31 9.00p 9.30p 890 93 95
MUNICIPAL BOND MARKET
YIELDS VOLUME WEEK ENDING M O O D Y ' S B O N D BUYER G R O S S 3 PER C E N T N E W I S S U E S 4
NEW ISSUE 2 Q - B O N D O F F E R I N G S S O L D BY END IN SYNDICATE INDEX ( $ MILLIONS) O F W E E K ( $ MILLIONS)
1974 - Dec. 6 6 . 4 0 6 . 8 9 569 90 167 13 6 . 8 0 7 .15 441 80 167 20 6 . 7 0 7 .08 290 89 140 27 6 . 7 0 7 .08 27 91 122
1975 - Jan. 3 6 . 7 0 7 .08 26 66 117 10 6 . 6 0 6 . 9 9 500 92 75 17 6 . 5 5 6 . 9 0 410 84 88 24 6 .10 6 .59 361 84 66 31 6 . 0 0 6 .54 667 95 48
NOTES:
1 Federal Reserve series of implied yield on newly issued, Aaa-rated utility bond with 5-year call protection.
2 Federal Reserve series of implied free-market yield on competitively bid Aaa-rated utility bond with 5-year call protection, released from price restrictions sometime during the last four weeks.
3 Estimated by F.R. on the basis of available data.
4 Corporate Market: Salomon Brothers Bond Market Roundup; Municipal Market: Weekly Bond Buyer. Data are adjusted by Federal Reserve when necessary to make coverage of this series consistent with the gross offerings series.
Digitized for FRASER http://fraser.stlouisfed.org/ Federal Reserve Bank of St. Louis

T a b l e 2
HIGH GRADE BOND YIELDS
DATE 1
NEW I S S U E A a a UTILITY
RECENTLY OFFERED j A a a UTILITY j
3 MOODY'S ' S E A S O N E D
C O R P O R A T E A a a U .S . GOVT. 20-YEAR 4
C O N S T A N T MATURITY BOND BUV'ER 5
2 0 - B O N D INDEX
1970 - High 9 .43 (6 /19) 9. 20 (6 /26) 8 .60 ( 7 / 3 ) 7. 55 (5 /29) 7.12 (5/5:8) Low 7.72 (12/11) 8. 16 (12/18) 7 .48 (12/21) 6. 17 (12/18) 5 .33 (12 /10)
1971 - High 8 .26 (7 /30) 8 . 23 ( 1 / 1 ) 7 .71 (8 /21) 6. ,51 (6 /18) 6 . 2 3 (6 /23 ) Low 7.02 (2 /5 ) 1. 17 (12/31) 7.06 (2 /12) 5. ,69 (3 /23) 4 . 9 7 (10/21)
1972 - High 7.60 (4 /21) 7. 49 (4 /21) 7.36 (4 /28) 6. , 19 (4 /14) 5 .54 (4 /13 ) Low 6 .99 (11/24) 1. 15 (12/1) 7 .05 (2 /12) 5, ,74 (11/17) 4 .96 (10/21)
1973 - High 8 .52 (8 /10) 8. ,32 (8 /10) 7 .77 (8 /24) 7. .79 (8 /10) 5 .59 ( 8 / 3 ) Low 7.29 (1 /21) 7. ,28 ( 1 / 5 ) 7 .11 (1 /5 ) 6. ,42 ( 1 / 5 ) 4 . 9 9 (10 /11)
1974 - High 10 .61 (10 /4) 10. ,52 (10/11) 9 .39 (10/11) 8, .68 (8 /30) 7 .15 (12/12) Low 8 .05 (2 /15) 8. ,13 (1 /4 ) 7 .73 (1 /4 ) 7. .39 ( 1 / 4 ) 5 .16 ( 2 / 7 )
1974 - Dec. 6 9 .50 9. ,39 8 . 9 0 i 7. .99 6 .89 13 9 .59 9. .57 8 .87 7, .83 7 .15 20 9.52 9. .59 8 .35 7, .81 7 .08 27 9. .64 8 .90 7, .91 7 .08
1975 - J a n . 3 — — 9. .67 8 .93 7, .93 7 .08 10 9 .62 9 .45 8 . 9 1 7.83. 6 .99 17 9 .38 9. ,55 8 .64 7 . 8 1 6 .90 24 9.45 9. , 47 r 8 .78 7. , 8 3r 1 6.59 31 9.00p 9, . 30p 8. 75p 7.87p 6. 54 p
NOTES: 1 Federal Reserve series of implied yield on newly issued, Aaa-rated utility bond with 5-year cull pn>;i'i.tton.
2 Federal Reserve series of implied free-market yield on competitively bid Aaa rated utility bond with 5 year call protection rclnusihl from price restrictions sometime during the last 4
3 We- .ly ave age of daily closing figures.
4 Weekly ave, age of daily figures. U.S. Treasury data.
5 Thursday figures. The average rating of the 20 bonds used in this index falls midway between 'he fom top groups us -.lassifiud by Moot'y's Investors Service. Weekly Bond Buynr data.
Digitized for FRASER http://fraser.stlouisfed.org/ Federal Reserve Bank of St. Louis

T a b l e 3
LONG-TERM CORPORATE AND STATE AND LOCAL GOVERNMENT
SECURITY OFFERINGS AND PLACEMENTS IN MILLIONS OF DOLLARS
PERIOD G R O S S PROCEEDS
PERIOD CORPORATE 1 STATE AND LOCAL 2 PERIOD 1 9 7 4 | 1 9 7 3 | 1 9 7 2 1 9 7 4 I 1 9 7 3 I 1 9 7 2
J a n u a r y 3 , 3 4 1 2 , 3 2 7 3 , 2 0 5 2 , 1 9 6 1 , 9 7 7 1 , 7 7 6 F e b r u a r y 2 , 6 9 0 1 , 9 6 2 3 , 3 6 9 1 , 9 3 3 1 , 5 1 5 2 , 0 0 5 M a r c h 3 , 2 1 6 3 , 9 3 3 3 , 2 2 9 1 , 9 9 8 2 , 4 6 7 . 2 , 2 3 9
April 3 , 0 6 7 2 , 4 9 7 3 , 2 7 5 2 , 3 7 0 1 , 8 2 6 1 , 9 8 9 May 3 , 1 6 4 2 , 5 4 3 3 , 5 9 8 2 , 2 3 7 1 , 9 3 9 2 , 0 1 7 J u n e 2 , 9 8 2 3 , 5 7 8 • 4 , 3 4 1 2 , 0 0 4 2 , 1 5 2 2 , 2 7 0
July 3 , 2 3 6 2 , 6 3 1 3 , 5 8 2 1 , 4 8 9 2 , 0 2 8 1 , 8 0 5 Augus t 2 : , 7 2 3 1 , 8 0 6 2 , 8 9 3 1 , 1 0 3 1 , 6 5 7 1 , 9 6 6 S e p t e m b e r 1. > 6 1 7 1 , 9 1 5 2 , 7 2 0 1 , 6 9 2 1 , 7 5 0 1 , 7 2 6
O c t o b e r 4 , , 4 9 2 3 , 3 9 8 3 , 7 9 1 2 , 3 3 4 2 , 3 1 3 2 . 2 0 0 N c v e m b v i j 3 , 5 6 3 3 , 3 7 7 2 , 2 5 7 1 , 8 6 2 D e c e m o e r | 3 , 2 3 8 3 , 3 9 6 2 , 0 8 9 1 , 7 9 7
Q1 9 , , 2 4 7 8 , 2 2 2 9 , 8 0 3 6 , 1 2 7 5 , 9 5 9 6 , 0 2 0 Q2 9 , 2 1 3 8 , 6 1 8 1 1 , 2 1 4 6 , 6 1 1 5 , 9 1 7 6 , 2 7 6 0 3 7 , ,567 6 , 3 5 2 9 , 1 9 5 4 ,284 5 , 4 3 5 5 ,497 Q4 1 0 , 1 9 9 1 0 , 5 6 4 6 , 6 5 9 5 ,859
1st Half 1 8 , 4 4 6 1 6 , 8 4 0 2 1 , 0 1 7 1 2 , 7 3 8 1 1 , 8 7 6 1 2 , 2 9 6 3 Qt r s . 2 5 , 8 4 1 2 3 , 1 9 2 3 0 , 2 1 2 • 1 7 , 0 2 2 1 7 , 3 1 1 17,793 Year 3 3 , 3 9 1 4 0 , 7 7 6 2 3 , 9 7 0 23,652
NOTES: 1 Securities and Exchange Commission estimates of gross proceeds. 2 Securities Industry Association estimates of principal amounts.
Digitized for FRASER http://fraser.stlouisfed.org/ Federal Reserve Bank of St. Louis

T a b l e 4
NEW CORPORATE SECURITY ISSUES BY TYPE OF ISSUE AND ISSUER
IN MILLIONS OF DOLLARS
PERIOD
G R O S S PROCEEDS BY TYPE OF ISSUE G R O S S PROCEEDS BY TYPE OF ISSUER
PERIOD TOTAL
\
BONDS COMMON MEMO MANUFAC-
TURING PUBLIC UTILITY
COMMUNI-CATIONS
1 OTHER
ISSUERS
PERIOD TOTAL
\ PUBLICLY OFFERED
PRIVATELY PLACED
AND PREFERRED
STOCK
ISSUES INCLUDED MANUFAC-TURING
PUBLIC UTILITY
COMMUNI-CATIONS
1 OTHER
ISSUERS
PERIOD TOTAL
\ PUBLICLY OFFERED
PRIVATELY PLACED
AND PREFERRED
STOCK FOREIGN (CONVERTIBLE
MANUFAC-TURING
PUBLIC UTILITY
COMMUNI-CATIONS
1 OTHER
ISSUERS
1973 - I I I 6 ,352 2 ,333 2,285 1 ,735 163 50 1 ,160 2 ,014 871 2,304 I V 10,199 5 ,026 2,059 3,114 136 282 1 ,502 2,917 1 ,851 3 ,930
1974 - I 9 ,247 5 ,818 1 ,652 1,777 88 58 1,927 3 ,569 874 2 ,880 I I 9,199 5 ,883 1 ,766 1,537 115 38 2 ,520 3 ,190 1 ,310 2 ,171 I I I 7 ,395 5 ,025 1 ,011 1 ,359 373 306 1 ,783 2 ,414 1 ,001 2 ,202
1973 - Nov. 3 ,563 1 ,669 589 1 ,305 53 32 476 1 ,080 796 , 1 ,212 Dec. 3 ,238 1 ,552 917 769 77 504 888 377 1,469
1974 - J a n . 3 , 3 4 1 2 ,115 794 430 56 2 896 1 , 4 4 1 146 861 Feb. 2 ,690 1 ,683 421 586 11 4 393 829 397 1 ,075 Mar. 3 ,216 2 ,020 437 760 21 52 641 1,299 331 947
Apr. 3 ,067 1 ,594 671 801 63 12 1 ,202 1 , 1 3 1 294 442 May 3,164 2 ,350 607 207 42 15 862 912 663 730 June 2 ,982 1 ,939 516 526 10 11 478 1 ,147 356 1 ,000
J u l y 3 ,236 2 ,086 612 555 223 205 1 ,094 601 295 1 ,248 Aug. 2 ,723 2 ,042 274 327 104 601 1 ,159 364 600 S e p t . 1 ,617 897 306 414 150 188 680 342 409
Oc t . 4 ,492 3 , 4 2 3 217 852 175 661 2 ,078 471 1 ,282
NOTES: 1 Other issuers are extractive, railroad and other transportation, real estate and finance, and commercial and other. Source: Securities and Exchange Commission.
Digitized for FRASER http://fraser.stlouisfed.org/ Federal Reserve Bank of St. Louis

LARGE LONG-TERM PUBLIC SECURITY ISSUES FOR NEW CAPITAL
OTHER THAN U.S. TREASURY 1
January 2, t h ru January 31, 1975
ISSUER TYPE AMOUNT
(MILLIONS OF
DOLLARS)
MATURITY COUPON RATE OFFERING
YIELD MOODY'S
RATING
CORPORATE
P u b l i c Svc E l e c t r i c & Gas Pfd s t k 35. 0 — 12.25 12.25 A P a c i f i c Power & Light Com s t k 58. 6 — Atch i son , Topeka & Santa Fe R.R. Equip t r 15. ,0 1990 8.75 7 .75 -8 .75 Aaa P h i l a d e l p h i a E l e c t r i c Co. Debt 100.0 1981 12.75 12.50 Baa Southwestern Be l l Te l . Co. Notes 100. .0 1982 8.20 8.20 i Aaa Southwestern B e l l Te l . Co. Debt 150, .0 2015 9.25 9.30 Aaa D e t r o i t Edison Co. 1 s t mtg 50. .0 1982 12.75 12.75 Baa/Bbb Black & Decker Mfg. Co. Notes 75. .0 1985 8.45 8.45 A/Aa C e n t r a l Te l . of V i r g i n i a 1s t mtg 20, .0 2000 10.20 10.20 A Boston Gas Co. Debt 25 .0 1982 9.88 9.88 A Armour & Co. Debt SF 75, .0 2000 9.88 9 .96 A Montgomery Ward C r e d i t . Corp. Debt 60 .0 1983 9.50 9 .50 A Caro l ina Power & Light Com s t k 59. ,0 P u b l i c Svc. of Ind iana Com s t k 42. 3 —
P o r t l a n d General E l e c t r i c Pfd s t k 30. ,0 — 11.50 11.50 Consol ida ted Na tu ra l Gas Pfd s t k 50. ,1 —— 10.75 10.75 A Union Carbide Corp. Debt 300. .0 2005 8.50 8 .50 Aa Cyprus Mines Corp. Notes 100. .0 1985 8 .75 8 .83 A Amax Inc . Debt SF 75, .0 2000 9.38 9 .45 A Amax Inc . Notes 75, .0 1984 8 .50 8 .56 A Oklahoma Gas & E l e c t r i c 1 s t mtge 60, .0 2005 9 .13 9 .00 Aa Cont. Te le . Co. of C a l i f . 1 s t mtge 25, .0 1982 10.00 10.00 Baa/Bbb+ Delmarva Power & Light Co. 1s t mtge 30, .0 1983 9.38 9 .25 A Kansas Nebraska Natura l Gas Debt 20, .0 1995 9 .88 9 .93 A/ A+
NOTES: • Rights offering. 1 Includes corporate and other security offerings of $15 million and over.
Digitized for FRASER http://fraser.stlouisfed.org/ Federal Reserve Bank of St. Louis

T a b l e 5A C o n t i n u e d
LARGE LONG-TERM PUBLIC SECURITY ISSUES FOR NEW CAPITAL
OTHER THAN U.S. TREASURY
January 2, th ru January 31, 1975
ISSUER TYPE
AMOUNT (MILLIONS
OF DOLLARS)
MATURITY COUPON RATE OFFERING
YIELD MOODY'S
RATING
CORPORATE Arco Pipe Line Co. Notes 250.0 1982 8.00 8.10 Aa Ford Motor Cred i t Co. Notes 125.0 1983 8.63 / 8.69 Aa/A Ford Motor Cred i t Co. Debt 75.0 1995 9.50 9.59 Aa/ A Weyerhaeuser Co. Notes 250.0 1985 8.00 8.06 Aa Nat iona l Rural U t i l . F in . Corp. 1s t mtge 100.0 1985 8.95 8.95 A/A+ Ohio Edison Pfd s t k 40.0 — 10.76 10.76 A Middle South U t i l i t i e s Com s t k 98.0 — — —
Columbus & Southern Ohio E l e c t r i c Com s t k 19.4 — ——
Houston Na tu ra l Gas Debt SF 50.0 1995 9.75 9.75 A Sears Roebuck Accept. Corp. Debt 125.0 1986 8.38 8.40 Aa Sco t t Paper Co. Debt SF 50.0 2000 8.75 8.75 Aa Sco t t Paper Co. Notes 35.0 1985 8.15 8.15 Aa Brown Group Inc . Debt SF 35.0 2000 9.88 9.90 A Columbus & Southern Ohio E l e c t r i c 1s t mtge 30.0 1983 11.00 11.00 A/Bbb FMC Corp. Debt 100.0 2000 9.50 9.60 A Union P a c i f i c RR Co. Equip t r 15.0 1989 8.25 7 .00-8 .25 Aaa H a r t f o r d E l e c t r i c Light 1s t mtge 20.0 1982 11.00 10.75 A Long I s l and Light ing Co. Com s t k ( r t s ) 29.4 - - - - - -Duke Power Co. Pfd s t k 60.0 - - 10.76 10.76 Baa American Te l . & Tel . Debt 300.0 2007 8.63 8.63 Aaa American Te l . & Te l . Notes 300.0 1982 7.75 7.75 Aaa Sohio BP Alaska P i p e l i n e F in . Co. Notes 350.0 1983 8.63 8 .63 Aa Bur l ing ton Northern Equip t r 15.6 1989 8.25 8.25 Aa Geal Tele. Co of the Southeast 1st mtg 25.0 2005 9.38 9.45 A
Digitized for FRASER http://fraser.stlouisfed.org/ Federal Reserve Bank of St. Louis

Table 5A Cont inued
LARGE LONG-TERM PUBLIC SECURITY ISSUES FOR NEW CAPITAL
OTHER THAN U.S. TREASURY
January 2, t h ru January 31, 1975
ISSUER TYPE
AMOUNT (MILLIONS
OF DOLLARS)
MATURITY COUPON RATE OFFERING
YIELD MOODY'S
RATING
CORPORATE
Other
In ter -American Dev. Bank Notes 100.0 1985 8.25 8 .40 Aaa Hydro-Quebec E l e c t r i c Debt 200.0 2005 10.25 10.25 A- l New Brunswick E l e c t r i c Pwr. Coram. Debt 75.0 2005 10.00 10.05 A
^Municipal F i n . Auth. of B r i t i s h Columb. Debt SF 34.5 2000 9 .75 9.86 Aa
Digitized for FRASER http://fraser.stlouisfed.org/ Federal Reserve Bank of St. Louis

Table 5B
LARGE LONG-TERM PUBLIC SECURITY ISSUES FOR NEW CAPITAL
OTHER THAN U.S. TREASURY ' January 2, t h ru January 31, 1975
ISSUER 2
TYPE AMOUNT
(MILLIONS OF DOLLARS)
MATURITY NET INTEREST COST
OFFERING YIELD
MOODY'S RATING
STATE AND LOCAL
Cuyahoga Co. , Ohio G.O. 30.0 1976-2000 6.74 4 .80-7 .50 Aa Dade Co. , F l a . G.O. 31.0 1975-1999 7.05 4.75-7170 A-l C a l i f o r n i a Educ. F a c i l i t i e s Auth . , C a l i f . Rev 3.7 1975-1985 7.18 4 .75 -6 .00 Aa C a l i f o r n i a Educ. F a c i l i t i e s Auth . , C a l i f . Rev 13.2 2000 7.18 7.20 Aa Sa l t River Agr ic . & Pyr . D i s t . , Ar iz . ; Rev 20.0 1983-1999 8 .11 6 .25-7 .90 A-l S a l t River Agric . & Pwr. D i s t . , Ar iz . Rev 40.0 2013 8 .11 8 .13 A-l Minnesota, S t a t e of G.O. 33.8 1976-1993 5.70 4 .20 -6 .20 Aaa Mass. Municipal E l e c t r i c Systems Rev 6 .0 1982-1994 8.13 6 .10 -7 .80 A-l Mass. Municipal E l e c t r i c Systems Rev 20 .1 2009 8.13 8.13 A-l Maine S t a t e Housing Auth, Rev 13.3 1975-1995 7.49 5 .10-7 .70 A-l Maine S t a t e Housing Auth. Rev 3 .7 2006 7.49 7.88 A-l Albany Co., N.Y. G.O. 70.0 1994-1998 7.52 5 .90 -8 .00 A Puerto Rico Rev 25.0 1978 — 8.00 F l o r i d a , S t a t e of Rev 10.0 1980-1993 6.47 5 .10-7 .00 A-l Alaska, S t a t e of Rev 10.6 1979-1992 7.48 5 .75 -7 .75 A Mobile Board of Water & Sewer Comm, Ala, Rev 11.5 1977-1998 7.30 . 5 .25 -7 .90 A S p r i n g f i e l d , 111. Rev 12.0 1976-1993 6.53 4 . 6 0 - 7 . 2 0 Aa Hamilton Co. , Ohio G.O. 35.0 1975-1978 4 .83 4 .60 Port of S e a t t l e , Wash. Rev 40.0 1976-1995 7.10 4 . 9 0 - 7 . 5 0 A-l C h a r l o t t e , N.C. G.O. 26.0 1976-1997 5.72 4 . 1 0 - 6 . 5 0 Aaa Washington, S t a t e of G.O. 12.5 1976-2000 5.84 4 .00 -6 .50 Aa Washington, S t a t e of G.O. 17.3 1976-2000 5.84 4 .00 -6 .50 Aa
NOTES:
1 Includes state and local security offerings of $10 million and over. 2 In case of State and local government securities, G O denotes general obligation; Rev.-Ut., revenue obligations secured only by income from public utilities; Rev.-Q.-Ut„ revenue bonds se-
cured only by income from quasi-utilities; Rev.-S.T., revenue bonds secured by revenue from specific taxes only; Rev. Rent., revenue bonds secured solely by lease payments. 3 Includes foreign government and International Bank for Reconstruction and Development issues and non-guaranteed issues by Federal Agencies.
Digitized for FRASER http://fraser.stlouisfed.org/ Federal Reserve Bank of St. Louis
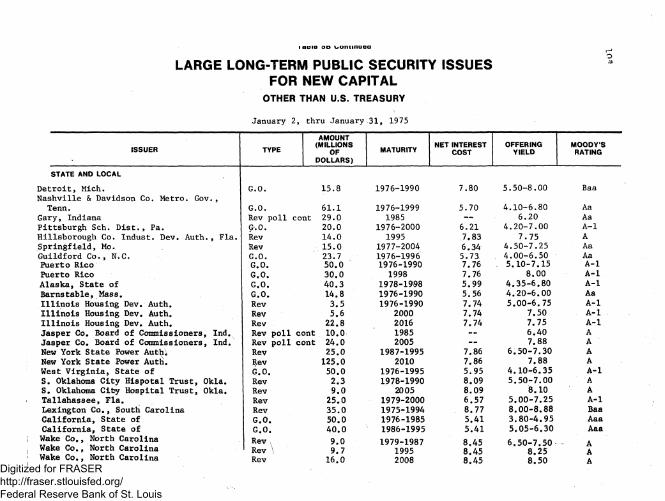
LARGE LONG-TERM PUBLIC SECURITY ISSUES FOR NEW CAPITAL
OTHER THAN U.S. TREASURY
January 2, thru January 31, 1975
ISSUER TYPE
AMOUNT (MILLIONS
OF DOLLARS)
MATURITY NET INTEREST
COST OFFERING
YIELD MOODY'S
RATING
STATE AND LOCAL
D e t r o i t , Mich. G.O. 15.8 1976-1990 7.80 5 .50 -8 .00 Baa N a s h v i l l e & Davidson Co. Metro. Gov. ,
Tenn. G.O. 61 .1 1976-1999 5.70 4 .10 -6 .80 Aa Gary, Indiana Rev p o l l cont 29.0 1985 — 6 .20 Aa P i t t s b u r g h Sch. D i s t . , Pa. G.O. 20.0 1976-2000 6 .21 4 . 2 0 - 7 . 0 0 A- l Hi l l sborough Co. I n d u s t . Dev. Auth . , F l a . Rev 14.0 1995 7.83 7 . 7 5 A S p r i n g f i e l d , Mo. Rev 15.0 1977-2004 6.34 4 .50 -7 .25 Aa Gui ldford Co. , N.C. G.O. 23.7 . 1976-1996 5 .73 . 4 . 0 0 - 6 . 5 0 Aa Puer to Rico G.O. 50.0 1976-1990 7.76 5 .10 -7 .15 A- l Puer to Rico G.O. 30.0 1998 7.76 8 .00 A- l Alaska , S t a t e of G.O. 40 .3 1978-1998 5 .99 4 . 3 5 - 6 . 8 0 A- l B a r n s t a b l e , Mass. G.O. 14.8 1976-1990 5.56 4 . 2 0 - 6 . 0 0 Aa I l l i n o i s Housing Dev. Auth. Rev 3 .5 1976-1990 7.74 5 .00 -6 .75 A- l I l l i n o i s Housing Dev. Auth. Rev 5 .6 2000 7.74 7.50 A- l I l l i n o i s Housing Dev. Auth. Rev 22.8 2016 7.74 7 .75 A- l J a s p e r Co. Board of Commissioners, Ind. Rev p o l l cont 10.0 1985 — - 6 .40 A J a s p e r Co. Board of Commissioners, Ind. Rev p o l l cont 24.0 2005 - - 7.88 A New York S t a t e Power Auth, Rev 25.0 1987-1995 7.86 6 . 5 0 - 7 . 3 0 A New York S t a t e Power Auth. Rev 125.0 2010 7.86 7.88 A West V i r g i n i a , S t a t e of G.O. 50.0 1976-1995 5 .95 4 . 1 0 - 6 . 3 5 A- l S. Oklahoma Ci ty Hispo ta l T r u s t , Okla. Rev 2 . 3 1978-1990 8.09 5 . 5 0 - 7 . 0 0 A S. Oklahoma Ci ty Hosp i t a l T r u s t , Okla. Rev 9 .0 2005 8.09 8 .10 A T a l l a h a s s e e , F l a . Rev 25.0 1979-2000 6 .57 5 . 0 0 - 7 . 2 5 A- l Lexington Co. , South Caro l ina Rev 35.0 1975-1994 8 .77 8 . 0 0 - 8 . 8 8 Baa C a l i f o r n i a , S t a t e of G.O. 50.0 1976-1985 5 .41 3 . 8 0 - 4 . 9 5 Aaa C a l i f o r n i a , S t a t e of G.O. 40 .0 1986-1995 5 .41 5 . 0 5 - 6 . 3 0 Aaa
Wake Co., North Caro l ina Rev 9 .0 1979-1987 8 .45 6 . 5 0 - 7 . 5 0 A Wake Co. , North Caro l ina Rev \ 9 .7 1995 8 .45 8 .25 A Wake Co. , North Caro l ina Rev 16.0 2008 8 .45 8 .50 A Digitized for FRASER http://fraser.stlouisfed.org/ Federal Reserve Bank of St. Louis

T a b l e 6A 1 1
FORTHCOMING LARGE LONG-TERM PUBLIC SECURITY OFFERINGS FOR NEW CAPITAL
OTHER THAN U.S. TREASURY 1
as of January 31, 1975
ISSUER TYPE AMOUNT
(IN MILLIONS OF DOLLARS)
APPROXIMATE % DATE OF OFFERING
CORPORATE
Cent ra l & South West Corp. Com s t k 55.0 February 4 Conn„ Light & Power Co. 1s t mtge 85.0 February 4 Pepsico Inc . Notes 75.0 February 4 S. P a c i f i c Transpc Co. Equip t r 15.0 February 4 Dow Chemical Co. Notes 200.0 February 6 Kansas Power & Light 1s t mtge 35.0 February 6 £ F lo r ida Power & Light Pfd s t k 60.0 February 6 United I l l u m i n a t i n g Co. Com s t k 16.1 February 11 £ Washington Water Power Co. 1s t mtge 25.0 February 11 | Duke Power Co, 1st mtge 100.0 February 11 Mountain Fuel Supply Co. Com s t k 30.0 February 11 PPG I n d u s t r i e s Inc . Notes 50.0 February 11 PPG I n d u s t r i e s I nc . Debt 75.0 February 11 Dana Corp. Debt 75.0 February 12 Southern Railway Co. Equip t r 15.0 February 13 S t a t e S t r e e t Boston Fin . Corp. Notes 25.0 February 13 Indiana Gas 1s t mtge 20.0 February 18 Atchinson Topeka &SFRR Equip t r 15.0 February 18 Southwestern Publ ic Service Co 1s t mtge 45 .0 February 19 Cleveland E l e c t r i c I l l umina t ing Co. Com s t k 35.0 February 19 Kansas Gas & E l e c t r i c Co Pfd s t k 20.0 February 19 P a c i f i c Light ing Svc. Co. 1s t mtge 30.0 February 20 F i r s t Nat ional Boston Corp. Notes 100.0 February 20 Houston Light ing & Power 1st mtge 125.0 February 24 American Natura l Gas Co. Com s t k 62 .5 February 25 L o u i s v i l l e Gas & E l e c t r i c Co* 1st mtge 25.0 February 25 Cent. I l l i n o i s Light Co. 1st mtge 25.0 February 25 Natural Gas P ipe l i ne Co. Debt 60.0 February 26 Dal las Power & Light Co. 1s t mtge 50.0 February 26 C i t i zens U t i l i t i e s Co. 1st mtge 35.0 February 27 New York S t a t e E l e c t . & Gas Corp. 1s t mtge 75.0 February 27 Mobile Alaska P i p e l i n e Co. Guar debt 300.0 February Esmark Inc . Debt sf 75.0 February Esmark Inc . Notes 50.0 February Freuhauf Finance Co. Notes 60.0 February ERC Corp. Debt 25.0 February Atchison & Topeka Santa Fe RR Equip t r 15.0 March 4 Je r sey Cent. Pwr. & Light Co. 1st mtge 35.0 March 5 Southern C a l i f o r n i a Edison Co. 1st mtge 50.0 March 6
N O T E S :
* Included in table for first time.
1 Includes corporate and other security issues of $15 million and over.
Digitized for FRASER http://fraser.stlouisfed.org/ Federal Reserve Bank of St. Louis

T a b l e 6A C o n t i n u e d
FORTHCOMING LARGE LONG-TERM PUBLIC SECURITY OFFERINGS FOR NEW CAPITAL
OTHER THAN U.S. TREASURY 1
as of January 31, 1975
TYPE AMOUNT APPROXIMATE
ISSUER TYPE (IN MILLIONS DATE OF OFFERING . OF DOLLARS)
DATE OF OFFERING .
CORPORATE
St„ Louis & Southwestern RR Equip t r 15.0 March 11 Niag a ra Mohawk Power Corp. Com s t k 25 .0 March 11 New York Te le . Corp. Notes 200.0 March 11 Niagara Mohawk Power Corp. 1s t mtge 50.0 March 11 Union E l e c t r i c Co. 1s t mtge 70.0 March 12 F l o r i d a Power & Light 1s t mtge 125.0 March 13
*General Publ ic U t i l i t i e s Co. Com s t k 30.5 March American Finance Corp. Debt 30.0 I n d e f i n i t e Montgomery Ward Cred i t Co. Debt sf 50.0 I n d e f i n i t e General Te le , of Ohio Pfd s t k 20.0 I n d e f i n i t e Nat iona l Secur i ty & Reg i s t e r Co. Bene i n t 30.0 I n d e f i n i t e Ot i s E lava tor Co. Debt 50.0 I n d e f i n i t e Oklahoma Gas & E l e c t r i c Co. Pfd s t k 35.0 I n d e f i n i t e
Other
Hydro-Quebec Debt 100.0 February Hydro-Quebec Debt 20.0 February European Coal & S t e e l Comm. Notes 100.0 February
*Govt, of I r e l and Notes 25.0 February
Postponed
Midland E n t e r p r i s e s Inc . 1s t mtge 15.0 January 22
Digitized for FRASER http://fraser.stlouisfed.org/ Federal Reserve Bank of St. Louis

Tab le 6B 13
FORTHCOMING LARGE LONG-TERM PUBLIC SECURITY OFFERINGS FOR NEW CAPITAL
OTHER THAN U.S. TREASURY 1
As of January 31, 1975
ISSUER TYPE AMOUNT
(IN MILLIONS OF DOLLARS)
APPROXIMATE DATE OF OFFERING
STATE & LOCAL *Nekooso, Wisconsin Rev p o l l cont 12.6 February 3 *Alaska Housing Finance Corp. Rev 40 .0 February 3
Ph i l ade lph i a , Pa. G.O. 10.0 February 4 New York S t a t e Housing Finance Age. Rev 103.5 February 4
^Michigan, S t a t e of G.O. 75.0 February 4 Garland, Texas G.O. 11.5 February 4
^Suf fo lk Co., N.Y. G.O. 36 .9 February 4 V i r g i n i a Publ ic School Auth. G.O. 16.5 February 5 Madison Voc. Tech. Educ. D i s t . , Wis G.O. 10.0 February 5
*Pennsylvania Higher Educ. F a c i l i t i e Auth* Rev 14.4 February 6
*Balt imore, Maryland Rev p o l l cont 17.0 February 6 A r t e s i a n Sch. Bldg. Corp . , Ind. Rev 10.5 February 6
* I l l i n o i s Educat ional F a c i l i t i e s Auth. Rev 12.0 February 6
San Antonio, Texas G.O. 25.0 February 6 San Antonio, Texas Rev 10.0 February 6
*Greater Chicago Metro. San i ta ry D i s t* , 111. G.O. 33.0 February 6
*New York, N.Y. G.O. 141.4 February 11 *0regon, S t a t e of G.O. 100.0 February 11 * I l l i n o i s , S t a t e of G.O. 150.0 February 13 *Plano Independent School D i s t . ,
Texas G.O. 12.0 February 18 ^Massachuset ts , S t a t e of GtO. 125.0 February 19 ^Maryland, S t a t e of G.O. 8 4 . 1 February 26 ^Flor ida S t a t e Board Higher Educ. Rev 46 .0 February 26 *Miami, F l o r i d a G.O. 19.0 February 27 *Prince Will iam Go., Va. G.O. 16.0 March 4
Ph i l ade lph ia Hosp i t a l Auth . , Pa Rev 50.0 I n d e f i n i t e S t . Charles Pa r i sh , La. Rev Po l l cont 60.0 I n d e f i n i t e
NOTES: 1 Includes state and local government issues of $10 million and over.
2 Includes foreign government and International Bank for Reconstruction and Development issues and issues of Federally sponsored agencies.
Digitized for FRASER http://fraser.stlouisfed.org/ Federal Reserve Bank of St. Louis

T a b l e 7
STOCK PRICES AND VOLUME
STOCK PRICES TRADING VOLUME
DJ INDUSTRIALS NYSE | AMEX | NASDAQ
27.6 (12/29) 10.3 (12/29) 14. .4 (12/29) 8 . 1 (7/3) 1 .8 (9/8) 5. .0 (10/9)
26.0 (9/20) 5 .5 (1/12) 11, .3 (1/11) 9 .0 (8/20) 1 .4 (8/20) 3 .5 (8/27)
24.9 (1/3) 4 .4 (1/3) 7 .5 (1 /3) 7.5 (7/5) .9 (9/26) 2 .8 (7/5)
65.14 (12/11) 56.23 (1/3)
65.48 (1/11) 49.12 (12/13)
53.37 (3/13) 32.89 (10/3)
34.45 35.39 35.23 35.36
37.35 38.57 37.86 33.84 40 .91
1036.27 (12/11) 889.15 (1/26)
1051.50 (1/11) 788.31 (12/5)
891.66 (3/13) 577.60 (12/6)
577.60 592.77 598.48 602.16
634.54 658.79 644.63 666.61 703.69
138.35 (4/11) 117.09 (1/3)
130.47 (1/11) 85.26 (12/20)
102.01 (3/14) 59.13 (12/6)
59.13 60.11 59.73 59.35
62.86 67.32 67 .81 71.05 74.20
135.15 (12/8) 113.65 (1/3)
136.84 (1/11) 89.12 (12/13)
96.53 (3/15) 54.87 (10/3)
58.21 59.22 58.67 58.74
61.23 63.69 64.40 65.37 69.78
13 .1 15 .1 16.4 13 .1
17.4 18.1 16.9 16 .4* 30.3
1.9 2.2 2 .4 r 2 .3
2.8 2.0 1.8 1. 9r 3. 1
4 .4 4 .8 5 .3 4 .4
5 .4 5 .5 4.9 4 . 6 r 7.2
NOTES: 1 Figures other than highs and lows are Fridays only. Highs and lows are for the year and are not necessarily for Fridays. 2 Volume figures are weekly averages of daily figures (millions of shares).
3 12 /31 /66-50 4 Based on average price change until September 4, 1973 thereafter, based on market value of shares listed.
Digitized for FRASER http://fraser.stlouisfed.org/ Federal Reserve Bank of St. Louis

Table 8
SECURITY CREDIT 15
END OF PERIOD
REGULATED MARGIN CREDIT EXTENDED BY
END OF PERIOD BROKERS O N 1
MARGIN STOCK
BROKERS O N 2
CONVERTIBLE BONDS
BANKS
, UNREGULATED NONMARGIN STOCK CREDIT
AT BANKS
OUTSTANDING
1973 - Sep t . 5,730 204 1,005 1,909 Oct. 5,690 203 1 ,181 1,878 Nov. 5,460 197 1,103 1,917 Dec. 5,050 189 1 ,131 1,866
1974 - J an . 5,130 182 1,020 1,845 Feb. 5,230 183 1,039 1 ,843 Mar. 5 ,330 180 1,008 1,869 Apr. 5,370 179 1,009 1,868 May- 5,180 172 1,020 1,858
5,080 172 1 ,037r 1 ,721 J u l y 4,760 158 l , 0 2 3 r 1,739 Aug. 4,510 156 953r 1,759 Sep t . 4,020 148 924r n . a . Oct . 3,930 145 n . a . n . a . Nov. 3,960 139 n . a . n . a .
CHANGE IN OUTSTANDING
1973 - Sep t . -100 —6 - 3 1 - 4 3 Oct. -40 - 1 176 - 3 1 Nov. -230 - 6 -78 39 Dec. -410 - 8 28 - 5 1
1974 - J a n . 80 -7 - 1 1 1 - 2 1 Feb, 100 1 19 - 2 Mar. 100 - 3 - 3 1 26 Apr. 40 - 1 1 - 1 May -190 -7 11 -10
-100 — 17 -137 J u l y -320 -14 -14 18 Aug. -250 - 3 -70 20
- Sep t . -490 - 7 -29 n . a . Oct . -90 - 3 n.a# Nov. -30 - 6
NOTES: 1 Margin account debt as reported by the New York Stock Exchange, excluding credit for subscription issues and convertible bonds. 2 New York Stock Exchange data. 3 June data for banks are universe totals; all other data for banks represent estimates for all commercial banks based on reports by a reporting
sample, which accounted for 60 per cent of security credit outstanding at banks on June 30. 4 Nonmargin stocks are those not listed on a national securities exchange and not included on the Board of Governors of the Federal Reserve
System's list of OTC margin stocks. At banks, loans to purchase or carry nonmargin stocks are unregulated; at brokers, such stocks have no
Digitized for FRASER http://fraser.stlouisfed.org/ Federal Reserve Bank of St. Louis

T a b l e 9
SAVINGS FLOWS AT NONBANK THRIFT INSTITUTIONS IN MILLIONS OF DOLLARS
MUTUAL SAVINGS BANKS
REGULAR DEPOSITS
NET FLOW
ANNUAL 3 GROWTH
RATE
NET NEW
MONEY
SAVINGS & LOAN ASSOCIATIONS
SHARE CAPITAL
NET FLOW
ANNUAL 3 GROWTH
RATE
NET NEW
MONEY NET
FLOW
ANNUAL 3 GROWTH
RATE
NET NEW
MONEY
1970 1971 1972 1973 r /
1973 - September.—^ October — . November —'
r ! • September October — , November —
1974 -
1974 - Apr. ~ May £ / June J u l y t f . Aug. S e p t . y Oc t . — Nov. ZJ
4 ,517 9 ,621
10,067 4 , 8 1 5
283 -150
440
. 319 -74 449
-206 203 444 - 8 2
12 172 260 534
6 .8 13,5 12.4
5 . 3
- 2 . 5 2 .5 5 . 5
- 1 . 0 0.1 2 .1 3 .2 6 .6
936 5 ,678 5 ,451
-442
-613 -337
265
-689 -260
236
10,965 27,793 32,567 20,237
1 ,821 935
1,260
1 ,421 438
1,212
8 . 1 19 .0 18.7
9 . 8
5 ,285 20,653 23,884 10,504
-340 835
1,166
-1,068 301
1,082
SEASONALLY ADJUSTED
532 2. 7 326 1 . 2 947 4. ,9 1 ,150 4 . 2
1 ,533 7. .8 1 ,977 7 . 2 579 2. .9 497 1 . 8 544 2, .8 556 2 .0 818 4, . 1 990 3 . 6
1,277 6 .4 — 1,537 5 . 5 1 ,738 8 .7 • — 2,272 8 . 1 —
15,482 37,414 42,634 25,052
2,104 785
1 ,700
1 ,740 364
1,661
7.7 17 .2 16.7
8 .4
6 ,221 26 ,331
io ' ,062
- 9 5 3 498
1 , 4 3 1
1,757 41
1 , 3 1 8
NOTES: 1 Regular deposit! at mutual savings banks exclude items such as Christmas club and certain escrow accounts, which represent a very small part of total deposits. 2 New deposits net of both withdrawals and interest. Data for S&L's are for insured associations only, which represent 96 per cent of industry total resources. 3 Annual growth rate for monthly data is the annualized monthly percentage increase in deposits. Source: National Association of Mutual Savings Banks and Federal Home Loan Bank Board.
Digitized for FRASER http://fraser.stlouisfed.org/ Federal Reserve Bank of St. Louis

T a b l e 10 1 7 .
MORTGAGE COMMITMENTS AT SELECTED THRIFT INSTITUTIONS
BILLIONS OF DOLLARS, SEASONALLY A D J U S T E D
OUTSTANDING COMMITMENTS NET CHANGE
PERIOD ALL SAVINGS MUTUAL ALL SAVINGS MUTUAL TOTAL & LOAN SAVINGS BKi 5 TOTAL & LOAN SAVINGS BKS
ASSOCIATIONS (N Y. STATE; I ASSOCIATIONS (N Y. STATE)
1971 - Dec. 17.5 13.8 3 .7 .41 .20 .21
1972 - Dec. 24.7 19.8 4 . 9 .36 .34 .02
1973 - Jan. 25 .7 20.6 5 . 1 .94 .81 .13 Feb. 26.2 21.3 4 . 9 .49 .63 - . 1 4 Mar. 25.7 20.9 4 . 8 - .54 - .37 - . 1 7 Apr . 25 .1 20.5 4 .6 - .57 - .38 - . 1 9 May 24.2 19.7 4 . 5 - .88 - .76 - . 1 2 June 23.9 19.5 4 . 4 - .31 - .25 - . 0 6 J u l y 23 .0 18.7 4 . 3 - .85 - .76 - . 0 9 Aug. 22 .1 17.9 4 . 2 - 1 . 0 1 - .87 - . 1 4 S e p t . 20.8 16.8 4 . 0 - 1 . 1 6 - 1 . 0 3 - . 1 3 Oc t . 19.9 16.0 3 .9 - 1 . 0 4 - .87 - . 1 7 Nov. 19.4 15.7 3 .7 - .37 - .21 - . 1 6 Dec. 19.5 15.9 3 .6 - .02 .15 - . 1 7
1974 - J a n . 19.3 15 .9 3 .4 - .08 .03 - .11 Feb. 19.6 16.4 , 3 .2 .21 .43 - . 2 2 Mar. 19.8 16.7 3 . 1 .19 .33 - . 1 4 Apr . 20 .0 16.9 3 .0 .10 .22 - . 1 2 May 18.8 15.9 2 .9 - .99 - .95 - . 0 4
18 .1 15.3 2 . 8 - .78 - .69 - . 0 9 J u l y 17.2 14.4 2 .8 - .89 - .83 - . 06 Aug. 16.6 13.8 2 .8 - .66 - .67 .01 S e p t . 16 .1 13 .4 — 2.7 - .52 - .40 - . 1 2 Oc t . 14.7 12.3 2 .4 - 1 . 3 6 -1 .06 - . 3 0 Nov. 14.3 12.0 2 .3 - .42 - .32 - . 1 0
NOTES:
Based on data from Federal Home Loan Bank Board and Savings Banks Association of New York State. Both series include a minor amount of non-residential commitments; S&L commitments also include loans in process. Net changes are derived directly from unrounded end-of-period outstanding levels as reported and after seasonal adjustment by Federal Reserve. Subtotals may not add to totals because of rounding.
Digitized for FRASER http://fraser.stlouisfed.org/ Federal Reserve Bank of St. Louis

T a b l e 11
NET NEW MONEY BORROWINGS BY MAJOR HOUSING AGENCIES
IN MILLIONS OF DOLLARS
PERIOD
TOTAL INCLUDING
SHORT-TERM DISCOUNT
NOTES
INTERMEDIATE AND LONG-TERM ISSUES FNMA & FHLB PERIOD
TOTAL INCLUDING
SHORT-TERM DISCOUNT
NOTES TOTAL FHLB FHLMC FNMA
SHORT-TERM DISCOUNT
NOTES] . /
1973 - J u l y +1,475 +1,528 +998 +530 -53 Aug. +1,693 +1,349 +1,349 - — - - +344 S e p t . +1,910 +1,850 +1,500 — — +350 +60 O c t . +1,946 +1,950 +1,300 +650 . -4 Nov. +11 -150 -150 — — +161 D e c . +598 +256 - - - - +256 +342
1974 - J a n . -671 -756 -800 +44 +85 F e b . -695 -657 -657 — — — -38 Mar. 4424 4450 — +450 -26 Apr. +508 -4 -4 — — - +512 May +1,442 +992 +992 - - - - , 4450
+2,699 +2,250 +1,500 • —— +750 +449 Ju ly +1,804 +1,499 +1,000 — +499 +305 Aug. +878 +200 +400 -200 — . +678 S e p t . +2,768 +2,750 +1,700 — +1,050 +18 O c t . +1,665 +1,599 +1,499 — +100 +66 Nov. p -431 -250 -250 —— — — -181 D e c . p +545 +1,000 +500 +500 -455
Notes : Based on d a t a from the Treasury Survey of Ownership. 1 / Sa le s of FHLB d i scoun t no te s began i n May 1974. |>/ P r e l i m i n a r y .
Digitized for FRASER http://fraser.stlouisfed.org/ Federal Reserve Bank of St. Louis

T a b l e 12
NET CHANGE IN MORTGAGE HOLDINGS1 « IN MILLIONS O F DOLLARS
TOTAL FINANCIAL INSTITUTIONS
PERIOD INCLUDING TOTAL COMMERCIAL M S B ' s S & L ' s INSURANCE FNMA-GNMA' FNMA-GNM/
TOTAL BANKS
M S B ' s S & L ' s COMPANIES
Not Seasona l ly Adius ted
1970 21,736 16,827 2,462 1,845 10,254 2,348 4,909 1971 41,647 39,259 9,940 3 ,938 23,919 1,221 2,388 1972 57,637 55 ,611 16,800 5,377 31,982 1,452 2,026 1973 59,732 56,432 19,600 5,642 26,912 4,278 3,300
1974 - Apr . 5 ,396 4 ,992 1,700 285 2,509 498 404 May 5,502 4,802 1,600 303 2,618 281 700 June 4,955 4,363 1,500 248 2,137 478 592
~ - - Ju ly 4 ,231 3,364 900 260 1,735 469 867 Aug 4,869 4 ,026 1,000 183 1,578 422 843 S e p t . 2,874 2,066 700 65 911 390 808 Oct . 2,419 1,655 500 45 565 545 764 Nov.
2,419 1,655 400 507 475 516
Seasona l ly Adius ted
1974 - Apr 5,537 4,977 1,667 328 2,389 593 560 May 5,317 4,489 1,412 289 2,429 359 828 June 4 ,095 3,431 - 1 ,281 131 1,499 520 664 Ju ly 3,679 2,889 796 217 1,382 494 790 Aug 3,130 2,543 741 135 1,260 407 587 S e p t . 2,580 1,928 458 114 944 412 652 Oct . 2,599 1,945 488 96 828 533 654 Nov. 501 793 449 449
NOTES:
1 Monthly data for commercial banks based on Federal Reserve estimates benchmarked to Call Report data on real estate loans outstanding as avail-able. Other data derived from mortgage debt outstanding as reported separately by National Assn. of Mutual Savings Banks, Federal Home Loan Bank Board, Institute of Life Insurance and, through August 1968, the Federal National Mortgage Association, and thereafter by FNMA and the Government National Mortgage Association. Data for mutual savings banks and for Life Insurance companies may differ somewhat from those de-rived from regular quarterly series because of minor conceptual differences for which adjustments are not made in the monthly series. Altogether, these groups accounted for ,Wper cent of the net increase estimated for all holders in 1 9 7 3 .
2 Beginning January 1972 datareflect activity in limited amount of conventional mortgages.
Digitized for FRASER http://fraser.stlouisfed.org/ Federal Reserve Bank of St. Louis

2 0 T a b l e 1 3
NET INCREASE IN MORTGAGE DEBT OUTSTANDING1
IN BILLIONS OF DOLLARS, SEASONALLY ADJUSTED ANNUAL RATES
QUARTER
2
TOTAL
RESIDENTIAL 3 MULTIFAMILY &
COMMERCIAL FARM QUARTER
2
TOTAL TOTAL 1- to 4 -FAMILY
MULTI-FAMILY
COMMERCIAL MULTIFAMILY
& COMMERCIAL
FARM
1968 - I 28 .1 19.4 16.3 3 . 1 6 .4 9 .5 2 .3 I I 26.4 18.2 15.0 3 . 2 6 . 0 9 .2 2.2. I I I 25.5 17.2 13.6 3 .5 6 .5 10 .1 1 .8 IV 29.6 20.4 16.5 3 . 9 7 .4 11.3 1 .9
1969 - I 32 .0 23.8 19.4 4 . 4 6 .0 10.4 2 .2 I I 29 .1 21.5 16.8 4 . 6 5 . 4 10 .1 2 .2 I I I 25 .8 18.7 14.0 4 . 7 5 . 3 10.0 1.7, IV 25.2 18.5 13 .1 5 . 4 5 . 3 10.7 1 .4
1970 I 20.7 14.4 9 .4 5 . 0 4 . 8 9 . 8 1 .5 I I 22.9 16.8 11.6 5 . 2 4 . 6 9 . 8 1 .5 I I I 28.5 21 .3 15.0 6 . 3 5 . 1 11.5 2 . 1 IV 31 .8 22 .8 16.2 6 .6 6 . 8 13.4 2 .2
1971 - I 37 .3 27.4 19.4 8 . 0 7 .7 15.7 2 .2 I I 47 .7 35.5 26.2 9 .4 9 . 8 19.2 2 .4 I I I 52 .3 38.5 28.6 9 .9 11.5 21.4 2 .3 IV 54 .2 41 .2 31 .3 9 .9 10.5 20 .4 2 .5
1972 - I 62 .8 4 6 . 1 37.7 8 .4 14 .1 22.5 2 .6 I I 64.9 4 7 . 0 37 .4 9 .6 15.3 24 .9 . 2 .6 I I I 65 .1 4 7 . 1 38 .0 9 . 1 15.3 24.4 2 .6 IV 68 .3 49 .5 4 0 . 0 9 .5 16 .3 25 .8 2 .5
1973 - I 83.4 63 .1 5 3 . 1 10.0 16.3 26 .3 4 . 1 I I 75.6 53 .9 44 .0 9 .9 17.8 27 .8 3 . 8 I I I 71.3 51 .4 4 1 . 8 9 .6 16.3 25 .9 3 . 6 IV 57 .9 38 .3 31.7 6 .5 15.0 21.5 4 . 6
1974 - I 58 .5 39.5 3 2 . 1 7 .4 15.4 22.7 3 . 6 I I 65 .3 44 .0 37 .1 6 . 8 17.3 24 .1 4 . 0 I I I 49 .8 33.7 27.7 6 .6 10.4 17.0 5 . 1
N O T E S : 1 Derived from data on mortgage debt outstanding from Federal Deposit Insurance Corporation, Federal Home Loan Bank Board, Institute of Life
Insurance, National Association of Mutual Savings Banks, Departments of Commerce and Agriculture, Federal National Mortgage Association, Federal Housing Administration, Veterans Administration and Comptroller of the Currency. Separation of nonfarm mortgage debt by type of property, where not available, and interpolations and extrapolations, where required, estimated mainly by Federal Reserve.
2 May differ somewhat from related flow of funds series mainly because of more aggregative type of seasonal adjustment.
3 Residential mortgage debt includes nonfarm only and is sum of 1 to 4- family and multifamily mortgage debt<combmed.
Digitized for FRASER http://fraser.stlouisfed.org/ Federal Reserve Bank of St. Louis

Table 14
PRIVATE HOUSING PERMITS, STARTS, COMPLETIONS, AND MOBILE HOME SHIPMENTS
IN THOUSANDS OF UNITS, SEASONALLY ADJUSTED ANNUAL RATES
PERMITS 1 / STARTS COMPLETIONS MOBILE
PERIOD TOTAL 1—FAMILY 2 - O R MORE TOTAL 1—FAMILY 2 - O R MORE TOTAL 1—FAMILY 2 - O R MORE HOME TOTAL FAMILY FAMILY FAMILY SHIPMENTS
1969 1,324 626 1 698 1,467 811 656 1,399 808 592 413 1970 1,352 647 705 1,434 813 .621 1,418 802 617 401 1971 1,952 928 1,025 2,052 1,151 901 1,706 1,014 692 497 1972 2,219 1,033 1,186 2,357 1,309 1,048 1,972 1,143 828 576 1973 1,820 882 937 2,045 1,132 914 2,005 1,166 838 580
1973 - J u l y 1,814 902 912 2,152 1,232 920 1,965 1,038 926 564 August 1,777 828 949 2,030 1,108 921 1,836 1,084 752 543 September 1,656 807 849 1,844 990 854 1,900 1,152 748 479 October 1,379 676 702 1,674 957 718 1 .971 1,125 846 458 November 1,361 674 687 1,675 938 737 1,949 1,128 821 490 December 1,285 641 645 1,403 767 636 1,873 1,050 823 456
1974 - January 1,282 637 645 1,464 793 671 1,916 1,026 890 469 February 1,325 716 609 1,922 1,056 866 1,891 1,018 873 449 March 1,410 761 649 1,499 962 537 1,885 973 912 475 A p r i l 1,296 727 569 1,630 996 634 1,695 883 812 435 May 1,120 671 449 1,471 931 540 1,677 882 795 451
"1,106 674 432 1,596 1,014 582 1 ,851 1,092 759 441 J u l y 1,017 632 385 1,338 958 380 1,674 935 739 380
900 618 282 1,134 812 322 1,505 899 607 370
Sept 823 577 246 1,150 844 306 1,505 882 624 316 Oc t . 782 533 249 1,109 777 332 1,645 922 722 248 Nov. 730 511 219 990 788 202 1,620 874 746 218 Dec. 802 482 320 868 678 190
NOTES: P r i v a t e b u i l d i n g permi t s ( f o r 14,000 a r e a s wi th permi t sys tems, exc lud ing farm), s t a r t s , and comple t ions a re h Census Bureau d a t a . A d w e l l i n g u n i t i s s t a r t e d when excava t ion b e g i n s . In the case of apar tment b u i l d i n g s , a l l u n i t s a r e cons ide red s t a r t e d a t t h a t t ime; however, a l l such un i t s a r e cons idered completed when more than h a l f of the u n i t s in the s t r u c t u r e a r e ready f o r u s e . P r i v a t e mobile home shipments a re Mobile Home Manufactures Assoc . d a t a conver ted to s e a s o n a l l y a d j u s t e d annual r a t e by Census Bureau. JL/Permit d a t a f o r 1969 and 1970 based on 13,000 a r e a s w i th permit sys t ems . Digitized for FRASER
http://fraser.stlouisfed.org/ Federal Reserve Bank of St. Louis

T a b l e 1 5 i o
AVERAGE RATES AND YIELDS ON HOME MORTGAGES
PERIOD
CONVENTIONAL L O A N S PRIMARY MARKET
HUD(FHA) INSURED L O A N S S E C O N D A R Y MARKET
S P R E A D B E T W E E N
R E T U R N S ON CONVENTIONAL AND HUD(FHA)
NEW HOME M O R T G A G E S
( B A S I S P O I N T S )
NEW A a a UTILITY
BOND YIELD
(IN PER CENT)
PERIOD
NEW H O M E S EXISTING H O M E S NEW H O M E S
S P R E A D B E T W E E N
R E T U R N S ON CONVENTIONAL AND HUD(FHA)
NEW HOME M O R T G A G E S
( B A S I S P O I N T S )
NEW A a a UTILITY
BOND YIELD
(IN PER CENT)
PERIOD RATE
(IN PER CENT)
1 SPREAD (BASIS
POINTS)
RATE (IN PER CENT)
1 SPREAD (BASIS POINTS)
YIELD (IN PER CENT)
1 SPREAD (BASIS
POINTS)
DISCOUNT (PERCENTAGE
POINTS)
S P R E A D B E T W E E N
R E T U R N S ON CONVENTIONAL AND HUD(FHA)
NEW HOME M O R T G A G E S
( B A S I S P O I N T S )
NEW A a a UTILITY
BOND YIELD
(IN PER CENT)
1972 - High 7 .70 61 7.75 66 7.57 48 4 .7 14 7 .45 Low 7.55 15 7 .60 20 7 .45 05 3 .7 06 7 .09
1973 - High 1 8 .95 107 8.95 107 9:18 130 9 .4 21 8 .36 Low 7 .70 31 7.75 37 7.55 14 2 .2 -23 7 .38
1974 - Jan 8 .65 40 8.65 40 8.25 Feb 8 .55 45 8 .60 50 8.54 44 2 .3 . 1 8 .10 Mar 8 .60 - 4 8.60 - 4 8.66 2 3 . 2 - 6 8 .64 Apr 8 .90 - 8 8.90 - 8 9.17 19 5 . 1 -27 8 .98 May 9.15 6 9.15 6 9.46 37 5 . 3 -31 9 .09
9 .25 -25 9.25 -25 9 .46 - 4 5 .3 -21 9 .50 J u l y 9 .40 -70 9 .40 -70 9.85 -25 6 .3 -45 10.10 Aug 9 .60 -39 9 .60 -39 10.30 31 5 .8 -70 9 .99 Sept 9 .80 -66 9 .80 -66 10.38 - 8 6 .3 -58 10.46 Oct 9 .70 -33 9 .70 -33 10.13 10 4 . 6 -43 10.03 Nov 9 .55 -13 9 .60 - 8 - - - - - - — — 9 .68 Dec. 9 .45 9.45 9 .51 3 . 8
N O T E S : 1 Gross yield spread is average mortgage return before deducting servicing costs, minus average yield on new issues of high-grade utility bonds with 5-year call protection.
Rates on conventional first mortgages (excluding additional fees and charges) are based on unweighted HUD (FHA) field office opinions on prevailing contract interest rates in the market areas of the insuring offices, rounded to the nearest 5 basis points. For secondary market data, weighted HUD office opinions on the average bid price for HUD (FHA) loans with minimum down-payment, prepaid in 15 years, for immediate delivery, are used.
Digitized for FRASER http://fraser.stlouisfed.org/ Federal Reserve Bank of St. Louis

T a b l e 1 6 —
FNMA AUCTION RESULTS HOME MORTGAGE COMMITMENTS
23
DATE O F AUCTION
GOVERNMENT-UNDERWRITTEN CONVENTIONAL
DATE O F AUCTION
AMOUNT (IN MILLIONS O F DOLLARS)
AVERAGE YIELD
AMOUNT (IN MILLIONS O F D O L L A R S )
A V E R A G E YIELD
DATE O F AUCTION
O F F E R E D | A C C E P T E D
AVERAGE YIELD
O F F E R E D | A C C E P T E D
A V E R A G E YIELD
1973 - High 551 (9 /3 ) 289 (9 /3 ) 9.37 (9/17) 171 (8 /20) 88 (4 /16) 9 .68 (9 /17)
Low 25 (10/15 , 17 (10 /15)7 .69 (1 /8 ) 9 (10/1) 7 (10 /1) 7 .84 (1 /2 ) 11/26)
1974 - Aug. 12 207.9 97.7 10.12 4 5 . 8 19.4 10.16 26 309.6 93.0 10.38 59 .0 24.9 10.42
S e p t . 9 176.1 98.6 10.59 46 .5 30 .9 10.71 23 57.2 38 .2 10.56 22 .1 19.0 10.66
Oc t . 7 46 .6 29.7 10.32 26 .1 23.3 10.46 21 34.5 26 .0 10.11 14 .1 12.2 10.27
Nov. 4 I 47 .8 24.7 9 .93 20.4 12 .1 10.11 18 I 25.7 17.6 9 .81 20.6 6 . 8 9.92
Dec . 2 52.5 23 .3 9 .61 24.0 12.0 9 .80 16 49 .6 43 .3 9.52 20 .1 18.5 9.72 30 35.7 31 .8 9 .47 17.2 10 .1 9 .59
J a n . 13 25 .3 21.2 9 .37 17.9 14.9 9 .50 27 41 .4 28.6 9.12 11.1 10.6 9.39
N O T E S :
Average secondary market yields are gross before deduction of the fee of 38 basis points paid for mortgage servicing. They reflect the average ac-cepted bid yield for home mortgages assuming a prepayment period of 12 years for 30 year loans, without special adjustment for Federal National Mortgage Association (FNMA) commitment fees and FNMA stock purchase and holding requirements on 4-month commitments. Mortgage amounts offered by bidders relate to total * bids received.
Digitized for FRASER http://fraser.stlouisfed.org/ Federal Reserve Bank of St. Louis