Embed Size (px)
Citation preview

Capital ManagementDEEP DIVE
THIS MATERIAL IS CONFIDENTIAL AND IS PROVIDED SOLELY FOR PRESENTATION
PURPOSES. IT IS INTENDED FOR QUALIFIED ELIGIBLE PARTICIPANTS ONLY. PAST
PERFORMANCE IS NOT NECESSARILY INDICATIVE OF FUTURE RETURNS.
THIS MATERIAL IS CONFIDENTIAL AND IS PROVIDED SOLELY FOR PRESENTATION
PURPOSES. IT IS INTENDED FOR QUALIFIED ELIGIBLE PARTICIPANTS ONLY. PAST
PERFORMANCE IS NOT NECESSARILY INDICATIVE OF FUTURE RETURNS.
THIS MATERIAL IS CONFIDENTIAL AND IS PROVIDED SOLELY FOR PRESENTATION
PURPOSES. IT IS INTENDED FOR QUALIFIED ELIGIBLE PARTICIPANTS ONLY. PAST
PERFORMANCE IS NOT NECESSARILY INDICATIVE OF FUTURE RETURNS.
REGULATORY BACKGROUND
TYPHON CAPITAL MANAGEMENT, LLC IS REGISTERED WITH THE U.S. COMMODITY FUTURES TRADING COMMISSION (THE "CFTC") AS A COMMODITY POOL
OPERATOR (“CPO”) AND IS EXEMPT FROM REGISTRATION WITH THE U.S. SECURITIES AND EXCHANGE COMMISSION (THE “SEC”) UNDER SECTION 203(B)(6) OF
THE INVESTMENT ADVISERS ACT OF 1940, AS MODIFIED BY THE DODD-FRANK ACT, AND UNDER SECTION 3(C)(1) OF THE INVESTMENT COMPANY ACT OF 1940.
THIS OFFERING IS EXEMPT FROM REGISTRATION WITH THE SEC BY REASON OF SECTION 4(A)(2) OF THE SECURITIES ACT OF 1933 AND RULE 506 PROMULGATED
THEREUNDER.
PURSUANT TO AN EXEMPTION FROM THE CFTC IN CONNECTION WITH POOLS WHOSE PARTICIPANTS ARE LIMITED TO QUALIFIED ELIGIBLE INVESTORS. A PPM
FOR THESE POOLS IS NOT REQUIRED TO BE, AND HAS NOT BEEN FILED WITH THE CFTC. THE CFTC DOES NOT PASS UPON THE MERITS OF PARTICIPATING IN A
POOL OR UPON THE ADEQUACY OR ACCURACY OF A PRIVATE PLACEMENT MEMORANDUM. CONSEQUENTLY, THE CFTC HAS NOT REVIEWED OR APPROVED THIS
OFFERING OR ANY PPM FOR THESE POOLS.
PURSUANT TO RULE 506(B) OF REGULATION D, THIS POOL IS OFFERED AS A PRIVATE OFFERING UNDER SECTION 4(A)(2) AND ITS INVESTORS ARE LIMITED TO
CERTAIN QUALIFIED INVESTORS.
RISK DISCLOSURE STATEMENT
THE RISK OF LOSS IN TRADING COMMODITIES CAN BE SUBSTANTIAL. YOU SHOULD THEREFORE CAREFULLY CONSIDER WHETHER SUCH TRADING IS SUITABLE
FOR YOU IN LIGHT OF YOUR FINANCIAL CONDITION. IN CONSIDERING WHETHER TO TRADE OR TO AUTHORIZE SOMEONE ELSE TO TRADE FOR YOU, YOU SHOULD
BE AWARE OF THE FOLLOWING:
IF YOU PURCHASE A COMMODITY OPTION YOU MAY SUSTAIN A TOTAL LOSS OF THE PREMIUM AND OF ALL TRANSACTION COSTS.
IF YOU PURCHASE OR SELL A COMMODITY FUTURE OR SELL A COMMODITY OPTION YOU MAY SUSTAIN A TOTAL LOSS OF THE INITIAL MARGIN FUNDS AND ANY
ADDITIONAL FUNDS THAT YOU DEPOSIT WITH YOUR BROKER TO ESTABLISH OR MAINTAIN YOUR POSITION. IF THE MARKET MOVES AGAINST YOUR POSITION,
YOU MAY BE CALLED UPON BY YOUR BROKER TO DEPOSIT A SUBSTANTIAL AMOUNT OF ADDITIONAL MARGIN FUNDS, ON SHORT NOTICE, IN ORDER TO MAINTAIN
YOUR POSITION. IF YOU DO NOT PROVIDE THE REQUIRED FUNDS WITHIN THE PRESCRIBED TIME, YOUR POSITION MAY BE LIQUIDATED AT A LOSS, AND YOU
WILL BE LIABLE FOR ANY RESULTING DEFICIT IN YOUR ACCOUNT.
UNDER CERTAIN MARKET CONDITIONS, YOU MAY FIND IT DIFFICULT OR IMPOSSIBLE TO LIQUIDATE A POSITION. THIS CAN OCCUR, FOR EXAMPLE, WHEN THE
MARKET MAKES A “LIMIT MOVE.” THE PLACEMENT OF CONTINGENT ORDERS BY YOU OR BY YOUR TRADING ADVISOR SUCH AS A “STOP-LOSS” OR “STOP-LIMIT”
ORDER, WILL NOT NECESSARILY LIMIT YOUR LOSSES TO THE INTENDED AMOUNTS, SINCE MARKET CONDITIONS MAY MAKE IT IMPOSSIBLE TO EXECUTE SUCH
ORDERS.
A “SPREAD” POSITION MAY NOT BE LESS RISKY THAN A SIMPLE “LONG” OR “SHORT” POSITION.
THE HIGH DEGREE OF LEVERAGE THAT IS OFTEN OBTAINABLE IN COMMODITY TRADING CAN WORK AGAINST YOU AS WELL AS FOR YOU. THE USE OF LEVERAGE
CAN LEAD TO LARGE LOSSES AS WELL AS GAINS.
IN SOME CASES, MANAGED COMMODITY ACCOUNTS ARE SUBJECT TO SUBSTANTIAL CHARGES FOR MANAGEMENT AND ADVISORY FEES. IT MAY BE NECESSARY
FOR THOSE ACCOUNTS THAT ARE SUBJECT TO THESE CHARGES TO MAKE SUBSTANTIAL TRADING PROFITS TO AVOID DEPLETION OR EXHAUSTION OF THEIR
ASSETS. THE RELEVANT OFFERING DOCUMENTS CONTAIN A COMPLETE DESCRIPTION OF EACH FEE TO BE CHARGED TO YOUR ACCOUNT BY THE COMMODITY
TRADING ADVISOR.
YOU SHOULD ALSO BE AWARE THAT THIS COMMODITY TRADING ADVISOR MAY ENGAGE IN TRADING FOREIGN FUTURES OR OPTIONS CONTRACTS.
TRANSACTIONS ON MARKETS LOCATED OUTSIDE THE UNITED STATES, INCLUDING MARKETS FORMALLY LINKED TO A UNITED STATES MARKET, MAY BE SUBJECT
TO REGULATIONS WHICH OFFER DIFFERENT OR DIMINISHED PROTECTION. FURTHER, UNITED STATES REGULATORY AUTHORITIES MAY BE UNABLE TO COMPEL
THE ENFORCEMENT OF THE RULES OF REGULATORY AUTHORITIES OR MARKETS IN NON-UNITED STATES JURISDICTIONS WHERE YOUR TRANSACTIONS MAY BE
EFFECTED. BEFORE YOU TRADE YOU SHOULD INQUIRE ABOUT ANY RULES RELEVANT TO YOUR PARTICULAR CONTEMPLATED TRANSACTIONS AND ASK THE FIRM
WITH WHICH YOU INTEND TO TRADE FOR DETAILS ABOUT THE TYPES OF REDRESS AVAILABLE IN BOTH YOUR LOCAL AND OTHER RELEVANT JURISDICTIONS.
THIS BRIEF STATEMENT CANNOT DISCLOSE ALL THE RISKS AND OTHER SIGNIFICANT ASPECTS OF THE COMMODITY MARKETS. YOU SHOULD THEREFORE
CAREFULLY STUDY THIS DISCLOSURE DOCUMENT AND COMMODITY TRADING BEFORE YOU TRADE INCLUDING THE DESCRIPTION OF PRINCIPAL RISK FACTORS IN
THE RELEVANT OFFERING DOCUMENTS.
THIS COMMODITY TRADING ADVISOR IS PROHIBITED BY LAW FROM ACCEPTING FUNDS IN THE TRADING ADVISOR’S NAME FROM A CLIENT FOR TRADING
COMMODITY INTERESTS. YOU MUST PLACE ALL FUNDS FOR TRADING IN THIS TRADING PROGRAM DIRECTLY WITH A FUTURES COMMISSION MERCHANT.
THIS MATERIAL IS CONFIDENTIAL AND IS PROVIDED SOLELY FOR PRESENTATION
PURPOSES. IT IS INTENDED FOR QUALIFIED ELIGIBLE PARTICIPANTS ONLY. PAST
PERFORMANCE IS NOT NECESSARILY INDICATIVE OF FUTURE RETURNS.

.
Etymology
THIS MATERIAL IS CONFIDENTIAL AND IS PROVIDED SOLELY FOR PRESENTATION
PURPOSES. IT IS INTENDED FOR QUALIFIED ELIGIBLE PARTICIPANTS ONLY. PAST
PERFORMANCE IS NOT NECESSARILY INDICATIVE OF FUTURE RETURNS.
Name: Ty·phon
Pronunciation: \ˈtī-ˌfän\
Etymology: Latin, from Greek Typhōn
n: (Greek mythology) a monster with a hundred heads and one of
the whirlwinds; son of Typhoneus and Echidna; father of
Cerberus and the Chimera and the Sphinx.
THIS MATERIAL IS CONFIDENTIAL AND IS PROVIDED SOLELY FOR PRESENTATION
PURPOSES. IT IS INTENDED FOR QUALIFIED ELIGIBLE PARTICIPANTS ONLY. PAST
PERFORMANCE IS NOT NECESSARILY INDICATIVE OF FUTURE RETURNS.
n: a deconstructed multi-strategy trading firm, where niche
managers can focus only on trading under an umbrella of unified
operations, compliance, independent risk management, and
business development. Clients can access these modular exposures
a la carte or via custom portfolios in Cayman or U.S. funds, or
managed accounts.

.
Passive Commodities Have No Intrinsic Returns
THIS MATERIAL IS CONFIDENTIAL AND IS PROVIDED SOLELY FOR PRESENTATION
PURPOSES. IT IS INTENDED FOR QUALIFIED ELIGIBLE PARTICIPANTS ONLY. PAST
PERFORMANCE IS NOT NECESSARILY INDICATIVE OF FUTURE RETURNS.
“Commodities are like dead money. They do not pay any interest or dividends
and are not expected to earn any return over the inflation rate. A bar of gold does
not generate any cash and will never turn into two bars of gold. Year
after year it just sits there, costing you money in storage, insurance and perhaps a
management fee if you invest in a gold ETF.”
Rick Ferri- http://online.wsj.com/news/articles/SB10001424127887323681904578643822549165446
THIS MATERIAL IS CONFIDENTIAL AND IS PROVIDED SOLELY FOR PRESENTATION
PURPOSES. IT IS INTENDED FOR QUALIFIED ELIGIBLE PARTICIPANTS ONLY. PAST
PERFORMANCE IS NOT NECESSARILY INDICATIVE OF FUTURE RETURNS.

.
Typhon Generates Alpha with Tactical Trading
http://managed-futures-blog.attaincapital.com/2014/08/25/trade-commodities-instead-of-invest-in-them/
Tactical traders can
profit from moves
to the downside of
commodity prices.
Unlike with equities,
it is simple to short
commodities, and
active trading
strategies have no
directional bias.
THIS MATERIAL IS CONFIDENTIAL AND IS PROVIDED SOLELY FOR PRESENTATION
PURPOSES. IT IS INTENDED FOR QUALIFIED ELIGIBLE PARTICIPANTS ONLY. PAST
PERFORMANCE IS NOT NECESSARILY INDICATIVE OF FUTURE RETURNS.

.
What Typhon looks for in a Manager
Defined edge
DifferentiatedStrategy
Uncorrelated returns
Typhon looks for managers that
have a clearly defined edge within
the markets they trade. In most
cases, this leads us to focused,
niche managers.
Typhon’s strategies are
uncorrelated to each other as well
as the broader universe of stocks,
bonds, real estate, hedge funds,
and CTAs.
THIS MATERIAL IS CONFIDENTIAL AND IS PROVIDED SOLELY FOR PRESENTATION
PURPOSES. IT IS INTENDED FOR QUALIFIED ELIGIBLE PARTICIPANTS ONLY. PAST
PERFORMANCE IS NOT NECESSARILY INDICATIVE OF FUTURE RETURNS.

.
Typhon Benefits
Favorable Tax Treatment
Typhon investments have 60/40 long-term/short-term capital gains taxation for U.S. investors.
Liquidity
Typhon SMAs have daily liquidity, while our strategies available on platforms have intra-month liquidity.
Transparency
Typhon offers full transparency in near real-time.
THIS MATERIAL IS CONFIDENTIAL AND IS PROVIDED SOLELY FOR PRESENTATION
PURPOSES. IT IS INTENDED FOR QUALIFIED ELIGIBLE PARTICIPANTS ONLY. PAST
PERFORMANCE IS NOT NECESSARILY INDICATIVE OF FUTURE RETURNS.

.
Typhon Risk Management
THIS MATERIAL IS CONFIDENTIAL AND IS PROVIDED SOLELY FOR PRESENTATION
PURPOSES. IT IS INTENDED FOR QUALIFIED ELIGIBLE PARTICIPANTS ONLY. PAST
PERFORMANCE IS NOT NECESSARILY INDICATIVE OF FUTURE RETURNS.
Independence The Risk Committee is independent from each of our trading groups. We protect our investors by ensuring that our managers are operating within their guidelines.
Empowered The Risk Committee has the authority to reduce exposure in the event that a manager has breached its risk limits. It is important to draw a distinction between risk management and risk monitoring.
Proprietary Tools Typhon has developed a suite of proprietary tools that are customized for each strategy.
Pre-established Risk Limits Risk criteria is not ad-hoc. The Risk Committee establishes risk guidelines for each manager before it starts trading on our platform.
Regular Review of all Strategies All strategies are reviewed on a regular basis; not just when there are issues. The Risk Committee is constantly aware of the trading positions. It wants to be aware of any potential issues before they develop and work collaboratively with our managers to help them best position their portfolios.
Value-Additive Feedback Because the Risk Committee is comprised of experienced risk managers, we work with our managers to help them structure positions with the most appropriate risk profile. We strive to be collaborative not solely overseers.
Risk Reporting We make our risk analytics available to our investors. We view this as an important part of our ongoing transparency.
THIS MATERIAL IS CONFIDENTIAL AND IS PROVIDED SOLELY FOR PRESENTATION
PURPOSES. IT IS INTENDED FOR QUALIFIED ELIGIBLE PARTICIPANTS ONLY. PAST
PERFORMANCE IS NOT NECESSARILY INDICATIVE OF FUTURE RETURNS.

.
The Typhon DistinctionMarket Coverage Typhon is plugged-in to the universe of emerging traders, and identifies distinctive specialists with defined edges.
Due Diligence Typhon has a rigorous due diligence process to cull the universe of emerging managers before bringing them into Typhon.
Operational Support Typhon provides its managers with best-in-class legal, compliance, accounting and administrative support. This tempers one of the largest risks associated with emerging traders.
Risk Oversight Typhon has an independent, empowered risk management committee that monitors our strategies on a daily basis.
Investor Relations Typhon has well-established relationships across the universe of investors in emerging and tactical traders.
No Additional Fees We work with our managers, not in addition to our managers. Our investors do not incur any fees, unlike with fund-of-funds or consultants.
THIS MATERIAL IS CONFIDENTIAL AND IS PROVIDED SOLELY FOR PRESENTATION
PURPOSES. IT IS INTENDED FOR QUALIFIED ELIGIBLE PARTICIPANTS ONLY. PAST
PERFORMANCE IS NOT NECESSARILY INDICATIVE OF FUTURE RETURNS.
Typhon Capital Management
Market Coverage
Due Diligence
Operational Support
Risk Oversight
Investor Relations
No Additional
Fees

.
Investor Protection
Commitment
Client Advocacy
Integrity
Typhon protects clients by:
• Advocating for customer protections. Our
CEO co-founded the Commodity
Customer Coalition and represented
approximately 10,000 MF Global
customers to help bring about a 100%
recovery for them, completely pro bono. He
also served on the Board of Directors and
Executive Committee of the National
Futures Association.
• Playing an active role in ensuring that
market participants are properly
represented.
• Ensuring those same ethical standards are
upheld by our managers and staff.
THIS MATERIAL IS CONFIDENTIAL AND IS PROVIDED SOLELY FOR PRESENTATION
PURPOSES. IT IS INTENDED FOR QUALIFIED ELIGIBLE PARTICIPANTS ONLY. PAST
PERFORMANCE IS NOT NECESSARILY INDICATIVE OF FUTURE RETURNS.

.
Typhon’s Divisions
Our strategies are specialized,
modular, and structure agnostic.
Each is available a la carte in
separately managed accounts or in
U.S. or Cayman funds within our
Argos Alternative Funds Platform.
Clients can build their own custom
portfolios, or have us construct one
that provides acceptable risk based
on the demands of the overall
portfolio.
Typhon never charges layered fees,
even for multi-manager products.
A Modular Approach to Allocations
THIS MATERIAL IS CONFIDENTIAL AND IS PROVIDED SOLELY FOR PRESENTATION
PURPOSES. IT IS INTENDED FOR QUALIFIED ELIGIBLE PARTICIPANTS ONLY. PAST
PERFORMANCE IS NOT NECESSARILY INDICATIVE OF FUTURE RETURNS.
leonidasEnergy/Macro
plutusGrain
vulcan Metals
proteusVolatility
chironCurrency
helios Deutsche
stoicRules-Based
zephyrusLivestock

.
Typhon Organization
THIS MATERIAL IS CONFIDENTIAL AND IS PROVIDED SOLELY FOR PRESENTATION
PURPOSES. IT IS INTENDED FOR QUALIFIED ELIGIBLE PARTICIPANTS ONLY. PAST
PERFORMANCE IS NOT NECESSARILY INDICATIVE OF FUTURE RETURNS.
James KoutoulasChief Executive Officer
Operations and Compliance
Diana RydbeckManaging Director
Alex KaraDirector of Operations
Due Diligence and Risk
David KlusendorfChief Investment Officer
Portfolio Management
Agricultural
Jerod LemanPortfolio Manager
Nick NickolsPortfolio Manager
Metals
James Gallo
Portfolio Manager
Anthony Cicileo
Senior Trader
Ed Smith
Senior Trader
Crypto, Energy, Macro
George Michalopoulos
Portfolio Manager
Stoic Rules-Based
Alex GreenPortfolio Manager
SystematicCurrency
Simon HarrisPortfolio Manager
Luca BonoCurrency Strategist
James MitchellSenior Trader
Nicholas BloomPortfolio Manager
SystematicStock Index
Hubert Van den Bergh
Portfolio Manager
Damian Taylor
Portfolio Manager
SystematicVolatility
Matthew Thompson
Portfolio Manager
Michael Thompson
Portfolio Manager
Business Development
Robin Ravel Director
Ernst Kosower Director

.
Strategies at a Glance
THIS MATERIAL IS CONFIDENTIAL AND IS PROVIDED SOLELY FOR PRESENTATION
PURPOSES. IT IS INTENDED FOR QUALIFIED ELIGIBLE PARTICIPANTS ONLY. PAST
PERFORMANCE IS NOT NECESSARILY INDICATIVE OF FUTURE RETURNS.
Please see each strategy's one-page performance summary and offering materials for detailed information about the above
calculations. Strategies with less than 12 months track record do not have annualized return statistics.
Our Argos Alternative Funds Platform allows investors to access Typhon’s unique tactical trading
strategies with low minimum investment sizes within pooled, limited liability structures in either the
U.S. or Cayman Islands. Investors may invest in any individual strategy independently, or create
custom portfolios. Argos utilizes top service providers such as BMO for custody, Deloitte for
audit, Foley & Lardner for legal, and NAV Consulting for administration.
Our Argos Alternative Funds Platform
trade
generation
sharpe
ratio
annualized
return
leonidas Cryptocurrency Multi-Strategy
leonidas Macro Multi-Strategy
proteus Dynamic ETP Hybrid 0.8 15.3%
stoic Rules-Based Strategies Systematic 1.0 29.2%
vulcan Metals Discretionary 2.5 17.8%
vulcan Metals SP Discretionary 2.4 17.1%

.
Strategies at a Glance
THIS MATERIAL IS CONFIDENTIAL AND IS PROVIDED SOLELY FOR PRESENTATION
PURPOSES. IT IS INTENDED FOR QUALIFIED ELIGIBLE PARTICIPANTS ONLY. PAST
PERFORMANCE IS NOT NECESSARILY INDICATIVE OF FUTURE RETURNS.
Please see each strategy's one-page performance summary and disclosure document for detailed information about the above calculations. Futures trading is inherently risky and past
performance is not necessarily indicative of future returns. Typhon Capital Management only provides services for Qualified Eligible Participants and non-US Investors. Strategies with less
than 12 months track record do not have annualized return statistics.
Separately Managed Accounts
Typhon strives to offer sophisticated clients maximum flexibility in structuring its strategies.
All of our futures-based strategies are available in separately managed accounts with daily
liquidity, position-level transparency, cross-margining and choice of virtually any clearing
broker which accepts give-ups.
trade
generation
sharpe
ratio
annualized
return
notional
funding
available
chiron Currency Systematic 0.5 2.5% 5:1
helios Deutsche Systematic 0.9 7.5% 4:1
leonidas Cryptocurrency Quantitative 1:1
leonidas Energy Discretionary 5:1
proteus Dynamic Volatility Systematic 0.4 3.1% 5:1
plutus Grain Discretionary 0.8 6.9% 5:1
vulcan Metals Discretionary 2.3 15.5% 5:1
zephyrus Livestock Discretionary 1.5 45.7% 3:1

METALSvulcan METALS GROUP
THIS MATERIAL IS CONFIDENTIAL AND IS PROVIDED SOLELY FOR PRESENTATION
PURPOSES. IT IS INTENDED FOR QUALIFIED ELIGIBLE PARTICIPANTS ONLY. PAST
PERFORMANCE IS NOT NECESSARILY INDICATIVE OF FUTURE RETURNS.
THIS MATERIAL IS CONFIDENTIAL AND IS PROVIDED SOLELY FOR PRESENTATION
PURPOSES. IT IS INTENDED FOR QUALIFIED ELIGIBLE PARTICIPANTS ONLY. PAST
PERFORMANCE IS NOT NECESSARILY INDICATIVE OF FUTURE RETURNS.

.
vulcan Metals Group
Strategy at a Glance
The Vulcan Metals Group trades metals on a discretionary basis and is comprised of James Gallo, Edward Smith, and
Anthony Cicileo. Utilizing a global network of information on mining, usage, historical movements, and need, and
proprietary research, the methodology is exacting yet flexible enough to capitalize on daily market irregularities. Vulcan
trades a variety of metals including copper, gold, silver, platinum and palladium. Vulcan primarily engages in relative value
futures spreads, roll arbitrage, LME/COMEX arbitrage, and flow trading. The full Vulcan methodology which includes
additional strategies for futures market making and physical metals warrants is available in US and Cayman funds on our
Argos Alternative Funds platform.
AUM $39.4M
Minimum Investment US $100k fund, $10M SMA
Management Fee 2%
Incentive Allocation 20%
Max Notional Funding 5:1
Max Margin : Equity 10.0%
Liquidity SMA Daily
THIS MATERIAL IS CONFIDENTIAL AND IS PROVIDED SOLELY FOR PRESENTATION
PURPOSES. IT IS INTENDED FOR QUALIFIED ELIGIBLE PARTICIPANTS ONLY. PAST
PERFORMANCE IS NOT NECESSARILY INDICATIVE OF FUTURE RETURNS.

.
vulcan Metals Fund
THIS MATERIAL IS CONFIDENTIAL AND IS PROVIDED SOLELY FOR PRESENTATION
PURPOSES. IT IS INTENDED FOR QUALIFIED ELIGIBLE PARTICIPANTS ONLY. PAST
PERFORMANCE IS NOT NECESSARILY INDICATIVE OF FUTURE RETURNS.
Performance prior to June 2016 is proprietary pro forma for 2/20 fees, at a 2.25M nominal account size, and an estimated $1,000 per month in extra commissions to
reflect non-member rates by NAV Consulting, Inc. Performance from June 2016 through February 2017 is a composite of client managed accounts net of actual fees,
and the performance of the Vulcan Metals Fund net of all fees and expenses thereafter. Please see offering materials for more notes and risk factors.
Year Jan Feb Mar Apr May Jun Jul Aug Sep Oct Nov Dec Year
2018 0.13% 1.63% 1.76%
2017 (0.79%) 0.56% 0.84% 2.34% 0.37% 0.73% 0.16% 0.48% 0.80% 1.53% 0.52% 1.49% 9.38%
2016 2.04% 0.31% (1.81%) 2.37% 2.70% 0.31% 0.43% 0.28% 0.14% 0.06% (0.50%) (1.12%) 5.23%
2015 1.60% 5.23% 1.35% 0.29% 1.54% 3.50% 2.54% 5.25% 0.42% (0.49%) 5.54% 0.32% 30.41%
2014 1.61% 8.29% 0.89% 4.07% 1.34% 0.08% 0.65% 2.10% 0.84% 2.42% 2.40% 0.39% 27.84%
2013 1.04% 0.34% 1.82% 2.40% (0.06%) 3.28% 1.03% 1.62% 1.08% (0.60%) 2.56% 0.67% 16.20%
2012 2.47% 0.19% 1.43% 7.93% 0.37% 2.92% 4.23% 2.97% 2.64% 1.24% (4.44%) (0.47%) 23.15%
2011 1.01% 0.33% 1.34%
Monthly Net Performance
Growth of $1,000
Year Jan Feb Mar Apr May Jun Jul Aug Sep Oct Nov Dec Year
2018 0.13% 1.63% 0.85% 2.63%
2017 (0.79%) 0.56% 0.84% 2.34% 0.37% 0.73% 0.16% 0.48% 0.80% 1.53% 0.52% 1.49% 9.38%
2016 2.04% 0.31% (1.81%) 2.37% 2.70% 0.31% 0.43% 0.28% 0.14% 0.06% (0.50%) (1.12%) 5.23%
2015 1.60% 5.23% 1.35% 0.29% 1.54% 3.50% 2.54% 5.25% 0.42% (0.49%) 5.54% 0.32% 30.41%
2014 1.61% 8.29% 0.89% 4.07% 1.34% 0.08% 0.65% 2.10% 0.84% 2.42% 2.40% 0.39% 27.84%
2013 1.04% 0.34% 1.82% 2.40% (0.06%) 3.28% 1.03% 1.62% 1.08% (0.60%) 2.56% 0.67% 16.20%
2012 2.47% 0.19% 1.43% 7.93% 0.37% 2.92% 4.23% 2.97% 2.64% 1.24% (4.44%) (0.47%) 23.15%
2011 1.01% 0.33% 1.34%
Monthly Net Performance
-6%
-4%
-2%
0%
2%
4%
6%
8%
10%
$0
$500
$1,000
$1,500
$2,000
$2,500
11/11 11/12 11/13 11/14 11/15 11/16 11/17
Vulcan Fund Monthly Return Vulcan FundBarclayHedge CTA Index HFRX COM
Vulcan Fund BH1 HFR COM 1
Annualized Return 17.77% 0.71% (1.90%)
Max Drawdown (4.91%) (7.38%) (11.98%)
Largest Gain 8.29% 3.07% 3.80%
Largest Loss (4.44%) (2.21%) (4.86%)
Sharpe Ratio 2.51 0.19 (0.39)
Sortino Ratio 2.36 0.08 (0.15)
Volatility (σ) 6.64% 4.14% 4.67%
Correlation (r) 0.20 0.09
Selected Statistics

.
vulcan Metals Strategy
THIS MATERIAL IS CONFIDENTIAL AND IS PROVIDED SOLELY FOR PRESENTATION
PURPOSES. IT IS INTENDED FOR QUALIFIED ELIGIBLE PARTICIPANTS ONLY. PAST
PERFORMANCE IS NOT NECESSARILY INDICATIVE OF FUTURE RETURNS.
Performance prior to June 2016 is proprietary pro forma for 2/20 fees, at a 2.25M nominal account size, and an estimated $1,000 per month in extra commissions to
reflect non-member rates by NAV Consulting, Inc. Performance thereafter is a composite of client accounts net of actual fees. For more information on the HFRX
Commodity and BarclayHedge CTA indices, please see hfr.com and barclayhedge.com, respectively. Please see offering materials for more notes and risk factors.
Growth of $1,000
-6%
-4%
-2%
0%
2%
4%
6%
8%
10%
$0
$500
$1,000
$1,500
$2,000
$2,500
11/11 11/12 11/13 11/14 11/15 11/16 11/17
Vulcan Monthly Return Vulcan
BarclayHedge CTA Index HFRX COM
Vulcan BH1 HFRX COM 1
Margin:Equity Avg, Max 2.5%, 10%
Annualized Return 15.49% 0.71% (1.90%)
Max Drawdown (4.91%) (7.38%) (11.98%)
Largest Gain 8.29% 3.07% 3.80%
Largest Loss (4.44%) (2.21%) (4.86%)
Sharpe Ratio 2.30 0.19 (0.39)
Sortino Ratio 2.19 0.08 (0.15)
Volatility (σ) 6.74% 4.14% 4.67%
Correlation (r) 0.19 0.13
Selected Statistics
Year Jan Feb Mar Apr May Jun Jul Aug Sep Oct Nov Dec Year
2018 0.71% 0.32% (0.02%) 1.01%
2017 (0.77%) 0.58% 1.51% 0.37% 0.02% (0.23%) 0.64% 0.10% 0.20% (0.08%) 0.30% 0.15% 2.79%
2016 2.04% 0.31% (1.81%) 2.37% 2.70% 0.36% 0.45% 0.28% 0.14% 0.15% (0.47%) (1.10%) 5.42%
2015 1.60% 5.23% 1.35% 0.29% 1.54% 3.50% 2.54% 5.25% 0.42% (0.49%) 5.54% 0.32% 27.09%
2014 1.61% 8.29% 0.89% 4.07% 1.34% 0.08% 0.65% 2.10% 0.84% 2.42% 2.40% 0.39% 25.08%
2013 1.04% 0.34% 1.82% 2.40% (0.06%) 3.28% 1.03% 1.62% 1.08% (0.60%) 2.56% 0.67% 15.18%
2012 2.47% 0.19% 1.43% 7.93% 0.37% 2.92% 4.23% 2.97% 2.64% 1.24% (4.44%) (0.47%) 21.48%
2011 1.01% 0.33% 1.34%
Monthly Net Performance

.
vulcan Strategy Focus
Vulcan trades a variety of metals including copper, gold, silver, platinum and palladium. Vulcan adapts to changing market
conditions, the strategy employs intra-commodity spreads to yield additional low risk returns. The majority of Vulcan’s
trades are relative value future spreads, but it also utilizes some outrights, options-on-futures, NYMEX/LME arbitrage,
and, in our funds, sub-strategies involving physical delivery of warehouse receipts.
THIS MATERIAL IS CONFIDENTIAL AND IS PROVIDED SOLELY FOR PRESENTATION
PURPOSES. IT IS INTENDED FOR QUALIFIED ELIGIBLE PARTICIPANTS ONLY. PAST
PERFORMANCE IS NOT NECESSARILY INDICATIVE OF FUTURE RETURNS.
Silver
Copper
Gold Palladium
Platinum
.
vulcan Edge
Historical Movements
Assessing Need
Research, Mining Data
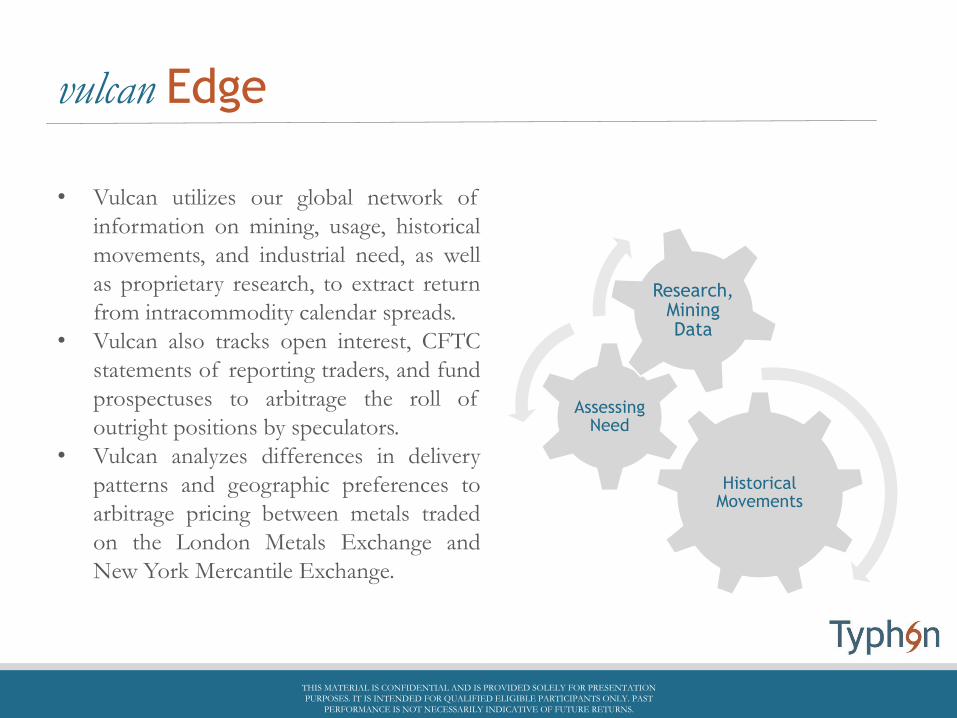
• Vulcan utilizes our global network of
information on mining, usage, historical
movements, and industrial need, as well
as proprietary research, to extract return
from intracommodity calendar spreads.
• Vulcan also tracks open interest, CFTC
statements of reporting traders, and fund
prospectuses to arbitrage the roll of
outright positions by speculators.
• Vulcan analyzes differences in delivery
patterns and geographic preferences to
arbitrage pricing between metals traded
on the London Metals Exchange and
New York Mercantile Exchange.
THIS MATERIAL IS CONFIDENTIAL AND IS PROVIDED SOLELY FOR PRESENTATION
PURPOSES. IT IS INTENDED FOR QUALIFIED ELIGIBLE PARTICIPANTS ONLY. PAST
PERFORMANCE IS NOT NECESSARILY INDICATIVE OF FUTURE RETURNS.

.
vulcan Risk Management
Protection is a key element in generating
returns - robust risk management is at the
core of this protection. We believe that
associated costs are more than
compensated for in times of market stress,
and the strategy generates strong positive
returns in rising markets.
Risk is actively managed through strict risk
budget limits at portfolio and individual
metals levels, with drawdown limits set and
enforced by Typhon’s Independent Risk
Committee.
Vulcan’s portfolio managers have traded
this strategy for between 20 and 30 years
each with their own money and all have
skin in the game.
Budget Limits
Positive Returns
Robust Risk Management
THIS MATERIAL IS CONFIDENTIAL AND IS PROVIDED SOLELY FOR PRESENTATION
PURPOSES. IT IS INTENDED FOR QUALIFIED ELIGIBLE PARTICIPANTS ONLY. PAST
PERFORMANCE IS NOT NECESSARILY INDICATIVE OF FUTURE RETURNS.

AGRICULTUREplutus GRAIN STRATEGY
zephyrus LIVESTOCK STRATEGY
THIS MATERIAL IS CONFIDENTIAL AND IS PROVIDED SOLELY FOR PRESENTATION
PURPOSES. IT IS INTENDED FOR QUALIFIED ELIGIBLE PARTICIPANTS ONLY. PAST
PERFORMANCE IS NOT NECESSARILY INDICATIVE OF FUTURE RETURNS.
THIS MATERIAL IS CONFIDENTIAL AND IS PROVIDED SOLELY FOR PRESENTATION
PURPOSES. IT IS INTENDED FOR QUALIFIED ELIGIBLE PARTICIPANTS ONLY. PAST
PERFORMANCE IS NOT NECESSARILY INDICATIVE OF FUTURE RETURNS.

.
plutus Grain Strategy
Strategy at a Glance
The Plutus Grain Strategy is a discretionary, diversified grain strategy designed to capture returns from the grain
markets with a low correlation to traditional assets. This methodology prioritizes capital preservation and seeks to
provide returns at a low level of volatility when compared to most other grain strategies.
THIS MATERIAL IS CONFIDENTIAL AND IS PROVIDED SOLELY FOR PRESENTATION
PURPOSES. IT IS INTENDED FOR QUALIFIED ELIGIBLE PARTICIPANTS ONLY. PAST
PERFORMANCE IS NOT NECESSARILY INDICATIVE OF FUTURE RETURNS.
AUM $19.25mm
Minimum Investment US $250k for SMA
Management Fee 2%
Incentive Allocation 20%
Max Notional Funding 5 : 1
Max Margin : Equity 5%
Liquidity SMA Daily

.
plutus Grain Strategy
Performance prior to September 2010 is proprietary pro forma for 2/20 fees and a composite of client net returns thereafter. For more information on the
BarclayHedge CTA and HFR Commodity indices, please see barclayhedge.com and HFR.com, respectively. Please see offering materials for more notes and risk
factors.
THIS MATERIAL IS CONFIDENTIAL AND IS PROVIDED SOLELY FOR PRESENTATION
PURPOSES. IT IS INTENDED FOR QUALIFIED ELIGIBLE PARTICIPANTS ONLY. PAST
PERFORMANCE IS NOT NECESSARILY INDICATIVE OF FUTURE RETURNS.
Growth of $1,000 Plutus BH1 HFR COM1
Annualized Return 6.94% 1.43% (2.18%)
Max Margin to Equity 5.00%
Max Drawdown (10.34%) (10.74%) (22.41%)
Largest Gain 11.74% 3.54% 3.80%
Largest Loss (7.66%) (2.94%) (4.86%)
Sharpe Ratio 0.76 0.32 (0.41)
Sortino Ratio 0.35 0.14 (0.16)
Volatility (σ) 9.16% 4.75% 5.07%
Correlation (r) -0.21% -5.18%
Selected Statistics
Year Jan Feb Mar Apr May Jun Jul Aug Sep Oct Nov Dec Year
2018 (0.17%) (0.51%) 2.22% 1.54%
2017 (1.13%) 1.03% 0.77% 1.58% 0.73% 4.41% (2.28%) (2.80%) 0.65% 0.50% 0.04% 0.30% 3.80%
2016 0.65% 0.40% 0.50% (5.18%) (1.23%) 0.35% 1.09% (1.98%) 0.13% (0.29%) 0.13% 0.71% (4.72%)
2015 0.81% (0.46%) 2.20% 0.55% 0.92% (1.34%) 3.49% 0.79% (0.76%) 0.16% 0.41% 0.35% 7.12%
2014 (0.54%) (4.16%) (1.55%) (1.73%) 1.46% 3.42% 1.96% 0.51% 0.17% (5.16%) 2.25% 0.96% (2.41%)
2013 (0.03%) 1.10% 0.52% 0.36% 1.49% (0.56%) 0.97% 0.13% 0.59% (0.05%) (0.16%) 0.88% 5.24%
2012 1.83% (0.57%) (3.75%) (0.86%) 0.93% 0.02% 2.01% 1.52% 0.06% 1.33% (0.59%) 0.08% 2.01%
2011 0.01% 0.14% 2.56% 2.32% 1.57% 2.66% 0.90% (1.81%) 2.22% 1.18% 1.13% (0.85%) 12.03%
2010 11.74% (0.78%) 0.96% 6.14% (1.53%) 7.32% (6.21%) 1.79% 1.97% 2.26% 1.02% 0.70% 25.38%
2009 1.32% (7.66%) (2.68%) 1.43% 6.01% 7.04% (4.30%) 3.49% 1.42% 4.46% 1.31% (7.04%) 4.81%
2008 8.05% 4.05% 0.09% 0.76% 0.57% (0.03%) (0.48%) 1.55% 0.07% 14.63%
Monthly Net Performance

.
plutus Approach
THIS MATERIAL IS CONFIDENTIAL AND IS PROVIDED SOLELY FOR PRESENTATION
PURPOSES. IT IS INTENDED FOR QUALIFIED ELIGIBLE PARTICIPANTS ONLY. PAST
PERFORMANCE IS NOT NECESSARILY INDICATIVE OF FUTURE RETURNS.
The Plutus Grain Strategy is a
discretionary strategy based on a
combination of supply/demand
fundamentals and technical analysis
which attempts to define trends and/or
changes in trends in various agricultural
commodity markets. Fundamental
analysis incorporates factors such as
production, domestic and foreign
demand, storage cost and availability,
governmental issues, and weather, both
in the United States and around the
world. Plutus primarily trades
agricultural futures spreads including
but not limited to corn, soybeans,
wheat, soybean meal, soy oil, oats, and
rice.
production
foreign demand
domestic demand
availability
government issues
weather
storage cost
THIS MATERIAL IS CONFIDENTIAL AND IS PROVIDED SOLELY FOR PRESENTATION
PURPOSES. IT IS INTENDED FOR QUALIFIED ELIGIBLE PARTICIPANTS ONLY. PAST
PERFORMANCE IS NOT NECESSARILY INDICATIVE OF FUTURE RETURNS.

.
plutus Risk Management
The Plutus Grain Strategy primarily
expresses trading views through
spreads in order to reduce volatility.
Approximately 90% of Plutus’
positions utilize futures spreads,
some of which are described in the
diagram on the right.
Plutus may take positions in the
futures and or options markets when
market conditions meet our risk
parameters. The strategy generally
maintains a sub-5% margin-to-equity
ratio, and never exceeds 10%.
Plutus does not sell naked options.
Intra-commodity spreads between calendar months,
example: December corn vs. March corn
Inter-commodity spreads between
different commodities,
example: December soy oil vs. December
soybean meal
plutus
Inter-market spreads between markets, example: Chicago
December wheat vs. Kansas City
December wheat
THIS MATERIAL IS CONFIDENTIAL AND IS PROVIDED SOLELY FOR PRESENTATION
PURPOSES. IT IS INTENDED FOR QUALIFIED ELIGIBLE PARTICIPANTS ONLY. PAST
PERFORMANCE IS NOT NECESSARILY INDICATIVE OF FUTURE RETURNS.

.
plutus Edge
Information Flow
The portfolio manager for the strategies remains active in the cash markets, structuring futures and swap hedges for many pure users and producers of agricultural commodities. This gives us a significant information advantage and insight into fundamentals ahead of the broader market.
Risk Management
Typhon strives to provide a low-volatility return profile across its strategies. Unlike most fundamental ag programs, plutus maintains low margin-to-equity usage and defined stops and profit targets on every trade. Both programs use technicalsto guide entries and exits. Frequently positions are developed prior to markets catalyzing execution.
THIS MATERIAL IS CONFIDENTIAL AND IS PROVIDED SOLELY FOR PRESENTATION
PURPOSES. IT IS INTENDED FOR QUALIFIED ELIGIBLE PARTICIPANTS ONLY. PAST
PERFORMANCE IS NOT NECESSARILY INDICATIVE OF FUTURE RETURNS.

.
zephyrus Livestock Strategy
Strategy at a Glance
The Zephyrus Livestock Strategy is a discretionary livestock strategy designed to capture returns from the
hog and cattle markets with a low correlation to traditional assets. This methodology incorporates both
fundamental data and technical analysis and prioritizes capital preservation and seeks to provide returns at
a moderate level of volatility.
AUM 250k
Minimum Investment U.S. 250k
Management Fee 0%
Incentive Allocation 30%
Liquidity Daily
THIS MATERIAL IS CONFIDENTIAL AND IS PROVIDED SOLELY FOR PRESENTATION
PURPOSES. IT IS INTENDED FOR QUALIFIED ELIGIBLE PARTICIPANTS ONLY. PAST
PERFORMANCE IS NOT NECESSARILY INDICATIVE OF FUTURE RETURNS.

.
zephyrus Livestock Strategy
THIS MATERIAL IS CONFIDENTIAL AND IS PROVIDED SOLELY FOR PRESENTATION
PURPOSES. IT IS INTENDED FOR QUALIFIED ELIGIBLE PARTICIPANTS ONLY. PAST
PERFORMANCE IS NOT NECESSARILY INDICATIVE OF FUTURE RETURNS.
Performance figures are a composite of live returns net of all expenses with fees pro forma to 0/30. For more information on the BarclayHedge CTA and HFR
Commodity indices, please see barclayhedge.com and HFR.com, respectively. Please see offering materials for more notes and risk factors.
Growth of $1,000
Year Jan Feb Mar Apr May Jun Jul Aug Sep Oct Nov Dec Year
2018 6.24% 1.92% 2.91% 11.07%
2017 5.60% 6.37% (6.53%) 7.47% 7.62% 26.10% 5.78% (6.59%) 4.90% (13.97%) 8.24% 1.06% 46.05%
Monthly Net Performance
-20%
-15%
-10%
-5%
0%
5%
10%
15%
20%
25%
30%
$0
$500
$1,000
$1,500
$2,000
1/17 1/18
Zephyrus Monthly Return Zephyrus BarclayHedge CTA Index HFRX COM
Zephyrus BH1 HFR COM 1
Annualized Return 45.70% 2.12% (2.87%)
Max Margin to Equity 25%
Max Drawdown (15.66%) (1.68%) (5.15%)
Largest Gain 26.10% 1.92% 3.80%
Largest Loss (13.97%) (1.03%) (4.86%)
Sharpe Ratio 1.48 0.80 (0.45)
Sortino Ratio 0.80 0.44 (0.18)
Volatility (σ) 30.82% 2.67% 6.03%
Correlation (r) -56.98% 20.90%
Selected Statistics
.
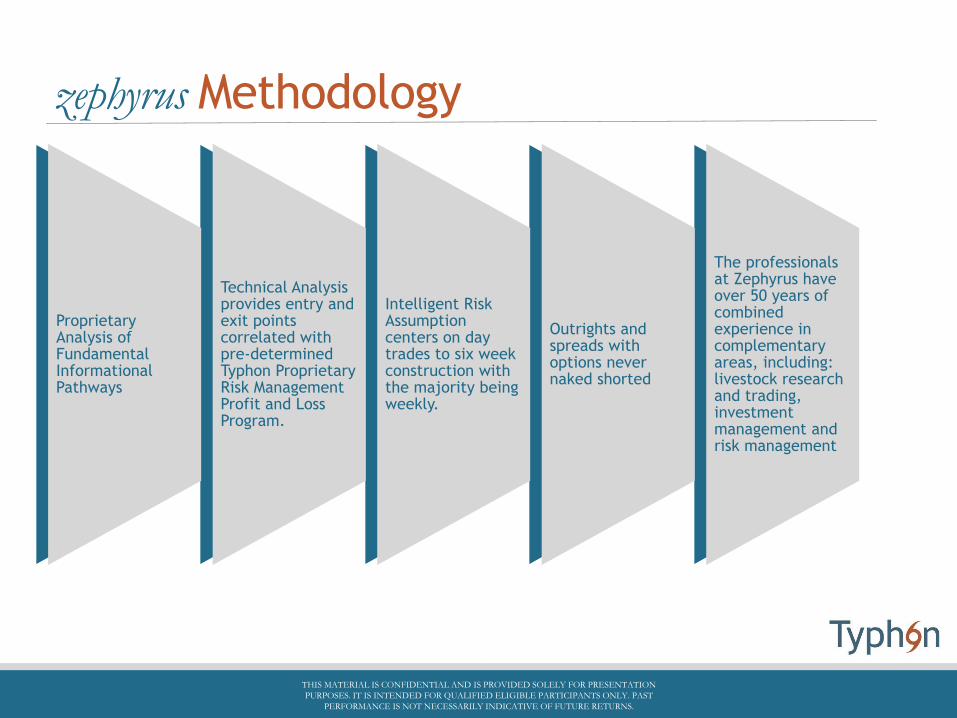
Proprietary Analysis of Fundamental Informational Pathways
Technical Analysis provides entry and exit points correlated with pre-determined Typhon Proprietary Risk Management Profit and Loss Program.
Intelligent Risk Assumption centers on day trades to six week construction with the majority being weekly.
Outrights and spreads with options never naked shorted
The professionals at Zephyrus have over 50 years of combined experience in complementary areas, including: livestock research and trading, investment management and risk management
zephyrus Methodology
THIS MATERIAL IS CONFIDENTIAL AND IS PROVIDED SOLELY FOR PRESENTATION
PURPOSES. IT IS INTENDED FOR QUALIFIED ELIGIBLE PARTICIPANTS ONLY. PAST
PERFORMANCE IS NOT NECESSARILY INDICATIVE OF FUTURE RETURNS.
Proprietary Analysis of Fundamental Informational Pathways
Technical Analysis provides entry and exit points correlated with pre-determined Typhon Proprietary Risk Management Profit and Loss Program.
Intelligent Risk Assumption centers on day trades to six week construction with the majority being weekly.
Outrights and spreads with options never naked shorted
The professionals at Zephyrus have over 50 years of combined experience in complementary areas, including: livestock research and trading, investment management and risk management

.
zephyrus Summary
THIS MATERIAL IS CONFIDENTIAL AND IS PROVIDED SOLELY FOR PRESENTATION
PURPOSES. IT IS INTENDED FOR QUALIFIED ELIGIBLE PARTICIPANTS ONLY. PAST
PERFORMANCE IS NOT NECESSARILY INDICATIVE OF FUTURE RETURNS.
Fundamental analysis incorporates factors such as production,
domestic and foreign demand, storage cost
and availability, governmental issues, and weather, both in the United States and
around the world.
Zephyrus trades are structured with
quantitative reasoning using the most appropriate
instruments, evaluating risk and
reward prior to execution
Zephyrus puts fundamental
information into analytical context with a structured approach to monitoring market
extremes
Typhon Capital provides institutional-caliber operations and risk
management capabilities
CRYPTOCURRENCYleondias CRYPTOCURRENCY GROUP
THIS MATERIAL IS CONFIDENTIAL AND IS PROVIDED SOLELY FOR PRESENTATION
PURPOSES. IT IS INTENDED FOR QUALIFIED ELIGIBLE PARTICIPANTS ONLY. PAST
PERFORMANCE IS NOT NECESSARILY INDICATIVE OF FUTURE RETURNS.
THIS MATERIAL IS CONFIDENTIAL AND IS PROVIDED SOLELY FOR PRESENTATION
PURPOSES. IT IS INTENDED FOR QUALIFIED ELIGIBLE PARTICIPANTS ONLY. PAST
PERFORMANCE IS NOT NECESSARILY INDICATIVE OF FUTURE RETURNS.

.
leonidas Crypto Market Opportunity
THIS MATERIAL IS CONFIDENTIAL AND IS PROVIDED SOLELY FOR PRESENTATION
PURPOSES. IT IS INTENDED FOR QUALIFIED ELIGIBLE PARTICIPANTS ONLY. PAST
PERFORMANCE IS NOT NECESSARILY INDICATIVE OF FUTURE RETURNS.
While cryptocurrency is incredibly risky and volatile, it has enabled some market participants to
generate spectacular returns to date, Mr. Michalopoulos believes much of the opportunity lays ahead.
“As with any new regime-changing technology in its early days, there is a lot of confusion as to what
the technology actually does, how much of it is hype, how much is real, and how to trade something
as volatile as it is, responsibly.
That confusion means there is opportunity. Experience trading crypto measured in years when
others measure it in months, is an advantage. Intimate familiarity with using the technology and
knowing its limitations is an advantage. Years of trading experience and risk management in yet
another volatile commodity – oil – is another advantage. Together it’s a unique combination of
advantages in a market rife with opportunities and risks.”
We recommend that only clients with very high risk tolerance engage in cryptocurrency
speculation, as doing so they risk the complete loss of principal while investing directly in
cryptocurrency or via a limited liability fund vehicle, and risk a loss greater than their
principal when investing in cryptocurrency futures or a managed account utilizing
cryptocurrency futures.

.
leonidas Crypto Market Opportunity
THIS MATERIAL IS CONFIDENTIAL AND IS PROVIDED SOLELY FOR PRESENTATION
PURPOSES. IT IS INTENDED FOR QUALIFIED ELIGIBLE PARTICIPANTS ONLY. PAST
PERFORMANCE IS NOT NECESSARILY INDICATIVE OF FUTURE RETURNS.
Data courtesy of coinmarketcap.com and is as of 11/21/17

.
Why Us?
THIS MATERIAL IS CONFIDENTIAL AND IS PROVIDED SOLELY FOR PRESENTATION
PURPOSES. IT IS INTENDED FOR QUALIFIED ELIGIBLE PARTICIPANTS ONLY. PAST
PERFORMANCE IS NOT NECESSARILY INDICATIVE OF FUTURE RETURNS.
With the euphoria surrounding cryptocurrencies, there has been a proliferation of funds starting
to service it. Many of their principals have never traded other asset classes, down markets, or
managed a regulated fund with proper internal controls. Typhon and Leonidas, on the other hand,
have an incredible amount of experience in the space:
• Leonidas’s Head Portfolio Manager was a senior energy derivatives trader at Citadel and has
been trading crypto using institutional strategies since 2012
• Typhon has been managing client assets in commodities since 2008, with independent risk
management resulting in low volatility return streams within volatile markets, and proper
internal controls
• Typhon’s CEO has programmed public key encryption software since 1995, began his trading
career with technology stocks in a similar environment to today’s crypto scene, and is a
vanguard of investor protection, recovering $6.7B for MF Global fraud victims, pro bono. He
was the youngest person elected to the Board and Executive Committee of the regulator for
derivatives and crypto.

.
leonidas Cryptocurrency Program
Strategy at a Glance
The Leonidas Cryptocurrency Program is managed by George Michalopoulos and exclusively trades
exchange-cleared derivatives, such as futures on cryptocurrencies such as Bitcoin as they become available.
The strategy is short-term quantitative in nature. The strategy is available in managed accounts only and
may also trade options on cryptocurrencies futures should they become available.
AUM 250k
Minimum Investment US 250K
Management Fee 0% (until Q2 2018, then 2%)
Incentive Allocation 20%
Max Notional Funding 2:1
Max Margin : Equity 40.0%
Liquidity Daily
THIS MATERIAL IS CONFIDENTIAL AND IS PROVIDED SOLELY FOR PRESENTATION
PURPOSES. IT IS INTENDED FOR QUALIFIED ELIGIBLE PARTICIPANTS ONLY. PAST
PERFORMANCE IS NOT NECESSARILY INDICATIVE OF FUTURE RETURNS.

.
Performance is live performance of a managed account running the program net of commission and pro forma for 2/20, and is not automatically compounded. The program
began within the Leonidas Macro Fund in December 2017. That account was closed 12/31/2017 and a new managed account was opened within the Leonidas
Cryptocurrency Fund in January 2018. YTD returns are calculated for capital invested from January 1 and do not reflect compounding. Actual returns may differ from
reported results due to differences in contribution dates, commissions, and fee structures.1-Any indices and other financial benchmarks shown are provided for illustrative
purposes only, are unmanaged, reflect reinvestment of income and dividends and do not reflect the impact of advisory fees. Data is of date of publication and may be a MTD
estimate. For more information regarding the indices included herein, see barclayhedge.com and gemini.com. Please see offering materials for more notes and risk factors.
THIS MATERIAL IS CONFIDENTIAL AND IS PROVIDED SOLELY FOR PRESENTATION
PURPOSES. IT IS INTENDED FOR QUALIFIED ELIGIBLE PARTICIPANTS ONLY. PAST
PERFORMANCE IS NOT NECESSARILY INDICATIVE OF FUTURE RETURNS.
leonidas Cryptocurrency Program
Year Jan Feb Mar Apr May Jun Jul Aug Sep Oct Nov Dec Year
2018 1.44% 3.82% (1.59%) 3.64%
2017 0.68% 0.68%
Monthly Net Performance

.
leonidas Cryptocurrency Fund
Strategy at a Glance
The Leonidas Cryptocurrency Fund is managed by George Michalopoulos and trades a basket of
cryptocurrencies such as Bitcoin and Ether, as well as exchange traded derivatives on cryptocurrencies,
and may participate in initial coin offerings and trade those coins in secondary markets. The fund uses a
blend of discretionary algorithmic strategies. The Fund currently uses Bittrex, Gemini, and Phillip
Securities as its custodians.
Minimum Investment US $550k
Management Fee 0% (until Q2 2018, then 2%)
Incentive Allocation 20%
Liquidity Quarterly
THIS MATERIAL IS CONFIDENTIAL AND IS PROVIDED SOLELY FOR PRESENTATION
PURPOSES. IT IS INTENDED FOR QUALIFIED ELIGIBLE PARTICIPANTS ONLY. PAST
PERFORMANCE IS NOT NECESSARILY INDICATIVE OF FUTURE RETURNS.

.
THIS MATERIAL IS CONFIDENTIAL AND IS PROVIDED SOLELY FOR PRESENTATION
PURPOSES. IT IS INTENDED FOR QUALIFIED ELIGIBLE PARTICIPANTS ONLY. PAST
PERFORMANCE IS NOT NECESSARILY INDICATIVE OF FUTURE RETURNS.
leonidas Cryptocurrency Fund
Performance is of the Leonidas Cryptocurrency Fund is prepared by NAV Consulting, Inc., is net of all fees and expenses, and compounded monthly. Please see offering
materials for more notes and risk factors.
Year Jan Feb Mar Apr May Jun Jul Aug Sep Oct Nov Dec Year
2018 (8.20%) (1.22%) (14.36%) (22.34%)
Monthly Net Performance

.
leonidas Cryptocurrency Index
Strategy at a Glance
The Leonidas Cryptocurrency Fund is managed by George Michalopoulos and will be a long-only, passive,
0 performance fee product available for investors looking for smart beta in the space, and also available on
our Argos Alternative Funds Platform. The Fund will use Gemini and Kingdom Trust as its initial
custodians.
AUM Pre-Launch
Minimum Investment US $100k
Management Fee 3%
Incentive Allocation 0%
Liquidity Quarterly
THIS MATERIAL IS CONFIDENTIAL AND IS PROVIDED SOLELY FOR PRESENTATION
PURPOSES. IT IS INTENDED FOR QUALIFIED ELIGIBLE PARTICIPANTS ONLY. PAST
PERFORMANCE IS NOT NECESSARILY INDICATIVE OF FUTURE RETURNS.

.
leonidas Cryptocurrency
The Leonidas Cryptocurrency Program launched December 10th, 2017 and the Fund launched January, 2018 under lead
portfolio manager George Michalopoulos. The fund trades Bitcoin (BTC), Ethereum (ETH), and other vetted
cryptocurrencies such as Monero (XMR), Zcash (ZEC), Ripple (XRP) and Dash (DASH), as well as CME and CBOE
Futures. The SMA strategy is futures-only currently, but may add options-on-futures as they become available. George
has been trading cryptocurrencies since 2012, and commodities since 2006 when he joined Citadel and eventually
became sole PM of the crude oil options business. The Index is pending launch. The Leonidas Cryptocurrency Group
has three approaches to the sector:
THIS MATERIAL IS CONFIDENTIAL AND IS PROVIDED SOLELY FOR PRESENTATION
PURPOSES. IT IS INTENDED FOR QUALIFIED ELIGIBLE PARTICIPANTS ONLY. PAST
PERFORMANCE IS NOT NECESSARILY INDICATIVE OF FUTURE RETURNS.
discretionary strategy based on fundamental analysis
algorithmic strategies to capitalize on the extreme volatility in the asset class
passive, long-only indexing approach
Management Fee
Only Product

.
Technical Analysis provides entry and exit points correlated with pre-determined Typhon Proprietary Risk Management Profit and Loss Program.
Intelligent Risk Assumption centers on day trades to six week construction with the majority being weekly.
Outrights and spreads with options never naked shorted
The professionals at Zephyrus have over 50 years of combined experience in complementary areas, including: livestock research and trading, investment management and risk management
leonidas Methodology
THIS MATERIAL IS CONFIDENTIAL AND IS PROVIDED SOLELY FOR PRESENTATION
PURPOSES. IT IS INTENDED FOR QUALIFIED ELIGIBLE PARTICIPANTS ONLY. PAST
PERFORMANCE IS NOT NECESSARILY INDICATIVE OF FUTURE RETURNS.
Limit investing universe by screening coins for integrity
Assess coin supply and demand. Make relative and tradeable statements about each
Enter and exit based on changing S&D dynamics
Maintain long bias while being prepared to cut risk dramatically.

.
leonidas Cryptocurrency Exchange FocusLeonidas only invests with established cryptocurrency platforms with credible management teams andproper governance structures. Regulated, US-based Exchanges are a cornerstone of the trading strategies.
THIS MATERIAL IS CONFIDENTIAL AND IS PROVIDED SOLELY FOR PRESENTATION
PURPOSES. IT IS INTENDED FOR QUALIFIED ELIGIBLE PARTICIPANTS ONLY. PAST
PERFORMANCE IS NOT NECESSARILY INDICATIVE OF FUTURE RETURNS.
Established Platforms
InsuredExchange Traded
DerivativesGovernance

.
leonidas Coin Pair Example
THIS MATERIAL IS CONFIDENTIAL AND IS PROVIDED SOLELY FOR PRESENTATION
PURPOSES. IT IS INTENDED FOR QUALIFIED ELIGIBLE PARTICIPANTS ONLY. PAST
PERFORMANCE IS NOT NECESSARILY INDICATIVE OF FUTURE RETURNS.
Ethereum (ETH)
Bitcoin (BTC)
Analysis uses proprietary
quantitative relationships
between coin pairs and
qualitative assessments about
integrity and adoptions
potential.
.
leonidas ICO Investment Process
THIS MATERIAL IS CONFIDENTIAL AND IS PROVIDED SOLELY FOR PRESENTATION
PURPOSES. IT IS INTENDED FOR QUALIFIED ELIGIBLE PARTICIPANTS ONLY. PAST
PERFORMANCE IS NOT NECESSARILY INDICATIVE OF FUTURE RETURNS.
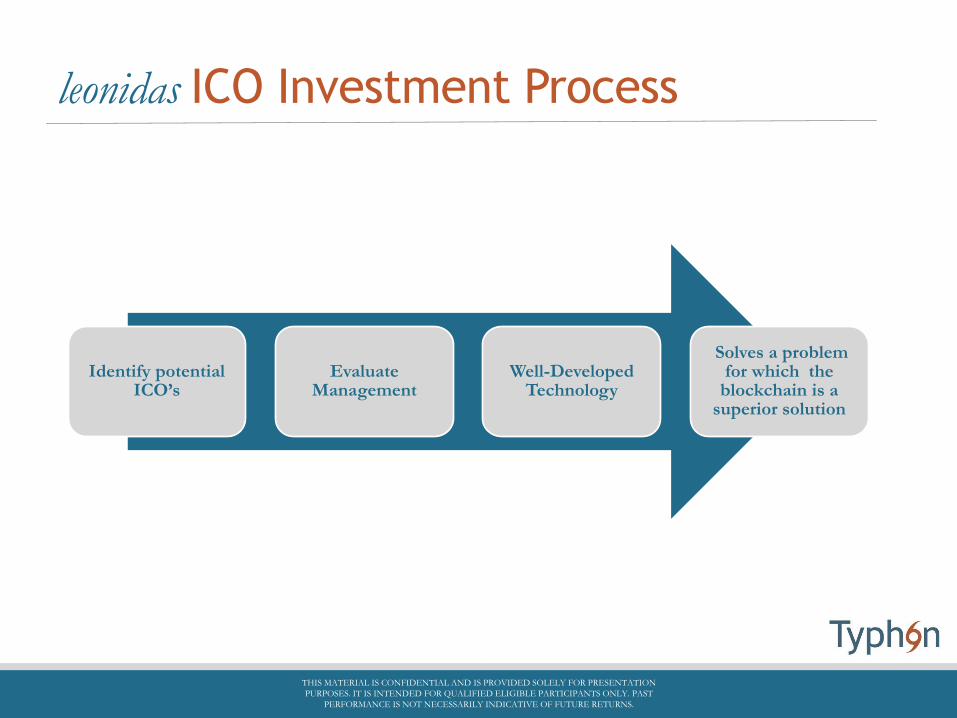
Identify potential ICO’s
Evaluate Management
Well-Developed Technology
Solves a problem for which the
blockchain is a superior solution

.
leonidas Multiple Approaches
THIS MATERIAL IS CONFIDENTIAL AND IS PROVIDED SOLELY FOR PRESENTATION
PURPOSES. IT IS INTENDED FOR QUALIFIED ELIGIBLE PARTICIPANTS ONLY. PAST
PERFORMANCE IS NOT NECESSARILY INDICATIVE OF FUTURE RETURNS.
Mr. Michalopoulos has formulated three main strategies since starting to trade
cryptocurrencies in 2012.
His first approach uses a discretionary strategy based on fundamental analysis. The
analysis uses relationships between coin pairs and their corresponding supply and
demand.
His second approach uses algorithmic strategies to capitalize on the extreme volatility
in the asset class. Mr. Michalopoulos sees this as a rare window of opportunity as
barriers to entry are still comparatively low, “but won’t remain that way for long.”
His third approach is a passive, long-only indexing approach. It is outside of the scope
of this fee structure, but is available for interested investors as a management fee only
product.

.
leonidas Risk Management
Protection is a key element in
generating returns - robust risk
management is at the core of this
protection. We believe that
associated costs are more than
compensated for in times of market
stress, and the strategy generates
good positive returns in rising
markets.
Risk is actively managed through
strict risk budget limits at portfolio
and individual metals levels, with
drawdown limits.
Budget Limits
Positive Returns
Robust Risk Management
THIS MATERIAL IS CONFIDENTIAL AND IS PROVIDED SOLELY FOR PRESENTATION
PURPOSES. IT IS INTENDED FOR QUALIFIED ELIGIBLE PARTICIPANTS ONLY. PAST
PERFORMANCE IS NOT NECESSARILY INDICATIVE OF FUTURE RETURNS.

ENERGY/MACROleonidas ENERGY STRATEGY
leonidas MACRO FUND
THIS MATERIAL IS CONFIDENTIAL AND IS PROVIDED SOLELY FOR PRESENTATION
PURPOSES. IT IS INTENDED FOR QUALIFIED ELIGIBLE PARTICIPANTS ONLY. PAST
PERFORMANCE IS NOT NECESSARILY INDICATIVE OF FUTURE RETURNS.
THIS MATERIAL IS CONFIDENTIAL AND IS PROVIDED SOLELY FOR PRESENTATION
PURPOSES. IT IS INTENDED FOR QUALIFIED ELIGIBLE PARTICIPANTS ONLY. PAST
PERFORMANCE IS NOT NECESSARILY INDICATIVE OF FUTURE RETURNS.

.
leonidas Energy Strategy
Strategy at a Glance
The Leonidas Energy Strategy is a pure discretionary macro trading strategy managed by George Michalopoulos, who was an energy portfolio
manager for Citadel Investment Group for six years. Mr. Michalopoulos has a unique understanding of global supply and demand dynamics as they
relate to WTI, Brent, and Henry Hub natural gas. Because these are physically-delivered contracts, there arises a unique trading advantage for those
understanding the fundamental dynamics. Often without taking the risk profile of outright positioning (long/short) in the underlying commodity.
This can be expressed in grade differentials, like WTI-BRT, WTI spreads, BRT spreads, and even WTI vs BRT spreads.
AUM $500k
Minimum Investment US $100K Fund, $500k SMA
Management Fee 2%
Incentive Allocation 20%
Max Notional Funding 5 : 1
Max Margin : Equity 10%
Liquidity SMA: Daily, Fund: Monthly
THIS MATERIAL IS CONFIDENTIAL AND IS PROVIDED SOLELY FOR PRESENTATION
PURPOSES. IT IS INTENDED FOR QUALIFIED ELIGIBLE PARTICIPANTS ONLY. PAST
PERFORMANCE IS NOT NECESSARILY INDICATIVE OF FUTURE RETURNS.

.
leonidas Energy Strategy Returns
THIS MATERIAL IS CONFIDENTIAL AND IS PROVIDED SOLELY FOR PRESENTATION
PURPOSES. IT IS INTENDED FOR QUALIFIED ELIGIBLE PARTICIPANTS ONLY. PAST
PERFORMANCE IS NOT NECESSARILY INDICATIVE OF FUTURE RETURNS.
Performance is live performance of an energy-only managed account within the Leonidas Macro Fund, net of commission and pro forma for 2/20, and is not automatically
compounded. For more information on the HFRX Commodity and BarclayHedge CTA indices, please see hfr.com and barclayhedge.com, respectively. Please see offering
materials for more notes and risk factors.
Growth of $1,000
-3%
-2%
-1%
0%
1%
2%
3%
$500
$600
$700
$800
$900
$1,000
$1,100
4/17 10/17
LE Monthly Return Leonidas Energy BarclayHedge CTA Index HFRX COM
Leonidas Energy BH1 HFR COM1
Margin:Equity Avg, Max 2.5%, 10%
Annualized Return
Max Drawdown (3.67%) (1.03%) (5.15%)
Largest Gain 1.53% 1.92% 3.80%
Largest Loss (1.32%) (1.03%) (4.86%)
Sharpe Ratio
Sortino Ratio
Volatility (σ) 2.57% 2.58% 6.79%
Correlation (r) (0.22) (0.62)
Selected Statistics
Year Jan Feb Mar Apr May Jun Jul Aug Sep Oct Nov Dec Year
2018 (0.99%) 1.53% (1.32%) (0.80%)
2017 0.22% (0.88%) (0.22%) (0.18%) (0.83%) (0.19%) (0.30%) (0.35%) 0.22% (2.49%)
Monthly Net Performance

.
leonidas Energy Strategy
THIS MATERIAL IS CONFIDENTIAL AND IS PROVIDED SOLELY FOR PRESENTATION
PURPOSES. IT IS INTENDED FOR QUALIFIED ELIGIBLE PARTICIPANTS ONLY. PAST
PERFORMANCE IS NOT NECESSARILY INDICATIVE OF FUTURE RETURNS.
The Leonidas Energy Strategy launched in April 2017 and is managed by George
Michalopoulos. The strategy trades exchange-traded energy contracts and was used
successfully by George at Citadel for 6 years. It is available in Separately Managed Accounts
with a 500k nominal minimum.
The Leonidas Energy Strategy has a unique understanding of global supply and demand
dynamics as they relate to WTI, Brent, and Henry Hub natural gas.
Because these are physically-delivered contracts, there arises a unique trading advantage for
those understanding the fundamental dynamics. Often without taking the risk profile of
outright positioning (long/short) in the underlying commodity. This can be expressed in
grade differentials, like WTI-BRT, WTI spreads, BRT spreads, and even WTI vs BRT
spreads.
energy gasoil

.
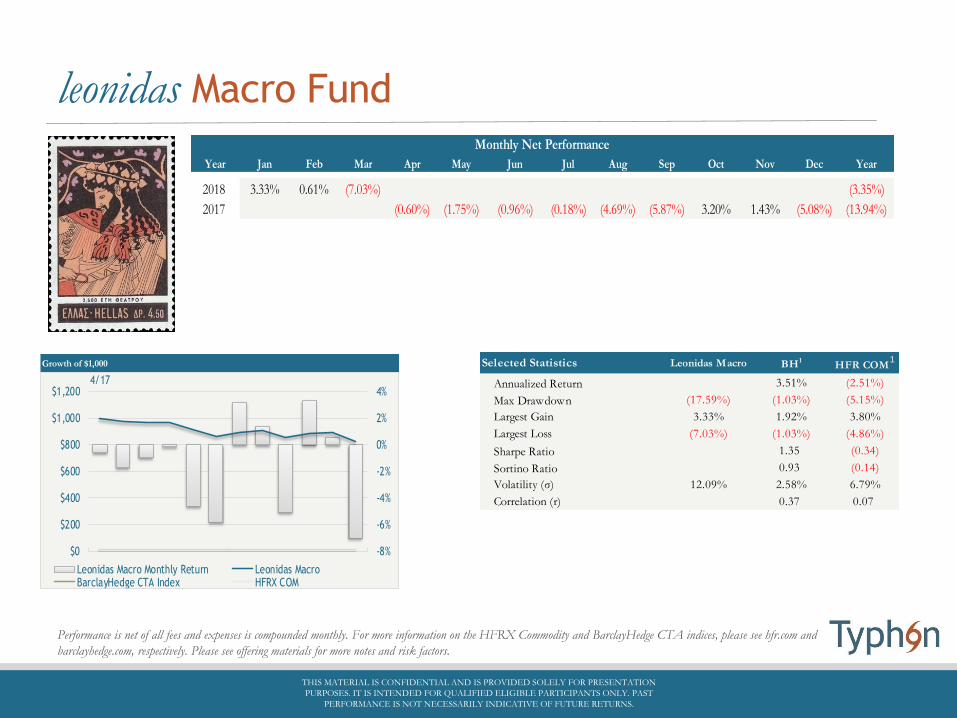
leonidas Macro Fund
Strategy at a Glance
The Leonidas Macro Fund is a purely discretionary global macro strategy managed by George Michalopoulos. Leonidas
analyzes global monetary and fiscal policy, specifically how they change, or how they might change given certain catalysts
such as rate policy meetings, and analyzes a portfolio that is as outcome-agnostic as possible. Leonidas attempts to express
such catalysts through trades constructed with off-setting correlations, while maintaining positive expected value on as many
elements of that portfolio as possible.
AUM $1.4M
Minimum Investment US $100K Fund, $10M SMA
Management Fee 2%
Incentive Allocation 20%
Max Notional Funding 5 : 1
Max Margin : Equity 10%
Liquidity SMA: Daily, Fund: Monthly
THIS MATERIAL IS CONFIDENTIAL AND IS PROVIDED SOLELY FOR PRESENTATION
PURPOSES. IT IS INTENDED FOR QUALIFIED ELIGIBLE PARTICIPANTS ONLY. PAST
PERFORMANCE IS NOT NECESSARILY INDICATIVE OF FUTURE RETURNS.
.
leonidas Macro Fund
Performance is net of all fees and expenses is compounded monthly. For more information on the HFRX Commodity and BarclayHedge CTA indices, please see hfr.com and
barclayhedge.com, respectively. Please see offering materials for more notes and risk factors.
THIS MATERIAL IS CONFIDENTIAL AND IS PROVIDED SOLELY FOR PRESENTATION
PURPOSES. IT IS INTENDED FOR QUALIFIED ELIGIBLE PARTICIPANTS ONLY. PAST
PERFORMANCE IS NOT NECESSARILY INDICATIVE OF FUTURE RETURNS.
Growth of $1,000
-8%
-6%
-4%
-2%
0%
2%
4%
$0
$200
$400
$600
$800
$1,000
$1,2004/17
Leonidas Macro Monthly Return Leonidas MacroBarclayHedge CTA Index HFRX COM
Year Jan Feb Mar Apr May Jun Jul Aug Sep Oct Nov Dec Year
2018 3.33% 0.61% (7.03%) (3.35%)
2017 (0.60%) (1.75%) (0.96%) (0.18%) (4.69%) (5.87%) 3.20% 1.43% (5.08%) (13.94%)
Monthly Net Performance
Leonidas Macro BH1HFR COM
1
Annualized Return 3.51% (2.51%)
Max Drawdown (17.59%) (1.03%) (5.15%)
Largest Gain 3.33% 1.92% 3.80%
Largest Loss (7.03%) (1.03%) (4.86%)
Sharpe Ratio 1.35 (0.34)
Sortino Ratio 0.93 (0.14)
Volatility (σ) 12.09% 2.58% 6.79%
Correlation (r) 0.37 0.07
Selected Statistics

.
leonidas Macro Fund
THIS MATERIAL IS CONFIDENTIAL AND IS PROVIDED SOLELY FOR PRESENTATION
PURPOSES. IT IS INTENDED FOR QUALIFIED ELIGIBLE PARTICIPANTS ONLY. PAST
PERFORMANCE IS NOT NECESSARILY INDICATIVE OF FUTURE RETURNS.
The Leonidas Macro Fund launched in April 2017 and is managed by George Michalopoulos. The strategy a
purely discretionary global macro strategy. Leonidas analyzes global monetary and fiscal policy, specifically
how they change, or how they might change given certain catalysts such as rate policy meetings, and analyzes a
portfolio that is as outcome-agnostic as possible. Leonidas attempts to express such catalysts through trades
constructed with off-setting correlations, while maintaining positive expected value on as many elements of
that portfolio as possible.
Ste
p 1 Identify
dominant macro trends S
tep
2 Identify central drivers of trends S
tep
3 Identify offsetting risk assets if drivers change
Ste
p 4 Screen
potential offsetting risk assets that have positive expected value in status quo
Ste
p 5 Construct
appropriately risk-manged portfolio to correct size and ratios, such that the desired daily and shock-simulated VAR metrics are within Typhon guidelines
Ste
p 6 Dynamically
adjust ratios and sizing to take advantage of above- and below-trend returns and/or adjust to new market realities and return to step 1
Leonidas Macro Fund Investment Process

Rules-Basedstoic RULES-BASED STRATEGIES FUND
THIS MATERIAL IS CONFIDENTIAL AND IS PROVIDED SOLELY FOR PRESENTATION
PURPOSES. IT IS INTENDED FOR QUALIFIED ELIGIBLE PARTICIPANTS ONLY. PAST
PERFORMANCE IS NOT NECESSARILY INDICATIVE OF FUTURE RETURNS.
THIS MATERIAL IS CONFIDENTIAL AND IS PROVIDED SOLELY FOR PRESENTATION
PURPOSES. IT IS INTENDED FOR QUALIFIED ELIGIBLE PARTICIPANTS ONLY. PAST
PERFORMANCE IS NOT NECESSARILY INDICATIVE OF FUTURE RETURNS.

.
stoic Rules-Based Strategies Fund
AUM $3.5M
Minimum Investment U.S. $100k
Management Fee 0%
Incentive Allocation 40%
Liquidity Quarterly
THIS MATERIAL IS CONFIDENTIAL AND IS PROVIDED SOLELY FOR PRESENTATION
PURPOSES. IT IS INTENDED FOR QUALIFIED ELIGIBLE PARTICIPANTS ONLY. PAST
PERFORMANCE IS NOT NECESSARILY INDICATIVE OF FUTURE RETURNS.
Strategy at a Glance
The Stoic Rules Based-Strategies Fund combines three components to produce a unique event-driven
fund. Stoic is currently comprised of three sub-strategies: event-driven single name equity options,
comparative single name stocks, and VIX-based derivatives. All components systematically produce
directional biases that the portfolio manager then executes with discretion. No naked options are used.

.
stoic Rules-Based Strategies Fund
THIS MATERIAL IS CONFIDENTIAL AND IS PROVIDED SOLELY FOR PRESENTATION
PURPOSES. IT IS INTENDED FOR QUALIFIED ELIGIBLE PARTICIPANTS ONLY. PAST
PERFORMANCE IS NOT NECESSARILY INDICATIVE OF FUTURE RETURNS.
Performance figures prior to January 2018 are a composite of live returns net of all expenses with fees pro forma to 0/40. All performance thereafter is that of the Stoic
Rules-Based Strategies Fund and is calculated net of all expenses, management fees and incentive fees. For more information on the S&P 500 index, please see
standardandpoors.com. Please see offering materials for more notes and risk factors.
Growth of $1,000
-20%
-10%
0%
10%
20%
30%
40%
$0
$500
$1,000
$1,500
$2,000
$2,500
6/14 12/14 6/15 12/15 6/16 12/16 6/17 12/17
Stoic Monthly Return Stoic S&P 500
Year Jan Feb Mar Apr May Jun Jul Aug Sep Oct Nov Dec Year
2018 (0.42%) (3.78%) (6.62%) (10.53%)
2017 8.55% 0.49% 11.02% (3.31%) 7.66% (0.15%) 1.84% (10.48%) 15.53% 1.75% 1.33% 3.70% 41.75%
2016 (2.01%) (0.22%) 11.13% (3.63%) 10.67% (0.70%) 6.43% 5.13% (0.79%) (9.21%) 15.29% 7.64% 43.92%
2015 (4.66%) 8.02% (8.82%) 3.07% 33.22% 4.73% (14.42%) 16.52% (1.27%) 1.73% (1.45%) (4.23%) 27.65%
2014 2.26% (5.97%) 4.88% 0.42% 2.53% 5.30% 4.80% 14.58%
Monthly Net Performance
Stoic S&P1
Annualized Return 29.61% 9.16%
Max Drawdown (14.42%) (8.89%)
Largest Gain 33.22% 8.30%
Largest Loss (14.42%) (6.26%)
Sharpe Ratio 1.04 0.93
Sortino Ratio 0.58 0.45
Volatility (σ) 28.49% 10.01%
Correlation (r) 23.72%
Selected Statistics

.
stoic Summary
THIS MATERIAL IS CONFIDENTIAL AND IS PROVIDED SOLELY FOR PRESENTATION
PURPOSES. IT IS INTENDED FOR QUALIFIED ELIGIBLE PARTICIPANTS ONLY. PAST
PERFORMANCE IS NOT NECESSARILY INDICATIVE OF FUTURE RETURNS.
Stoic trades rules-based strategies and
are never data mined
2 of the 3 current strategies are event-
driven and trade single name stocks and options. The
3rd strategy trades VIX futures.
The strategies are traded on a
notional basis, with each trade being a pre-determined
percentage of the notional.
Typhon Capital provides
institutional-caliber operations and risk
management capabilities

.
_ _ _ _
stoic Methodology
THIS MATERIAL IS CONFIDENTIAL AND IS PROVIDED SOLELY FOR PRESENTATION
PURPOSES. IT IS INTENDED FOR QUALIFIED ELIGIBLE PARTICIPANTS ONLY. PAST
PERFORMANCE IS NOT NECESSARILY INDICATIVE OF FUTURE RETURNS.
general trading
perspective
back tested for validity, not data-
mined
identify trade entry
and exit
Trades are executed
on a percentage
of notional
basis

.
stoic Methodology
THIS MATERIAL IS CONFIDENTIAL AND IS PROVIDED SOLELY FOR PRESENTATION
PURPOSES. IT IS INTENDED FOR QUALIFIED ELIGIBLE PARTICIPANTS ONLY. PAST
PERFORMANCE IS NOT NECESSARILY INDICATIVE OF FUTURE RETURNS.
Every strategy Stoic considers must make sense from a general trading perspective. Potential strategies are
thought of and then back tested for validity, not data-mined. Stoic’s methodology is not based on scanning
price curves or other data sources for predictive patterns. Rules are followed to identify trade entry/exit, and
trades are executed manually. This prevents the portfolio manager from second-guessing the strategy or
becoming married to any trades.
Stoic concurrently trades three rules-based strategies at the present time. These strategies are traded on a
notional basis, with each trade being a certain percentage of the notional value of the fund. Two of the three
current strategies are event-driven and trade single name stocks and options. These two strategies are typically
less than 50% invested on a notional basis, so the fund typically will have a large cash balance. Hold times are
typically one week for the option strategy and typically 1.5 months for the stock strategy. The option strategy is
long only options and the stock strategy is long only stock, so there is no open-ended risk.
The third strategy trades VIX futures. This is a directional strategy driven by the shape of the curve, that can
be long, short, or not invested. This allows the strategy to profit in low vol periods as well as potentially profit
in market downturns when VIX spikes.
Strategies may be added in the future. Each strategy must be profitable on its own, and provide a differentiated
return stream to the other strategies.

Systematic - Quantitativechiron CURRENCY PROGRAM
THIS MATERIAL IS CONFIDENTIAL AND IS PROVIDED SOLELY FOR PRESENTATION
PURPOSES. IT IS INTENDED FOR QUALIFIED ELIGIBLE PARTICIPANTS ONLY. PAST
PERFORMANCE IS NOT NECESSARILY INDICATIVE OF FUTURE RETURNS.
THIS MATERIAL IS CONFIDENTIAL AND IS PROVIDED SOLELY FOR PRESENTATION
PURPOSES. IT IS INTENDED FOR QUALIFIED ELIGIBLE PARTICIPANTS ONLY. PAST
PERFORMANCE IS NOT NECESSARILY INDICATIVE OF FUTURE RETURNS.

.
chiron Currency Program
Strategy at a Glance
The Chiron Currency Program is an intraday-only currency overlay that trades G10 currency futures. The
strategy is 100% systematic and acts as a liquidity provider within a clearly defined daily risk budget.
AUM $2mm
Minimum Investment US $250k for SMA
Management Fee 2%
Incentive Allocation 20% Monthly
Max Notional Funding 5 : 1
Max Margin : Equity 0%
Liquidity SMA Daily
THIS MATERIAL IS CONFIDENTIAL AND IS PROVIDED SOLELY FOR PRESENTATION
PURPOSES. IT IS INTENDED FOR QUALIFIED ELIGIBLE PARTICIPANTS ONLY. PAST
PERFORMANCE IS NOT NECESSARILY INDICATIVE OF FUTURE RETURNS.

.
chiron Currency Program
THIS MATERIAL IS CONFIDENTIAL AND IS PROVIDED SOLELY FOR PRESENTATION
PURPOSES. IT IS INTENDED FOR QUALIFIED ELIGIBLE PARTICIPANTS ONLY. PAST
PERFORMANCE IS NOT NECESSARILY INDICATIVE OF FUTURE RETURNS.
Performance from February 2008 to January 2010 was calculated on proprietary performance of the system, pro forma for fees and reflects automatic compounding. Performance
from February 2010 through February 28, 2012 is of the Arktos Currency Program within the Xenfin Diversified Fund, SPC and was audited by Baker Tilly. Performance
thereafter is a composite of client managed accounts managed by Typhon and does not reflect automatic compounding.
Growth of $1,000
-4%
-2%
0%
2%
4%
6%
$0
$500
$1,000
$1,500
2/08 2/10 2/12 2/14 2/16 2/18
Chiron Monthly Return Chiron
Chiron BH1 HFR COM 1
Annualized Return 2.48% 1.89% (1.43%)
Max Margin to Equity
Max Drawdown (7.46%) (10.74%) (21.29%)
Largest Gain 5.35% 5.52% 9.11%
Largest Loss (3.38%) (2.94%) (4.86%)
Sharpe Ratio 0.46 0.40 (0.22)
Sortino Ratio 0.22 0.19 (0.10)
Volatility (σ) 5.20% 5.01% 5.82%
Correlation (r) -1.67% 10.27%
Selected Statistics
Year Jan Feb Mar Apr May Jun Jul Aug Sep Oct Nov Dec Year
2018 2.59% 0.04% (1.61%) 1.02%
2017 (0.67%) (0.52%) (0.11%) (0.83%) (0.30%) (0.52%) 0.60% 0.06% 0.16% 0.31% (1.01%) (0.57%) (3.40%)
2016 2.16% 2.82% 0.95% (1.74%) (0.78%) (1.04%) (0.31%) (0.04%) 0.27% 0.76% 2.17% 0.19% 5.41%
2015 0.98% (1.42%) (0.93%) 2.02% (3.27%) 1.51% (1.23%) 1.86% (1.82%) (0.62%) (1.43%) (0.99%) (5.34%)
2014 (0.01%) 1.17% (0.70%) (0.24%) 0.58% (1.04%) 0.28% (0.21%) 0.76% 0.58% 0.89% (0.33%) 1.73%
2013 (0.61%) 1.15% 1.30% (1.96%) 0.14% 2.41% (1.53%) (1.87%) (1.77%) 2.01% (0.27%) 0.60% (0.40%)
2012 (1.26%) 1.06% (1.72%) (0.27%) 1.25% 0.31% (2.43%) (0.16%) 0.48% (0.21%) 0.87% (1.30%) (3.38%)
2011 1.05% 0.63% 1.52% 0.80% 0.18% (2.23%) 0.45% 1.27% (0.40%) 2.38% (0.07%) 0.51% 6.19%
2010 0.33% 0.34% 0.47% (0.31%) 2.05% 1.47% 1.58% 0.03% (0.26%) (0.20%) 0.77% 0.04% 6.46%
2009 4.30% 1.21% (1.15%) (2.47%) 0.75% 5.05% (3.38%) 0.50% 0.11% (0.94%) (2.94%) (0.81%) (0.14%)
2008 0.55% 1.66% 0.52% (0.80%) 2.77% 0.83% 2.41% 3.25% (0.13%) 5.35% (0.16%) 17.32%
Client Monthly Net Performance

.
chiron Philosophy
chiron
USD
EUR
JPY
GBP
CHF
CAD
The Chiron Currency Program was born out of a
need to protect assets when markets are doing poorly
and to generate acceptable returns when core markets
are doing well.
Currency markets were chosen for their liquidity,
trading efficiency, transparency and diversification.
For global investors as a diversifying source, Chiron
mitigates exposure to equity and bond market beta,
providing portfolio protection when necessary.
The investment approach is both pragmatic and
realistic. Chiron strives to both protect capital and
generate returns, while containing costs without
sacrificing framework for the security of the assets
managed.
THIS MATERIAL IS CONFIDENTIAL AND IS PROVIDED SOLELY FOR PRESENTATION
PURPOSES. IT IS INTENDED FOR QUALIFIED ELIGIBLE PARTICIPANTS ONLY. PAST
PERFORMANCE IS NOT NECESSARILY INDICATIVE OF FUTURE RETURNS.

.
chiron Strategy Focus
The Chiron Currency Program is intraday-only and trades G10 currency futures. The strategy is 100%systematic and acts as a liquidity provider within a clearly defined daily risk budget. Chiron dynamicallyapplies risk weightings which reduce exposure in adverse market environments. Chiron trades a diversifiedbasket of currencies based on a quantitatively-determined directional bias with a volatility-based cashmanagement model setting pre-defined entry, exit, and stop levels for each trade within a daily risk budget.
chiron MSCI World
2008 +16.25% vs -42.00%
2011 +6.09% vs -7.60%
THIS MATERIAL IS CONFIDENTIAL AND IS PROVIDED SOLELY FOR PRESENTATION
PURPOSES. IT IS INTENDED FOR QUALIFIED ELIGIBLE PARTICIPANTS ONLY. PAST
PERFORMANCE IS NOT NECESSARILY INDICATIVE OF FUTURE RETURNS.

.
chiron Edge
Diversification
Downside Protection
Liquidity
Chiron is a concentrated
portfolio for existing CTAs
and currency investors, using
six currency pairs and carefully
controlled managed risk for
downside protection.
Chiron is also a diversifying
source of return for a global
investment portfolios, notably
mitigating exposure to equity
market beta.
THIS MATERIAL IS CONFIDENTIAL AND IS PROVIDED SOLELY FOR PRESENTATION
PURPOSES. IT IS INTENDED FOR QUALIFIED ELIGIBLE PARTICIPANTS ONLY. PAST
PERFORMANCE IS NOT NECESSARILY INDICATIVE OF FUTURE RETURNS.

.
chiron Risk Management
Protection is a key element in
generating returns - robust risk
management is at the core of this
protection. We believe that
associated costs are more than
compensated for in times of
market stress, and the strategy
generates good positive returns in
rising markets.
Risk is actively managed through
strict risk budget limits at portfolio
and individual pair levels, with
drawdown limits.
Budget Limits
All open positions close by 8pm GMT, with no overnight
positions
Robust Risk Management
THIS MATERIAL IS CONFIDENTIAL AND IS PROVIDED SOLELY FOR PRESENTATION
PURPOSES. IT IS INTENDED FOR QUALIFIED ELIGIBLE PARTICIPANTS ONLY. PAST
PERFORMANCE IS NOT NECESSARILY INDICATIVE OF FUTURE RETURNS.

SYSTEMATIC- STOCK INDEXhelios DEUTSCHE PROGRAM
THIS MATERIAL IS CONFIDENTIAL AND IS PROVIDED SOLELY FOR PRESENTATION
PURPOSES. IT IS INTENDED FOR QUALIFIED ELIGIBLE PARTICIPANTS ONLY. PAST
PERFORMANCE IS NOT NECESSARILY INDICATIVE OF FUTURE RETURNS.
THIS MATERIAL IS CONFIDENTIAL AND IS PROVIDED SOLELY FOR PRESENTATION
PURPOSES. IT IS INTENDED FOR QUALIFIED ELIGIBLE PARTICIPANTS ONLY. PAST
PERFORMANCE IS NOT NECESSARILY INDICATIVE OF FUTURE RETURNS.

.
helios Deutsche Program
Strategy at a Glance
The Helios Deutsche Program, managed by Damian Taylor and Hubert Van Den Bergh, uses a
proprietary short-term systematic model to trade DAX® futures in an attempt to generate absolute returns
uncorrelated to other asset classes. The DAX®'s volatility and price action have made it an ideal
instrument for expressing the Helios methodology.
AUM $14M
Minimum Investment $500k SMA
Management Fee 2%
Incentive Allocation 20%
Max Notional Funding 4:1
Max Margin : Equity 15.0%
Liquidity SMA Daily
THIS MATERIAL IS CONFIDENTIAL AND IS PROVIDED SOLELY FOR PRESENTATION
PURPOSES. IT IS INTENDED FOR QUALIFIED ELIGIBLE PARTICIPANTS ONLY. PAST
PERFORMANCE IS NOT NECESSARILY INDICATIVE OF FUTURE RETURNS.

.
helios Deutsche Program
THIS MATERIAL IS CONFIDENTIAL AND IS PROVIDED SOLELY FOR PRESENTATION
PURPOSES. IT IS INTENDED FOR QUALIFIED ELIGIBLE PARTICIPANTS ONLY. PAST
PERFORMANCE IS NOT NECESSARILY INDICATIVE OF FUTURE RETURNS.
Prior to October 2015, performance is proprietary pro forma for 2/20, and thereafter, of the McLean Systematic Fund Class D, net of actual fees and has
been audited by a big 4 auditor. For more information about the DAX® and BarclayHedge CTA indices, see https://www.dax-indices.com/ and
barclayhedge.com, respectively. Please see offering materials for more notes and risk factors.
Year Jan Feb Mar Apr May Jun Jul Aug Sep Oct Nov Dec Year
2018 3.37% (1.98%) 3.37% 4.76%
2017 (1.66%) 2.03% (0.25%) 2.84% 0.03% (2.16%) 1.95% (0.88%) 0.52% 0.12% (0.42%) (0.17%) 1.95%
2016 (4.16%) 2.45% (0.41%) 2.28% (4.93%) 4.91% 0.90% 2.85% (1.32%) (1.10%) (1.63%) 2.31% 2.15%
2015 4.31% 2.80% 4.44% (2.84%) (1.01%) (2.06%) 4.10% 2.40% (0.76%) 3.09% 1.09% (2.41%) 13.15%
2014 (0.22%) 1.61% 0.28% 1.42% 0.88% 1.60% (3.09%) 2.93% 2.74% 8.15%
Monthly Net Performance
Growth of $1,000 Helios DAX®1
BH1
Margin:Equity 15%
Annualized Return 7.54% 6.80% 2.08%
Max Drawdown (7.18%) (20.65%) (6.32%)
Largest Gain 4.91% 12.32% 3.07%
Largest Loss (4.93%) (9.28%) (2.14%)
Sharpe Ratio 0.92 0.49 0.51
Sortino Ratio 0.44 0.20 0.24
Volatility (σ) 8.18% 15.87% 4.19%
Correlation (r) 0.38 0.22
Selected Statistics
-6%
-4%
-2%
0%
2%
4%
6%
$0
$500
$1,000
$1,500
4/14 4/15 4/16 4/17
Helios Monthly Return Helios
DAX BarclayHedge CTA Index

.
helios Deutsche Program Focus
THIS MATERIAL IS CONFIDENTIAL AND IS PROVIDED SOLELY FOR PRESENTATION
PURPOSES. IT IS INTENDED FOR QUALIFIED ELIGIBLE PARTICIPANTS ONLY. PAST
PERFORMANCE IS NOT NECESSARILY INDICATIVE OF FUTURE RETURNS.
Helios is a systematic strategy that only trades the
DAX® future
Helios employs no leverage and
positons are held on average for 2
days
The model has analyzed all c. 14,000 days in the DAX®
trading history, and recognizes short-term patterns that have
occurred in the past, when similar criteria and patterns
emerge in the present

.
helios Deutsche Program Edge
THIS MATERIAL IS CONFIDENTIAL AND IS PROVIDED SOLELY FOR PRESENTATION
PURPOSES. IT IS INTENDED FOR QUALIFIED ELIGIBLE PARTICIPANTS ONLY. PAST
PERFORMANCE IS NOT NECESSARILY INDICATIVE OF FUTURE RETURNS.
Concentrated
Volatile
Liquid
The DAX ® is liquid- the
average daily value traded in
2015 was EUR 30.7B, average
in 2016 was EUR 26.1 B
The DAX ® is volatile- the
average 30 day volatility
(annualized) in 2015 was
23.1%, in 2016 was 21.06%
The DAX ® is concentrated-
the top 10 shares make up
65.9% of the index.

.
helios Deutsche Program Risk Management
THIS MATERIAL IS CONFIDENTIAL AND IS PROVIDED SOLELY FOR PRESENTATION
PURPOSES. IT IS INTENDED FOR QUALIFIED ELIGIBLE PARTICIPANTS ONLY. PAST
PERFORMANCE IS NOT NECESSARILY INDICATIVE OF FUTURE RETURNS.
Helios is short-term trend following and ensures a losing position is flattened quickly
Helios utilizes a 7.5% positional stop loss target
All trades are done using a volatility overlay – as volatility rises, leverage is reduced
Helios inputs trades at least 30 minutes before the fixed trading time each day, a risk officer checks these trades at this time
We set a maximum contract limit at the prime broker-level, ensuring no “fat finger” or rogue algo trades can be processed for an additional layer of operational security.

SYSTEMATIC- VOLATILITYproteus DYNAMIC VOLATILITY PROGRAM
proteus RISK OVERLAY
THIS MATERIAL IS CONFIDENTIAL AND IS PROVIDED SOLELY FOR PRESENTATION
PURPOSES. IT IS INTENDED FOR QUALIFIED ELIGIBLE PARTICIPANTS ONLY. PAST
PERFORMANCE IS NOT NECESSARILY INDICATIVE OF FUTURE RETURNS.
THIS MATERIAL IS CONFIDENTIAL AND IS PROVIDED SOLELY FOR PRESENTATION
PURPOSES. IT IS INTENDED FOR QUALIFIED ELIGIBLE PARTICIPANTS ONLY. PAST
PERFORMANCE IS NOT NECESSARILY INDICATIVE OF FUTURE RETURNS.

.
proteus Dynamic Volatility Program
Strategy at a Glance
The Proteus Dynamic Volatility Program trades the VIX futures term structure. The program analyzes the
shape of the curve to determine whether it should be short-vol, flat, or long-vol. We also operate an overlay
which utilizes only the long-VIX signals as a dynamic tail hedge strategy. Proteus is long VIX only about 3%
of the time.
AUM $7.6M
Minimum Investment $250k SMA
Management Fee 2%
Incentive Allocation 20%
Max Notional Funding 5 : 1
Max Margin : Equity 15%
Liquidity SMA Daily
THIS MATERIAL IS CONFIDENTIAL AND IS PROVIDED SOLELY FOR PRESENTATION
PURPOSES. IT IS INTENDED FOR QUALIFIED ELIGIBLE PARTICIPANTS ONLY. PAST
PERFORMANCE IS NOT NECESSARILY INDICATIVE OF FUTURE RETURNS.

.
proteus Dynamic Volatility Program
Performance prior to April 2013 is proprietary pro forma for 2/20 fees and a composite of net client returns thereafter. VXX is the ETF designed to track the
SPVIXSTR, S&P 500 VIX Short-Term Futures Index and XVZ is the ETF designed to track the S&P 500 Dynamic VIX Futures Index; see
www.spindices.com for more information. Please see offering materials for more notes and risk factors.
THIS MATERIAL IS CONFIDENTIAL AND IS PROVIDED SOLELY FOR PRESENTATION
PURPOSES. IT IS INTENDED FOR QUALIFIED ELIGIBLE PARTICIPANTS ONLY. PAST
PERFORMANCE IS NOT NECESSARILY INDICATIVE OF FUTURE RETURNS.
Growth of $1,000
$0
$500
$1,000
$1,500
10/11 10/12 10/13 10/14 10/15 10/16 10/17
Proteus VXX XVZ
Proteus VXX XVZ
Margin:Equity Avg, Max 1.9%, 15%
Annualized Return 3.08% (57.20%) (16.37%)
Max Drawdown (10.72%) (99.76%) (69.75%)
Largest Gain 6.50% 67.47% 11.07%
Largest Loss (5.41%) (31.57%) (12.35%)
Sharpe Ratio 0.42 (1.17) (1.21)
Sortino Ratio 0.17 (0.51) (0.40)
Volatility (σ) 7.06% 57.03% 13.82%
Correlation (r) (0.46) (0.22)
Selected Statistics
Year Jan Feb Mar Apr May Jun Jul Aug Sep Oct Nov Dec Year
2018 (2.14%) (2.20%) (3.48%) (7.82%)
2017 0.20% 0.78% 0.57% 0.44% 0.09% (0.24%) 0.36% 2.48% 0.38% 1.19% 0.76% 0.97% 7.98%
2016 0.12% (1.56%) 2.28% (2.48%) 0.22% 1.77% (0.72%) (0.32%) 1.40% 0.25% (5.41%) 3.13% (1.32%)
2015 (1.71%) 2.04% 0.15% 0.44% 0.80% (0.38%) 2.00% 0.79% (1.46%) 2.03% (3.75%) (2.52%) (1.57%)
2014 0.60% (0.45%) (1.61%) 0.82% 0.35% 1.28% 0.33% 0.58% (0.44%) 2.02% 1.97% (3.95%) 1.50%
2013 6.50% 0.09% 0.46% 1.25% (1.03%) (1.73%) 1.67% (2.03%) 1.69% 1.47% 1.28% (0.35%) 9.31%
2012 6.01% (1.40%) 0.99% (0.75%) (3.41%) 0.01% 1.17% 3.38% 2.68% (0.95%) 2.15% (2.31%) 7.43%
2011 3.05% (2.12%) 2.59% 3.48%
Monthly Net Performance
proteus

“The long term expected value of your ETN is zero. If you hold your ETNs as a long term investment, it is likely that you will lose all or a substantial portion of your investment.”- Credit Suisse’s VelocityShares
THIS MATERIAL IS CONFIDENTIAL AND IS PROVIDED SOLELY FOR PRESENTATION
PURPOSES. IT IS INTENDED FOR QUALIFIED ELIGIBLE PARTICIPANTS ONLY. PAST
PERFORMANCE IS NOT NECESSARILY INDICATIVE OF FUTURE RETURNS.
“Virtually guaranteed to lose money through time.”
- Robert E. Whaley, The Creator of VIX
“VXX: Where Wealth Goes to Die”- Daniel Putnam

.
When Diversification Fails
THIS MATERIAL IS CONFIDENTIAL AND IS PROVIDED SOLELY FOR PRESENTATION
PURPOSES. IT IS INTENDED FOR QUALIFIED ELIGIBLE PARTICIPANTS ONLY. PAST
PERFORMANCE IS NOT NECESSARILY INDICATIVE OF FUTURE RETURNS.
Diversification can help mitigate risk, but leaves portfolios vulnerable in liquidation periods when correlations rise.
During the
Financial Crisis,
diversification
benefits
disappeared as
correlations
increased.
Source: CBOE & Edward Szado, CFA
Correlation To S&P 500 Index
0.02
0.51
-0.22
0.56
0.22
0.87
0.52
0.85
-0.40
-0.20
0.00
0.20
0.40
0.60
0.80
1.00
Bonds High Yield Bonds Commodity Real Estate
2004-2006
2007-2008

.
VIX Helps Complete Diversification
VIX reliably rises during market stress, providing an effective offset for rising correlations during crisis periods.
VIX Index
+172.4%
IEF 10yr Treasury ETF
-1.8%
S&P 500 Index
-24.2%
Return Comparison: September – October 2008
Any indices and other financial benchmarks shown are provided for illustrative purposes only, are unmanaged, reflect reinvestment of income and dividends and may not reflect the
impact of advisory fees. Data is of date of publication. For more information regarding the benchmarks included herein, see ishares.com, cboe.com, and standardandpoors.com.
THIS MATERIAL IS CONFIDENTIAL AND IS PROVIDED SOLELY FOR PRESENTATION
PURPOSES. IT IS INTENDED FOR QUALIFIED ELIGIBLE PARTICIPANTS ONLY. PAST
PERFORMANCE IS NOT NECESSARILY INDICATIVE OF FUTURE RETURNS.

.
Static Approaches To VIX Fall Short
Gaining exposure to VIX via static approaches is easy to implement but doesn’t produce the desired portfolio effect.
Short VIX Futures ProfileLong VIX Futures Profile
Can profit during rising volatility, but -40% annual since Mar 2004. Profitable in rising markets, but does not hedge against rising
volatility.
S&P 500 VIX Short Term Futures
Index
Daily Inverse S&P 500 VIX Short Term Futures Index
Any indices and other financial benchmarks shown are provided for illustrative purposes only, are unmanaged, reflect reinvestment of income and dividends and may not reflect the
impact of advisory fees. Data is of date of publication. For more information regarding the benchmarks included herein, see ishares.com, cboe.com, and standardandpoors.com.
THIS MATERIAL IS CONFIDENTIAL AND IS PROVIDED SOLELY FOR PRESENTATION
PURPOSES. IT IS INTENDED FOR QUALIFIED ELIGIBLE PARTICIPANTS ONLY. PAST
PERFORMANCE IS NOT NECESSARILY INDICATIVE OF FUTURE RETURNS.

.
proteus Summary
THIS MATERIAL IS CONFIDENTIAL AND IS PROVIDED SOLELY FOR PRESENTATION
PURPOSES. IT IS INTENDED FOR QUALIFIED ELIGIBLE PARTICIPANTS ONLY. PAST
PERFORMANCE IS NOT NECESSARILY INDICATIVE OF FUTURE RETURNS.
Traditional correlation-based
diversification fails when correlations rise, commonly in
times of stress
Since its correlation is
reliably negative, adding volatility (VIX) exposure can help address
this issue
Proteus Dynamic Volatility program
may provide a more effective
volatility exposure than static VIX
approaches
Typhon Capital provides
institutional-caliber operations
and risk management capabilities

.
proteus Dynamic ETP Fund
Strategy at a Glance
The Proteus Dynamic ETP Fund is a systematic, uncorrelated capital appreciation strategy using a rules-
based trading system on Exchanged-Traded Products (ETPs) that track VIX futures, either long or short.
Strategy AUM $14.5M
Minimum Investment U.S. $100k
Management Fee 2%
Incentive Allocation 20%
Liquidity Bi-Monthly
THIS MATERIAL IS CONFIDENTIAL AND IS PROVIDED SOLELY FOR PRESENTATION
PURPOSES. IT IS INTENDED FOR QUALIFIED ELIGIBLE PARTICIPANTS ONLY. PAST
PERFORMANCE IS NOT NECESSARILY INDICATIVE OF FUTURE RETURNS.

.
proteus Dynamic ETP Fund Returns
THIS MATERIAL IS CONFIDENTIAL AND IS PROVIDED SOLELY FOR PRESENTATION
PURPOSES. IT IS INTENDED FOR QUALIFIED ELIGIBLE PARTICIPANTS ONLY. PAST
PERFORMANCE IS NOT NECESSARILY INDICATIVE OF FUTURE RETURNS.
Performance figures are a composite of managed account returns normalized to 2/20. Returns from October 1st, 2011 to July 31, 2016 have been independently
verified by Alpha Performance Verification Services. VXX is the ETF designed to track the SPVIXSTR, S&P 500 VIX Short-Term Futures Index and
XVZ is the ETF designed to track the S&P 500 Dynamic VIX Futures Index; see www.spindices.com for more information. Please see offering materials for
more notes and risk factors.
Year Jan Feb Mar Apr May Jun Jul Aug Sep Oct Nov Dec Year
2018 (4.53%) (3.97%) (6.05%) (13.87%)
2017 4.42% 3.74% 2.33% 1.27% (1.16%) (1.43%) 1.87% 0.53% 1.34% 1.73% 0.43% 1.75% 17.99%
2016 3.88% 0.42% (2.30%) (0.86%) 0.41% 3.28% (5.36%) (1.25%) (0.45%) 1.71% 5.54% 3.89% 8.71%
2015 0.02% 0.06% 2.54% 2.47% 2.46% 1.95% 5.21% (0.33%) (3.12%) 2.12% (0.48%) (0.25%) 13.12%
2014 (1.42%) (4.54%) (2.03%) (0.39%) 0.19% 2.64% 1.78% 1.18% (1.19%) (1.49%) 0.69% (5.86%) (10.27%)
2013 16.96% 0.50% 2.19% 4.41% (4.37%) (6.12%) 7.40% (5.15%) 6.79% 2.96% 2.44% 3.82% 34.13%
2012 24.18% (6.11%) 7.36% (1.91%) (12.45%) 8.78% 5.00% 11.46% 11.77% (4.39%) 7.09% (6.49%) 46.46%
2011 15.20% (12.56%) 13.57% 14.40%
Monthly Net Performance
Growth of $1,000
-15%
-10%
-5%
0%
5%
10%
15%
20%
25%
$0
$500
$1,000
$1,500
$2,000
$2,500
Proteus ETP Monthly Return Proteus ETP Fund XVZ VXX
Proteus XVZ VXX
Annualized Return 15.28% (16.37%) (57.20%)
Max Drawdown (14.55%) (69.75%) (99.76%)
Largest Gain 24.18% 11.07% 67.47%
Largest Loss (12.56%) (12.35%) (31.57%)
Sharpe Ratio 0.80 (1.21) (1.17)
Sortino Ratio 0.40 (0.40) (0.51)
Volatility (σ) 20.34% 13.82% 57.03%
Correlation (r) -27.99% -49.84%
Selected Statistics

.
VIX is a Closed Loop
THIS MATERIAL IS CONFIDENTIAL AND IS PROVIDED SOLELY FOR PRESENTATION
PURPOSES. IT IS INTENDED FOR QUALIFIED ELIGIBLE PARTICIPANTS ONLY. PAST
PERFORMANCE IS NOT NECESSARILY INDICATIVE OF FUTURE RETURNS.
Since it tracks expectations for 30-day variability in the VIX1 , the VIX Index is a closed loop. It simply oscillates over and under
its long term average price of about 20. Using VIX ETPs* and VIX futures and options, each loop can be a potential profit
opportunity. The pace and size of loops may vary, but this is all the VIX ever does.**
Price High: 40+
Price Low: 10 - 12
VIX loops are independent of:
• Level of S&P (bull/bear markets)
• Interest rates
• Earnings / economic conditions
Avg = 20
*Exchange-Traded Products **Source: Bloomberg
VIX Rising
S&P Falling
VIX Falling
S&P Rising

.
Year Jan Feb Mar Apr May Jun Jul Aug Sep Oct Nov Dec Year
2017 4.40% 3.70% 2.30% 1.30% (1.20%) (1.40%) 1.87% 0.53% 1.34% 13.43%
2016 3.90% 0.40% (2.30%) (0.90%) 0.40% 3.30% (5.40%) (1.30%) (0.40%) 1.70% 5.50% 3.90% 8.59%
2015 0.00% 0.10% 2.50% 2.50% 2.50% 1.90% 5.20% (0.30%) (3.10%) 2.10% (0.50%) (0.30%) 13.07%
2014 (1.40%) (4.50%) (2.00%) (0.40%) 0.20% 2.60% 1.80% 1.20% (1.20%) (1.50%) 0.70% (5.90%) (10.23%)
2013 17.00% 0.50% 2.20% 4.40% (4.40%) (6.10%) 7.40% (5.20%) 6.80% 3.00% 2.40% 3.80% 34.07%
2012 24.20% (6.10%) 7.40% (1.90%) (12.50%) 8.80% 5.00% 11.50% 11.80% (4.40%) 7.10% (6.50%) 46.58%
2011 15.20% (12.60%) 13.60% 14.38%
Client Monthly Net Performance
Return Characteristics
THIS MATERIAL IS CONFIDENTIAL AND IS PROVIDED SOLELY FOR PRESENTATION
PURPOSES. IT IS INTENDED FOR QUALIFIED ELIGIBLE PARTICIPANTS ONLY. PAST
PERFORMANCE IS NOT NECESSARILY INDICATIVE OF FUTURE RETURNS.
Proteus Dynamic ETP performs best in trending markets (up or down) and seeks to recover quickly from drawdowns
Past performance is no guarantee of future results. Performance results prior to the Kaizen inception date includes accounts managed at another entity. The persons managing the account at Kaizen were primarily
responsible for achieving the performance results at the prior firm and the strategy is currently being managed in a similar manner.
Proteus Dynamic ETP drawdowns are typically around these
transition points. Importantly, these transitions also set up the
next opportunity as VIX continues around the loop.
This is why the system’s most profitable periods have been
immediately following transitions.
2016 Transition Examples
Recovery Examples

.
ETP Risk/Reward Trade
THIS MATERIAL IS CONFIDENTIAL AND IS PROVIDED SOLELY FOR PRESENTATION
PURPOSES. IT IS INTENDED FOR QUALIFIED ELIGIBLE PARTICIPANTS ONLY. PAST
PERFORMANCE IS NOT NECESSARILY INDICATIVE OF FUTURE RETURNS.
25.2%
-12.6%
Top 10 vs Worst 10 Trades: Avg ROR
Top 10 Avg ROR Worst 10 Avg ROR
Proteus Dynamic ETP Trade ROR Distribution

The Typhon Team
THIS MATERIAL IS CONFIDENTIAL AND IS PROVIDED SOLELY FOR PRESENTATION
PURPOSES. IT IS INTENDED FOR QUALIFIED ELIGIBLE PARTICIPANTS ONLY. PAST
PERFORMANCE IS NOT NECESSARILY INDICATIVE OF FUTURE RETURNS.
THIS MATERIAL IS CONFIDENTIAL AND IS PROVIDED SOLELY FOR PRESENTATION
PURPOSES. IT IS INTENDED FOR QUALIFIED ELIGIBLE PARTICIPANTS ONLY. PAST
PERFORMANCE IS NOT NECESSARILY INDICATIVE OF FUTURE RETURNS.

.
THIS MATERIAL IS CONFIDENTIAL AND IS PROVIDED SOLELY FOR PRESENTATION
PURPOSES. IT IS INTENDED FOR QUALIFIED ELIGIBLE PARTICIPANTS ONLY. PAST
PERFORMANCE IS NOT NECESSARILY INDICATIVE OF FUTURE RETURNS.
James Koutoulas
National Media ProfilesBusiness Insider- Meet James Koutoulas, The Man Who Never Wanted To Be A Lawyer But Now Fights For 8,000 MF Global Customers
Chicago Tribune- Hedge-fund Manager an Impassioned Advocate for Commodities Customers
Forbes- The Hero of MF Global’s High-Noon James Koutoulas Wins Big for Little Guys
Fortune- The Boy Wonder of the MF Global Nightmare
Motley Fool- You Want Real Change in the Financial Industry? I suggest you keep an eye on James Koutoulas
Thomson Reuters- Brash Commodities Trader Shakes up MF Global case
Typhon’s CEO, James L. Koutoulas, Esq., founded Typhon 2008 in order to provide investors with the
ability to access emerging managers who are surrounded by institutional infrastructure. He sits on Typhon’s
Risk and Investment Committees. James has 20 years experience in accounting, computer programming,
operations, and trading. He graduated from the University of Florida with a B.S. in Finance as a National
Merit Scholar, and has a J.D. from the Northwestern University Prtizker School of Law with a
concentration in Securities Law. Northwestern Law named James its top Emerging Leader in 2016.
James is one of the leaders of the futures industry. He is the President and co-founder of the Commodity
Customer Coalition and led the recovery of $6.7B for customers affected by the MF Global Bankruptcy.
He served on the Board of Directors of the National Futures Association for three years. James has a
Series 3 and Series 65. He is an Advisor to Basis and was named one of “Wall Street’s Top Crypto
Rockstars” by Business Insider.
Chief Executive Officer
THIS MATERIAL IS CONFIDENTIAL AND IS PROVIDED SOLELY FOR PRESENTATION
PURPOSES. IT IS INTENDED FOR QUALIFIED ELIGIBLE PARTICIPANTS ONLY. PAST
PERFORMANCE IS NOT NECESSARILY INDICATIVE OF FUTURE RETURNS.

.
David Klusendorf
David Klusendorf is the Chief Investment Officer and a principal of Typhon Capital Management which he
joined in March 2015. Mr. Klusendorf began his career at Timber Hill, LLC, a propriety option market
making firm based in New York, N.Y., as a floor clerk in March 1987. In June 1987, Mr. Klusendorf was
promoted to floor trader and became a member at the Chicago Mercantile Exchange. He was responsible for
making markets in the S&P options and hedging the firm’s position in the S&P futures pit. In November
1988, Mr. Klusendorf became a member at the Chicago Board of Trade and was promoted to the head of the
CBOE 250 futures operation at the Chicago Board Options Exchange.
In August 1989, Mr. Klusendorf returned to the CME to serve as the head of futures trading for Timber
Hill’s new foreign currency operation. In March 1992, Mr. Klusendorf left Timber Hill to trade Eurodollars
for Bob Levinson’s Proprietary Trading Group located in Chicago, Illinois. The firm gave him his own
discretionary account allowing him to manage his own positions independently. Mr. Klusendorf was assigned
the responsibility of training the firm’s new traders, educating them in execution, spreading and hedging
techniques. In April 1993, Mr. Klusendorf purchased a full membership at the CME and founded Klusendorf
Trading as its President. Klusendorf Trading was a propriety trading company specializing in interest rate
products with a focus on Eurodollar futures located in Chicago, Illinois.
Mr. Klusendorf enrolled at Loyola University Chicago located in Chicago Illinois in the fall 1983. He earned a
Bachelor of the Arts in Finance in December 1986. January 1987, Mr. Klusendorf enrolled in the graduate
school of Business at Loyola University Chicago from where he graduated with a Masters of Business
Administration in June 1991. He holds a Series 3 and 30
Chief Investment Officer
THIS MATERIAL IS CONFIDENTIAL AND IS PROVIDED SOLELY FOR PRESENTATION
PURPOSES. IT IS INTENDED FOR QUALIFIED ELIGIBLE PARTICIPANTS ONLY. PAST
PERFORMANCE IS NOT NECESSARILY INDICATIVE OF FUTURE RETURNS.

.
James Gallo
James Gallo joined Typhon Capital Management in May 2016 as the Portfolio Manager of
the Vulcan Metals Strategy.
In 1987, Mr. Gallo became a member of Commodity Exchange, Inc., COMEX, based in
New York, NY, as the youngest member in its history. Once Mr. Gallo graduated from high
school he embarked on what has become a three-decade career in the financial industry, all
spent at the COMEX/NYMEX where he has both run All American Copper and been a
proprietary trader for 29 years.
Mr. Gallo has also served as President and CEO for the All American Copper Corporation,
a order execution firm in New York, NY, since 1994.
Mr. Gallo lives in New Jersey and is an avid sports fan and aficionado of American History.
Portfolio Manager: Vulcan Metals Strategy
THIS MATERIAL IS CONFIDENTIAL AND IS PROVIDED SOLELY FOR PRESENTATION
PURPOSES. IT IS INTENDED FOR QUALIFIED ELIGIBLE PARTICIPANTS ONLY. PAST
PERFORMANCE IS NOT NECESSARILY INDICATIVE OF FUTURE RETURNS.

.
Edward Smith
THIS MATERIAL IS CONFIDENTIAL AND IS PROVIDED SOLELY FOR PRESENTATION
PURPOSES. IT IS INTENDED FOR QUALIFIED ELIGIBLE PARTICIPANTS ONLY. PAST
PERFORMANCE IS NOT NECESSARILY INDICATIVE OF FUTURE RETURNS.
Edward Smith is a Senior Trader within Typhon’s Vulcan Metals Group and is a
Precious Metals Specialist.
Mr. Smith has spent nearly three decades working in the financial industry,
beginning as a phone clerk for Harmon, Lichtenstein & Company. Since the start,
Mr. Smith has been persistent and keen to learn from each position he has held at
each institution.
In 1994 Mr. Smith became a member of COMEX trading proprietary accounts. In
2005, Mr. Smith was hired by Hudson River Futures to trade gold, silver and copper.
After working at the NYMEX for over two decades, Mr. Smith parlayed his
experience and passion for metals into a new venture with a partner, forming
Hudson Floor Brokerage. While growing this new business, Mr. Smith continued to
have great rapport with his customers, maintaining his excellent reputation within
the industry. Through Hudson, he has worked closely with James Gallo, the head of
the Vulcan Metals Group since 2006.
Mr. Smith remains a member of both the COMEX and NYMEX.
Senior Trader: Vulcan Metals Strategy

.
Anthony Cicileo
THIS MATERIAL IS CONFIDENTIAL AND IS PROVIDED SOLELY FOR PRESENTATION
PURPOSES. IT IS INTENDED FOR QUALIFIED ELIGIBLE PARTICIPANTS ONLY. PAST
PERFORMANCE IS NOT NECESSARILY INDICATIVE OF FUTURE RETURNS.
Anthony Cicileo is a Senior Trader for Typhon’s Vulcan Metals Group and joined
the group in January 2017. Mr. Cicileo adds his expertise as a Silver Metals Specialist
to the Vulcan trade group.
Prior to joining Typhon, Mr. Cicileo held the roles of floor trader, broker and
President and owner of Arch/AC Trading from October of 1998 to present. While
owning and operating Arch/AC, Mr. Cicileo also performed speculative proprietary
trading.
Previous to Arch/AC, Mr. Cicileo worked for Credit Suisse from September 1996 to
October 1998 and Republic National Bank from February 1990 through June 1996
on their respective trading desks as a Market Maker in precious metals bouillon and
forwards. Mr. Cicileo hedged and managed bank portfolios valued at over $300M
and participated in speculative trading.
Mr. Cicileo received a Bachelor’s degree in Finance from Baruch College in New
York, New York.
Mr. Cicileo remains an active member of COMEX.
Senior Trader: Vulcan Metals Strategy

.
Alexander Green
In November of 2017, CALCULATED TRADING LLC joined Typhon to head the Stoic Rules-Based Strategies
Group. Alexander Green is the Managing Member and Chief Investment Officer of CALCULATED TRADING
LLC, which he founded in March 2014.
Prior to starting CALCULATED TRADING LLC, Mr. Green was a Managing Director at Crestline Investors,
Inc where he worked from 2004 to 2014. While at Crestline Mr. Green was the Strategy Head for Structured
Credit, Mortgage Arbitrage, Interest Rate Arbitrage, Volatility Arbitrage, Managed Futures, Municipal Bond
Arbitrage, Macro, Convertible Bond Arbitrage, and Currency strategies. He managed 20-25% of Crestline’s
Diversified Fund of Hedge Funds ($3+ billion AUM) and sourced several opportunistic trades for the fund and
clients.
From 2001 to 2004 Mr. Green was a Portfolio Manager at Freddie Mac working on the mortgage portfolio. Mr.
Green’s focus was non-agency mortgage securities (CMBS, Subprime, Alt-A, HELOC, FHA/VA, etc.) where he
developed and tracked prepayment and loss models as well as reverse engineered all RMBS deals. Before moving
onto the mortgage portfolio, Mr. Green ran the internal risk management for Freddie Mac’s $3 billion external
money manager program from 2000 to 2001.
Previous to Freddie Mac, Mr. Green was a Proprietary Equity Trader from 1999 to 2000 and worked for Atlantic
Portfolio Analytics & Management (APAM), a mortgage hedge fund, from 1998 to 1999. At APAM Mr. Green
traded interest rate derivatives, agency debentures, currencies, and US Treasuries.
Mr. Green graduated from The University of Florida in 1995 with a BSBA with Honors in Finance where he was
a member of the Men’s Track and Field Team, made the SEC Academic Honor Roll in 1994, and was an SEC
Scholar Athlete award winner in 1994.
Mr. Green graduated from Boston College in 1997 with a MS in Finance.
Portfolio Manager: Stoic Rules-Based Strategies Fund
THIS MATERIAL IS CONFIDENTIAL AND IS PROVIDED SOLELY FOR PRESENTATION
PURPOSES. IT IS INTENDED FOR QUALIFIED ELIGIBLE PARTICIPANTS ONLY. PAST
PERFORMANCE IS NOT NECESSARILY INDICATIVE OF FUTURE RETURNS.

.
George Michalopoulos
THIS MATERIAL IS CONFIDENTIAL AND IS PROVIDED SOLELY FOR PRESENTATION
PURPOSES. IT IS INTENDED FOR QUALIFIED ELIGIBLE PARTICIPANTS ONLY. PAST
PERFORMANCE IS NOT NECESSARILY INDICATIVE OF FUTURE RETURNS.
Portfolio Manager: Leonidas Crypto, Energy, and Macro Group
George Michalopoulos joined Typhon in December 2016 as the head of the Leonidas
Crypto, Energy, and Macro Group.
Prior to joining Typhon, Mr. Michalopoulos worked for Citadel Investment Group in
London and Chicago from August of 2005 through March of 2011 where he held various
roles, among them Portfolio Manager and as a Junior Trader for their crude oil portfolio-
ultimately becoming the Director of Citadel’s sole speculative crude volatility business.
During his tenure at Citadel, Mr. Michalopoulos gained valuable skills and experience
trading in the energy products, including Crude Oil, WTI, Brent, and Natural Gas.
Following his time at Citadel, Mr. Michalopoulos founded Empeopled, a social project to
self-govern social media and create crowd-based decision making, in April of 2012 in Los
Angeles, California and continues working on today.
Mr. Michalopoulos graduated from The University of Chicago in June of 2005 with a BA in
Economics and a 3.8 GPA, he was named to the Dean’s List from 2001 thru 2005, and was
a Metcalf Fellow in 2004. Mr. Michalopoulos was elected Phi Beta Kappa in 2005.

.
Jerod Leman
THIS MATERIAL IS CONFIDENTIAL AND IS PROVIDED SOLELY FOR PRESENTATION
PURPOSES. IT IS INTENDED FOR QUALIFIED ELIGIBLE PARTICIPANTS ONLY. PAST
PERFORMANCE IS NOT NECESSARILY INDICATIVE OF FUTURE RETURNS.
Jerod Leman is the principal trader and portfolio manager for the Plutus Grain Strategy.
He also continues to structure cash market hedges for end users and producers of
agricultural products at Wellington Commodities.
Mr. Leman was born and raised on a farm in Indiana. He graduated from Purdue
University with a Bachelors Degree in Agricultural Economics. Mr. Leman brings a real
world meets higher education approach to trading agricultural strategies.
Previous to joining Typhon, Mr. Leman held the position of Hedge Account Executive at
Overmeyer Commodities, Commercial Hedgings. He was also involved in Direct-Ship
Cash Grain with Starke Indy Direct.
Portfolio Manager: Plutus Grain Strategy
THIS MATERIAL IS CONFIDENTIAL AND IS PROVIDED SOLELY FOR PRESENTATION
PURPOSES. IT IS INTENDED FOR QUALIFIED ELIGIBLE PARTICIPANTS ONLY. PAST
PERFORMANCE IS NOT NECESSARILY INDICATIVE OF FUTURE RETURNS.

.
Nick Nickols
Nick A Nickols is currently Co-Head of Typhon’s Capital’s livestock group where he manages the
Zephyrus Livestock Strategy. Mr. Nickols is President of NK Commodity Brokers, Inc. which began in
1991 providing financial risk strategies and execution services to their Institutional clients. Prior to 1991,
Mr. Nickols began his career in 1981 with Security Pacific National Bank in their Primary Dealer Group
and was VP of their Futures Commission Merchant Sales staff, focusing on Treasury and Eurodollar
strategies and cross currency arbitrage strategies.
With the consolidation of the banking industry in the mid 1990’s, NK Commodity Brokers focus was
shifted into the traditional commodities, with new clientele needing risk management solutions in Coffee,
Sugar & Cocoa, Live Cattle & Hogs.
In 2007, NK Commodity Brokers established a small Exempt Commodity Pool with multiple outside
managers to provide additional products to new clients. Mr. Nickols took over 100% of the trading in the
pool in 2015 to focus on a single market sector, Livestock.
Mr. Nickols has been a member of the NFA since 1989.
He Received his Bachelor of Science in Business Administration from West Coast University.
He was on the Board of Directors of Michrom BioResources Inc. a Scientific Instrumentation
manufacturer of HPLC and Mass Spectrometers and was instrumental in the purchase of the Company to
Bruker, Inc. in 2011.
Mr Nickols has a Series 3
Portfolio Manager: Zephyrus Livestock Strategy
THIS MATERIAL IS CONFIDENTIAL AND IS PROVIDED SOLELY FOR PRESENTATION
PURPOSES. IT IS INTENDED FOR QUALIFIED ELIGIBLE PARTICIPANTS ONLY. PAST
PERFORMANCE IS NOT NECESSARILY INDICATIVE OF FUTURE RETURNS.

.
THIS MATERIAL IS CONFIDENTIAL AND IS PROVIDED SOLELY FOR PRESENTATION
PURPOSES. IT IS INTENDED FOR QUALIFIED ELIGIBLE PARTICIPANTS ONLY. PAST
PERFORMANCE IS NOT NECESSARILY INDICATIVE OF FUTURE RETURNS.
D. Matthew Thompson
Matthew Thompson is currently Co-Head of Typhon Capital’s volatility group where he manages
the Proteus Dynamic Volatility Program and Proteus Risk Overlay. Mr. Thompson became a
principal of Typhon in November 2013, and in January 2014, he also became an associated person to
operate Proteus exclusively for Typhon. In July of 2015 Mr. Thompson took on an additional role at
mutual fund manager Kaizen Advisory, LLC to head their strategy research and risk management
efforts. Previous to Typhon, Mr. Thompson was a principal at Advocate Asset Management and a
proprietary trader for Avalon Trading, a group within the prop trading arm of ED&F Man Ltd.
Earlier in his career, Mr. Thompson was a portfolio manager at Hills Capital Management, a
$100MM family office where he co-developed the Proteus strategy. Prior to Hills, Mr. Thompson
held business development and strategy research roles at Actuarials Exchange LLC, a startup
derivatives exchange in Chicago IL.
Prior to these roles, Mr. Thompson held portfolio analytics and management roles at Northern Trust
and a $500MM registered investment advisor in Chicago, IL as well as a portfolio analytics and
consulting role at Envestnet, a $3B consultant to registered investment advisors across the US.
Mr. Thompson holds a BS in Economics from the University of Illinois at Urbana/Champaign and
has earned the CFA designation. He is currently a member of the CFA Institute and the CFA Society
of Chicago.
Portfolio Manager: Proteus Dynamic Volatility Program
THIS MATERIAL IS CONFIDENTIAL AND IS PROVIDED SOLELY FOR PRESENTATION
PURPOSES. IT IS INTENDED FOR QUALIFIED ELIGIBLE PARTICIPANTS ONLY. PAST
PERFORMANCE IS NOT NECESSARILY INDICATIVE OF FUTURE RETURNS.

.
THIS MATERIAL IS CONFIDENTIAL AND IS PROVIDED SOLELY FOR PRESENTATION
PURPOSES. IT IS INTENDED FOR QUALIFIED ELIGIBLE PARTICIPANTS ONLY. PAST
PERFORMANCE IS NOT NECESSARILY INDICATIVE OF FUTURE RETURNS.
Michael A. Thompson
Michael Thompson is currently Co-Head of Typhon Capital’s volatility group where he manages the
Proteus Dynamic Volatility Program and Proteus Risk Overlay. Mr. Thompson became a principal
of Typhon in November 2013, and in January 2014, he also became an associated person to operate
Proteus exclusively for Typhon. In July of 2015 Mr. Thompson took on an additional role at mutual
fund manager Kaizen Advisory, LLC to head their strategy research and risk management efforts.
Previous to Typhon, Mr. Thompson was a principal at Advocate Asset Management and a
proprietary trader for Avalon Trading, a group within the prop trading arm of ED&F Man Ltd.
Earlier in his career, Mr. Thompson was a portfolio manager at Hills Capital Management, a
$100MM family office in Barrington, IL where he co-developed the Proteus strategy. Prior to Hills,
Mr. Thompson held the Chief of Business Development and strategy research roles at Actuarials
Exchange LLC, a startup derivatives exchange in Chicago IL.
Mr. Thompson has also held portfolio management roles at a $500MM registered investment advisor
and an investment analyst role at William Blair & Company where he developed and implemented an
options overlay strategy for a mutual fund and client portfolios. Mr. Thompson began his career at
Northern Trust & Co as a performance analytics analyst in the Global Custody department before
moving to the Northern Investment Counselor investment group as an Investment Officer.
Mr. Thompson earned a BS in Economics from the University of Illinois at Urbana/Champaign and
holds the CFA designation. He is also a member of the CFA Institute and the CFA Society of
Chicago.
Portfolio Manager: Proteus Dynamic Volatility Program
THIS MATERIAL IS CONFIDENTIAL AND IS PROVIDED SOLELY FOR PRESENTATION
PURPOSES. IT IS INTENDED FOR QUALIFIED ELIGIBLE PARTICIPANTS ONLY. PAST
PERFORMANCE IS NOT NECESSARILY INDICATIVE OF FUTURE RETURNS.

.
Damian Taylor
In February of 2017, Messrs. van den Bergh and Taylor joined Typhon as the co-heads of the Helios
Deutsche Program.
Prior to joining Typhon Mr. Taylor set up the equity trading desk for the Seaport Group from June of
2014 through May of 2015. Before that, he was a partner and head of Equity trading at NSBO Ltd (North
Square Blue Oak) from November of 2008 through March of 2014.
From August of 2007 to October of 2008 Mr. Taylor was appointed head of trading at Matrix Alternative
Asset Management, a hedge fund group with 3 funds running over $40M AUM. He came to Matrix after
working at Pali International from February of 2006 until July 2007 as a senior trader for Institutional
Derivatives and Equities.
Before joining Pali, Mr. Taylor set up the Mountcashel Fund from May 2002 through January 2006-a long-
short equity hedge fund based on a proprietary algorithm he helped to write and develop and served as
Partner and Senior Fund Manager.
From September 1997 to April 2002 Mr. Taylor worked for ING Barings where he developed a trading
system that systematically traded long-short equities, relative value and directional futures for one of their
proprietary books. Mr. Taylor began his career as a closed-end funds analyst at Caspian Securities from
January 1996 to August 1997.
Mr. Taylor received his BA from the University of Manchester in 1995 with Honors in Economics and
Econometrics. Mr. Taylor completed 3 A levels in Economics, Math and Chemistry in 1991. He currently
holds an Investment Management Certificate.
Portfolio Manager: Helios Deutsche Program
THIS MATERIAL IS CONFIDENTIAL AND IS PROVIDED SOLELY FOR PRESENTATION
PURPOSES. IT IS INTENDED FOR QUALIFIED ELIGIBLE PARTICIPANTS ONLY. PAST
PERFORMANCE IS NOT NECESSARILY INDICATIVE OF FUTURE RETURNS.

.
Hubert Van den Bergh
In February of 2017, Messrs. Van den Bergh and Taylor joined Typhon as the co-heads of
the Helios Deutsche Program.
Prior to joining Typhon, Mr. Van den Bergh worked in equity sales for The Lazarus
Partnership from 2014 to 2015 and Oriel Securities from 2013 to 2014. Prior to this Mr.
Van den Bergh was at Kew Capital LLP, 2010 through 2011, as manager of an equity
long/short book.
From 2004 to 2009 he co-managed a fund at Park Town Asset Management LLP, a
business later sold to Matrix Asset Management LLP.
Mr. Van den Bergh was at Merrill Lynch Investment Managers from 1998 to 2004 where he
managed $1bn of pension fund money. Simultaneously, he co-managed the UK equity
hedge fund.
Mr. Van den Bergh received a BA degree from Oxford University in French and Linguistics.
His earlier education was completed at Eton College. Mr. Van den Bergh holds both CFA
and IMC (Investment Management Certificate), credentials.
Portfolio Manager: Helios Deutsche Program
THIS MATERIAL IS CONFIDENTIAL AND IS PROVIDED SOLELY FOR PRESENTATION
PURPOSES. IT IS INTENDED FOR QUALIFIED ELIGIBLE PARTICIPANTS ONLY. PAST
PERFORMANCE IS NOT NECESSARILY INDICATIVE OF FUTURE RETURNS.

.
chiron Trading GroupSim
on H
arr
isP
ort
folio
Man
ager •30 years Financial
Markets experience: equities, bonds & foreign exchange in proprietary trading and brokerage in senior management roles since 1982
•Senior Trading and Business Management roles at Wood MacKenzie, Williams de Broe, Tullet & Tokyo
•Risk Management experience running trading teams, Head of Risk at TMS Capital
Nic
hola
s Blo
om
Hea
d o
f R
esea
rch •30 years Financial
Markets in trading and portfolio manager selection and management
•Trading roles with Richco, Chemical Bank Int’l. and Lehman Bros.-metals, money and credit markets
•Manager FI prop trading & Internat’l US Gov’t. Securities
•FI prop trading at Barclays Capital and West Deutsche Landesbank
Luca B
ono
Curr
ency
Str
ateg
ist
•25 years experience in Global currency markets-trading, options and research with JP Morgan, Catalina Capital, Clessidra Alternatives, family office advisory, and others
Jam
es
Mit
chell
Sen
ior
Tra
der
•16 years Trading and Administration experience in Financial Futures
•Responsible for execution and reconciliation, client reporting and liaison and fund administration
THIS MATERIAL IS CONFIDENTIAL AND IS PROVIDED SOLELY FOR PRESENTATION
PURPOSES. IT IS INTENDED FOR QUALIFIED ELIGIBLE PARTICIPANTS ONLY. PAST
PERFORMANCE IS NOT NECESSARILY INDICATIVE OF FUTURE RETURNS.

.
OperationsTyphon’s Due Diligence, Risk, and Operations Group has a wide breadth of experience across the
commodities and securities industries and supervises manager on-boarding, risk, and operations across all of
Typhon’s trading groups.
Dia
na R
ydbeck
Man
agin
g D
irec
tor • Compliance, Operations
and Investor Relations since 2009, Typhon
• Operations, Commodity Customer Coalition
• BS, University of Florida
Ale
x K
ara
Dir
ecto
r o
f O
per
atio
ns • Facilities & Office
Coordinator, Balyasny Asset Management, LP
• Runner/Clerk, JP Morgan Futures, Inc.
• ASCJ, Associate of Science in Criminal Justice, Moraine Valley Community College
THIS MATERIAL IS CONFIDENTIAL AND IS PROVIDED SOLELY FOR PRESENTATION
PURPOSES. IT IS INTENDED FOR QUALIFIED ELIGIBLE PARTICIPANTS ONLY. PAST
PERFORMANCE IS NOT NECESSARILY INDICATIVE OF FUTURE RETURNS.

.
Contact InformationTyphon Capital Management, LLC – Headquarters1776 N. Pine Island Rd., Suite 316Plantation, FL 33322+1.312.836.1180
Typhon Capital Management, LLC – Chicago190 South LaSalle St., Suite 3000Chicago, Illinois 60603+1.312.836.1180
Typhon Capital Management, LLC – New York724 Fifth Avenue, 9th FloorNew York, NY 10019+1.312.836.1180
Typhon Capital Management, LLC – Paris16-18 Rue EscudierBuilding A, 2nd Floor92100 Boulogne BillancourtIle-de-FranceFrance
THIS MATERIAL IS CONFIDENTIAL AND IS PROVIDED SOLELY FOR PRESENTATION
PURPOSES. IT IS INTENDED FOR QUALIFIED ELIGIBLE PARTICIPANTS ONLY. PAST
PERFORMANCE IS NOT NECESSARILY INDICATIVE OF FUTURE RETURNS.Typhon Capital Management, LLC is registered as a Commodity Trading Advisor and Commodity Pool Operator with the National Futures Association, with
a 4.7 exemption for serving Qualified Eligible Participants only. Typhon Global Fund Management, LLC provides services only to non-US investors and tax
exempt US institutional investors. Typhon Securities, LLC is currently exempt from registering with the Securities and Exchange Commission.
THIS MATERIAL IS CONFIDENTIAL AND IS PROVIDED SOLELY FOR PRESENTATION
PURPOSES. IT IS INTENDED FOR QUALIFIED ELIGIBLE PARTICIPANTS ONLY. PAST
PERFORMANCE IS NOT NECESSARILY INDICATIVE OF FUTURE RETURNS.