Embed Size (px)
Citation preview

63
Cap
ital B
udge
t and
Thr
ee-Y
ear C
apita
l Pla
n
MAJOR CAPITAL PROJECTS – PERCENT OF COMPLETION 2011/121
[IN MILLIONS OF DOLLARS] ESTIMATED COSTS ESTIMATED PERCENT IN PROJECT COMPLETE 2011/12 COST 2011/12
Bioengineering/ ChemicalEngineering 71.3 211.4 47%
BingConcertHall 53.5 111.9 100%
WestCampusRecreationCenter 26.3 35.5 93%
JillandJohnFreidenrichCenter forTranslationalResearch 16.6 21.3 100%
CentralEnergySystemImprovements 65.9 558.0 12%
StanfordResearchComputingFacility 19.1 42.3 50%
SatelliteResearchAnimalFacility(SRAF) 12.5 27.5 69%
3165PorterDriveTenantImprovements 17.7 22.0 100%
3155PorterDriveTenantImprovements 11.9 15.0 100%
294.6 1,044.91 Includesprojectsscheduledtobeinconstructionandwithforecasted
expendituresgreaterthan$10millionin2011/12.
CHAPTER 4
CAPITAL BUDGET AND THREE-YEAR CAPITAL PLAN
Stanford’sCapitalBudgetandthree-yearCapitalPlanarebasedonaprojectionofthemajorcapital
projectsthattheuniversitywillpursueinsupportoftheacademicmission.TheCapitalBudget
representstheanticipatedcapitalexpendituresinthefirstyearoftherollingthree-yearCapitalPlan.
TheCapitalPlanincludesprojectsthatareinprogressorareexpectedtocommenceduringthatthree-year
period.BoththeCapitalBudgetandtheCapitalPlanaresubjecttochangebasedonfundingavailability,budget
affordability,anduniversitypriorities.
The university has been in the midst of the largest con-
struction program in its history, addressing the need
to replace and upgrade many aging facilities. At $1.9
billion, the Capital Plan is 24% larger than last year’s
plan. This year’s plan includes significant projects in the
areas of academic research, housing, and infrastructure.
The 2011/12–2013/14 Capital Plan includes the new
Bioengineering/Chemical Engineering building, a new
concert hall, several School of Medicine projects (includ-
ing plans to lease 255,124 gross square feet of Stanford
Research Park space), the repurposing of the vacated
Graduate School of Business complex, and a new build-
ing for the arts. Housing projects include the addition of
the new Escondido Village Comstock Graduate Housing
and Rains Houses Renovation projects. The Capital Plan
also includes $558 million for the new Campus Energy
SystemImprovementsprojects.
The Capital Plan reflects the significant investment that
Stanfordismakinginitsfacilities,drivenbytheacademic
priorities for teaching, research, and related activities
describedinChapter2,andtheinitiativesoftheadministra-
tiveandauxiliaryunitsthatsupporttheacademicmission,
describedinChapter3.Thischapterincludesadiscussion
ofthe2011/12CapitalBudget,providesanoverviewofthe
capitalplanningprocess,describescurrentstrategicinitia-
tives,andpresentsthe2011/12–2013/14CapitalPlanand
relatedconstraints.
THE CAPITAL BUDGET, 2011/12
The 2011/12 Capital Budget at $455.5 million reflects
the university’s significant capital projects including the
Bioengineering/Chemical Engineering building (BioE/
ChemE), Bing Concert Hall, West Campus Recreation
Center, Jill and John Freidenrich Center for Translational
Research (Freidenrich Center), Campus Energy System
Improvements (CESI), Stanford Research Computing
Facility, Satellite Research Animal Facility (SRAF), tenant
improvementsat3155and3165PorterDrive,andvarious
infrastructureprojectsandprograms.Theprojected2011/12
expendituresreflectonlyaportionofthetotalcostsofthe
capitalprojects,asmostprojectsspanmorethanoneyear.
Thetablebelowhighlightsmajorcapitalprojectswithsig-

64
Cap
ital B
udge
t and
Thr
ee-Y
ear C
apita
l Pla
n
nificantexpenditureswhichwillbeincurredinthe2011/12
Capital Budget, as well as the percentage of the project
expectedtobecompletebytheendof2011/12.
Themagnitudeof theCapitalBudget isbasedon theas-
sumptionthatfundingavailabilitywillalignwithapproved
projectschedules.Historically,theCapitalBudgethasbeen
substantially higher than actual spending due to project
deferralscausedbyfundinggaps.Infact,thelastdecade’s
actualexpenditureswere69%ofthetotalbudgeted.This
hasbeen lessofa factor in the threepastyearsbecause
mostoftheprojectsinrecentCapitalBudgetshavefunding
identified,staffassigned,andBoardofTrusteesapproval.
However,expendituresin2011/12maybelowerthanthese
averagesduetothehigherlevelofGiftstobeRaisedand
ResourcestobeIdentified.
Sources and UsesSourcesoffundsfortheCapitalBudgetwillbeacombina-
tionofCurrentFunds(whichincludetheCapitalFacilities
Fund (CFF), funds from university and school reserves,
GUPandSIPprograms,andasubventionfromtheHoover
Institution),gifts,anddebt.Theuniversitytypicallyallocates
THECAPITALBUDGET2011/12$455.5MILLION
2000/01 2001/02 2002/03 2003/04 2004/05 2005/06 2006/07 2007/08 2008/09 2009/100
100
200
300
400
500
600
700
800
CAPITAL BUDGET VS. EXPENDITURES 2000/01 to 2009/10[IN MILLIONS OF DOLLARS]
Capital Expenditures
Capital Budget
55% 72% 75% 41% 58% 69% 57% 72% 81% 70%
New Construction50%
Renovations11%
Infrastructure39%
Uses of Funds by Project Type
Housing3%
Academic Support30%
Academic/Research
22%
Infrastructure39%
Uses of Funds by Program Category
Athletics/Student Activities
6%

65
Cap
ital B
udge
t and
Thr
ee-Y
ear C
apita
l Pla
n
debttoprojectsintheabsenceofotheravailablefunding.
Themixofprojectfundingwillbeimpactedbythetimingof
giftreceipts,whichmaybebridgefinancedwithmedium-
termdebt.
Of the $455.5 million in the overall Capital Budget, as
shown in theupperpiechartonthe facingpage,anesti-
mated50%ofthebudgetwillbespentonnewconstruction
projects. Infrastructure “project types” comprise 39% of
theupperpie.Theremaining11%offundswillbespenton
renovationprojects.Asshowninthelowerpiechartonthe
facingpage(capturingUsesofFundsbyProgramCategory),
approximately 39% will be spent on infrastructure proj-
ects.TheseincludeCESI,theInvestmentinPlantProgram
(Planned Maintenance), R&DE Capital Improvement
Program (CIP), Capital Utilities Program (CUP), and the
GeneralUsePermit(GUP)MitigationProgram.Academic
Support comprises 30% of the categorical picture in the
lower pie chart, Academic/Research comprises 22%,
Athletics/Student Activities represents 6%, and Housing
comprises3%.
Capital Facilities Fund
AcrucialsourceoffundsforcapitalprojectsistheCFF.In
June2007,theBoardofTrusteesapprovedanincreasein
thetargetendowmentpayoutratefrom5.0%to5.5%.The
additional0.5%payoutreleasesunrestrictedfunds,which
areheldintheCFFtosupportmajorfacilitiesprojects.
Transfers to the CFF will be $81.8 million in 2010/11 and
$85.9million in2011/12withcommitmentsof$35.9mil-
lion in2010/11and$56.5million in2011/12,asshown in
theadjacenttable.
Non-formula CFF funds are allocated to projects that are
difficult to support through restricted sources, and thus
reducethecallfordebtservicedbygeneralfunds.Among
other uses, non-formula CFF is providing funding for the
Stanford Auxiliary Library III Phase 2 ($14.8 million),
West Campus Recreation Center ($11 million), Stanford
ResearchComputingFacility($10.6million),andenhanced
sustainability features for the BioE/ChemE building ($5
million).Loanrepaymentof$19.1millionfromtheOlmsted
TerraceFacultyHomesisanticipatedin2010/11.
TheformulaunitsdetermineusesoftheirCFFfundsaccord-
ingtotheirhighestpriority.
CAPITAL FACILITIES FUND (CFF)Funding Sources and Committed Uses of Funding(IN MILLIONS OF DOLLARS) 2010/11 2011/12
SourcesofFunding Formula Units
SchoolofMedicine 10.7 11.4
HooverInstitution 3.6 3.8
President’sFunds 9.3 9.3
Non-Formula 58.2 61.4
TotalFunding 81.8 85.9
CommittedUsesofFunding VariousProjectsFundedbyPresident’sFunds 9.3 9.3
FoundationsinMedicine1(FIM1) 2.0 6.7
Lane/Alway 5.2
VariousSchoolofMedicineProjects 9.4 2.9
HooverInstitutionProject 3.6 3.8
WestCampusRecreationCenter 11.0
StanfordResearchComputingFacility 6.3 4.2
Bioengineering/ChemicalEngineering 5.0
EmergencyPowerandManagementPrograms 3.1 0.8
StanfordAuxiliaryLibraryIII,Phase2 2.3 11.8
SchoolofEducationBuildingReimbursement (4.9)
OlmstedTerraceFacultyHomesLoanRepayment (19.1)
BingConcertHall(O&M) 7.0
Biology 5.0
CrownQuad 5.0
OtherProjects 2.7
TotalCommitments 35.9 56.5
AnnualUncommittedBalance 45.9 29.4
BalanceatBeginningofYear 38.2 84.1
UncommittedBalance 84.1 113.5
Capital Budget Impact on 2011/12 OperationsThe2011/12ConsolidatedBudgetforOperationsincludes
incrementaldebtserviceandoperationsandmaintenance
(O&M) expenses for projects completing in 2011/12.
Additionally,thisbudgetincludesanincrementalincrease
indebtserviceandO&Mexpensesforprojectscompleting
in2010/11thatwereoperationalforlessthan12months.
Capital projects requiring debt are funded from internal
loansthatareamortizedovertheassetlifeinequalinstall-
ments(principalandinterest).Thebudgetedinterestrate
(BIR)usedtocalculateinternaldebtserviceisablended
rateofinterestexpenseondebtissuedforcapitalprojects,

66
Cap
ital B
udge
t and
Thr
ee-Y
ear C
apita
l Pla
n
bondissuancecosts,andadministrativecosts.TheBIRfor
2011/12is4.5%.
Theprojectedincrementalinternaldebtservicefundedby
unrestricted funds, including formula units, in 2011/12 is
$3.6million.Thisamountincludestheadditionaldebtser-
viceontheKnightManagementCenter,WilliamH.Neukom
(Neukom)Building,theBeckmanEnergyRetrofit,andother
smallercapitalprojectsandprograms.Italsoincludesinter-
estondebtrequiredtobridgefinancegiftreceiptsforthe
Jen-HsunHuangEngineeringCenter,CenterforNanoscale
Science and Engineering, Jerry Yang and Akiko Yamazaki
Environmental and Energy Building, Knight Management
Center, Li Ka Shing Center for Learning and Knowledge,
Lorry I. Lokey Stem Cell Research Building, and Neukom
Building.Thisadditionaldebtservicebringsthetotalannual
internal debt service borne by the unrestricted university
budgetto$58.4million.
Consolidated internal debt service, including that borne
byformulaunits,auxiliaries,servicecenters,FacultyStaff
Housing, and real estate investments is projected to in-
crease from $157.9 million to $164.6 million. In addition,
annual lease payments are projected at $22.9 million in
2011/12.
Theuniversitywill incuradditionalO&Mcostsin2011/12
ofapproximately$3.7million,ofwhich$344,000willbe
fundedbytheBingConcertHallendowment.TheseO&M
costs are primarily attributed to the 2011/12 completion
of the Bing Concert Hall, the 3160 Porter Lease, and the
prioryearcompletionsoftheNeukomBuildingandParking
Structure7(PS7),whichwereoperationalforlessthan12
monthsinthatyear.TheO&Mcostsareoffsetbyprojected
savings resulting from the demolition of the Terman and
Ginztonbuildings.
CAPITAL PLANNING OVERVIEW
Capital Planning at Stanford Stanford’s Capital Plan is a three-year rolling plan with
budgetcommitmentsmadeforthefirstyearandthenonly
forprojectswithfullyidentifiedandapprovedfunding.Cash
flowexpenditureforecastsfortheseprojectsextendbeyond
thethree-yearperiod,withbudgetimpactsforoperations,
maintenance,anddebtservicecommencingatconstruction
completion.Theplanincludesforecastsofbothcashflow
andbudgetimpactsbyyear,demonstratingtheimpactof
projectsbeyondthethree-yearplan(seetablesonpage74).
TheCapitalPlanissetinthecontextofalonger-termcapital
forecastfortheuniversity.Thedetailsofthislonger-term
forecast, particularly funding sources and schedules, are
lessclearthanthoseof thethree-yearplan,astheneeds
andfundingsourcesthatmayemergeoverthelong-term
horizon are difficult to anticipate. Over the longer-term
forecast,planstendtoevolveasvariousprojectsprovemore
feasible than others based upon shifting funding realities
andacademicpriorities.
Inthe2009/10–2011/12CapitalPlan,theuniversitydelayed
orsuspended$1.1billioninplannedcapitalprojectsdueto
theimpactoftheglobalfinancialcrisis.Eachcapitalplan-
ningcycle,thedelayedorsuspendedprojectsarereviewed
todeterminefeasibilityandfundingchanges. Asaresult
ofthisreview,thecurrentplanincludesthereactivationof
$135.8 million in projects, with $3.4 million in associated
O&M expenses. The remaining delayed and suspended
projectswillcontinuetobereevaluatedannually,andare
detailedonthefacingpage.
Strategic Initiatives Thefollowinguniversitystrategicinitiativesareintegralto
thisyear’sCapitalPlanandaredetailedbelow:
n Science,Engineering,andMedicalCampus(SEMC)
n SustainabilityandEnergyManagement(SEM)/Campus
EnergySystemImprovements(CESI)
Science,Engineering,andMedicalCampus
OverthecourseoftheSEMCinitiative,theuniversityhas
invested intheupgradeofaging facilities for thescience,
engineering,andmedicalprograms.
TheSEMCconsistsofeightnewbuildings,sixcompleted,
oneinplanningandonedelayed:
n Astrophysics(completedin2006)
n JerryYangandAkikoYamazakiEnvironmentandEnergy
Building(Y2E2)(completedin2007)
n LorryI.LokeyStemCellResearchBuilding(SIM1)(com-
pletedin2010)
n Jen-Hsun Huang Engineering Center (Huang) (com-
pletedin2010)
n Center forNanoscaleScienceandEngineering(Nano)
(completedin2010)
n LiKaShingCenterforLearningandKnowledge(LKSC)
(completedin2010)

67
Cap
ital B
udge
t and
Thr
ee-Y
ear C
apita
l Pla
n
2011/12–2013/14 CAPITAL PLAN REACTIVATED, DELAYED, SUSPENDED AND CANCELLED PROJECTS [IN MILLIONS OF DOLLARS] ESTIMATED
SCHOOL/ OPERATIONS DEPARTMENT PROJECTCOST DEBTSERVICE &MAINTENANCE
ReactivatedProjects
McMurtry(Art)Building H&S 67.0 1.4
HooverOfficeBuilding(CummingsReplacement) HOOVER 45.6 1.5
StanfordAuxiliaryLibraryIII,Phase2 SUL 14.8 0.4
MaderaGroveChildren’sCenter/MulberryHouse PRES/PROV 4.6 0.1
AccessControlEnterpriseSystem(ACES)-Phase2 PRES/PROV 3.8
Total – Reactivated Projects 135.8 3.4
ESTIMATED
SCHOOL/ OPERATIONS DEPARTMENT PROJECTCOST DEBTSERVICE &MAINTENANCE
DelayedProjects
FoundationsinMedicine(FIM)1 SOM 172.7 2.1 2.3
BiologyBuilding(SEMCproject) H&S 86.1 1.0 1.9
EncinaRenovation DOR/H&S 67.2 2.7
OldChemistryClassroomswithLibrary H&S 55.0 1.8 1.2
PanamaMallRenovations SOE 20.8 0.1
Buildings02-520and02-524Renovations($12M)
DurandPhase4($6.8M)
Building02-560($2M)
PublicSafetyBuilding PRES/PROV 16.6 0.4
GreenDorm(47beds) SOE 16.0 1.3
GolfClubHouse,ProShop,CartBarn DAPER 10.4 0.1
MultipleNon-BoardofTrusteeLevelProjects Multiple 13.0 0.2 0.1
Subtotal-DelayedProjects 457.7 7.8 7.4
SuspendedProjects
RedwoodCityCampusMasterPlanPhase1 PRES/PROV 379.0 18.5 8.9
MemorialAuditoriumRenovation PRES/PROV 63.2
Subtotal-SuspendedProjects 442.2 18.5 8.9
CancelledProjects
MeyerReplacement SUL 46.1
MaplesParkingStructure LBRE 40.0 0.2
MechanicalEngineering(Building630Replacement) SOE 14.9 0.4
Subtotal-CancelledProjects 101.0 0.6
Total - Delayed, Suspended and Cancelled Projects 1,000.9 26.3 16.9

68
Cap
ital B
udge
t and
Thr
ee-Y
ear C
apita
l Pla
n
n Bioengineering/ChemicalEngineering(BioE/ChemE)(in
planning)
n Biology(delayed)
Thisyear’sCapitalPlanincludestheBioE/ChemEbuilding,
one of the two remaining SEMC projects. At $211.4 mil-
lion,theBioE/ChemEprojectisthefinalcomponentofthe
ScienceandEngineeringQuad2(SEQ2).Thisbuildingand
itsassociatedconnectiveelementsandfit-upswillfacilitate
interdisciplinarystudythroughtheplacementoftworelated
programs—Bioengineering and Chemical Engineering—in
onelocation.Thebuildingwillbepredominantlycomprised
ofwetlaboratoriesandassociatedsupportspacesdesigned
forintensiveresearchforeachofthedepartments.Included
in the building scope are classrooms, faculty offices, and
conferencespaces.
The196,315grosssquarefoot(gsf)BioE/ChemEbuilding
will match the architectural character of the neighbor-
ing Y2E2 building, and the Huang Engineering and Nano
Centers.TheGinztonLaboratorywillbedemolishedtoclear
thesite.Massexcavationofthesitewillcommencein2011,
withexpectedcompletionby2014.
Sustainability and Energy Management / Campus Energy System Improvements Stanford is committed to advancing sustainability in the
design, construction, and operation of campus facilities.
Thereductionofoverallenergyconsumptionandtheuseof
cleanerenergysourcesareintegraltocreatingasustainable
campus.Stanfordcontinuesadecade-longcommitmentto
energyconservationandefficiency.
Existingenergy-savingstrategiesareexpectedtodecrease
energyconsumptionthrough2011.In2012,additionalde-
mandfromnewbuildingsmayrequireenhancedconserva-
tionefforts.Stanfordcurrentlyreceivesmostofitsenergy
fromtheCardinalCogenerationplant.Thecontractforen-
ergyservicesfromthisplantexpiresin2015,atwhichtime
itwillbe28yearsoldandneartheendofitsusefullife.The
universityisnowexploringoptionsforreplacingtheplant
throughthenewCESIproject.
Options being considered for this major capital utilities
projectrangefromanewlike-kind,naturalgas-firedcogen-
eration and steam supply system, to a fully electric heat
recovery plant with a campus-wide steam to hot water
conversion,tohybridsofthetwo.Inmostscenarios,anew
centralenergyplantwouldbeconstructed inanewloca-
tiononthewestsideofcampus,andtheoldplantwould
be phased out and demolished to make way for future
academicdevelopment.Alsoincludedisanupgradeofthe
high voltage electrical infrastructure to support campus
growthandaddedcentralplantload.Estimatedcostsfor
CESIare$558million.
Stanford is also pursuing approaches to reduce the use
of non-renewable resources and minimize environmental
impacts. Under the university’s sustainability standards,
newbuildingsarerequiredtouse30%lessenergyand25%
less water than building codes require. This is achieved
through a combination of building orientation relative to
thesun,adeptspaceuseplanningandbuildingoperation
scheduling,anduseofefficientelectricalandmechanical
equipment.Inaddition,useofnativedrought-tolerantland-
scapingandnon-potableorreclaimedwaterfor irrigation
andothersuitableapplications,educationandtrainingof
buildingoccupants,andothermeasureswillcontributeto
improved conservation and sustainability goals. Existing
buildings thathavebeen identifiedas the largestenergy-
intensivefacilitiesoncampusarebeingrenovatedtomeet
the Whole Building Energy Retrofit Program sustainable
standards(pleaseseethediscussiononpage70forfurther
information).Minorcapitalandoperationsimprovements
arefundedthroughtheEnergyRetrofitProgram(ERP).The
EnergyConservationIncentiveProgram(ECIP)providesin-
centivesforschoolsandotherunitstodecreaseenergyuse.
Acrosstheuniversity,SustainableWorkingTeamsarecol-
laboratingtoadvancesustainableapproachestooperations
inotherareassuchasgreenpurchasing,foodservice,recy-
cling,andtransportation.Revisedlong-termmasterplans
forincreasedsustainabilityeffortsintheareasofcampus
wateruseandtransportationare indraft formandunder
reviewwithinSEMatthistime.
THE CAPITAL PLAN, 2011/12–2013/14
Stanford’scentralcampus,includingtheMedicalSchoolbut
excludingthehospitals,hasapproximately700majorbuild-
ings providing 15.3 million square feet of physical space.
Thephysicalplanthasanhistoricalcostof$6.3billionand
anestimatedreplacementcostinexcessof$7billion.
The Capital Plan includes a forecast of Stanford’s annual
programsdesignedtorestore,maintain,andimprovecam-
pus facilities for teaching, research, housing, and related
activities.TheplanalsooutlinesStanford’sneedsfornew

69
Cap
ital B
udge
t and
Thr
ee-Y
ear C
apita
l Pla
n
facilities.TheCapitalPlan iscompiled, reviewed,andap-
provedinacoordinatedmanneracrosstheuniversity.The
plan carefully balances institutional needs for new and
renovated facilities with the challenging constraints of
limited development entitlements, available funding, and
budgetaffordability.
ProjectslistedintheCapitalPlanarethoseapprovedbythe
provost.Manyoftheprojectsareunderthepurviewofthe
BoardofTrustees. Board-levelapprovalsarerequired for
anyofthefollowing:
n Totalprojectcostof$10millionandabove
n Newbuildingconstruction
n Projectsthatuse5,000ormorenewsquarefeetwithin
theAcademicGrowthBoundary
n Changesinlanduse
n Projectswithmajorexteriordesignchanges
Expenditures in the 2011/12–2013/14 Capital Plan, which
include major construction projects in various stages of
development and numerous infrastructure projects and
programs, total $1.9 billion. The table below provides a
comparisonofthelastthreeCapitalPlans.
COMPARATIVE CAPITAL PLANS [IN MILLIONS OF DOLLARS] 2009/10 2010/11 2011/12
Design/Construction 1,427.0 795.9 495.3
Forecasted 79.6 221.8 1,106.1
Infrastructure 294.0 498.0 275.8
Total 1,800.6 1,515.7 1,877.2
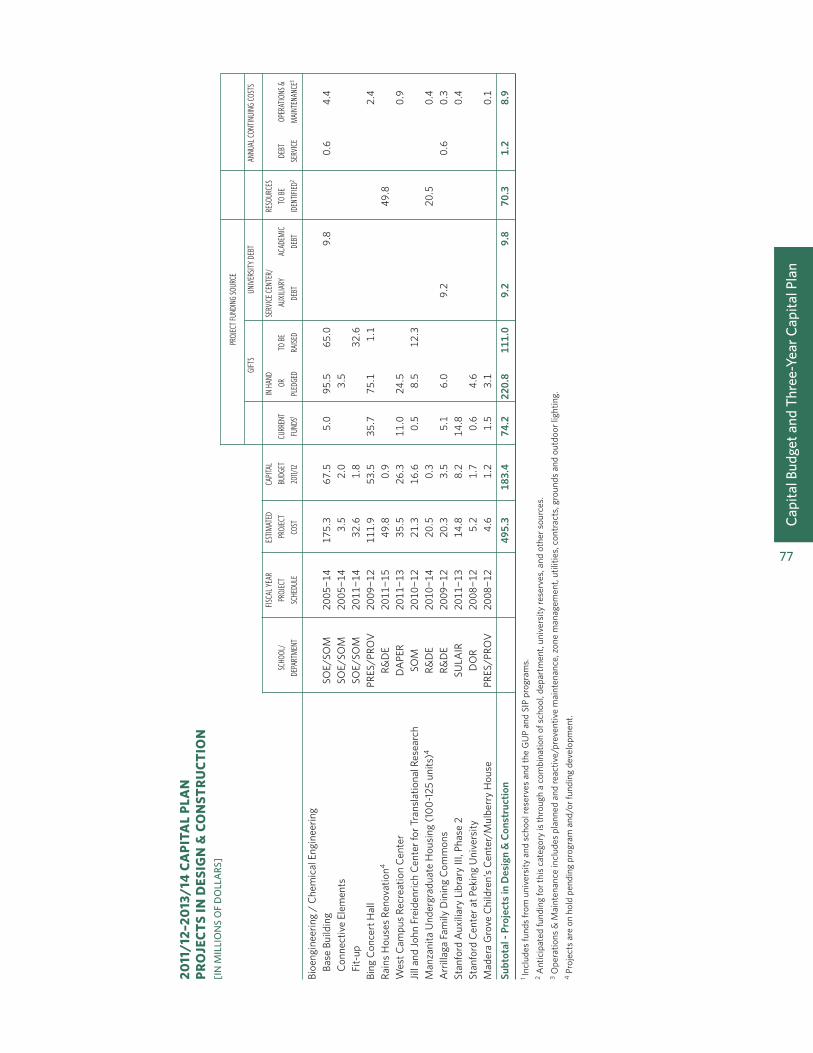
Projects in Design and Construction ProjectsinDesignandConstructionrepresent$495.3mil-
lion(26%of theplan). Constructionof theseprojects is
contingentonfundraisingof$111million(22%)andidentify-
ingresourcesforthe$70.3millionfundinggap(14%).Ten
projectsarelistedinthiscategory,asshownintherelated
tableonpage77.
ThecostofprojectsinDesignandConstructiondecreased
by$300.6millionfrom2010/11asaresultofthecomple-
tionofcertainprojectsoffsetbytheadditionofnewproj-
ects.CompletedprojectsincludetheKnightManagement
CenterandPS7($345.3million),NeukomBuilding($63.9
million),OlmstedTerraceFacultyHomes($28.6million),
Nano Fit-up ($17.7 million), Olmsted Road Staff Rental
Housing($16million),HuangFit-up($14million),andthe
CognitiveandNeurobiologicalImaging(CNI)Center($7.5
million).Offsetting thesedecreases is$20.5million from
the Manzanita Undergraduate Housing project that was
previously listed in the Forecasted Projects section. The
Rains Houses Renovation ($49.8 million) and the West
Campus Recreation Center ($35.5 million) are two new
CapitalPlanprojectsthatfurtheroffsetdecreasesby$85.3
million. The Stanford Auxiliary Library III Phase 2 ($14.8
million)wasreactivatedfromtheDelayedandSuspended
Projectslist.
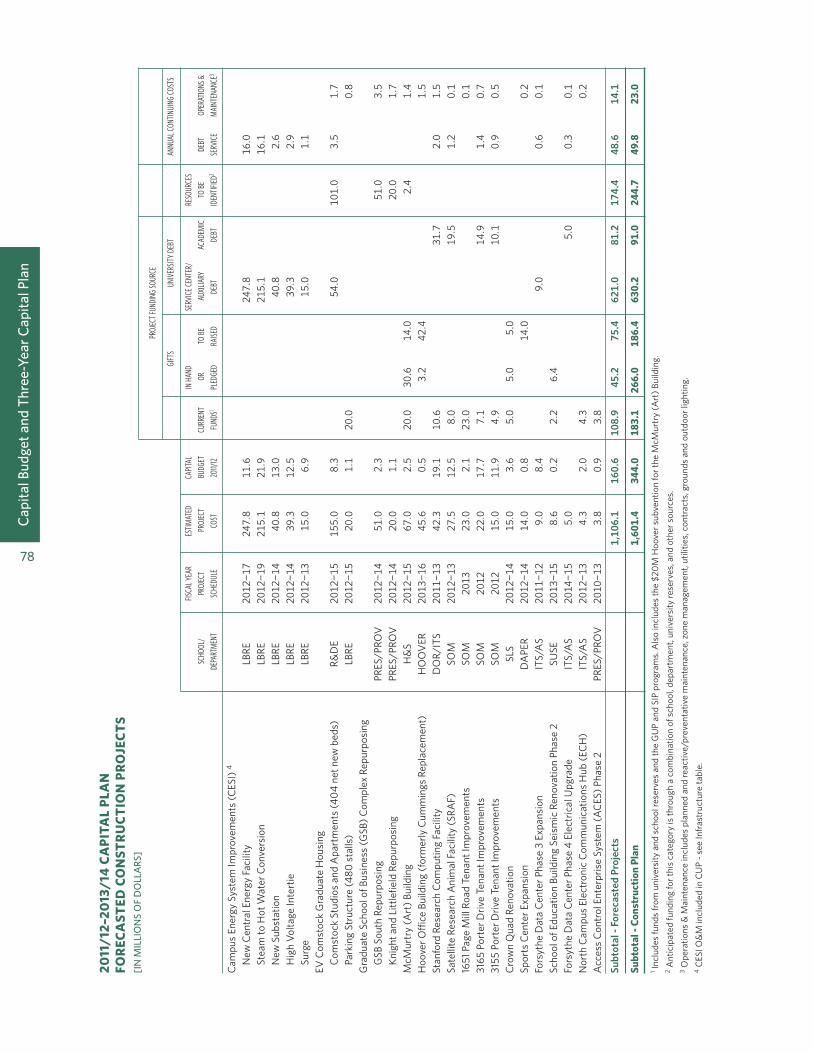
Forecasted Projects ForecastedProjectsarethoseanticipatedtoreceiveBoard
ofTrusteesapprovaloverthenextthreeyears.Theseproj-
ects total $1.1 billion (59% of the plan) and are listed on
page78.AswiththeprojectsinDesignandConstruction
describedabove,theseprojectsarecontingentuponfund-
ing.Forthisgroupofprojects,atotalof$75.4million(7%)
remainstobefundraisedand$174.4million(16%)requires
fundingtobeidentified.
Projectcostswithinthiscategoryhaveincreasedby$884.3
million from 2010/11, as a number of new and existing
projectshaveeitherbeenaddedtotheplanormovedinto
the Forecasted Projects category. The most significant
impacttothisfigureisthenewCESIinitiative,whichcar-
ries a project cost of $558 million. Additional projects
addedtotheForecastedProjectssectionaretheEscondido
VillageComstockGraduateStudentHousingandParking
Structure($175million),SatelliteResearchAnimalFacility
($27.5million),1651PageMillRoadTenantImprovements
($23 million), 3165 Porter Drive Tenant Improvements
($22 million), 3155 Porter Drive Tenant Improvements
($15million),CrownQuadRenovation($15million),Sports
Center Expansion ($14 million), Forsythe Data Center
Phase4ElectricalUpgrade($5million),andNorthCampus
ElectronicCommunicationsHub($4.3million).TheHoover
Office Building ($45.6 million) was reactivated from the
Delayed and Suspended Projects table in the 2011/12
CapitalPlan.
InfrastructureStanford’s ongoing efforts to renew its infrastructure,
excluding the CESI initiative, are reflected in a budget of
$275.8million(15%oftheplan).Infrastructurecostshave
decreased from last year’s Capital Plan by $222.2 mil-
lion,duetotheCESIinitiativenowreflectedinForecasted

70
Cap
ital B
udge
t and
Thr
ee-Y
ear C
apita
l Pla
n
Projects. Infrastructureprograms include the Investment
inPlantProgram(PlannedMaintenance),R&DE’sCapital
Improvement Program (CIP), GUP Mitigation Program,
Capital Utilities Program (CUP), Whole Building Energy
RetrofitProgramGroup2,StanfordInfrastructureProgram
(SIP),InformationTechnology&CommunicationsSystems,
Emergency Generators, Lagunita Diversion Facility
Remediation, and Storm Drain projects. GUP mitigation
and SIP projects are funded through construction project
surcharges.Theothercategoriesofprojectsarefundedby
centralfundsordebt.
InvestmentinPlant–PlannedMaintenanceProgram
Annual Investment in Plant assets represents the main-
tenance funds planned to be “invested” to preserve and
optimize Stanford’s existing facilities. These projections
arebasedonthelifecycleplanningmethodology,thekey
conceptbeingthatlifeexpectanciesoffacilitysubsystems
areknownand,asaresult,maintenanceschedulescanbe
predicted.Thisyear’sPlannedMaintenanceProgramalso
includes $5 million in pathway, outdoor structures, and
grounds.Theplannedcostsandfundingtotal$117.6million
andaredetailedbyareaonpage79.
R&DECapitalImprovementProgram
R&DE’s CIP initiative is intended to address health and
safety issues,seismicupgrades,codecompliance,energy
conservationandsustainabilitymeasures,andmajorpro-
grammaticimprovementsinthestudenthousinganddining
physicalplant.CIPprojectsanticipatedoverthenextthree
years total$43.4million. Theplan includescontinuation
ofthecodecomplianceupgradesofvariousRowHouses,
repairs to the Escondido Village slab heating system and
infrastructure, as well as bathroom and kitchen renova-
tions. In an effort to reduce deferred maintenance within
R&DEfacilities,aBacklogReductionInitiative($27.1million)
willbeunderwaytoupgradecriticalbuildingsystemsand
components.UponcompletionofCIPbuildingrenovations,
thefacilitiesaremaintainedthroughtheStanfordHousing
Asset Renewal Program (SHARP) and the Dining Asset
RenewalProgram(DARP).
GUPMitigation
Funding for GUP mitigations is generated by an internal
feeleviedoncapitalprojectsthatincreaseschool/depart-
mentcampusspaceallocations.Thefeeprovidesfunding
necessaryforimplementationofSantaClaraCountyGUP
requirementsandrecommendationsincludingtrails,storm
watermanagement,transportationdemandmanagement,
protection of biological resources and other programs.
Additionally,GUPfeesfundnewparkingspaces.
Stanford reached agreement with Santa Clara County on
theimplementationoftherequiredtrailsintheCountyand
otherjurisdictions.SantaClaraCountysegmentswereper-
mittedforconstructionandbeganin2005.Construction
was suspended when the Committee for Green Foothills
sued the County and Stanford over the adequacy of the
EnvironmentalImpactReport(EIR).Thelitigationwasre-
solvedonFebruary11,2010byaCaliforniaSupremeCourt
rulinginfavorofStanfordUniversityandSantaClaraCounty
to proceed with development of the trails located in the
foothillsalongPageMillRoad.Thetotalestimatedcostfor
alltrailsis$21.7million.
CapitalUtilitiesProgram
The$20.1millionthree-yearplanimproveselectrical,steam,
water, chilled water, and wastewater utility systems. The
annualCUPprogramcoverstheareasofsystemexpansion
($11 million) and system replacement ($9.1 million). The
universityannuallybudgetsforthereplacementofsystems
that are nearing the end of their useful life and expands
systemsasrequiredbycampusgrowth.
Included in the replacement and expansion process are
distribution pipes, conduits, switchgear, Central Energy
Facility(CEF)productionequipment,softwareandhardware
for metering and monitoring utility systems, and water
systems. The CUP program is significantly less than in
prioryearsinanticipationoftheCESIinitiative,whichwill
subsume many energy-related CUP projects in the next
fewyears.
WholeBuildingEnergyRetrofitProgramGroup2
TheWholeBuildingEnergyRetrofitProgramseekstoreduce
energyconsumptioninStanford’slargestenergy-intensive
buildings. The program began in 2003/04 with studies
of the top 12 energy using buildings, representing $15.9
millionofenergyexpensesperyear,ornearly36%ofthe
totalcampusenergyexpense.Ithasnowbeenexpandedto
includethetop26energyusingbuildings,representingan
additional$9.2millionofenergyexpenses(totalof$25.1
million)peryearand60%ofthetotalcampus.Theretrofits
completedthusfarhavedeliveredadiscountedpaybackof

71
Cap
ital B
udge
t and
Thr
ee-Y
ear C
apita
l Pla
n
3.3yearsandPacificGasandElectricrebatesof$440,000.
Anadditional$1.85millioninPG&Erebatesareanticipated
forprojectsinconstruction.
Thetableabovesummarizesthestatusoftheseprojects,
expected annual savings, and early results. It should be
notedthatearlyresultsmaynotbeindicativeofexpected
long-term improvements due to the imprecise nature of
estimatingpotentialenergysavingsfrommajorrenovations
aswellasthetimeneededforthechangestotakefulleffect.
Where resultsvarysignificantly fromexpectations(more
than+5%)andafteratleastonefullannualbuildingcycle
WHOLE BUILDING ENERGY RETROFIT PROGRAM ESTIMATEDANNUALPROJECT RETROFITSTATUS CONSUMPTIONSAVINGS EARLYRESULTS
StaufferI-Chemistry Complete 38% 46%
Gordon&BettyMooreMaterialsResearch1 Complete 32% 10%
PaulAllenCenterforIntegratedSystems(CIS) Complete 15% 14%
Forsythe(George)Hall2 Complete 8% 0%
StaufferII-PhysicalChemistry Complete 38% 43%
GatesComputerScience Complete 29% 27%
BeckmanCenterforMolecularandGeneticMedicine Construction 43%
GilbertBiologicalSciences Construction 34%
CantorCenterforVisualArts Construction 13%
BingWing(GreenLibraryWest) Construction 16%
PsychiatryAcademicandClinicBuilding Design 56%
PackardElectricalEngineering Design 26%
MitchellEarthSciences Design 25%
GreenEarthSciences Study
ClarkCenter Study
ArrillagaAlumniCenter Study
JordanHall Notstarted
VarianPhysicsLaboratory Notstarted
MechanicalEngineeringLaboratory Notstarted
GreenLibraryEast Notstarted
SweetHall Notstarted
RAF1 Notstarted
RAF2 Notstarted
LucasCenter Delayedto2011/12
CenterforClinicalSciencesResearch(CCSR) Delayedto2012/13
HerrinHall-Biology3 Cancelled 1Constructionscopereducedfromoriginalsurvey.2EquipmentinstalledaspartoftheForsytheHallretrofituseslessenergy,however,theinstallation
ofadditionalcomputingequipmenthasoffsettheenergysavingsachievedbytheretrofit3Plannedfordemolition.
haspassed,troubleshootingwillcontinueuntilanyidenti-
fiedproblemsareaddressedandexpectationsaremetor
exceeded.Thistroubleshootingwillbeundertakenunless
unforeseenbuildingchangesorweatherpatterns, though
unlikely,materiallyaffectthedesignintentoftheretrofit.
StanfordInfrastructureProgram
TheSIPconsistsofcampusandtransportationprojectsand
programsfortheimprovementandgeneralsupportofthe
university’s academic community, hospitals, and physical
plant.SIPexpendituresareexpectedtototal$12.2million

72
Cap
ital B
udge
t and
Thr
ee-Y
ear C
apita
l Pla
n
overthenextthreeyears(excludingfundingforreplacement
parkingspaces). SIPprojects include theconstructionof
campus transit improvements, parking lot infrastructure
improvements, site improvements, landscape design and
enhancements,bicycle,cartandpedestrianpaths,lighting,
signage,andoutdoorart.
InformationTechnologyandCommunicationSystems
Theuniversity’scomputingandcommunicationssystems
provide comprehensive data, voice and video services to
thecampuscommunity.Overtime,thesesystemsmustbe
improvedand/orreplacedsothataconsistentlyhighlevelof
servicecanbemaintained.Additionally,newtechnologies
areimplementedthatprovidemoreefficient,faster,and/or
morecost-effectivesolutions.For2011/12-2013/14,atotal
of $8.3 million has been allocated for upgrades to these
criticaluniversitysystems.
EmergencyGenerators
Comprehensiveemergencypreparednessplanningincludes
theinstallationofemergencygeneratorsatmajorhousing
and dining facilities throughout campus. In the 2011/12-
2013/14CapitalPlan,thecostoftheemergencygenerators
programis$2.4million.
LagunitaDiversionFacilityRemediation
TheLagunitaDiversionFacilityonSanFrancisquitoCreek
consistsofadam,waterdiversionfacilities,andafishladder
toallowpassageprimarilyforsteelhead.Waterdiversion
operationswerediscontinuedat this facility in the 1980s
becauseofrepeatedcollapseofthediversionchanneland
the facility’s replacementbyadownstreampumpstation
diversionfacility.TheStateofCaliforniaDepartmentofFish
andGamehasexpressedconcernsaboutthefacility’sad-
equacyforfishpassage,andStanfordhasproposedremoval
oftheentiredamanddiversionfacilityaspartoftheHabitat
ConservationPlan,currentlyunderreviewbyfederalagen-
cies. Theuniversityestimates that the remainingproject
coststoremovethefacilityandstabilizethecreek’sbanks
willbe$1million.
StormDrains
Theongoingstormdrainageprogramincludesprojectsfor
improvingandexpandingthecapacityofthecampusstorm
drainagesystem,replacingdeterioratedpipes,andimprov-
ing drainage around buildings. In addition, increasingly
stringentstormwaterqualityregulationsarenecessitating
newstormwatertreatmentapproachessuchasbioswales,
bioretention, and storm water capture to minimize con-
taminationconveyedtonaturalwaterbodiesfromcommon
storms.Thesetreatmentapproacheswillbe incorporated
on new building sites by those projects, where feasible.
Thisprogramcoverscampus-widestormwatertreatment
facilitiesthatmeettheserequirementsbeyondthosemetby
newbuildingprojects.Theestimatedcostfortheprogram
for2011/12-2013/14is$900,000.
Other Stanford EntitiesInanefforttopresentacomprehensiveviewofuniversity
plannedconstruction,thecapitalplanningprocesshasin-
cludedrealestateinvestments,theStanfordHospitaland
Clinics(SHC),LucilePackardChildren’sHospital (LPCH),
andtheSLACNationalAcceleratorLaboratory. Although
theCapitalPlantablesattheendofthischapterdonotin-
cludetheseotherentities,briefdescriptionsoftheircapital
programsfollow:
RealEstateInvestments
Underanapprovedlandusedevelopmentagreementwith
theCityofPaloAlto,knownastheMayfieldAgreement,the
RealEstatedivisionwillbemasterplanningtheconversion
ofsomecommercialsitesontheedgesoftheResearchPark
toresidentialsitesbytheyear2014,whentheunderlying
groundleasesexpire.TheRealEstategrouphasbegunthe
earlyplanningphase for thesedevelopmentprojects;de-
tailedplansandprojectcostswillbedeterminedinfuture
years.
StanfordHospitalandClinicsandLucilePackardChildren’sHospital
The Stanford University Medical Center (SUMC) is re-
questingentitlementsinPaloAltotocreateanewhospital
zone,whichwouldallowdevelopmentofapproximately1.3
millionsquarefeetofnetnewhospital,clinic,andmedical
office space. Approval of the SUMC entitlements would
permittherenovationandexpansionofStanfordHospital
andClinics,theLucilePackardChildren’sHospitalandthe
buildingofnewmedicalschool facilities. Inaddition, the
new zone would allow for an increase in the height limit
from50 feet to 130 feet. Theestimatedprojectcostsof
the Stanford Hospital and Clinics and the Lucile Packard
Children’sHospitalare$2billionand$1billion,respectively.

73
Cap
ital B
udge
t and
Thr
ee-Y
ear C
apita
l Pla
n
Sincethefallof2006,representativesfromthetwohospi-
tals,theSchoolofMedicine,anduniversityadministration
(including Land, Buildings and Real Estate, Public Affairs,
and the Office of the General Counsel) have worked to-
gether to manage the entitlement process. The formal
projectapplicationwassubmittedinAugust2007.TheCity
CouncilhearingonthefinalEnvironmentalImpactReport
(EIR)andapprovaloftheDevelopmentAgreementisnow
targetedforMay2011.
SLACNationalAcceleratorLaboratory
InFebruary2011,theSLACNationalAcceleratorLaboratory
completed its Long-Range Development Plan with its vi-
siontoconsolidateresearchactivities,upgradeinfrastruc-
ture,and/ordemolishandrenovate facilities. In2011/12,
the Research Support Building (RSB) and Infrastructure
Modernizationproject,totalingapproximately$97million
fundedbytheDepartmentofEnergy(DOE),willbeginat
theSLACNationalAcceleratorLaboratorycampusand is
scheduledforcompletionby2014.Theenablingprojects
include the construction of a new 64,000 gross square
foot building to house accelerator research staff at the
RSB,renovationoftwomission-supportbuildings,andthe
demolitionof64,000squarefeetofsubstandardbuildings
andtrailers.
Additional projects within the Long-Range Development
planincluderenovationofofficespaceandconstructionof
newlaboratoryspacefortheStanfordInstituteforMaterials
andEnergyScience(SIMES)program,constructionofanew
ScienceandUserSupportBuilding,andtheconstructionof
theLinacCoherentLightSourceII(LCLS-II)facilities(see
Chapter 2 SLAC National Accelerator Laboratory section
foradditionalprojectdetails).
SLACNationalAcceleratorLaboratoryiscollaboratingwith
theuniversitytodetermineafeasiblesolutionforascalable,
efficient and high density scientific research computing
facility as data centers at both SLAC and on campus are
currentlyoperatingatmaximumcapacity.
Overall SummaryA summary table of the 2011/12–2013/14 three-year
Capital Plan appears on page 74. Included are projects
andprogramsinDesignandConstruction,Forecasted,and
Infrastructurethatareanticipatedtocommenceinthenext
threeyears.
Todifferentiatebetweentheestimatedcostsofthethree-
yearCapitalPlanandtheforecastedspendingtocomplete
its projects and programs, an additional table (Capital
Plan Cash Flows) is included along with the Capital Plan
Summary.Thistableforecaststheexpenditureoutflowof
theCapitalPlanbasedonprojectandprogramschedules.
Thesecashexpendituresareanticipatedtobespentovera
periodextendingbeyond2013/14.
Operating(includingutilities),maintenance,anddebtser-
vicecostswillimpacttheuniversity’soperatingbudgetonce
the construction is substantially complete. Although the
CapitalPlanSummaryshowsthefullbudgetimpactofall
completedprojects,itisimportanttonotethatthisimpact
aligns with the project completion schedule and will be
absorbedbytheuniversitybudgetoveraperiodbeyondthe
three-yearplanbasedonactualprojectcompletiondates.
AtableentitledCapitalPlanImpactonBudgetisincluded
withtheCapitalPlanSummaryandCapitalPlanCashFlows
tabletoforecastthebudgetimpactbyareaofresponsibility
(e.g.,generalfunds,formulaschools,etc.).
Thetablesattheendofthischapterprovideadetailedlist
oftheprojectsincludedintheCapitalPlan.Theaccompa-
nyingtextsummarizestheseprojectsinordertopresenta
comprehensiveviewofallplannedconstructiononStanford
lands.
The following sections address the Capital Plan funding
sourcesanduses,alongwithresourceconstraints.
Capital Plan Funding Sources Asthefirstchartonpage75shows,Stanford’sCapitalPlan
reliesonseveral fundingsources includingCurrentFunds
(whichincludetheCapitalFacilitiesFund,fundsfromuni-
versityandschoolreserves,GUPandSIPprogramsanda
subvention from the Hoover Institution), gifts, and debt.
Dependinguponfundraisingrealitiesandtimeframes,some
projectswillprovemoredifficultthanotherstocomplete.
As a result, it is possible that additional projects on the
CapitalPlan—beyondthosealreadydelayedorsuspended—
willhavetobecancelled,delayed,orscaledbackinscope.
ForanyprojectsrelyingonGiftstobeRaised,theOfficeof
Development has determined that fundraising plans are
feasible, although the time frames for the receipt of gifts
aresubjecttochange.ResourcestobeIdentifiedincludes

74
Cap
ital B
udge
t and
Thr
ee-Y
ear C
apita
l Pla
n
SUMMARY OF THREE-YEAR CAPITAL PLAN 2011/12-2013/14[IN MILLIONS OF DOLLARS] PROJECTFUNDINGSOURCE
GIFTS UNIVERSITYDEBT ANNUALCONTINUINGCOSTS
SERVICE ESTIMATED CAPITAL CENTER/ RESOURCES PROJECT BUDGET CURRENT INHANDOR TOBE AUXILIARY ACADEMIC TOBE DEBT OPERATIONS& COST 2011/12 FUNDS1 PLEDGED RAISED DEBT DEBT IDENTIFIED2 SERVICE MAINTENANCE3
ProjectsinDesign&Construction 495.3 183.4 74.2 220.8 111.0 9.2 9.8 70.3 1.2 8.9
ForecastedProjects 1,106.1 160.6 108.9 45.2 75.4 621.0 81.2 174.4 48.6 14.1
Total Construction Plan 1,601.4 344.0 183.1 266.0 186.4 630.2 91.0 244.7 49.8 23.0
InfrastructurePrograms 275.8 111.5 149.7 92.0 23.3 10.8 8.2 0.3
TotalThree-YearCapitalPlan2010/11-2012/13 1,877.2 455.5 332.8 266.0 186.4 722.2 114.3 255.5 58.0 23.3
1IncludesfundsfromuniversityandschoolreservesandtheGUPandSIPprograms.Alsoincludesthe$20millionHooversubventionfortheMcMurtry(Art)Building.
2Anticipatedfundingforthiscategoryisthroughacombinationofschool,department,universityreserves,andothersources.3Operations&Maintenanceincludesplannedandreactive/preventativemaintenance,zonemanagement,utilities,contracts,groundsandoutdoorlighting.
CAPITAL PLAN CASH FLOWS [IN MILLIONS OF DOLLARS] 2014/15& 2010/11&PRIOR 2011/12 2012/13 2013/14 THEREAFTER TOTAL
ProjectsinDesign&Construction 126.3 183.4 78.7 79.5 27.4 495.3
ForecastedProjects 12.1 160.6 330.4 309.8 293.2 1,106.1
Total Construction Plan 138.4 344.0 409.1 389.2 320.6 1,601.4
InfrastructurePrograms 11.0 111.5 88.9 62.9 1.6 275.8
TotalThree-YearCapitalPlan2011/12-2013/14 149.4 455.5 498.0 452.1 322.2 1,877.2
CAPITAL PLAN IMPACT ON BUDGET [IN MILLIONS OF DOLLARS] 2014/15& 2012/13 2013/14 THEREAFTER TOTAL
DebtService
GeneralFunds 2.0 0.6 2.6
FormulaandOtherSchools 2.3 1.2 3.5
Auxiliary 0.6 2.1 5.6 8.3
ServiceCenter 0.6 1.1 41.9 43.6
TotalDebtService 3.5 6.4 48.1 58.0
OperationsandMaintenance
GeneralFunds 2.5 1.9 12.5 16.9
FormulaandOtherSchools 1.2 0.1 1.3
Auxiliary 0.3 0.9 2.5 3.7
ServiceCenter 0.3 0.2 0.9 1.4
TotalOperationsandMaintenance 4.3 3.1 15.9 23.3

75
Cap
ital B
udge
t and
Thr
ee-Y
ear C
apita
l Pla
n
funds yet to be fully identified, with the expectation that
fundswillcomefromacombinationofschool,department
anduniversityreserves,andothersources.
Uses of Funds by Program Category and Project TypeThe chart above divides the Capital Plan activity into
program categories—Academic/Research, Infrastructure,
Academic Support, Housing, and Athletics/Student
Activities—with the largest category being Infrastructure
at 45% of the Capital Plan. The chart below breaks out
the same activity into project types—New Construction,
Infrastructure, and Renovations—with Infrastructure and
NewConstructioncomprising45%and43%of theplan,
respectively.Notably,becauseofthecompletionofseveral
majorprojectsduring2010/11,Academic/Researchhasa
relativelysmallerportionofactivitycomparedtolastyear’s
CapitalPlanwithadeclinefrom45%to23%oftheplan.
Conversely,theInfrastructureportionoftheplan—whether
viewed as a program category or a project type—will in-
creasefrom33%oflastyear’splantobecome45%ofthis
year’splanduetotheinclusionoftheCESIinitiative.
Capital Plan Constraints
Affordability
Theincrementalinternaldebtserviceexpectedatthecom-
pletionofallprojectscommencing in the three-yearplan
period(completiondatesrangefrom2011/12to2018/19)
totals$58millionannually(excludingdebtservicefordebt
bridgefinancingthereceiptofgifts).Ofthisamount,$2.6
millionwillbeservicedbygeneral funds,$51.9millionby
auxiliaryorservicecenteroperations,and$3.5millionby
formulaschools(theGSBandSoM).
TheadditionalO&Mcostsexpectedatthecompletionofall
projectscommencing inthethree-yearperiodtotal$23.3
millionperyear.Ofthisamount,$16.9millionwillbeser-
vicedbygeneralfunds,$5.1millionbyauxiliaryandservice
centeroperations,and$1.3millionbytheformulaschools.
O&Manddebtserviceoncapitalprojectscompetedirectly
withotheracademicprograminitiatives.
2011/12–2013/14USESOFFUNDSBYPROJECTTYPE:$1.9BILLION
Infrastructure45%
Renovations12%
NewConstruction
43%
THEPLAN2011/12–2013/14:$1.9BILLION
Service Center/Auxiliary Debt
38%
Academic Debt6%
Gifts to be Raised10%
Current Funds18%
Resources to be Identified14 %
Gifts in Hand or Pledged
14%
Infrastructure45%
Housing14%
Athletics/Student Activities
2%Academic Support16%
Academic/Research23%
Sources of Funds Uses of Funds by Program Category

76
Cap
ital B
udge
t and
Thr
ee-Y
ear C
apita
l Pla
n
DebtCapacity
AsofMay2,2011debtavailabletofinancecapitalprojects
andfacultymortgagesisestimatedat$763million,includ-
ing$269millionoftaxablecommercialpaper,$218million
oftax-exemptcommercialpaper,$40millionofunexpend-
edtax-exemptbondproceedsand$236millionunexpended
taxablebondproceeds.Inaddition,throughfiscalyear-end
2010/11,$106millionfrominternalamortizationondebt-
funded projects will become available to lend to projects
and$101millioninforecastedpledgepaymentswillretire
debtissuedtobridgefinancethereceiptofgifts.
TheCapitalPlanwillrequireatotalof$746millionofdebt:
n $243milliontocompleteprojectsalreadyapprovedor
underconstruction,
n $319 million for projects forecast to be approved in
2011/12,
n $184milliontobridgefinancethereceiptofgiftpledges
forprojectsunderconstruction.
AdditionaldebtwillberequiredtofinancetheFacultyStaff
Housingprogram.AsofMay2,2011theportfolioofdebt-
subsidizedmortgageshadincreasedby$11millionto$388
million.
Projectsidentifiedinthethree-yearCapitalPlancommenc-
ing after 2011/12 will require an additional $524 million
in long-term debt. Debt for these projects has not been
committedandallocationswillbeevaluatedinthecontext
ofdebtcapacity,affordability,viabilityofthefundingplan,
andGUPlimitations.
Entitlements
The Stanford campus comprises 8,180 acres, which fall
withinsix jurisdictions. Of this total,4,017acres, includ-
ingmostofthecentralcampus,arewithinunincorporated
SantaClaraCounty.
InDecember2000,SantaClaraCountyapprovedaGeneral
UsePermit(GUP)thatallowsStanfordtoconstructupto
2,035,000additionalgrosssquarefeetofacademic-related
buildings on the core campus. The GUP also allows the
constructionofupto2,000newstudenthousingunitsand
over1,000unitsofhousingforpostdoctoralfellows,medi-
calresidents,faculty,andstaff.
Conditionsofapprovalincludedthefollowing:
n Creationofanacademicgrowthboundary to limit the
buildableareatothecorecampus
n Approval of a sustainable development study (SDS)
beforenewconstructionisdevelopedbeyondonemil-
liongrosssquarefeet.(TheSDSwasapprovedbySanta
ClaraCountyinApril2009.)
n Constructionof605unitsofhousingforeach500,000
grosssquarefeetofnewacademicbuilding
GiventhestringentrequirementsimposedbytheGUPand
theincreasinglydifficultentitlementenvironment,Stanford
carefullymanagestheallocationofnewgrowth.Thetotal
GUPsquarefootageallocationwasoriginallyprojectedtobe
expendedover15yearsatanaveragerateofapproximately
135,000grosssquarefeetperyear.Subsequentexperience
haslengthenedthisprojection.
The 2011/12–2013/14 Capital Plan includes 356,850
gross square feet of GUP square feet currently in Design
and Construction and 120,338 net GUP square feet in
ForecastedProjects.Thissquarefootage,alongwithgross
squarefeetpreviouslyallocated,bringsthetotalGUP2000
grosssquarefeetexpendedorplannedtooveronemillion.
Giventheuniversity’slonger-termcapitalforecast,coupled
withfundingandaffordabilitychallengesandongoingscru-
tinyofexpansion,thecurrentGUPallocationmayextend
through2025.
WiththecompletionoftheEscondidoVillageConversions
andvarioushousingunitcredits,Stanfordwillhaveadded
1,448netnewhousinglinkageunitssinceapprovalofthe
GUP. The completion of these units will enable the uni-
versity to construct up to 1.5 million gross square feet of
newacademicspaceundertheGUP.Theconstructionof
squarefootagebeyondthisamountwillrequireadditional
housingunits.
CAPITAL PLAN PROJECT DETAIL
The tables on the following three charts show projects
grouped within three categories: Projects in Design and
Construction, Forecasted Construction Projects, and
InfrastructureProjectsandPrograms.
77
Cap
ital B
udge
t and
Thr
ee-Y
ear C
apita
l Pla
n
2011
/12–
2013
/14
CA
PIT
AL
PLA
N
PR
OJE
CT
S IN
DES
IGN
& C
ON
STR
UC
TIO
N[I
N M
ILLI
ON
S O
F D
OLL
ARS
]
PR
OJEC
TFUN
DING
SOUR
CE
GI
FTS
UN
IVER
SITY
DEBT
AN
NUAL
CONT
INUI
NGCO
STS
FISCA
LYEA
RES
TIMAT
ED
CAPIT
AL
IN
HAN
D
SERV
ICEC
ENTE
R/
RE
SOUR
CES
SC
HOOL
/PR
OJEC
TPR
OJEC
TB
UDGE
TCU
RREN
T
OR
TO
BE
AUX
ILIAR
Y
ACAD
EMIC
TO
BE
DEBT
OP
ERAT
IONS
&
DE
PART
MEN
TSC
HEDU
LE
COST
20
11/12
FU
NDS1
PLED
GED
RAISE
DDE
BT
DEBT
ID
ENTIF
IED2
SERV
ICE
MAI
NTEN
ANCE
3
Bioe
ngin
eerin
g/
Che
mic
alE
ngin
eerin
g
Ba
seB
uild
ing
SOE/
SOM
20
05-1
4 1
75.3
6
7.5
5
.0
95.
5
65.
0
9
.8
0
.6
4.4
Con
nect
ive
Elem
ents
SO
E/SO
M
2005
-14
3.5
2
.0
3
.5
Fit-
up
SOE/
SOM
20
11-1
4 3
2.6
1
.8
32.
6
Bing
Con
cert
Hal
lPR
ES/P
ROV
20
09-1
2 1
11.9
5
3.5
3
5.7
7
5.1
1
.1
2.4
Ra
ins
Hou
ses
Reno
vatio
n4 R&
DE
2011
-15
49.
8
0.9
49.
8
W
estC
ampu
sRe
crea
tion
Cen
ter
DA
PER
2011
-13
35.
5
26.
3
11.
0
24.
5
0
.9
Jilla
ndJo
hnF
reid
enric
hC
ente
rfor
Tra
nsla
tiona
lRes
earc
hSO
M
2010
-12
21.
3
16.
6
0.5
8
.5
12.
3
Man
zani
taU
nder
grad
uate
Hou
sing
(10
0-1
25u
nits
)4 R&
DE
2010
-14
20.
5
0.3
20.
5
0
.4
Arr
illag
aFa
mily
Din
ing
Com
mon
sR&
DE
2009
-12
20.
3
3.5
5
.1
6.0
9.2
0
.6
0.3
St
anfo
rdA
uxili
ary
Libr
ary
III,P
hase
2
SULA
IR
2011
-13
14.
8
8.2
1
4.8
0
.4
Stan
ford
Cen
tera
tPek
ing
Uni
vers
ity
DO
R20
08-1
2 5
.2
1.7
0
.6
4.6
Mad
era
Gro
veC
hild
ren’
sC
ente
r/M
ulbe
rry
Hou
se
PRES
/PRO
V
2008
-12
4.6
1
.2
1.5
3
.1
0
.1
Subt
otal
-Pr
ojec
tsin
Des
ign
&C
onst
ruct
ion
495
.3
183
.4
74.
2
220
.8
111
.0
9.2
9
.8
70.
3
1.2
8
.9
1 Incl
udes
fund
sfr
omu
nive
rsity
and
sch
oolr
eser
ves
and
the
GU
Pan
dSI
Ppr
ogra
ms.
2 Ant
icip
ated
fund
ing
fort
his
cate
gory
isth
roug
ha
com
bina
tion
ofs
choo
l,de
part
men
t,un
iver
sity
rese
rves
,and
oth
ers
ourc
es.
3 Ope
ratio
ns&
Mai
nten
ance
incl
udes
pla
nned
and
reac
tive/
prev
entiv
em
aint
enan
ce,z
one
man
agem
ent,
utili
ties,
con
trac
ts,g
roun
dsa
ndo
utdo
orli
ghtin
g.
4 Pro
ject
sar
eon
hol
dpe
ndin
gpr
ogra
ma
nd/o
rfun
ding
dev
elop
men
t.
78
Cap
ital B
udge
t and
Thr
ee-Y
ear C
apita
l Pla
n
2011
/12–
2013
/14
CA
PIT
AL
PLA
N
FOR
ECA
STED
CO
NST
RU
CT
ION
PR
OJE
CT
S[I
N M
ILLI
ON
S O
F D
OLL
ARS
]
PR
OJEC
TFUN
DING
SOUR
CE
GI
FTS
UN
IVER
SITY
DEBT
AN
NUAL
CONT
INUI
NGCO
STS
FISCA
LYEA
RES
TIMAT
ED
CAPIT
AL
IN
HAN
D
SERV
ICEC
ENTE
R/
RE
SOUR
CES
SC
HOOL
/PR
OJEC
TPR
OJEC
TB
UDGE
TCU
RREN
T
OR
TO
BE
AUX
ILIAR
Y
ACAD
EMIC
TO
BE
DEBT
OP
ERAT
IONS
&
DE
PART
MEN
TSC
HEDU
LE
COST
20
11/12
FU
NDS1
PLED
GED
RAISE
DDE
BT
DEBT
ID
ENTIF
IED2
SERV
ICE
MAI
NTEN
ANCE
3
Cam
pus
Ener
gyS
yste
mIm
prov
emen
ts(C
ESI)
4
N
ewC
entr
alE
nerg
yFa
cilit
yLB
RE
2012
-17
247
.8
11.
6
2
47.8
1
6.0
Stea
mto
Hot
Wat
erC
onve
rsio
nLB
RE
2012
-19
215
.1
21.
9
2
15.1
1
6.1
New
Sub
stat
ion
LBRE
20
12-1
4 4
0.8
1
3.0
40.
8
2.6
Hig
hV
olta
geIn
tert
ie
LBRE
20
12-1
4 3
9.3
1
2.5
39.
3
2.9
Surg
eLB
RE
2012
-13
15.
0
6.9
15.
0
1.1
EV
Com
stoc
kG
radu
ate
Hou
sing
C
omst
ock
Stud
ios
and
Apa
rtm
ents
(40
4ne
tnew
bed
s)
R&D
E20
12-1
5 1
55.0
8
.3
5
4.0
101
.0
3.5
1
.7
Pa
rkin
gSt
ruct
ure
(480
sta
lls)
LBRE
20
12-1
5 2
0.0
1
.1
20.
0
0.8
G
radu
ate
Scho
olo
fBus
ines
s(G
SB)
Com
plex
Rep
urpo
sing
G
SBS
outh
Rep
urpo
sing
PR
ES/P
ROV
20
12-1
4 5
1.0
2
.3
5
1.0
3.5
Kni
ghta
ndL
ittle
field
Rep
urpo
sing
PR
ES/P
ROV
20
12-1
4 2
0.0
1
.1
2
0.0
1.7
M
cMur
try
(Art
)Bu
ildin
gH
&S
2012
-15
67.
0
2.5
2
0.0
3
0.6
1
4.0
2
.4
1
.4
Hoo
verO
ffice
Bui
ldin
g(f
orm
erly
Cum
min
gsR
epla
cem
ent)
H
OO
VER
20
13-1
6 4
5.6
0
.5
3
.2
42.
4
1.5
St
anfo
rdR
esea
rch
Com
putin
gFa
cilit
yD
OR/
ITS
2011
-13
42.
3
19.
1
10.
6
3
1.7
2.0
1
.5
Sate
llite
Res
earc
hA
nim
alF
acili
ty(
SRA
F)
SOM
20
12-1
3 2
7.5
1
2.5
8
.0
1
9.5
1.2
0
.1
1651
Pag
eM
illR
oad
Tena
ntIm
prov
emen
ts
SOM
20
13
23.
0
2.1
2
3.0
0
.1
3165
Por
terD
rive
Tena
ntIm
prov
emen
ts
SOM
20
12
22.
0
17.
7
7.1
14.
9
1
.4
0.7
31
55P
orte
rDriv
eTe
nant
Impr
ovem
ents
SO
M
2012
1
5.0
1
1.9
4
.9
1
0.1
0.9
0
.5
Cro
wn
Qua
dRe
nova
tion
SLS
2012
-14
15.
0
3.6
5
.0
5.0
5
.0
Spor
tsC
ente
rExp
ansi
on
DA
PER
2012
-14
14.
0
0.8
1
4.0
0
.2
Fors
ythe
Dat
aC
ente
rPha
se3
Exp
ansi
on
ITS/
AS
2011
-12
9.0
8
.4
9
.0
0.6
0
.1
Scho
olo
fEdu
catio
nBu
ildin
gSe
ism
icR
enov
atio
nPh
ase
2SU
SE
2013
-15
8.6
0
.2
2.2
6
.4
Fo
rsyt
heD
ata
Cen
terP
hase
4E
lect
rical
Upg
rade
IT
S/A
S20
14-1
5 5
.0
5
.0
0
.3
0.1
N
orth
Cam
pus
Elec
tron
icC
omm
unic
atio
nsH
ub(
ECH
)IT
S/A
S20
12-1
3 4
.3
2.0
4
.3
0.2
A
cces
sC
ontr
olE
nter
pris
eSy
stem
(A
CES
)Ph
ase
2PR
ES/P
ROV
20
10-1
3 3
.8
0.9
3
.8
Subt
otal
-Fo
reca
sted
Pro
ject
s
1
,106
.1
160
.6
108
.9
45.
2
75.
4
621
.0
81.
2
174
.4
48.
6
14.
1
Subt
otal
- Co
nstr
ucti
on P
lan
1,6
01.4
3
44.0
1
83.1
2
66.0
1
86.4
6
30.2
9
1.0
2
44.7
4
9.8
2
3.0
1 Incl
udes
fund
sfr
omu
nive
rsity
and
sch
oolr
eser
ves
and
the
GU
Pan
dSI
Ppr
ogra
ms.
Als
oin
clud
esth
e$2
0M
Hoo
vers
ubve
ntio
nfo
rthe
McM
urtr
y(A
rt)
Build
ing.
2 Ant
icip
ated
fund
ing
fort
his
cate
gory
isth
roug
ha
com
bina
tion
ofs
choo
l,de
part
men
t,un
iver
sity
rese
rves
,and
oth
ers
ourc
es.
3 Ope
ratio
ns&
Mai
nten
ance
incl
udes
pla
nned
and
reac
tive/
prev
enta
tive
mai
nten
ance
,zon
em
anag
emen
t,ut
ilitie
s,c
ontr
acts
,gro
unds
and
out
door
ligh
ting.
4 CES
IO&
Min
clud
edin
CU
P-s
eeIn
fras
truc
ture
tabl
e.

79
Cap
ital B
udge
t and
Thr
ee-Y
ear C
apita
l Pla
n
2011
/12–
2013
/14
CA
PIT
AL
PLA
N
INFR
AST
RU
CT
UR
E P
RO
JEC
TS
& P
RO
GR
AM
S[I
N M
ILLI
ON
S O
F D
OLL
ARS
]
PR
OJEC
TFUN
DING
SOUR
CE
GI
FTS
UN
IVER
SITY
DEBT
AN
NUAL
CONT
INUI
NGCO
STS
FISCA
LYEA
RES
TIMAT
ED
CAPIT
AL
IN
HAN
D
SERV
ICEC
ENTE
R/
RE
SOUR
CES
SC
HOOL
/PR
OJEC
TPR
OJEC
TB
UDGE
TCU
RREN
T
OR
TO
BE
AUX
ILIAR
Y
ACAD
EMIC
TO
BE
DEBT
OP
ERAT
IONS
&
DE
PART
MEN
TSC
HEDU
LE
COST
20
11/12
FU
NDS1
PLED
GED
RAISE
DDE
BT
DEBT
ID
ENTIF
IED2
SERV
ICE
MAI
NTEN
ANCE
3
Inve
stm
enti
nPl
ant(
Plan
ned
Mai
nten
ance
)
N
on-F
orm
ula/
Adm
in
LBRE
20
12-1
4 5
1.3
1
6.7
5
1.3
Form
ula
SOM
20
12-1
4 2
3.3
5
.9
23.
3
R&
DE
(SH
ARP
/DA
RP)4
R&D
E20
12-1
4 3
0.0
8
.3
30.
0
D
APE
RD
APE
R20
12-1
4 1
0.8
4
.1
1
0.8
U
tiliti
es5
LBRE
20
12-1
4
Ro
ads
LBRE
20
12-1
4 2
.2
0.3
2
.2
Subt
otal
-Inv
estm
enti
nPl
ant(
Plan
ned
Mai
nten
ance
)
1
17.6
3
5.3
1
06.8
1
0.8
R&
DE
Cap
italI
mpr
ovem
entP
rogr
am4
R&D
E20
12-1
4 7
0.5
3
9.9
3
.1
67.
4
4.2
0
.2
GU
PM
itiga
tion
Prog
ram
s
Tr
ails
LB
RE
2005
-12
21.
7
10.
7
21.
7
W
ater
-Rel
ated
Pro
gram
sLB
RE
2012
-14
2.5
0
.8
2.5
Subt
otal
-GU
PM
itig
atio
nPr
ogra
ms
24.
2
11.
5
24.
2
Cap
italU
tiliti
esP
rogr
am(C
UP)
Sy
stem
Exp
ansi
on
LBRE
20
12-1
4 1
1.0
3
.8
1
1.0
0
.8
Sy
stem
Rep
lace
men
tLB
RE
2012
-14
9.1
5
.2
9
.1
0.8
Subt
otal
-CU
P
2
0.1
9
.0
20.
1
1.6
W
hole
Bui
ldin
gEn
ergy
Ret
rofit
Pro
gram
Gro
up2
V
ario
us
2012
-14
18.
6
6.9
1
8.6
1.8
Stan
ford
Infr
astr
uctu
reP
rogr
am(
SIP)
LB
RE
2012
-14
12.
2
4.0
1
2.2
Info
rmat
ion
Tech
nolo
gy&
Com
mun
icat
ions
Sys
tem
sIT
S20
12-1
4 8
.3
2.8
4.5
3
.8
0
.5
Emer
genc
yG
ener
ator
sEH
&S
2012
-14
2.4
0
.8
2.4
Lagu
nita
Div
ersi
onF
acili
tyR
emed
iatio
nLB
RE
2012
-13
1.0
1
.0
1.0
Stor
mD
rain
sLB
RE
2012
-14
0.9
0
.3
0.9
0.1
0
.1
Subt
otal
-In
fras
truc
ture
Pro
ject
s&
Pro
gram
s
2
75.8
1
11.5
1
49.7
9
2.0
2
3.3
1
0.8
8
.2
0.3
TOTA
L CA
PITA
L PL
AN
1
,877
.2
455
.5
332
.8
266
.0
186
.4
722
.2
114
.3
255
.5
58.
0
23.
3
1 Incl
udes
fund
sfr
omu
nive
rsity
and
sch
oolr
eser
ves
and
the
GU
Pan
dSI
Ppr
ogra
ms.
2 Ant
icip
ated
fund
ing
fort
his
cate
gory
isth
roug
ha
com
bina
tion
ofs
choo
l,de
part
men
t,un
iver
sity
rese
rves
,and
oth
ers
ourc
es.
3 Ope
ratio
ns&
Mai
nten
ance
incl
udes
pla
nned
and
reac
tive/
prev
entiv
em
aint
enan
ce,z
one
man
agem
ent,
utili
ties,
con
trac
ts,g
roun
dsa
ndo
utdo
orli
ghtin
g.4 R
&D
EC
apita
lIm
prov
emen
tPro
gram
gen
eral
lyin
clud
esp
rogr
ama
ndc
ode
upgr
ades
vs.
Pla
nned
Mai
nten
ance
whi
chin
clud
ess
ubsy
stem
repl
acem
ent.
5 Incl
uded
und
erC
UP
-Sys
tem
Rep
lace
men
tbel
ow.

80
Cap
ital B
udge
t and
Thr
ee-Y
ear C
apita
l Pla
n


![CS230 Deep Learningcs230.stanford.edu/projects_spring_2019/reports/18681615.pdfStanford University 1050 Arastradero Rd., Stanford, CA kkaganov [ at ] stanford.edu Abstract In order](https://img.dokumen.tips/doc/110x75/5f9ad4de7f7e6a771b58635e/cs230-deep-stanford-university-1050-arastradero-rd-stanford-ca-kkaganov-at.jpg)


