Embed Size (px)
Citation preview

WIR SCHAFFEN WISSEN – HEUTE FÜR MORGEN
Capillary Pressure Evolution in Operating Polymer Electrolyte Fuel Cells
Adrian Mularczyka, Qingyang Linb, Daniel Niblettc, Jens Elleraa Paul Scherrer Institut, b Imperial College London, UK & Zhejiang University, CNc University of Manchester, UK
240th ECS Meeting, October 10 – 14, 2021

2
Working principle of Polymer Electrolyte Fuel Cells
H2O
500 µm 20µm200 µm
GDLMEM CLCLGDL Flow fieldFlow field
H2 2 H+ + 2 e- 0.5 O2 + 2 H+ + 2 e- H2O
Liquid water on the micro-scale influencesoverall PEFC performance and efficiency
Flückiger et al., 2008
Gas Diffusion Layer (GDL)ε0 = 0.8
Dp = 20 μm ε0 = 0.4
Dp = 60 nm
Catalyst Layer (CL)
Metal FF (automotive)
Toyota.com
Graphitic FF (stationary)
Swisshydrogen.ch
--- Do not redistribute ---

3
(adapted from www.ak-tomographie.de)
X-ray Tomographic Microscopy Principle
Take up to 1501 projections
Rotate sampleover 180º
Greek: ‚tomos‘ <> slice
Reconstruct 3D material
distribution via 2D slices
(using eg. filtered backprojection)
X-ray
visible light
--- Do not redistribute ---
4
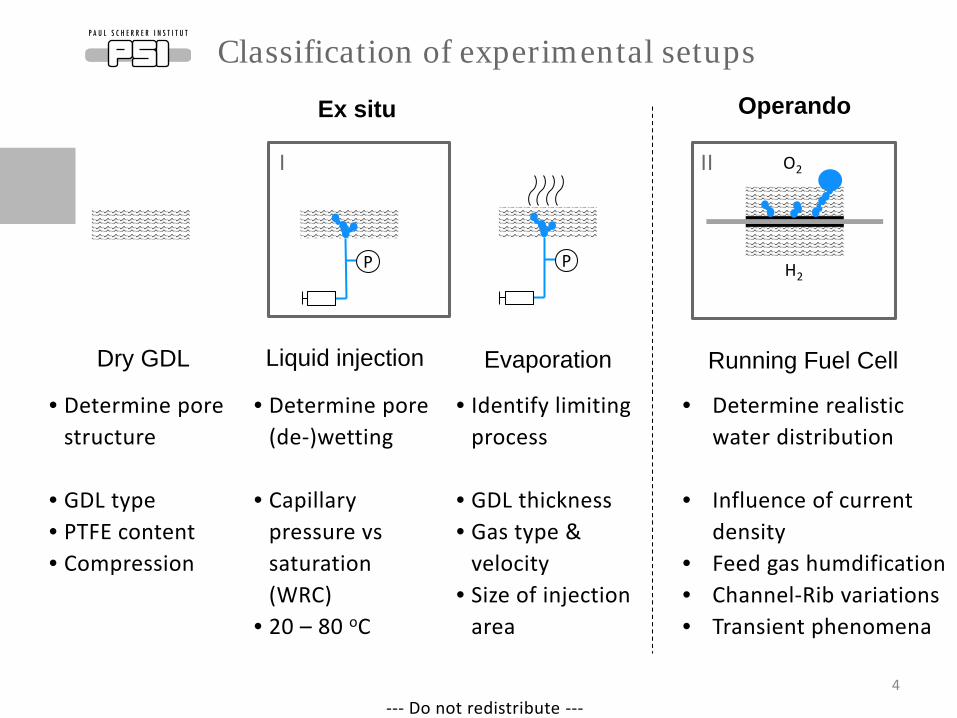
• Determine realistic water distribution
• Influence of current density
• Feed gas humdification• Channel-Rib variations• Transient phenomena
Classification of experimental setups
Dry GDL Liquid injection Evaporation Running Fuel Cell
P H2
O2
Ex situ Operando
• Identify limiting process
• GDL thickness• Gas type &
velocity• Size of injection
area
• Determine pore (de-)wetting
• Capillarypressure vssaturation(WRC)
• 20 – 80 oC
• Determine pore structure
• GDL type• PTFE content• Compression
P
--- Do not redistribute ---
I II

5
Water
Water injection cell
Injection rate: 350 nL/min Injection diameter: 500 µm
Temperature: 25°CGas: Nitrogen (RH 0%)Flow rate: 6 m/s
--- Do not redistribute ---

6
Water injection – Droplet release cycle stages
Mularczyk et al 2020 J. Electrochem. Soc. 167 084506
M. Andersson, A. Mularczyk et al., J. Power Sources, 404, 159, 2018
XTM VoF Simulation
D. Niblett, A. Mularczyk et al., J. Power Sources, 471 (2020) 228427,
--- Do not redistribute ---

7
Droplet release cycle influences GDL saturation
Before droplet formation
After droplet formation
Fiber
• Water retracts in GDL after droplet detachment• GDL saturation changes by just 2 %
Mularczyk et al 2020 J. Electrochem. Soc. 167 084506--- Do not redistribute ---

8
Curvature analysis to determine capillary pressure
Mularczyk et al 2020 J. Electrochem. Soc. 167 084506--- Do not redistribute ---

9
Operando cluster formation
Mode Current jump (~2 A/cm²)
Scan procedure 0.25 s every 1 s
Scans 180
Active area: 200 µm * 250 µm
Material TGP-H 060 (10wt% PTFE)
Temperature: 25°CGas: Oxygen (RH 100%)Flow rate: 6 m/s
--- Do not redistribute ---Mularczyk et al 2021 ACS Appl. Mater. Interfaces 2021, 13, 29, 34003–34011, DOI: 10.1021/acsami.1c04560

10
Water cluster – droplet interactions
• Droplet feed is unstable• Curvature based capillary pressure correlates with pore scale events
--- Do not redistribute ---Mularczyk et al 2021 ACS Appl. Mater. Interfaces 2021, 13, 29, 34003–34011, DOI: 10.1021/acsami.1c04560

11
Thoughts on high capillary pressure values
• Volume of fluids simulation confirms high capillary pressure level• Pc of individual clusters may not follow pc-saturation curves determined by ex-
situ experiments on large representative GDL areasXTM VoF Simulation
--- Do not redistribute ---Mularczyk et al 2021 ACS Appl. Mater. Interfaces 2021, 13, 29, 34003–34011

12
Conclusion
--- Do not redistribute ---
• Curvature analysis provides insight into capillarypressure of running polymer electrolyte fuel cells
• Individual clusters grow at high pc than what typicalpc-sat curves tell us
• How common are such percolation path instabilities?
I01A-1026Insights into the Stability and Formation of Water Droplets Using Operando X-Ray Tomographic MicroscopyT. Dörenkamp, M. Sabharwal, J. Eller (PSI)

Acknowledgement
Thank You for Your Attention!
• Electrochemistry Lab F. Büchi, C. Chen, C. Csoklich, C. Gloor, T. Gloor,S. de Angelis, J. Halter, A. Lamibrac, M. Sabharwal,A. Schuller, T. Schuler, M. Striednig, T. Rosén,J. Roth, A. Vasile, H. Xu
• ENE A. Hamburger, U. Ludgate, T. Schmidt
• TOMCAT Beamline M. Bührer, F. Marone, C. Schlepütz, M. Stampanoni
• Funding Swiss National Science Foundation

Paul Scherrer Institute (PSI) - Switzerland
Thank You for Your Attention!


![Capillary thermostatting in capillary electrophoresis · Capillary thermostatting in capillary electrophoresis ... 75 µm BF 3 Injection: ... 25-µm id BF 5 capillary. Voltage [kV]](https://img.dokumen.tips/doc/110x75/5c176ff509d3f27a578bf33a/capillary-thermostatting-in-capillary-electrophoresis-capillary-thermostatting.jpg)