Embed Size (px)
Citation preview
CAPILLARY BLOOD SAMPLING: ARE
THE RESULTS COMPARABLE TO
VENOUS SAMPLING IN HEALTH AND
DISEASE
By
Dr Tyrone Oliver Lightbody
A thesis submitted to the University of Birmingham for the degree of MSc by Research
School of Clinical & Experimental Medicine University of Birmingham
June 2017

University of Birmingham Research Archive
e-theses repository This unpublished thesis/dissertation is copyright of the author and/or third parties. The intellectual property rights of the author or third parties in respect of this work are as defined by The Copyright Designs and Patents Act 1988 or as modified by any successor legislation. Any use made of information contained in this thesis/dissertation must be in accordance with that legislation and must be properly acknowledged. Further distribution or reproduction in any format is prohibited without the permission of the copyright holder.

Abstract
Background: Blood gas analyser (BGA) results are used to guide treatment, however their
accuracy for some parameters is unknown. Blood tests taken from capillary blood can also
be analysed by a BGA but again the accuracy is unknown.. Capillary and venous BGA tests
were compared to gold standard tests for sodium, potassium, haemoglobin, glucose and
lactate.
Methods: 23 healthy adults and 48 acutely unwell diabetic patients had ear lobe prick (EP)
and finger prick (FP) (capillary) and standard venous blood samples. Venous samples went
for standard laboratory (VL) reporting as well as being analysed in the BGA (VBG). Results
were compared to international acceptability criteria. All studies had ethical approval
(NRES14/WM/1057).
Results: VBG and EP sodium results met the acceptability criteria. FP samples marginally
failed with 94.8% meeting the required level (95% within 4mmol/l of VL result). All
potassium, haemoglobin and lactate samples failed to reach the required level of accuracy
(95% within 0.5mmol/l, 5g/l and 0.5mmol/l respectively). Potassium FP and EP samples
were more accurate than the VBG results (p<0.001). VBG glucose in the hyperglycaemic
range met acceptability criteria (within 20% of VL) as did FP when values were >12mmol/l.
Conclusions: BGA results are sufficiently accurate for the analysis of sodium. FP and VBG
glucose are suitable in hyperglycaemic ranges only. Capillary samples could be used as an
alternative to VBG potassium if considering BGA measurement only. Results for other
parameters should be used as a guide rather than as a definitive value.

Acknowledgements
I would like to say a big thank you to my supervisors: Dr Elizabeth Sapey, for all of her support and
helping bring everything together and also Dr Vinay Reddy-Kolanu and Dr Peter Nightingale for all of
their crucial input.
I would like to thank all the participants in this study.
Finally I would like to thank my wife Laura, my children Elijah, Nell and Ezekiel as well as my mother
and father for all of their support.

Table of Contents Acknowledgements ...............................................................................................................................IV
List of Tables ........................................................................................................................................VII
List of Figures ........................................................................................................................................ XI
1. Introduction ....................................................................................................................................... 1
1.1 Background and Rationale............................................................................................................ 1
1.2 Current Methods of Point of Care Blood Testing in Emergency Care and the Evidence for them 4
1.2.1 Blood gas analysis .................................................................................................................. 5
1.2.2 Electrolytes ............................................................................................................................ 9
1.2.3 Lactate ................................................................................................................................. 16
1.2.4 Glucose ................................................................................................................................ 18
1.2.5 Haemoglobin and Haematological Parameters. .................................................................. 19
1.3 Statistical analysis for assessing the agreement between 2 methods of clinical measurement . 22
1.4 Evidence for POCT improving patient outcomes and providing economic benefits. .................. 23
1.5 The challenges with venepuncture and other methods of blood sampling ................................ 26
1.6 Conclusions ................................................................................................................................ 28
1.6.1 Blood Gases ......................................................................................................................... 29
1.6.2 Electrolytes .......................................................................................................................... 30
1.6.3 Lactate ................................................................................................................................. 32
1.6.4 Glucose ................................................................................................................................ 33
1.6.5 Haemoglobin and haematological parameters ................................................................... 33
1.7 Hypothesis and Aims .................................................................................................................. 34
1.7.1 Hypothesis ........................................................................................................................... 34
1.7.2 Aims ..................................................................................................................................... 34
2. Materials and methods .................................................................................................................... 36
2.1 Ethics and Governance ............................................................................................................... 36
2.2 Overall study design ................................................................................................................... 38
2.3 Validation ................................................................................................................................... 38
2.3.1 Participants ......................................................................................................................... 39
2.3.2 Procedure for collecting the blood samples – Venous samples .......................................... 40
2.3.4 Ear and finger prick samples ................................................................................................ 42
2.3.5 Use of Transvasin Cream to collect earlobe samples .......................................................... 43
2.3.6 Sample size calculation ........................................................................................................ 44

2.4 Main Study ................................................................................................................................. 44
2.4.1 Healthy participants and acutely unwell subjects ............................................................... 44
2.4.2 Acceptability criteria............................................................................................................ 45
2.4.3 Experience rating ................................................................................................................. 45
2.5 Training for ear lobe prick .......................................................................................................... 46
2.6 Statistical evaluation and sample size calculation ...................................................................... 47
3. Results ............................................................................................................................................. 50
3.1 Validation: The use of Transvasin cream .................................................................................... 50
3.1.1 Results of Transvasin Feasibility testing .............................................................................. 50
3.2 Validation study; Intra-patient variability ................................................................................. 51
3.2.1 Population demographics for validation work..................................................................... 52
3.2.2 Validation results ................................................................................................................. 52
3.2.3 Sample size calculations ...................................................................................................... 54
3.3 Participant Demographics .......................................................................................................... 55
3.4 Laboratory Parameters ............................................................................................................... 56
3.4.1 Glucose ................................................................................................................................ 57
3.4.2 Sodium ................................................................................................................................ 71
3.4.3 Potassium ............................................................................................................................ 81
3.4.4 Haemoglobin ....................................................................................................................... 92
3.4.5 Lactate ............................................................................................................................... 102
3.5 Experience rating...................................................................................................................... 110
4. Discussion ....................................................................................................................................... 113
4.1 Summary of results .................................................................................................................. 113
4.1.1 Glucose .............................................................................................................................. 114
4.1.2 Sodium .............................................................................................................................. 115
4.1.2 Potassium .......................................................................................................................... 116
4.1.3 Haemoglobin ..................................................................................................................... 118
4.1.4 Lactate ............................................................................................................................... 120
4.1.5 Patient experience rating and methods of sampling ......................................................... 121
4.2 How results compare to previous publications ........................................................................ 123
4.3 Strengths and Limitations ......................................................................................................... 126
4.4 Further Work ............................................................................................................................ 131
5. Conclusions .................................................................................................................................... 133

7. Appendices ..................................................................................................................................... 136
Appendix 1. Letter of agreement. National Research Ethics Service Committee - West Midlands
(NRES reference 14/WM/1057). .................................................................................................... 137
Appendix 2. Letter of agreement. Sponsorship agreed by the University Hospital Birmingham NHS Foundation Trust (UHBFT) Research and Development Committee .................................... 138
Appendix 3. IQC performance data for b221 blood gas analysers in ED and CDU, University Hospital
Birmingham NHS Trust ................................................................................................................... 139
Appendix 4. Healthy participant data ............................................................................................. 141
Appendix 5. Patient Data – Patients with Glucose 10-15 mmol/l ................................................... 143
Appendix 6. Patient Data – Patients with Glucose >15 mmol/l ...................................................... 145
8. References ..................................................................................................................................... 147
List of Tables
Table 1. 1 Results of meta-analysis comparing arterial and venous blood gas results ........................... 7
Table 1. 2 Summary of findings from the meta-analysis by Zvorsky comparing capillary blood gases to
arterial .................................................................................................................................................... 8
Table 1. 3 Comparison of Arterial POCT blood gas machine with Venous serum Lab analysed samples(Perkov 2006). ......................................................................................................................... 11
Table 1. 4 Arterial blood samples compared to venous laboratory samples (R King 2000, Anunaya Jain 2009, Binila Chacko 2011, Budak YU1 2012, Quinn LM1 2013) ....................................................... 12
Table 1. 5 Comparison of arterial to venous lactate (Gallagher E.John 1997, Réminiac 2012, Ikami A 2013, Talayero Gimenez De Azcarate M. 2013) .................................................................................. 18
Table 1. 6 BGA glucose compared to laboratory plasma glucose (Stadlbauer V1, 2011,
Hoedemaekers, 2008). ................................................................................................................... 19
Table 1. 7 Comparison of BGA haemoglobin to laboratory values (R King 2000, Ray JG 2002, A Beggs 2006, Quinn LM1 2013) ............................................................................................................ 20
Table 1. 8 Aims for the accuracy of the study parameters ................................................................... 35
Table 2. 1 Inclusion criteria for healthy volunteers and diabetic .......................................................... 39
Table 2. 2 Exclusion criteria for healthy volunteers and diabetic patients ............................................ 40
Table 2. 3 Acceptability Criteria ............................................................................................................ 45
Table 3. 1 Comparison of electrolytes between capillary ear prick sample with and without Transvasin
TV cream .............................................................................................................................................. 51
Table 3. 2 The demographic of the participants in the validation study ............................................... 52
Table 3.3 a Result of the validation study for glucose. It shows the mean, standard deviation (SD) and
coefficient of the variance (CV) of the 3 samples taken for each patient for the finger prick, ear prick
and laboratory samples. ....................................................................................................................... 53
Table 3.3 b. Result of the validation study for sodium. It shows the mean, standard deviation (SD) and
coefficient of the variance (CV) of the 3 samples taken for each patient for the finger prick, ear prick
and laboratory samples. ....................................................................................................................... 53

Table 3.3 c Result of the validation study for potassium. It shows the mean, standard deviation (SD)
and coefficient of the variance (CV) of the 3 samples taken for each patient for the finger prick, ear
prick and laboratory samples. .............................................................................................................. 53
Table 3.3 d Result of the validation study for haemoglobin. It shows the mean, standard deviation
(SD) and coefficient of the variance (CV) of the 3 samples taken for each patient for the finger prick,
ear prick and laboratory samples. ........................................................................................................ 54
Table 3. 3 Demographic date for healthy participants and acutely unwell patients ............................ 55
Table 3. 4 Normality testing of the MEs and percentage MEs between Finger Prick (FP), Ear Prick (EP)
and Venous (VP) BGA glucose and standard laboratory values............................................................ 57
Table 3. 5 Results of finger prick glucose compared to venous laboratory plasma samples in healthy
participant group, patient group and combined results. ...................................................................... 59
Table 3. 6 Results of Ear prick sampling compared to venous laboratory plasma samples in healthy
participant group, patient group and combined results. ...................................................................... 60
Table 3. 7 Results of Venous BGA glucose compared to venous laboratory plasma samples in healthy
participant group, patient group and combined results. ...................................................................... 61
Table 3. 8 The estimated percentage of samples meeting the acceptability for glucose for Finger prick
(FP), Ear prick (EP) and Venous BGA (VP) in healthy, patient and combined groups ............................ 67
Table 3. 9 Results of Friedman’s test between finger prick, ear prick and venous BGA glucose bias
results ................................................................................................................................................... 68
Table 3. 10 Post hock analysis of bias results between Finger prick (FP), ear prick (EP) and venous BGA
(VP) biases ............................................................................................................................................ 68
Table 3. 11 Results of F-tests of the MEs in glucose results between healthy and patient groups for
Finger prick (FP), Ear prick (EP) and venous BGA (VP). ......................................................................... 69
Table 3. 12. Results of F-tests of the MEs in glucose results between Finger prick (FP), Ear prick (EP)
and venous BGA (VP). ........................................................................................................................... 69
Table 3. 13. Comparison of mean bias of glucose results when divided into age quintile groups in
healthy group and patient groups for finger prick (FP), ear prick (EP) and venous BGA (VP) testing
methods. .............................................................................................................................................. 70
Table 3. 14 Normality testing of the MEs for Finger Prick (FP), Ear Prick (EP) and Venous (VP) BGA
sodium.................................................................................................................................................. 71
Table 3. 15 Results of finger prick sodium compared to venous laboratory plasma samples in healthy
participant group, patient group and combined results. ...................................................................... 72
Table 3. 16 Results of Ear prick sodium compared to venous laboratory plasma samples in healthy
participant group, patient group and combined results. ...................................................................... 72
Table 3. 17 Results of Venous BGA sodium compared to venous laboratory plasma samples in healthy
participant group, patient group and combined results. ...................................................................... 73
Table 3. 18 The estimated percentage of samples meeting the acceptability for sodium for Finger
prick (FP), Ear prick (EP) and Venous BGA (VP) in healthy, patient and combined groups ................... 78
Table 3. 19 Results of Friedman’s test between finger prick, ear prick and venous BGA sodium ME
results ................................................................................................................................................... 79
Table 3. 20 Post hock analysis of ME results between Finger prick (FP), ear prick (EP) and venous BGA
(VP) biases ............................................................................................................................................ 79
Table 3. 21 Results of F-tests of the ME in sodium results between healthy and patient groups for
Finger prick (FP), Ear prick (EP) and venous BGA (VP). ......................................................................... 80

Table 3. 22. Results of F-tests of the ME in sodium results between Finger prick (FP), Ear prick (EP) and
venous BGA (VP). .................................................................................................................................. 80
Table 3. 23 Comparison of mean bias for sodium when divided into age quintile groups in healthy
group and patient group for finger prick (FP), ear prick (EP) and venous BGA (VP) testing methods ... 80
Table 3. 24. Normality testing of the MEs for Finger Prick (FP), Ear Prick (EP) and Venous (VP) BGA
potassium ............................................................................................................................................. 82
Table 3. 25 Results of finger prick potassium compared to venous laboratory plasma samples in
healthy participant group, patient group and combined results. ......................................................... 82
Table 3. 26 Results of Ear prick potassium compared to venous laboratory plasma samples in healthy
participant group, patient group and combined results. ...................................................................... 83
Table 3. 27 Results of Venous BGA potassium compared to venous laboratory plasma samples in
healthy participant group, patient group and combined results. ......................................................... 83
Table 3. 28 The estimated percentage of samples meeting the acceptability for potassium for Finger
prick (FP), Ear prick (EP) and Venous BGA (VP) in healthy, patient and combined groups ................... 89
Table 3. 29 Results of Friedman’s test between finger prick, ear prick and venous BGA potassium bias
results ................................................................................................................................................... 89
Table 3. 30 Post hock analysis of ME results between Finger prick (FP), ear prick (EP) and venous BGA
(VP) ...................................................................................................................................................... 90
Table 3. 31 Results of F-tests of the MEs in potassium results between healthy and patient groups for
Finger prick (FP), Ear prick (EP) and venous BGA (VP). ......................................................................... 90
Table 3. 32. Results of F-tests of the biases in potassium results between Finger prick (FP), Ear prick
(EP) and venous BGA (VP). ................................................................................................................... 90
Table 3. 33 Comparison of mean bias for potassium when divided into age quintile groups in healthy
group and patient group for finger prick (FP), ear prick (EP) and venous BGA (VP) testing methods ... 91
Table 3. 34 Normality testing of theMEss for Finger Prick (FP), Ear Prick (EP) and Venous (VP) BGA
haemoglobin ........................................................................................................................................ 92
Table 3. 35 Results of finger prick haemoglobin compared to venous laboratory EDTA samples in
healthy participant group, patient group and combined results. ......................................................... 93
Table 3. 36 Results of Ear prick haemoglobin compared to venous laboratory EDTA samples in healthy
participant group, patient group and combined results. ...................................................................... 93
Table 3. 37 Results of Venous BGA haemoglobin compared to venous laboratory EDTA samples in
healthy participant group, patient group and combined results. ......................................................... 94
Table 3. 38 The estimated percentage of samples meeting the acceptability for haemoglobin for
Finger prick (FP), Ear prick (EP) and Venous BGA (VP) in healthy, patient and combined groups ........ 99
Table 3. 39 Results of Friedman’s test between finger prick, ear prick and venous BGA ME results .. 100
Table 3. 40 Post hock analysis of ME results between Finger prick (FP), ear prick (EP) and venous BGA
(VP). ................................................................................................................................................... 100
Table 3. 41 Results of F-tests of the biases in haemoglobin results between healthy and patient
groups for Finger prick (FP), Ear prick (EP) and venous BGA (VP). ...................................................... 101
Table 3. 42. Results of F-tests of the biases in haemoglobin results between Finger prick (FP), Ear prick
(EP) and venous BGA (VP). ................................................................................................................. 101
Table 3. 43 Comparison of mean bias for haemoglobin when divided into age quintile groups in
healthy group and patient group for finger prick (FP), ear prick (EP) and venous BGA (VP) testing
methods ............................................................................................................................................. 101

Table 3. 44 Normality testing of the MEs for Finger Prick (FP) and Ear Prick (EP) lactate .................. 102
Table 3. 45 Results of finger prick lactate compared to venous BGA lactate in healthy participant
group, patient group and combined results. ...................................................................................... 103
Table 3. 46 Results of finger prick lactate compared to venous BGA lactate in healthy participant
group, patient group and combined results showing predicted mean bias, lower and upper 95%
confidence interval following linear regression analysis. ................................................................... 104
Table 3. 47 Results of Ear prick haemoglobin compared to venous BGA lactate in healthy participant
group, patient group and combined results. ...................................................................................... 106
Table 3. 48 The number and percentage of samples meeting the acceptability for lactate for Finger
prick (FP) and Ear prick (EP) in healthy, patient and combined groups .............................................. 108
Table 3. 49 Results of Wilcoxon Signed Ranks test between finger prick (FP)and ear prick (EP) lactate
........................................................................................................................................................... 109
Table 3. 50 Results of F-tests of the MEs in lactate results between healthy and patient groups for
Finger prick (FP), Ear prick (EP) and venous BGA (VP). ....................................................................... 109
Table 3. 51. Results of F-tests of the MEs in lactate results between Finger prick (FP), Ear prick (EP)
and venous BGA (VP). ......................................................................................................................... 109
Table 3. 52 Comparison of mean bias for lactate when divided into age quintile groups in healthy
group and patient group for finger prick (FP) and ear prick (EP) testing methods ............................. 110
Table 3. 53 The median, interquartile range and significant difference results for pain scores (out of a
maximum of 10) for finger prick, ear prick and venepuncture (VP) in the healthy group, patient group
and the healthy and patient group combined .................................................................................... 111
Table 3. 54 Patient preference for modality of blood sampling .......................................................... 112
Table 3. 55 The number of attempts required for each modality in the healthy group, patient group
and combined groups. ........................................................................................................................ 112
Table 4. 1 Comparison of mean bias, limits of agreement, whether the acceptability criteria were met
and ranking of samples according to their accuracy (1 most accurate 3 least) for each parameter and
testing modality. *Acceptability criteria met when glucose >12mmol/l. ........................................... 113

List of Figures
Figure 2. 1 Flow chart of validation study ............................................................................................ 40
Figure 2. 2 Illustrating the blood taking procedure. ............................................................................. 42
Figure 2. 3 Flow chart for healthy volunteers and acutely unwell adults ............................................. 45
Figure 2. 4 Visual analogue pain scale used in patients’ experience of the 3 different methods of
blood taking. ........................................................................................................................................ 46
Figure 3. 1 Consort diagram outlining sample collection in all participants ............................ 56
Figure 3. 2 Bland-Altman Plot for finger prick glucose BGA results compared to laboratory
plasma glucose in Healthy participants .................................................................................... 62
Figure 3. 3 Bland-Altman Plot for finger prick glucose BGA results compared to laboratory
plasma glucose in acutely unwell diabetic patients ................................................................. 62
Figure 3. 4 Bland-Altman Plots for finger prick glucose BGA results compared to laboratory
plasma glucose in healthy participants and acutely unwell diabetic patients combined........ 63
Figure 3. 5 Bland-Altman Plots for ear prick glucose BGA percentage bias compared to
laboratory plasma glucose in healthy participants .................................................................. 64
Figure 3. 6 Bland-Altman Plots for ear prick glucose BGA percentage bias compared to
laboratory plasma glucose in and acutely unwell diabetic patients ........................................ 64
Figure 3. 7 Bland-Altman Plots for ear prick glucose BGA percentage bias compared to
laboratory plasma glucose in healthy participants and acutely unwell diabetic patients
combined. ................................................................................................................................. 65
Figure 3. 8 Bland-Altman Plots for Venous glucose BGA percentage bias compared to
laboratory plasma glucose in Healthy participants .................................................................. 66
Figure 3. 9 Bland-Altman Plots for Venous glucose BGA percentage bias compared to
laboratory plasma glucose in acutely unwell diabetic patients ............................................... 66
Figure 3. 10 Bland-Altman Plots for Venous glucose BGA percentage bias compared to
laboratory plasma glucose in Healthy participants and acutely unwell diabetic patients
combined. ................................................................................................................................. 67
Figure 3. 11 Bland-Altman Plots for finger prick BGA sodium compared to laboratory serum
sodium in Healthy participants ................................................................................................. 73
Figure 3. 12 Bland-Altman Plot for finger prick BGA sodium compared to laboratory serum
sodium in acutely unwell diabetic patients .............................................................................. 74
Figure 3. 13 Bland-Altman Plots for finger prick BGA sodium compared to laboratory serum
sodium in healthy participants and acutely unwell diabetic patients combined. ................... 74
Figure 3. 14 Bland-Altman Plot for ear prick BGA sodium compared to laboratory serum
sodium in Healthy participants ................................................................................................. 75
Figure 3. 15 Bland-Altman Plot for ear prick BGA sodium compared to laboratory serum
sodium in acutely unwell diabetic patients .............................................................................. 75

Figure 3. 16 Bland-Altman Plot for ear prick BGA sodium compared to laboratory serum
sodium in Healthy participants and acutely unwell diabetic patients combined (Figure 3.12).
.................................................................................................................................................. 76
Figure 3. 17 Bland-Altman Plot for Venous BGA sodium compared to laboratory serum
sodium in Healthy participants ................................................................................................. 76
Figure 3. 18 Bland-Altman Plots for Venous BGA sodium compared to laboratory serum
sodium in acutely unwell diabetic patients .............................................................................. 77
Figure 3. 19 Bland-Altman Plots for Venous BGA sodium compared to laboratory serum
sodium in healthy participants and acutely unwell diabetic patients combined .................... 78
Figure 3. 20 Bland-Altman Plot for finger prick potassium results compared to laboratory
serum potassium in healthy participants. ................................................................................ 84
Figure 3. 21 Bland-Altman Plot for finger prick potassium results compared to laboratory
serum potassium in acutely unwell diabetic patients. ............................................................. 84
Figure 3. 22 Bland-Altman Plot for finger prick potassium results compared to laboratory
serum potassium in healthy participants and acutely unwell diabetic patients combined. ... 85
Figure 3. 23 Bland-Altman Plots for ear prick potassium results compared to laboratory
serum potassium in healthy participants. ................................................................................ 85
Figure 3. 24 Bland-Altman Plot for ear prick potassium results compared to laboratory serum
potassium acutely unwell diabetic patients. ............................................................................ 86
Figure 3. 25 Bland-Altman Plot for ear prick potassium results compared to laboratory serum
potassium in healthy participants and acutely unwell diabetic patients combined ............... 87
Figure 3. 26 Bland-Altman Plot for Venous BGA results compared to laboratory serum
potassium in healthy participants. ........................................................................................... 87
Figure 3. 27 Bland-Altman Plot for Venous BGA results compared to laboratory serum
potassium in acutely unwell diabetic patients combined. ....................................................... 88
Figure 3. 28 Bland-Altman plots for Venous BGA results compared to laboratory serum
potassium in healthy participants and acutely unwell diabetic patients combined. .............. 88
Figure 3. 29 Bland-Altman Plot for finger prick haemoglobin results compared to laboratory
EDTA haemoglobin in healthy participants. ............................................................................. 94
Figure 3. 30 Bland-Altman Plot for finger prick haemoglobin results compared to laboratory
EDTA haemoglobin in acutely unwell diabetic patients. .......................................................... 95
Figure 3. 31 Bland-Altman Plot for finger prick haemoglobin results compared to laboratory
EDTA haemoglobin in healthy participants and acutely unwell diabetic patients combined. 95
Figure 3. 32 Bland-Altman Plot for ear prick haemoglobin results compared to laboratory
EDTA haemoglobin in healthy participants. ............................................................................. 96
Figure 3. 33 Bland-Altman Plot for ear prick haemoglobin results compared to laboratory
EDTA haemoglobin in acutely unwell diabetic patients. .......................................................... 96
Figure 3. 34 Bland-Altman Plot for ear prick haemoglobin results compared to laboratory
EDTA haemoglobin in healthy participants and acutely unwell diabetic patients combined
(Figure 3.34). ............................................................................................................................. 97

Figure 3. 35 Bland-Altman Plot for Venous BGA haemoglobin results compared to laboratory
EDTA haemoglobin in healthy participants. ............................................................................. 98
Figure 3. 36 Bland-Altman Plot for Venous BGA haemoglobin results compared to laboratory
EDTA haemoglobin in acutely unwell diabetic patients. .......................................................... 98
Figure 3. 37 Bland-Altman Plot for Venous BGA haemoglobin results compared to laboratory
EDTA haemoglobin in healthy participants and acutely unwell diabetic patients combined. 99
Figure 3. 38 Scatter Plot for finger prick lactate results compared to venous BGA lactate in
healthy participants and acutely unwell diabetic patients combined. .................................. 103
Figure 3. 39. Scatter chart of finger prick lactate bias compared to venous BGA lactate with
linear regression lines showing the predicted mean and the 95% confidence intervals (CI) 105
Figure 3. 40 Bland-Altman Plot for ear prick haemoglobin results compared to laboratory
EDTA haemoglobin in healthy participants. ........................................................................... 107
Figure 3. 41 Bland-Altman Plot for ear prick haemoglobin results compared to laboratory
EDTA haemoglobin in acutely unwell diabetic patients. ........................................................ 107
Figure 3. 42 Bland-Altman Plot for ear prick haemoglobin results compared to laboratory
EDTA haemoglobin in healthy participants and acutely unwell diabetic patients combined.
................................................................................................................................................ 108

1
1. Introduction
1.1 Background and Rationale
Close monitoring of physiological parameters is known to improve patient outcome in many
disease states. Rapid correction of electrolyte abnormalities in conditions such as diabetic
ketoacidosis has been shown to reduce morbidity as well as the length of stay in
hospital.(Matoo VK 1991, Wagner A 1999, MacIsaac RJ 2002, Jayashree M 2004, Solá E
2006, Armor B 2011) Close monitoring of sodium is critical to prevent irreversible
neurological sequalae such as cerebellar pontine myelinolysis and extra-pontine
myelinolysis.(Karp BI 1993, Laureno R 1997, Chakraborty S 2013) For these reasons the
necessity of close biochemical monitoring has been emphasised by various national bodies
such as the Joint British Diabetes Society (JBDS), Renal Association UK and the National
Institute for Clinical Excellence.(Alfonzo A 2014, Group 2014, Hospital 2014).
In conditions such as hyperglycaemia, hyperkalaemia, hyponatraemia and diabetic
ketoacidosis, it is common to perform serial venepunctures during a single day to guide
electrolyte replacement therapy as recommended by current guidelines, including from the
JBDS on pathways for the management of DKA.(Group 2014) There can be practical
difficulties complying with these recommendations. Venepuncture is one of the most painful
procedures and one of the most frequently performed ones (Taddio A 2002, Deacon B 2006)
and anxiety associated with venepuncture is a common problem. This anxiety can prevent a
patient agreeing to repeat blood tests, affecting a patient’s ability to receive medically
essential treatment (Deacon B 2006). Patients with acute illness can have poor venous access,
and oedema and obesity can hinder serial testing. Delirium associated with illness can also

2
hamper compliance with treatment. Once a sample is taken, rapid correction of electrolytes
abnormalities is limited by the speed at which clinical laboratories can process and report
biochemical analyses of venous samples, a process which can take several hours.
These factors have driven the proliferation of analysing blood using point-of-care testing
(POCT)(Howanitz JH 2001), where blood samples are taken to an analyser at or near the
patient’s bedside or immediate environment and processed to get an result within a few
minutes. Improved patient outcomes and reduction in the length of hospital stay are seen as
one of the main advantages of point of care testing(Grieve R 1999). Using blood gas
analysers as a POCT method may provide a rapid assessment of gross electrolytes and
haematological disturbances. However, since venepuncture is the most common method of
blood sampling for this method of POCT, it continues to cause anxiety, pain and subsequent
hyperalgesia (Taddio A 2002, Deacon B 2006). The current modality of blood sugar
monitoring in diabetic patients and triaging hospital admissions involves bedside capillary
blood glucose meters. Their use has been validated in clinical environments and is
recommended in the Joint Diabetes Society Guidelines for continuing monitoring of blood
glucose (Arabadjief D 2006, Thomas LE 2008, Boren SA 2010). While the validity of
capillary blood glucose measurement by glucose meters is known, the validity of glucose
measurement in capillary heparinised samples run through a blood gas analyser is unknown in
adult patients. Blood gas analysers can also provide Na, K, Hb, Lactate, PaO2, PaCO2,
Glucose and HCO3 but only capillary O2 (kPa), CO2 (kPa), glucose and ketones (using
specialist meters) have been validated in adults, although there has been study in paediatric
populations.

3
Capillary blood sampling offers several advantages in the acute setting. Firstly the relative
ease of obtaining the samples compared to venepuncture. There are several collection sites
on the body and these can be rotated (heel, fingertip, earlobe) and testing can be performed
with minimal training by medical, nursing and ancillary healthcare staff. Blood gas analyses
provide an almost immediate result, which may speed clinical decisions regarding care.
Capillary sampling is believed to be less painful, and this may facilitate serial testing in the
frail, anxious or those without capacity. Also, serial testing will not impact on venous access
points which can then be used for intravenous medications and fluids and avoid cannulation in
sites more prone to infection such as the lower limbs or the requirement of invasive central
venous access. Patients in hospital, particularly diabetic patients, are also frequently having
capillary blood taken for glucose monitoring when on intravenous insulin (often required
hourly in this case) or during their standard blood glucose monitoring regimens. If this blood
could be taken for measurement of other the parameters listed above at the same time this
could reduce the overall number of blood tests taken but also allow very close monitoring of
these crucial biochemical and haematological tests. If capillary blood gas analyses were
accurate enough to inform clinical decisions, these advantages would be of significant value
to patient care.
There are, however, several potential disadvantages to capillary blood sampling. It is unclear
if other values derived from POCT testing (for example: Na, K, Hb, lactate, glucose using a
blood gas analyser) are accurate enough to guide clinical care. Only a limited amount of
blood can be obtained by this sampling modality and therefore analysis needs to be focused
on a small number of parameters. The standard capillary tube, which can be used in blood gas
analysers can take approximately 120 microlitres and needs to be full to process all the

4
required results. Acquiring this volume of blood may be difficult if flow is poor or there is
inadequate puncture. Scarring can occur when there have been multiple puncture sites in the
same area and it has been hypothesised that damage to blood cells may cause inaccurate test
results such as an artificially high potassium or low haemoglobin, but this has not been
proven.
1.2 Current Methods of Point of Care Blood Testing in Emergency Care and the
Evidence for them
For the reasons discussed POCT is being used for many different biochemical and
haematological parameters. However, the blood analysed is often different to the standard
analysis methods for example point of care analysers uses whole blood, often this will have
heparin incorporated into the collection device, whereas laboratory samples use several
different types of blood and reagents. These include serum samples used for most electrolytes
and biochemical tests that contain gel separators which will enable the serum to be easily
removed following centrifugation. There are also plasma samples, used for glucose and
lactate measurements, which are derived from centrifuged whole blood containing an
antiglycolytic agent and an anticoagulant. EDTA samples are used for full blood count
assessment; this is a potent anticoagulant and enables blood cell measurement. So
differences in processing and also subsequent analysis occurs within different time frames
with POCT being processed within minutes but laboratory samples taking up to several hours
to be processed. They are transported differently as well, with POCT samples being
transported usually very short distances by hand, whereas laboratory samples may be
transported by pneumatic pods, hospital transport or portering services. Most of the POCT
analysers have direct ion-selective electrodes, which measure the activity of ions in plasma. In
contrast, the central laboratory analyser has indirect ion-selective electrodes and measures the

5
activity of ions in pre-diluted sample and is affected by dissolved solids such as proteins,
hence influencing the values obtained by various electrodes. (Dheeraj Kapoor1 2014) These
differences may cause clinically significant differences in the parameters being analysed. For
these reason many authors have attempted to compare point of care testing to standard testing
results. These papers will now be discussed including the different parameters currently
being measured by POCT, the evidence behind them and their reliability in guiding clinical
care.
1.2.1 Blood gas analysis
Arterial blood gas analysis is a well-established method of assessing patients who are acutely
unwell to assess patients’ blood oxygen levels (pO2), carbon dioxide level (pCO2), and acid
base balance. This is a very painful procedure and can be associated with serious
complications including arterial vessel intimal tears and ischaemia to the hand.(Mortensen
1967, Roberts J 1998) For this reason studies have looked into using alternatives such as
venous sampling to see if these would produce similar results.
In a number of studies venous and arterial blood have been shown to produce concordant
values for pH and bicarbonate (HCO3) (Gokel Y 2000, Kelly A M 2001, Ma O J 2003, Kelly
A M 2004). To study the differences between samples some authors report the mean
difference, which is the same as mean bias, and also the R2 or the coefficient of determination.
This is a statistical test that summarises how close the data fits a statistical model with values
closer to 1 representing the closest fit.
6
The first of these studies by Kelly 2001 who looked at venous pH compared to arterial pH in
246 patients presenting to the emergency department, who the attending doctor deemed
requiring an ABG. This included 195 adult patients with acute respiratory disease and 51
with suspected metabolic derangement. It showed good levels of agreement when compared
to arterial pH with a mean difference of -0.04 and 95% limits of agreement (LOA) from -0.11
to +0.04. The same author added further analysis to these results in 2004 by comparing
agreement of bicarbonate and showed a mean difference of 1.2 mmol/L with 95% LOA from
-2.73 to +5.13 (Kelly A M 2001, Kelly A M 2004). Other studies have focused on adult
patients presenting to the emergency department with DKA with Ma in 2003 and Gokel in
2000 comparing the results of paired ABG and VBG for pH and bicarbonate. This was
assessed in 195 and 152 patients respectively and again showed no significant difference
between the two. Gokel also included 33 healthy controls in this study and showed
differences in the means between arterial and venous pH in this healthy group to be 0.05 +/-
0.01 (standard error) and for bicarbonate -1.66 +/- 0.58 mmol/l, with a correlation in this
group (R2) of 0.60 and 0.55 respectively. This was a weaker correlation than found in the
DKA group where R2 was 0.99 and 0.99, respectively. The healthy control group were
younger than those patients within the DKA group (age ranges of 18-65) but the authors
offered no further details about this group nor potential reasons for this difference.
A meta-analysis including 18 studies agreed that there was little clinically significant
difference in pH and showed arterial pH to typically be 0.030 higher than the venous pH (95%
confidence interval 0.029 to 0.038). This analysis also concluded that the pCO2 values with
variations between venous and arterial of -1.43 kPa to +0.33kPa (within the 95% confidence

7
interval) were unacceptably wide for clinical use (Byrne AL1 2014). Another meta-analysis
had similar conclusions but considered a normal venous pCO2 a good negative predictor of
significant hypercapania compared to an arterial sample allowing a venous test to rule out
significant hypercapnic respiratory disease.(Bloom BM1 2014) These studies also accepted
that the pO2 values were not of an acceptable level of agreement between venous and
arterial(Byrne AL1 2014) The patients included in these meta-analysis were adult hospital
patients predominantly from emergency departments but also includes intensive care patient,
trauma units, cardiothoracic surgery patients and patients specifically with exacerbation of
COPD. Table 1.1 below summarises the findings of these meta-analysis.
Parameter, Study
Number of studies included
Mean difference compared to arterial
Lower 95% LOA
Upper 95% LOA
pH Bloom Byrne
13 18
-0.033 -0.03
-0.039 -0.023
0.027 0.090
pO2 (kPa) Bloom Byrne
Not Included 11
- 4.91
- 3.62
- 6.21
pCO2(kPa) Bloom Byrne
12 18
0.589 0.553
-2.71 -1.43
3.42 0.31
Bicarbonate (mmol/L) Bloom Byrne
10 Not included
1.03 -
-7.1 -
10 -
Table 1. 1 Results of meta-analysis comparing arterial and venous blood gas results
Capillary blood from an ear lobe arterialised blood sample is now commonly used in
respiratory clinics for determination of pH, pO2 and pCO2 to help guide clinical practice.
This practice has been guided by a large meta-analysis of 29 studies (each of which included
664 to 222 samples per study) comparing paired capillary blood samples from an ear lobe and
finger prick test to an arterial blood gas taken from taken from the radial artery. The meta-

8
analysis concluded that ear lobe sampling was 2.5 times more accurate in predicting arterial
pO2 compared to a finger prick test. Both these capillary samples were generally more
accurate at lower levels of pO2. The ear lobe samples were a good predictor of arterial pO2
(adjusted R2 = 0.88, mean bias = 0.507kPa) but finger prick samples were not (adjusted R2 =
0.48, mean bias = 1.53kPa). The authors did not state what would be an acceptable level of
mean bias or R2 value. It covered a large range of pO2 values ranging from as low as
approximately 3 kPa to 15kPa and a large diversity of population including adult and
paediatric population in emergency department, critical care and outpatient environments. It
also showed that both finger prick and ear lobe prick samples were accurate for assessing pH,
with a mean bias of only 0.02. The range of values studied here was wide, including pH from
6.8 to 7.6. The study suggested that ear lobe prick was more accurate at assessing pCO2 but
that both closely reflected arterial levels (with arterial versus earlobe adjusted r2 = 0.94, mean
bias =0.253 kPa ; arterial versus fingertip, adjusted R2 = 0.95, mean bias = 0.293 kPa). This
study included patients with a wide range of pCO2 values, ranging from approximately
1.33kPa to 16kPa (Zavorsky GS1 2006). The summary of the result are given in table 1.2
below. A potential limitation of this study was the use of mean bias and R2 values to form its
conclusions, and more stringent tests can be applied, which will be discussed below.
Parameter, Type of capillary sample
Mean Bias Adjusted R2 Difference clinically significant?
pH Finger Ear Lobe
0.02 0.02
0.9 0.94
No No
pO2 (kPa) Finger Ear Lobe
1.53 0.507
0.88 0.48
Yes No
pCO2 (kPa) Finger Ear Lobe
0.293 0.253
0.95 0.94
No No
Table 1. 2 Summary of findings from the meta-analysis by Zvorsky comparing capillary blood gases to arterial

9
Similarly there have also been several studies in paediatric and neonatal populations which
show good correlation of blood gases, apart from pO2, taken from capillary samples
(normally taken from a heel prick in this patient group).(Yang KC 2002, Yildizdaş D
2004)(100) Two of these studies included paired results of patients on neonatal intensive care
and two were from patients from paediatric intensive care units, including 33 to 116 patients.
All showed good correlation between arterial and capillary pH and pCO2 with R2>0.87.
However, these studies all focused on correlation only in their conclusions.
1.2.2 Electrolytes
Assessment of electrolytes is essential in patients who are acutely unwell. Having almost
instant results from POCT could allow rapid treatment of life threatening emergencies or
identification of patients who are at high risk of development of the potentially fatal
complications of their derangement such as cardiac arrhythmias or seizures. It is unclear
whether these tests are clinically reliable enough, however, to allow commencement of
treatments or to monitor outcome.
There have been a number of studies that have compared electrolyte values between POCT
blood gas analyser measurements with serum laboratory values. A study by Beggs in 2006
concluded there were no differences between arterial blood gas and venous laboratory
samples for electrolytes when 238 paired samples were taken for sodium, potassium and
chloride from intensive care patients. It showed strong correlation coefficients for sodium,
potassium and chloride (0.945, 0.817 and 0.922).(A Beggs 2006). Subsequently other studies

10
have not replicated this level of correlation.(Campbell3 200, Anunaya Jain 2009, Binila
Chacko 2011, Budak YU1 2012, Quinn LM1 2013). One study (Jain 2000) compared 200
paired ITU samples and showed only minimal differences between potassium (mean ABG
potassium 3.74mmol/l (SD 1.92), mean serum potassium 3.896mmol/l (SD 1.848) (p =
0.2679)). However, the same study demonstrated differences in the testing modalities results
for sodium (mean ABG sodium 131.28mmol/l (SD 7.33), mean serum sodium 136.45mmol/l
(SD 6.50) (p < 0.001) with a correlation coefficient of 0.68.(Anunaya Jain 2009) A similar
study by Quinn agreed with these conclusions but suggested that potassium arterial POCT
values at lower concentrations (<3 mmol/l) did not show agreement to a clinically acceptable
level with variation from serum samples between 1 and -0.3mmol/l (values within 95%
confidence interval).(Binila Chacko 2011). Furthermore, a study published in 2013
concluded that potassium levels at higher concentrations (>5mmol/l) may also show a
clinically relevant difference between sampling modalities (mean difference 0.44 mmol/l).
This paper also differed in its conclusions regarding the accuracy of POCT sodium results,
surmising that this was sufficiently accurate within the physiological range.(Quinn LM1
2013).
The reason for these differences in conclusions is not clear, however, the statistical analysis
undertaken may provide some explanation. Quin et al, used a paired T-test. This approach
does not analyse the range of results and so cannot provide a comparison to accepted accuracy
measures as the analysis will only allow confirmation or rejection of the null hypotheses.
Other studies have concluded that there wasn’t sufficient concordance between POCT or
venous results to support clinical care. Budak et al described a mean bias for potassium of -
0.251 mmol/l with LOAs from -1.1 to + 0.597 and a mean sodium bias of -4.94 with LOAs
of -10.05 to +0.97, both of which were considered too discordant to direct clinical decisions

11
(Budak YU1 2012). These results are similar to that of Jain et al 2009, however, there were
discrepancies as to what each study defined as being a clinically acceptable difference. Both
studies used the United States Clinical Laboratory Improvement Amendment (US CLIA)
2006, which accepts a difference of 0.5 mmol/l in measured potassium, and 4 mmol/l in
measured sodium, from the gold standard measure of standard calibration solutions for their
conclusions (Anunaya Jain 2009, Réminiac 2012). However, Budak et al 2012, argued that a
difference of >0.25mmol/l in potassium should be considered clinically relevant but did not
provide an adequate explanation for this cut off.
A further study described no clinically significant differences between whole arterial blood
samples analysed in a POCT blood gas analyser compared to the serum venous values for
several electrolytes including glucose, urea, sodium, potassium and creatinine, as shown in
table 1.3, with 55-70 paired samples taken from patient in an adult intensive care unit of
each.(Perkov 2006) This study was one of very few papers that covered a wide range of
electrolytes rather than focussing on a small number of parameters.
Electrolyte N Mean Venous serum+/-SD
Mean Arterial POCT+/-SD
Difference in means
Glucose, mmol/L 55 7.14 +/- 1.62 7.17 +/- 1.68 0.03 Urea, mmol/L 55 11.96 +/- 8.39 13.87 +/- 10.75 1.94
Creatinine, mmol/L
55 156.26 +/- 137.93 154.20 +/-145.83 2.06
Potassium, mmol/L
70 4.28 +/- 0.46 4.23 +/- 0.47 0.05
Sodium, mmol/L 70 141.6+/- 17.03 138.8 +/- 5.69 2.8 Chloride, mmol/L 70 112.37 +/- 6.43 110.67 +/- 4.99 1.7
Table 1. 3 Comparison of Arterial POCT blood gas machine with Venous serum Lab analysed samples(Perkov 2006).

12
This study concluded the differences are clinically acceptable, however, did not comment
how this conclusion was drawn nor on which standard references ranges this conclusion was
based.
Table 1.4 below summarises the studies comparing samples assessed in a blood gas analyser
to laboratory venous samples. These were taken from Intensive care and Emergency
Department populations. It shows the lowest mean bias from the selected studies and the
highest with the same applied to the LOAs
Parameter Number of Studies Reviewed (patient number)
Mean Bias Lower 95% LOA
Upper 95% LOA
Sodium (mmol/l)
5 (44-200) 1.77 to 5.17 -6.4 to-0.66 2.9 to 8.78
Potassium(mmol/l)
5 (44-200) -0.3 to 0.156 -0.72 to -0.4 0.13 to 0.8
Table 1. 4 Arterial blood samples compared to venous laboratory samples (R King 2000, Anunaya Jain 2009, Binila Chacko 2011, Budak YU1 2012, Quinn LM1 2013)
There have been a number of studies assessing the accuracy of venous electrolytes as tested in
a blood gas analyser to confirm the presence of DKA and acid base balance (Brandenburg
MA1 1998, Menchine M1 2011). One study concluded that measurement of bicarbonate, pH,
anion gap and glucose as a combined tool was sufficient to give a diagnosis of DKA with a
sensitivity of 100% and specificity of 97.8%, however, the authors did not draw any
conclusions of the reliability of the individual parameters when considered alone (Menchine
M1 2011).
All of the above studies used arterial blood measured in a blood gas analyser compared to the
venous laboratory test. There appear to be very few studies, which have used venous blood

13
analysed in a blood gas analyser for the same analysis. The only study found was taken in a
paediatric intensive care population where 60 consecutive paired samples were taken and
sodium and potassium were compared. This showed mean differences of -8.76mmol/l for
sodium and -0.75mmol/l for potassium with 95% limits of agreement of -20.7mmol/l to
3.2mmol/l for sodium and -1.9 to 0.4 for potassium. They concluded that these were not
clinically acceptable differences as they exceeded the recommended ranges as provided by the
United States Clinical Laboratory Improvement Amendment (US CLIA) (Kumar. 2013).
This is the laboratory regulation service regulated by the Centre for Medicare and Medicaid
Services in the United States who’s objective is to ensure quality laboratory testing (Medicaid
2016).
Another method for measurement of electrolytes is using an i-STAT portable analyser. This is
a hand held battery powered analyser that uses disposable cartridges that can perform several
analyses simultaneously with results available in 2 minutes. There is one cartridge that
measures electrolytes including sodium, potassium, chloride, urea and glucose, measures
packed cell volume and calculates Hb from this. Another cartridge measures blood gases. A
study by Papadeain in a paediatric population including 225 samples attempted to assess the
accuracy of this method and concluded that concordance between all electrolytes measured, as
well as pH, was acceptable with a coefficient of variation (CV) of less than 2%. However, the
concordance between creatinine and haematocrit values was lower (CV<9.5%). The authors
used whole blood with samples taken in capillary tubes or blood gas syringes (the actual sites
were not specified) from patients less than 3 months old and greater than 3 months old.
Parameters were compared using coefficient of the variance, which is a potential limitation of
this study as it is not the gold standard for comparing such variables(J. Martin Bland 1986)

14
(methods for comparing variable will be discussed later, (see section 1.3). It is unclear if
these results are generalizable to an adult population but there are methodological differences
which might limit comparisons. The standard method for measurement of electrolytes in
adults uses serum samples whereas whole blood samples were utilised in this study (Christine
Papadea1 2002).
A study in an adult population compared arterial blood measured in the istat analyser to
central lab samples and gave correlation co-efficient values of 0.85 for Ca, 1 for K, 0.86 for
Na, 0.99 and concluded it had suitable reliability for most clinical setting(Schneider J1 1997).
This study again only used arterial blood drawn so might not be generalizable to most blood
samples taken in a hospital setting nor acceptable as a means to gain serial samples from
many patients.
Another study (Wilding 1993) compared venous samples measured in the Istat analyser to
laboratory values using samples taken from 142 patients in Emergency Department and
Outpatient areas. The authors reported Pearson’s correlation coefficient (r) values with mean
differences of 0.937 and 1.37mmol/l for sodium; 0.993 and 0.08mmol/l for potassium,; 0.904
and 1.00mmol/l for chloride, 0.996 and -0.22mmol/l for urea nitrogen; and 0.952 and
0.01mmol/l for glucose, respectively. This showed concordance of measurements and further
analysis using linear regression also suggested favourable accuracy for this POCT measure.
A limitation for this study was that the analysis did not include Bland-Altman plots or limits
of agreement analysis (the recognised gold standards for comparing tests, which will be
discussed fully in section 1.3) to enable the results to be more widely interpreted. This study

15
also compared the concordance between the i-stat analyser and the standard laboratory
analyser when the analysis was done by laboratory staff using the analyser in the central
laboratory compared to nursing staff working in the areas at the patient bedside and showed
no clinically significant differences between these methods, however, the study did not state
what a clinically significant difference would be. This interpretation included regression
analysis which showed good levels of correlation (r>0.95) (Wilding 1993). Other studies have
shown similar levels of accuracy. One such study by Mock (Mock T 1995) which reported
coefficient of variation (CV) showed CVs of less than 3.5% for all the above parameters,
however, only used a small sample size (of 10-20 healthy volunteers).
Use of capillary electrolytes is common practice in paediatric medicine. There are few studies
of capillary whole blood samples tested in a POCT blood gas analyser for electrolytes. One
such study (Yang KC 2002) compared capillary samples and arterial samples analysed in a
blood gas analyser and concluded that there was good correlation between the following
parameters: hemoglobin, hematocrit, sodium, calcium, glucose, lactate and osmolality. Again,
however these results compared just whole blood samples taken through a blood gas analyser
in neonates and did not compare them to gold standard laboratory values, so are of limited use
in current adult medical practice.
Ionised calcium can be reported from most blood gas analysers. Ionised calcium is the
physiologically active state of the ion as much of the total blood calcium will be bound by
albumin and other blood proteins. Measurement of corrected total body calcium alone may
not be a true reflection of the ionised calcium in patients who are unwell as other factors can

16
increase or decrease its protein binding e.g. acid/base disturbance or when albumin is very
low. In these clinical settings ionised calcium may be of relevance and was commonly
obtained via an arterial sample and processed via a blood gas analyser. Bilkovski et al.
showed that there was concordance between arterial and venous samples processed in the
same way with a correlation coefficient of r=0.94 (P<.0001) and a mean difference between
venous and arterial ionized calcium measurements of 0.015mmol/l±0.045 (standard error)
(P=.001)(R.N. Bilkovski 2004). This difference is likely to be of minimal clinical
significance. Both of these samples use whole blood measurements and there is evidence that
whole blood samples differ from serum for ionised calcium samples and will give a lower
level by an average of 0.126 mmol/l, with the difference decreasing with lower values of
ionised calcium (Seok Hui Kang 2014). The Clinical Laboratory Standards Institute (CLSI)
suggests that both methods are acceptable (Sachs C 1991) , however interpretation at very low
calcium values should be done with caution and serum samples requested if required.
1.2.3 Lactate
Lactate is a produce of anaerobic respiration, which occurs in many tissues when there is
reduction in delivery of oxygen and so is a good indicator of organ perfusion in conditions
such as sepsis or when patients are in shock.
Lactate is a common parameter checked on POCT analysers. As with blood gases the gold
standard for analysis has been an ABG. This has led to studies assessing the concordance
between an Arterial and venous POCT lactate analysis. One study (Ikami A 2013) which
included samples from 72 emergency department patients with a range of lactate values from
0.5-14.6mmol/l, concluded that there was a high level of correlation showing variation from -

17
0.4 to +1.1 and a mean difference of 0.268mmol/l with venous levels being consistently
higher to allow a correction with the formula below devised from regression analysis
modelling:
Arterial lactate (mmol/L) = –0.259 + venous lactate (mmol/L) × 0.996
There have been several similar studies with the same conclusions (Réminiac 2012, Akira
Mikami 2013) however, the majority of studies did not specifically select patients with
lactates outside the normal range. This was addressed in a study by Bloom et al (2014)
reviewing patients with high lactates to determine if a venous blood sample can be used to
accurately diagnose a lactic acidosis. This study showed the mean difference and standard
deviation between venous and arterial blood for all patients was 1.06 ± 1.30 mmol/L and
stated that using a cut off of 2mmol/l and 4 mmol/l would incorrectly diagnose a lactic
acidosis in 36.2% and 17.9%(B. Bloom 2014). With the cut off of 2 being of particular
significant as this is where hyperlacticaemia is defined. (Kyle J Gunnerson 2015)
Table 1.5 below summarises the results from 4 studies with samples taken from patients
presenting to an emergency department. They compare arterial lactate (the gold standard) to
venous measured in a blood gas analyser.

18
Parameter Number of Studies Reviewed (patient number)
Mean Bias Adjusted R2
Lactate (mmol/l)
4 (72-188)
0.268 to 0.4
0.96
Table 1. 5 Comparison of arterial to venous lactate (Gallagher E.John 1997, Réminiac 2012, Ikami A 2013, Talayero Gimenez De Azcarate M. 2013)
1.2.4 Glucose
Point of care glucose analysis using capillary glucose is a very well established method of
blood glucose measurement by clinical staff and patients at home and in hospital. Generally
this produces accurate results within the physiologically normal range but there is concern
about their accuracy in the hypo and hyperglycaemic ranges(R Boyd 2005, Rebel A1 2006).
One group compared the glucose meter readings to central laboratory analyser readings, for
both hypoglycemic and hyperglycemic values, and showed the differences were greater than
10% in more than 61% of samples. Further to this, in the hypoglycemic range, differences
were greater than 20%, 57% of the time (Khan AI 2006).
Both POCT glucose meter glucose and POCT glucose measured in a BGA were examined in
a literature review of 21 articles (Inoue S 2013), where the agreement was assessed by the
percentage of values within 20% of the laboratory plasma measurement (as per the
international organisation for standardisation, IOS, Criteria). The proportion of non-
agreement was 12.5% for BGA samples and 1.3 - 9.3% for capillary blood glucose meters. It
also used a meta-analysis from 3 studies (912 samples) as a straight comparison of accuracy
between glucose metre and BGA values. This showed BGA glucose to be more accurate
compared to a capillary blood measured in a glucose metre, (odds ratio for non-agreement,
19
0.04; P < 0.001) but not significantly more accurate than arterial blood measured in a glucose
metre (odds ratio for non-agreement, 0.17; P = 0.20) glucose metre. Suggesting that the type
of blood i.e. capillary or arterial sampled is more important for the accuracy than the method
of analysis when differentiating between BGA and glucose metre.
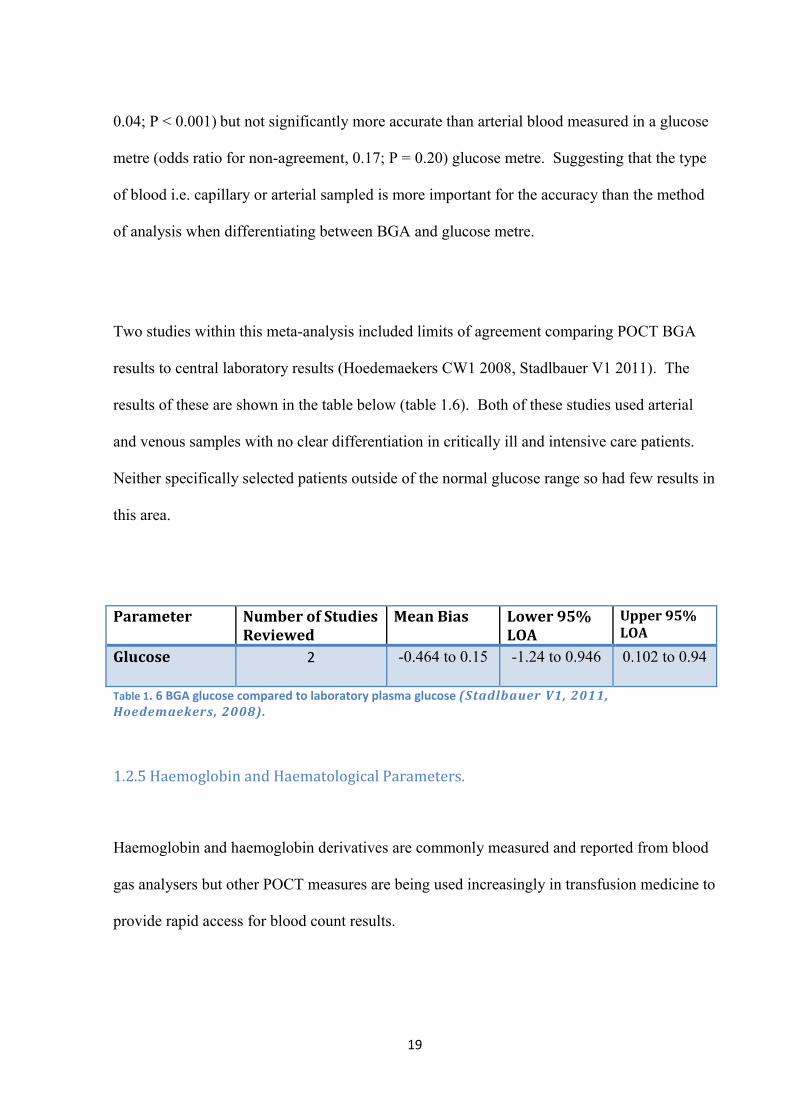
Two studies within this meta-analysis included limits of agreement comparing POCT BGA
results to central laboratory results (Hoedemaekers CW1 2008, Stadlbauer V1 2011). The
results of these are shown in the table below (table 1.6). Both of these studies used arterial
and venous samples with no clear differentiation in critically ill and intensive care patients.
Neither specifically selected patients outside of the normal glucose range so had few results in
this area.
Parameter Number of Studies Reviewed
Mean Bias Lower 95% LOA
Upper 95% LOA
Glucose 2 -0.464 to 0.15 -1.24 to 0.946 0.102 to 0.94
Table 1. 6 BGA glucose compared to laboratory plasma glucose (Stadlbauer V1, 2011, Hoedemaekers, 2008).
1.2.5 Haemoglobin and Haematological Parameters.
Haemoglobin and haemoglobin derivatives are commonly measured and reported from blood
gas analysers but other POCT measures are being used increasingly in transfusion medicine to
provide rapid access for blood count results.

20
Haemoglobin is essential for carrying oxygen to tissues and organs via the circulatory system
to enable aerobic respiration. Its levels can be reduced through haemorrhage as well as other
haematological and non-haematological diseases. It is an essential measure in acutely unwell
patients. Blood gas POCT analysers have been investigated for their accuracy and reliability
in providing haemoglobin results. One such study compared 238 paired arterial samples
processed through a blood gas analyser to venous laboratory results and showed a correlation
co-efficient of 0.934. Another study compared 81 paired arterial blood gas analysed samples
and arterial samples sent to the laboratory and showed minimal difference between the means
(0.19g/dL) but commented that the 95% limits of agreement were large (− 10.9 to +14.7
g/l)(Campbell3 200). A further study showed similar results (mean difference Hb -4.3 g/l
(95% CI = -11.0 to 2.4)(Ray JG 2002). These studies all compared arterial samples measured
in a blood gas analyser compared to the standard venous measurement. There are no such
studies comparing venous blood measured in a blood gas analyser compared in a similar
fashion.
Table 1.7 shows the combined results from 4 studies all of which were taken from ITU
populations where limits of agreement and mean bias were analysed.
Parameter Number of Studies Reviewed (patient number)
Mean Bias Lower 95% LOA
Upper 95% LOA
Haemoglobin (g/l)
4 (100-238) -0.433 to 0.91 -1.1 to -1.47 2.4 to14.7
Table 1. 7 Comparison of BGA haemoglobin to laboratory values (R King 2000, Ray JG 2002, A Beggs 2006, Quinn LM1 2013)

21
Despite not specifying guidelines to assess parity of results, all of the studies concluded that
BGA haemoglobin lacked the required accuracy required to guide clinical care.
Haemocue is one of the most frequently used point of care analysers in transfusion medicine
and haematology due to its accuracy with venous and arterial samples. There have been a
number of studies which have confirmed this with values within 1g/dL (for 95% of samples)
in multiple studies across a range of haemoglobin concentrations(Lardi A. M. 1998, J 2002,
Rechner I. J. 2002, Sanchis-Gomar 2013). There have been some concerns about its
reliability when capillary samples are taken and several studies have concluded that this
method is not significantly accurate to guide patient treatment and requirement for
transfusion.(Seguin P1 2010, Mimoz O1 2011, Sanchis-Gomar 2013) The mean difference
(bias) between capillary haemocue and laboratory Hb was 0.2 g/dL (95%CI, 0.1;0.3), and
limits of agreement were -1.3 g/dL (95%CI, -1.4;-1.2) to 1.7 g/dL (95%CI, 1.6;1.9), however,
the discrepancies between capillary and lab samples were greater than 1 g/dL in 30.8% of
cases.(Seguin P1 2010).
A study by Gehring, which examined and compared several POCT methods for HB
measurement for 50 post operative ITU patients showed a mean bias of 0.2 g/dL for blood gas
analyser Hb and 0.3 for haemocue compared to lab gold standard values(H. Gehring1 2002),
suggesting parity.
INR is a common blood test taken to assess patients’ coagulation especially in patients on
vitamin K antagonists such as warfarin to assess whether it is within the therapeutic range. If

22
the INR is too high patients risk sustaining potentially life threatening haemorrhage. If it is
too low then it will not be having its therapeutic effect. Point of care testing is now also
widely used for measurement of INR. This enables health care works to quickly assess INR
and advise on dosing of an anticoagulant within a clinic visit but also enables patients to
monitor their own INR at home and adjust their dosing accordingly themselves. There have
been many studies that have assessed the accuracy these meters. A literature review of 22
papers in 2012 concluded that they were sufficiently accurate for clinical use, however, their
accuracy should be viewed in the context of the inherent inaccuracies in INR measurements.
This is because there is a variability in laboratory measurements of INR with the coefficient
of the variance (CV) in the order of 5% due to differences in reagent coagulometer
combinations.(Christensen TD1 2012) One study in children, included in this review,
compared POCT samples taken at 2 different time points to laboratory samples and showed
Bland-Altman's 95% limits of agreement were 0.11 (-0.20; 0.42) and 0.13 (-0.22; 0.48).49 A
study comparing the accuracy of patients using the POCT INR meter themselves with a
laboratory INR value taken within one hour of the POCT test showed similar accuracy with a
mean difference of 0.08 with 94% of readings within 0.5, 6 % from 0.5-1 and with no
readings >1 unit from the laboratory samples.(M. NAGLER1 2013)
1.3 Statistical analysis for assessing the agreement between 2 methods of clinical
measurement
There have been a number of different methods utilised in the papers reviewed above which
compare a method of POCT to the gold standard tests. These include simple comparisons of
the means, calculating the mean differences between the POCT test and the gold standard

23
tests, calculating the correlation coefficient, the coefficient of determination and using bland-
altman plots, which include determining 95% limits of agreement.
The bland-altman plot method has now become the most commonly used method for this type
of analysis and was used in 85 % of studies reported from 2007 to 2009 as opposed to the
correlation coefficient, which is still used in 27% of studies (Rafdzah Zaki 2012).
The bland-altman method overcomes some intrinsic issues that are present when a correlation
coefficient is used in isolation. A correlation coefficient will show a perfect correlation as
long as there is a direct linear relationship between two parameters, despite the fact that there
may be very poor agreement (Altman DG 1983) For example a test could show a value which
is always twice as much as a gold standard test; this would show a perfect correlation between
the two tests, however the agreement between the two would be poor. Similarly using
regression analysis and a coefficient of determination only would not give a true measure of
agreement as these are based on correlations rather than agreement.
1.4 Evidence for POCT improving patient outcomes and providing economic
benefits.
The accuracy of POCT is of importance during clinical use, however, for it to be established
as a viable method for patient assessment, POCT regimes need to demonstrate clinical
efficacy. It is important to ascertain whether a quickly available result would improve patient
outcomes in comparison with a slower laboratory processed sample. An example of this might

24
be by reducing morbidity or mortality or reducing patient length of stay in a department or
hospital. POCT also needs to be shown to be cost effective if it is to be introduced widely,
especially in the current time of financial austerity where there is high scrutiny on healthcare
budgets.
A review by Lewandrowski highlighted decreased length of stay in the Emergency
Department for patients who had point of care tests for a number of different presenting
conditions.(Elizabeth Lee Lewandrowski1 2013). However, a large multicentre randomised
control trial (1132 patients) did not replicate these results and described a decreased median
length of stay when this method is used but no change in mean length of stay as well as being
calculated to be less cost effective when compared to standard methods calculated by mean
costs and quality-adjusted life-years (QALYs), and then estimated the probability of cost-
effectiveness assuming willingness to pay £20,000 per QALY gained. The number of major
adverse events defined by death, non-fatal AMI, life-threatening arrhythmias or
hospitalisation for MI showed no significant increase in the POCT group.(Goodacre S1 2011)
A randomised control study at a large teaching hospital Emergency Department attempted to
measure the extent to which point of care testing resulted in differences in clinical outcome
for patients when compared with patients whose samples were tested by the hospital
laboratory. This recruited 1728 patients who were randomised to point of care testing with an
i-STAT system for blood analysis and to standard laboratory analysis. It then compared the
outcome of the 2 groups and concluded that POCT brought faster changes in treatment for
which timing was considered to be critical in 7% and influenced the treatment in 14% of cases

25
but that these patients did not spend less time in the department. Decisions were made 74
minutes earlier for haematological tests and 86 minutes earlier for biochemical tests. It also
stated that the reduction in the time for the test results to be available did not seem to improve
the clinical outcome of the patients. The other clinical outcomes measured were mortality,
length of stay, the admission rates, the amount of time the patients spent in the department.
The assessment of time critical in this paper was done by consultants and senior registrars
using a visual analogue scale so objective measures were not used.(Jason Kendall 1998,
Kendall JM1 1998)
A similar study (CURTIS A. PARVIN 1996) using the i-Stat device (measuring Na, K, Cl,
glucose and blood urea nitrogeon), which compared 2 separate control periods over a few
weeks with an experimental period where the i-Stat device was used also showed no
difference in overall length of stay in the Emergency department in the included 4985
patients. Again suggesting that awaiting blood results does not have a large impact on length
of stay.
Measurement of the precise economic benefit of point of care testing can be very challenging.
It is easy to focus on the individual unit costs and without the benefit of economies of scale
and automation then POCT is often more expensive than its laboratory alternative in this area.
There have been a number of papers that have included formal cost effective analysis(Andrew
St John1 2013). One of these looked at self glucose monitoring and found that self-care using
POCT glucose monitor was of higher cost (additional £92) without providing clinically
significant differences in outcomes such as HbA1C(Simon J 2008) Another article looked at

26
the cost of cardiac biomarkers and also concluded that this method is likely to produce higher
ED costs, coronary care cost as well as cardiac intervention costs due to more frequent
requirement of cardiac interventions, coronary care and intensive care admissions in the
POCT group. This study did not assess clinical outcomes(Fitzgerald P 2011).
A paper by Kendal et al looked at the financial implications of using POCT as either a
supplement to the standard laboratory test or a replacement in both Accident and emergency
departments and intensive care. It concluded that the average cost per test was £4.06 with the
laboratory arrangements but could be reduced to £3.78 per POCT method. This would give
overall hospital savings from £8332-£20,000 if POCT replaced this method but there would
be a substantial increased expenditure if it was used as a supplement only.(Kendall JM1 1999)
In a similar study there was only a slight increased cost observed in the use of capillary blood
glucose POCT measurement. Given the ease of performing and the immediacy of it results it
is clear then how this has become the most frequently used method for glucose
monitoring.(Lee-Lewandrowski E1 1994)
1.5 The challenges with venepuncture and other methods of blood sampling
The most common procedure performed in hospital for blood collection is venepuncture.
Venepuncture is associated with pain and for a large proportion of people causes significant
symptoms of anxiety and in some patients causes vasovagal reactions.(Langham BT 1993,
Pavlin DJ 1993) This can effect patients ability to receive medically essential treatment if for

27
these reasons the refuse the tests.(Deacon B 2006) Venepuncture also has the possible
complication of damage to the nerves in the arm or hand very occasionally causing a complex
pain syndrome. This nerve damage is thought to be rare and incidence rates have not been
reported, however due to the affected nerves being sensory it is likely to be underreported
(Foad Elahi 2014). It can cause bleeding and bruising if the vessels are damaged (Yuan
R.T.W. 1985, Yamada K. 2008). Arterial blood sampling is an alternative method of blood
sampling but as discussed above this is associated with more severe pain as well as potential
devastating complications such as ischaemia of the hand (Mortensen 1967). This
complication, however, is more associated with arterial catheterisation, where the incidence of
arterial occlusion is 0.09% (Clinical review: Complications and risk factors of peripheral
arterial catheters used for haemodynamic monitoring in anaesthesia and intensive care
medicine) rather than single arterial puncture.
Patients often undergo at least daily venepuncture in hospital. A study which assessed blood
volumes taken during phlebotomy showed an average of 115 blood tests taken per patient in
patients undergoing cardiac surgery, with blood gas analysis being the most frequent. This
equated to blood volumes of 332mls in intensive care patients and 118mls in patients outside
intensive care (Koch CG1 2015). This frequent venepuncture can cause veins to become
thrombosed or scarred leading to decreased flow through these vessels to the point when
venepuncture is no longer successful, which can happen to multiple veins, which are
accessible for venepuncture leading to the patients having no accessible veins for peripheral
cannulation. In turn this can lead to patients needing multiple attempts by clinical staff but
may also require patients to be switched to often less effective oral medications when veins
are not accessible. The alternative is to have more invasive central line insertions, where a
larger intravenous line is inserted into the groin or neck, which has associated procedural risks

28
including infection, bleeding and pneumothorax (lung puncture) or PICC (peripherally
inserted central catheter) lines which may be limited by the same problems of venepuncture
above but can also become clotted preventing blood collection. Obesity and oedema can also
limit ability to access veins due to difficulty visualising or palpating veins.(Cleveland-Noriega
D.S. 2010) The relatively large blood volumes required in venepuncture may also contribute
to anaemia or the requirement of red cell or other blood product transfusion (Koch CG1 2015)
Patients with certain conditions in hospital can require even more frequent blood tests to
evaluate their on-going management. These include DKA patients where blood tests for pH,
bicarbonate and potassium are required initially every 2 hours according to the current
guidelines as stated by the JBDS (Group 2014). This is in addition to the hourly capillary
blood glucose and ketone monitoring required for these patients. In this case if the capillary
assessed parameters measured on a blood gas machine were deemed to be accurate, then this
could be done at the same time using the same puncture when the blood sugar and capillary
sample are taken. This then this could save the patient numerous blood tests at the same time
as conserving the veins of patients who often need at least 2 intravenous cannulas in place to
administer their fluid and insulin regimens.(Group 2014)
1.6 Conclusions
Serial blood tests are frequently required as part of guideline driven management of many
common conditions including diabetic emergencies. Laboratory processing can be slow,
delaying clinical care. Furthermore, serial testing is unacceptable to some patients and
practically difficult in others (who suffer from poor venous access).

29
Point of care testing produces results more rapidly, which may facilitate care by allowing
timely biochemical monitoring of acutely unwell patients, allow quicker triage of at risk
patients and allow more rapid discharge of patients who are low risk. However, several
studies have shown no differences in outcomes such as length of stay when this method is
used, although few studies have assessed more complex outcomes such as changes in
treatment practice or critical decision times. It is also unclear whether POCT is cost effective.
Many studies have compared POCT to laboratory processed venous blood samples. The use
of POCT in these studies seeks to overcome the delay inherent in laboratory assessments,
however the procedure of venesection is the same for the patient and remains painful and
unpleasant when required serially. There is evidence in some biological POCT tests that a
capillary sample may provide as a robust assessment as a venous sample. Capillary sampling
has many potential advantages; it is reputed to be less painful, can be performed on many sites
in rotation and would not impact on the availability of venous access points for future care.
However, few comparative studies have been conducted in an adult population, and fewer still
in an acutely unwell adult population. It would be important to determine the accuracy,
reliability and acceptability of POCT using capillary samples in an acutely unwell adult
population where serial blood tests are required for close monitoring purposes.
1.6.1 Blood Gases
Venous blood gases appear accurate enough to assess pH and bicarbonate. They cannot be
used to accurately assess pO2 or pCO2, however, can be used to rule out significant
hypercapnic respiratory disease. This has been evaluated by several high quality studies

30
including 2 meta-analysis with high patient numbers producing similar results and the same
conclusions.
Capillary blood taken from arterialised ear lobe samples are accurate for assessing arterial
pO2 especially at lower levels of pO2. They can also be used to assess pH, pCO2 and
bicarbonate. Finger prick capillary samples are similarly accurate in these parameters but
cannot be used to reliably estimate arterial pO2. These results come from good quality meta-
analysis by Zavorski. Due to their concerns with regard to bias, Bland-Altman 95% limits of
agreement analysis was not undertaken. This analysis, however, could have been useful for
individual clinicians to interpret the accuracy of these tests rather than basing conclusions
around the coefficient of determination. This does not allow easy interpretation of how close
this test is likely to be to the gold standard measurement and how likely it is to fall out of a
range which is clinically acceptable.
1.6.2 Electrolytes
Arterial potassium measurement through a blood gas analyser is generally accurate but may
not be accurate at lower concentration i.e. <3mmol/l, arterial sodium may show poor clinical
correlation compared to serum samples.
These conclusions come from several individual studies that appeared appropriately powered
in terms of patient numbers. Different methods of statistical analysis have been used for these
studies. The better quality studies have incorporate limits of agreement and compare these to
defined guidelines of acceptable accuracy (e.g. US CLIA). Where this has been done

31
potassium values are within the 0.5mmol/l limits, whereas sodium consistently falls short of
the required 4mmol/l. The sample studied have predominately been arterial BGA samples
and not venous. Further investigation in this area with pooled data, which included venous
BGA compared to laboratory gold standards, would help with these conclusions.
There still appears to be conflicting evidence in the evaluation of electrolytes analysed in
blood gas analysers outside of the normal physiological range when accurate testing is often
more crucial. It may be useful to have good quality studies with conclusions based around
Bland-Altman plots, which assesses accuracy over the range of values in adult populations to
further assess this.
I-stat analysers are generally accurate for the assessment of sodium, potassium, chloride, urea
and glucose using venous or arterial blood. This has been evaluated by several studies in the
1990s. These studies all focused on correlation rather than accuracy or assessment of
coefficients of variation, again making a clinical interpretation of their accuracy difficult.
From the literature there does not appear to be any evidence with regards to the accuracy in
the measurement of capillary blood samples in adults compared to standard testing when
measured in blood gas analyser for glucose, electrolytes, haemoglobin or lactate. There is
some evidence for the use of the i-stat analyser for measuring these parameters, however,
capillary samples alone are not usually separated in these studies. I-stat analysers have lacked
the ability to show significant benefits in patient care or economic benefits so this has led to
this method of testing failing to become widely adopted in Emergency Care. Blood gas

32
analysers are present in most emergency care areas already, however, and the use of capillary
testing using this method is unlikely to produce any significant increases in economic burdens
for departments but could impact on the ability to closely monitor patients without the
requirement and the problem of venous testing as discussed above.
1.6.3 Lactate
Venous lactate measured on a blood gas analyser shows good correlation and acceptable
clinical accuracy. This has been evaluated by a number of studies across a range of lactate
measurements. A possible correction formula has been devised, however, given the close
correlation and relatively small mean difference many clinician may assess the trends rather
than uses this adjustment. The diagnosis of a lactic acidosis may be overestimated when
using a venous blood gas by up to 36.2 % according to one study (53). However, I think it
could be argued that the arbitrary cut off for diagnosis of lactic acidosis may not be of great
clinical significance and the correlation may be more useful.
Conclusions in these studies were based around mean bias and correlation again making an
individual clinician uncertain about how likely the result of an individual test will fall outside
an acceptable range. No acceptable ranges of agreement were proposed in these studies and
do not appear to be present within the literature. The surviving sepsis campaign does not
differentiate to whether arterial or venous lactate should be used and suggests any variety that
is abnormal must be explained and uses a cut off of 4mmol/l as level suggestive of severe
sepsis (Dellinger RP 2013). The upper normal limit is 2 mmol. For this study a cut off of

33
level of agreement is suggested at 0.5mmol/l which is similar to the lower limit of mean bias
given in the studies above.
1.6.4 Glucose
POCT glucose machines are accurate in the normoglycaemic range, however, are less
accurate at lower glucose concentrations. Arterial or venous samples measured through a
blood gas analyser show good concordance in these ranges compared to venous serum
laboratory values and maybe more appropriate when urgent assessment or verification is
required. This has been well evaluated in a literature review of 21 articles with large patient
numbers.
1.6.5 Haemoglobin and haematological parameters
Haemoglobin can be accurately assessed with haemocue point of care tests with arterial or
venous samples (not capillary). There have been a number of high quality studies, which
confirmed accuracy within the required 1.0g/dl for 95 % of values. Blood gas analyser
arterial haemoglobin is less accurate but may be useful when very accurate measurement is
not required. Several large studies have shown accuracies within 1.5g/dl for 95% of values.
These studies do not explain the reasons for the required levels of accuracy and appear to use
arbitrary cut offs. There does not appear to be clear guidelines in the literature for this,
however, a separate study has stated “that transfusion of an erythrocyte concentrate (250 ml,
cHb 250 g/l) increases the haemoglobin concentration of a patient by about 10 g/l,
corresponding, for example, to a rise from 75 g/l to 85 g/l. Such a change should indeed be
registered. Because of this, the confidence limits (±2 SD of the difference) for measured
values of the instruments should lie within ±5 g/l.” (Rajamäki 1980). This then seems like a

34
reasonable cut off. These studies all compared arterial samples measured in a blood gas
analyser compared to the standard venous measurement. There does not appear to be good
studies comparing venous blood measured in a blood gas analyser compared in the same way.
1.7 Hypothesis and Aims
1.7.1 Hypothesis
Capillary blood sampling will provide biochemical and haematological results that are
accurate enough to guide clinical care when compared to the gold standard method of
analysis, i.e. either a venous sample processed in NHS clinical laboratories or a venous
sample processed in a blood gas analyser, in acutely unwell adults. Furthermore, capillary
blood sampling will be more acceptable to patients than standard venous sampling.
1.7.2 Aims
We compared venous and capillary blood sample results (from a finger and earlobe)
processed by a blood gas analyser to gold standard venous laboratory results in healthy
controls and patients admitted to the clinical decisions unit in the Queen Elizabeth Hospital.
We assessed if capillary POCT results for Na, K, Hb, Glucose and Lactate were sufficiently
accurate compared with venous blood gas and laboratory processed results. Accuracy was
determined by the criteria in table 1.6 for each criterion. We determined which sampling
modality patients prefer using a visual analogue scale.

35
Parameter Accuracy Measure Guideline Sodium 95% values within 4mmol/l US CLIA Potassium 95 % values within 0.5mmol/l US CLIA Haemoglobin 95% values within 0.5mmol/ Rajamäki A 1980 Glucose 95% values within 20% JBDS, IOS Lactate 95% values within 0.5 See section 1.6.3 above Table 1. 8 Aims for the accuracy of the study parameters

36
2. Materials and methods
2.1 Ethics and Governance
This study was conducted according to the ethical principles set out in the Declaration of
Helsinki (Rits 1964). All subject participation was supported by a favourable ethical review
provided by the National Research Ethics Service Committee - West Midlands (NRES
reference 14/WM/1057) and by sponsorship agreed by the University Hospital Birmingham
NHS Foundation Trust (UHBFT) Research and Development Committee (See Appendices 1-
2).
This study aimed to include patients with deranged biochemical parameters. Informed written
consent was obtained from all participants prior to any research procedures in individuals with
capacity to provide such consent. Delirium (defined as “an acute confusional state which is an
organically-caused decline from a previously attained baseline level of cognitive function”
(Gleason 2003)) is present in 14 – 56% of patients admitted with clinical conditions
associated with abnormal blood biochemistry (Inouye 1994). It was recognised that some
potential participants would not have capacity to provide fully informed consent at the time of
recruitment due to delirium associated with their clinical condition.
As this study was intrusive research, requiring the collection of blood samples and clinical
data, but not a clinical trial of an investigational medical product, the inclusion of these
patients was governed the Mental Capacity Act. (Affairs 2005) Capacity to consent was
determined by a senior physician prior to recruitment in all cases, as described in Section 3

37
and 30-33 of this Act. A potential participant was deemed not to have capacity where that
person had “an impairment of or disturbance to the mind or brain and as a result is unable to
• Understand the information relevant to the decision
• Retain the information
• Use or weigh the information
• Communicate their decision” (Affairs 2005)
Approval was given to include adult patients without capacity as it was agreed that this
research would specifically benefit patients with delirium secondary to deranged biochemical
parameters by potentially improving care pathways without imposing a disproportionate
burden and research of equal effectiveness could not be conducted if confined to patients with
capacity (due to the incidence rates of delirium in this patient population at the time of
admission).
For those participants unable to provide informed consent, informed assent was sought from
the patient’s personal consultee (PerCon) who may have been a relative, partner, carer or
close friend. The PerCon was informed about the trial by a member of the research team and
they were asked to give an opinion as to whether the patient should take part in the research,
taking into consideration what the patient’s wishes and feelings would be. If the PerCon
decided that the patient would wish participate, they were asked give their Assent in writing.
This project required recruitment while biochemical parameters were deranged, and this was
most common during the early phase of a patient’s admission and treatment pathway. In
some cases, it was not possible to identify a PersCon prior to potential recruitment. In these
circumstances, specific permission was granted to include adult patients without capacity

38
following the assent of a Professional Consultee – an independent senior doctor involved in
the care of the patient, under Section 32(9) of the Mental Capacity Act. As per section 33 of
the Act, patients were not recruited or were immediately withdrawn from the study if the
participant appeared to object to any study procedures or where the interests of the participant
supported withdrawal.
2.2 Overall study design
This project was an open study with participants recruited from a single hospital based centre
(UHB NHSFT, UK). The study had 3 parts. Validation (5 completed data sets), healthy
volunteers (20 completed data sets) and acutely unwell diabetic patients with capillary blood
sugars in the range of 10-15mmmol/L (20 completed data sets) and diabetic patients with
capillary blood sugars in the range of >15mmol/L (20 completed data sets). Diabetic patients
were chosen as these patients often also had deranged blood biochemistry (MS Elisaf 1996),
evidence of lactic acidosis (Cox) and alterations in haemoglobin concentrations (Thomas
2004) and therefore provided a wide range of biological parameters to study.
2.3 Validation
Since there are no comparator studies of capillary sampling in adults it was not clear of the
number of patients required to adequately power this study. This validation allowed
assessment of feasibility of sampling and intra-patient variability, the latter allowed power
calculations to ensure the patient study included sufficient numbers.

39
2.3.1 Participants
Healthy adults were recruited from an advertisement campaign in the Queen Elizabeth
Hospital Birmingham and University of Birmingham campus. Subjects were screened against
the inclusion and exclusion criteria (see table 2.1 and 2.2) and if the criteria were satisfied
participants were consented and recruited. Participants were recruited to allow 5 completed
data sets for the validation stage of the study. Hypoglycaemic patient were not included in the
study as carrying out the 4 methods of blood sampling would incur a time cost of 20-30
minutes, which was felt to be ethically inappropriate given their need for immediate care.
During this time period the potential for irreversible neurological sequelae would negate the
potential benefits of the intended study as POCT glucose meters are already validated for
states of hypoglycaemia and existing protocol have been devised with this testing modality in
mind.
Cohort Inclusion Criteria
Healthy volunteers Provision of signed informed consent Age Limit: Minimum 18 years old. No upper limit. Queen Elizabeth Hospital Staff Vital signs within the normal range No significant past medical history Not taking regular prescription medications Non-smokers
Diabetic Patients with a BM of 10-15 mmol/L and BM >15 mmo/L
Age Limit: Minimum 18 years old. No upper limit. Provision of signed informed consent or personal consultee POCT glucose meter results of 10-15mmol/L or >15mmol/L based on last recorded PICS result Confirmation of diabetes in the patients’ medical notes
Table 2. 1 Inclusion criteria for healthy volunteers and diabetic

40
Cohort Exclusion Criteria
Healthy volunteers Unable to provide signed informed consent Age limit: Below 18 years old. Not Queen Elizabeth Hospital Staff Observations outside the normal range Significant past medical history Taking regular prescription medications Smokers
Diabetic Patients with a BM of 10-15 mmol/L and BM >15 mmo/L
Age limit: Below 18 years old. No documented diagnosis of diabetes in the patient’s medical notes POCT glucose meter result of <10 mmol/L
Table 2. 2 Exclusion criteria for healthy volunteers and diabetic patients
Demographic details and physiological observations (Blood pressure, saturations, heart rate,
respiratory rate, temperature, and capillary refill time) were taken. Venous blood samples
were collected for processing in the NHS accredited hospital laboratories (the gold standard).
The venous sample was also used for blood gas analysis and an ear lobe and finger prick
capillary sample were taken. These samples were collected consecutively in alternating order
on 5 adults on 3 occasions over 1 week. See figure 2.1 below.
Figure 2. 1 Flow chart of validation study
2.3.2 Procedure for collecting the blood samples – Venous samples
Plasma venous blood gas samples and venous blood laboratory samples were obtained
simultaneously through a single venepuncture site. A disposable latex free BD
Healthy Volunteers from QEHB Staff (N=5 complete data sets)
Screening and Demographic Data
Valid Consent Obtained
Sample Collection Capillary Blood Venous Blood Plasma Blood
Repeat Testing Monday 0900 Wednesday 1400 Friday 2200

41
VACUETTE® tourniquet was applied midway up the right arm of the non-dominant hand.
The antecubital fossa was cleaned with a PDI Sani-Cloth CHG 2% disinfectant wipe for 30
seconds and the treated site allowed to dry for another 30 seconds. A 22G BD
VACUTAINER® Safety-Lok™ butterfly needle was used to collect 2mls of venous blood
gas sample into a Radiometer® PICO™ sampler followed by 2mls of venous blood plasma
collected in a lithium heparin tube, 3mls in an EDTA tube and 3mls in a plasma serum gel
tube (see figure 2.2).
Blood gas analysis was performed within 2 minutes using a point of care testing Cobas® b
221 blood gas analyser in the Clinical Decisions Unit or Emergency department of UHB and
venous blood was sent to the UHB laboratory service for analysis; cell counts and
biochemical analysis were performed in the Haematology and Biochemistry Laboratory at the
Queen Elizabeth Hospital, Birmingham. Laboratory samples were delivered using SDS
ac3000 pneumatic tube system to avoid delay and were processed as per standard practice
within University Hospital Birmingham laboratory procedure to reproduce usual clinical care.
All laboratory tests were conducted in NHS approved laboratories or their maintained
equipment by trained staff and met the standards required by good laboratory standards as set
out by the Medicines and Healthcare products Regulatory Agency (MHRA) (Gov.uk 2016).
The Cobas® b 221 blood gas analyser is a bench top blood gas analyser that gives results
within 2 minutes. This machine has 1 point calibration every hour and 2 point calibration
every 12 hours. The performance data for the machines can be seen in appendix 3.

42
2.3.4 Ear and finger prick samples
The earlobe was cleaned with a PDI Sani-Cloth CHG 2% disinfectant wipe and the treated
site was allowed to dry for 30 seconds. Following this a thin film of transvasin® cream was
placed on the ear lobe to arterialise the ear lobe capillaries and left on for 10 minutes.
Patient recruited and consented
Samples taken consecutively as below with
alternating order with each patient (i.e 1,2,3;
2,3,1; 3,1,2; 2,1,3)
Figure 2. 2 Illustrating the blood taking procedure. The shaded area should be completed within 20 minutes

43
The earlobe was then cleaned again with the PDI Sani-Cloth CHG 2% disinfectant wipe for 30
seconds and the treated site was allowed to again dry for another 30 seconds. The ear lobe
was then coated with a thin film of white soft paraffin prior to being punctured with a
Unitstix® 3 lancing device and the earlobe gently squeezed until a drop of blood was
expressed. A heparinised RAPIDLyte® Multicap-S plastic capillary tube was filled with a
150µl column of blood and closed at both ends with rubber caps as provided by the
manufacturer. Blood gas analysis was performed immediately using a point of care testing
Cobas® b 221 blood gas analyser at the Queen Elizabeth Hospital Birmingham. The same
procedure occurred for the finger prick sample using the third or fourth finger of the non-
dominant hand (See above figure 2.2).
2.3.5 Use of Transvasin Cream to collect earlobe samples
There was concern that the Transvasin cream itself may impact results due to the ingredients
contained within it (although there is no evidence this cream alters capillary blood gas results
including PaO2 and PaCo2) (Zavorsky 2006). In order to assess this, earlobe capillary
samples collected both using and not using Transvasin cream were compared in 3 healthy
volunteers prior to commencing the validation part of the study.
A small amount of Transvasin cream was applied to one earlobe on the anterior surface.
Capillary blood was then taken using a lancet and capillary tube as described in 2.3.3
sequentially from the ear lobe without the Transvasin cream followed by the ear lobe with the
Transvasin cream and then processed in the blood gas analyser and the results compared.

44
2.3.6 Sample size calculation
For the validation study, the results for intra-patient variability using co-efficient of variation
and the relationship between samples were compared. The parameter with the highest
variability would be predicted to have the highest sample number requirements so was used to
ensure adequate sample numbers for all parameters being assessed.
Given the acceptability criteria described in section 2.4.2, sample size was based on the
accuracy of the estimates of the percentages that were within 20% of the gold standard test. A
previous study comparing blood glucose has suggested a sample size of 16 provides such
power (R Boyd 2005).
2.4 Main Study
2.4.1 Healthy participants and acutely unwell subjects
A further 15 healthy patients (total 20) were recruited in the same way as 2.3.1 and were
screened against the same inclusion and exclusion criteria (as per table 2.1 and 2.2). These
participants had blood samples taken as per 2.2.2 and 2.2.3 on a single occasion only. The
adult patients (20 diabetic patients with capillary blood sugars in the range of 10-15mmmol/L
and 20 diabetic patients with capillary blood sugars in the range of >15mmol/L) were
recruited following their acute admission to the Queen Elizabeth Hospital Clinical Decisions
Unit. Suitable patients were identified from the Clinical Decisions Unit Prescribing

45
Information and Communications Service; an online database at QEHB that records patient’s
physiological parameters, laboratory datasets and medication prescribing and administration.
These patients were then screened against the inclusion and exclusion criteria for diabetic
patients (see table 2.1 and 2.2) and consented. Blood tests were taken as per 2.2.2 and 2.2.3.
Subjects then scored their experience using a visual analogue score as described in section
2.4.2 below.
Figure 2. 3 Flow chart for healthy volunteers and acutely unwell adults
2.4.2 Acceptability criteria
As per the. section 1.7.2 of the introduction the acceptable level of accuracy were chosen
using the criteria in table 2.3 below.
Parameter Accuracy Measure Guideline Sodium 95% values within 4mmol/l US CLIA Potassium 95 % values within 0.5mmol/l US CLIA Haemoglobin 95% values within 0.5mmol/ Rajamäki A 1980 Glucose 95% values within 20% JBDS, IOS Lactate 95% values within 0.5mmol/l See section 1.6.3 above Table 2. 3 Acceptability Criteria
2.4.3 Experience rating

46
Each patient had their experience of the 3 methods of taking blood (ear lobe prick, finger
prick and standard venepuncture) documented via a visual analogue scale for assessing pain
(See figure 2.4). Given the perceived relatively low amount of pain for these procedure this
was deemed most appropriate given it has been shown to be a sensitive measure of pain and is
easy to use (Huskisson 1974). It has no formal validation as there is no gold standard for pain
measurement and in fact other pain measures use this method for their own validation.
(Huskisson 1974, A. Hawker 2011)
Pain Score (out of 10)
No Pain Worst pain imaginable
Figure 2. 4 Visual analogue pain scale used in patients’ experience of the 3 different methods of blood taking.
2.5 Training for ear lobe prick
Prior to commencing the validation work for the study experience was gained in taking ear
lobe capillary blood samples by a placement with the Home Oxygen Assessment Clinic at the
Queen Elizabeth Hospital, Birmingham. This is the only area of the hospital currently which
regularly uses capillary testing. Here, arterialization of the capillary blood occurs by first
applying transvasin ® cream. This is a heat rub cream used in the symptomatic treatment of
muscular pain which not only helps with arterialisation of the blood but also improves flow
allowing successful collection via a capillary tube. This method of sampling had not yet been
considered within our research protocol. During the feasibility assessment part of this study
ear prick samples were initially trialed without the use of the Transvasin ® cream.

47
2.6 Statistical evaluation and sample size calculation
All statistical evaluation was conducted using SPSS Statistics (IBM, UK, Version 20) and
Microsoft Excel (version 2012). Mean measurement error (ME) values for the three samples
(venous blood, finger prick and earlobe sample) were assessed and the whether there was a
significant difference between the groups determined using Friedman’s test when there were
more than one set of paired groups for comparison and Wilcoxon-signed ranks test when there
was one. Post-hock analysis using Friedman’s test pair wise comparisons was used when
there was a significant difference between the sampling methods. Pearson’s correlation
coefficient was used to determine the degree of correlation of the finger and earlobe samples
with the laboratory result.
To ensure adequate sample size in the patient group the first 6 patient samples were assessed.
The parameter showing the highest variability as per the validation study was used to
calculate sample size. This was calculated according to the mean and standard deviation of
the percentage MEs in this group with a power of 95% and an α of 0.05 and will determine
the number of participants required to detect 5% difference between the formal laboratory
analysed blood test and the capillary blood test and so determine whether there is a
statistically significant difference between these results. This was calculated for each
sampling method i.e. finger prick, ear prick and venous BGA results.
A Bland- Altman plot was used to plot the difference between capillary derived and
laboratory blood test result against the laboratory blood level. This plot provides a graphical

48
comparison of the level of agreement between two methods of assessment. As the procedure
removes most of the variation between subjects and leaves the measurement error, it is
expected that the differences will be normally distributed. This was tested using SPSS
Statistics (IBM, UK, Version 20) using the Kolmogorov-Smirnov or Shapiro-Wilk test and
also assessed using a Q-Q plot. A value of approximately less than 0.1 for the Kolmogorov-
Smirnov test would suggest an approximate normal distribution. The Q-Q plot is a graphical
method for comparing 2 variables and assessing theoretical distributions. Interpretation
requires skill and assistance with this has been provided by an experienced statistician. When
there is a high level of agreement, the mean measurement error (ME) (or mean bias) would be
close to zero, and the limits of agreement of the MEs narrow.
To show whether there were statistically significant differences between the sampling
methods as well as between the healthy and patient groups for the widths of the limits of
agreement, an F test was used. This test calculates whether there is a significant difference
between variance. As the widths of the limits of agreement are directly proportional to the
standard deviation this test can be used to show whether the difference between these is
statistically significant. A value of greater than 0.05 would show that there is no statistically
significant difference in the widths of the limits of agreement.
When there is a pattern of correlation which is not equal across the range of values then linear
regression analysis was used to model the distribution and allow estimates of the 95%
prediction intervals (where 95% of the MEs are predicted to fall). This was done using the
SPSS statistical software which can model the data and in doing so enabled predictions of the

49
mean ME for any given gold standard value including 95% prediction intervals. In doing so it
enables a formula to be devised for any given gold standard value. When the results could not
be modelled by linear regression and the results of normality testing did not fit an
approximate normal distribution weighted average centile were calculated from SPSS to
enable an assessment of the calculated limits of agreement.
It was predicted that the healthy control group may be different from the patient group for age
given that they are selected from hospital staff who are within working age when compared
with a patient group that included patients of any age acutely admitted to hospital. For this
reason the results from each group were split into quintiles and mean bias calculated and
compared. Statistical difference between the quintiles was then assessed using Kruskal Wallis
test. If there was no significant difference across the quintiles then it is likely that age is not a
significant factor when determining differences between sampling modalities tested and the
gold standard.
Using the same assumptions of a normal distribution of MEs the proportion of patients within
the acceptability criteria for each of the parameters were also calculated. Where a parameter,
did not demonstrate a normal distribution for the MEs confidence interval were also included.
Analysis of the experience rating was done by calculating the median values for pain scores as
well as the quartiles. Comparisons between the sampling modalities and between the healthy
and patient groups was done using Friedman’s analysis and post hoc analysis with Wilcoxon-
signed ranks test.

50
3. Results
3.1 Validation: The use of Transvasin cream
Transvasin cream is used to increase blood vessel dilatation and thus enhance capillary
sample collection in some centres. However, it was unclear if this might alter biochemistry
readings or whether this was needed in the current study. To assess this a validation study
was conducted to assess the impact of Transvasin cream use on blood parameters, which
included 3 subject (see 2.3.4.).
3.1.1 Results of Transvasin Feasibility testing
Table 3.1 shows the absolute values and percentage difference in electrolytes between
samples where Transvasin cream was used and where it was not been used prior to
collecting capillary ear prick samples, in three subjects.
Participant 1 2 3
Parameter With TV
Without TV
% Difference
With TV
Without TV
% Difference
With TV
Without TV
% Difference
Sodium mmol/L
137.8 137.8 0 141.4 140.4 -0.71 139 136 -2.21
Potassium mmol/l
4.79 4.63 -3.46 4.31 4.27 -0.94 4.22 5.52 -30.1
Bicarbonate mmol/l
22.9 22.9 0 23.9 24.2 1.24 23.6 Insufficient Insufficient

51
Ionised Calcium mmol/l 1.176 1.194 1.51 1.21 1.197 -1.09 1.188 1.192 0.34
Chloride mmol/l 104.
3 103.7 -0.58 103 103.6 0.58 102.5 103.3 0.77
pH 7.426 7.41 -0.21 7.39
9 7.419 0.27 7.428
Insufficient Insufficient
Table 3. 1 Comparison of electrolytes between capillary ear prick sample with and without Transvasin TV cream
Overall, the use of Transvasin cream greatly improved the technical ability to collect samples,
by enhancing blood flow. There were difficulties in acquiring the required volume of blood
from the 3rd participant when no Tranvasin was used, and so the dataset is incomplete. The
first 2 participants demonstrate little intra-person variability between the electrolytes using the
2 sampling methods with a maximum of 4.22 % variation. However, there was a difference in
potassium concentrations between the two sampling methods with the 3rd participant. This
might reflect the technical difficulties experienced in collecting the sample, or the duration of
the collection time.
It was considered necessary to use Transvasin cream for the collection of ear prick samples as
it was deemed not feasible to gain the required volumes of blood without using this cream.
Furthermore, the cream did not appear to cause significant differences in electrolyte
concentrations, overall.
3.2 Validation study; Intra-patient variability
Participants were recruited to the validation study until 5 complete data sets were achieved.
This resulted in a total of 8 participants recruited to this part of the study.

52
3.2.1 Population demographics for validation work
Table 3.2 below shows the demographics for participants involved in the validation study.
These were healthy subjects recruited from hospital staff members.
Healthy subjects Number (n) 8 Age: Mean Median Range
32.8 28
24-49 Gender Male Female
4 4
Table 3. 2 The demographic of the participants in the validation study
3.2.2 Validation results
Samples were collected consecutively in alternating order on 5 adults on 3 occasions over 1
week, as shown in figure 2.2 (methods). Tables 3.3a – 3.3d show the results of the validation
study. Each table provides the mean of the 3 blood sample results for each sampling
modality with the standard deviation (SD), and the coefficient of variation (CV) for each
subject. Table 3.3a show the results for glucose. The median CV for the laboratory sample
was 8.9% (IQR 7.9 – 10.5), the median CV for the finger prick sample was 12.6% (IQR; 11.4 –
18.0) and for the ear prick sample was 12.7% (IQR 9.3-20.3).
Finger Prick Ear Prick Laboratory Result
Participant Mean (mmol/l)
SD
CV (%) Mean (mmol/l)
SD CV (%) Mean (mmol/l)
SD CV (%)
1 5.36 0.98 18.27 Incomplete data 4.46 0.57 12.97
2 Incomplete date 6.33 0.52 8.29 5.5 0.54 9.73
3 6.73 0.55 8.17 6.9 0.85 12.3 5.8 0.5 8.62
4 Incomplete Date Incomplete Data 5.53 0.51 9.27
5 Incomplete Data 5.47 0.15 2.79 4.36 0.35 8.04

53
6 6.5 0.82 12.59 6.9 1.93 27.95 5.8 1.2 20.68
7 6.6 0.75 11.43 6.8 0.88 13.07 5.53 0.31 5.52
8 6.13 1.10 17.96 5.73 1.30 22.70 4.77 0.35 7.36 Table 3.3 a Result of the validation study for glucose. It shows the mean, standard deviation (SD) and coefficient of the variance (CV) of the 3 samples taken for each patient for the finger prick, ear prick and laboratory samples.
Table 3.3b show the results for sodium. The median CV for the laboratory sample was 0.6%
(IQR 0.5– 0.8), the median CV for the finger prick sample was 0.8% (IQR; 0.5 – 0.8) and for
the ear prick sample was 0.8% (IQR 0.5-0.8).
Table 3.3 b. Result of the validation study for sodium. It shows the mean, standard deviation (SD) and coefficient of the variance (CV) of the 3 samples taken for each patient for the finger prick, ear prick and laboratory samples.
Table 3.3c show the results for potassium. The median CV for the laboratory sample was
5.6% (IQR 4.8– 7.3), the median CV for the finger prick sample was 5.5% (IQR; 4.8 – 6.7) and
for the ear prick sample was 5.5% (IQR 3.6-6.0).
Table 3.3 c Result of the validation study for potassium. It shows the mean, standard deviation (SD) and coefficient of the variance (CV) of the 3 samples taken for each patient for the finger prick, ear prick and laboratory samples.
Finger Prick Ear Prick Laboratory Result
Participant Mean (mmol/l)
SD
CV (%)
Mean (mmol/l)
SD CV (%)
Mean (mmol/l)
SD CV (%)
1 140.5 0.707 0.503 139.8 0.707 0.552 141.3 0.772 0.667
2 142.4 0.579 0.407 142.6 1.56 1.10 141.0 0.816 0.579
3 141.9 0.835 0.588 140.6 1.08 0.767 139.7 1.53 1.09
4 140.1 0.611 0.436 138.9 1.12 0.803 139.3 1.15 0.829
5 142.2 1.78 1.25 140.0 1.23 0.878 141.7 0.577 0.408
6 140.2 1.75 1.25 138.9 1.15 0.830 139.3 1.53 1.10
7 143.1 1.27 0.885 140.4 0.173 0.123 138.3 0.577 0.417
8 140.5 0.874 0.622 Incomplete data 140.2 0.902 0.643
Finger Prick Ear Prick Laboratory Result
Participant Mean (mmol/l)
SD
CV (%)
Mean (mmol/l)
SD CV (%)
Mean (mmol/l)
SD CV (%)
1 4.19 0.278 6.63 4.27 0.227 5.32 4.2 0.082 1.94
2 4.36 0.139 3.19 4.41 0.247 5.60 4.367 0.04 0.92
3 4.09 0.203 4.97 4.19 0.375 8.95 4.33 0.208 4.80
4 4.89 0.915 18.7 4.69 0.271 5.77 4.7 0.265 5.63
5 3.8 0.203 5.34 4.17 0.08 1.92 4.23 0.306 7.22
6 4.16 0.474 11.4 4.40 0.183 4.17 Incomplete data
7 3.65 0.240 6.57 3.95 0.270 6.82 4 0.3 7.5
8 4.09 0.221 5.41 3.98 0.007 0.18 4.33 0.321 7.42

54
Table 3.3d show the results for haemoglobin. The median CV for the laboratory sample was
1.9% (IQR 1.0– 3.5), the median CV for the finger prick sample was 3.4% (IQR; 2.0 – 4.4) and
for the ear prick sample was 3.2% (IQR 2.1-3.6).
Table 3.3 d Result of the validation study for haemoglobin. It shows the mean, standard deviation (SD) and coefficient of the variance (CV) of the 3 samples taken for each patient for the finger prick, ear prick and laboratory samples.
These results show intra-patient variability was greatest in the glucose sampling with a co-
efficient of variation up to 28% in the finger prick sample, 27% in the ear prick sample and
21% in the laboratory result. As this was higher than that of the sodium, potassium, and
haemoglobin, this parameter was used to formulate the sample size calculation.
3.2.3 Sample size calculations
Sample size calculation was based on the first 6 patient group glucose results (as per the
validation study). The mean difference for each sampling method was 4.18, 6.21 and 3.05
with standard deviations of 4.18, 8.31 and 4.06 for finger prick, ear prick and venous BGA
Finger Prick Ear Prick Laboratory Result
Participant Mean (g/l)
SD
CV (%)
Mean (g/l)
SD CV (%)
Mean (g/l)
SD CV (%)
1 Incomplete data Incomplete data 135 2.83 2.10
2 Incomplete data 152.1 0.928 0.610 147 1.41 0.961
3 140.5 5.87 4.18 146.1 6.47 4.43 135.7 4.04 2.98
4 Incomplete data 155.8 5.05 3.24 144.7 0.577 0.399
5 151.8 7.65 5.04 147.8 5.36 3.62 144.7 5.03 3.48
6 154.8 2.99 1.93 Incomplete data 146.3 1.53 1.04
7 151.1 0.351 0.232 Incomplete data 138.3 1.53 1.10
8 145.5 6.54 4.50 137.7 2.89 2.1 136. 2.08 1.52

55
samples respectively. With an α of 0.1 and β of 0.05 this gives sample size estimations of 13,
23 and 23 for each sampling method. With the proposed combined total of 40 patients in
the patient group this was therefore deemed adequate.
3.3 Participant Demographics
Table 3.3 below shows the demographics of the healthy participants and patient groups
within the study.
Healthy subjects Diabetic subjects with blood glucose
between 10 – 15 mmol/l
Diabetic subjects with blood glucose
>15 mmol/l
Number (n) 23 25 23 Age in years:
Mean Range
33
24-49
67
37-87
65
19-84 Gender
Male Female
9 14
13 12
14 9
Ethnicity Caucasian
Asian Afro-Caribbean
Other
12 10 0 1
15 6 4 0
17 3 3 0
Table 3. 3 Demographic date for healthy participants and acutely unwell patients
Figure 3.1 (below) shows a consort diagram outlining sample collection in all participants

56
Figure 3. 1 Consort diagram outlining sample collection in all participants
3.4 Laboratory Parameters
Earlobe, finger prick and the venous blood sample analysed using the blood gas analyser
(BGA) was compared with the gold standard laboratory processed samples. Data for each
participant, sampling technique and parameter as well as admitting diagnosis for the patient

57
group are presented in appendices 4-5. Analysed data are presented for each parameter
sequentially below.
3.4.1 Glucose
The acceptability criteria for glucose was that results should be within 20% of the gold
standard plasma sample.
Table 3.6 -3.8 summarise the results from the glucose BGA results for the capillary finger
prick, ear prick and venous samples compared to the gold standard venous plasma glucose
laboratory result. The full results can be seen in appendix 1. Results have been divided into
healthy participant, patient and the combined dataset. The mean measurement error (ME)
or bias, standard deviation and the Bland-Altman 95 % limits of agreement (LOA), as well as
the Pearson’s correlation coefficient between the tested samples and laboratory samples
have been calculated. Mean bias and LOA have also been calculated as a percentage of the
plasma glucose level to allow comparison with the ISO guidelines.
Normality testing of the 3 methods was conducted to test whether the MEs were normally
distributed so the calculations of the limits of agreement are valid. This has also been done
for the percentage measurement error, as shown in table 3.4.
Kolmogorov-Smirnov Shapiro-Wilk
Statistic df Sig. Statistic Df Sig.
FP 0.117 69 0.021 0.913 69 0
EP 0.272 60 0 0.426 60 0
VP 0.094 69 .200* 0.938 69 0.002
FP % 0.171 69 0 0.879 69 0
EP% 0.115 59 0.049 0.92 59 0.001
VP % 0.087 69 .200* 0.977 69 0.239 Table 3. 4 Normality testing of the MEs and percentage MEs between Finger Prick (FP), Ear Prick (EP) and Venous (VP) BGA glucose and standard laboratory values

58
When these results were compared to the Q-Q plot, there was an approximate normal
distribution of the ME results for the finger prick and the venous prick as well as the ear
prick and venous prick percentage measurement error, as the Kolmogorov-Smirnov result
was approximately 0.1 or less and the Q-Q plot was in keeping with a normal distribution.
However, ear prick MEs and finger prick percentage MEs did not equate to a normal
distribution, as the Kolmogorov-Smirnov result was greater than 0.1 and the Q-Q plot was
not in keeping with a normal distribution so assessment of these limits of agreement are not
valid.
There were 6 incomplete data sets for the ear prick sample. A further sample was reported
as out of range for the ear prick sample on the BGA with no value given and could not be
included and 1 sample from each of the finger prick and ear prick groups could not be
compared as a plasma sample was reported as not received by the laboratory staff. A
further ear prick sample had one result that showed extreme variation from the laboratory
sample (0.8mmol/l compared to plasma value of 19.6). This sample was difficult to collect
and had a prolonged collection time. Analysis has included and excluded this result in order
to demonstrate the effect of this outlier.
Table 3.5 below shows the results for the blood glucose finger prick samples. Both the
patient groups demonstrated a strong correlation with a Pearson’s correlation co-efficient (r)
of 0.983 and 0.989 respectively. The healthy participant group did not show the same
strength of correlation with an r of 0.566. The mean ME (bias) in the patient group was very

59
similar to the laboratory plasma sample of 0.208mmol/l (1.97% bias). The healthy
participant group did not show this level of proximity with mean bias of 0.377 (7.74%). The
limits of agreement of the MEs in the healthy participant group (where 95% of the
differences values are predicted to fall) were within -1.43 to 2.18mmol/l of the plasma
sample. This was a narrower range than the range for the patient group of -2.13 to 2.54,
however when expressed as a percentage (as per the ISO guidelines) of the laboratory
sample the healthy participant limits of agreement were much wider with limits of
agreement ranging from -29.1% to 44.7% compared to the patient group -13.2 to 17.1%.
The percentage MEs in this group as mentioned was not normally distributed so
interpretations based on these would not be valid.
Participant group
Complete data set
Mean bias mmol/l / % bias
Standard Deviation of the MEs mmol/l (%)
Lower 95% LOA / (%)
Upper 95% LOA (%)
Pearson’s Correlation co-efficient
Healthy Participants
22/23 0.377 (7.74%)
0.92 (18.8%)
-1.43 (-29.1%)
2.18 (44.7)
0.566
Diabetic patients
47/48 0.208 (1.97%)
1.19 (7.72)
-2.13 (-13.2)
2.54 (17.1)
0.983
Combined 69/71 0.26 (3.81%)
1.11 (12.5)
-1.91 (-20.8)
2.43 (28.4)
0.989
Table 3. 5 Results of finger prick glucose compared to venous laboratory plasma samples in healthy participant group, patient group and combined results.
Table 3.6 shows the results for the finger prick glucose samples compared to the plasma
laboratory samples and have been analysed with and without the outlying sample as
discussed above. When the outlier was removed, the correlation in the patient group and
combined groups was strong with a Pearson’s correlation co-efficient (PCC) of 0.978 and
0.987, respectively). Although still strong, the correlation was weaker in the healthy

60
participant group (0.724). When the outlying sample was included the correlation between
finger prick and laboratory glucose results was weaker, with PCC for the patient and
combined group of 0.833 and 0.978 respectively. The mean bias in each of the healthy
participant, patient and combined groups (with or without the outlier) were not as close to
the plasma glucose results as the finger prick samples, with values of 0.69 (13.3%) for the
healthy group, 0.358 (6.93%) for the diabetic group with the outlier and 0.85 without. The
limits of agreement for the ear prick MEs were not normally distributed as discussed above
so are not valid. The MEs as percentages in this group, however were normally distributed
and demonstrated quite weak correlations in the healthy group with LOA of -20.1% to
46.7%. This was improved in the patient group when the outlier was excluded with LOAs of
-12.6 to 26.5 and the 2 groups combined -16.4 to 34.6%.
Participant group
Complete data set
Mean bias mmol/l ( % bias)
Standard Deviation of the MEs mmol/l ( %)
Lower 95% LOA mmol/l ( %)
Upper 95% LOA mmol/l (%)
Correlation co-efficient
Healthy Participants
20/23 0.69 (13.3%)
0.863 (17%)
-1.00 (-20.1 %)
2.38 (46.7%)
0.724
Diabetic patients
40/48 0.358 (4.36%)
3.36 (9.97%)
-6.22 (-32.9%)
6.93 (41.6%)
0.833
Diabetic patients - without outlier result
39/48 0.85 (6.93%)
1.16 (9.97%)
-1.42 (-12.6%)
3.13 (26.5%)
0.978
Combined 60/71 0.46 (7.35%)
2.78 (18.8%)
-4.98 / -29.4%
5.91 (44%)
0.91
Combined - without outlier
59/71 0.8 (9.11%)
1.07 (13.0%)
-1.29 / -16.4%
2.89 (34.6%)
0.987
Table 3. 6 Results of Ear prick sampling compared to venous laboratory plasma samples in healthy participant group, patient group and combined results.

61
Table 3.7 describes the venous BGA glucose results compared to the venous plasma results.
In concordance with all BGA samples the mean bias was consistently higher than the plasma
samples in both groups with a mean bias of 0.282mmol/l (5.37%), 0.211mmol/l (2.12%) and
0.23mmol/l (3.15%) in the healthy, diabetic and combined groups respectively. The LOAs
were also narrower than for the ear prick and finger prick at -1.19 to 1.75mmol/l (-22.2 to
33.1%) in the healthy participant group, -1.63 to 2.05 (-7.38 to 11.6%) in the patient group
and -1.4 to 1.9 (-14 to 20.6%) with the groups combined. This was reflected by the strong
correlation seen in both the diabetic and combined group both with PCCs of 0.993).
Participant group
Complete data set
Mean bias mmol/l (%)
Standard Deviation of the MEs mmol/l (%)
Lower 95% LOA (%)
Upper 95% LOA (%)
Correlation co-efficient
Healthy Participants
22/23 0.282 (5.37)
0.751 (14.1)
-1.19 (-22.3)
1.75 (33.1)
0.739
Diabetic patients
47/48 0.211 / (2.12)
0.940 (4.85)
-1.63 (-7.38)
2.05 (11.6)
0.993
Combined 69/71 0.23 (3.15)
0.879 (8.9%)
-1.4 (-14.0)
1.9 (20.6)
0.993
Table 3. 7 Results of Venous BGA glucose compared to venous laboratory plasma samples in healthy participant group, patient group and combined results.
Figure 3.2 – 3.4 are Bland-Altman plots that compare the finger prick differences compared
to the laboratory plasma samples with combined patient and healthy participant followed by
each of these individually. A graph showing a mean bias close to 0 with narrow limits of
agreement lines would confer a comparable test. To assess this test against our aim of
showing a glucose measurement within 20% of the laboratory samples for 95% of the values,
a line showing the 20% limits is provided.

62
Figure 3.2 describes the finger prick glucose compared to the laboratory plasma glucose in
healthy participants. Despite the mean difference being close to 0, the 95% limits of
agreement were wide and within this normoglycaemic range (4.4-6.1mmol/l fasting) do not
lie within the 20% of plasma values required by the ISO guidelines.
Figure 3. 2 Bland-Altman Plot for finger prick glucose BGA results compared to laboratory plasma glucose in Healthy participants
Figure 3.3 describes the Bland Altmann plots for finger prick glucose compared with the
laboratory sample for the diabetic patient group. The mean difference was close to 0 and
the 95% limits of agreement cross the required 20% of the plasma value in the
hyperglycaemic range with all values above 10mmol/l being within 20% of the plasma value.
The limits of agreement, however, cross at approximately 12mmol/l.
Figure 3. 3 Bland-Altman Plot for finger prick glucose BGA results compared to laboratory plasma glucose in acutely unwell diabetic patients
-2
-1
0
1
2
3
4
0 2 4 6 8 10
Dif
fere
nce
(Fi
nge
r p
rick
-P
lasm
a gl
uco
se m
mo
l/l)
Plasma Glucose mmol/l
Mean Difference = 0.38
Lower 95% LOA = -1.43
Upper LOA = 2.18
Serum Value +20%
Serum Value -20%
-10
-8
-6
-4
-2
0
2
4
6
8
10
0 10 20 30 40 50
Dif
fere
nce
(fi
nge
r P
rick
-P
lasm
a G
luco
se m
mo
l/l)
Plasma Glucose Value mmol/l
Mean difference = 0.21
Lower 95% LOA = -2.13
Upper 95% LOA = 2.43
Serum value + 20%
Serum Value + 20%

63
Figure 3.4 describes the combined results for all participants, comparing finger prick to
laboratory glucose. Within the hyperglycaemic range (above 10mmol/l), the 95% limits of
agreement approach the required accuracy of within 20% of the plasma value, however,
within the normoglycaemic range many values do not satisfy this criteria. The mean bias
remained slightly higher than the plasma value.
Figure 3. 4 Bland-Altman Plots for finger prick glucose BGA results compared to laboratory plasma glucose in healthy participants and acutely unwell diabetic patients combined.
The bland altman plot of the percentage differences for ear prick glucose compared with
laboratory results are shown in Figures 3.5 – 3.7. The outlying result has been excluded
because when included, the graphs were highly distorted as the y axis was extended to the
extent where the other values were not easily distinguishable.
Figure 3.5. is the Bland Altman plot comparing the healthy participants’ ear prick glucose
results to the laboratory sample, using percent biases. The mean difference was 13.3%, as
-10
-8
-6
-4
-2
0
2
4
6
8
10
0 10 20 30 40 50
Dif
fere
nce
(fi
nge
r p
rick
-p
lasm
a va
lue
mm
ol/
l)
Plasma Glucose Value mmol/l
Mean Difference = 0.262
Lower 95% LOA = -1.91
Upper 95% LOA = 2.43
Serum Value + 20%
Serum Value - 20%

64
opposed to zero (which would represent a comparable test) and the 95% limits of
agreement were not within 20% of the plasma glucose values.
Figure 3. 5 Bland-Altman Plots for ear prick glucose BGA percentage bias compared to laboratory plasma glucose in healthy participants
Figure 3.6 compares the ear prick and laboratory glucose for the patient group. This
demonstrates improved comparability with a mean difference closer to 0 and narrower
limits of agreement, however, only the lower limit of agreement of 12.61% was within the
required 20% of plasma values.
Figure 3. 6 Bland-Altman Plots for ear prick glucose BGA percentage bias compared to laboratory plasma glucose in acutely unwell diabetic patients
-40
-20
0
20
40
60
80
0 2 4 6 8 10
% D
iffe
ren
ce (
fin
ger
pri
ckl -
pla
sma
glu
cose
mm
ol/
l)
Plasma Glucose (mmol/l)
Mean % Difference = 13.33%
Lower 95% LOA = -20.07%
Upper 95%LOA = 46.72%
-30
-20
-10
0
10
20
30
40
50
60
0 10 20 30 40 50
% D
iffe
ren
ce (
Fin
ger
pri
ck -
pla
sma
glu
cose
mm
ol/
l)
Plasma Glucose mmol/l
Mean Difference = 6.94
Lower 95% LOA = -12.61
Upper 95%LOA = 26.48

65
Figure 3.7 shows the combined results for all participants (healthy and diabetic). The LOA
ranged from 16.4 to 34.63, and did not satisfy the ISO guidelines. There was also a
substantial deviation from 0 for the mean percentage difference (9.1%).
Figure 3. 7 Bland-Altman Plots for ear prick glucose BGA percentage bias compared to laboratory plasma glucose in healthy participants and acutely unwell diabetic patients combined.
Figure 3.8-3.9 show the Bland Altmann plots for the venous BGA glucose result compared to
the laboratory sample result. This was normally distributed for both the ME and the
percentage ME. Figure 3.8 shows the percentage differences (MEs) in healthy participants
comparing venous BGA glucose to the laboratory sample. In this predominantly
normoglycaemic range the LOA still failed to fall within the ISO guidelines of 20% (being
22.3% and 33.0%) and the mean percentage difference was still relatively high at 5%.
-30
-20
-10
0
10
20
30
40
50
60
70
0 5 10 15 20 25 30 35
% D
iffe
ren
ce (
Fin
ger
Pri
ck -
pla
sma
Glu
cose
mm
ol/
l)
Plasma Glucose (mmol/L)
Mean % Difference = 9.11
Lower 95% LOA = 16.42
Upper 95% LOA = 34.63

66
Figure 3. 8 Bland-Altman Plots for Venous glucose BGA percentage bias compared to laboratory plasma glucose in Healthy participants
Figure 3.9 compares the venous BGA glucose with the laboratory sample in the patient
group. There is good concordance in values with the LOA within the ISO guideline of 20%
and a mean difference of 2% in these samples.
Figure 3. 9 Bland-Altman Plots for Venous glucose BGA percentage bias compared to laboratory plasma glucose in acutely unwell diabetic patients
Figure 3.10 compares venous BGA with laboratory samples for both patients and healthy
participants, combined. The LOA fall just outside the set limits of 20% with an upper LOA of
20.7%. The figure also demonstrates that there was more discordance in normoglycaemic
compared with hyperglycaemic values.
-30
-20
-10
0
10
20
30
40
0 2 4 6 8 10
% D
iffe
ren
ce (
Ven
ou
s B
GA
gl
uco
se -
pla
sma
mm
ol/
l)
Plasma Glucose mmol/l
Mean % Difference = 5.37%
Lower 95% LOA = -22.32%
Upper 95%LOA = 33.06%
-10
-5
0
5
10
15
0 10 20 30 40 50
% D
iffe
ren
ce (
Ven
ou
s B
GA
glu
cose
-Se
rum
Glu
cose
mm
ol/
l)
Plasma Glucose mmol/l
Mean Difference = 2.12%
Lower 95% LOA = -7.38%
Upper 95%LOA = 11.62%

67
Figure 3. 10 Bland-Altman Plots for Venous glucose BGA percentage bias compared to laboratory plasma glucose in Healthy participants and acutely unwell diabetic patients combined.
Results compared to acceptability criteria
The acceptability criteria for glucose was derived from the IOC guidelines and state 95% of
results should fall within 20% of a plasma sample. Under the assumptions used to calculate
the 95% limits of agreement, the proportion lying within these guidelines have been
calculated. Table 3.8 below shows these results. It shows that the criteria were met in the
patient group finger prick samples and both patient and combined groups for the venous
BGA results reflecting the results seen above.
FP % EP % VP %
Healthy 67.2 62.7 81.3
Patient 98.8 69.4 100
Combined 87.4 68.1 96.5 Table 3. 8 The estimated percentage of samples meeting the acceptability for glucose for Finger prick (FP), Ear prick (EP) and Venous BGA (VP) in healthy, patient and combined groups
-20
-10
0
10
20
30
40
0 10 20 30 40 50
% D
iffe
ren
ce (
Fin
ger
pri
ck t
o p
lasm
a gl
uco
se)
Plasma Glucose mmol/l
Mean % Difference = 3.16%
Lower 95% LOA = -14.36%
Upper 95%LOA = 20.67%

68
Comparison between groups
Table 3.9 below shows the results of the Friedman’s test when the MEs between each of the
methods of testing were compared (Finger prick, ear prick and venous prick). This shows
that there was a statistically significant difference in the MEs between the different methods
of testing with Chi-squared value of 22.908 and p < 0.001.
Test Statistics
N 60
Chi-Square 22.908
df 2
Asymp. Sig. <0.001
Table 3. 9 Results of Friedman’s test between finger prick, ear prick and venous BGA glucose bias results
Post Hock analysis is shown in table 3.10 below. This demonstrates that there was no
significant difference between the MEs of the finger prick and venous prick testing methods,
however, finger prick and venous prick both showed statistically reduced MEs when
compared to ear prick testing with p values of 0.002 and <0.001.
EP - FP VP - FP VP - EP
Adjusted Significance
<0.001 1.00 0.001
Table 3. 10 Post hock analysis of bias results between Finger prick (FP), ear prick (EP) and venous BGA (VP) biases.

69
The results of the F tests of the MEs are shown in table 3.11 and 3.12 and below. This has
been used to assess the difference between the range and hence width of the limits of
agreement with a wider LOA reflecting a less reliable test (i.e. the ability to get the same
result twice). This shows there were no statistically significant difference between the
variance of the MEs and hence the range (width) of the limits of agreement between the
healthy and patient groups in either the finger prick or the venous BGA sampling methods (p
values 0.198 and 0.266 respectively) but was a statistically significant difference in the ear
prick group ( p-value 0.000) reflecting less reliability in the healthy group. When the
sampling methods were compared against each other there was no statistically significant
difference in the range of LOAs between the finger prick and venous BGA glucose samples (p
values 0.058) but there was between the finger prick and ear prick as well as between the
ear prick and venous BGA (p values <0.001). SO the LOAs are significantly narrower in the
finger prick and venous BGA group when compared to the ear prick.
FP EP VP
Healthy to patient
0.198 <0.001 0.266
Table 3. 11 Results of F-tests of the MEs in glucose results between healthy and patient groups for Finger prick (FP), Ear prick (EP) and venous BGA (VP).
F test Result
FP to EP <0.001
FP to VP 0.058
EP to VP <0.001
Table 3. 12. Results of F-tests of the MEs in glucose results between Finger prick (FP), Ear prick (EP) and venous BGA (VP).

70
Comparison of results by age
As there was a significant age difference between healthy participants and patient groups,
MEs were studied by quintile groups. Mean bias was then compared between these groups
and significant differences between the groups compared using a Kruskal-Wallis test. Table
3.13 below shows the age range in each quintile and the mean bias for each sampling
modality for both the healthy group and the patient group. It can be observed from this that
there is no clear pattern between increasing age and changes to mean bias.
Healthy Patient Group
Quintile Age Range of Quintile
Mean Bias Age Range of quintile
Mean bias mmol/l
FP EP VP FP EP VP
1st 24 - 25 1.13 1 0.83 19 - 53.8 -0.22 1 0.01
2nd 25 - 28.2 0.34 1.35 0.08 53.8 – 63 0.34 -1.7 0.1
3rd 28.2 - 35.4 -0.1 0.35 0.05 63 – 74 0.16 0.82 0.53
4th 35.4 - 42 4 0.1 0.65 74 – 82 0.29 1.19 0.07
5th 42 - 49 0.42 0.28 0.28 82 – 87 0.47 0.58 0.32 Table 3. 13. Comparison of mean bias of glucose results when divided into age quintile groups in healthy group and patient groups for finger prick (FP), ear prick (EP) and venous BGA (VP) testing methods.
Following a Kruskal Wallis test comparing the combined quintile results there were no
significant differences between the quintiles for any of the finger prick, ear prick or
venepuncture sampling method (p values 0.907, 0.871 and 0.843 respectively). This
confirms that there is no significant difference between the MEs in the different age groups.
Summary

71
The venous BGA glucose in the hyperglycaemic range met the acceptability criteria as stated.
Finger prick glucose also did when glucose values were above 12mmol/l. None of the
samples were sufficiently accurate in the normoglycaemic range. On direct comparison of
the 3 sampling methods there was no significant difference between the accuracy of finger
prick and venous BGA glucose measurement. However, both testing modalities were
significantly more accurate and reliable (with significantly narrower limits of agreement)
than the ear prick sampling method. There was also no significant difference in the
differences between the age groups studied.
3.4.2 Sodium
Tables 3.15 to 3.17 summarise the sodium BGA results for the capillary finger prick, ear prick
and venous samples compared to the gold standard, venous laboratory result. Incomplete
datasets were collected in 2 subjects due to insufficient volume collection in capillary
samples despite multiple attempts and 2 samples were reported as not received by the
laboratory staff.
Table 3.14 below shows the results of the normality testing, confirming an approximate
normal distribution of the MEs for this parameter.
Kolmogorov-Smirnov Shapiro-Wilk
Statistic df Sig. Statistic df Sig.
FP Bias 0.071 67 .200 0.979 67 0.305
EP Bias 0.102 61 0.183 0.953 61 0.02
VP Bias 0.103 69 0.067 0.986 69 0.624 Table 3. 14 Normality testing of the MEs for Finger Prick (FP), Ear Prick (EP) and Venous (VP) BGA sodium

72
Table 3.15 describes the finger prick BGA result compared to the venous serum sodium. The
range of results (from 121.6 to 147.3) demonstrates the inclusion of parameters outside of
the normal range. The healthy participants and the diabetic groups showed similar mean
bias of 1.53 and 1.3mmol/l and limits of agreement of -1.15 to 4.63mmol/l and -1.9 to
4.5mmol/l respectively.
Participant group
Complete data set
Range of measurement Mmol/l
Mean bias mmol/l
Standard Deviation of the bias (mmol/l)
Lower 95% LOA bias
Upper 95% LOA bias
Healthy Participants
19/23 137.7 – 143.8 1.53 1.58 -1.57 4.63
Diabetic patients
48/48 121.6-147.3 1.3 1.63 -1.9 4.50
Combined 67/71 121.6-147.3 1.37 1.61 -1.79 4.52 Table 3. 15 Results of finger prick sodium compared to venous laboratory plasma samples in healthy participant group, patient group and combined results.
Ear prick results were compared to the laboratory samples (as described in table 3.16).
Healthy participants had highly comparable results with a mean bias of 0.33mmol/l and 95%
limits of agreement of -2.65 to 3.30. The diabetic group demonstrated less comparability
with a mean bias more positive at 1.15mmol/l and 95% LOA further from the plasma
samples at of -2.36 to 4.64.
Participant group
Complete data set
Range of measurement Mmol/l
Mean bias mmol/l
Standard Deviation of the bias (mmol/l)
Lower 95% LOA bias
Upper 95% LOA bias
Healthy Participants
20/23 134.8 – 143.5 0.33 1.52 -2.65 3.30
Diabetic patients
45/48 122.6 - 143 1.15 1.79 -2.36 4.64
Combined 65/71 122.6 - 143 0.88 1.73 -2.52 4.27 Table 3. 16 Results of Ear prick sodium compared to venous laboratory plasma samples in healthy participant group, patient group and combined results.

73
Sodium venous BGA results were compared to laboratory results (described in table 3.17)
These show adequate comparability which was not dissimilar to the finger prick and ear
prick results.
Participant group
Complete data set
Range of measurement Mmol/l
Mean bias mmol/l
Standard Deviation of the bias (mmol/l)
Lower 95% LOA bias
Upper 95% LOA bias
Healthy Participants
21/23 136.9 – 143.6 1.10 1.29 -1.43 3.63
Diabetic patients 48/48 121.4-144.7 0.85 1.52 -2.14 3.83
Combined 69/71 121.4 – 144.7 0.92 1.42 -1.92 3.77
Table 3. 17 Results of Venous BGA sodium compared to venous laboratory plasma samples in healthy participant group, patient group and combined results.
Figure 3.11 shows the Bland-Altman plot for the healthy participant finger prick sodium
result compared to the venous serum gold standard. All of the sample results are within the
US CLIA 4mmol/l guidelines but the 95% LOA exceed this, at -1.15 to 4.63 mmol/l with a
mean difference of 1.53.
Figure 3. 11 Bland-Altman Plots for finger prick BGA sodium compared to laboratory serum sodium in Healthy participants
-2
-1
0
1
2
3
4
5
135 137 139 141 143 145 147
Dif
fere
nce
(Fi
nge
r P
rick
-Se
rum
So
diu
m m
mo
l/l)
Serum Sodium mmol/l
Mean Difference = 1.53
Lower 95% LOA = -1.15
Upper 95%LOA = 4.63

74
Figure 3.12 shows the Bland-Altman plot for the patients’ finger prick sodium result
compared to the venous serum gold standard. The 95% LOAs exceed the US CLIA
recommendations, however, only one value lies outside this range with a 4.3mmol/l
difference.
Figure 3. 12 Bland-Altman Plot for finger prick BGA sodium compared to laboratory serum sodium in acutely unwell diabetic patients
Figure 3.13 shows the Bland-Altman plot for healthy participants and patients’ finger prick
sodium result compared to the venous serum gold standard. When the datasets are
combined, the upper limit of agreement does not lie within the 4mmol/l cut off.
Figure 3. 13 Bland-Altman Plots for finger prick BGA sodium compared to laboratory serum sodium in healthy participants and acutely unwell diabetic patients combined.
-4
-3
-2
-1
0
1
2
3
4
5
118 123 128 133 138 143 148 153
Dif
fere
nce
(Fi
nge
r P
rick
-Se
rum
So
diu
m m
mo
l/l)
Sodium mmol/l
Mean Difference = 1.3
Lower 95% LOA = -1.90
Upper 95%LOA = 4.50
-4
-3
-2
-1
0
1
2
3
4
5
118 123 128 133 138 143 148 153
Dif
fere
nce
(Fi
nge
r p
rick
so
diu
m -
seru
m
sod
ium
mm
ol/
l)
Serum Sodium mmol/l
Mean Difference = 1.37
Lower 95% LOA = -1.79
Upper 95%LOA = 4.52

75
Figure 3.14 compares the ear prick BGA sodium samples to the laboratory result in healthy
participants. This shows a mean difference very close to 0 and relatively narrow 95% limits
of agreement within the US CLIA guidelines.
Figure 3. 14 Bland-Altman Plot for ear prick BGA sodium compared to laboratory serum sodium in Healthy participants
Figure 3.15 compares ear prick BGA sodium to laboratory values in patients. The 95% LOA
do not meet the US CLIA guidelines as there were 2 samples outside 4mmol/l with one result
showing 6mmol/l difference from the serum sodium sample.
Figure 3. 15 Bland-Altman Plot for ear prick BGA sodium compared to laboratory serum sodium in acutely unwell diabetic patients
-5
-4
-3
-2
-1
0
1
2
3
4
135 137 139 141 143 145
Dif
fere
nce
(Ea
r P
rick
-Se
rum
So
diu
m
mm
ol/
l)
Serum Sodium mmol/l
Mean Difference = 0.33
Lower 95% LOA = --2.65
Upper 95%LOA = 3.30
-6
-4
-2
0
2
4
6
8
118 123 128 133 138 143 148 153
Dif
fere
nce
(Ea
r P
rick
-Se
rum
so
diu
m
mm
ol/
l)
Serum Sodium mmol/l
Mean Difference = 1.15
Lower 95% LOA = -2.36
Upper 95%LOA = 4.65

76
Figure 3.16 shows the combined patient and healthy participant results, comparing ear prick
BGA to laboratory values. This demonstrated a positive mean difference and fairly narrow
95% limits of agreement but with an upper LOA higher than the 4mmol US CLIA set criteria.
Figure 3. 16 Bland-Altman Plot for ear prick BGA sodium compared to laboratory serum sodium in Healthy participants and acutely unwell diabetic patients combined (Figure 3.12).
Figure 3.17 is the Bland-Altman plot for the healthy participant’s venous BGA sodium
compared to the serum values. All values were within the US CLIA 4 mmol/l guidelines, as
were the 95% LOAs.
Figure 3. 17 Bland-Altman Plot for Venous BGA sodium compared to laboratory serum sodium in Healthy participants
-6
-4
-2
0
2
4
6
8
118 123 128 133 138 143 148 153
Dif
fere
nce
(Ea
r p
rick
So
diu
m -
Seru
m S
od
ium
)
Serum Sodium mmol/l
Mean Difference = 0.88
Lower 95% LOA = -2.52
Upper 95%LOA = 4.28
-3
-2
-1
0
1
2
3
4
135 137 139 141 143 145 147
Dif
fere
nce
(V
eno
us
BG
A s
od
ium
-
Seru
m S
od
ium
mm
ol/
l)
Serum sodium mmol/l
Mean Difference = 1.1
Lower 95% LOA = 1.43
Upper 95%LOA = 3.63

77
Figure 3.18 compares venous BGA to laboratory sodium value in patients. The LOA were
sufficiently narrow compared to the US CLIA guidelines with only one sample lying outside
these 4mmol/l cut off.
Figure 3. 18 Bland-Altman Plots for Venous BGA sodium compared to laboratory serum sodium in acutely unwell diabetic patients
Figure 3.19 compares venous BGA and laboratory sodium in both healthy participants and
patients. The LOA fell within the required 4mmol/l with a difference of less than 1 mmol/l
for the mean bias.
-4
-3
-2
-1
0
1
2
3
4
5
6
118 123 128 133 138 143 148 153
Dif
fere
nce
(ve
no
us
BG
A S
od
ium
-se
rum
so
diu
m m
mo
l/l)
Serum Sodium
Mean Difference = 0.85
Lower 95% LOA = -2.14
Upper 95%LOA = 3.84

78
Figure 3. 19 Bland-Altman Plots for Venous BGA sodium compared to laboratory serum sodium in healthy participants and acutely unwell diabetic patients combined
Results compared to acceptability criteria
The acceptability criteria for sodium was derived from the US CLIA guidelines and state 95%
of results should fall within 4mmol/ of a serum sample. Table 3.18 below shows the
percentage of samples that fulfil these criteria for each sampling method based on the
assumptions made for the calculations of the limits of agreement. It shows that there was
only the finger prick healthy and combined groups and the ear prick patient group that
marginally failed to meet this criterion by less than 1%.
FP % EP % VP %
Healthy 94.1 99.0 98.8
Patient 95.0 94.3 98.0
Combined 94.8 96.5 98.2 Table 3. 18 The estimated percentage of samples meeting the acceptability for sodium for Finger prick (FP), Ear prick (EP) and Venous BGA (VP) in healthy, patient and combined groups
-4
-3
-2
-1
0
1
2
3
4
5
6
118 123 128 133 138 143 148 153
Dif
fere
nce
(V
eno
us
BG
A s
od
ium
-Se
rum
so
diu
m
mm
ol/
l)
Serum Sodium
Mean Difference = 0.92
Lower 95% LOA = -1.92
Upper 95%LOA = 3.77

79
Comparison between groups
Table 3.19 below shows the results of the Friedman’s test when the MEs between each of
the methods of testing were compared (Finger prick, ear prick and venous prick). This shows
that there were significant differences of the MEs between these groups with chi-squared
value of 11 and p value of 0.003
Test Statistics
N 59
Chi-Square 11.489
df 2
Asymp. Sig. .003
Table 3. 19 Results of Friedman’s test between finger prick, ear prick and venous BGA sodium ME results
Post Hock analysis is shown in table 3.20, below. There were statistically significant
difference between the MEs of the finger prick and both the other sampling methods (p
values 0.015 and 0.008), with the highest level of ME for the finger prick sampling method.
There were no statistically significant differences between the venous BGA ME and the ear
prick (p-value 1.00).
EP - FP VP - FP VP - EP
Adjusted Significance 0.015 0.008 1.00
Table 3. 20 Post hoc analysis of ME results between Finger prick (FP), ear prick (EP) and venous BGA (VP) biases using.
The results of the F tests of the biases for sodium are shown in table 3.21 and 3.22, below.
There were no statistically significant differences in the width of the LOAs between the
healthy and patient groups in any of the testing methods but also not between each of the
testing methods with no p values less than 0.05.

80
FP EP VP
Healthy to patient 0.916 0.448 0.419
Table 3. 21 Results of F-tests of the ME in sodium results between healthy and patient groups for Finger prick (FP), Ear prick (EP) and venous BGA (VP).
F test Result
FP to EP 0.555
FP to VP 0.401
EP to VP 0.157
Table 3. 22. Results of F-tests of the ME in sodium results between Finger prick (FP), Ear prick (EP) and venous BGA (VP).
Comparison of results by age
The age difference between healthy and patient groups was studied by quintile groups.
Table 3.23 below shows the age range in each quintile and the mean bias for each sampling
modality for both the healthy and the patient group. It can be observed that there was no
clear pattern between increasing age and changes to mean bias.
Healthy Patient Group
Quintile Age Range of Quintile
Mean Bias Age Range of Quintile
Mean bias mmol/l
FP EP VP FP EP VP
1st 24 - 25 2.73 0.5 1.53 19 - 53.8 2.69 2.82 2.23
2nd 25 - 28.2 1.28 1 0.96 53.8 - 63 0.53 0.24 0.37
3rd 28.2 - 35.4 0 0.25 1.73 63 - 74 0.95 0.78 0.66
4th 35.4 - 42 0.23 2.55 1.33 74 - 82 1.18 0.36 0.57
5th 42 - 49 0.4 -1.43 -0.48 82 - 87 1.29 1.16 0.52 Table 3. 23 Comparison of mean bias for sodium when divided into age quintile groups in healthy group and patient group for finger prick (FP), ear prick (EP) and venous BGA (VP) testing methods

81
Following a Kruskal Wallis test comparing the combined quintile results there were no
significant differences between the quintiles for the finger prick, ear prick or venepuncture
sampling method (p values 0.34, 0.599 and 0.325 respectively). This confirmed that there
was no significant difference between the MEs in the different age groups.
Summary
All venous BGA sodium results met the acceptability criteria and had 95% limits of
agreement within the 4mmol/l guidelines (FederalRegister 1992). The ear prick samples also
met acceptability criteria for healthy controls and combined groups but not patients. The
finger prick test for both healthy and combined groups also failed to reach the required level
of acceptability by less than 1% but did for the patient group. When comparing the three
different sampling methods, there were no significant differences between the ear prick and
venous BGA methods, however, finger prick was significantly less accurate than the other 2
sampling methods despite having 94.8% of the samples reaching guideline levels of
concordance.
3.4.3 Potassium
Tables 3.25 to 3.27 summarise the results from the potassium BGA results for the capillary
finger prick, ear prick and venous samples compared to the gold standard, venous laboratory
result. The Bland-Altman plots for the corresponding data follows (figures 3.20-3.22).

82
Table 3.24 shows the results of normality testing, confirming an approximate normal
distribution of the MEs for this parameter.
Kolmogorov-Smirnov Shapiro-Wilk
Statistic Df Sig. Statistic df Sig.
FP Bias 0.092 69 .200* 0.968 69 0.076
EP Bias 0.103 61 0.178 0.971 61 0.158
VP Bias 0.125 69 0.009 0.914 69 0 Table 3. 24. Normality testing of the MEs for Finger Prick (FP), Ear Prick (EP) and Venous (VP) BGA potassium
Table 3.25 describes the finger prick BGA potassium compared to the venous serum result.
The range of results (3.34 to 5.41mmol/l) did not deviate far from physiologically normal
values. The patient mean bias (0.15mmol/l), was closer to the serum value compared to the
healthy participants (mean bias of -2.86). However the 95% LOA in the healthy group (-
0.656 to 0.083mmol/l) were narrower than that of the patient group (-0.686 to 0.386) but
not significantly so (see f test results below).
Participant group
Complete data set
Range of measurement mmol/l
Mean bias mmol/l
Standard Deviation of the bias (mmol/l)
Lower 95% LOA bias
Upper 95% LOA bias
Healthy Participants
21/23 3.53-4.48 -0.286 0.188 -0.656 0.083
Diabetic patients
48/48 3.34-5.41 -0.15 0.273 -0.686 0.386
Combined 69/71 3.34-5.41 -0.191 0.257 -0.695 0.312 Table 3. 25 Results of finger prick potassium compared to venous laboratory plasma samples in healthy participant group, patient group and combined results.
Table 3.26 describes the ear prick data for potassium. The patient group for this method of
blood collection was the only one of all the sampling methods to show a positive mean bias
of 0.048 mmol/l. The healthy group had mean bias of -0.131 with 95% LOAs of -0.66 and
0.398, significantly narrower than the relatively wide patient group ( -0.77 to 0.867),
(p=0.044, see f test below).

83
Participant group
Complete data set
Range of measurement mmol/l
Mean bias mmol/l
Standard Deviation of the bias (mmol/l)
Lower 95% LOA bias
Upper 95% LOA bias
Healthy Participants
20/23 3.6-4.97 -0.131 0.270 -0.66 0.398
Diabetic patients
41/48 3.57-5.82 0.048 0.418 -0.77 0.867
Combined 61/71 3.57-5.82 -0.011 0.383 -0.762 0.740 Table 3. 26 Results of Ear prick potassium compared to venous laboratory plasma samples in healthy participant group, patient group and combined results.
Table 3.27 describes venous BGA potassium. The mean bias for this method of blood
sampling was further from 0 than the finger prick and ear prick groups (mean bias of -0.467
in the healthy participant groups, -0.362 for the diabetic group and -0.394 for the combined
results). This led to an almost completely negative range of LOA, from -0.793 to 0.004 in the
combined group.
Participant group
Complete data set
Range of measurement mmol/l
Mean bias mmol/l
Standard Deviation of the bias (mmol/l)
Lower 95% LOA bias
Upper 95% LOA bias
Healthy Participants
21/23 3.31-4.31 -0.467 0.116 -0.695 -0.239
Diabetic patients
48/48 3.29-5.48 -0.362 0.225 -0.804 0.079
Combined 69/71 3.29-5.48 -0.394 0.203 -0.793 0.004
Table 3. 27 Results of Venous BGA potassium compared to venous laboratory plasma samples in healthy participant group, patient group and combined results.
The Bland-Altman plot for the healthy participant’s finger prick potassium compared to the
laboratory serum venous sample is shown in Figure 3.20. The 95% LOA were not within the
US CLIA 0.5mmol/l guidelines, with the lower limit LOA less than -0.66mmol/l due to a low
mean difference of -0.29.

84
Figure 3. 20 Bland-Altman Plot for finger prick potassium results compared to laboratory serum potassium in healthy participants.
The Bland Altman plot comparing the patients’ finger prick to laboratory potassium is shown
in figure 3.21 below. The mean difference was negative and the lower LOA exceeded the US
CLIA guidelines of 0.5mmol/l (FederalRegister 1992).
Figure 3. 21 Bland-Altman Plot for finger prick potassium results compared to laboratory serum potassium in acutely unwell diabetic patients.
The Bland Altman plot comparing finger prick to laboratory potassium for all participants is
shown in figure 3.22. The lower limit of agreement did not satisfy the US CLIA criteria of
95% of results falling within 0.5mmol/l of the gold standard test. Both this and the previous
figure (3.21) highlight the presence of an outlying sample which was 1.03mmol/l less than
the serum potassium sample.
-0.8
-0.6
-0.4
-0.2
0
0.2
3.5 3.7 3.9 4.1 4.3 4.5 4.7 4.9 5.1
Dif
fere
nce
(Fi
nge
r P
rick
-Se
rum
K m
mo
l/l)
Serum potassium mmol/l
Mean Difference = -0.29
Lower 95% LOA = -0.66
Upper 95%LOA = 0.083
-1.2
-1
-0.8
-0.6
-0.4
-0.2
0
0.2
0.4
0.6
3.54 4.04 4.54 5.04 5.54
Dif
fere
nce
(Fi
nge
r P
rick
-Se
rum
K
mm
ol/
l)
Serum Potassium mmol/l
Mean Difference = -0.15
Lower 95% LOA = -0.69
Upper 95%LOA = 0.39

85
Figure 3. 22 Bland-Altman Plot for finger prick potassium results compared to laboratory serum potassium in healthy participants and acutely unwell diabetic patients combined.
Figure 3.23 shows the Bland Altman plot comparing ear prick BGA and laboratory potassium
results in healthy participants. The mean difference was negative and the lower LOA
exceeded the US CLIA guidelines.
Figure 3. 23 Bland-Altman Plots for ear prick potassium results compared to laboratory serum potassium in healthy participants.
-1.2
-1
-0.8
-0.6
-0.4
-0.2
0
0.2
0.4
0.6
3.5 4 4.5 5 5.5 6 6.5
Dif
fere
nce
(fi
nge
r p
rick
-se
rum
po
tass
ium
mm
ol/
l)
Serum Potassium
Mean Difference = -0.19
Lower 95% LOA = -0.70
Upper 95%LOA = 0.31
-0.8
-0.6
-0.4
-0.2
0
0.2
0.4
0.6
3.5 3.7 3.9 4.1 4.3 4.5 4.7 4.9 5.1
Dif
fere
nce
(Ea
r p
rick
-se
rum
K
mm
ol/
l
Serum Potassium mmol/l
Mean Difference = -0.13
Lower 95% LOA = -0.66
Upper 95%LOA = 0.40

86
Figure 3.24 demonstrates the Bland Altman plot comparing ear prick and laboratory
potassium in patients. The mean difference was close to zero but the 95% LOA exceed the
US CLIA guidelines.
Figure 3. 24 Bland-Altman Plot for ear prick potassium results compared to laboratory serum potassium acutely unwell diabetic patients.
When results from healthy participants and patients were combined, neither the upper or
lower 95% LOA satisfied the US CLIA criteria (see Figure 3.25). This figure also illustrates
three data points which were >0.8 mmol/l from the serum values.
-1
-0.8
-0.6
-0.4
-0.2
0
0.2
0.4
0.6
0.8
1
1.2
3.5 4 4.5 5 5.5 6 6.5
Dif
fere
nce
(Ea
r P
rick
-Se
rum
K m
mo
l/l)
Serum Potassium mmol/l
Mean Difference = 0.04
Lower 95% LOA = -0.77
Upper 95%LOA = 0.87

87
Figure 3. 25 Bland-Altman Plot for ear prick potassium results compared to laboratory serum potassium in healthy participants and acutely unwell diabetic patients combined
Finally, venous BGA potassium results were compared to the venous serum laboratory
values in healthy controls (figure 3.26), patients (figure 3.27) and all participants (figure
3.28). In healthy participants, the BGA samples were consistently less than the serum
laboratory samples, with a mean difference of almost -0.5mmol/l. The 95% limits of
agreement were narrow, however, with a difference of only 0.46mmol/l.
Figure 3. 26 Bland-Altman Plot for Venous BGA results compared to laboratory serum potassium in healthy participants.
-1
-0.8
-0.6
-0.4
-0.2
0
0.2
0.4
0.6
0.8
1
1.2
3.5 4 4.5 5 5.5 6 6.5
Dif
fere
nce
(Ea
r P
rick
Po
ttas
ium
-Se
rum
po
tass
ium
)
Serum Potassium mmol/l
Mean Difference = 0.01
Lower 95% LOA = -0.76
Upper 95%LOA = 0.74
-0.8
-0.7
-0.6
-0.5
-0.4
-0.3
-0.2
-0.1
0
3.5 3.7 3.9 4.1 4.3 4.5 4.7 4.9 5.1
Dif
fere
nce
(ve
no
us
BG
A -
Seru
m K
m
mo
l/l)
Serum potassium mmol/l
Mean Difference = -0.47
Lower 95% LOA = -0.70
Upper 95%LOA = -0.24

88
Figure 3.27 shows the Bland Altman plot for patient venous BGA compared with the
laboratory result. In this case the 95% LOA exceeded accepted criteria.
Figure 3. 27 Bland-Altman Plot for Venous BGA results compared to laboratory serum potassium in acutely unwell diabetic patients combined.
Figure 3.28 shows the Bland Altman plot for the combined healthy and patient venous BGA
and laboratory result. Once again, a negative bias was seen and the LOA failed to meet the
US CLIA guidelines.
Figure 3. 28 Bland-Altman plots for Venous BGA results compared to laboratory serum potassium in healthy participants and acutely unwell diabetic patients combined.
-1.2
-1
-0.8
-0.6
-0.4
-0.2
0
0.2
0.4
0.6
3.5 4 4.5 5 5.5 6 6.5
Dif
fern
ce (
Ven
ou
s B
GA
-se
rum
K
mm
ol/
l)
Serum potassium mmol/l
Mean Difference = -0.36
Lower 95% LOA = -0.80
Upper 95%LOA = 0.079
-1.2
-1
-0.8
-0.6
-0.4
-0.2
0
0.2
0.4
0.6
3.5 4 4.5 5 5.5 6
Dif
fere
nce
(V
eno
us
BG
A p
ota
ssiu
m -
Seru
m
po
tasi
um
mm
ol/
l)
Serum potassium mmol/L
Mean Difference = -0.39
Lower 95% LOA = -0.79
Upper 95%LOA = 0.0049

89
Results compared to acceptability criteria
The acceptability criterion for potassium was derived from the US CLIA guidelines and state
95% of results should fall within 0.5mmol/ of a serum sample (FederalRegister 1992). Table
3.28 below shows the results for percentage of samples that fulfil these criteria based on the
assumptions for calculation of LOAs for each sampling method. It shows that the criteria
were not met in any of the sampling methods. The venous BGA samples had less than 70%
fulfilling the criteria.
FP % EP % VP %
Healthy 87.2 90.4 61.1
Patient 89.1 76.5 72.9
Combined 88.0 80.8 69.8 Table 3. 28 The estimated percentage of samples meeting the acceptability for potassium for Finger prick (FP), Ear prick (EP) and Venous BGA (VP) in healthy, patient and combined groups
Comparison between groups
Table 3.29 below shows the results of the Friedman’s test when the MEs between each of
the methods of testing are compared (Finger prick, ear prick and venous prick). This shows
that there were significant differences between the biases between these groups with chi-
squared value of 60.5 and p value of <0.001.
Test Statistics
N 61
Chi-Square 60.570
df 2
Asymp. Sig. <0.001
Table 3. 29 Results of Friedman’s test between finger prick, ear prick and venous BGA potassium bias results

90
Post Hoc analysis is shown in table 3.30, below. This shows that there were statistically
significant differences between all of the sampling methods with ear prick testing showing
reduced levels of ME compared to both of the other sampling methods. Furthermore, finger
prick samples had reduced levels of ME compared to venous BGA bias (p values all <0.001).
EP - FP VP - FP VP - EP
Adjusted Significance 0.01 <0.001 <0.001
Table 3. 30 Post hoc analysis of ME results between Finger prick (FP), ear prick (EP) and venous BGA (VP) using Wilcoxan signed ranks test.
The results of the F tests of the MEs for potassium are shown in table 3.31 and 3.32, below.
There were statistically significant differences between the range of the LOAs between the
healthy and patient groups in the ear prick and venous BGA groups but not in the finger prick
group. When the sampling methods were compared there were also statistically significant
differences between the range of LOAs in the finger prick to ear prick and ear prick to
venous prick, confirming that wide LOAs seen in the ear prick group are significantly wider
than the other 2 sampling methods.
FP EP VP
Healthy to patient
0.072 0.044 0.002
Table 3. 31 Results of F-tests of the MEs in potassium results between healthy and patient groups for Finger prick (FP), Ear prick (EP) and venous BGA (VP).
F test Result
FP to EP 0.002
FP to VP 0.057
EP to VP <0.001 Table 3. 32. Results of F-tests of the biases in potassium results between Finger prick (FP), Ear prick (EP) and venous BGA (VP).

91
Comparison of results by age
Parameters measurement error was studied by age quintile groups. Table 3.33 below shows
the age range in each quintile and the mean bias for each sampling modality for both the
healthy group and the patient group. There was no clear pattern between increasing age
and changes to mean bias. However, there was a generally higher bias in the youngest
quintile group.
Healthy Patient Group
Quintile Age Range of Quintile
Mean Bias Age Range of quintile
Mean bias mmol/l
FP EP VP FP EP VP
1st 24 - 25 2.73 0.5 1.53 19 - 53.8 2.69 2.82 2.23
2nd 25 - 28.2 1.28 1 0.96 53.8 - 63 0.53 0.24 0.37
3rd 28.2 - 35.4 0 0.25 1.73 63 - 74 0.95 0.78 0.66
4th 35.4 - 42 0.23 2.55 1.33 74 - 82 1.18 0.36 0.57
5th 42 - 49 0.4 -1.43 -0.48 82 - 87 1.29 1.16 0.52 Table 3. 33 Comparison of mean bias for potassium when divided into age quintile groups in healthy group and patient group for finger prick (FP), ear prick (EP) and venous BGA (VP) testing methods
Following a Kruskal-Wallis test comparing the combined quintile results there were no
significant differences between the quintiles for the ear prick or venepuncture sampling
methods (p values 0.106, 0.061 respectively). There was, however, statistical difference
between the quintile groups in the finger prick method, p = 0.008.
Summary
The BGA finger prick, ear prick and venous potassium results were insufficiently accurate to
fulfil the US CLIA guidelines and gave results consistently lower than the gold standard
laboratory samples. When comparing the different methods of testing, ear prick was the

92
most accurate followed by finger prick and then the venous BGA method, however the ear
prick has significantly wider limits of agreement than either the finger prick or the venous
BGA test suggesting a less reliable test (i.e. the ability to produce reproduce the same
results).
3.4.4 Haemoglobin
Tables 3.35 to 3.37 summarise the haemoglobin BGA results for the capillary finger prick, ear
prick and venous samples compared to the gold standard, venous laboratory result..
The Bland-Altman plots for the corresponding data follows (figures 3.29-3.37). Table 3.34
describes normality testing. This confirms an approximate normal distribution of the MEs
for this parameter.
Kolmogorov-Smirnov Shapiro-Wilk
Statistic Df Sig. Statistic df Sig.
FP Bias 0.066 69 .200* 0.988 69 0.772
EP Bias 0.09 60 .200* 0.975 60 0.268
VP Bias 0.086 70 .200* 0.951 70 0.009 Table 3. 34 Normality testing of theMEss for Finger Prick (FP), Ear Prick (EP) and Venous (VP) BGA haemoglobin
Table 3.35 describes the finger prick BGA haemoglobin compared to the venous laboratory
EDTA haemoglobin for the healthy participant group, the patient group and the combined
results. There were complete data sets in the healthy group but 2 incomplete sets for the
patient group, which were due to 1 insufficient volume of collection and 1 laboratory report
as not received. The mean bias for both groups were similar at 8.27g/l and 8.33g/l for the
healthy group and diabetic group respectively, giving a combined mean of 8.32g/l. There

93
were wide LOA of -2.2g/l to 18.7 g/l and -4.84g/l to 21.5g/l for the healthy participant and
patient groups respectively.
Participant group
Complete data set
Range of measurement g/l
Mean bias g/l
Standard Deviation of the bias (g/l)
Lower 95% LOA bias
Upper 95% LOA bias
Healthy Participants
23/23 112.4 -166.4 8.27 5.34 -2.20 18.7
Diabetic patients
46/48 81.6-172.6 8.33 6.72 -4.84 21.5
Combined 69/71 81.6-172.6 8.32 6.26 -3.95 20.6 Table 3. 35 Results of finger prick haemoglobin compared to venous laboratory EDTA samples in healthy participant group, patient group and combined results.
Table 3.36 compares the ear prick haemoglobin to the laboratory gold standard. The mean bias was
consistently lower compared to the finger prick equivalents at 4.79g/l in the healthy participant
group and 6.8g/l in the patient group with very similar 95% LOAs of -5.75g/l to 15.3g/l and -5.75g/l to
19.3 g/l respectively.
Participant group
Complete data set (g/l)
Range of measurement (g/l)
Mean bias (g/l
Standard Deviation of the bias (g/l)
Lower 95% LOA bias
Upper 95% LOA bias
Healthy Participants
22/23 102.5-160.8 4.79 5.38 -5.75 15.3
Diabetic patients
38/48 75.9-172.6 6.8 6.40 -5.75 19.3
Combined 60/71 75.9-172.6 6.06 6.08 -5.85 18.0 Table 3. 36 Results of Ear prick haemoglobin compared to venous laboratory EDTA samples in healthy participant group, patient group and combined results.
Table 3.37 describes the venous BGA haemoglobin compared to the venous laboratory EDTA
haemoglobin. The mean bias suggested more concordance between this sampling modality

94
than either the finger prick or ear prick in both the healthy participant group (mean bias
1.43) and the patient group (mean bias 1.96g/l).
Participant group
Complete data set
Range of measurement g/l
Mean bias g/l
Standard Deviation of the bias (g/l)
Lower 95% LOA bias
Upper 95% LOA bias
Healthy Participants
23/23 103.1-152.6 1.43 2.72 -3.89 6.77
Diabetic patients
47/48 74.5-165 1.96 3.57 -5.04 8.96
Combined 70/71 74.5-165 1.79 3.31 -4.69 8.27
Table 3. 37 Results of Venous BGA haemoglobin compared to venous laboratory EDTA samples in healthy participant group, patient group and combined results.
Figure 3.29 shows the Bland-Altman plot of the finger prick haemoglobin compared to the
laboratory result for healthy participants. The mean difference and 95 % LOA demonstrated
the discordance between the sampling modalities, exceeding the set limits of <5g/l.
Figure 3. 29 Bland-Altman Plot for finger prick haemoglobin results compared to laboratory EDTA haemoglobin in healthy participants.
Similarly, the finger prick result from patients (shown in figure 3.30) demonstrated
discordance from the laboratory results, with 95% LOA exceeding the 5g/l limits. The figure
-5
0
5
10
15
20
102 122 142 162 182 202
Dif
fere
nce
(FI
nge
r P
rick
-ED
TA H
b
g/l)
EDTA Haemoglobin g/l
Mean Difference = 8.27
Lower 95% LOA = -2.20
Upper 95%LOA = 18.74

95
demonstrates an outlying result which was approximately 30g/l removed from the gold
standard.
Figure 3. 30 Bland-Altman Plot for finger prick haemoglobin results compared to laboratory EDTA haemoglobin in acutely unwell diabetic patients.
The combined healthy participant and patient results for finger prick BGA are shown in
figure 3.31. There was significant discordance between the sampling modalities, exceeding
the set criteria.
Figure 3. 31 Bland-Altman Plot for finger prick haemoglobin results compared to laboratory EDTA haemoglobin in healthy participants and acutely unwell diabetic patients combined.
-10
-5
0
5
10
15
20
25
30
70 90 110 130 150 170 190
Dif
fere
nce
(Fi
nge
r p
rick
-se
rum
Hb
g/
l)
EDTA Haemoglobin g/l
Mean Difference = 8.33
Lower 95% LOA = -4.84
Upper 95%LOA = 21.52
-10
-5
0
5
10
15
20
25
30
70 90 110 130 150 170 190
Dif
fere
nce
(Fi
nge
r P
rick
Hb
-ED
TA H
b g
/l)
EDTA Haemoglobin g/l
Mean Difference = 8.31
Lower 95% LOA = -3.95
Upper 95%LOA = 20.58

96
Figure 3.32 shows the Bland Altman plot for ear prick haemoglobin compared with the
laboratory result in healthy participants. There was significant discordance in results with
the 95% LOA greater than the 5g/l.
Figure 3. 32 Bland-Altman Plot for ear prick haemoglobin results compared to laboratory EDTA haemoglobin in healthy participants.
Figure 3.33 shows the Bland Altman plot for ear prick haemoglobin compared with the
laboratory result in patients. There was also significant discordance in results with the 95%
LOA greater than the 5g/l.
Figure 3. 33 Bland-Altman Plot for ear prick haemoglobin results compared to laboratory EDTA haemoglobin in acutely unwell diabetic patients.
-10
-5
0
5
10
15
20
102 122 142 162 182 202
Dif
fere
nce
(Ea
r P
rick
-ED
TA H
b
g/l)
EDTA Haemoglobin g/l
Mean Difference = 4.79
Lower 95% LOA = -5.75
Upper 95%LOA = 15.33
-10
-5
0
5
10
15
20
25
70 90 110 130 150 170 190
Dif
fere
nce
(Ea
r p
rick
Hb
-ED
TA H
b
g/l)
EDTA Haemoglobin g/l
Mean Difference = 6.8
Lower 95% LOA = -5.75
Upper 95%LOA = 19.3

97
The combined ear prick results in figure 3.34 demonstrated the spread of results across a
range of haemoglobins, including many participants who were anaemic, up to the upper end
of the normal range. On average, the ear prick sample was greater compared to the
laboratory gold standard, with only 6 results being lower than the laboratory equivalent.
Once again, there was significant discordance between the ear prick and laboratory sample.
Figure 3. 34 Bland-Altman Plot for ear prick haemoglobin results compared to laboratory EDTA haemoglobin in healthy participants and acutely unwell diabetic patients combined (Figure 3.34).
Finally, a venous sample (assessed using the BGA) was compared to the laboratory
haemoglobin result. The Bland Altman plots demonstrate that the acceptability criteria were
not reached for healthy controls (see figure 3.35), patients (see figure 3.36) or when groups
were combined (see figure 3.37).
-10
-5
0
5
10
15
20
25
70 90 110 130 150 170 190
Dif
fere
nce
(Ea
r P
rick
-Se
rum
Hb
g/l
)
EDTA Hb g/l
Mean Difference = 6.06
Lower 95% LOA = -5.85
Upper 95%LOA = 17.98

98
Figure 3. 35 Bland-Altman Plot for Venous BGA haemoglobin results compared to laboratory EDTA haemoglobin in healthy participants.
Figure 3.36 displays patient data, and as expected, included a wider range of haemoglobin
measurements than seen in healthy subjects.
Figure 3. 36 Bland-Altman Plot for Venous BGA haemoglobin results compared to laboratory EDTA haemoglobin in acutely unwell diabetic patients.
-6
-4
-2
0
2
4
6
8
100 120 140 160 180 200
Dif
fere
nce
(V
eno
us
BG
A -
Seru
m H
b g
/L)
EDTA haemoglobin g/l
Mean Difference = 1.44
Lower 95% LOA = -3.89
Upper 95%LOA = 6.77
-15
-10
-5
0
5
10
15
70 90 110 130 150 170 190
Dif
fere
nce
(V
eno
us
BG
A -
EDTA
Hb
g/
l)
EDTA Haemoglobin g/l
Mean Difference = 1.95
Lower 95% LOA = -5.04
Upper 95%LOA = 8.96

99
Figure 3. 37 Bland-Altman Plot for Venous BGA haemoglobin results compared to laboratory EDTA haemoglobin in healthy participants and acutely unwell diabetic patients combined.
Results compared to acceptability criteria
The acceptability criteria for haemoglobin state 95% of results should fall within 5 g/l of the
EDTA sample (see section 2.4.2). Table 3.38 below shows the results for the number and
percentage of samples that fulfil these criteria for each sampling method. Only
approximately a quarter of the finger prick samples and less than half of the ear prick
samples fulfilled this criterion, with venous BGA approaching 86% of samples reaching this
acceptability criterion with less than half of the ear prick and approximately a quarter of the
finger prick samples fulfilling this cut off.
FP % EP % VP %
Healthy 26.3 48.1 89.6
Patient 28.6 35.6 77.7
Combined 28.1 39.6 81.4 Table 3. 38 The estimated percentage of samples meeting the acceptability for haemoglobin for Finger prick (FP), Ear prick (EP) and Venous BGA (VP) in healthy, patient and combined groups
Comparison between groups
-15
-10
-5
0
5
10
15
70 90 110 130 150 170 190
DIf
fere
nce
(V
eno
us
BG
A H
b -
EDTA
Hb
g/l
)
EDTA haemoglobin g/l
Mean Difference = 1.79
Lower 95% LOA = -4.69
Upper 95%LOA = 8.26

100
Table 3.39 below shows the results of the Friedman’s test when the MEs between each of
the methods of testing were compared (Finger prick, ear prick and venous prick). There
were significant differences between the biases between these groups with chi-squared
value of 51 and p value of 0.000.
Test Statistics
N 59
Chi-Square 51.034
df 2
Asymp. Sig. .000
Table 3. 39 Results of Friedman’s test between finger prick, ear prick and venous BGA ME results
Post Hoc analysis is show in table 3.40 below. This shows that there were statistically
significant differences between the biases of both the capillary sampling methods (Finger
prick and ear prick) when compared to the venous BGA MEs (p values <0.001), however,
there were no significant difference between the two capillary methods (p=0.92). Here, the
venous BGA haemoglobnin showed reduced bias compared to both finger prick and ear
prick.
EP - FP VP - FP VP - EP
Adjusted Significance .092 <0.001 <0.001
Table 3. 40 Post hoc analysis of ME results between Finger prick (FP), ear prick (EP) and venous BGA (VP) using Wilcoxan signed ranks test.
The results of the F tests of the MEs for haemoglobin are shown in table 3.41 and 3.42
below. There were no statistically significant differences between the range of LOAs
between the healthy and patient groups in any of the testing methods. There was also no
significant difference between the finger prick and ear prick sampling methods (p=0.823).

101
When both the capillary samples (finger prick and ear prick) were compared to the venous
BGA samples there were significant differences, with the venous BGA having significantly
narrower LOAs (p values <0.001).
FP EP VP
Healthy to patient 0.244 0.399 0.168
Table 3. 41 Results of F-tests of the biases in haemoglobin results between healthy and patient groups for Finger prick (FP), Ear prick (EP) and venous BGA (VP).
F test Result
FP to EP 0.823
FP to VP <0.001
EP to VP <0.001 Table 3. 42. Results of F-tests of the biases in haemoglobin results between Finger prick (FP), Ear prick (EP) and venous BGA (VP).
Comparison of results by age
Mean bias results were studied by quintile groups, as shown in table 3.43. There was no
clear pattern between increasing age and mean bias.
Healthy Patient Group
Quintile Age Range of Quintile
Mean Bias g/l Age Range of quintile
Mean bias g/l
FP EP VP FP EP VP
1st 24 - 25 11.1 2.6 1.33 19-53.8 8.71 4.46 2.03
2nd 25 - 28.2 9.96 8.32 2.92 53.8-63 8.52 7.14 0.78
3rd 28.2 - 35.4 9.22 7.22 2.7 63-74 7.03 7.05 2.5
4th 35.4 - 42 -0.42 5.56 2.43 74-82 5.85 11.89 1.94
5th 42 - 49 5.56 1.9 -0.44 82-87 11.7 6.37 2.68 Table 3. 43 Comparison of mean bias for haemoglobin when divided into age quintile groups in healthy group and patient group for finger prick (FP), ear prick (EP) and venous BGA (VP) testing methods
There were no significant differences between the quintiles for each of the groups (p values
0.269, 0.492 and 0.161) for finger prick, ear prick and venous BGA results respectively, when
compared using Kruskal Wallis test.

102
Summary
None of the BGA samples showed sufficient concordance to satisfy the acceptability criteria
of 95% of the values being within 5g/l for haemoglobin. The venous sample showed the
closest level of concordance where 95% of the values were within 10g/l and showed
statistically higher levels of accuracy and narrower limits of agreement when directly
compared to the other sampling methods. The ear prick and finger prick showed no
significant differences in their accuracy between one another
3.4.5 Lactate
Tables 3.45 to 3.47 describe the results for lactate, where finger and ear prick samples were
compared to venous BGA standard. The Bland-Altman plots and regression plot for the
corresponding data are given in figures 3.38-3.43.
Table 3.39 describes the normality testing which demonstrates that the finger and ear prick
sampling did not conform to a normal distribution.
Kolmogorov-Smirnov Shapiro-Wilk
Statistic df Sig. Statistic df Sig.
FP Bias 0.171 71 0 0.905 71 0
EP Bias 0.139 62 0.005 0.908 62 0 Table 3. 44 Normality testing of the MEs for Finger Prick (FP) and Ear Prick (EP) lactate
Table 3.45 describes finger prick compared to venous BGA lactate. As the distribution of the
MEs were not normally distributed, Bland-Altman LOAs are not valid and not given. The

103
variability of the MEs suggested a low degree of agreeability with the combined standard
deviation being 0.34mmol/l.
Participant group
Complete data set
Range of measurement mmol/l
Mean bias mmol/l
Standard Deviation of the bias (mmol/l)
Healthy Participants
23/23 0.7-1.7 0.091 0.26
Diabetic patients
48/48 0.5-5.4 -0.040 0.369
Combined 71/71 0.5-5.4 0.0028 0.342 Table 3. 45 Results of finger prick lactate compared to venous BGA lactate in healthy participant group, patient group and combined results.
Figure 3.38 below shows the scatter plot of the combined healthy participant and patient
group results for finger prick lactate. As venous BGA lactate increased, there was a
progressive tendency for the finger prick result to underestimate the lactate values. In light
of this, the degree of difference could not be predicted by a single value for the upper and
lower 95 % limits of agreement and therefore linear regression analysis was used for this
group (as described in section 2.6 of the methods).
Figure 3. 38 Scatter Plot for finger prick lactate results compared to venous BGA lactate in healthy participants and acutely unwell diabetic patients combined.
-1.5
-1
-0.5
0
0.5
1
1.5
0.5 1.5 2.5 3.5 4.5 5.5 6.5
Dif
fere
ence
(fi
nge
r p
rick
lact
ate
-ve
no
us
BG
A la
ctat
e)
Venous BGA lactate mmol/l
Mean Difference = 0.038

104
Table 3.46 describes the finger prick compared to venous BGA lactate in healthy participants
and patients following linear regression analysis. The predicted mean values and upper and
lower 95% confidence intervals (CI) have been included in the table to cover the lower and
upper range of the lactate results. This provides the maximum and minimum range of the
predicted means and upper and lower 95% CIs. For the healthy group the predicted mean
bias was 0.149 when the VBG lactate was 0.7mmol/l (the lowest venous BGA level recorded
in this group). At the top of the range (when the venous BGA lactate was 1.7mmol/l) the
predicted mean bias was 0.0106mmol/l; so the predicted mean bias decreases in this group
as the lactate level increased (but remained within the normal range). The 95 % confidence
intervals (equivalent to the LOA) similarly decrease with increasing lactate ranging from -
0.473mmol/l to 0.769mmol/l when the lactate was 0.7mmol/l to -0.618mmol/l to
0.673mmol/l at 1.7mmol/l when the lactate reached 1.7mmol/l. The lactate values
increased in the patient group, and the bias continued to decrease until it became negative
when the venous BGA lactate was 5.4mmol/l, with a predicted mean bias of -0.5.
Participant group
Range of measurement mmol/l
Predicted mean bias at corresponding range measurement
Lower 95% Confidence interval
Upper 95% Confidence interval
Healthy Participants
0.7 1.7
0.149 0.0106
-0.473 -0.618
0.769 0.637
Diabetic patients
0.5 5.4
0.176 -0.5
-0.444 -1.15
0.796 0.149
Combined 0.5 5.4
0.176 -0.5
-0.444 -1.15
0.796 0.149
Table 3. 46 Results of finger prick lactate compared to venous BGA lactate in healthy participant group, patient group and combined results showing predicted mean bias, lower and upper 95% confidence interval following linear regression analysis.

105
Figure 3.39 shows the scatter chart of the finger prick lactate bias compared to venous BGA
lactate values. The linear regression lines for both the upper and lower 95% confidence
interval and the predicted mean are included. These demonstrate that finger prick lactate
measurement increasingly under-predicted the venous BGA lactate as this value increased.
When venous BGA lactate was less than 2mmol/l (and within the normal range) the lactate
measurement still did not fit the aim of 95% of values being within 0.5mmol/l.
Figure 3. 39. Scatter chart of finger prick lactate bias compared to venous BGA lactate with linear regression lines showing the predicted mean and the 95% confidence intervals (CI)
Ear prick lactates were then compared to the venous BGA lactate result, and are shown
below. The normality testing suggested the distribution was not normal (described in table
3.47). There was incomplete data capture from both the healthy participant and patient
-1.5
-1
-0.5
0
0.5
1
1.5
0 1 2 3 4 5 6 7
Dif
fere
nce
(Fi
nge
r p
rick
lact
ate
-ve
no
us
BG
A la
ctat
e m
mo
l/l)
Venous BGA lactate mmol/l
Linear (Lower 95 % CIregression line = -0.145x-0.371)
Linear (Predicted meanregression line = -0.138x +0.245)Linear (Upper 95% CIregression line = -0.132x +0.8616)

106
group due to insufficient volumes of the capillary blood. The mean difference was similar in
both healthy and patient groups (-0.17mmol/l and 0.11mmol/l respectively) however, these
are lower than that of the finger prick group. With a larger standard deviation the combined
95% LOA were relatively wide (-0.964 to 0.693).
Participant group
Complete data set
Range of measurement mmol/l
Mean bias mmol/l
Standard Deviation of the bias (mmol/l)
Lower 95% LOA bias
Upper 95% LOA bias
Healthy Participants
21/23 0.3-2.1 -0.17 0.362 -0.877 0.543
Diabetic patients
41/48 0.4-5.2 -0.11 0.454 -1.01 0.770
Combined 62/71 0.3-5.2 -0.14 0.423 -0.964 0.693 Table 3. 47 Results of Ear prick haemoglobin compared to venous BGA lactate in healthy participant group, patient group and combined results.
The 95% LOAs were compared to the weighted average centile values (as per section 2.6 of
the methods) as the distribution did not fit with linear regression modelling. This gave an
upper 95% confidence interval of 0.745 and a lower CI of -1.14, wider than those calculated
based on a normal distribution as shown in table 3.20. In light of this, the LOAs described for
this parameter are likely to suggest a higher degree of agreeability for this test than is
actually present.
Figure 3.40 describes a Bland-Altman plot for the ear prick BGA lactate compared to the
venous BGA results. The 95% LOA did not meet the required criteria of 95% LOAs
<0.5mmol/l.

107
Figure 3. 40 Bland-Altman Plot for ear prick haemoglobin results compared to laboratory EDTA haemoglobin in healthy participants.
Figure 3.41 shows the patient ear prick BGA lactate compared to the venous BGA results.
These include some results outside of the normal range (>2mmol/l). The mean differences
and 95% LOA were similar to that of the healthy group with a negative mean difference and
LOA failed to meet the agreed acceptability criteria.
Figure 3. 41 Bland-Altman Plot for ear prick haemoglobin results compared to laboratory EDTA haemoglobin in acutely unwell diabetic patients.
The combined healthy control and patient ear prick results are shown in figure 3.42,
including an outlying result which differed by 1.8 mmol/l to the corresponding venous BGA
result. There was not the same degree of progressively negative bias with increasing lactate
values, as was seen with finger prick samples.
-1
-0.8
-0.6
-0.4
-0.2
0
0.2
0.4
0.6
0.8
1
0.5 0.7 0.9 1.1 1.3 1.5 1.7 1.9 2.1
Dif
fere
nce
(Ea
r p
rick
-ve
no
us
BG
A
lact
ate
mm
ol/
l)
Venous BGA lactate mmol/l
Mean Difference = -0.17
Lower 95% LOA = -0.88
Upper 95%LOA = 0.54
-2
-1.5
-1
-0.5
0
0.5
1
0.5 1.5 2.5 3.5 4.5 5.5 6.5
Dif
fere
nce
(Ea
r p
rick
-ve
no
us
BG
A
lact
ate
mm
ol/
l
Venous BGA lactate mmol/l
Mean Difference = -0.11
Lower 95% LOA = -1.01
Upper 95%LOA = 0.77

108
Figure 3. 42 Bland-Altman Plot for ear prick haemoglobin results compared to laboratory EDTA haemoglobin in healthy participants and acutely unwell diabetic patients combined.
Results compared to acceptability criteria
The acceptability criteria for lactate state 95% of results should fall within 0.5 mmol/l of the
venous BGA sample (see section 2.4.2). Table 3.43 below shows the results for the number,
percentage and confidence limits of samples that fulfil these criteria for each sampling
method. Approximately 85% (CI 74-92%) of the finger prick sample and three quarters (CI
66-87%) of the ear prick samples meet these criteria.
FP / total FP % 95% Confidence Limits
EP / total EP % 95% Confidence Limits
Healthy 19/23 82.6 61-95 15/21 71.4 48-89
Patient 41/48 85.4 72-94 33/41 80.5 62-91
Combined 60/71 84.5 74-92 48/62 77.4 66-87 Table 3. 48 The number and percentage of samples meeting the acceptability for lactate for Finger prick (FP) and Ear prick (EP) in healthy, patient and combined groups
-2
-1.5
-1
-0.5
0
0.5
1
0.5 1.5 2.5 3.5 4.5 5.5 6.5
Dif
fere
nce
(Ea
r p
rick
lact
ate
-V
eno
us
BG
A la
ctat
e m
mo
l/l)
Venous BGA Lactae mmol/l
Mean Difference = -0.14
Lower 95% LOA = -0.96
Upper 95%LOA = 0.69

109
Comparison between groups
Table 3.43 below shows the results of the Wilcoxon Signed Ranks test when the MEs of the
finger prick and ear prick were compared. There were significant differences between the
MEs of these groups with a p value of 0.11, with finger prick sampling having a significantly
reduced level of bias compared to ear prick tests.
Test Statistics
Asymp. Sig. .011
Table 3. 49 Results of Wilcoxon Signed Ranks test between finger prick and ear prick lactate ME results
The results of the F tests of the MEs for lactate are shown in table 3.50 and 3.51 below.
There were no statistically significant differences between the range of LOAs between the
healthy and patient groups in any of the testing methods or between the sampling methods
themselves when patients and healthy subjects were combined (p=0.088).
FP EP
Healthy to patient 0.093 0.280
Table 3. 50 Results of F-tests of the MEs in lactate results between healthy and patient groups for Finger prick (FP), Ear prick (EP) and venous BGA (VP).
F test Result
FP to EP 0.088
Table 3. 51. Results of F-tests of the MEs in lactate results between Finger prick (FP), Ear prick (EP) and venous BGA (VP).
Comparison of results by age
Parameters bias was studied by age quintile groups, as shown in table 3.52. There was no
pattern between increasing age and changes to mean bias.

110
Healthy Patient Group
Quintile Age Range of Quintile
Mean Bias g/l Age Range of quintile
Mean bias g/l
FP EP FP EP
1st 24 - 25 0.35 -0.033 19-53.8 -0.09 -0.08
2nd 25 - 28.2 0.2 -0.13 53.8-63 -0.14 -0.29
3rd 28.2 - 35.4 -0.02 -0.06 63-74 0.01 -0.1
4th 35.4 - 42 0.48 0.08 74-82 -0.06 0.043
5th 42 - 49 -0.1 -0.42 82-87 0.09 -0.16 Table 3. 52 Comparison of mean bias for lactate when divided into age quintile groups in healthy group and patient group for finger prick (FP) and ear prick (EP) testing methods
There were no significant differences between the quintiles for either the finger prick or ear
prick groups (p= 0.328 and 0.445 respectively).
Summary
Neither the finger prick nor ear prick lactate results were sufficiently comparable to the
venous BGA gold standard as per the defined criteria of 95% of the values being within
0.5mmol/l. Despite this, when the two methods were compared, finger prick tests showed
significantly more accuracy than the ear prick with approximately 85% of results satisfying
the acceptability criteria.
3.5 Experience rating
Table 3.53 describes the scores from the visual analogue scales for each of the healthy
group, patient group and the combined results. In the healthy group the median pain score
was less for both the finger prick and ear prick when compared to the venepuncture and

111
there was no statistically significant difference between the pain scores of either of the
capillary sampling method when compared to the venepuncture. In the patient group,
however, finger prick and ear prick were both scored significantly lower than the
venepuncture blood tests with a median of 0.45 for the finger prick and 0.35 for the ear prick
compared to the venepuncture of 1.4. When the results of the two groups are combined
both the ear prick and the finger prick were significantly less painful than the venepuncture
(p value 0.00).
Finger Prick Ear Prick Venepuncture
Healthy Median 1.2 0.8 1.3
Interquartile Range 0.5-1.9 0.2-1.5 0.4-1.8
Significant difference compared to VP
No (p=0.295) No (0.058) -
Patient Median 0.45 0.35 1.4
Interquartile Range 0-1.5 0-1.7 0-3.53
Significant difference compared to VP
Yes (p<0.001) Yes (p=0.001) -
Combined Median 0.7 0.5 1.4
Interquartile Range 0-1.55 0-1.50 0-2.80
Significant difference compared to VP
Yes (p<0.001) Yes (p=0.001) -
Table 3. 53 The median, interquartile range and significant difference results for pain scores (out of a maximum of 10) for finger prick, ear prick and venepuncture (VP) in the healthy group, patient group and the healthy and patient group combined
The patient group were also asked which sampling modality they preferred, as shown in
table 3.54. The majority of patients preferred the finger prick to the other modality with 60
% suggesting this as a preferred method. The ear prick was the next most commonly
preferred modality with 17% preferring this method, with venepuncture being the least
commonly preferred option.

112
Modality preference
Number of patients
Percent
Finger 29 60
Ear 8 17
Venous 6 13
No preference 1 2
Unable 4 8
Table 3. 54 Patient preference for modality of blood sampling
Table 3.55 below shows the number of attempts required per test. Data collection on
number of attempts required started after the commencement of the validation part of the
study so only includes 14 healthy participants. The finger and ear prick were both successful
on the first attempt in more than 90% of the time whereas the ear prick was only successful
on the first attempt approximately a third of the time with approximately 20 % requiring
more than 3 attempts and 8% not successful despite more than 3 attempts.
Modality First attempt % (number)
Second Attempt % (number)
Third Attempt % (number)
More than 3 attempts % (number)
Number unsuccessful % (number)
Healthy Finger 93 (13) 7 (1) 0 (0) 0 (0) 0 (0)
Ear 21 (3) 29 (4) 29 (4) 14 (2) 7 (1)
Venous 100 (14) 0 (0) 0 (0) 0 (0) 0 (0)
Patient Finger 92 (44) 6 (3) 2 (1) 0 (0) 0 (0)
Ear 33 (16) 21 (10) 17 (8) 21 (10) 8 (4)
Venous 87 (42) 13 (6) 0 (0) 0 (0) 0 (0)
Combined Finger 92 (57) 6 (4) 2 (1) 0 (0) 0 (0)
Ear 31 (19) 23 (14) 19 (12) 19 (12) 8 (5)
Venous 90 (56) 10 (6) 0 (0) 0 (0) 0 0) Table 3. 55 The number of attempts required for each modality in the healthy group, patient group and combined groups.

113
4. Discussion
4.1 Summary of results
This is the first study to assess the accuracy and acceptability of capillary blood tests when
assessed in a blood gas analyser for glucose, sodium, potassium, haemoglobin and lactate. It
is the first study to compare their accuracy to the gold standard laboratory samples but also
to venous samples processed in a blood gas analyser. Table 4.1 below summarises the
results for each parameter comparing the results to the acceptability criteria. It also ranks
the methods in order of accuracy as per the Friedman’s or Wilcoxon signed ranks test.
Sampling method
Mean Bias Limits of Agreement
Acceptability Criteria met
% Meeting Acceptability Criteria
Rank
Glucose mmol/l (%)
Finger prick 0.26 (3.81%) -1.91– 2.43mmol/l
No* 87.4 1
Ear Prick 0.46 (9.11%) 18.8% - 29.4%
No 68.1 3
Venous BGA 0.23 (3.13%) 8.94%-20.6% Yes** 96.5 1 Sodium mmol/l
Finger prick 1.37 -1.79 – 4.52 No 94.8 3
Ear Prick 0.88 -2.52 – 4.27 Yes 96.5 1 Venous BGA 0.92 -1.92 – 3.77 Yes 98.2 1
Potassium mmol/l
Finger prick -0.191 -0.695 – 0.312
No 88.0 2
Ear Prick -0.011 -0.762 – 0.740
No 80.8 1
Venous BGA -0.394 -0.793 – 0.004
No 69.8 3
Hb g/l Finger prick 8.32 -3.95 -20.6 No 28.1 2
Ear Prick 6.06 -5.85 - 18 No 39.6 2 Venous BGA 1.79 -4.69 – 8.27 No 81.4 1
Lactate mmol/l
Finger prick - 0.5 to 0.176
Not valid No 84.5 (CI 74-92) 1
Ear Prick -0.14 -0.964 – 0.693
No 77.4 (CI 66-87) 2
Table 4. 1 Comparison of mean bias, limits of agreement, whether the acceptability criteria were met and ranking of samples according to their accuracy (1 most accurate 3 least) for each parameter and testing modality. *Acceptability criteria met when glucose >12mmol/l.**Acceptability not met in the healthy group when glucose <10mmol/l

114
4.1.1 Glucose
All glucose BGA samples tended to overestimate the plasma glucose with mean bias ranging
from 0.2 to 0.7mmol/l. In this population, capillary finger prick, ear prick and venous BGA
results were not sufficiently accurate in the normal physiological range to be adopted for use
in clinical care when compared to the ISO guidelines for glucose meters. The finger prick and
venous BGA samples were sufficiently accurate in the hyperglycaemic range when the
plasma glucose was above approximately 12mmol/l. There was no significant difference in
the accuracy of the venous BGA test and the finger prick test but both these methods were
significantly more accurate than the ear prick method.
The ear prick sample consistently demonstrated poorer agreement with the gold standard
test than either the finger prick or the venous BGA sample and less reliability with wider
limits of agreement. There were technical difficulties in obtaining adequate samples and the
frequent requirement for several capillary punctures. This might have led to haemolysis or
clot formation. Because of these difficulties several samples were not able to be processed
by the BGA or were not obtainable at all.
Impact of results on management of acutely unwell adults
Given that the results show suitable accuracy in patients in the hyperglycaemic range, when
glucose is above 12, finger prick BGA glucose could be used as an alternative to standard

115
testing when managing patients who may be within this range. This maybe particularly
useful in patients being treated for diabetic emergencies such as DKA or hyperglycaemic
hyperosmolar non-ketotic states when regular assessment of several parameters may be
important. Below this range finger prick samples show similar accuracy to what has been
seen in glucose meter and arterial BGA samples in critically ill adults on intensive care (Inoue
S 2013), however, do not meet the ISO guidelines so should only be used with caution.
4.1.2 Sodium
This is the first study to show the accuracy of capillary sodium samples analysed in a blood
gas analyser. It is also one of the first studies to compared venous BGA results alone
(excluding arterial samples).
In the current study, finger and ear prick BGA results had a positive mean bias of 1.37mmol/l
and 0.92mmol/l respectively. The limits of agreement for both sampling modalities were
marginally outside those required by the US CLIA requirement of 95% of <4mmol/l
(FederalRegister 1992). Despite this when the proportion of samples meeting this criteria is
calculated the ear prick samples satisfy the US CLIA guidelines with 96.5% fulfilling this
criteria and finger prick samples only fail to reach the criteria by only 0.2% (94.8% fulfil the
criteria). The venous BGA samples met the US CLIA requirements with LOAs within the
4mmol/l cut off.

116
Impact of results on management of acutely unwell adults
The current study supports the use of venous BGA sodium and ear prick sodium as an
alternative to venous laboratory serum samples. The finger prick capillary BGA sample,
however, only marginally failed to reach the accuracy level required by the US CLIA
guidelines but may still be seen as clinically acceptable given its proximity to the required
accuracy. NICE guidelines for the management of hyponatraemia state mild hypoglycaemia
is in the range of 130-135mmol/l. The lower range LOA for the finger prick sample is -1.79
and upper 4.52 and ear prick -2.52 and 4.27. The recommendations from NICE would be to
repeat a sample when sodium is within the mild ranges. The impact of a test falling at the
extreme ranges of LOAs would be to be potentially falsely reassured by a normal result when
only mild hyponatraemia exists and this is unlikely to have a large impact on acute clinical
care (NICE 2015). It may be suitable to use this method for monitoring sodium with the
addition of venous testing when results are abnormal.
4.1.2 Potassium
This is the first study to compare capillary and venous BGA potassium to the gold standard
serum and demonstrated that neither capillary nor venous BGA samples meet the US CLIA
guidelines of 95% of the samples within 0.5mmo/l of the gold standard (FederalRegister
1992). The guideline criteria could be met using finger prick and venous BGA samples
following correction using the mean bias.

117
All BGA values under-estimated the potassium concentration when compared to the
laboratory result. Potassium is predominantly an intracellular ion, released during
haemolysis. The under-estimation may reflect potassium release from the laboratory sample
during transit and analysis, rather than true physiological change or BGA error.
Furthermore, serum samples have higher potassium concentrations (by 0.36 +/- 018mmol/l
(Jaya R Asirvatham 2013) compared with plasma samples due clotting-associated potassium
release from platelets. This reported difference is a very similar to that which was seen in
the whole blood venous BGA result in the current study, where haemolysis or clotting is
likely to be minimal.
The potassium sample for the finger prick was the only sample to show any significant
differences in mean difference between the quintiles. In both the healthy and patient group
the mean bias in the 1st quintile were higher than the other quintile groups. There did not
appear to be any evidence of specific changes in mean bias across the ranges of age. The
cause for this is not clear, however, may be due to the younger patients being sampled
earlier in the study when the technique of the investigator may have caused a higher degree
of haemolysis.
Impact of results on management of acutely unwell adults
It is common place to monitor the correction of electrolytes, and especially potassium in
patients with hyperkalaemia, using serial samples analysed by BGA for example in recent

118
DKA guidelines (Group 2014) which advocate venous BGA potassium monitoring with
intermittent laboratory confirmation. Given that the current study shows venous capillary
BGA potassium is more accurate when compared to venous BGA sample, this method would
be a more favourable alternative. The recommendations for the use of venous BGA
sampling may have the potential to significantly underestimate potassium with the lower
95% up to 0.8mmol/l away from the gold standard sample (similar to what has previously
been reported) with only approximately three quarters of results fulfilling the US CLIA
criteria. This has the potential of falsely diagnosing patients with severe hypokalaemia
despite potassium being measured with in the normal range or give falsely reassuring level
for patients in the hyperkaleamic range. Use of finger prick samples may reduce this risk but
cautious use when samples are outside or at the extremes of the normal range when
laboratory confirmation should be applied. Given the wide LOAs seen in the ear prick
sample and hence poor reliability it may be preferable to use finger prick capillary samples
when compared to ear prick.
4.1.3 Haemoglobin
This is the first study to compare capillary haemoglobin measured in a BGA to laboratory
samples. Neither the capillary samples nor the venous BGA sample showed sufficient levels
of accuracy, predetermined to be <5g/l of the EDTA laboratory samples. All samples showed
a positive bias. The ear and finger prick samples demonstrated an upper LOA approaching
20 g/l

119
Impact of results on management of acutely unwell adults
The level of error reported in the current study may prohibit the use of BGA results in
informing clinical care in patients unless treatment could be based on an approximate value.
Indeed, previous studies have concluded that haemoglobin BGA were not sufficiently
accurate for clinical care. Previous studies looking at haemoglobin measured by capillary
samples have compared the results of haemocue test to laboratory Haemoglobin and these
have also shown capillary samples to be less accurate compared to venous and arterial
samples measured using the same methodology and not sufficiently accurate to guide
transfusions (Seguin P1 2010, Sanchis-Gomar 2013). One specific study where LOAs were
reported described LOAs between -13 g/l to 17 g/l (Seguin P1 2010), in agreement with
those reported in the current study.
However, a randomised trial of 357 patients described no difference in mortality when Hb
was maintained between 70 and 90 g/l as opposed to 100 and 120g/l (ref). Therefore, it is
possible that accuracy better than within 20g/l is not of actual clinical benefit in the acute
setting when haemoglobin is >90g/l, although studies still advocate confirming a BGA result
with an EDTA sample prior to definitive management (PC Hebert 2001).

120
The consistent positive bias reported in the current and previous studies has been proposed
to be due to incomplete bottle filling and blood sample clotting before the container is filled.
Also, it has been suggested that the sample site may influence intra-subject variation, with
differences of up to 8g/l being observed at different sites of capillary measurement (Morris
SS 1999).
4.1.4 Lactate
Neither the finger nor ear prick lactate measurements demonstrated sufficient accuracy, as
predetermined by our stated aim of 95% of the samples being within 0.5mmol/l of the
venous BGA result.
The gold standard method for determining lactate is from an arterial blood gas assessment
and this has been the standard for comparison in the majority of reported studies. Previous
studies have shown venous lactate to be consistently lower than arterial lactate (Gallagher
E.John 1997, Réminiac 2012, Akira Mikami 2013, Ikami A 2013, Talayero Gimenez De
Azcarate M. 2013) and a correction of factor of: –0.259 + venous lactate (mmol/L) × 0.996
has been proposed for conversion (Ikami A 2013). Ear pricks can be used to assess
oxygenation as the samples are arterialised (Zavorsky 2006) and therefore it is perhaps
unsurprising that this modality would provide a negative mean bias compared to the venous
sample (i.e. would be more comparable to an arterial sample).

121
Impact of results on management of acutely unwell adults
Despite the capillary lactate samples not showing sufficient accuracy as compared to our set
criteria, there is still potential use for this modality to be used as a screening tool for
significant lactic acidosis. The Surviving Sepsis guidelines recommend that a lactate of 4
mmol/l should be considered as a marker of severe sepsis (Dellinger RP 2013). In the current
study, capillary sampling was associated with a maximum LOA of -1.2 mmol/l, providing
sufficient accuracy to suggest the presence of severe sepsis. However, in the current study,
the distribution of results was different between the finger and the ear prick groups. The
finger prick showed increasing negative bias with increasing lactate concentrations,
suggesting that the finger capillary sample under estimated the lactate more and more, as
the lactate level rose. A venous sample may reflect systemic tissue perfusion more than a
finger prick, which might be influenced by local perfusion. The ear prick sample did not
appear to show the same trend of widening bias, and the bias was more approximated to a
normal distribution. This might reflect the arterialisation of the sample.
4.1.5 Patient experience rating and methods of sampling
The pain rating of the different sampling methods varied between the patient and healthy
groups, with the healthy participants having lower mean scores for the capillary sample but
no significant over all difference when compared to the venepuncture.

122
The diabetic patient group found both capillary methods significantly less painful than
venepuncture and preferred the finger prick blood test. This may reflect prior experience.
Finger prick blood testing is commonly used to monitor diabetes by capillary blood glucose
metres. A previous study comparing capillary and venepuncture in 70 patients on
anticoagulation having INR monitoring regularly showed that the capillary technique was
associated with a reduction in pain by 2.6 points on the pain intensity scale. (Gonzalez Diaz
E. 2010).
However, it is also possible that some patients had evidence of peripheral neuropathy, a
well-known complication of diabetes, which can be associated with reduced pain sensation
that starts distally (i.e. at the finger tips and toes) and progresses proximally (Kelsey Juster-
Switlyka 2016).
The preference for finger prick sampling over ear prick sampling in the patient group,
despite there being no significant difference in levels of pain experienced may also be due to
the sampling site. A finger prick blood test occurs at a more distal part of the body. The ear
prick blood test involves closer proximity to a patient’s face as well as being less familiar
method of blood testing. A further problem was that it required more attempts to
successfully gain an adequate sample, with 70% of subjects requiring two or more
punctures.
The patient group rated a venepuncture as being more painful than capillary sampling.
Many patients had undergone multiple blood tests prior to the inclusion of the study, and

123
many were older, acutely unwell and had limited sites from which to gain a venous sample.
Although there are few reported studies of pain associated with serial blood sampling, it is
possible that the repetitive sampling from a single site could cause more pain than when a
single sample was taken (as was the case in the healthy controls).
Ear prick also sampling requires preparation with transvasin cream for approximately 10
minutes to ensure adequate yield of blood for analysis. This also limits its usefulness given
that one of the main reasons of using a POCT test is the rapidly available results.
4.2 How results compare to previous publications
This is the first study to assess the accuracy of capillary glucose results analysed in a blood
gas analyser. Previous studies have reviewed accuracy of BGA glucose in venous and arterial
samples. The meta-analysis by Inoue in 2013 (Inoue S 2013) included 2 studies where
arterial BGA glucose was compared to plasma samples where mean bias results and LOAs
were included. They gave mean bias results from - 0.15mmol/l to 0.464mmol/l and 95% LOA
ranging from -1.24 to 1.23mmol/l. There were 74 and 171 samples analysed on intensive
care unit patients only (Hoedemaekers CW1 2008, Stadlbauer V1 2011, Inoue S 2013).The
mean bias (which is slightly positive) is similar to what these 2 previous studies have shown.
Three other studies which have reported the mean bias values only (without LOAs) in BGA
venous or arterial samples also show positive mean biases of 0.022 (60 samples) (Slater-
MacLean L1 2008), 0.1 (84 samples) (Peterson J 2008)and 1.40mmol/l (440 samples)
(Corstjens AM1). In the current study, the mean bias was similar to what has been

124
previously observed for venous BGA. The limits of agreement, however, are wider than the
2 previous studies but do incorporate the same ranges. The reason for this difference is
unclear but may due to all the samples in the previous studies being taken in critically ill
patient on intensive care units where blood sugars are tightly controlled, and therefore did
not cover the wide ranges of samples incorporated in the current study.
The mean biases of 0.26 in the finger prick and 0.46 in the ear prick capillary BGA results are
similar to those reported for capillary glucose tested via a POCT glucose in other published
studies described in the meta-analysis by Inoue (Inoue S 2013). These showed mean biases
ranging from -0.888mmol/l to 0.549mmol/l from 13 studies, with 9 of the 13 studies
reporting positive bias results. Limits of agreement were also included in 10 of these studies
and the range (upper limit to lower limit) was from 2.44mmol/l to 7.992mmol/l. This is
comparable to the range reported in the current study (finger prick; 4.34mmol/l: ear prick,
10.89mmol/l). This meta-analysis described only 1 out of 7 of the studies meeting the IOC
criteria (95% of samples within 20% of venous plasma gold standard) with this ranging from
1.4 – 24.8 % of samples and 9.3 % combined (total 2778 samples). In the current study,
10.2% of finger prick samples and 15% of ear prick samples did not meet this criteria. The
failure of the BGA samples to show the required level of agreeability within the
normoglycaemic range is also similar to what has been reported in previous studies, where
12.5% of mixed venous and arterial samples did not meet the ISO standard (ISO 2013), when
compared to venous BGA sample in the current study of 18.7%. This study by Inoue focused
predominantly on patients in intensive care. Other studies have reviewed accuracy of blood
glucose meters in clinic or outpatient environments, where accuracy has been shown to be

125
superior. One study reviewed 6 of the commonly used glucose meters in these
environments and only 1 failed to meet the ISO standard (from approximately 200 samples
for each meter), where 93 % achieved the required level of accuracy (Sujit R. Jangam 2013).
There appears to be limited studies assessing accuracy in acutely unwell hospital patients
not in critical/intensive care environments.
The current study included analysis with and without an outlying sample where the ear prick
BGA glucose value was 0.8mmol/l and the corresponding venous laboratory sample was
19.6mmol/l. This was considered to exceed the variability expected in human physiology
and so was assumed to be a procedural or handling error. There were technical issues with
sample collection, delaying sample analysis, which could impact upon results. Following this,
other samples were collected in close succession or discarded if sampling times exceeded
twenty minutes.
For sodium the positive mean bias present across all BGA sampling modalities is concordant
with previous studies comparing BGA and laboratory serum values and the limits of
agreement shown within the current study are also similar to those recorded previously
(Campbell3 200, Anunaya Jain 2009, Binila Chacko 2011, Budak YU1 2012, Quinn LM1 2013)
Despite describing similar results, previous studies have disagreed as to whether BGA
sodium samples are sufficiently accurate to inform clinical care. The current study however
would agree with those studies favouring its use for clinical care when in the normal range
as it satisfied the US CLIA guidelines.

126
The mean bias and LOA for potassium described in the current study are similar to those
reported in previous studies, which have compared BGA potassium (taken from arterial
samples) to serum samples. Mean biases in these studies ranged from -0.156 to -0.3 with
LOAs from -0.72 to -0.4 (lower) to 0.13 to 0.8 (upper) (R King 2000, Anunaya Jain 2009,
Binila Chacko 2011, Budak YU1 2012, Quinn LM1 2013). Reported studies provide discordant
recommendations as to whether BGA samples can be used to inform clinical care.
Previous studies comparing BGA haemoglobin results have generally used arterial samples
but have described similar positive mean bias of up to 0.91 g/l and LOAs (ranging from -
11g/l to 14.7g/l) (R King 2000, Ray JG 2002, A Beggs 2006, Quinn LM1 2013).
The only study comparing a capillary BGA lactate to the usual arterial sample was conducted
in neonates. Here, a mean bias of -0.08 and LOAs of -0.77 to 0.61mmol/l were reported
(Fauchère JC1 2002), which are not dissimilar to the finger prick results of the current study .
4.3 Strengths and Limitations
This study has assessed the comparability of a number of blood parameters, over a wide
range of values that you would expect to find in Emergency and acute care. It has used
Bland-Altman limits of agreement which enable easy comparison to the standards set by the
various associations and IOS and compares the unvalidated method of POCT (capillary

127
sampling) to methods already in common use (venous BGA sampling). Its setting within the
acute medical admissions unit on acutely unwell patients makes it generalizable to a
population who may benefit most from this type of blood sampling. It has compared
patients experience of the testing methods and used robust statistical analysis to compare
the differences in healthy and patient groups as well as across age groups.
There are also limitations to this study. There was a difference in the average age of the
healthy cohort compared to the acutely unwell patient cohort. This may impact on test
results and could limit the ability to compare results across groups. However, for the
majority of parameters, there were no significant differences between the age quintiles,
therefore, it is unlikely that age had an influence on the results studied for the majority of
the study. There was, however, a statistically significant difference in the bias result for age
in potassium although this appears to be due to the influence of the lowest quintile age
group only. The cause for this is not clear and there does not appear to be any evidence in
the literature which may explain this.
The 3 different sampling modalities were taken sequentially over approximately 20 minutes.
The order of sampling alternated throughout the study, to reduce any collection bias. It is
possible that variability in the measured results may reflect true physiological changes in
parameters over this period. During an acute admission, patients often receive rapid
intravenous infusions of therapies that may alter concentrations of blood constituents. The
venous BGA and laboratory sample were taken from the same venepuncture sample which

128
might explain the increased level of agreement noted. This is particularly relevant to glucose
where delays of 15 min or more has shown to reduce clinical accuracy to below the ISO
standards (Sujit R. Jangam 2013). The effect of the timing of the samples, however, is
unlikely to be as significant for sodium or potassium as they do not have the same degree of
post-prandial peaks and troughs as glucose and has a more stable diurnal variation (Kamil
Fijorek 2013).
An outlying glucose result taken from an ear prick sample has been excluded for some of the
analysis (with clear descriptions of where this has occurred). The variation was not thought
compatible with physiological change and was instead thought to be due to sampling error.
Including this value distorted the plots and did not confer a useful visual representation of
the results as it extended the y-axis of the graph to the extent where the other values are
not easily distinguishable. Given that ear prick glucose samples did not satisfy the criteria for
clinical use even without this outlying sample, the removal of this result from some of the
analyses is unlikely to influence any conclusion. However, that such an extreme result
occurred would suggest that any results taken following a prolonged sampling time should
be viewed with caution and potentially discarded.
This study was conducted unblinded and with no placebo procedure, however all sample
analysis was conducted by automated processes, reducing the potential for experimenter
bias. Sample bias may impact on this study. Patients were selected following screening of
an electronic investigation and prescribing system. All suitable patients were approached in

129
a sequential order (and not randomly), which could introduce bias. However, the current
study includes a broad range of age groups, different ethnicities and a wide range of
physiological and pathological blood results, reflecting the type of people that are cared for
in the acute medical environment.
Another limitation of this study is that the full range of pathological results were not
included. Glucose results included those patients with hyperglycaemic ranges up to levels
which may be expected for acutely unwell adults, as hyperglycaemia can be slow to respond
to treatment, allowing time to ethically recruit patients without hindering treatment
processes. However, patients were not studied in the hypoglycaemic range due to the
speed of response of this parameter to correction. As the current study suggests decreased
accuracy at lower glucose level, the results cannot be extrapolated to hypoglycaemic levels.
There were only 2 samples with sodium concentrations below 130 mmol/l and no samples
within the hypernatraemic range. In light of this, these results should also not be
extrapolated to include results beyond the accepted physiological range. With regards to
potassium, the current study did not include patients with significantly deranged potassium
concentrations either, and therefore results again cannot be extrapolated to comment on
hypo or hyperkalaemia. This would be of particular importance as previous studies of
arterial samples taken out of the normal range have showed poor agreeability when
potassium is less than 3mmol/l and >5mmol/l (R King 2000, Quinn LM1 2013). Despite
covering the anaemic range there were no samples where haemoglobin was less than 76 g/l

130
and only 3 samples less than 90g/l. The LOA did not suggest there was more error at lower
or higher haemoglobin concentrations, but the results should not be extrapolated to include
results beyond those measured and these should be tested in a further study.
The mean biases for lactate were not normally distributed for the finger prick test.
Alternative analysis using regression analysis was adopted and enabled further
interpretation for this parameter. The weighted average centiles showed differing results for
the 95% confidence intervals compared to the Bland-Altman limits of agreement. This
difference was due to the lack of normality of this distribution. The 95% confidence intervals
were higher than the corresponding LOA, suggesting less agreeability. This suggests the LOA
are likely to be an underestimation of the discordance between the capillary and venous
BGA lactate, and interpretation is therefore limited using the Band Altman plots and limits of
agreement.
The current results include lactate values of <5.2mmol/l and given the trend of increasing
negative bias with increasing lactate, cannot be extrapolated above this range. However, a
lactate of >5mmol/l would be indicative of severe sepsis, suggesting patients with a
significant burden of ill health were included in the study. Furthermore, the current study
did not compare capillary sampling to the gold standard arterial measurement, although a
number of studies report that it is acceptable to use venous lactate as an alternative due to
the fairly close agreement (Gallagher E.John 1997, Brad S. Karon 2007, Akira Mikami 2013,
Dheeraj Kapoor1 2014).

131
There were incomplete datasets for some patients. These may include those with poor
tissue perfusion and their exclusion may have biased results. However, every attempt was
made to include patients who were acutely unwell and as stated, the current study included
those who met the definition of severe sepsis.
Most diabetic patients are already familiar with finger prick blood tests and may have
complications of the condition which may make this method of blood taking more
preferable. This makes these results less generalizable to all patients presenting with acute
illness. Some patients were not able to complete a visual analogue scale due to visual
difficulties or cognitive impairment. These data were not collected in this patient group and
it is unclear whether they might have different perceptions of pain or sampling. Expanding
this aspect of the study so as to include a broader range of patients and to increased
numbers may help overcome any sample bias.
4.4 Further Work
Further studies could be used to select patients who may fall outside of the ranges included
in the current study to ensure these tests are validated for these ranges. This may include
selecting patients with anaemia or polycythaemia (as seen in a haematology clinic), and
those with significant biochemical disturbances, which are frequently seen in acute kidney
injury (potassium) and patients with delirium (sodium).

132
This was a single centre study using a single model of blood gas analyser (Cobas® b 221).
Further study in other centres using other models of BGA should be conducted to ensure
these results are generalizable to other centres and when using other machines.

133
5. Conclusions
This study is the first to assess the accuracy of capillary blood tests measured on a blood gas
analyser for glucose, sodium, potassium, haemoglobin and lactate as well as assessing their
acceptability for patients.
Finger prick capillary blood tests processed in a blood gas analyser can be used as an
alternative to venous testing for the measurement of glucose, in patients who are
hyperglycaemic, when glucose is greater than 12mmol/l.
Ear prick testing did not show the same degrees of accuracy or reliability for glucose. There
are technical difficulties with this method of testing which may prevent or limits its use.
Even with specific training and experience, the assessment often required numerous
punctures. It was generally not favoured when compared to the finger prick test in the
acutely unwell patients and may not be as acceptable to patients as a method of blood
sampling. Due to these problems this method was deemed an inferior method of sampling
when compared to finger prick sampling.
Venous BGA sodium and ear prick sodium are sufficiently accurate compared to the US CLIA
guidelines and could be used as an alternative to serum testing. These results are
generalizable within the normal range, however, further investigation when sodium is less

134
than 130mmol and in hypernatraemic range needs to be undertaken to confirm the accuracy
within these ranges. Capillary BGA Sodium is not sufficiently accurate when taken from a
finger prick sample to meet the US CLIA guidelines for accuracy, however the failure of this
method by only 0.2% is unlikely to be clinically significant.
Capillary BGA analysis for potassium provides superior accuracy to venous testing, however,
does not meet US CLIA standards. It may be used as an alternative to venous BGA testing
but intermittent laboratory confirmation should be applied. Given the poor reliability of ear
prick testing finger prick methods may be used as the preferred method of capillary BGA
sampling.
Haemoglobin measured by both finger prick and ear prick capillary BGA samples are not
accurate enough to produce precise haemoglobin monitoring, as defined by the
predetermined limits of acceptability. It may be useful to rule out significant anaemia
requiring transfusion. Further study is required in the anaemic range when haemoglobin is
less than 7g/l.
Lactate measured via capillary samples should not be used when precise measurement is
required. If precision is not required it may be useful to monitor trends of lactates value but
with caution. Further study is required to evaluate its accuracy for values greater than
5mmol/l.

135
Capillary sampling from the ear and finger prick are less painful as blood taken in the
standard way from venepuncture and are a preferred method of blood sampling from
acutely unwell diabetic patients.

136
7. Appendices

137
Appendix 1. Letter of agreement. National Research Ethics Service Committee -
West Midlands (NRES reference 14/WM/1057).

138
Appendix 2. Letter of agreement. Sponsorship agreed by the University Hospital Birmingham NHS Foundation Trust (UHBFT) Research and Development Committee

139
Appendix 3. IQC performance data for b221 blood gas analysers in ED and CDU,
University Hospital Birmingham NHS Trust
IQC performance data for b221 blood gas analysers in ED and CDU
The data in the column labelled Roche is the expected %CV performance of that analyte using the QC
material (between lot number) determined from 2 runs per day with 2 replicates per run for 20 days
on 4 different instruments
The 2SD and CV columns are the data obtained for the daily IQC performed on the specified
instruments at QEHB during the month of June 2015.Values of IQC for each parameter
Analyte
ED CDU
QC L1 QCL2 QC L3 QCL1 QCL2 QCL3
2SD
CV Roche
2SD
CV Roche
2SD
CV Roche
2SD
CV Roche
2SD
CV Roche
2SD
CV Roche
pH 0.013
0.001
0.05
0.008
0.001
0.06
0.01
0.001
0.07
0.008
0.001
0.05
0.01
0.001
0.06
0.013
0.001
0.07
pO2 1.14
0.074
6.53
0.883
0.034
5.38
1.081
0.03
4.51
1.565
0.102
6.53
0.808
0.031
5.38
1.136
0.029
4.51
pCO
2
0.210
0.012
2.72
0.183
0.017
1.74
0.112
0.015
2.74
0.331
0.020
2.72
0.248
0.023
1.74
0.110
0.015
2.74
Na 1.33
0.005
0.93
1.28
0.005
0.55
2.11
0.007
0.53
1.33
0.005
0.93
4.12
0.015
0.55
3.06
0.009
0.53
K 0.034
0.006
0.95
0.042
0.004
0.53
0.199
0.014
0.74
0.044
0.007
0.95
0.123
0.013
0.53
0.115
0.008
0.74
Ca++ 0.038
0.012
0.98
0.022
0.009
1.20
0.029
0.025
1.43
0.038
0.012
0.98
0.030
0.013
1.20
0.023
0.019
1.43
Cl- 2.44
0.014
1.96
1.512
0.008
0.97
1.493
0.006
0.87
2.275
0.013
1.96
3.008
0.015
0.97
1.537
0.007
0.87
THb 0.737
0.005
1.514
0.006
4.072
0.011
2.824
0.019
1.514
0.006
9.385
0.025
Glucose
0.103
0.009
2.38
0.105
0.021
4.83
0.817
0.022
1.91
0.256
0.023
2.38
0.184
0.039
4.83
1.149
0.031
1.91
Lactate
0.290
0.015
4.92
0.067
0.011
4.12
0.067
0.018
7.02
0.283
0.014
4.92
0.135
0.024
4.12
0.100
0.028
7.02

140
L1 L2 L3
pH 7.20 7.45 7.55
pO2 7.69 13.16 20.41
pCO2 8.48 5.49 3.674
Na 123 140 160
K 3.0 4.8 7.0
Ca++ 1.56 1.18 0.60
Cl- 88 100 118
THb 76 120 180
Glucose 5.7 2.6 18.5
Lactate 10.0 3.0 1.8

141
Appendix 4. Healthy participant data
Glucose (mmol/l) Sodium mmol/l)
Patient Number
Time taken Sex Age Ethnicity FP EP VBG VP FP EP VBG VP
1 17:30 f 42 Caucasian 4.2 4.9 5.2 4.6 141.5 140.9 140.8 142
5 16:30 m 40 Asian 5.1 5.6 5.5 4.8 143.2 142.3 141.7 141
6 13:45 f 49 caucasian 6.2 6.8 5.9 5.3 141.1 140.1 141.1 141
7 15:45 m 26 caucasian 6.4 7.6 7.1 6.1 140 139.7 139.8 140
8 11:50 m 24 caucasion 5.3 5.5 5.1 4.4 143.8 140.9 141.7 141
9 14:15 m 29 caucasian 7.2 9.1 7.9 7 137.7 137.8 139.5 139
10 15:00 f 25 Asian 5.2 5.5 4.8 4.5 140.4 139 140.6 139
11 15:55 f 25 Asian 6.5 6.5 6.1 5.6 142.9 140.5 141.2 139
12 13:55 f 27 caucasian 7.2 7 5.5 4.4 140.7 140.4 141.1 138
13 14:50 f 25 caucasian 7.8 7.6 5.8 141.8 139.6 140.6 139
14 16:15 m 30 Asian 7.1 5.9 5.7 143.5 141.1 142.6
15 12:50 f 25 caucasian 4.6 5.9 4.3 5.1 141.1 139.3 138.8 138
17 15:30 m 40 Asian 4.4 4.9 4.6 5 142.6 139.9 141.4 139
20 13:20 f 31 Asian (other) 4.8 5.1 4.4 5.1 140.3 138.3 140.6 139
23 11:55 f 42 Asian 4.5 4.4 4.5 5.1 140 138.7 138.6
25 16:35 m 26 Asian 4.5 4.3 5.2 140.8 ins 142.8 142
28 11:40 f 27 caucasian 4.6 5.3 4.8 4.8 140.8 139.6 139.3 139
39 15:55 m 41 asian 7.2 8.4 7.2 7.7 143.3 143.5 143.6 141
72 11:15 f 49 caucasian 6.7 5.2 6.7 5.6 143 141.5 142.3 141
73 12:30 f 36 caucasian 6.2 6.2 6.1 5 139.1 137.6 138.5 137
74 11:49 f 31 mixed - other 5.1 4.8 5.5 5.3 136.1 137.2 135
2 10:00 f 44 caucasian 5.8 5.4 4.4 4.7 139 134.8 136.9 139
75 12:00 m 35 Asian 5.5 5.4 5.4 5.6 139.8 140.6 138

142
Potassium mmol/l Haemoglobin g/l Lactate (mmol/l)
Patient Number
FP EP VBG VP FP EP VBG VP FP EP VBG
1 3.85 4.02 3.69 4.3 142 137.6 130.8 131
5 4.19 4.51 3.8 4.3 148.6 152.9 145.7 148
1.2 0.9 1.4
6 4.27 4.18 3.92 4.5 139.9 138.6 136.9 138
1 1.1 1
7 4.14 4.39 3.8 4.5 150.7 160.8 147.2 144
1.2 1.2 1.6
8 3.76 4.09 4.09 4.5 160.6 153.8 151.2 150
1.3 1.3 1.4
9 3.81 4.19 3.58 3.9 151.6 150.7 148.1 146
1.1 0.7 0.9
10 4.27 4.16 4.02 4.6 112.4 102.5 103.1 102
1.1 2.1 1.3
11 3.53 3.77 3.31 3.7 151.4 140.8 137.1 137
1.3 0.8 0.8
12 3.92 3.97 3.68 4.2 148.9 138.7 142 138
1.7 1.1 1
13 4.14 4.44 3.75 4.1 141.8 135.3 135.9 133
1.7 1.4 1.2
14 3.9 4.54 3.82 161.6 157.2 152.1 145
1.3 ins 1.3
15 3.84 3.98 3.72 4.3 138.4 130.1 128.5 123
1.2 0.7 1.2
17 4 3.64 3.55 4 166.35 155 152.6 149
1 0.3 0.8
20 3.76 3.91 3.65 4.3 130.6 128.5 124.1 126
1.4 0.8 1.2
23 3.99 4.03 4.02 139.1 135.1 133 131
1.2 0.9 1.2
25 4.03 3.94 4.3 160.6 157.6 150.7 148
1 0.7 0.9
28 3.89 4.22 3.84 4.3 131.2 134.4 126.2 127
1.2 ins 1.3
39 4.16 4.97 4.24 4.6 149.5 149.9 146.9 144
1.1 0.5 0.6
72 4.11 4.2 4.03 4.3 137.5 135.3 135 139
1.3 1.4 1.1
73 3.65 3.6 3.54 3.9 133.8 127.9 132.7 135
1.6 0.7 1.6
74 4.23 3.97 3.87 4.3 141.7 132.8 131.9 130
1.3 0.9 1.4
2 4.48 4.92 4.31 4.8 142.3 135.1 134
0.8 0.6 0.9
75 4.36 4.35 4.26 4.7 139.6 145.9 136.3 132
0.7 0.6 0.7

143
Appendix 5. Patient Data – Patients with Glucose 10-15 mmol/l Glucose (mmol/l) Sodium mmol/l)
Patient Number Sex Age Ethnicity Admitting Diagnosis FP EP VBG VP FP EP VBG VP
16 f 84 asian CAP + NSTEMI 13.8 12.6 13.3 13.5 137.5 137 136.5 138
19 f 69 afro-caribbean Vomiting 14.2 13 13.7 12.7 138.8 138.3 138
30 m 61 caucasian infective exacerbation of bronchiectaisis 7.7 8.7 8.1 7.6 137.6 136.8 137
31 m 78 caucasian exacerbation of COPD 13.8 13.3 13.1 13 138.3 136.8 137.3 136
32 f 38 caucasian collapse 11.6 13.1 11.4 11.5 134.8 134.6 133.8 132
35 f 73 asian Constipation/obstruction 11.3 12.2 11.6 11 137.7 138.8 137.8 137
36 m 58 asian Gastroenteritis 9.5 10.7 9.7 9.3 137.8 137.8 137.7 136
37 m 37 asian CAP 6.2 8 8.5 8.7 136.8 135.6 135.7 133
41 m 65 caucasian urosepsis/dka 11.2 11.8 11.7 11.5 134.8 132.6 133 131
42 f 51 caucasian Hyperglycaemia, renal colic 15.5 16.4 15.6 15 140.2 139.6 139.3 137
43 f 72 caucasian chest pain 13.1 13.5 13.2 12.4 137.6 142.7 139.6 139
45 f 80 caucasian Fast AF, LVF sepsis 12 12.1 137.3 137.5 136
46 m 74 caucasian sepsis 10.7 12.1 11.1 11.1 135.8 136.8 135.4 137
47 f 83 asian aki, hypercalcaemia 14.5 15 13.7 13.9 137 136.7 135.2 134
48 m 63 caucasian collapse 12.8 13 11.6 131.2 132.1 130
50 f 55 caucasian fever/sepsis 14.6 14.8 14.5 13.3 138.1 137.1 138.6 137
54 m 47 afro-caribbean Infected foot ulcer 12.6 12.8 13.1 141.1 141.4 140.3 140
55 m 75 asian Risperidone overdose 9.7 11.9 10.5 10.5 139.6 137.7 138.5 137
56 f 55 afro-caribbean Hyperglycaemia 6.5 6.5 6.1 144 142.5 143
57 f 83 caucasian hypoglycaemia 13.5 13.7 13.6 12.8 134.4 133.8 132.9 133
63 m 82 caucasian infective exacerbation of COPD 19.4 20.1 19.2 18.2 132.1 131.8 133 134
66 m 48 caucasian confusion 14.4 14.1 14.1 13.6 121.6 122.6 121.4 118
68 f 79 caucasian sepsis 15.7 16.3 16.1 136.1 136.3 134.8 135
70 m 87 afro-caribbean sepsis 11.3 11.6 10.3 9.9 143 141.7 142 142
71 m 79 caucasian exacerbation of COPD 29 29.9 28.3 28.2 137.9 137.9 136.6 137

144
Potassium mmol/l Haemoglobin g/l Lactate (mmol/l)
Patient Number
FP EP VBG VP FP EP VBG VP FP EP VBG
16 4.03 4.09 3.66 4.2 132.9 123 116.3 111 2 1.6 1.7
19 3.55 3.41 3.7 124.8 119.2 118 119 1.8 1.7 1.7
30 3.77 4.02 4.3 104.1 104.2 106.5 104 1.8 1.7 1.8
31 5.06 5.53 4.95 5.1 157.7 156.6 151.2 152 2.1 1.9 2.2
32 3.98 4.08 4.04 4.6 141.7 141.5 136.6 136 0.8 1 0.9
35 4.8 5.42 4.79 5.1 130.4 134 120.9 117 1.6 1.8 1.6
36 4.03 4.19 3.81 4.2 120.3 125.3 119.5 117 1.5 1.5 1.6
37 4.2 3.8 3.79 4.3 126.8 143.1 122 121 1.9 2.2 2.6
41 3.83 4.33 3.42 3.8 122.3 130.8 128.5 125 1.9 2.2 1.8
42 3.56 3.71 3.29 3.5 129.6 117.3 117.4 117 1.4 1.2 1.4
43 4.62 5.02 4.67 4.9 115.9 121.6 113.8 115 2.4 2.2 2.1
45 3.83 3.64 4.3 118.1 112.5 110 1.4 1.4
46 4.25 4.22 4.07 4.3 98.5 98.4 93.1 92 2 2 2
47 5.41 5.74 5.48 5.7 105.8 105.2 93.6 93 1.2 0.9 0.9
48 3.61 3.47 3.7 146.5 136.3 134 1.7 1.7
50 3.57 3.72 3.59 4.6 145 143.7 137.2 137 1.6 0.6 2.4
54 4.36 4.84 4.15 4.6 121.8 102.5 111.7 107 0.8 0.7
55 4.24 4.92 3.82 4.2 116.2 115.3 113 1 1.4 0.9
56 3.66 3.58 4 114 112.9 111 1 1
57 4.56 4.63 4.3 5 121.6 113.1 107.7 104 0.6 0.6 0.5
63 4.11 4.56 3.87 4.3 136.1 127.5 117 4.1 5.2 4.7
66 4.31 4.19 3.98 4.3 137.2 128.5 125.9 126 0.7 0.4 0.7
68 4.05 4.77 3.58 4 116.4 123.5 107.6 101 1.9 1.9
70 4.62 4.26 3.97 4.7 139.8 129.9 125.5 123 4.2 1.9 2.9
71 4.73 5.6 4.4 4.7 136.8 137.7 136 4 4 4.2

145
Appendix 6. Patient Data – Patients with Glucose >15 mmol/l Glucose (mmol/l) Sodium mmol/l)
Patient Number
Sex Age Ethnicity Admitting Diagnosis FP EP VBG VP FP EP VBG VP
18 m 19 caucasian Hyperglycaemia 25.5 24.4 24.3 23.4 138.2 136.1 136.2 135
21 f 54 caucasian insulin od 28.6 27 27 28.2 134 135.6 135.2 133
22 m 80 caucasian Chest pain 25.2 27 25.2 27.2 134.4 132.2 133.4 131
24 m 71 caucasian CAP 21 21.2 21.6 139.5 140.7 141.9 140
26 m 62 asian LVF 14.1 15.2 12.9 13.3 132.8 133.8 132.9 134
29 m 52 asian Chest pain 34.4 35.6 39 128.2 128.5 128.5 125
33 m 57 caucasian infected ulcer/cellulitis 16.5 16.6 16.2 15.9 132.5 132.7 132.8 132
34 f 83 caucasian sepsis/delirium 20.4 20.9 20.9 21 139.1 140 139 137
38 f 53 caucasian sepsis/cellulitis 16.7 17.4 17 16.6 132.1 133 132.2 132
40 f 65 caucasian Anaemia 21.5 22.6 21.5 20.9 138.9 137.5 138.9 137
44 m 84 caucasian Fall-multifactorial 13.6 14.3 13.9 13.7 140.2 138.9 139.6 138
49 m 56 caucasian fall 20.9 21.6 21.3 21.5 135.1 133.8 134.6 138
51 f 83 caucasian fall 14.2 15 13.5 14.4 134.4 134.6 134.1 132
52 m 78 afro-caribbean burns, aki 18 17.5 17.1 134 133.9 132
53 m 57 afro-caribbean urinary sepsis 18.9 0.8 18.5 19.9 141.2 139.9 139.5 139
58 f 74 asian Hyperglycaemia , AKI 6.8 8.3 6.1 5.6 133.9 133.2 134
59 m 66 caucasian DKA 17.3 15.7 19.1 19 147.3 142.6 144.7 143
60 f 74 caucasian CAP 24.8 24.4 24.2 23.9 136.2 135.8 135.5 136
61 f 63 caucasian sepsis ?source 19 21.2 19.5 17.8 137.7 136.9 136.7 138
62 m 33 caucasian Infective exac COPD 21.7 22.1 21.4 19.7 140.2 143 141.7 137
64 m 83 caucasian vacent episode 21.7 21.6 22.6 20.3 136.6 137.8 136.7 137
67 m 82 afro-caribbean hypoglycaemia 20.3 19.6 20.2 19.6 134.4 134.9 133.7 134
69 f 71 caucasian ?CCF 18.3 19.7 18.7 18 134.4 133.4 133.3 133

146
Potassium mmol/l Haemoglobin g/l Lactate (mmol/l)
Patient Number
FP EP VBG VP FP EP VBG VP FP EP VBG
18 4.42 4.44 4.08 4.4 137.9 138.1 132.9 132 2.9 2.8 2.8
21 4.65 5.23 4.55 4.8 136.3 138.8 126.3 127 2.6 2.6 2.1
22 4.92 4.81 4.72 5 117.5 127.1 119.3 119 0.9 0.9 0.9
24 5.4 5.82 4.47 4.9 172.6 172.6 165 163 5.4 ins 5.8
26 3.34 3.95 3.36 3.7 127.1 132.6 122.3 126 2.2 2.5 3.1
29 4.17 4.27 3.99 4.4 159 140.7 145.6 146 1.6 2.3 1.6
33 4.56 4.83 4.46 5.1 124.8 118.8 113.5 113 1.4 1.3 1.5
34 3.45 3.68 3.58 4.1 142.4 128.4 136.1 130 4 5 5
38 4.19 4.35 3.98 4.3 81.6 83.5 74.5 74 2.7 2.6 2.6
40 4.9 4.38 4.9 4.7 82.3 75.9 82.3 76 2.4 2.1 2.4
44 4.11 4.48 3.94 4.2 101.9 93.4 98.4 96 1.2 1.3 1.4
49 4 4.78 3.77 4.1 157 150.1 147.3 149 0.5 0.6 0.6
51 4.02 4.08 3.9 4.2 97.5 97.4 93.1 92 2.3 2.2 2.2
52 4.3 3.62 4 123.4 121.2 119 1.6 1.2
53 4.78 5.08 4.26 4.7 157.1 145.6 133 129 0.7 0.6 0.6
58 4.94 4.43 5.1 103.2 99.2 110 2.4 2.8 2.7
59 4.71 3.57 3.72 4.2 94.9 83.2 84 4.4 3.1 4.4
60 4.45 4.55 4.13 4.5 138.1 140.3 132.9 128 2.5 2.1 2.4
61 3.75 3.9 4.37 4 122.5 129.8 114.8 2.6 2.7 2.9
62 4.24 4.25 4.72 4.6 137.8 139.9 146.7 136 1.9 1.7 2.2
64 4.28 4.33 4.02 4.4 128.5 128.6 119.7 121 1.7 1.7 1.9
67 4.77 4.7 4.52 4.8 93.9 97.3 92.7 89 1.6 1.4 1.5
69 3.71 3.77 3.37 3.7 134.4 126.7 118 2.1 2 1.8

147
8. References
A Beggs, M. G., D Bennett and T Rahman (2006). "Comparison of arterial haemoglobin and electrolyte measurements between an arterial blood gas analyser and the laboratory on the critical care unit. ." Critical Care 10(1): 239.
A. Hawker, S. M., TETYANA KENDZERSKA, AND MELISSA FRENCH (2011). "Measures of Adult Pain." Arthritis Care & Research 63: S240-252.
Affairs, D. f. C. (2005). "Mental Capacity Act Code of Practice." Retrieved 16/08/2015, 2015.
Akira Mikami, M., Sachiko Ohde, EdM, Gautam A. Deshpande, MD, Toshiaki Mochizuki, MD, Norio Otani, MD, Shinichi Ishimatsu, MD, PhD (2013). "Can we predict arterial lactate from venous lactate in the ED? ." The American Journal of Emergency Medicine 31(7): 1118-1120.
Alfonzo A, S. J., Nolan, J, Mactier R, Shilliday I, Fox J et al (2014). "Treatment of Acute Hyperkalaemia in Adults. ." Retrieved 24 January 2014, 2014.
Altman DG, B. J. (1983). "Measurement in Medicine: the Analysis of Method Comparison Studies." The Statistician 32: 307-317.
Andrew St John1, a. C. P. P. (2013). "Economic Evidence and Point-of-Care Testing. ." Clin Biochem Rev. 34(2): 61-74.
Anunaya Jain, c. a. I. S., 2 and Mahesh Joshi2 (2009). "Comparison of the point-of-care blood gas analyzer versus the laboratory auto-analyzer for the measurement of electrolytes. ." Int J Emerg Med 2(2): 117-120.
Arabadjief D, N. J. (2006). "Assessing glucose meter accuracy." Curr Med Res Opin 22(11): 2167-2174.
Armor B, H. D., Lawler F (2011). "Assessment of the clinical outcome of a symptom-based outpatient hyperglycemia protocol." Diabetes Ther 2(2): 67-80.
B. Bloom, M. a., J. Pott, RN, Y. Freund, MD b, J. Grundlingh, MD a, T. Harris, MD (2014). "The role of venous blood gas in the Emergency Department: a systematic review and meta-analysis." Am J Emerg Med. 32(6): 596-600.
Binila Chacko, J. V. P., Shalom Patole, Jude J Fleming,1 and Ratnasamy Selvakumar2 (2011). "Electrolytes assessed by point-of-care testing – Are the values comparable with results obtained from the central laboratory?" Indian J Crit Care Med 15(1): 24-29.

148
Bloom BM1, G. J., Bestwick JP, Harris T (2014). "The role of venous blood gas in the emergency department: a systematic review and meta-analysis." 21 21(2): 81-88.
Boren SA, C. W. (2010). "Analytical and clinical performance of blood glucose monitors." J Diabetes Sci Technol. 4(1): 84-97.
Brad S. Karon, M., PhD, Renee Scott, Mary F. Burritt, PhD, and Paula J. Santrach, MD (2007). "Comparison of Lactate Values Between Point-of-Care and Central Laboratory Analyzers." American Journal of Clinical Pathology 128: 168-171.
Brandenburg MA1, D. D. (1998). "Comparison of arterial and venous blood gas values in the initial emergency department evaluation of patients with diabetic ketoacidosis." Ann Emerg Med 31(4): 459-465.
Budak YU1, H. K., Polat M. (2012). "Use of a blood gas analyzer and a laboratory autoanalyzer in routine practice to measure electrolytes in intensive care unit patients." BMC Anesthesiol 12: 17.
Byrne AL1, B. M., Chatterji R, Symons R, Pace NL, Thomas PS (2014). "Peripheral venous and arterial blood gas analysis in adults: are they comparable? A systematic review and meta-analysis. ." Respirology. 19(2): 168-175.
Campbell3, R. K. a. (200). "Performance of the Radiometer OSM3 and ABL505 blood gas analysers for determination of sodium, potassium and haemoglobin concentrations." Anaesthesia 55(1): 65-69.
Chakraborty S, B. C., Das S, Sen S (2013). "Delta check: a must in the management of hyponatremia." Clin Chem Lab Med 51(7): 161-162.
Christensen TD1, L. T. (2012). "Precision and accuracy of point-of-care testing coagulometers used for self-testing and self-management of oral anticoagulation therapy. ." J Thromb Haemost 10(2): 251-260.
Christine Papadea1, J. F., Sharon Grant2, Sandra A. Ballard3, John C. Cate IV1, W. Michael Southgate4 and Dilip M. Purohit4. (2002). "Evaluation of the i-STAT Portable Clinical Analyzer for Point-of-Care Blood Testing in the Intensive Care Units of a University Children’s Hospital." Ann Clin Lab Sci 32(3): 231-243.
Cleveland-Noriega D.S., C. J., Paranjape G.,Sutor L.J. (2010). "Evaluation of successful venipuncture in morbidly obese donors." Transfusion, 50(238A): 0041-1132.

149
Corstjens AM1, L. J., van der Horst IC, Spanjersberg R, Lind JS, Tulleken JE, Meertens JH, Zijlstra JG. "Accuracy and feasibility of point-of-care and continuous blood glucose analysis in critically ill ICU patients." Crit Care. 10(5): 135.
Cox, K. e. a. "Prevalence and significance of lactic acidosis in diabetic ketoacidosis." Journal of Critical Care 27(2): 132-137.
CURTIS A. PARVIN, S. F. L., ’ SUSAN M. DEUSER,2 LYNN G. WEAVER,3 LAWRENCE M. LEwIs,3’4 and MITCHELL G. Scovrl,2 (1996). "Impact of point-of-care testing on patients’ length of stay in a large emergency department." Clinical Chemistry 42(5): 711-717.
Deacon B, A. J. (2006). "Fear of needles and vasovagal reactions among phlebotomy patients." J Anxiety Disord. 20(7): 946-960.
Dellinger RP, L. M., Rhodes A, et al (2013). "Surviving Sepsis Campaign: International guidelines for management of severe sepsis and septic shock." Crit Care Med 41: 580-637.
Dheeraj Kapoor1, M. S., Pritam Singh2. (2014). "Point of care blood gases with electrolytes and lactates in adult emergencies." Int J Crit Illn Inj Sci. 4(3): 216-222.
Elizabeth Lee Lewandrowski1, Kent Lewandrowski1, (2013). "Implementing point-of-care testing to improve outcomes." Journal of Hospital Administration 2(2).
Fauchère JC1, B. A., Arlettaz R, Zimmermann-Bär U, Bucher HU. (2002). "Agreement between capillary and arterial lactate in the newborn." Acta Paediatr. 91(1): 78-81.
FederalRegister (1992). CLIA Proficiency Testing criteria. 57: 7002-7186.
Fitzgerald P, G. S., Cross E, Dixon S. (2011). "Cost-effectiveness of point-of-care biomarker assessment for suspected myocardial infarction: the randomized assessment of treatment using panel assay of cardiac markers (RATPAC) trial. ." Acad Emerg Med. 18: 488-495.
Foad Elahi, C. G. R. (2014). "Venipuncture-Induced Complex Regional Pain Syndrome: A Case Report and Review of the Literature." Case Reports in Medicine 2014(613921): 3.
Gallagher E.John , M., Rodriguez Kevin, Touger Michael , MD. (1997). "Agreement Between Peripheral Venous and Arterial Lactate Levels." Annals of Emergency Medicine 29(4): 479-483.
Gleason, O. C. (2003). " Delirium." Am Fam Physician 67(5): 1027-1034.

150
Gokel Y, P. S., Koseoglu Z. et al (2000). "Comparison of blood gas and acid‐base measurements in arterial and venous blood samples in patients with uremic acidosis and diabetic ketoacidosis in the emergency room." Am J Nephrol 20(4): 319-323.
Gonzalez Diaz E., D. J. A. E., Higuera Martin R.M.,Cogolludo Cogolludo Y.,Sanchez Lozano Y. (2010). "Pain related to blood drawing in patients on oral anticoagulant therapy: A comparison of two technique." European Journal of Cardiovascular Nursing, 2010, vol./is. 9/(S43), 1474-5151 (2010) 9(S43): 1474-5151.
Goodacre S1, B. M., Fitzgerald P, Cross E, Collinson P, Gray A, Hall AS. (2011). "The RATPAC (Randomised Assessment of Treatment using Panel Assay of Cardiac markers) trial: a randomised controlled trial of point-of-care cardiac markers in the emergency department." Heart 97(3): 190-196.
Gov.co.uk (2017). " https://www.gov.uk/guidance/good-laboratory-practice-glp-for-safety-tests-on-chemicals#l1. Retrieved 25/05/17
Grieve R, B. R., Vincent J, Mazurkiewicz J (1999). "Near patient testing in diabetes clinics: appraising the costs and outcomes." Health Technol Assess 3(15): 1-74.
Group, T. J. B. D. S. I. C. (2014). "Management of Diabetic Ketoacidosis in Adults. ." Retrieved 24 January 2014, 2014.
H. Gehring1, C. H., L. Dibbelt3, A. Roth-Isigkeit1, K. Gerlach1, J. Schumacher1 andP. Schmucker1 (2002). "Accuracy of point-of-care-testing (POCT) for determining hemoglobin concentrations." Acta Anaesthesiologica Scandinavica. 46(8): 980-986.
Hoedemaekers CW1, K. G. J., Prinsen MA, Willems JL, Van der Hoeven JG. (2008). "Accuracy of bedside glucose measurement from three glucometers in critically ill patients." Crit Care Med. 36(11): 3062-3066.
Hospital, N. C. G. C. I. F. T. i. A. i. (2014, 2014). "Intravenous Fluid Therapy in Adults in Hospital. ." Retrieved 24 January 2014, 2014.
Howanitz JH, H. P. L. r. (2001). "Timeliness as a quality attribute and strategy." Am J Clin Pathol. 116(3): 311-315.
Huskisson, E. C. (1974). "MEASUREMENT OF PAIN." The Lancet 304(7889): 1127-1131.
Ikami A, O. S., Deshpande G et al. (2013). "Can we predict arterial lactate from venous lactate in the ED. ." Am J Emerg Med 31(11): 18-20.
151
Inoue S, E. M., Kotani J, Morita K. (2013). "Accuracy of blood-glucose measurements using glucose meters and arterial blood gas analyzers in critically ill adult patients: systematic review." Critical Care 17(2): 48.
Inouye, S. K. (1994). "The dilemma of delirium: Clinical and research controversies regarding diagnosis and evaluation of delirium in hospitalized elderly medical patients." American Journal of Medicine 97: 278-288.
ISO (2013). "ISO 15197:2013 In vitro diagnostic test systems -- Requirements for blood-glucose monitoring systems for self-testing in managing diabetes mellitus." Retrieved 6/11/15, 2015.
J, P. J. (2002). "Evaluation of the Haemoglobin Colour Scale and Comparison with the HemoCue Haemoglobin Assay." World Health Organ 80(10): 813-816.
J. Martin Bland, D. G. A. (1986). "Statistical methods for assessing agreement between two methods of clinical measurement. ." Lancet. 327(8476): 307-310.
Jason Kendall, s. r. i. a. a. e. m., a Barnaby Reeves, senior lecturer in health services research,b and Michael Clancy, consultant in accident and emergency medicine. (1998). "Point of care testing: randomised controlled trial of clinical outcome." BMJ 316(7137): 1052-1057.
Jaya R Asirvatham, V. M., 1 and Loring Bjornson (2013). "Errors in Potassium Measurement: A Laboratory Perspective for the Clinician." N Am J Med Sci 5(4): 255-2589.
Jayashree M, S. S. (2004). "Diabetic ketoacidosis: predictors of outcome in a pediatric intensive care unit of a developing country." Pediatr Crit Care Med 5(5): 427-433.
Karp BI, L. R. (1993). "Pontine and extrapontine myelinolysis: a neurologic disorder following rapid correction of hyponatremia. ." Medicine (Baltimore). 72(6): 359-373.
Kelly A M, M. R., Kyle E (2001). "Venous pH can safely replace arterial pH in the initial evaluation of patients in the emergency department." Emerg Med J 18(5): 340-342.
Kelly A M, M. R., Kyle E (2004). "Agreement between bicarbonate measured on arterial and venous blood gases." Emerg Med Australas 16(5-6): 407-409.
Kelsey Juster-Switlyka, a. A. G. S. (2016). "Updates in diabetic peripheral neuropathy." Faculty Rev-738 5(F1000).
Kendall JM1, B. G., Clancy MJ (1998). "Point of care testing: randomised controlled trial of clinical outcome." BMJ 316(7137): 1052-1057.

152
Kendall JM1, B. G., Clancy MJ (1999). "Point of care testing in the accident and emergency department: a cost analysis and exploration of financial incentives to use the technology within the hospital." J Health Serv Res Policy. 4(1): 33-38.
Khan AI, V. Y., Gray J, Wians FH Jr, Kroll MH (2006). "The variability of results between point-of-care testing glucose meters and the central laboratory analyzer." Arch Pathol Lab Med. 130(10): 1527-1532.
Koch CG1, R. E., Tang AS3, Hixson ED4, Phillips S5, Sabik JF 3rd6, Henderson JM7, Blackstone EH (2015). "Contemporary bloodletting in cardiac surgical care." Ann Thorac Surg. 99(3): 779-784.
Kumar., V. C. S. K. K. R. S. V. (2013). "A Comparative Study on Reliability of Point of Care Sodium and Potassium Estimation in a Pediatric Intensive Care Unit." Indian J Pediatr 80(9): 731-735.
Kyle J Gunnerson, M. C. E. M. R. P., MD, CM, Dr(HC), FCCP, MCCM (2015). "Lactic Acidosis." Retrieved 12/01/2016, 2016.
Langham BT, H. D. (1993). "The pressor response to venous cannulation: attenuation by prior infiltration with local anaesthetic." Br J Anaesth 70: 519-521.
Lardi A. M., H. C., Mortimer A. J., McCollum C. N. (1998). "Evaluation of the HemoCue for Measuring Intra-operative Haemoglobin Concentrations: A Comparison with the Coulter Max-M." A Comparison with the Coulter Max-M 53(4): 349-352.
Laureno R, K. B. (1997). "Myelinolysis after correction of hyponatremia." Ann Intern Med 1;126(1): 57-62.
Lee-Lewandrowski E1, L. M., Eschenbach K, Camooso C, Nathan DM, Godine JE, Hurxthal K, Goff J, Lewandrowski K (1994). "Utilization and cost analysis of bedside capillary glucose testing in a large teaching hospital: implications for managing point of care testing. ." Am J Med. 97(3): 222-230.
M. NAGLER1, P. R.-M., P. SCHMID1, L. M. BACHMANN2 andW. A. WUILLEMIN (2013). "Accuracy of the point-of-care coagulometer CoaguChek XS in the hands of patients." Journal of Thrombosis and Haemostasis 11(1): 197-199.
Ma O J, R. M. D., Godfrey M M. et al (2003). "Arterial blood gas results rarely influence emergency physician management of patients with suspected diabetic ketoacidosis." Acad Emerg Med 10(8): 836-841.
MacIsaac RJ, L. L., McNeil KJ, Tsalamandris C, Jerums G (2002). "Influence of age on the presentation and outcome of acidotic and hyperosmolar diabetic emergencies." Intern Med J 32(8): 379-385.

153
Mark E Daly, C. V., Mark Walker, Alison Littlefield, K George MM Alberti, and John C Mathers (1997). "Acute effects on insulin sensitivity and diurnal metabolic profiles of a high-sucrose compared with a high-starch diet1–3." Am J Clin Nutr 67: 1186-1196.
Matoo VK, N. K., Dash RJ. (1991). "Clinical profile and treatment outcome of diabetic ketoacidosis." J Assoc Physicians India 39(5): 379-381.
Medicaid, C. f. M. a. (2016). "Clinical Laboratory Improvement Amendments (CLIA)." Retrieved 12/01/2016, 2016.
Menchine M1, P. M., Agy C, Bach D, Arora S. (2011). "Diagnostic accuracy of venous blood gas electrolytes for identifying diabetic ketoacidosis in the emergency department." Acad Emerg Med. 18(10): 1105-1108.
Mimoz O1, F. D., Médard A, Soubiron L, Debaene B, Dahyot-Fizelier C (2011). "Reliability of the HemoCue® hemoglobinometer in critically ill patients: a prospective observational study. ." Minerva Anestesiol 77(10): 979-985.
Mock T, M. D., Yatscoff R (1995). "Evaluation of the i-STAT system: a portable chemistry analyzer for the measurement of sodium, potassium, chloride, urea, glucose, and hematocrit. ." Clin Biochem 28(2): 187-192.
Morris SS, e. a. (1999). " Precision, accuracy, and reliability of hemoglobin assessment with use of capillary blood." Am J Clin Nutr 69: 1243-1248.
Mortensen, J. (1967). "Clinical sequelae from arterial needle puncture, cannulation, and
incision." Circulation 35: 1118-1123.
MS Elisaf , A. T., Katopodis , Siamopoulos (1996). "Acid–base and electrolyte disturbances in patients with diabetic ketoacidosis." Diabetes Res Clin Pract 34: 23-27.
NICE (2015). "Management of Hyponatraemia." 06/11/15.
Pavlin DJ, L. S., Rapp SE, Nessly ML, Keyes HJ. (1993). "Vaso-vagal reactions in an ambulatory Surgery Center." Aalesth Analg 76: 931-935.
PC Hebert, Y. E., Martin C, Blajchman MA, Wells G, Marshall J, Tweeddale M, Pagliarello G, Schweitzer I. (2001). "Is a low transfusion threshold safe in critically ill patients with cardiovascular diseases? ." Crit CareMed. 29: 227-234.

154
Perkov, Z. F.-M. t. a. S. (2006). "Comparability of point-of-care whole-blood electrolyte and substrate testing using a Stat Profile Critical Care Xpress analyzer and standard laboratory methods." Clin Chem Lab Med 44(7): 898-903.
Peterson J, G. D., Tacker D, Okorodudu A. Mohammed A, Cardenas V. (2008). "Glucose measurement in the intensive care unit." Clin Chim Acta 396(1-2): 10-13.
Quinn LM1, H. N., Wilkin R, Sheikh A (2013). " Arterial blood gas analysers: accuracy in determining haemoglobin, glucose and electrolyte concentrations in critically ill adult patients. ." Br J Biomed Sci 70(3): 97-100.
R Boyd, B. L., and P Stuart (2005). "Capillary versus venous bedside blood glucose estimations. ." Emerg Med J. 22(3): 177-179.
R King, A. C. (2000). "Performance of the radiometer OSM3 and ABL505 blood gas analysers for determination of sodium, potassium and haemoglobin concentrations. ." Anaesthesia. 55(1): 65-69.
R.N. Bilkovski, C. M. C., S. Adhikari, I. Nasr. (2004). "Arterial and venous ionized calcium measurements: Is there a difference?" Annals of Emergency Medicine 44(4): S56.
Rafdzah Zaki, * Awang Bulgiba,1 Roshidi Ismail,1 and Noor Azina Ismail2 (2012). "Statistical Methods Used to Test for Agreement of Medical Instruments Measuring Continuous Variables in Method Comparison Studies: A Systematic Review. ." Iran J Basic Med Sci 16(6): 803-803.
Rajamäki, A. (1980). "Limits of performance for measurement of blood haemoglobin concentration, number concentration of erythrocytes, and erythrocyte Volume fraction in interlaboratory trials." Scand J Clin Lab Invest 40: 563-566.
Ray JG, P. J., Hamielec C (2002). "Use of a rapid arterial blood gas analyzer to estimate blood hemoglobin concentration among critically ill adults." Crit Care 6(1): 72-75.
Rebel A1, R. M., Fahy BG (2006). "Accuracy of point-of-care glucose measurements." Arch Pathol Lab Med 130(10): 1527-1532.
Rechner I. J., T. A., Davies A. F., Imong S (2002). "Evaluation of the HemoCue Compared with the Coulter STKS for Measurement of Neonatal Haemoglobin." Arch. Dis. Child Fetal Neonatal Ed 86(3): 188-189.
Réminiac, F. M. S.-E., Christophe MD; Runge, Isabelle MD; Ayé, Denis Ykpé MD; Benzekri-Lefevre, Dalila MD; Mathonnet, Armelle MD; Boulain, Thierry MD (2012). "Are Central Venous Lactate and Arterial Lactate Interchangeable? A Human Retrospective Study." Anesthesia & Analgesia 115(3): 605-610.

155
Rits, I. A. (1964). "Declaration of Helsinki. Recommendations guidings doctors in clinical research." World Medical Journal 11: 281.
Roberts J, H. J. (1998). Clinical procedures in emergency medicine., Saunders.
Sachs C, R. P., Chaneac M, Kindermans C, Dechaux (1991). "In vitro evaluation of a heparinized blood sampler for ionized calcium measurement." Ann Clin Biochem 28(3): 240-244.
Sanchis-Gomar, F. (2013). "Hemoglobin Point-of-Care Testing. The HemoCue System." Journal of Laboratory Automation 18(3): 198-205.
Schneider J1, D. R., Westphal K, Vettermann J. (1997). "The i-STAT analyzer. A new, hand-held device for the bedside determination of hematocrit, blood gases, and electrolytes." Anaesthesist. 46(8): 704-714.
Seguin P1, K. A., Chanavaz C, Morcet J, Mallédant Y. (2010). "Determination of capillary hemoglobin levels using the HemoCue system in intensive care patients. ." J Crit Care 26(4): 423-427.
Seok Hui Kang, K. H. C., Jong Won Park, Kyung Woo Yoon, and Jun Young (2014). "Whole blood versus serum ionized calcium concentrations in dialysis patients." Korean J Intern Med 29(2): 226-230.
Simon J, G. A., Clarke P, Wade A, Neil A, Farmer A (2008). " Diabetes Glycaemic Education and Monitoring Trial Group Cost effectiveness of self monitoring of blood glucose in patients with non-insulin treated type 2 diabetes: economic evaluation of data from the DiGEM trial." BMJ 336: 1177-1180.
Slater-MacLean L1, C. G., Chin D, Shalapay C, Binette T, Hegadoren K, Newburn-Cook C. (2008). "Accuracy of glycemic measurements in the critically ill." Diabetes Technol Ther. 10(3): 169-177.
Solá E, G. S., García-Torres S, Cubells P, Morillas C, Hernández-Mijares A (2006). "Management of diabetic ketoacidosis in a teaching hospital." Acta Diabetol 43(4): 127-130.
Stadlbauer V1, W. S., Stojakovic T, Smolle KH. (2011). "Comparison of 3 different multianalyte point-of-care devices during clinical routine on a medical intensive care unit." J Crit Care. 26(4): 433.e431-411.
Sujit R. Jangam, P. D., Gary Hayter, M.S., and Timothy C. Dunn, Ph.D (2013). "Impact of Glucose Measurement Processing Delays on Clinical Accuracy and Relevance." J Diabetes Sci Technol. 7(3): 660-668.

156
Taddio A, S. V., Gilbert-MacLeod C, Katz J (2002). "Conditioning and hyperalgesia in newborns exposed to repeated heel lances." JAMA. 288(7): 857-861.
Talayero Gimenez De Azcarate M., G. F. C., Chico Fernandez M.,Montejo Gonzalez J.C.,Alted Lopez E. (2013). "Agreement between arterial and peripheral venous lactate levels in trauma patients." Intensive Care Medicine 39(S437): 0342-4642.
Thomas LE, K. M., Bakst G, Busch RS, Hamilton RA, Abelseth JM (2008). "A glucose meter accuracy and precision comparison: the FreeStyle Flash Versus the Accu-Chek Advantage, Accu-Chek Compact Plus, Ascensia Contour, and the BD Logic." Diabetes Technol Ther. 10(2): 102-110.
Thomas, R. M. (2004). "Anaemia in diabetes." Acta Diabetol.
Wagner A, R. A., Brill HL, Wienhausen-Wilke V, Rottmann M, Sondern K, Angelkort B (1999). "Therapy of severe diabetic ketoacidosis. Zero-mortality under very-low-dose insulin application." Diabetes Care 22(5): 674-677.
Wilding, K. A. E. a. P. (1993). "Evaluation of a Novel Point-of-Care System, the i-STAT Portable Clinical Analyzer." CLIN. CHEM 39(2): 283-287.
Yamada K., K. I., Hida T. (2008). "Cubital fossa venipuncture sites based on anatomical variations and relationships of cutaneous veins and nerves. ." Clinical Anatomy 21(4): 307-313.
Yang KC, S. B., Tsai FJ, Peng CT. (2002). "The comparison between capillary blood sampling and arterial blood sampling in an NICU." Acta Paediatr Taiwan 43(3): 124-126.
Yildizdaş D, Y. H., Yilmaz HL, Sertdemir Y (2004). "Correlation of simultaneously obtained capillary, venous, and arterial blood gases of patients in a paediatric intensive care unit." Arch Dis Child. 89(2): 176-180.
Yuan R.T.W., C. M. J. (1985). "Lateral antebrachial cutaneous nerve injury as a complication of phlebotomy " Plastic and Reconstructive Surgery 76(2): 299-300.
Zavorsky GS1, C. J., Mayo NE, Gabbay R, Murias JM (2006). "Arterial versus capillary blood gases: a meta-analysis." Respir Physiol Neurobiol. 155(3): 268-279.


![Capillary thermostatting in capillary electrophoresis · Capillary thermostatting in capillary electrophoresis ... 75 µm BF 3 Injection: ... 25-µm id BF 5 capillary. Voltage [kV]](https://img.dokumen.tips/doc/110x75/5c176ff509d3f27a578bf33a/capillary-thermostatting-in-capillary-electrophoresis-capillary-thermostatting.jpg)