Embed Size (px)
DESCRIPTION
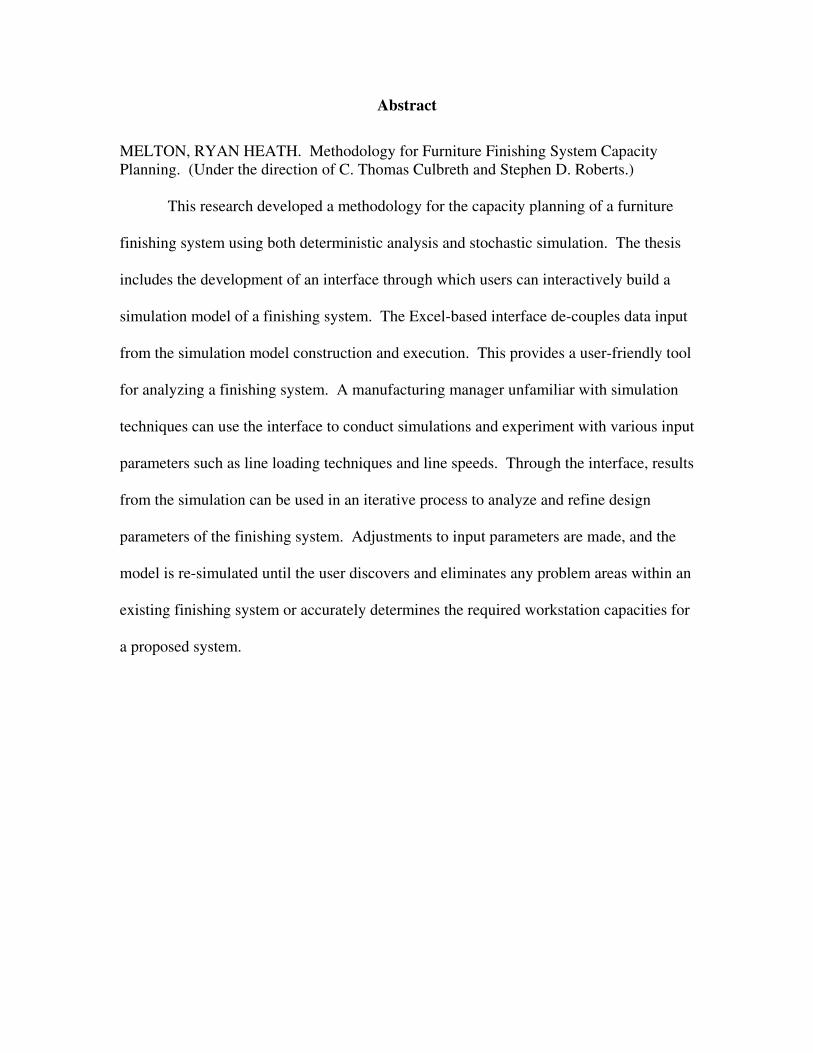
This research developed a methodology for the capacity planning of a furniturefinishing system using both deterministic analysis and stochastic simulation. The thesisincludes the development of an interface through which users can interactively build asimulation model of a finishing system. The Excel-based interface de-couples data inputfrom the simulation model construction and execution. This provides a user-friendly toolfor analyzing a finishing system. A manufacturing manager unfamiliar with simulationtechniques can use the interface to conduct simulations and experiment with various inputparameters such as line loading techniques and line speeds.
Citation preview
Abstract
MELTON, RYAN HEATH. Methodology for Furniture Finishing System CapacityPlanning. (Under the direction of C. Thomas Culbreth and Stephen D. Roberts.)
This research developed a methodology for the capacity planning of a furniture
finishing system using both deterministic analysis and stochastic simulation. The thesis
includes the development of an interface through which users can interactively build a
simulation model of a finishing system. The Excel-based interface de-couples data input
from the simulation model construction and execution. This provides a user-friendly tool
for analyzing a finishing system. A manufacturing manager unfamiliar with simulation
techniques can use the interface to conduct simulations and experiment with various input
parameters such as line loading techniques and line speeds. Through the interface, results
from the simulation can be used in an iterative process to analyze and refine design
parameters of the finishing system. Adjustments to input parameters are made, and the
model is re-simulated until the user discovers and eliminates any problem areas within an
existing finishing system or accurately determines the required workstation capacities for
a proposed system.

ii
Dedication
To my family for their love and encouragement and to the Almighty who gives mestrength and wisdom.
iii
Biography
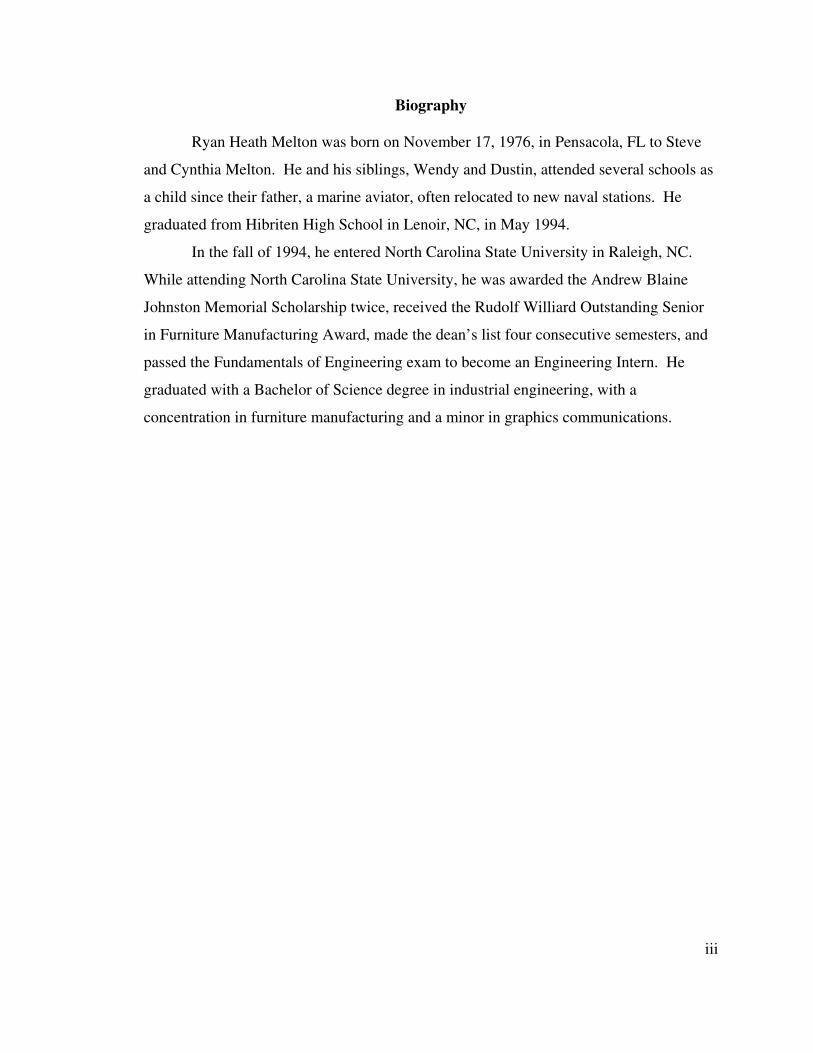
Ryan Heath Melton was born on November 17, 1976, in Pensacola, FL to Steve
and Cynthia Melton. He and his siblings, Wendy and Dustin, attended several schools as
a child since their father, a marine aviator, often relocated to new naval stations. He
graduated from Hibriten High School in Lenoir, NC, in May 1994.
In the fall of 1994, he entered North Carolina State University in Raleigh, NC.
While attending North Carolina State University, he was awarded the Andrew Blaine
Johnston Memorial Scholarship twice, received the Rudolf Williard Outstanding Senior
in Furniture Manufacturing Award, made the dean’s list four consecutive semesters, and
passed the Fundamentals of Engineering exam to become an Engineering Intern. He
graduated with a Bachelor of Science degree in industrial engineering, with a
concentration in furniture manufacturing and a minor in graphics communications.

iv
Acknowledgements
I thank Dr. C. Thomas Culbreth and Dr. Stephen Roberts, Co-Chairs of my
advisory committee, for the time and effort they have given in the preparation of this
thesis. I also thank Dr. Jeff Joines for his support and help given to this study, and Dr.
Don Ridgeway for serving as a Minor Representative on my committee. It has been a
pleasure to work with you all.
v
Table of Contents
Page
LIST OF TABLES. .…………………………………………………………………….vii
LIST OF FIGURES. .…………………………………………………………………..viii
1. INTRODUCTION. .………………………………………………………………….1
1.1 The Furniture Industry. .…………………………………………………………11.2 Methods of Finishing. .…………………………………………………………..21.3 Finishing System Characteristics. .………………………………………………41.4 Materials Schedule. ……………………………………………………………...51.5 Finishing Materials – Types of Coatings. ……………………………………….71.6 Material Handling. .……………………………………………………………...81.7 Finishing System Specifications. .……………………...………………………111.8 Deterministic Analysis Example. .……………………………………………...111.9 Deterministic vs. Stochastic Modeling. .……………………………………….151.10 Model Features. .…………..……………………………………………....…..171.11 Finishing System Layout. .…………..………………………………………..181.12 Scope of the Study. .……………...……..….…………………………………22
2. LITERATURE REVIEW. .………………………..………………………………..24
2.1 Related Literature. .……………………………………………………………..242.2 Related Simulation Projects. .…………………………………………………..262.3 Simulation Used in Industry. .…………………..……………………………...272.4 Simulation Limitations. .……………………………………………………….282.5 Summary of Available Literature. .…………………………………………….29
3. MODELING THE FINISHING OPERATION. ...………………………………….30
3.1 Modeling Tool. ....……………………………………………………………...303.2 Spreadsheet Model. ...…………………………………………………………..303.3 Simulation Replications…………………………………………………………393.4 Spreadsheet/Simulation Interaction. …………………………………………...403.5 Simulation Model. …...…………………………………………………………433.6 Scope and Objectives. ………………………………………………………….433.7 Simulation Model Construction. ...……………………………………………..443.8 Simulation Model Logic. ………………………………………………………453.9 Simulation Model Animation. ..………………………………………………..56
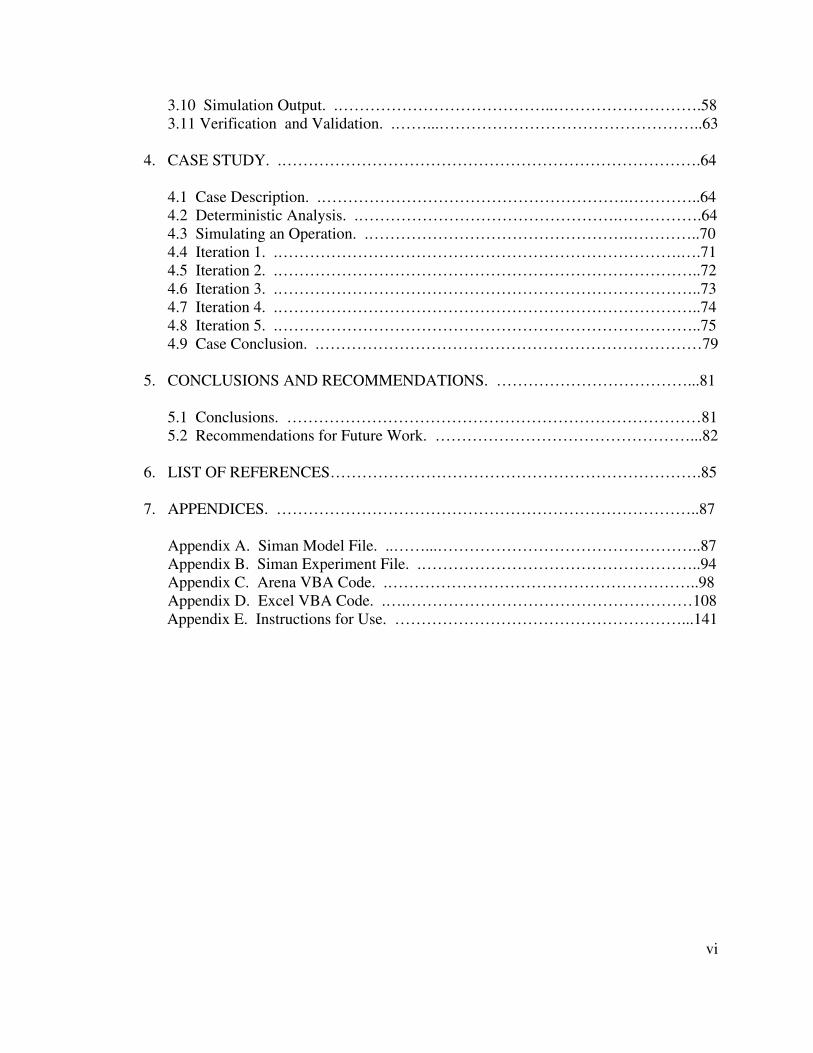
vi
3.10 Simulation Output. .…………………………………..……………………….583.11 Verification and Validation. .……...…………………………………………..63
4. CASE STUDY. .…………………………………………………………………….64
4.1 Case Description. .………………………………………………….…………..644.2 Deterministic Analysis. .………………………………………….…………….644.3 Simulating an Operation. .………………………………………….…………..704.4 Iteration 1. .………………………………………………………………….….714.5 Iteration 2. .……………………………………………………………………..724.6 Iteration 3. .……………………………………………………………………..734.7 Iteration 4. .……………………………………………………………………..744.8 Iteration 5. .……………………………………………………………………..754.9 Case Conclusion. .………………………………………………………………79
5. CONCLUSIONS AND RECOMMENDATIONS. ………………………………...81
5.1 Conclusions. ……………………………………………………………………815.2 Recommendations for Future Work. …………………………………………...82
6. LIST OF REFERENCES…………………………………………………………….85
7. APPENDICES. ……………………………………………………………………..87
Appendix A. Siman Model File. ..……...…………………………………………..87Appendix B. Siman Experiment File. .……………………………………………..94Appendix C. Arena VBA Code. .…………………………………………………..98Appendix D. Excel VBA Code. .….………………………………………………108
Appendix E. Instructions for Use. ………………………………………………...141
vii
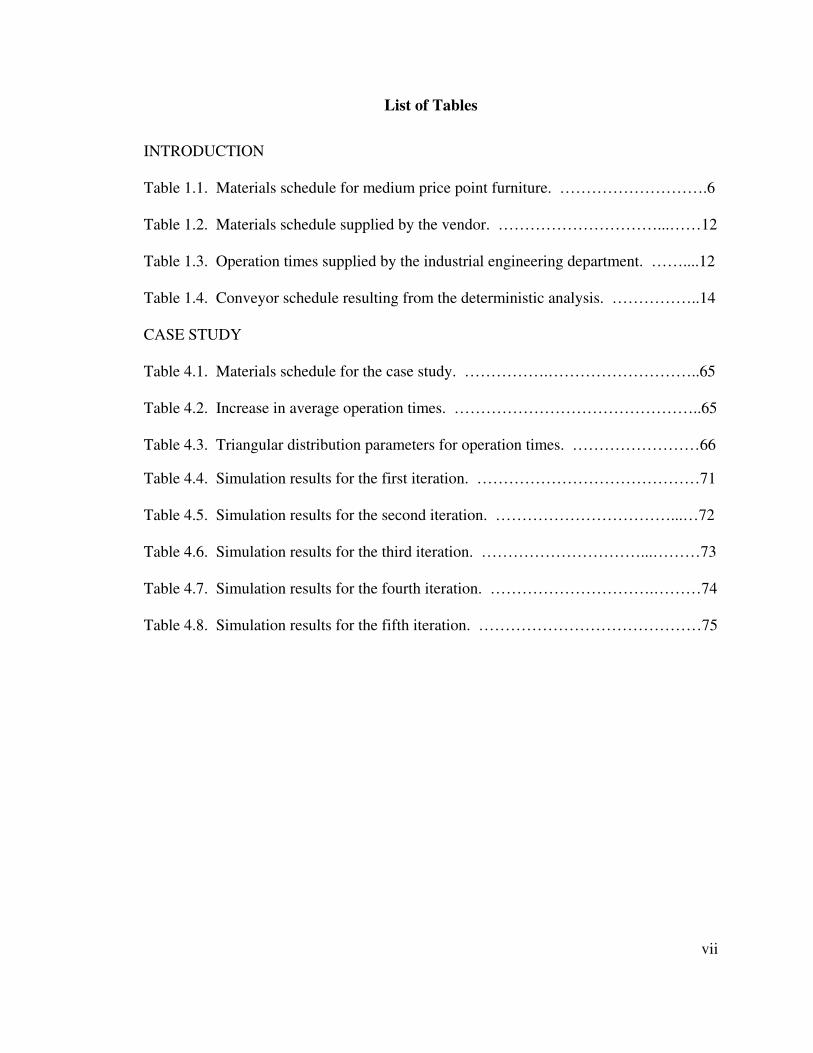
List of Tables
INTRODUCTION
Table 1.1. Materials schedule for medium price point furniture. ……………………….6
Table 1.2. Materials schedule supplied by the vendor. …………………………...……12
Table 1.3. Operation times supplied by the industrial engineering department. ……....12
Table 1.4. Conveyor schedule resulting from the deterministic analysis. ……………..14
CASE STUDY
Table 4.1. Materials schedule for the case study. …………….………………………..65
Table 4.2. Increase in average operation times. ………………………………………..65
Table 4.3. Triangular distribution parameters for operation times. ……………………66
Table 4.4. Simulation results for the first iteration. ……………………………………71
Table 4.5. Simulation results for the second iteration. ……………………………...…72
Table 4.6. Simulation results for the third iteration. …………………………...………73
Table 4.7. Simulation results for the fourth iteration. ………………………….………74
Table 4.8. Simulation results for the fifth iteration. ……………………………………75
viii
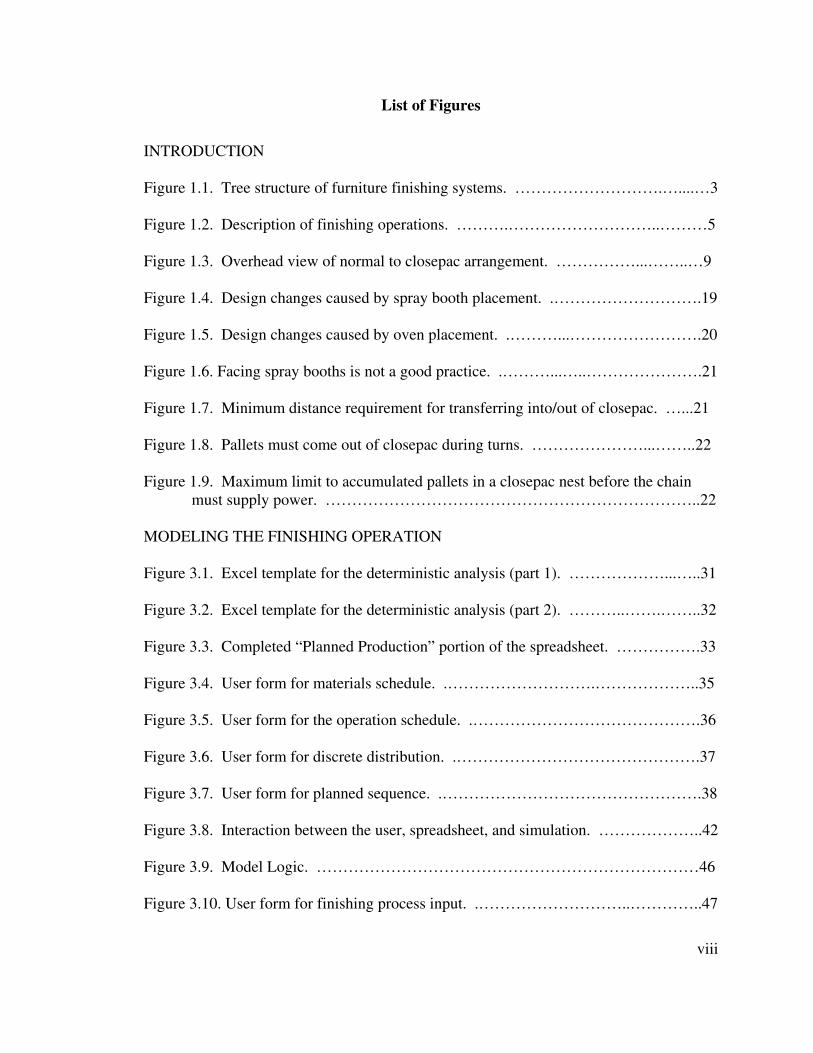
List of Figures
INTRODUCTION
Figure 1.1. Tree structure of furniture finishing systems. ……………………….…....…3
Figure 1.2. Description of finishing operations. ……….………………………..………5
Figure 1.3. Overhead view of normal to closepac arrangement. ……………...……..…9
Figure 1.4. Design changes caused by spray booth placement. .……………………….19
Figure 1.5. Design changes caused by oven placement. .………...…………………….20
Figure 1.6. Facing spray booths is not a good practice. .………...…..………………….21
Figure 1.7. Minimum distance requirement for transferring into/out of closepac. …...21
Figure 1.8. Pallets must come out of closepac during turns. …………………...……..22
Figure 1.9. Maximum limit to accumulated pallets in a closepac nest before the chainmust supply power. ……………………………………………………………..22
MODELING THE FINISHING OPERATION
Figure 3.1. Excel template for the deterministic analysis (part 1). ………………...…..31
Figure 3.2. Excel template for the deterministic analysis (part 2). ………..…….……..32
Figure 3.3. Completed “Planned Production” portion of the spreadsheet. …………….33
Figure 3.4. User form for materials schedule. .……………………….………………..35
Figure 3.5. User form for the operation schedule. .…………………………………….36
Figure 3.6. User form for discrete distribution. .……………………………………….37
Figure 3.7. User form for planned sequence. .………………………………………….38
Figure 3.8. Interaction between the user, spreadsheet, and simulation. ………………..42
Figure 3.9. Model Logic. ………………………………………………………………46
Figure 3.10. User form for finishing process input. .………………………..…………..47
ix
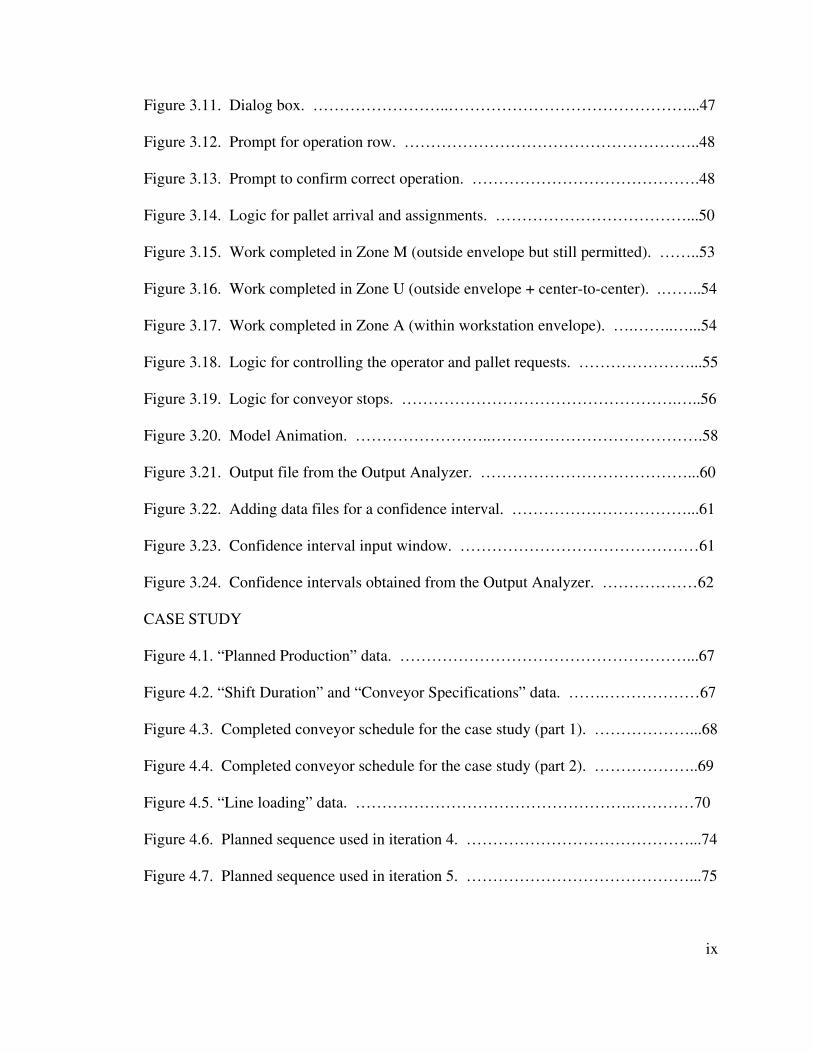
Figure 3.11. Dialog box. ……………………..………………………………………...47
Figure 3.12. Prompt for operation row. ………………………………………………..48
Figure 3.13. Prompt to confirm correct operation. …………………………………….48
Figure 3.14. Logic for pallet arrival and assignments. ………………………………...50
Figure 3.15. Work completed in Zone M (outside envelope but still permitted). ……..53
Figure 3.16. Work completed in Zone U (outside envelope + center-to-center). .……..54
Figure 3.17. Work completed in Zone A (within workstation envelope). ….……..…...54
Figure 3.18. Logic for controlling the operator and pallet requests. …………………...55
Figure 3.19. Logic for conveyor stops. …………………………………………….…..56
Figure 3.20. Model Animation. ……………………..………………………………….58
Figure 3.21. Output file from the Output Analyzer. …………………………………...60
Figure 3.22. Adding data files for a confidence interval. ……………………………...61
Figure 3.23. Confidence interval input window. ………………………………………61
Figure 3.24. Confidence intervals obtained from the Output Analyzer. ………………62
CASE STUDY
Figure 4.1. “Planned Production” data. ………………………………………………...67
Figure 4.2. “Shift Duration” and “Conveyor Specifications” data. …….………………67
Figure 4.3. Completed conveyor schedule for the case study (part 1). ………………...68
Figure 4.4. Completed conveyor schedule for the case study (part 2). ………………..69
Figure 4.5. “Line loading” data. …………………………………………….…………70
Figure 4.6. Planned sequence used in iteration 4. ……………………………………...74
Figure 4.7. Planned sequence used in iteration 5. ……………………………………...75
x
Figure 4.8. Final design parameters (part 1). ……………………………………..……77
Figure 4.9. Final design parameters (part 2). …………………………………………..78
1
Introduction
1.1 The Furniture Industry
The U.S. furniture industry is one of the most significant producers of furniture in the
world. According to an article in Wood and Wood Products, the estimated value of
residential furniture shipments for 1999 was 25 billion dollars, and the value of office
furniture shipments for 1999 was estimated at 12.25 billion dollars. Both values are
expected to increase in the year 2000 (Adams and Iwanski, 2000).
The residential furniture industry can be broken into two product categories of either
upholstered or casegoods furniture. Upholstered furniture includes sofas, love seats, and
chairs. According to a 1997 U.S. Census report, there are over 1700 establishments in
the United States that produce upholstered furniture (U.S. Dept. of Commerce, 1999a).
Upholstered furniture frames may have few or no finished parts. For this reason,
upholstered furniture will not be considered in this study.
Non-upholstered residential furniture refers to the wood furniture found in the home
and includes bedroom, dining room, and occasional furniture. The 1997 U.S. Census
report states that there are over 3800 establishments in the United States that produce this
type of furniture. Of these establishments, 743 of them have 20 or more employees (U.S.
Dept. of Commerce, 1999b). Casegoods furniture is typically finished after the assembly
process when parts are in a three-dimensional state.
As reported by the 1997 U.S. Census report, 676 establishments in the United States
produce office or ready-to-assemble (RTA) furniture (U.S. Dept. of Commerce, 1999c).
RTA furniture is typically created using flat panels and European 32-mm construction.
The flat panels allow for efficient manufacturing but often lack the complex styling of
traditional furniture. The finishing of RTA furniture is often done before assembly while
the parts are still in a two-dimensional state. This type of finishing system is known as
flat line finishing. This thesis will briefly discuss flat line finishing systems but will not
provide any great detail.
2
1.2 Methods of Finishing
Furniture is a fashion product with aesthetic as well as functional characteristics.
The finish applied to an article of furniture is an important contributor to the final beauty
of the piece. The chemical coatings that make up the finish also serve to provide a
smooth, protective covering for the wood. Finishing materials are normally applied as a
wet film, and the application of the finish can account for as much as 10 percent of the
cost of manufacturing. Surface treatments for furniture can be applied as either a wet
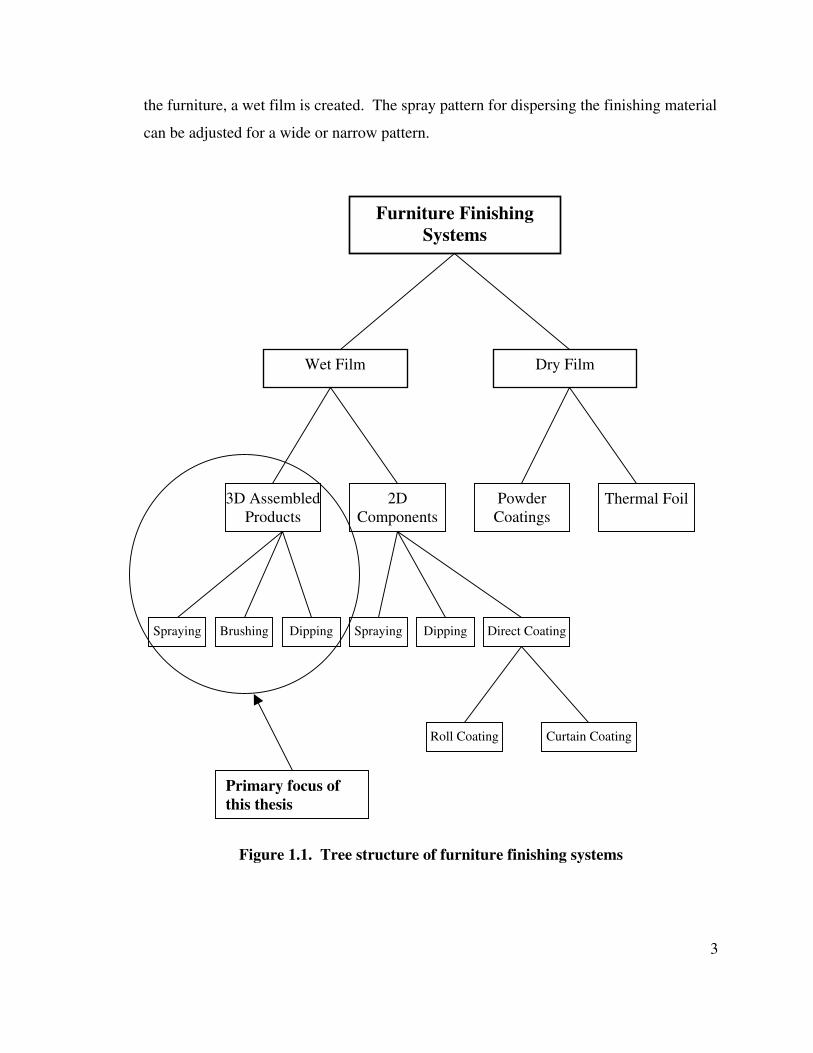
film or dry film. Figure 1.1 highlights the various furniture finishing processes currently
in use.
The application of a complete finish to a piece of furniture is a multi-step process
usually involving a series of stations. Each station may apply a different type of finishing
material. The goal is to eventually build a film on the surface of the furniture that is of
the right color, sheen, and depth. The two basic ingredients in a finish are solids (resins)
and solvents. The resins are the actual film forming materials. The solvents act as a
vehicle to carry and disperse the resins. Typical resins include nitrocellulose, acrylics,
vinyls, and polyesters while typical solvents include alcohol, acetones, acetates, and
water.
There are several limiting constraints that must be taken into consideration when
selecting a finishing method with the equipment cost and degree of styling being the
major concerns. Two popular methods for applying finish are to spray the finish onto
assembled items and to use roll, curtain, or spray coating equipment to finish two-
dimensional components. The primary finishing method is to spray the finish onto the
assembled parts. This study focuses on design characteristics of spray finishing systems
that are used for assembled items as seen in Figure 1.1.
Spray finishing is the most widely used finishing method in the United States.
Prak and Myers claim, “A major reason for using the spray process is that it allows such a
variety of shapes and sizes to be finished on the same equipment” ( Prak and Myers,
1981a). In a spraying process, the finishing material passes through a spray gun that
transforms the material into small droplets. These droplets then travel through the air
and are dispersed onto the surface of the furniture. As droplets build up on the surface of
3
the furniture, a wet film is created. The spray pattern for dispersing the finishing material
can be adjusted for a wide or narrow pattern.
Figure 1.1. Tree structure of furniture finishing systems
Furniture FinishingSystems
Dry Film
3D AssembledProducts
2DComponents
PowderCoatings
Thermal Foil
Spraying Brushing Dipping Direct Coating
Roll Coating Curtain Coating
Spraying Dipping
Wet Film
Primary focus ofthis thesis
4
A flat-line finishing system uses roll coating to finish individual components
rather than an assembled piece of furniture. There are variations in the equipment used
for this process, but the basic machine is the roll coater. The roll coater involves a doctor
roll and application roll. The thickness of the coat depends on the spacing between the
doctor roll and the application roll. Another type of machine used in a flat line system is
the curtain coater. The curtain coater allows a thin sheet of finishing material to drop
from a head into a trough. When a panel passes under the head, the curtain of finishing
material applies a coat onto the surface of the panel.
An obvious difference between the spray system and the flat-line system is the
transfer efficiency. The spray system results in overspray that must be contained. Spray
systems require spraying operations to take place in spray booths that collect excess
finishing material. The collection of this material is done to prevent fire hazards and to
conform to indoor air quality regulations set by the Occupational Safety and Health
Administration (OSHA). A flat-line system has the advantage of maximum transfer
efficiency and minimum waste. Any finishing material that is not applied to a panel is
recycled through the system and used for the following panels. However, the most
notable disadvantages of a flat-line system are its limitation to panel parts and its inability
to produce color styled finishes. Spray finishing requirements will be further discussed in
the next section of this report.
1.3 Finishing System Characteristics
The common operations that are found in most finishing operations are spraying,
sanding, wiping, and drying. Figure 1.2 gives a brief description of each operation and
the order of their occurrence.
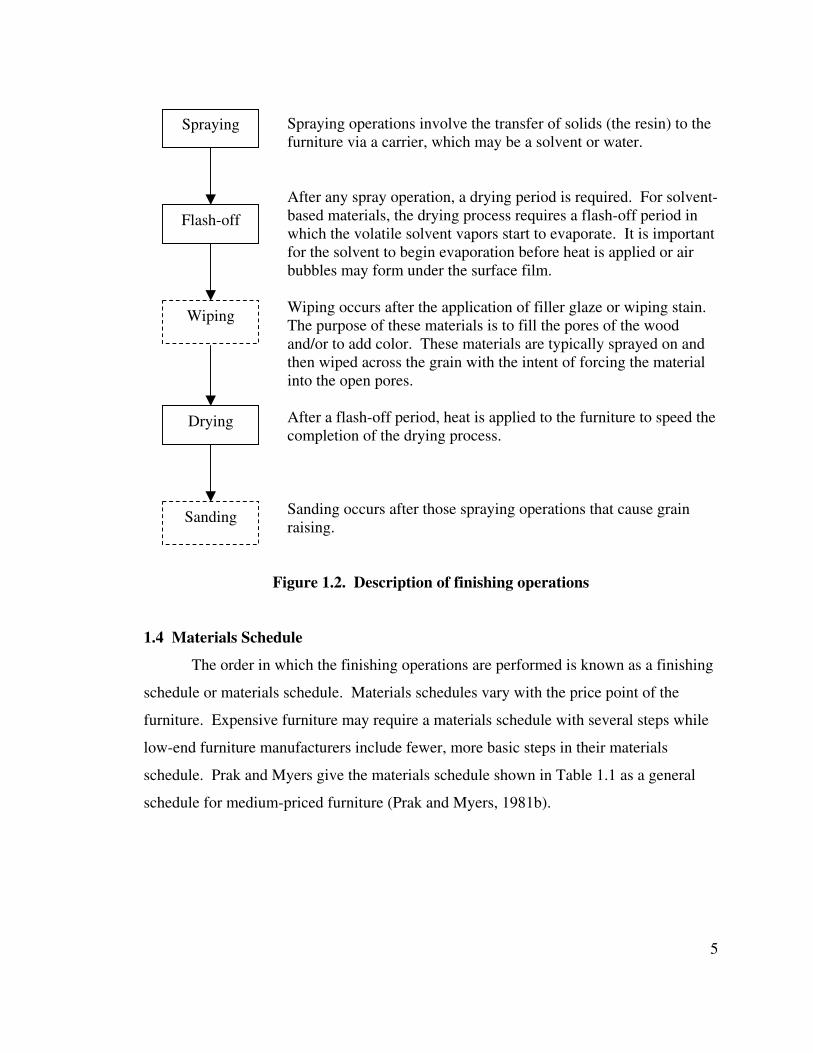
5
Spraying operations involve the transfer of solids (the resin) to thefurniture via a carrier, which may be a solvent or water.
After any spray operation, a drying period is required. For solvent-based materials, the drying process requires a flash-off period inwhich the volatile solvent vapors start to evaporate. It is importantfor the solvent to begin evaporation before heat is applied or airbubbles may form under the surface film.
Wiping occurs after the application of filler glaze or wiping stain.The purpose of these materials is to fill the pores of the woodand/or to add color. These materials are typically sprayed on andthen wiped across the grain with the intent of forcing the materialinto the open pores.
After a flash-off period, heat is applied to the furniture to speed thecompletion of the drying process.
Sanding occurs after those spraying operations that cause grainraising.
Figure 1.2. Description of finishing operations
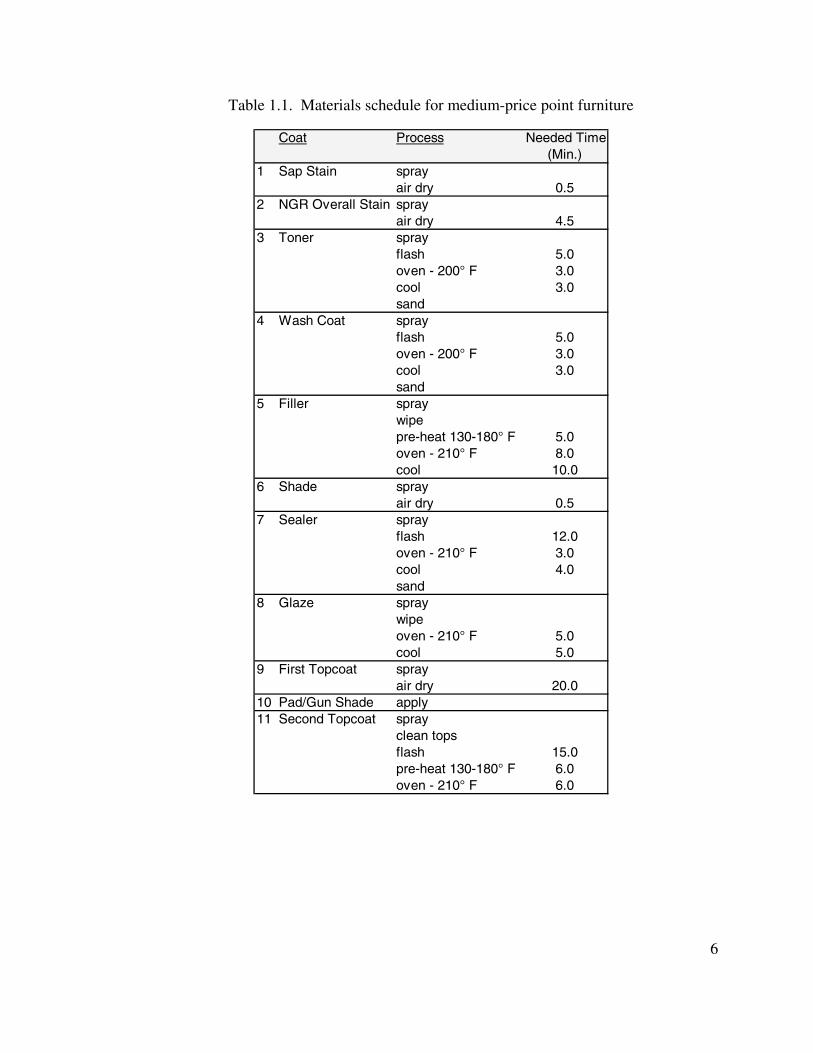
1.4 Materials Schedule
The order in which the finishing operations are performed is known as a finishing
schedule or materials schedule. Materials schedules vary with the price point of the
furniture. Expensive furniture may require a materials schedule with several steps while
low-end furniture manufacturers include fewer, more basic steps in their materials
schedule. Prak and Myers give the materials schedule shown in Table 1.1 as a general
schedule for medium-priced furniture (Prak and Myers, 1981b).
Spraying
Flash-off
Drying
Sanding
Wiping
6
Table 1.1. Materials schedule for medium-price point furniture
Coat Process Needed Time(Min.)
1 Sap Stain sprayair dry 0.5
2 NGR Overall Stain sprayair dry 4.5
3 Toner sprayflash 5.0oven - 200° F 3.0cool 3.0sand
4 Wash Coat sprayflash 5.0oven - 200° F 3.0cool 3.0sand
5 Filler spraywipepre-heat 130-180° F 5.0oven - 210° F 8.0cool 10.0
6 Shade sprayair dry 0.5
7 Sealer sprayflash 12.0oven - 210° F 3.0cool 4.0sand
8 Glaze spraywipeoven - 210° F 5.0cool 5.0
9 First Topcoat sprayair dry 20.0
10 Pad/Gun Shade apply11 Second Topcoat spray
clean topsflash 15.0pre-heat 130-180° F 6.0oven - 210° F 6.0
7
1.5 Finishing Materials – Types of Coatings
The most common finishing materials used in a spray finishing system include
bleaches, stains, washcoats, fillers or wiping stains, sealers, toners, and topcoats. Each
material serves a specific function, and the application times for each material vary.
Bleaching is done to provide a uniform background on which to apply a finish.
There is a fire hazard associated with the bleaching process since the bleaches often
contain oxidizing agents. This often results in an entirely separate bleaching set up with
its own conveyor system. For this reason, many companies do not include bleaching in
their finishing schedule.
The two primary types of stains are pigmented stains or dye stains. Pigment
stains contain insoluble particles that sit on top of the wood while dye stains contain
soluble colorants that penetrate the wood. Sap stains are applied to even up light and
dark wood areas. The time it takes to apply sap stain depends on the color variations of
the wood used in the furniture. Body stains or overall stains are spayed over the entire
surface of the article of furniture in order to provide an undertone color.
Washcoats are used to raise the wood fibers for sanding as well as to seal the
overall stain to prevent excessive penetration of subsequent coats. The washcoat is
sanded to provide a smooth surface for the next coat. A filler glaze or wiping stain is
used to fill the large pores and provide a primary coloring coat. Application of the
wiping stain does not have to be precise since the majority of the material is wiped off.
Sealers are similar to the washcoat in that they seal the underlying coats and raise
the grain for sanding. The sealer is colorless and used to provide a depth to the finish.
The sealer coat is sanded in order to provide a smooth surface for the topcoat
applications. Toners are used to even up any remaining variations in color and to
highlight grain effects. Application of toner requires a well-trained operator since control
of this operation ensures a consistent finish appearance.
Topcoats are the transparent coats of lacquer that provide depth and protection to
the underlying wood and are typically applied in multiple coats. The application of
topcoats may take longer than other spraying operations since the goal of topcoats is to
8
achieve a thick coat of material without causing runs. Often topcoats are rubbed or
polished to provide a smooth surface with high gloss.
1.6 Material Handling Systems
The material handling system is an important component of the finishing room
with conveyors being the most popular type of material handling systems for finishing
rooms. Conveyors can easily transport the articles of furniture between stations and help
to pace the work as well as create uniformity between job loads (Prak and Myers, 1981c).
Conveyors move the material, facilitate proper height and position during the spraying
operation, dictate the operation times for each stage of the finishing process, and define
the capacity in terms of pallets per shift. The conveyor also helps to eliminate labor cost
that would be needed in a non-conveyorized finishing room. However, a disadvantage of
conveyors is the difficulty in line balancing. The different operations have different
process times requiring the conveyor to travel at the pace of the slowest operation or
requiring larger crews at labor intensive operations.
There are several different types of conveyors that are used in finishing rooms,
each having advantages and disadvantages under certain operating circumstances. The
pallet conveyor is one of the more popular ones. This conveyor consists of wheeled
pallets that are usually about 6’ x 2.5’ with a removable pin in the middle. The pin
travels in a slot in which dogs on a chain catch and pull the pins, therefore, moving the
pallets. The pallets are equally spaced with a center-to-center distance ranging from 6 to
12 feet. The pins are removable, which allows for manual manipulation of the carts. The
wheeled pallets can either travel along a track on a raised platform or travel along the
floor.
The pallet conveyor is a type of “power and free” conveyor that enables the
pallets to go into closepac arrangement. The closepac arrangement is a space saving
method in which the pallets are turned to travel in the direction of the small dimension as
seen in Figure 1.3. The chain is lowered so the dogs release the pins. The pallets then
move along only when pushed by another pallet entering the closepac area. At the end of
the closepac area, the chain is raised to reconnect with the pallets. The pallets return to
9
the length direction and travel along in the normal configuration. Pallets are placed into
closepac arrangement in order to save floor space during drying operations. Figure 1.3
shows an overhead view of pallets going into closepac arrangement before entering a
drying oven.
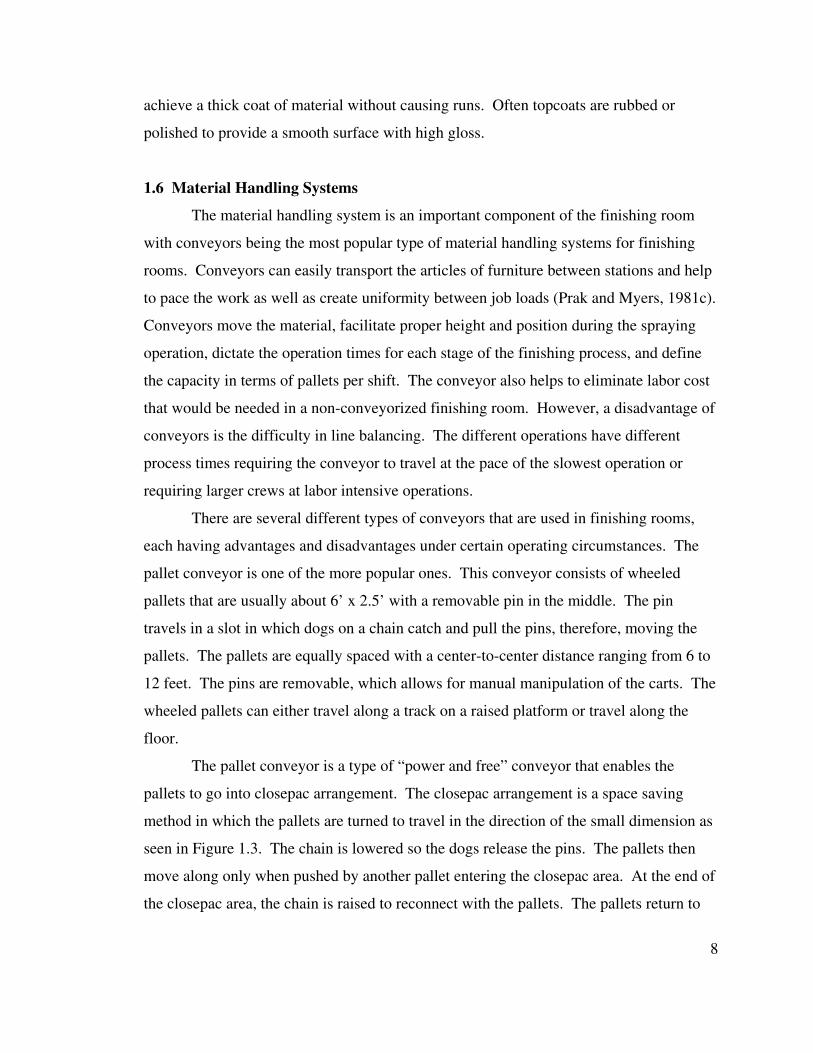
Figure 1.3. Overhead view of normal to closepac arrangement
Spray booths play a critical role in the spray finishing system. Spray booths act as
hoods that trap overspray and solvent vapors. This containment eliminates air pollution
and fire hazards and provides a safe, clean environment for workers. Two types of
filtration methods used in spray booths are dry filtration and water wash.
Dry filtration spray booths use exhaust systems that employ filters made from
paper, sytrofoam, or metal. The filters trap the solids before exhausting the air into the
environment. The filters must be changed periodically to prevent excess buildup of
finishing material. Since the spray operation also causes a buildup of finish on the spray
booth itself, the walls of a dry filtration booth are covered in removable cardboard panels
or a strippable coating.
Water-wash systems use a continuous curtain of water along the back wall of the
booth to trap overspray. This system reduces the buildup of finishing material in an
exhaust system, thereby reducing the fire hazard. The water must be periodically treated
and changed to prevent the solids from building up in the piping system. However, water
wash systems are more expensive than the dry filtration systems.
10
It is important for all spraying operations to take place inside a spray booth. Any
overspray not contained inside the spray booth will buildup on walls, floors, and other
objects in the finishing room causing a serious fire hazard as well as a potential health
risk to workers. While it is imperative that the spray booth dimensions allow adequate
working space, it is also desirable to keep spray booth dimensions to a minimum in order
to minimize conveyor chain length, number of pallets, required square footage of
building space, and costly ventilation requirements. Further discussion on the estimation
of spray booth dimensions occurs later in this paper.
Drying ovens are also necessary for a spray finishing system. The drying of
finish material is dependent upon time, airflow, and temperature. Drying ovens can use
convection or radiation heating. Conventional convection ovens use controlled
temperature and airflow to dry the finishing material. Advantages of a convection oven
are the uniform product temperature, even oven temperature, and it is the least
problematic method. Disadvantages include slow product heating, long dry cycles, and
high plant space requirements (Stauffer, 1993a).
Radiation ovens use infrared and ultraviolet (UV) light for heating. Infrared
systems transfer heat by electromagnetic radiation in the infrared range. Stauffer states,
“Advantages are fast product heat up, short drying and curing cycles, low plant space
requirements, and low operating costs. Disadvantages include difficult to control,
possible non-uniform product heating if “shadowing” occurs” (Stauffer, 1993b).
There are several costs associated with the development of a finishing system. A
major cost is the cost of the facility that will house the finishing system. Another major
cost is the equipment needed for the finishing system. Equipment for the system includes
the conveyor, spray booths, ovens, material delivery equipment, and spray guns. The
equipment for a typical casegoods furniture finishing system can cost well over a million
dollars. There are also operational costs associated with the finishing system That
include labor, material handling, finishing materials, and energy consumption.
11
1.7 Finishing System Specifications
There are several factors to be considered in the design and installation of a finishing
system. A target level for quality and complexity must be established before any design
work begins. During the design stage, it is important to remember that the system needs
to be flexible in order to accommodate new product lines and new finishing materials.
The finishing system should be designed to synchronize and balance all operations while
meeting the production requirements. System capacity is measured in pallets per shift.
In order to meet profit goals, a certain production level must be met. According to
Culbreth, the following is a list of basic steps for designing and installing a finishing
system (Culbreth, 2000):
� Determine the finishing method (3-D vs. flat line)� Estimate the required level of production
- pallets per shift (assembled furniture - 3-D)- square footage per shift (components – 2-D)
� Determine functional requirements of the finish and select materials- solvent resistance- print resistance
� Consider the regulatory requirements� Collaborate with vendors to obtain materials schedules� Design and evaluate the system� Install, test, and operate
Estimating the capacity and setup of a finishing room can be a very difficult and
time-consuming process. However, it is a process that must be completed whenever
planning for a new finishing room, re-designing an existing finishing room, or preparing
a finishing room for a new and different product line. The best way to describe the
approach to finishing system design is by example. The following is a simple example of
the steps and processes used in a deterministic approach to finishing system design.
1.8 Deterministic Analysis Example
A company that produces desks is building a new manufacturing facility. The
daily production rate is set at 550 desks per day. Approximately 5 percent of the desk
will require repair. Therefore, the required production rate is closer to 575 desks per day.
The company wishes to use an in-floor pallet conveyor system. The conveyor length,
12
line speed, cycle time, spray booth sizes, required number of pallets, and crew size must
be determined. These calculations are based upon a materials schedule provided by a
vendor and standard operation times provided by the in-house engineering staff.
Given Information:
The vendor has supplied the information shown in Table 1.2. Table 1.3 shows the
operational information supplied by the industrial engineering department.
Table 1.2. Materials schedule supplied by the vendor
Materials Schedule:Operation Flash Off Drying Time
Stain 2 min. 5 min.Washcoat 25 min.Wiping Stain 5 min. 30 min.Sealer 25 min.Lacquer 5 min. 45 min.
Table 1.3. Operation times supplied by the industrial engineering department
Operation Times:Operation Time (min.)
Load 0.50Spray Stain 0.80Spray Washcoat 0.80Sand Washcoat 2.00Spray Wiping Stain 1.45Wipe Wiping Stain 6.45Spray Sealer 0.80Sand Sealer 3.00Spray Lacquer 1.45Unload 0.50
1. Select pallet dimensions:A conveyor pallet size 6’ x 2.5’ is chosen to accommodate the desks. The center tocenter spacing (C-C) is 9’.
13
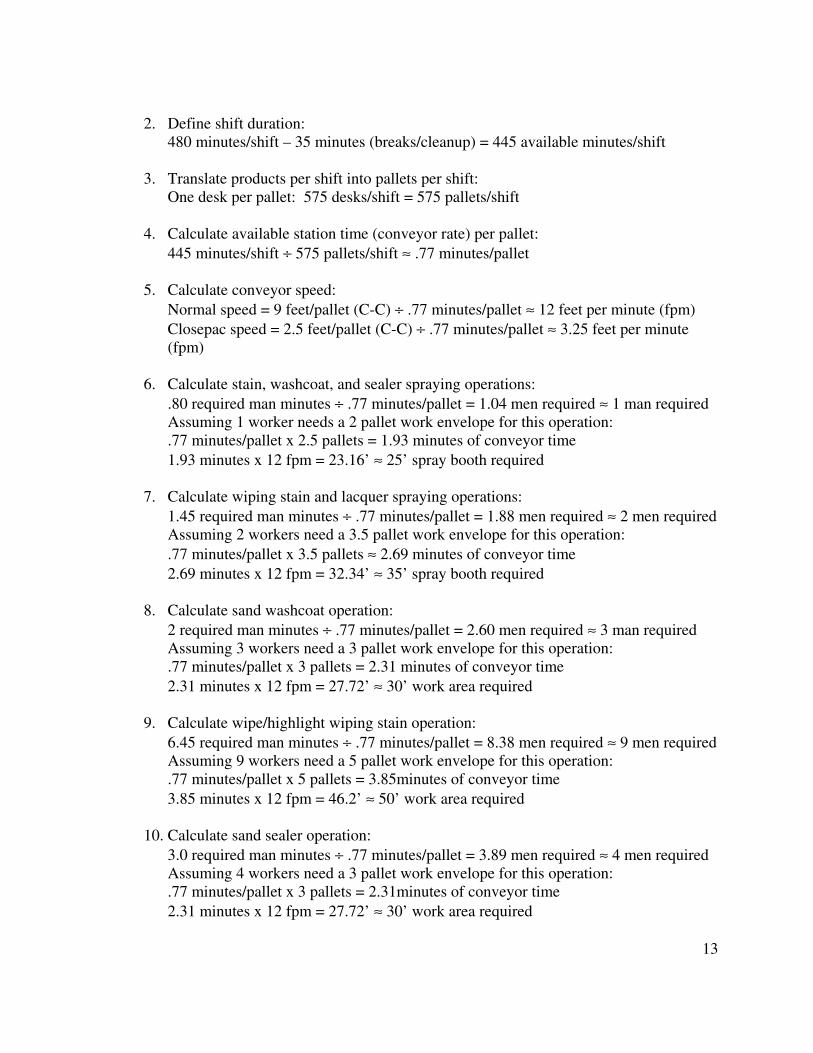
2. Define shift duration:480 minutes/shift – 35 minutes (breaks/cleanup) = 445 available minutes/shift
3. Translate products per shift into pallets per shift:One desk per pallet: 575 desks/shift = 575 pallets/shift
4. Calculate available station time (conveyor rate) per pallet:445 minutes/shift ÷ 575 pallets/shift ≈ .77 minutes/pallet
5. Calculate conveyor speed:Normal speed = 9 feet/pallet (C-C) ÷ .77 minutes/pallet ≈ 12 feet per minute (fpm)Closepac speed = 2.5 feet/pallet (C-C) ÷ .77 minutes/pallet ≈ 3.25 feet per minute(fpm)
6. Calculate stain, washcoat, and sealer spraying operations:.80 required man minutes ÷ .77 minutes/pallet = 1.04 men required ≈ 1 man requiredAssuming 1 worker needs a 2 pallet work envelope for this operation:.77 minutes/pallet x 2.5 pallets = 1.93 minutes of conveyor time1.93 minutes x 12 fpm = 23.16’ ≈ 25’ spray booth required
7. Calculate wiping stain and lacquer spraying operations:1.45 required man minutes ÷ .77 minutes/pallet = 1.88 men required ≈ 2 men requiredAssuming 2 workers need a 3.5 pallet work envelope for this operation:.77 minutes/pallet x 3.5 pallets ≈ 2.69 minutes of conveyor time2.69 minutes x 12 fpm = 32.34’ ≈ 35’ spray booth required
8. Calculate sand washcoat operation:2 required man minutes ÷ .77 minutes/pallet = 2.60 men required ≈ 3 man requiredAssuming 3 workers need a 3 pallet work envelope for this operation:.77 minutes/pallet x 3 pallets = 2.31 minutes of conveyor time2.31 minutes x 12 fpm = 27.72’ ≈ 30’ work area required
9. Calculate wipe/highlight wiping stain operation:6.45 required man minutes ÷ .77 minutes/pallet = 8.38 men required ≈ 9 men requiredAssuming 9 workers need a 5 pallet work envelope for this operation:.77 minutes/pallet x 5 pallets = 3.85minutes of conveyor time3.85 minutes x 12 fpm = 46.2’ ≈ 50’ work area required
10. Calculate sand sealer operation:3.0 required man minutes ÷ .77 minutes/pallet = 3.89 men required ≈ 4 men requiredAssuming 4 workers need a 3 pallet work envelope for this operation:.77 minutes/pallet x 3 pallets = 2.31minutes of conveyor time2.31 minutes x 12 fpm = 27.72’ ≈ 30’ work area required
14
11. Calculate load and unload operations:.5 required man minutes ÷ .77 minutes/pallet = .67 men required ≈ 1 man required2 men may be required at both load and unload since desks are relatively largeand heavy objects. Load and unload cannot take place at the same station sincethe engineers have requested a 240’ return distance. Load and unload operationstypically have a staging area to allow for line balancing.Assuming 2 workers need a 5 pallet work envelope for this operation:.77 minutes/pallet x 5 pallets = 3.85minutes of conveyor time3.85 minutes x 12 fpm = 46.2‘ ≈ 50’ staging area required
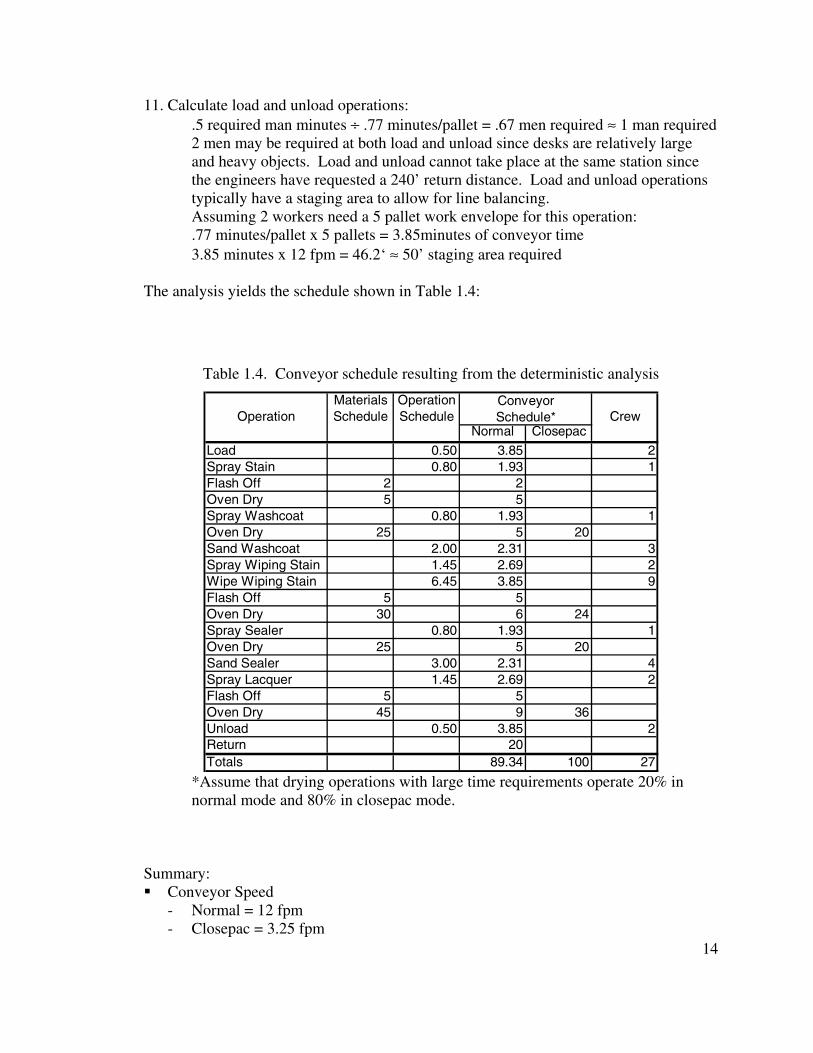
The analysis yields the schedule shown in Table 1.4:
Table 1.4. Conveyor schedule resulting from the deterministic analysis
Materials OperationOperation Schedule Schedule Crew
Normal Closepac
Load 0.50 3.85 2Spray Stain 0.80 1.93 1Flash Off 2 2Oven Dry 5 5Spray Washcoat 0.80 1.93 1Oven Dry 25 5 20Sand Washcoat 2.00 2.31 3Spray Wiping Stain 1.45 2.69 2Wipe Wiping Stain 6.45 3.85 9Flash Off 5 5Oven Dry 30 6 24Spray Sealer 0.80 1.93 1Oven Dry 25 5 20Sand Sealer 3.00 2.31 4Spray Lacquer 1.45 2.69 2Flash Off 5 5Oven Dry 45 9 36Unload 0.50 3.85 2Return 20Totals 89.34 100 27
ConveyorSchedule*
*Assume that drying operations with large time requirements operate 20% innormal mode and 80% in closepac mode.
Summary:� Conveyor Speed
- Normal = 12 fpm- Closepac = 3.25 fpm
15
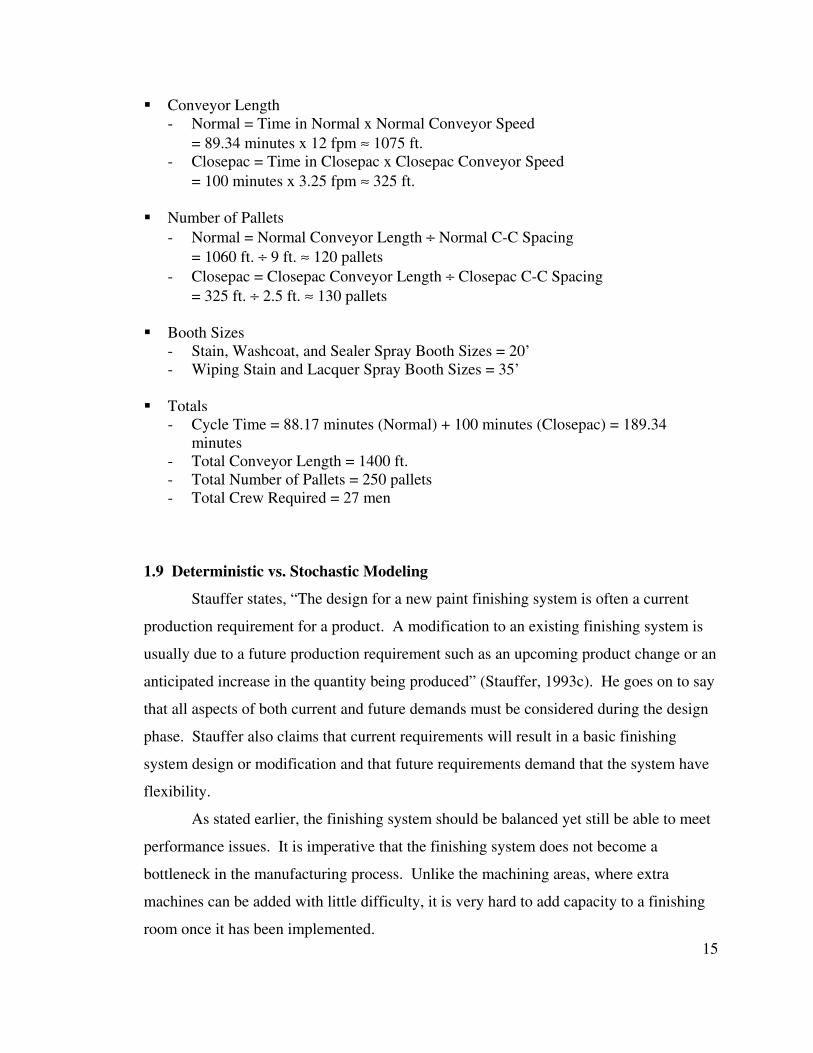
� Conveyor Length- Normal = Time in Normal x Normal Conveyor Speed
= 89.34 minutes x 12 fpm ≈ 1075 ft.- Closepac = Time in Closepac x Closepac Conveyor Speed
= 100 minutes x 3.25 fpm ≈ 325 ft.
� Number of Pallets- Normal = Normal Conveyor Length ÷ Normal C-C Spacing
= 1060 ft. ÷ 9 ft. ≈ 120 pallets- Closepac = Closepac Conveyor Length ÷ Closepac C-C Spacing
= 325 ft. ÷ 2.5 ft. ≈ 130 pallets
� Booth Sizes- Stain, Washcoat, and Sealer Spray Booth Sizes = 20’- Wiping Stain and Lacquer Spray Booth Sizes = 35’
� Totals- Cycle Time = 88.17 minutes (Normal) + 100 minutes (Closepac) = 189.34
minutes- Total Conveyor Length = 1400 ft.- Total Number of Pallets = 250 pallets- Total Crew Required = 27 men
1.9 Deterministic vs. Stochastic Modeling
Stauffer states, “The design for a new paint finishing system is often a current
production requirement for a product. A modification to an existing finishing system is
usually due to a future production requirement such as an upcoming product change or an
anticipated increase in the quantity being produced” (Stauffer, 1993c). He goes on to say
that all aspects of both current and future demands must be considered during the design
phase. Stauffer also claims that current requirements will result in a basic finishing
system design or modification and that future requirements demand that the system have
flexibility.
As stated earlier, the finishing system should be balanced yet still be able to meet
performance issues. It is imperative that the finishing system does not become a
bottleneck in the manufacturing process. Unlike the machining areas, where extra
machines can be added with little difficulty, it is very hard to add capacity to a finishing
room once it has been implemented.
16
A problem with the previous deterministic model is the lack of consideration of
variability in present or future production requirements. Product lines change frequently
in furniture manufacturing facilities. Although the data used in the deterministic analysis
provides approximations for current production requirements, it fails to account for the
future requirements stemming from a change in the product line or production scheduling
methods. A benefit of a stochastic model is that it provides the user with statistics that
can be used in the design of the system. These statistics allow the designer to evaluate
the impact of variability in operation times on all components of the system. This
provides the system with the flexibility it needs to meet both current and future
production requirements.
Kelton, et al, say, “One fundamental issue in quantitative modeling is whether
you’re going to model an input quantity as a deterministic (non-random) quantity, or
whether you’re going to model it as a random variable following some probability
distribution” (Kelton, et al, 1998a). Some inputs, such as the number of workers at a
station, are easily quantified and can be modeled as deterministic. Other inputs, such as
operation times and interarrival times, are more random and their randomness should be
included in the model. Kelton, et al say, “You might be tempted to assume away your
input’s randomness, since this seems simpler and has the advantage that the model’s
outputs will be non-random. This can be pretty dangerous, though, from the model-
validity viewpoint because it’s often the randomness itself that leads to important system
behavior that you’d certainly want to capture in your simulation model” (Kelton, et al,
1998b).
For finishing room design, the deterministic analysis fails to consider the
distribution of the operation times. If the analysis uses only a mean value for the
operation times, it is not completely accurate since the times are variable. Operation
times vary primarily because of differences in the furniture size and complexity of the
shape. Operation times may also vary across operations because of operator skills as well
as the difficulty of the operation.
A simulation model allows the user to include the distribution of the operation
times in the model to obtain more accurate results. The simulation of the finishing
17
system represents a stochastic model that takes into account the variability in the
operation times encountered when finishing pieces of furniture with different sizes and
configurations. The variability in the spray times can be characterized by fitting various
probability distributions to empirical data on spraying times. Sampling from these
distributions allows the model to evaluate the most representative scenario. It is
important in the design of the system to accommodate situations where unusually long
spraying times are encountered. Otherwise, spraying operations might exceed the
confines of the spray booth causing an unsafe or unhealthy working environment.
Because of the high capital costs encountered in the implementation of a finishing
system, it is important that the system be designed correctly. The deterministic analysis
provides a good first approximation for the setup and capacity of a finishing system but
the results are not completely accurate. Reasons for this inaccuracy are the many
assumptions made in the analysis. Assumptions were made concerning the work
envelope required by an operation. Using the deterministic method alone, there is no way
to verify or validate the results obtained by making these assumptions until the proposed
system is implemented.
Simulation can be a useful tool for analysis because it allows the user to model
the proposed system to see how it will behave. The user can verify the model by making
sure the model is behaving the manner expected. The user can then make sure the model
is valid by seeing if it has a relationship with similar real world systems. This thesis uses
a demonstrative simulation model for the stochastic evaluation of the finishing system.
1.10 Model Features
The model allows the user to determine the overall system capacity and to
determine the individual workstation capacity (size/crew) under the following user-
specified conditions of:
� Production volume� Product mix� Line loading patterns� Distributed Operation Times
18
The production volume is the major factor in determining overall capacity. The
simulation allows the user to determine if the proposed finishing system is capable of
meeting the production requirements. This provides the user with the ability to make any
needed adjustments to the finishing system while still in the design phase.
A critical issue for determining workstation capacity is the resource utilization.
The simulation allows the user to determine the percentage of time a worker is spraying
outside of the booth. If a worker is overutilized, then he/she will not be able to confine
work to the spray booth work envelope. However, the line speed should not be so slow
that the workers are underutilized. The simulation tool will allow a user to see if the
work envelopes assumed in the deterministic analysis are adequate.
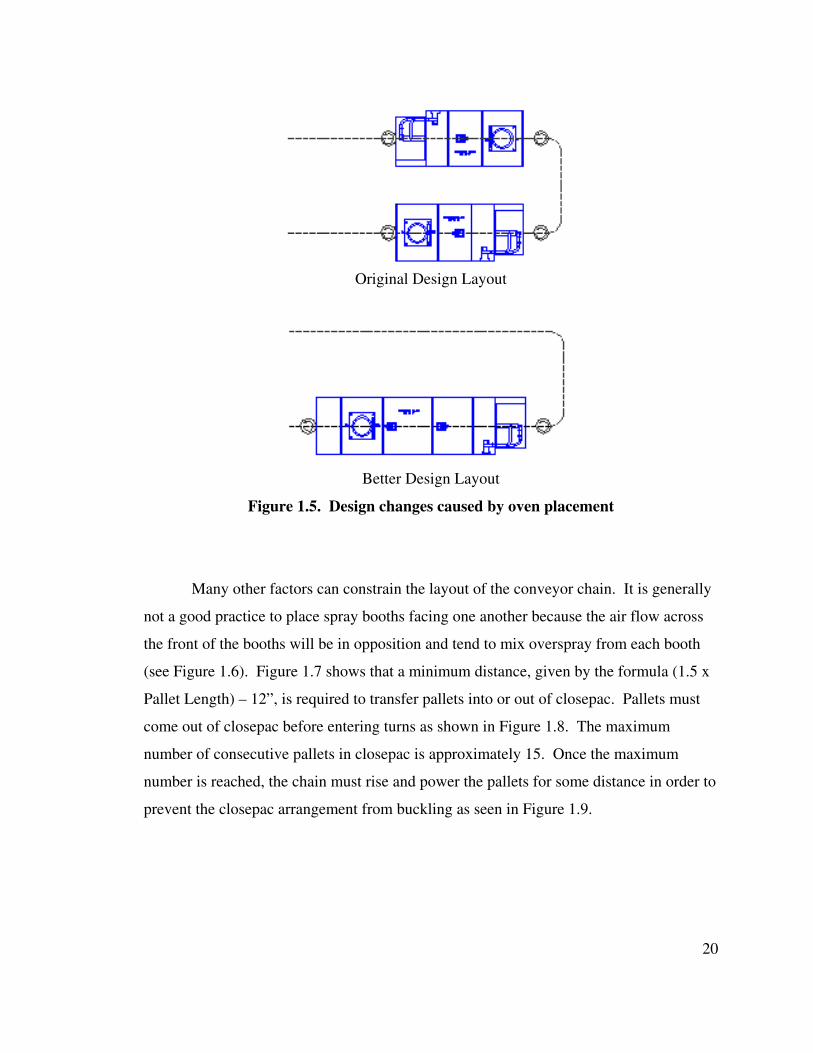
1.11 Finishing System Layout
Regardless of whether the finishing system capacity analysis is deterministic or
stochastic, it remains just an estimate. Certain features of the system, such as line length
and required floor space, are affected by the actual layout of the system. Thus, the
system layout is the last stage in the design of a finishing system and must be completed
before the final chain length and number of pallets required can be determined.
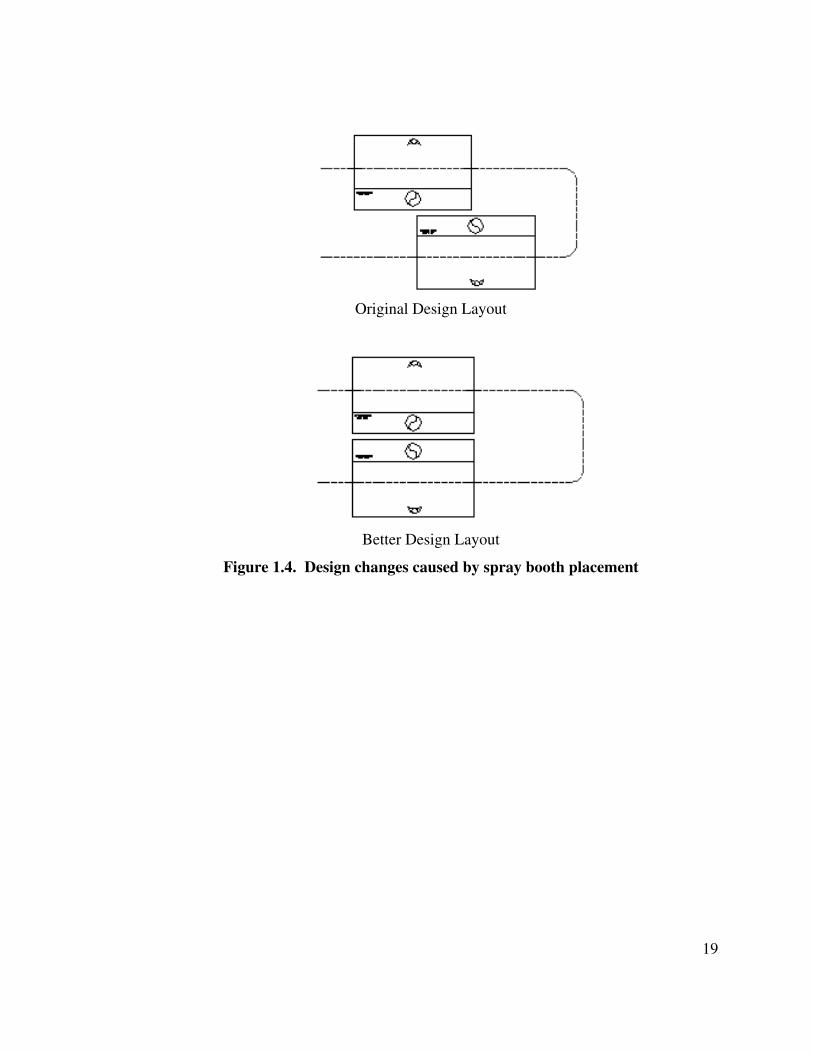
During the layout process, situations may be encountered that require the chain to
be lengthened. The conveyor path may be obstructed by columns, walls, or aisles, and
therefore, may require adjustments. Figure 1.4 shows an example in which the conveyor
chain is lengthened in order to place two spray booths back to back. Figure 1.5 shows an
example in which the conveyor chain is lengthened to allow the use of one long oven
instead of two short ovens.
19
Original Design Layout
Better Design Layout
Figure 1.4. Design changes caused by spray booth placement
20
Original Design Layout
Better Design Layout
Figure 1.5. Design changes caused by oven placement
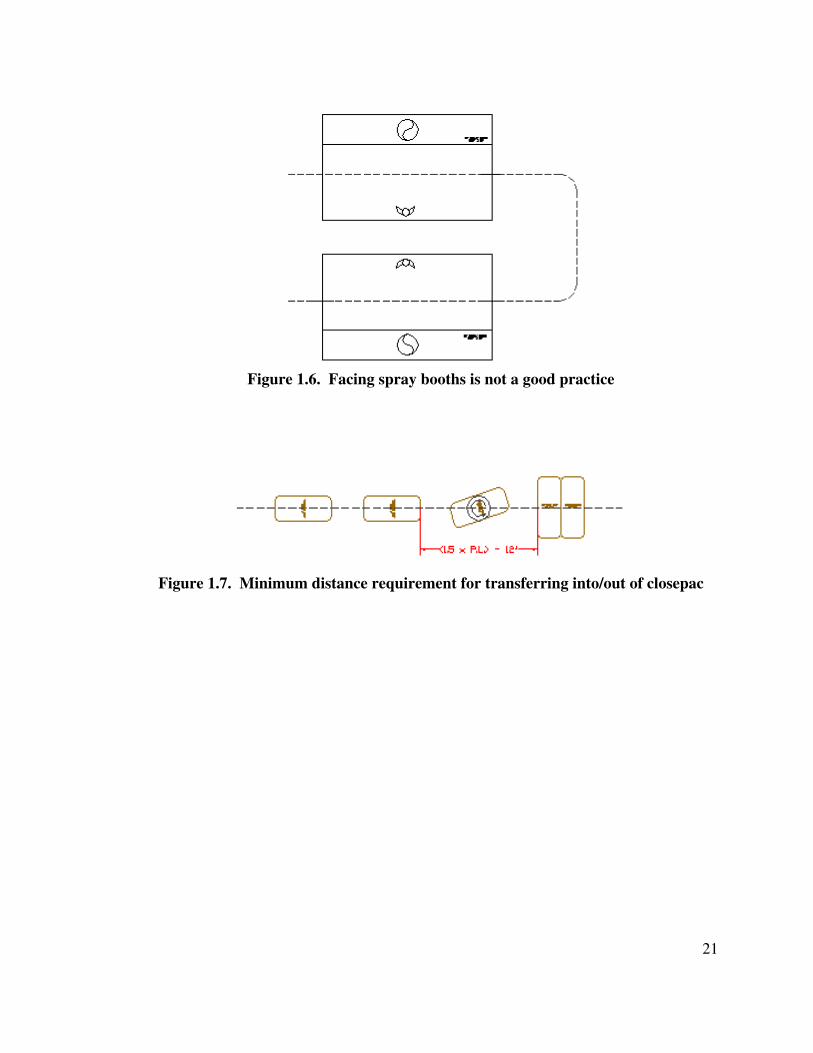
Many other factors can constrain the layout of the conveyor chain. It is generally
not a good practice to place spray booths facing one another because the air flow across
the front of the booths will be in opposition and tend to mix overspray from each booth
(see Figure 1.6). Figure 1.7 shows that a minimum distance, given by the formula (1.5 x
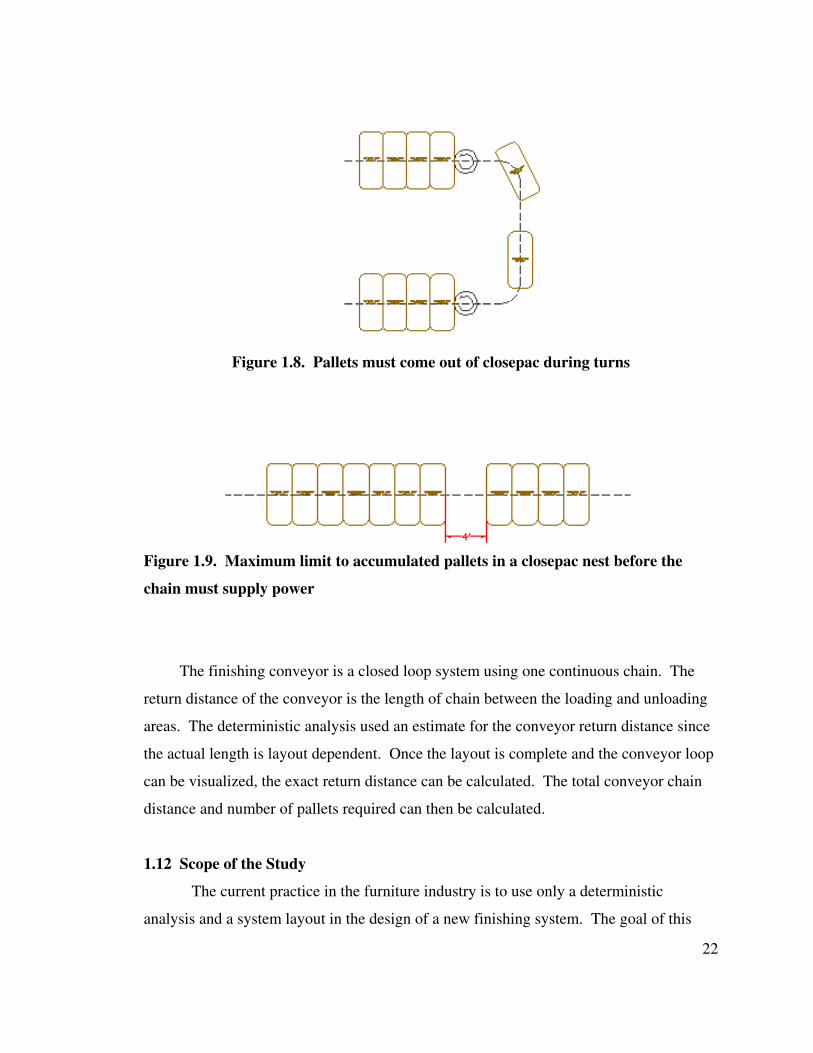
Pallet Length) – 12”, is required to transfer pallets into or out of closepac. Pallets must
come out of closepac before entering turns as shown in Figure 1.8. The maximum
number of consecutive pallets in closepac is approximately 15. Once the maximum
number is reached, the chain must rise and power the pallets for some distance in order to
prevent the closepac arrangement from buckling as seen in Figure 1.9.
21
Figure 1.6. Facing spray booths is not a good practice
Figure 1.7. Minimum distance requirement for transferring into/out of closepac
22
Figure 1.8. Pallets must come out of closepac during turns
Figure 1.9. Maximum limit to accumulated pallets in a closepac nest before the
chain must supply power
The finishing conveyor is a closed loop system using one continuous chain. The
return distance of the conveyor is the length of chain between the loading and unloading
areas. The deterministic analysis used an estimate for the conveyor return distance since
the actual length is layout dependent. Once the layout is complete and the conveyor loop
can be visualized, the exact return distance can be calculated. The total conveyor chain
distance and number of pallets required can then be calculated.
1.12 Scope of the Study
The current practice in the furniture industry is to use only a deterministic
analysis and a system layout in the design of a new finishing system. The goal of this

23
thesis is to extend the methodology for calculating a furniture finishing system’s capacity
by developing a stochastic evaluation of the finishing system. A demonstration model
will be created that provides a more accurate basis for developing the system layout. The
main focus of the thesis is on the stochastic evaluation of the system since this area of
concentration offers abundant possibilities for development.
24
Literature Review
2.1 Related Literature
There is a limited amount of published works directly relating to the furniture
industry and furniture finishing practices. Many references give only a brief overview of
finishing system and conveyor design. However, a few sources did contain information
on the importance of a finishing conveyor and possible approaches to take in system
design.
According to McCluckie, “Automating material handling is one of the most
important steps in planning a finishing operation. The right choice adds efficiency,
adaptability, and dependability, whether you are finishing household appliances,
automotive parts, office products, or aircraft components” (McCluckie, 1996a).
McCluckie also says that the production rate is an important factor to be considered when
designing a material handling system. The carrier rates, chain-dog spacing, and conveyor
speed must be calculated correctly in order to create a handling system that reduces
finishing time, increases throughput, and saves labor costs (McCluckie, 1996b).
The Association for Finishing Processes of the Society of Manufacturing
Engineers published a book in 1993 entitled Finishing Systems Design and
Implementation. Stauffer, the book’s editor, dedicates an entire chapter to conveyor
types, operations, features, selection, and design. He gives the following step-by-step
procedure to follow when designing a conveyor for a finishing system (Stauffer, 1993d):
� Draw plant layout.� Design a carrier.� Determine conveyor size.� Determine track elevations.� Determine material flow.� Select vertical curves.� Locate drive.� Select horizontal turns.� Determine guard requirements.� Determine trolley spacing.� Determine maximum conveyor speed.� Determine conveyor length.� Determine moving load.� Determine lift load.
25
� Determine chain pull.� Safety codes.
Prak and Myers give the most relevant material dealing with furniture finishing
and system design. Their book, Furniture Manufacturing Processes, also contains a
chapter dedicated to the selection and design of the finishing conveyor. In this chapter,
they give a deterministic methodology for calculating conveyor requirements similar to
the deterministic approach seen in the introduction of this thesis. Prak and Myers stress
the importance of the conveyor design by stating, “Once the finishing conveyor is
installed, it becomes the constraint by which the selection of finishing schedules must be
made” (Prak and Myers, 1981d).
The deterministic methodology given by Prak and Myers has its limitations.
There exists a need for a new methodology that includes both a deterministic and
stochastic analysis. The following is a list of steps for a proposed methodology for
determining finishing system capacity requirements:
� Develop or obtain materials schedule� Determine operation times (deterministic, average times)
- Loading/Unloading- Spraying- Sanding- Wiping
� Product analysis- Determine pallet size- Determine the number of items/pallet
� Determine center-to-center spacing� Define shift duration� Translate products/shift into pallets/shift� Calculate conveyor speed� Calculate operation requirements
- Determine the number of workers required- Estimate a work envelope (in pallets)- Determine required conveyor time- Determine the length of required work area
� Determine stochastic operation times- Determine the type of distribution- Determine the distribution parameters
26
� Incorporate stochastic data into the simulation template to achieve more accurateresults- Include distributions for operation times- Include variations in line loading- Verify work areas are adequate
� Create a layout of the proposed system� Determine conveyor return distance� Determine total conveyor length
- Determine normal conveyor length- Determine closepac conveyor length
� Determine required number of pallets- Determine the number of pallets required in normal- Determine the number of pallets required in closepac
� Calculate total cycle time
2.2 Related Simulation Projects
The proposed methodology includes stochastic analysis using simulation. Several
simulation projects concerning conveyor system design have been conducted. While
these simulations do not directly address the capacity and setup issues of the finishing
conveyor, they are important in that they contain information on conveyor system design.
The following paragraphs give a brief review of previous work involving simulation and
conveyor design.
Henriksen and Schriber published a paper entitled Simplified Approaches to
Modeling Accumulating and Non-accumulating Conveyor Systems for the Proceedings of
the 1986 Winter Simulation Conference. The paper details the characteristics of
conveyor systems and the modeling challenge these characteristics pose. The goal of the
project was to present simplified modeling approaches for representing conveyor systems
(Henriksen and Schriber, 1986).
Another conveyor design project is detailed in a paper entitled Insights Into
Carrier Control: A Simulation of a Power and Free Conveyor Through an Automotive
Paint Shop written by Graehl for the1992 Winter Simulation Conference. Graehl
explains that “discrete event simulation is used to model portions of the system in order
to determine whether the system can operate sufficiently when a second body style is
introduced and to study the effects of making modifications to some of the conveyors”
(Graehl, 1992).
27
The 1995 Winter Simulation Conference included a paper written by Laughery
entitled A Micro Saint Model of Conveyor Management Strategies. Laughery uses a
Micro Saint simulation model to “evaluate increases in throughput and utilization that
would be gained in different scenaria in 1) different conveyor programming strategies, 2)
increases in conveyor demand, and 3) changes in conveyor demand variability”
(Laughery, 1995).
2.3 Simulation Used in Industry
Because the proper design of a material handling system is so important, many
companies use simulation models in the system design phase. Modern Materials
Handling magazine issued a survey in which a sample of 1,000 readers were asked about
their uses of simulation software. “Simulations, these readers said, are to develop a
materials handling layout (75% of users), or to expand or modernize a facility (55%),
build a new one (40%), or replace equipment (33%)” (Feare, 1996a). Feare says that
simulation with the right software allows users to build dynamic models of real systems
that can save money and time by helping avoid design errors and prevent over or under
building a system (Feare, 1996b).
Modern Materials Handling explains how Harley-Davidson used simulation
software when designing a new plating facility in York, Pennsylvania. The software
enabled the project team to build a three-dimensional model of the proposed facility and
to test various system designs and production scenarios. One of the goals set for the plant
was to ensure the conveyor system design allowed maximum throughput with minimal
inventory throughout the process. The article states, “The simulation software package
chosen enabled personnel to analyze the details and dynamics of the plating process
before making any hard commitments to design. Simulation…proved to be a powerful
tool to test and evaluate alternative system designs well in advance of the critical
implementation phase” (Anonymous, 1997a).
Another article in Modern Materials Handling tells of Hewlett-Packard’s decision
to automate the material handling system at a production plant in Corvallis, Oregon. The
project manager required that the vendor be capable of simulating the material handling
28
system. He felt that simulation would ensure a proper system design, help remove any
uncertainties the company might have, and streamline communication between the
company and the vendor. Hewlett-Packard used the simulation to analyze several
different system scenarios, which enabled them to make several design modifications
before placing the automated handling system into operation. The project manager says,
“We attribute much of the success of our new materials movement system to the
simulation. It allowed us to address the entire manufacturing process during the
design/build. We were able to evaluate potential system bottlenecks and look at a wide
range of alternative scenarios” (Anonymous, 1997b).
2.4 Simulation Limitations
As useful and helpful as simulation seems, there are limitations to its powers.
Field states, “The power of simulation is that it can help to identify weaknesses or
inconsistencies in a design that may not be intuitively obvious from a back-of-the-
envelope calculation. It can also help designers gain insight into their designs and better
visualize their concept. Ironically, however, it is precisely this power that leads some
people to believe that a simulation model is fault proof” (Field, 1997a). Field also says
that no simulation model is ever completely correct since a simulation is only a
representation of an actual system. However, she does state that accuracy levels of 95
percent are achievable today. In order to reach this level of accuracy the model must use
good input data, include randomness, and avoid illogical assumptions. Field gives the
following top ten list of simulation errors (Field, 1997b).
1. Performing a simulation without a clear definition of the objectives.2. Believing that the model itself can compensate for poor data collection.3. Lacking an understanding of statistical processes.4. Failing to do order profiling.5. Ignoring the effects of randomness.6. Incorporating randomness inappropriately.7. Failing to consider downtime.8. Making illogical assumptions.9. Failing to question the results.10. Failing to recognize that simulation is a study tool.
29
2.5 Summary of Available Literature
There exists very limited literature concerning furniture finishing system design.
This lack of information offers a tremendous opportunity for research in the field of
furniture finishing. This opportunity, along with the increasing popularity of simulation
modeling will enable the results of this thesis to make a significant contribution to the
furniture industry.
30
Modeling the Finishing System
3.1 Modeling Tool
This thesis provides a tool to assist in the design and analysis of a finishing
system. The tool consists of a stochastic simulation model that communicates with an
Excel spreadsheet. The Excel spreadsheet is used for data input that is then used to drive
the simulation. The spreadsheet is used to generate overall design parameters and accepts
information for an entire finishing system. The simulation model uses information from
the spreadsheet to simulate one of the finishing operations. Both the spreadsheet model
and the simulation model can be operated independently if desired.
3.2 Spreadsheet Model
A template for a deterministic analysis in the form of a spreadsheet has been
created using Microsoft Excel 97 with Visual Basic for Applications (VBA). This
Excel/VBA interface is used for data input and is used to drive the simulation model.
The spreadsheet has a light green background with white cells indicating where user
input is required. The spreadsheet requires users to provide information such as
production rate, pallet dimensions, rework percentage, and shift duration. This
information is then used by the spreadsheet to calculate the required pallets per shift and
the conveyor rate and speed. The template also allows users to interactively build a
deterministic model of their own finishing system by adding operations as needed. The
spreadsheet format can be seen in Figures 3.1 and 3.2. When using the spreadsheet solely
for a deterministic analysis, the user only needs to complete part 1 of the spreadsheet seen
in Figure 3.1. However, the user must complete both parts of the spreadsheet if it is to be
used to drive the computer simulation.
VBA is used within the Excel spreadsheet to validate input and determine overall
design parameters for the finishing system. Specifically, as the user inputs values, VBA
code examines the input to be sure it is valid (non-negative, numeric, etc.). Once the
input is validated, Excel uses cell formulas to compute design parameters internally based
on the deterministic calculations illustrated in Chapter 1. Furthermore, the spreadsheet
uses several user forms invoked from VBA. These user forms will be discussed in
greater detail later in this chapter.
31
Month: 1 Day: 1Planned Production
550Length: 7Width: 2.5C-C: 9
4.50%1
Shift Duration48035
Conveyor Specifications0.81
Normal Conveyor Speed (ft/min): 11.00Closepac Conveyor Speed (ft/min): 3.09
2402080
Materials Operation Approximate RequiredSchedule Schedule Crew Work Envelope Work Space(minutes) (minutes) (Approx.) (Pallets) Normal Closepac (feet)
0.50 2 5 4.05 451.00 1 2 1.62 18
2 25 5
0.80 1 2 1.62 1825 5 20
2.00 2 3 2.43 271.45 2 3.5 2.84 31
5 56.45 8 5 4.05 45
30 6 240.80 1 2 1.62 18
25 5 203.00 4 3 2.43 271.45 2 3.5 2.84 31
5 545 9 36
0.50 2 5 4.05 4521.82
25 91.37 100
User Name: User
Production Rate (articles per day):Pallet Dimensions (feet):
Required Pallets per Shift550
Percentage of Rework:Average Products per Pallet:
Minutes per Shift: Available Minutes per ShiftBreaks/Cleanup (minutes): 445
Conveyor Rate (minutes/pallet):
Materials Schedule Operation ScheduleEstimated Return Distance (feet):Percentage of Time in Normal:Percentage of Time in Closepac:
ConveyorOperation Schedule*
LoadSpray StainFlash OffOven DrySpray WashcoatOven DrySand WashcoatSpray Wiping StainFlash OffWipe Wiping StainOven DrySpray SealerOven DrySand SealerSpray Lacquer
Totals
Flash OffOven DryUnloadReturn
Add OperatioAdd Operatio
Figure 3.1. Excel template for the deterministic analysis (part 1)
32
Year: 2000 1Line Loading
0
Percentage25%25%25%25%100%
Sequence Sequence1 112 123 134 145 156 167 178 189 1910 20
Minimum Mode Max Minimum Mode Max Minimum Mode Max0.25 0.30 0.35 0.30 0.35 0.40 0.35 0.40 0.450.28 0.33 0.38 0.31 0.37 0.57 0.51 0.69 0.93
0.16 0.34 0.45 0.16 0.34 0.45 0.35 0.55 0.68
0.65 0.72 1.20 1.20 1.92 2.72 3.02 3.02 5.240.30 0.38 0.43 0.45 0.51 0.68 0.82 0.98 1.10
0.99 1.05 1.11 1.50 2.25 3.32 2.48 3.00 3.76
0.15 0.20 0.25 0.38 0.52 0.74 0.38 0.52 0.74
0.65 0.72 1.20 1.20 1.92 2.72 3.02 3.02 5.240.13 0.22 0.30 0.40 0.43 0.88 1.09 1.29 1.50
0.25 0.30 0.35 0.30 0.35 0.40 0.35 0.40 0.45
Simulation Replications:
Pallet LoadEmptySmall
MediumLargeSum
Pallet Load Pallet LoadSmall Large
Medium EmptyLarge SmallEmpty MediumSmall Large
Medium EmptyLarge SmallEmpty MediumSmall Large
Medium Empty"Small" Operation Time (mins) "Medium" Operation Time (mins) "Large" Operation Time (mins)
Triangular Distribution Triangular Distribution Triangular Distribution
Enter Discrete Distribution
Enter Planned Sequence
Use Discrete Distribution
Use Planned Sequence
Figure 3.2. Excel template for the deterministic analysis (part 2)
33
When using the spreadsheet solely for a deterministic analysis, the user only
needs to complete part 1 seen in Figure 3.1. However, the user must complete both parts
of the spreadsheet if it is to be used to drive the computer simulation. Data input begins
with the user typing in his or her name, the date, and the desired number of simulation
replications. A discussion for the appropriate number of simulation replications occurs
later in this chapter.
Next, the user fills in the required input for the “Planned Production” section of
the spreadsheet. Required data in this section includes the required production (articles
per day), pallet dimensions, rework percentage, and the average number of products per
pallet. This information is used by the spreadsheet to automatically calculate the required
number of pallets per shift using the formula:
Required Pallets per Shift = Round (Required Production * (1 + Percentage of
Rework) / Average Products per Pallet, 0).
Figure 3.3 shows the completed “Planned Production” portion of the spreadsheet.
Month: 1 Day: 1Planned Production
550Length: 7Width: 2.5C-C: 9
4.50%1
User Name: User
Required Production (articles per day):Pallet Dimensions (feet):
Required Pallets per Shift575
Percentage of Rework:Average Products per Pallet:
Figure 3.3. Completed “Planned Production” portion of the spreadsheet
Once the “Planned Production” portion is complete, data can be input into the
“Shift Duration” and “Conveyor Specifications” portions of the spreadsheet. Required
information for the “Shift Duration” portion of the spreadsheet includes minutes per shift
and minutes required for breaks/cleanup. This information is used to calculate the
available minutes per shift by simply subtracting time lost to breaks/cleanup from the
shift length. Once the required pallets per shift and available minutes per shift are
34
known, the conveyor rate, normal speed, and closepac speed are automatically calculated
in the “Conveyor Specifications” portion of the spreadsheet. The calculations for these
variables are as follows:
Conveyor Rate = Available Minutes per Shift / Required Pallets per ShiftNormal Speed = Pallet Length / Conveyor RateClosepac = Pallet Width / Conveyor Rate
The user can then enter the estimated return distance for the conveyor and the estimated
percentages of time that a pallet will stay in closepac or normal mode.
The user can now start adding operations to build the deterministic model of the
finishing schedule. Since the load, unload, and return operations are part of every
finishing line, they are included in the model by default. The input required for the load
and unload operations includes the average operation time, approximate crew size, and a
work envelope (in pallets). To overwrite existing information, simply click in the correct
cell and enter in the new data. This information is then used to create the conveyor
schedule and required work envelope for that operation. The user can also enter the
distribution parameters for the operation times that will be used in the simulation model.
The return operation simply transforms the estimated return distance into minutes and
adds it to the conveyor schedule. There are no required inputs for this operation.
Other operations can be added to the finishing schedule as needed. Operations are
added to the spreadsheet as part of a time-based materials schedule e.g. (flash off, oven
dry, and cooling), or they are defined as part of the operation schedule, e.g., (spraying,
sanding, wiping, and inspecting). Operations belonging to the materials schedule require
the user to input the operation name and the average number of minutes required for that
operation. The spreadsheet uses this information to calculate the conveyor schedule for
the operation. For drying operations, the conveyor schedule is often split into a normal
and closepac component. Values for the approximate percentage of time spent in each
category must be provided with typical values for normal equal to 20 percent and
closepac equal to 80 percent of the time.
To add an operation that is part of the materials schedule, the user must click on
the “Add Operation” button located under the caption “Materials Schedule.” When the
user clicks this button, a user form is invoked from VBA and requests information about
35
the operation to be added. The user form for the materials schedule is illustrated in
Figure 3.4. All operations must be placed between the load and unload operations.
When the information is complete, the user clicks on the “Add Materials” button and the
operation is added to the finishing schedule.
Figure 3.4. User form for materials schedule
All operations specified as using an operation schedule require the user to provide
the operation name and the average number of minutes required for performing the
operation. To add an operation that is part of the operations schedule, the user must click
on the “Add Operation” button located under the caption “Operations Schedule.” When
the user clicks this button, a user form will appear requesting information about the
operation to be added. The user form for the operations schedule is illustrated in Figure
3.5.
36
Figure 3.5. User form for the operation schedule
The number of workers is calculated automatically after the average operation
time is entered. The formula used for this calculation is:
Number of workers = Round (Operation Time / Conveyor Rate, 0).
The user can then estimate a work envelope for the calculated number of workers. The
user also has the option of entering distribution parameters for the operation time based
on different sizes of furniture articles. The stochastic model uses triangular distributions
to characterize the operation times. Therefore, the user form requires the user to input
minimum, mode, and maximum operation times to be used as distribution parameters.
The distribution parameters will default to zero if the user decides not to input data into
this option. When the information is complete, the user clicks on the “Add Operation”
button and the operation is added to the finishing schedule.
37
Once all operations have been added to the finishing schedule, the user can edit
the information by selecting the appropriate cells and overwriting the existing
information. An entire row can be deleted by choosing the row number and selecting
“Edit -> Delete” from the pull down menu. Using the methods described above, the user
is able to create a deterministic model of the finishing system.
The Excel spreadsheet also gives the user the option of entering a line loading
pattern. Line loading can be accomplished by assigning either a discrete distribution or a
planned sequence. The user simply clicks either the “Enter Discrete Distribution” button
or the “Enter Planned Sequence” button. The user forms associated with each of these
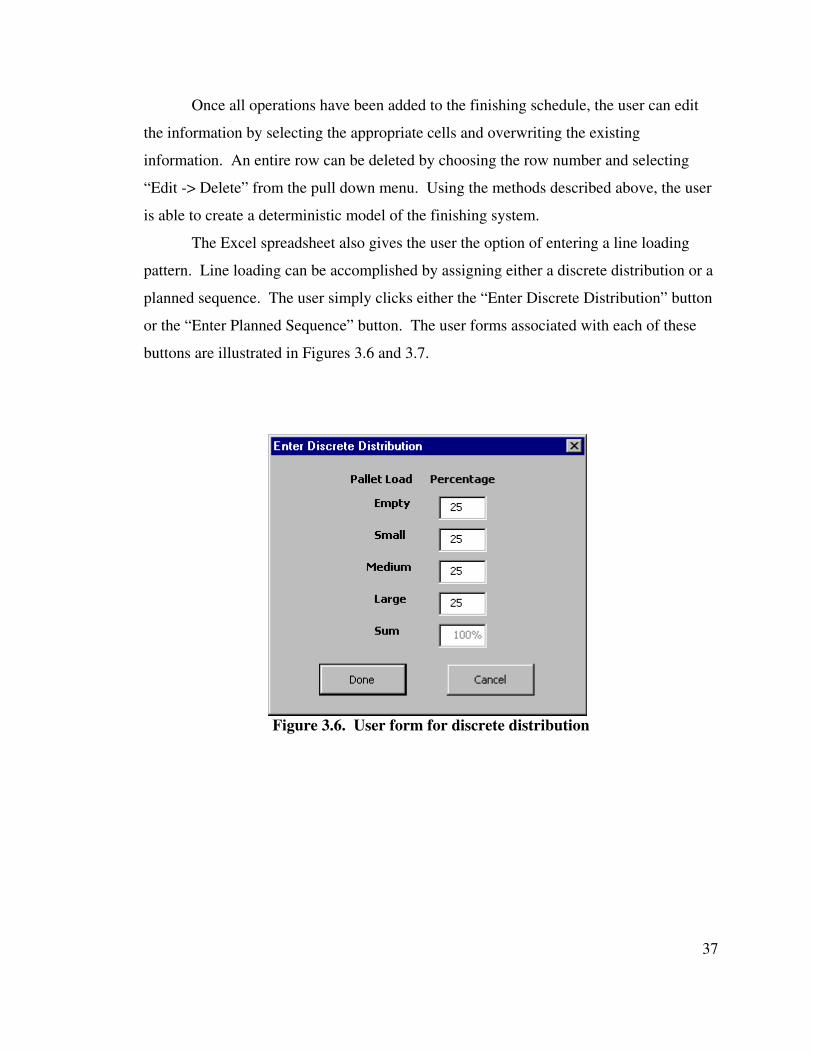
buttons are illustrated in Figures 3.6 and 3.7.
Figure 3.6. User form for discrete distribution
38
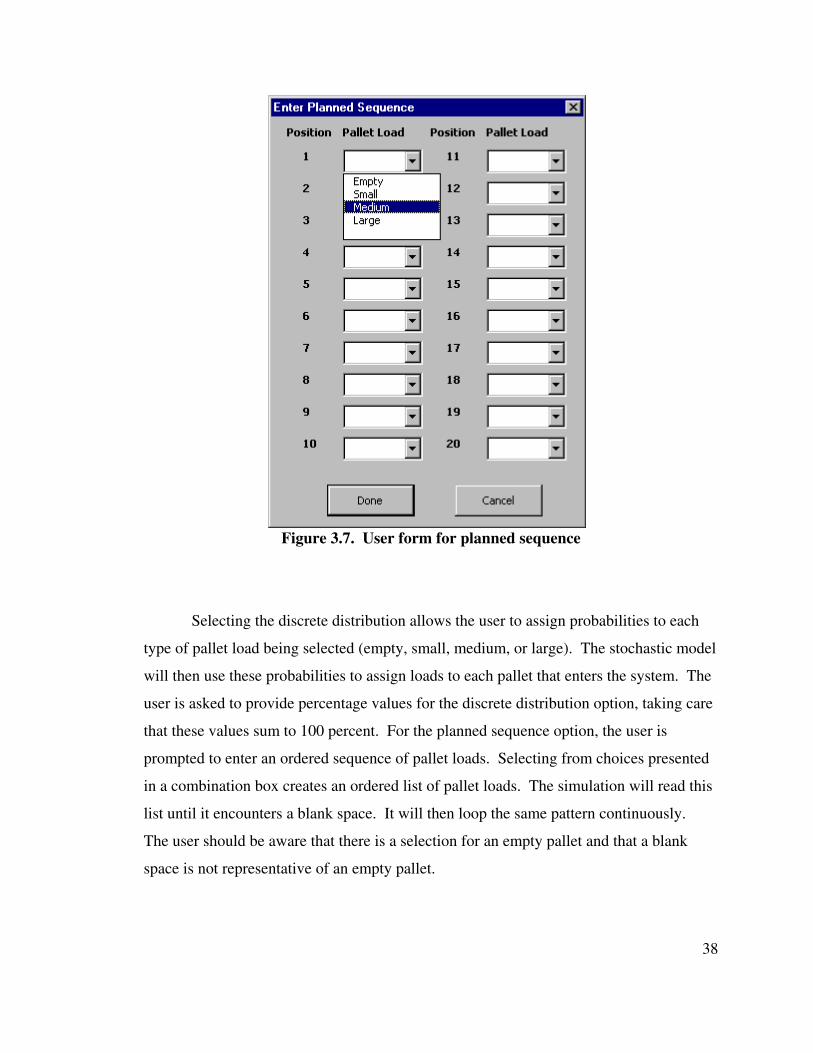
Figure 3.7. User form for planned sequence
Selecting the discrete distribution allows the user to assign probabilities to each
type of pallet load being selected (empty, small, medium, or large). The stochastic model
will then use these probabilities to assign loads to each pallet that enters the system. The
user is asked to provide percentage values for the discrete distribution option, taking care
that these values sum to 100 percent. For the planned sequence option, the user is
prompted to enter an ordered sequence of pallet loads. Selecting from choices presented
in a combination box creates an ordered list of pallet loads. The simulation will read this
list until it encounters a blank space. It will then loop the same pattern continuously.
The user should be aware that there is a selection for an empty pallet and that a blank
space is not representative of an empty pallet.
39
Whenever a user selects a button to enter a line loading technique, a radio button
associated with that line loading technique is automatically selected. The simulation will
use this radio button to decide which technique to use. If data exist for both line loading
techniques, toggling the radio button on and off will select either technique. To make
changes to a line loading technique after it has been entered, the user re-enters the
information by clicking on the proper line loading technique enter button. Re-entering
the information will overwrite the existing information.
3.3 Simulation Replications
In every simulation, the number of replications should be great enough to ensure
the confidence interval half-width is within a certain percentage of the mean, i.e., within
10 percent of the mean value. One way to determine the number of replications required
to obtain a specified half-width is through the use of sequential sampling. The concept of
sequential sampling is to perform several pilot simulation runs and check to see if the
half-width of the confidence interval is acceptable. If the half-width is small enough,
then no more replications are needed. However, if the half-width is not acceptable,
another simulation replication should be made and the value checked again. This process
should continue until the half-width converges and an acceptable half-width is obtained.
Logic for sequential sampling could be included in the model such that the
number of replications is automatically determined in order to get all of the half-widths
for the output statistics within a certain percentage of their means (Kelton, et al, 1998c).
However, a primary goal of the simulation is to eliminate conveyor stops and incidences
where the operator is working outside of the workstation envelope. As the number of
observations of these statistics is reduced, sequential sampling would require more and
more replications in order to obtain the desired half-widths. Consequently, the logic for
sequential sampling is not included in the model to prevent undue lengthy simulations.
However, the user is able to manually determine the number of replications
needed to obtain a desired half-width, by first making initial replications and then using
the following formula:
40
n ≅ n0 * (h02 / h2)
n = number of required replicationsn0 = number of initial replicationsh = desired half-widthh0 = initial half-width
In general, the experience of this author is that the user should make at least 20
replications to obtain acceptable statistics. The default run length for the simulation is
equal to the shift length, therefore, 20 replications are equivalent to simulating the
finishing operation for 20 work shifts. The only variability in the system is the operation
times and the sequence of pallets entering the system. Because of the low variability in
the system and the length of the simulation run, 20 replications should be adequate for
statistics collection.
3.4 Spreadsheet/Simulation Interaction
The simulation model uses much of the same input data as that of the
deterministic analysis. By first completing the Excel spreadsheet deterministic analysis,
much of the required input for the simulation is readily available, and the user can use the
spreadsheet to input data into the simulation model. With the use of VBA, the simulation
model provides the option of using the Excel spreadsheet to obtain relevant data. Instead
of manually entering data, such as minutes per shift, required pallets per shift, and pallet
dimensions, the user can conveniently select the proper Excel file with the information
readily available. Once the proper Excel file is opened, the user simply selects the
desired finishing operation to simulate by clicking on the row number. The simulation
will then be driven by the appropriate data on the spreadsheet. The spreadsheet is
advantageous in that it allows the user to simulate specific operations but does not require
the extra logic to be placed into the model. The user maintains the ability to enter data
directly into the simulation but this is only recommended for users who are familiar with
the Arena simulation software.
There are several advantages gained by de-coupling the data input from the
simulation. The primary and most obvious advantage is that it simplifies the user
interaction with the simulation. The logic of a detailed computer simulation can be very
complex and may limit the use of the simulation to persons with an understanding of
41
computer simulation. Using the spreadsheet to drive the simulation eliminates the need
for this knowledge, thus, allowing almost anyone to use the simulation with only simple
directions.
Another advantage of the spreadsheet is that it clearly specifies all required input
data. The spreadsheet acts as a template that accepts data for both a deterministic and
stochastic analysis. All of this data is contained on one page of the spreadsheet, and
relevant data is automatically placed into the logic modules of the simulation when the
simulation begins. Without this automation, the user would have to manually change
data in several logic modules each time a simulation of a different workstation was
performed.
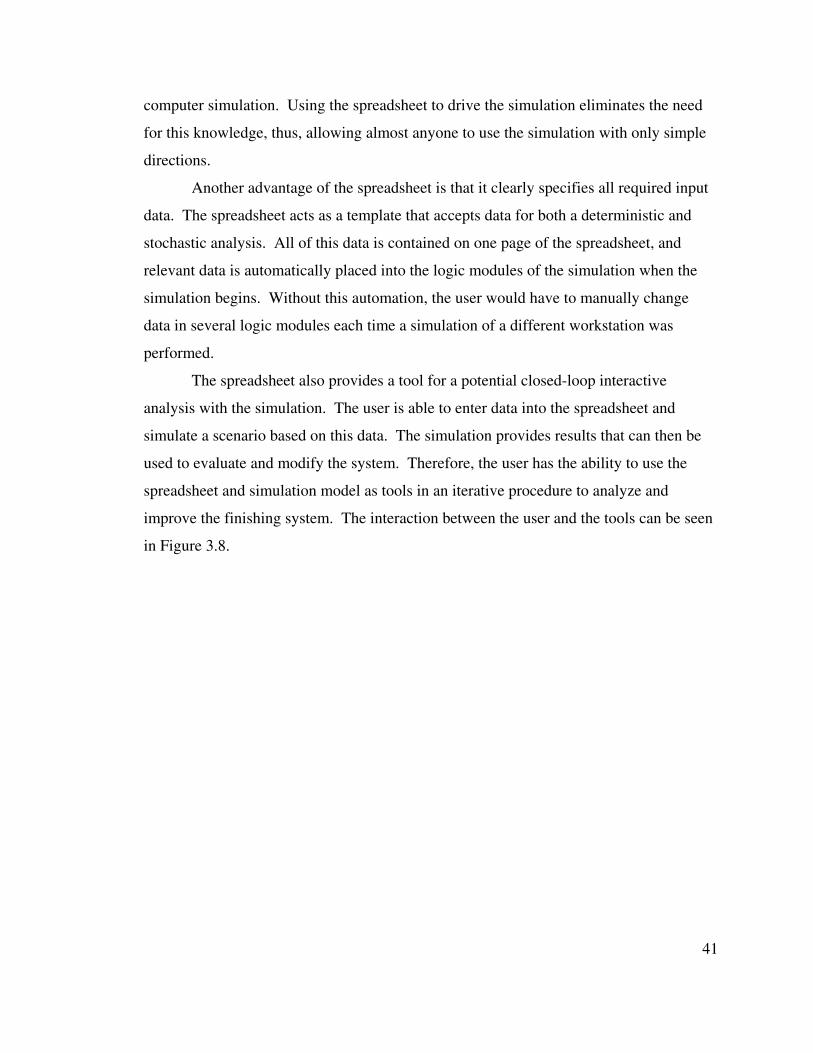
The spreadsheet also provides a tool for a potential closed-loop interactive
analysis with the simulation. The user is able to enter data into the spreadsheet and
simulate a scenario based on this data. The simulation provides results that can then be
used to evaluate and modify the system. Therefore, the user has the ability to use the
spreadsheet and simulation model as tools in an iterative procedure to analyze and
improve the finishing system. The interaction between the user and the tools can be seen
in Figure 3.8.
42
Figure 3.8. Interaction between the user, spreadsheet, and simulation
The Excel spreadsheet also gives the user the ability to adjust distribution
parameters and line loading patterns. The deterministic analysis considers only average
operation times. The simulation model is a stochastic evaluation that takes into account
the distribution of data, thereby, resulting in more accurate output. In order to accurately
estimate the capacity needed for a finishing room, information concerning the
distributions of the operation times must be known.
As stated earlier, a triangular distribution will be used in the simulation. The
triangular distribution was chosen for a variety of reasons. The primary reason is that
minimum, mode, and maximum operation times are easily obtained and simple to
understand. The second reason is that for many operations there is little available data
concerning operation times in the finishing room. The triangular distribution is used in
many situations where there is limited or no data available because a person familiar with
the operation may be able to make an educated guess for the minimum, mode, and
maximum values. The final reason is that the triangular distribution is bounded and
eliminates the possibility of obtaining a negative operation time.
User Spreadsheet Simulation Model
Data
Results
Data
Evaluation andSystem Modification
43
When a simulation run is made, the triangular distribution parameters in the
simulation model will change to match those of the operation selected on the Excel
spreadsheet. The user has the ability to change the parameter values and the actual
distribution types by editing the distributions found in the “Expressions” module in the
simulation model.
The simulation uses the line loading pattern that is selected on the Excel
spreadsheet. By default, four types of pallet loads can enter the simulation. Pallets can
be empty or they can carry large, medium, or small articles of furniture. As stated earlier,
the pattern in which pallets enter the system can be based on a discrete distribution or a
planned sequence. This option of changing the line loading pattern allows several
production schedules to be evaluated.
3.5 Simulation Model
The simulation model provides a tool to analyze and visualize how proposed
finishing systems will behave using different line loading techniques, different product
lines, or different line speeds. The primary goal of the simulation is to verify and refine
the adequacy of the estimated workstation sizes obtained from the deterministic analysis.
Statistics obtained by simulating different scenarios will allow the user to state with a
certain amount of confidence what the ideal workstation size for an application will be.
The simulation can also be used to test possible solutions for a problematic workstation
on an existing finishing line. By changing the variables mentioned above, the finishing
system could be continuously improved through experimentation.
3.6 Scope and Objectives
Several issues need to be addressed when creating a simulation model of a
finishing operation. One issue is the modeling of the power and free conveyor.
Modeling the conveyor as multiple conveyor segments seems to be a logical approach.
These conveyor segments will correspond to the normal or closepac sections of the actual
conveyor. The conveyor segments are made up of several equally sized cells. The length
of the conveyor must be divisible by the number of cells. Items accessing the conveyor
44
may take up multiple cells but the number of available cells limits conveyor access.
Therefore, the concern of pallet size and pallet spacing arises when conveyors are used.
Another issue is the modeling of the finishing line employees. Because the
conveyor is constantly moving, some workers must move with the pallets while
performing any one of several finishing operations. Another issue concerning the
modeling of finishing line employees is that workstations can involve multiple
employees. Some spray booths may utilize more than one worker, while many sanding
and wiping stations use multiple employees. The potential problems of work breakdown,
worker overlap, and proper spacing must be addressed.
Animation is an important feature of the simulation model. By observing the
animation, the user is able to verify that workstation sizes are correct. The user is also
able to observe the operator to see how the operator reacts to different workloads. A
heavy workload will prevent the operator from keeping up with the work and cause the
operator to exceed the workstation limits. The operator must have opportunities to
recover from heavy workloads or the workstation envelope will be exceeded regardless of
workstation size.
The size and complexity of a finishing system is another area of concern.
Because of the time and effort required to construct a simulation of an entire finishing
system, a smaller model dealing with the essential elements of the finishing system has
been developed. This smaller model allows the user to analyze each workstation in the
system separately. This does not appear to be problematic since a major objective of the
simulation is too ensure that workstation sizes are adequate.
3.7 Simulation Model Construction
The simulation software used in this thesis is Arena 3.0 with SIMAN. The
ultimate goal is to use this software to simulate the operation of an entire finishing room.
Such a model would be very large and detailed but the basic idea remains simple. Pallets
arriving on the line are the fundamental entities in the system. The pallet entity travels
around the entire finishing chain loop and is then disposed. Four types of pallets can
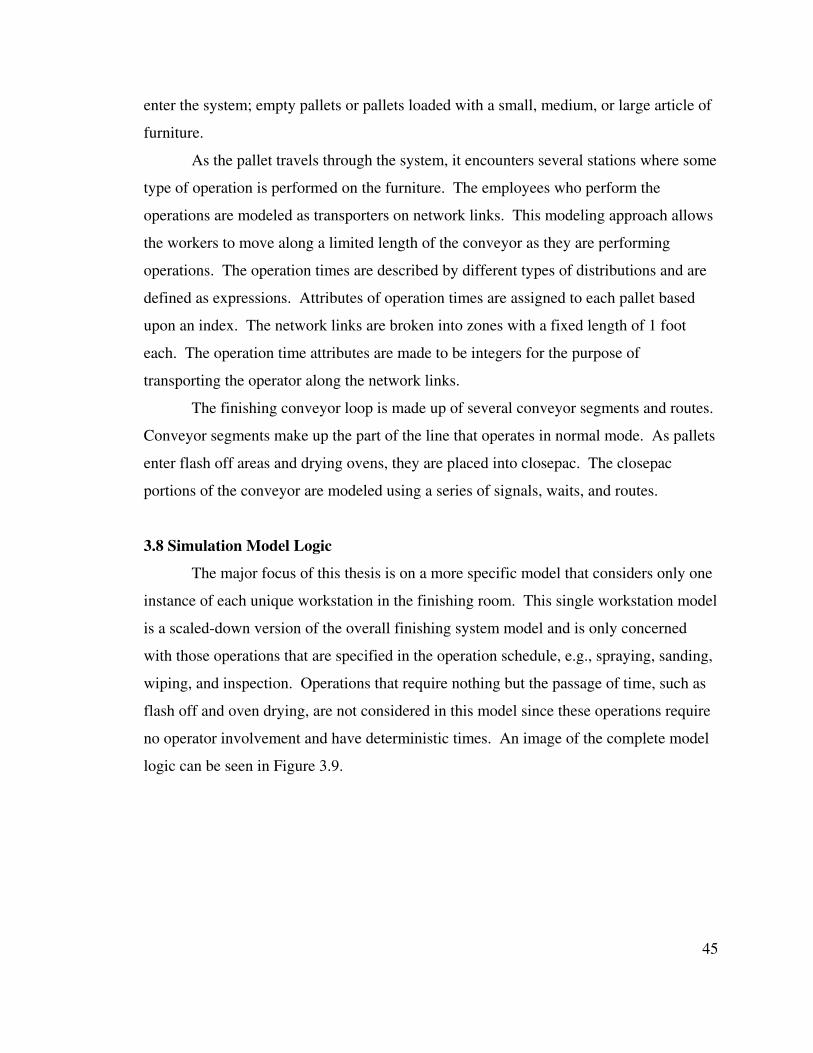
45
enter the system; empty pallets or pallets loaded with a small, medium, or large article of
furniture.
As the pallet travels through the system, it encounters several stations where some
type of operation is performed on the furniture. The employees who perform the
operations are modeled as transporters on network links. This modeling approach allows
the workers to move along a limited length of the conveyor as they are performing
operations. The operation times are described by different types of distributions and are
defined as expressions. Attributes of operation times are assigned to each pallet based
upon an index. The network links are broken into zones with a fixed length of 1 foot
each. The operation time attributes are made to be integers for the purpose of
transporting the operator along the network links.
The finishing conveyor loop is made up of several conveyor segments and routes.
Conveyor segments make up the part of the line that operates in normal mode. As pallets
enter flash off areas and drying ovens, they are placed into closepac. The closepac
portions of the conveyor are modeled using a series of signals, waits, and routes.
3.8 Simulation Model Logic
The major focus of this thesis is on a more specific model that considers only one
instance of each unique workstation in the finishing room. This single workstation model
is a scaled-down version of the overall finishing system model and is only concerned
with those operations that are specified in the operation schedule, e.g., spraying, sanding,
wiping, and inspection. Operations that require nothing but the passage of time, such as
flash off and oven drying, are not considered in this model since these operations require
no operator involvement and have deterministic times. An image of the complete model
logic can be seen in Figure 3.9.
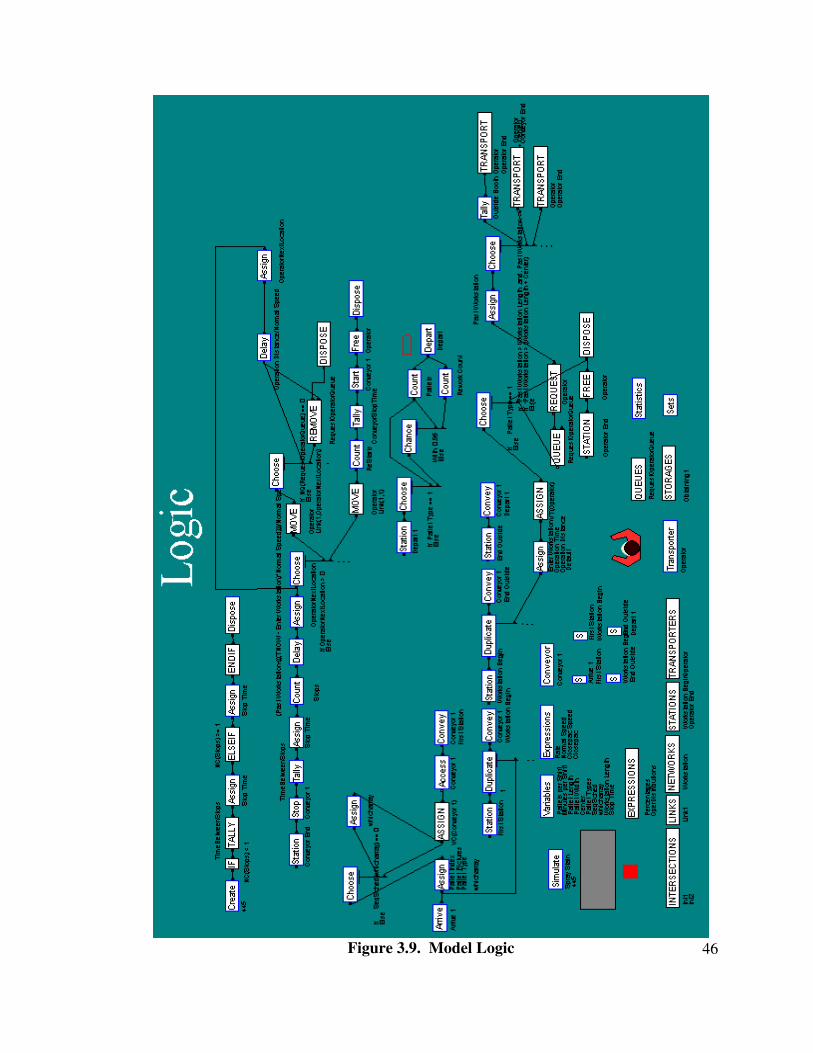
46Figure 3.9. Model Logic
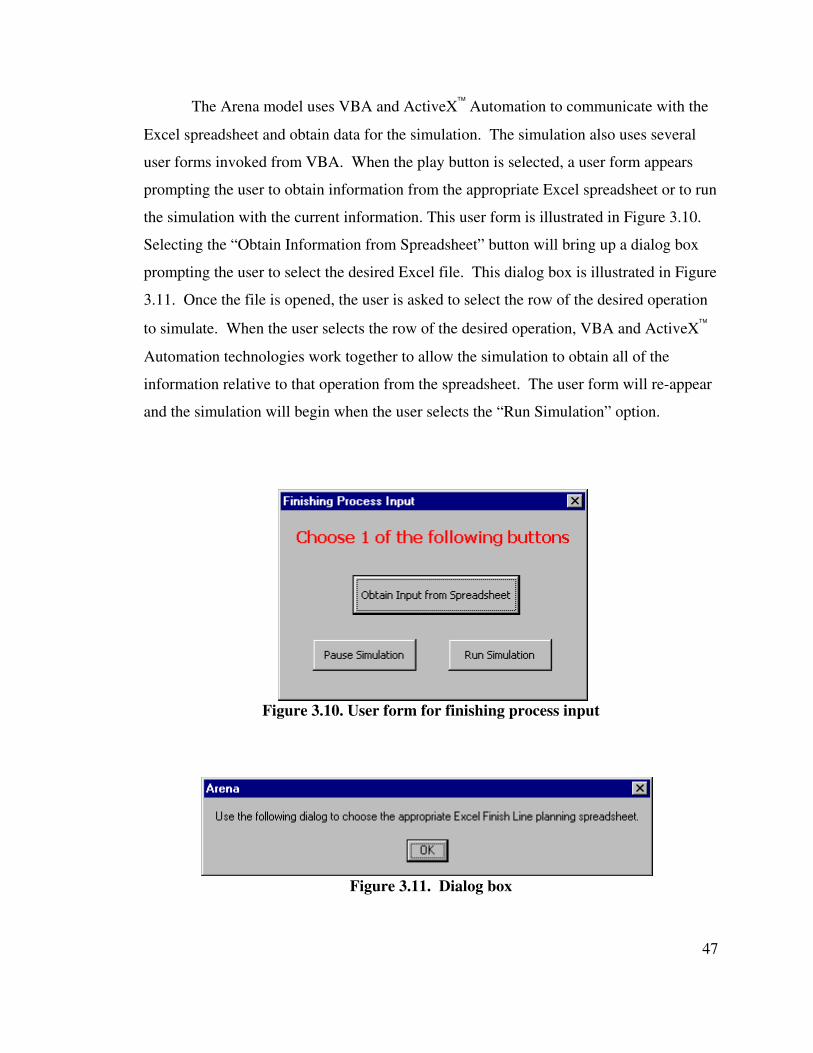
47
The Arena model uses VBA and ActiveX Automation to communicate with the
Excel spreadsheet and obtain data for the simulation. The simulation also uses several
user forms invoked from VBA. When the play button is selected, a user form appears
prompting the user to obtain information from the appropriate Excel spreadsheet or to run
the simulation with the current information. This user form is illustrated in Figure 3.10.
Selecting the “Obtain Information from Spreadsheet” button will bring up a dialog box
prompting the user to select the desired Excel file. This dialog box is illustrated in Figure
3.11. Once the file is opened, the user is asked to select the row of the desired operation
to simulate. When the user selects the row of the desired operation, VBA and ActiveX
Automation technologies work together to allow the simulation to obtain all of the
information relative to that operation from the spreadsheet. The user form will re-appear
and the simulation will begin when the user selects the “Run Simulation” option.
Figure 3.10. User form for finishing process input
Figure 3.11. Dialog box
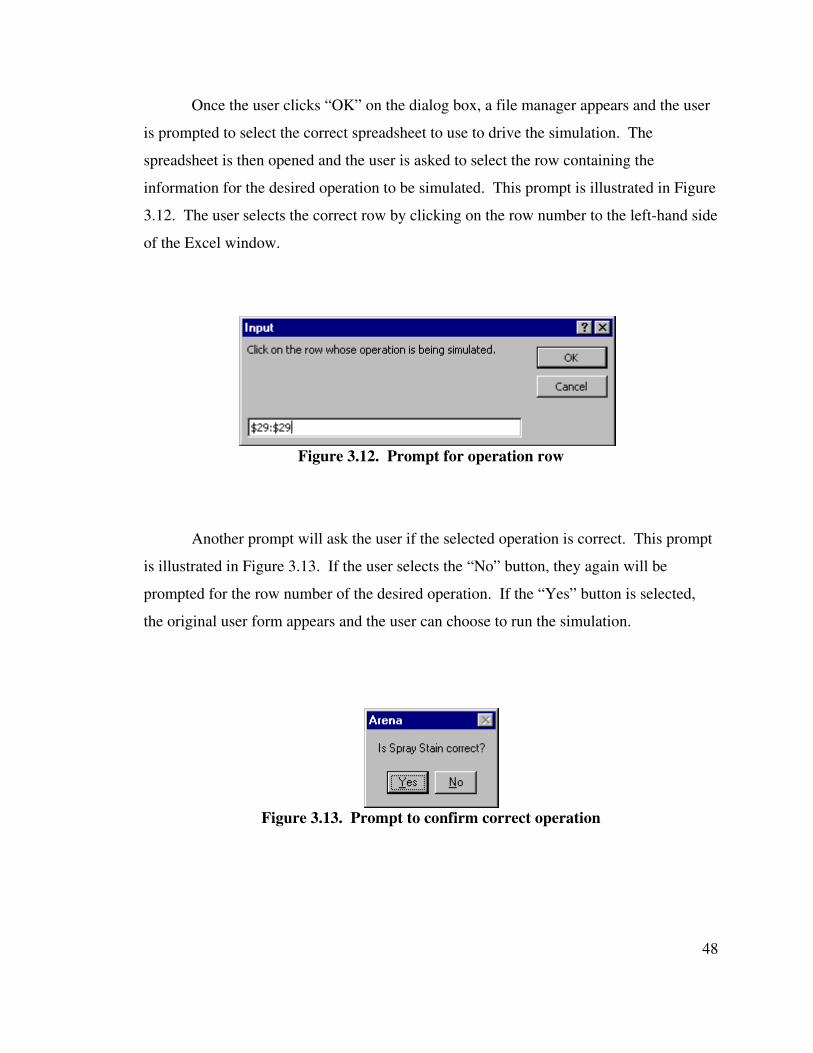
48
Once the user clicks “OK” on the dialog box, a file manager appears and the user
is prompted to select the correct spreadsheet to use to drive the simulation. The
spreadsheet is then opened and the user is asked to select the row containing the
information for the desired operation to be simulated. This prompt is illustrated in Figure
3.12. The user selects the correct row by clicking on the row number to the left-hand side
of the Excel window.
Figure 3.12. Prompt for operation row
Another prompt will ask the user if the selected operation is correct. This prompt
is illustrated in Figure 3.13. If the user selects the “No” button, they again will be
prompted for the row number of the desired operation. If the “Yes” button is selected,
the original user form appears and the user can choose to run the simulation.
Figure 3.13. Prompt to confirm correct operation
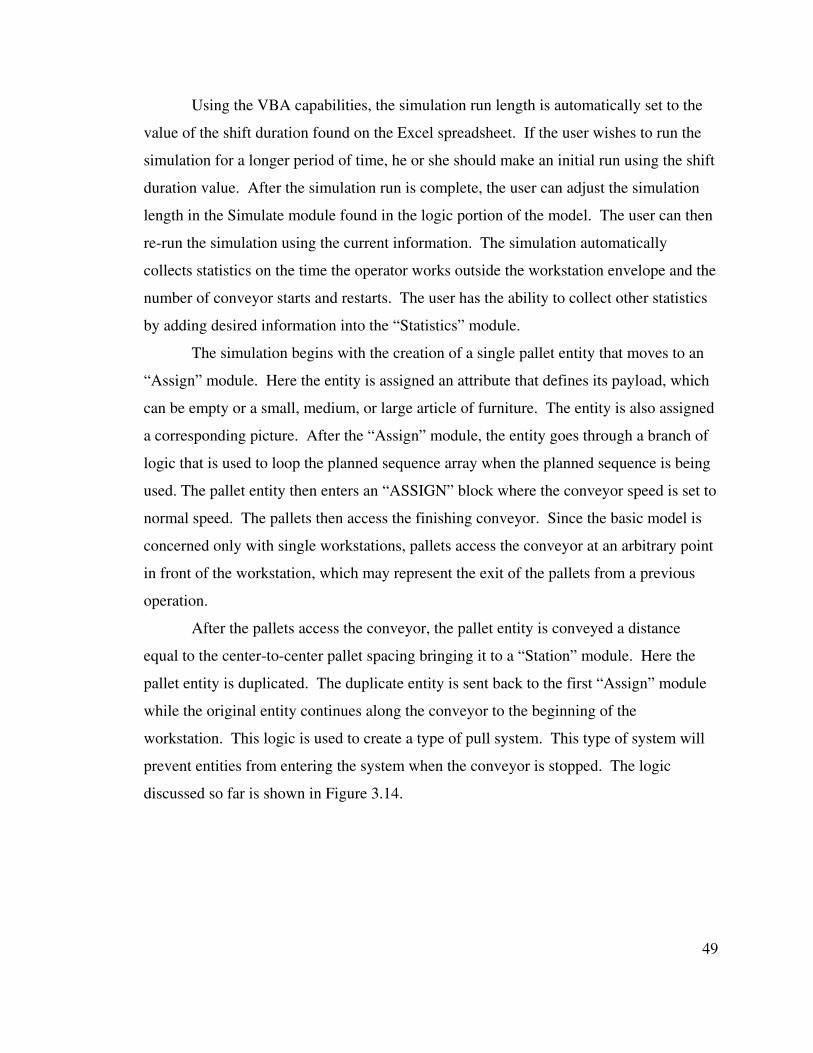
49
Using the VBA capabilities, the simulation run length is automatically set to the
value of the shift duration found on the Excel spreadsheet. If the user wishes to run the
simulation for a longer period of time, he or she should make an initial run using the shift
duration value. After the simulation run is complete, the user can adjust the simulation
length in the Simulate module found in the logic portion of the model. The user can then
re-run the simulation using the current information. The simulation automatically
collects statistics on the time the operator works outside the workstation envelope and the
number of conveyor starts and restarts. The user has the ability to collect other statistics
by adding desired information into the “Statistics” module.
The simulation begins with the creation of a single pallet entity that moves to an
“Assign” module. Here the entity is assigned an attribute that defines its payload, which
can be empty or a small, medium, or large article of furniture. The entity is also assigned
a corresponding picture. After the “Assign” module, the entity goes through a branch of
logic that is used to loop the planned sequence array when the planned sequence is being
used. The pallet entity then enters an “ASSIGN” block where the conveyor speed is set to
normal speed. The pallets then access the finishing conveyor. Since the basic model is
concerned only with single workstations, pallets access the conveyor at an arbitrary point
in front of the workstation, which may represent the exit of the pallets from a previous
operation.
After the pallets access the conveyor, the pallet entity is conveyed a distance
equal to the center-to-center pallet spacing bringing it to a “Station” module. Here the
pallet entity is duplicated. The duplicate entity is sent back to the first “Assign” module
while the original entity continues along the conveyor to the beginning of the
workstation. This logic is used to create a type of pull system. This type of system will
prevent entities from entering the system when the conveyor is stopped. The logic
discussed so far is shown in Figure 3.14.
50
Figure 3.14. Logic for pallet arrival and assignments
After duplicating itself, the original pallet entity travels along the finishing
conveyor at normal speed until it reaches a “Station” module that corresponds to the start
point of a workstation. Here the pallet entity duplicates itself again with the original
entity, which is animated as a pallet continuing along the finishing conveyor. The
duplicated entity is sent through a logic series in which the entity triggers the operator,
causing the operator to transport the duplicated entity along side of the original pallet
entity that is traveling on the conveyor. When animated, the operator looks to be
performing an operation on the pallet entity, however, the operator is actually
transporting the duplicate entity. In the first step of this logic, the duplicated entity is sent
to an “Assign” module where it is given a time attribute for the time that it enters the
workstation. It is also given an operation time attribute taken from the distribution of
times for the operation being simulated. This operation time is translated into an
operation distance attribute using the distance formula
AINT(Operation Time * Normal Speed + 1).
This formula returns an integer value for the distance the operator travels while
performing the operation on the pallet that is moving at normal speed.
The duplicated entity is then sent to an “ASSIGN” block where the speed of the
operator is set to the normal conveyor speed. The entity then enters a “Choose” module
to determine which type of pallet load is being carried. If the pallet load is empty, the
duplicated entity is disposed. Otherwise, the duplicated entity is sent to a queue where it
Arrive 1Arrive
Conveyor 1Access
Conveyor 1Workstation Begin
Convey
VC(Conveyor 1)
ASSIGN
1
Duplicate
Pallet Index
Pallet Typewhicharray
Pallet Pictures
Assign
Conveyor 1First Station
Convey
First StationStation
SeqSched(whicharray) == 0IfElse
Choose whicharray
Assign
51
requests the operator who is modeled as a transporter. The modeling of the operator is
somewhat complex because the finishing conveyor is constantly moving. When a pallet
enters the workstation, the operator begins work and must walk along side of the
conveyor while performing the operation. Once the work is complete, the operator will
either return to the beginning of the workstation to await the arrival of the next pallet or
start work on the next pallet if it has already entered the workstation.
The operator moves along a transport link that is parallel to the finishing
conveyor. The transport link begins at the point where the finishing conveyor enters the
workstation and extends beyond the end of the workstation. This extension provides
allowance for lengthy operations that require the operator to exceed the workstation
envelope. The transport link is divided into zones one foot in length. The home point for
the operator is the first zone on the transport link, which corresponds to the beginning of
the workstation.
Once the duplicated entity requests the operator, the operator locates the
duplicated entity using the location formula
Link(1, AINT((TNOW - Enter Workstation) * Normal Speed) + 1).
The operator begins work as soon as the entity enters into the first zone if the operator is
idle and waiting at the first zone. If the operator is busy when the duplicate entity sends
its request, the operator finishes the current work and moves to the location of the
duplicate entity based on the location formula. This formula assumes that the operator
speed is infinite or high enough that the time to travel between pallets is negligible. This
assumption is acceptable since most humans walk comfortably around 250 ft./min and
the typical finishing conveyor runs at speeds between 12 and 20 ft./min. The difference
in speeds, along with the short distance the operator must travel between pallets, makes
the travel time insignificant.
The operator is seized by the duplicate entity when the operator reaches the
location of the duplicate entity. The entity is then sent to an “Assign” module. The
entity is assigned an attribute called Past Workstation. The formula for this attribute is
(((TNOW - Enter Workstation) * Normal Speed)) + Operation Distance).
52
This attribute determines the final location of the pallet and operator when the operation
is complete. The entity is sent to another “Choose” module to determine if the distance it
takes to perform the operation exceeds the workstation envelope. This “Choose” module
has the following three decision branches:
If Past Workstation > Workstation Length .and. Past Workstation <=(Workstation Length + Center-to-Center)
If Past Workstation > (Workstation Length + Center-to-Center)Else
These decisions are “look-ahead” decisions that alert the simulation of the correct
logic branch the entity should follow. The first decision determines if the final location
of the operator after completing the required work is past the workstation envelope but
does not exceed the envelope by more than the center-to-center spacing. The simulation
permits work to occur in this region but it is not desirable for the operator to work in this
area. Therefore, this region is called Zone M (marginal zone) and can be seen in Figure
3.15. If this logic for this decision is true, statistics are collected on the amount of time
the operator is outside of the workstation envelope based on the formula
((((TNOW - Enter Workstation) * Normal Speed) + Operation Distance) –
Workstation Length) / Normal Speed).
This formula calculates the distance the operator travels outside the workstation and
transforms the distance value into a time value. Statistics are kept on the number of times
the operator exceeds the workstation limits and the average and maximum times spent
outside of the workstation.
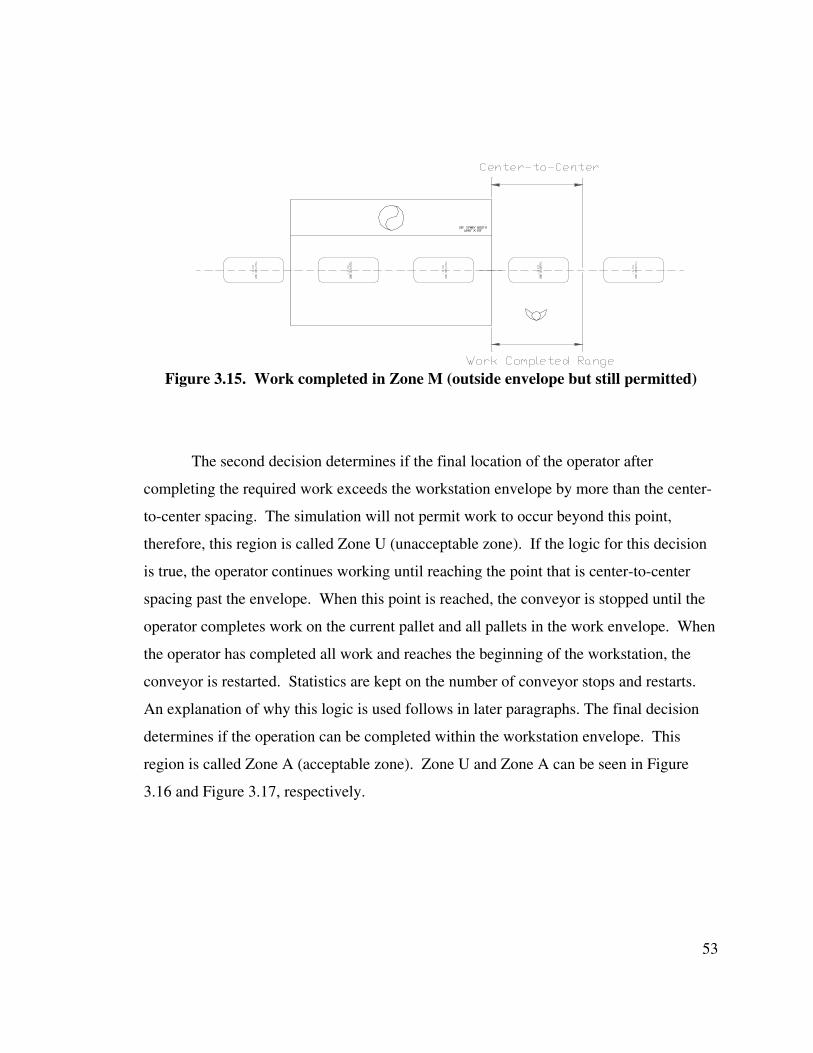
53
Figure 3.15. Work completed in Zone M (outside envelope but still permitted)
The second decision determines if the final location of the operator after
completing the required work exceeds the workstation envelope by more than the center-
to-center spacing. The simulation will not permit work to occur beyond this point,
therefore, this region is called Zone U (unacceptable zone). If the logic for this decision
is true, the operator continues working until reaching the point that is center-to-center
spacing past the envelope. When this point is reached, the conveyor is stopped until the
operator completes work on the current pallet and all pallets in the work envelope. When
the operator has completed all work and reaches the beginning of the workstation, the
conveyor is restarted. Statistics are kept on the number of conveyor stops and restarts.
An explanation of why this logic is used follows in later paragraphs. The final decision
determines if the operation can be completed within the workstation envelope. This
region is called Zone A (acceptable zone). Zone U and Zone A can be seen in Figure
3.16 and Figure 3.17, respectively.
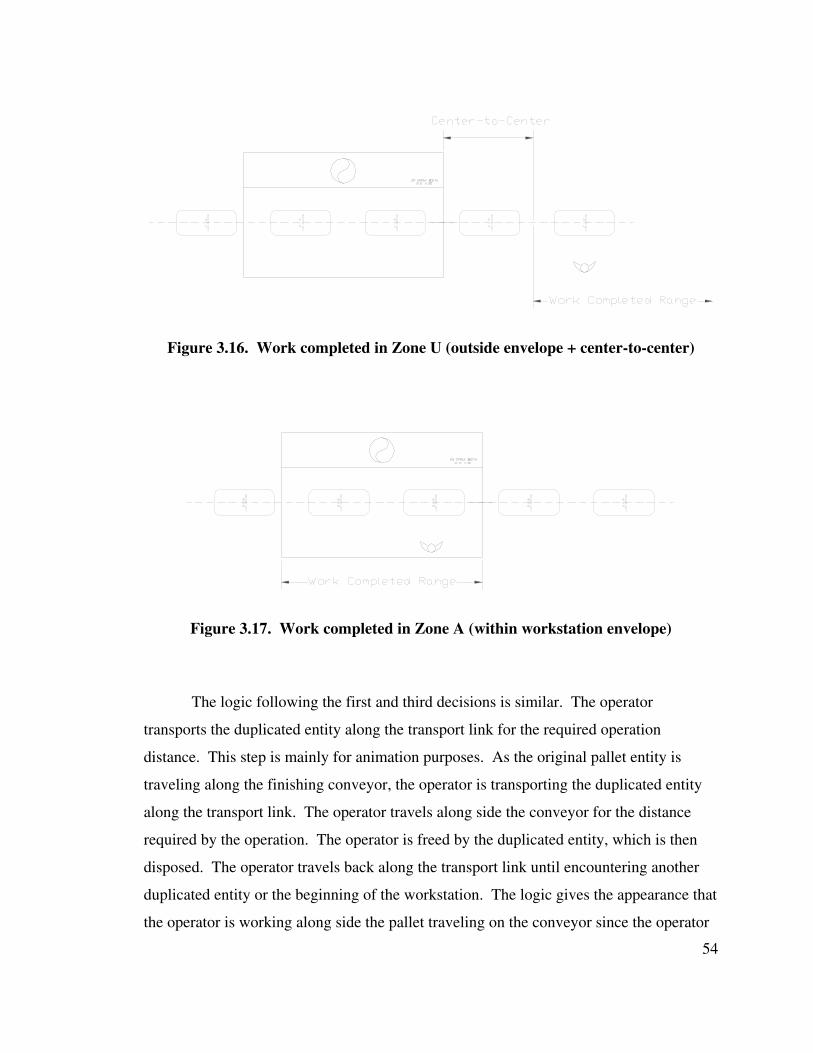
54
Figure 3.16. Work completed in Zone U (outside envelope + center-to-center)
Figure 3.17. Work completed in Zone A (within workstation envelope)
The logic following the first and third decisions is similar. The operator
transports the duplicated entity along the transport link for the required operation
distance. This step is mainly for animation purposes. As the original pallet entity is
traveling along the finishing conveyor, the operator is transporting the duplicated entity
along the transport link. The operator travels along side the conveyor for the distance
required by the operation. The operator is freed by the duplicated entity, which is then
disposed. The operator travels back along the transport link until encountering another
duplicated entity or the beginning of the workstation. The logic gives the appearance that
the operator is working along side the pallet traveling on the conveyor since the operator
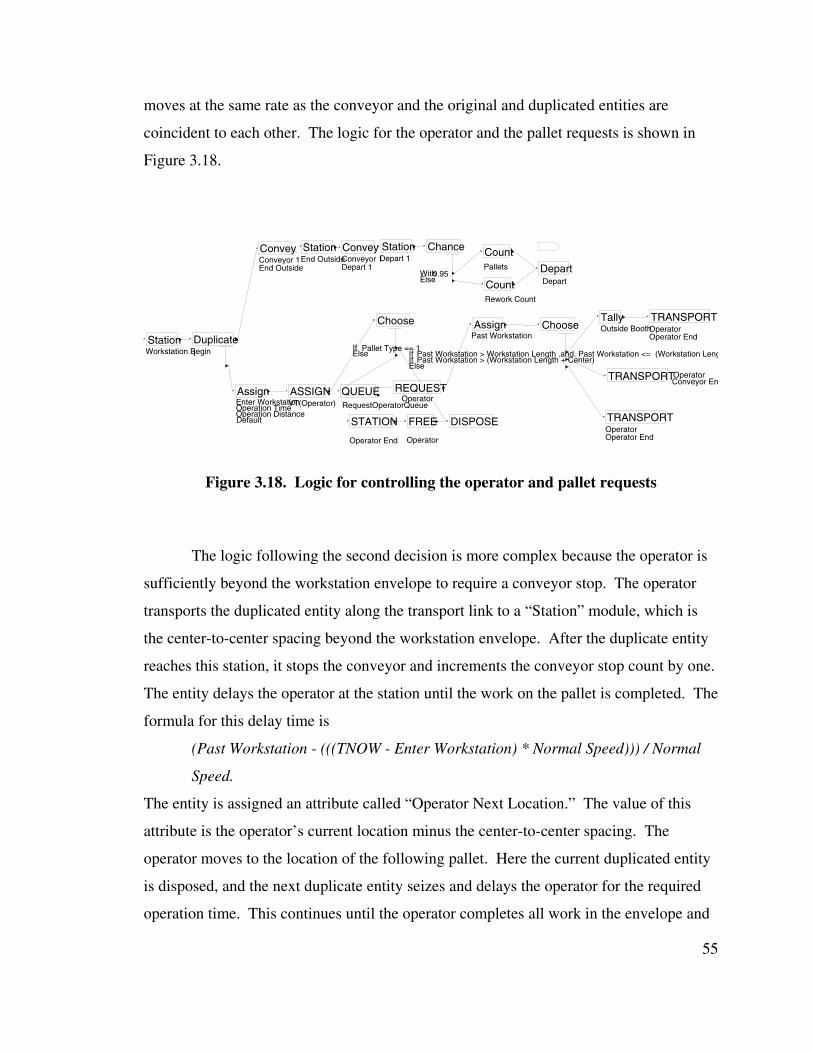
55
moves at the same rate as the conveyor and the original and duplicated entities are
coincident to each other. The logic for the operator and the pallet requests is shown in
Figure 3.18.
Figure 3.18. Logic for controlling the operator and pallet requests
The logic following the second decision is more complex because the operator is
sufficiently beyond the workstation envelope to require a conveyor stop. The operator
transports the duplicated entity along the transport link to a “Station” module, which is
the center-to-center spacing beyond the workstation envelope. After the duplicate entity
reaches this station, it stops the conveyor and increments the conveyor stop count by one.
The entity delays the operator at the station until the work on the pallet is completed. The
formula for this delay time is
(Past Workstation - (((TNOW - Enter Workstation) * Normal Speed))) / Normal
Speed.
The entity is assigned an attribute called “Operator Next Location.” The value of this
attribute is the operator’s current location minus the center-to-center spacing. The
operator moves to the location of the following pallet. Here the current duplicated entity
is disposed, and the next duplicate entity seizes and delays the operator for the required
operation time. This continues until the operator completes all work in the envelope and
Workstation BeginStation
Conveyor 1End Outside
Convey
1
Duplicate
Operator End
STATION
Operator
FREE DISPOSE
OperatorREQUEST
Depart
Depart
VT(Operator)ASSIGN
Enter WorkstationOperation TimeOperation DistanceDefault
AssignRequestOperatorQueue
QUEUE
End OutsideStation
Conveyor 1Depart 1
Convey
Operator EndOperatorTRANSPORT
Past Workstation > Workstation Length .and. Past Workstation <= (Workstation LengPast Workstation > (Workstation Length + Center)
IfIfElse
Choose Outside BoothTally
Operator EndOperatorTRANSPORT
Past WorkstationAssign
Conveyor EnOperatorTRANSPORT
Pallet Type == 1IfElse
Choose
Depart 1Station
WithElse
0.95
Chance
Pallets
Count
Rework Count
Count
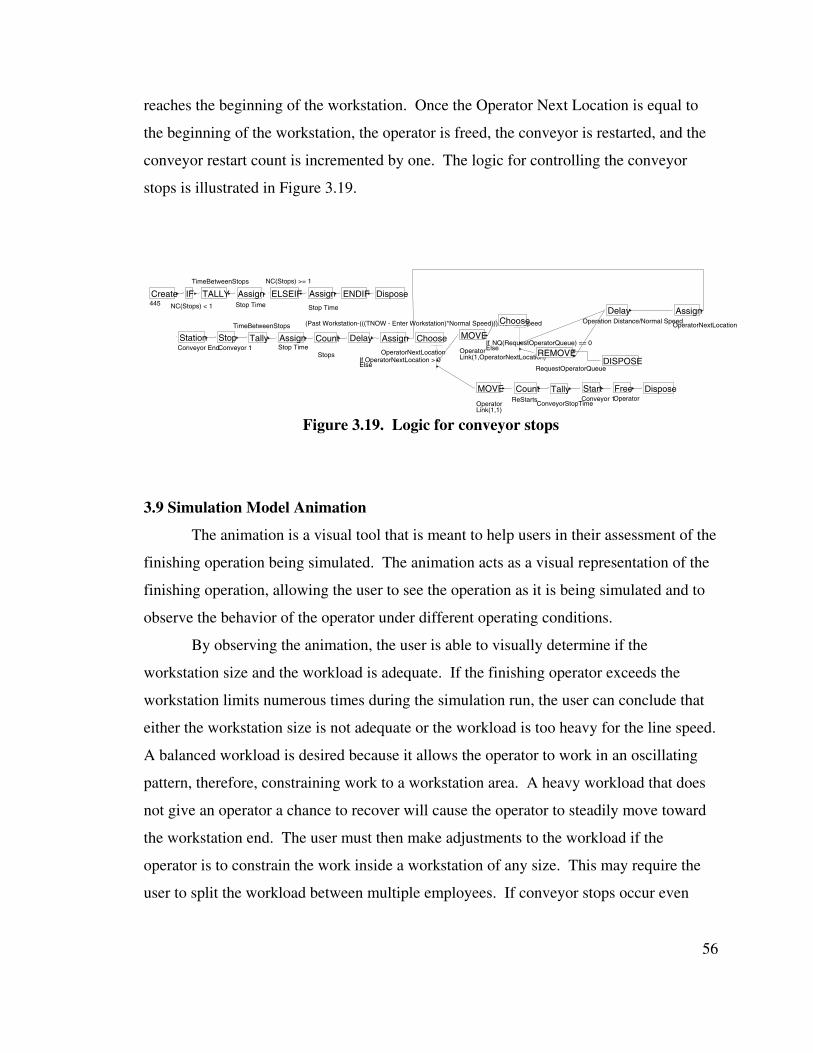
56
reaches the beginning of the workstation. Once the Operator Next Location is equal to
the beginning of the workstation, the operator is freed, the conveyor is restarted, and the
conveyor restart count is incremented by one. The logic for controlling the conveyor
stops is illustrated in Figure 3.19.
Figure 3.19. Logic for conveyor stops
3.9 Simulation Model Animation
The animation is a visual tool that is meant to help users in their assessment of the
finishing operation being simulated. The animation acts as a visual representation of the
finishing operation, allowing the user to see the operation as it is being simulated and to
observe the behavior of the operator under different operating conditions.
By observing the animation, the user is able to visually determine if the
workstation size and the workload is adequate. If the finishing operator exceeds the
workstation limits numerous times during the simulation run, the user can conclude that
either the workstation size is not adequate or the workload is too heavy for the line speed.
A balanced workload is desired because it allows the operator to work in an oscillating
pattern, therefore, constraining work to a workstation area. A heavy workload that does
not give an operator a chance to recover will cause the operator to steadily move toward
the workstation end. The user must then make adjustments to the workload if the
operator is to constrain the work inside a workstation of any size. This may require the
user to split the workload between multiple employees. If conveyor stops occur even
Conveyor 1Stop
(Past Workstation-(((TNOW - Enter Workstation)*Normal Speed)))/Normal Speed
Delay
OperatorNextLocation > 0IfElse
ChooseConveyor EndStation
Link(1,OperatorNextLocation)Operator
MOVE
OperatorNextLocation
Assign
OperatorNextLocation
Assign
Link(1,1)Operator
MOVEConveyor 1Start
OperatorFree Dispose
ReStarts
Count
Stops
Count
RequestOperatorQueue
REMOVEDISPOSE
NQ(RequestOperatorQueue) == 0IfElse
Choose Operation Distance/Normal Speed
Delay
TimeBetweenStops
Tally
445Create
NC(Stops) < 1
IF ENDIF Dispose
TimeBetweenStops
TALLY
Stop TimeAssign
ConveyorStopTime
Tally
Stop Time
Assign
NC(Stops) >= 1
ELSEIF
Stop Time
Assign
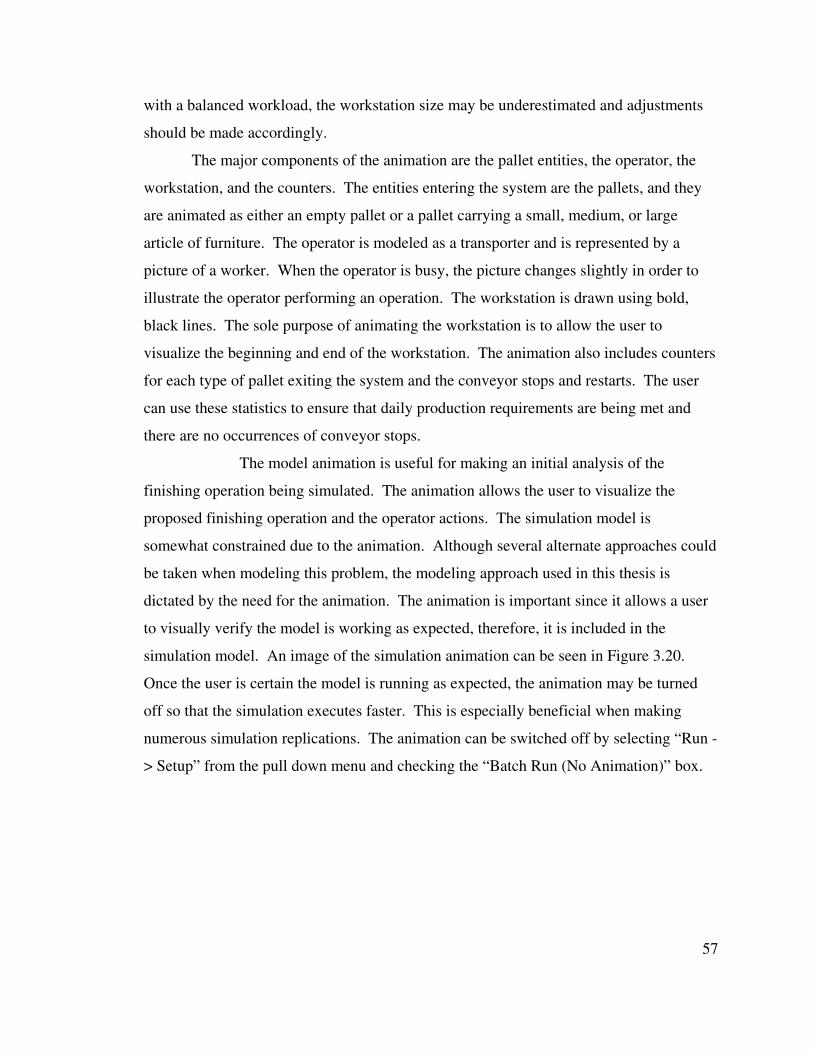
57
with a balanced workload, the workstation size may be underestimated and adjustments
should be made accordingly.
The major components of the animation are the pallet entities, the operator, the
workstation, and the counters. The entities entering the system are the pallets, and they
are animated as either an empty pallet or a pallet carrying a small, medium, or large
article of furniture. The operator is modeled as a transporter and is represented by a
picture of a worker. When the operator is busy, the picture changes slightly in order to
illustrate the operator performing an operation. The workstation is drawn using bold,
black lines. The sole purpose of animating the workstation is to allow the user to
visualize the beginning and end of the workstation. The animation also includes counters
for each type of pallet exiting the system and the conveyor stops and restarts. The user
can use these statistics to ensure that daily production requirements are being met and
there are no occurrences of conveyor stops.
The model animation is useful for making an initial analysis of the
finishing operation being simulated. The animation allows the user to visualize the
proposed finishing operation and the operator actions. The simulation model is
somewhat constrained due to the animation. Although several alternate approaches could
be taken when modeling this problem, the modeling approach used in this thesis is
dictated by the need for the animation. The animation is important since it allows a user
to visually verify the model is working as expected, therefore, it is included in the
simulation model. An image of the simulation animation can be seen in Figure 3.20.
Once the user is certain the model is running as expected, the animation may be turned
off so that the simulation executes faster. This is especially beneficial when making
numerous simulation replications. The animation can be switched off by selecting “Run -
> Setup” from the pull down menu and checking the “Batch Run (No Animation)” box.
58
Figure 3.20. Model Animation
3.10 Simulation Output
The simulation should be used as part of an iterative process in which the
simulation output is reviewed, adjustments are made to the parameters and physical
features in the spreadsheet, and the operation is re-simulated. Useful output from the
59
simulation includes the number of times the operator exceeded the workstation limits, the
average duration time spent outside the workstation, and the maximum amount of time
spent outside of the workstation. This information, collected over several simulation
runs, allows the user to see how large the workstation should be to prevent the operator
from exceeding the workstation limits. Multiplying the time spent outside the
workstation by the line speed gives the distance the operator travels outside of the work
envelope. The user has the ability to run the simulation with heavy workloads to plan for
worst-case scenarios. Because of the expense involved with each square foot of
workstation space, it may be desirable to determine the minimum work envelope required
for a particular operation.
Other useful information is the number of conveyor stops and restarts. If there is
a high number of conveyor stops, it is because the workstation is under capacitated and
the operator cannot complete the work inside the work envelope. Remedies for this
situation include staggering the line loading pattern, reducing the line speed, adding
additional workers to the station, and increasing the workstation size.
The Arena Output Analyzer allows the user to collect statistics on relevant data
and to create confidence intervals with that data. For example, the user may wish to state
with a certain level of confidence that the operator does not exceed the limits of a
particular workstation. The user could make multiple simulation runs to collect statistics
and create a confidence interval for the average number of times the operator exceeds the
work envelope. The model has several default statistics that are sent to an output file.
These include the pallet counts, conveyor stops and restarts, time between conveyor
stops, observations outside of the workstation, and operator utilization.
The Output Analyzer can be opened by selecting “Tools -> Output Analyzer”
from the pull down menu. This will open the Output Analyzer window. In this window,
the user is able to create a new output file by selecting “File -> New” from the pull down
menu. The user can add the desired data group files to the output file. Figure 3.21 shows
the output file with the added data group files.
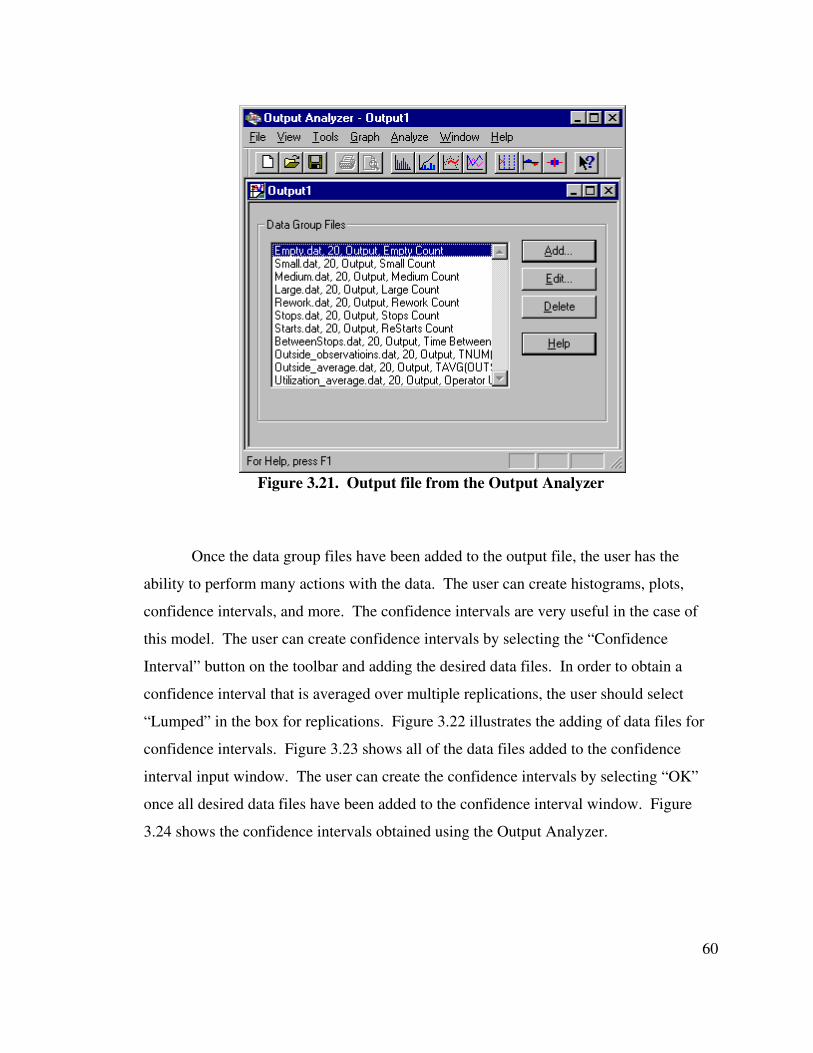
60
Figure 3.21. Output file from the Output Analyzer
Once the data group files have been added to the output file, the user has the
ability to perform many actions with the data. The user can create histograms, plots,
confidence intervals, and more. The confidence intervals are very useful in the case of
this model. The user can create confidence intervals by selecting the “Confidence
Interval” button on the toolbar and adding the desired data files. In order to obtain a
confidence interval that is averaged over multiple replications, the user should select
“Lumped” in the box for replications. Figure 3.22 illustrates the adding of data files for
confidence intervals. Figure 3.23 shows all of the data files added to the confidence
interval input window. The user can create the confidence intervals by selecting “OK”
once all desired data files have been added to the confidence interval window. Figure
3.24 shows the confidence intervals obtained using the Output Analyzer.
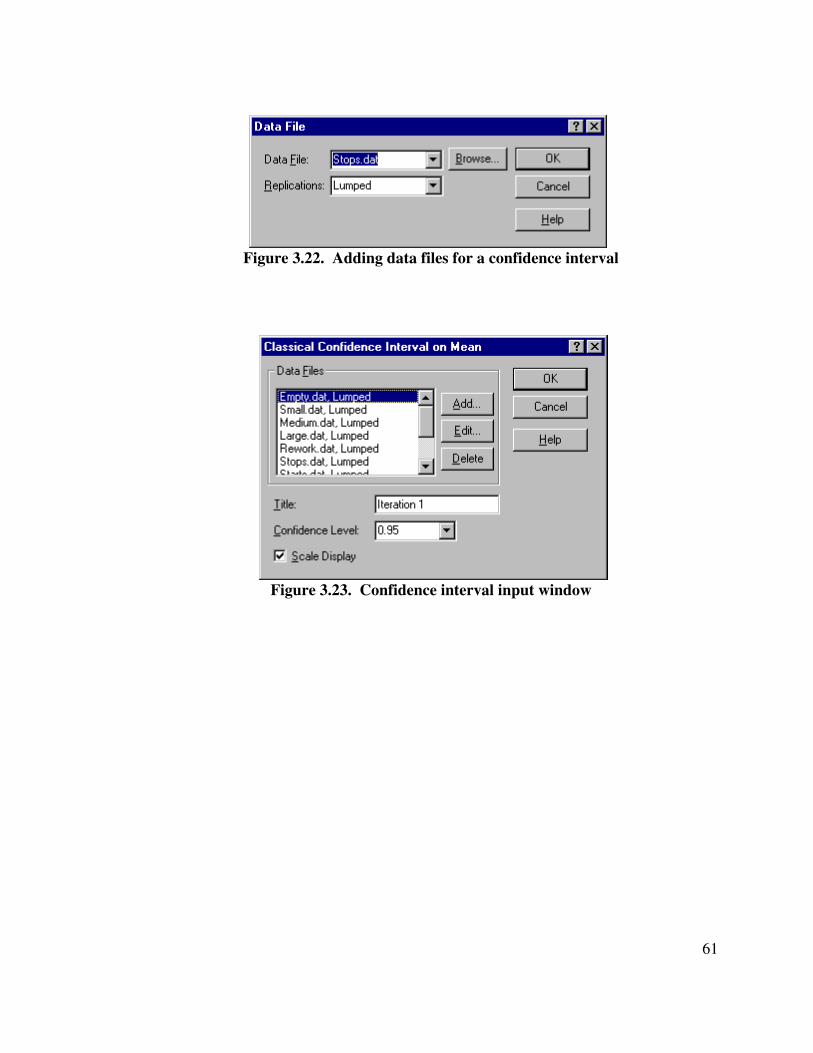
61
Figure 3.22. Adding data files for a confidence interval
Figure 3.23. Confidence interval input window
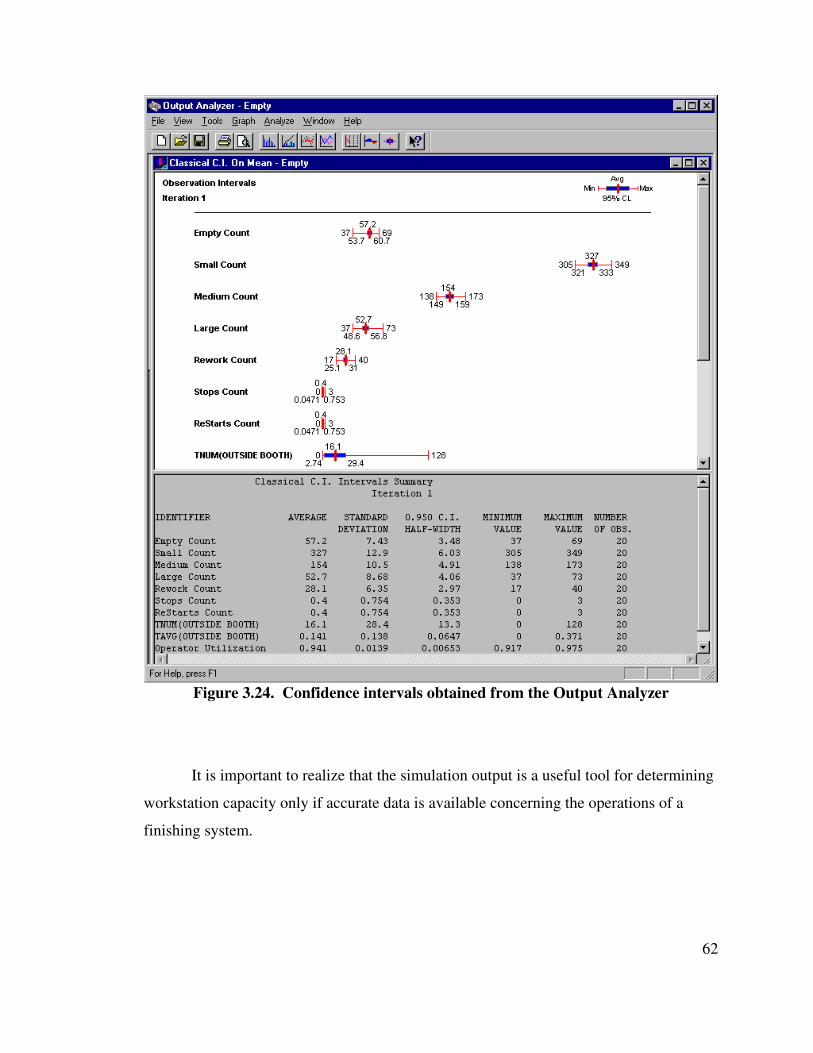
62
Figure 3.24. Confidence intervals obtained from the Output Analyzer
It is important to realize that the simulation output is a useful tool for determining
workstation capacity only if accurate data is available concerning the operations of a
finishing system.
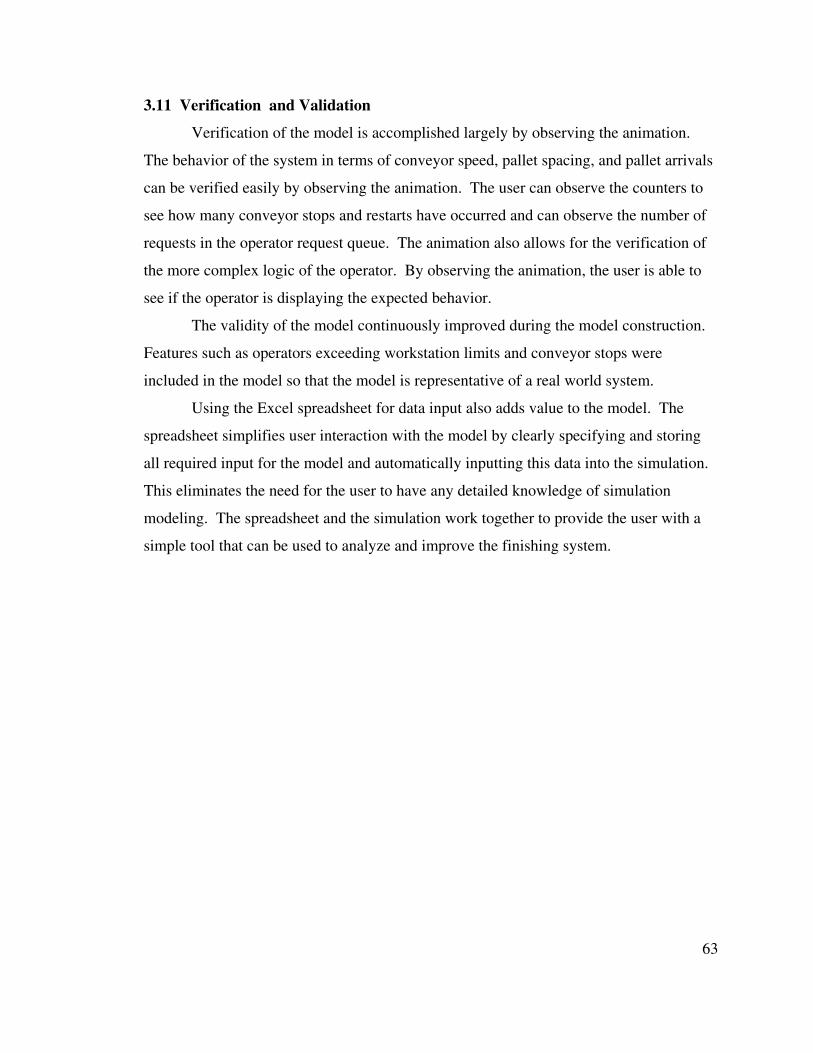
63
3.11 Verification and Validation
Verification of the model is accomplished largely by observing the animation.
The behavior of the system in terms of conveyor speed, pallet spacing, and pallet arrivals
can be verified easily by observing the animation. The user can observe the counters to
see how many conveyor stops and restarts have occurred and can observe the number of
requests in the operator request queue. The animation also allows for the verification of
the more complex logic of the operator. By observing the animation, the user is able to
see if the operator is displaying the expected behavior.
The validity of the model continuously improved during the model construction.
Features such as operators exceeding workstation limits and conveyor stops were
included in the model so that the model is representative of a real world system.
Using the Excel spreadsheet for data input also adds value to the model. The
spreadsheet simplifies user interaction with the model by clearly specifying and storing
all required input for the model and automatically inputting this data into the simulation.
This eliminates the need for the user to have any detailed knowledge of simulation
modeling. The spreadsheet and the simulation work together to provide the user with a
simple tool that can be used to analyze and improve the finishing system.
64
Case Study
4.1 Case Description
This chapter presents a simple case study that serves as a detailed example of
the data and procedures involved in the complete design of a finishing system. The case
study will be based on the desk manufacturing example used in Chapter 1. The data in
this case are representative of situations found in many residential furniture industries.
Recall that the desk manufacturer was developing plans for a new manufacturing facility.
It has been decided by management to expand the product line to include a new office
suite consisting of a traditional desk, a credenza with a hutch top, and an executive desk
with an “L” configuration. These articles represent small, medium, and large articles of
furniture, respectively. In order to meet demand, the company wishes to produce 315
traditional desks/day, 150 credenzas/day, and 65 executive desks/day, setting the daily
production rate at 530 articles per day.
The company must determine the conveyor length, line speed, cycle time, spray
booth sizes, required number of pallets, and crew size. This case study uses the Excel
spreadsheet to specify the overall design parameters and uses the simulation model to
evaluate individual operations. By using the spreadsheet and simulation in an iterative
process, a solution will be determined that ensures all production requirements are met
and all work is constrained inside an operation’s work envelope.
4.2 Deterministic Analysis
The new office suite uses the same materials schedule found in the example of
Chapter 1, which is shown in Table 4.1. It is assumed that the average operation times
will increase by 10 percent because of the larger furniture items. The results from the
increase in operation times can be seen in Table 4.2.
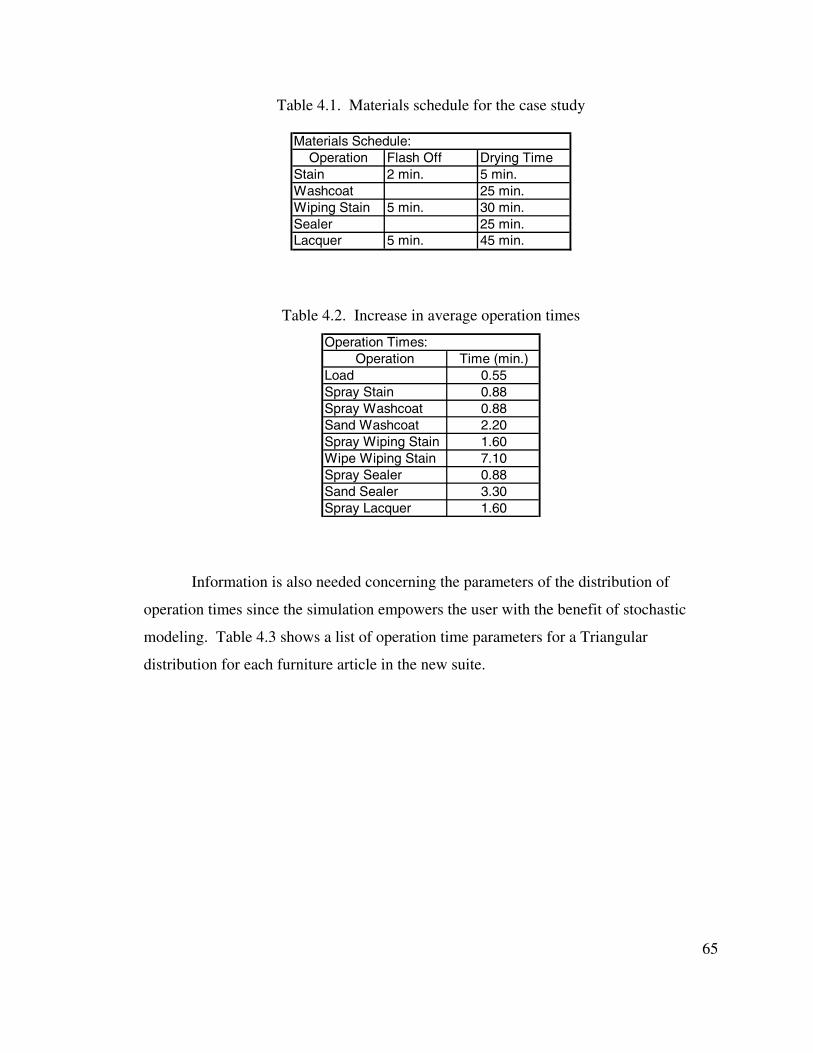
65
Table 4.1. Materials schedule for the case study
Materials Schedule:Operation Flash Off Drying Time
Stain 2 min. 5 min.Washcoat 25 min.Wiping Stain 5 min. 30 min.Sealer 25 min.Lacquer 5 min. 45 min.
Table 4.2. Increase in average operation times
Operation Times:Operation Time (min.)
Load 0.55Spray Stain 0.88Spray Washcoat 0.88Sand Washcoat 2.20Spray Wiping Stain 1.60Wipe Wiping Stain 7.10Spray Sealer 0.88Sand Sealer 3.30Spray Lacquer 1.60
Information is also needed concerning the parameters of the distribution of
operation times since the simulation empowers the user with the benefit of stochastic
modeling. Table 4.3 shows a list of operation time parameters for a Triangular
distribution for each furniture article in the new suite.
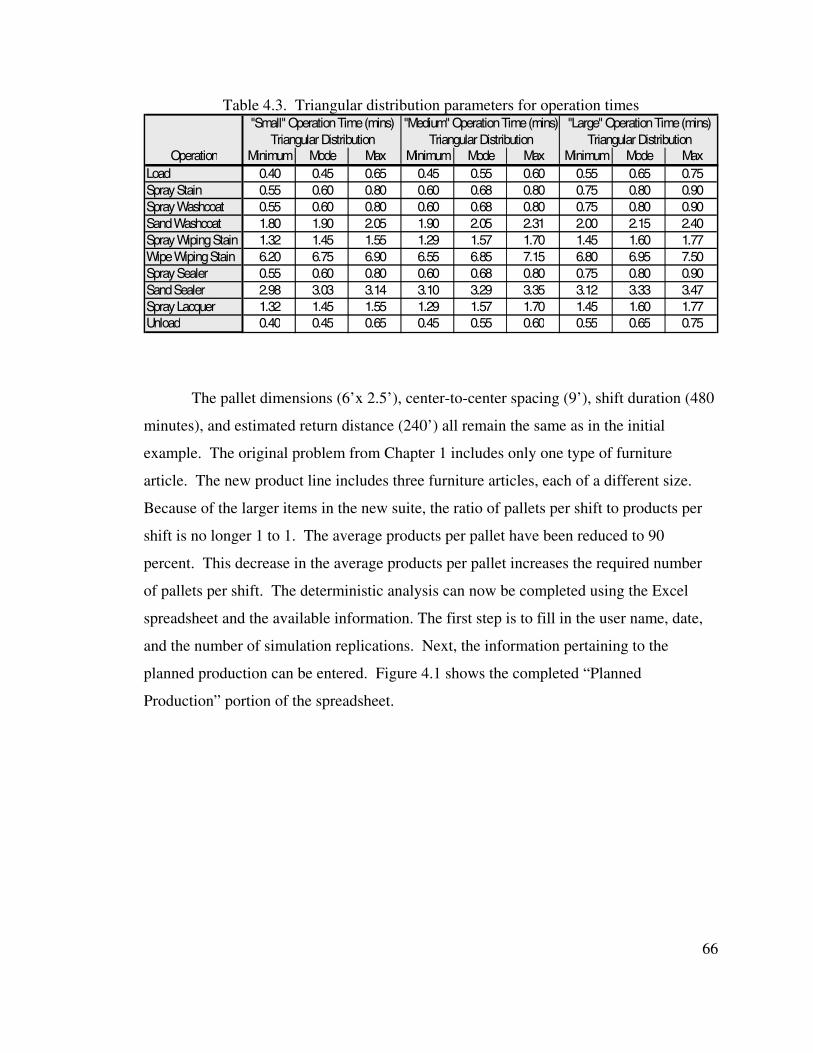
66
Table 4.3. Triangular distribution parameters for operation times
Operation Minimum Mode Max Minimum Mode Max Minimum Mode MaxLoad 0.40 0.45 0.65 0.45 0.55 0.60 0.55 0.65 0.75Spray Stain 0.55 0.60 0.80 0.60 0.68 0.80 0.75 0.80 0.90Spray Washcoat 0.55 0.60 0.80 0.60 0.68 0.80 0.75 0.80 0.90Sand Washcoat 1.80 1.90 2.05 1.90 2.05 2.31 2.00 2.15 2.40Spray Wiping Stain 1.32 1.45 1.55 1.29 1.57 1.70 1.45 1.60 1.77Wipe Wiping Stain 6.20 6.75 6.90 6.55 6.85 7.15 6.80 6.95 7.50Spray Sealer 0.55 0.60 0.80 0.60 0.68 0.80 0.75 0.80 0.90Sand Sealer 2.98 3.03 3.14 3.10 3.29 3.35 3.12 3.33 3.47Spray Lacquer 1.32 1.45 1.55 1.29 1.57 1.70 1.45 1.60 1.77Unload 0.40 0.45 0.65 0.45 0.55 0.60 0.55 0.65 0.75
"Small" Operation Time (mins) "Medium" Operation Time (mins) "Large" Operation Time (mins)Triangular Distribution Triangular Distribution Triangular Distribution
The pallet dimensions (6’x 2.5’), center-to-center spacing (9’), shift duration (480
minutes), and estimated return distance (240’) all remain the same as in the initial
example. The original problem from Chapter 1 includes only one type of furniture
article. The new product line includes three furniture articles, each of a different size.
Because of the larger items in the new suite, the ratio of pallets per shift to products per
shift is no longer 1 to 1. The average products per pallet have been reduced to 90
percent. This decrease in the average products per pallet increases the required number
of pallets per shift. The deterministic analysis can now be completed using the Excel
spreadsheet and the available information. The first step is to fill in the user name, date,
and the number of simulation replications. Next, the information pertaining to the
planned production can be entered. Figure 4.1 shows the completed “Planned
Production” portion of the spreadsheet.
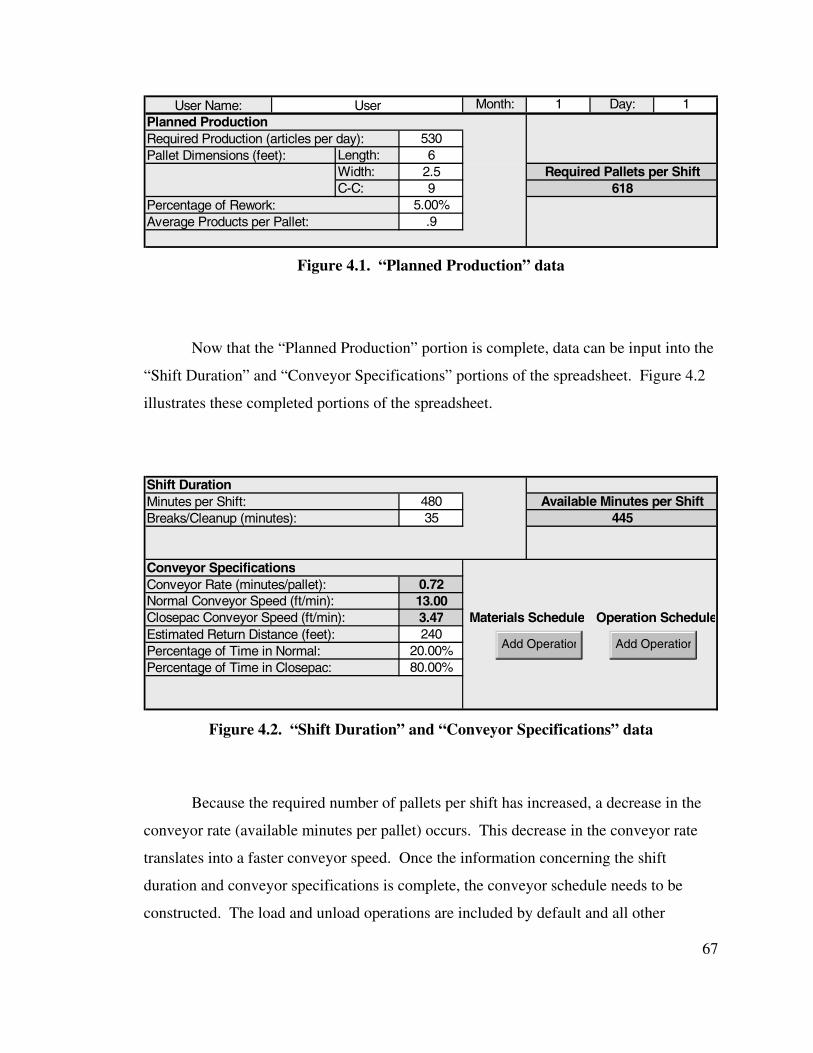
67
Month: 1 Day: 1Planned Production
530Length: 6Width: 2.5C-C: 9
5.00%.9
Required Pallets per Shift618
User Name: User
Required Production (articles per day):Pallet Dimensions (feet):
Percentage of Rework:Average Products per Pallet:
Figure 4.1. “Planned Production” data
Now that the “Planned Production” portion is complete, data can be input into the
“Shift Duration” and “Conveyor Specifications” portions of the spreadsheet. Figure 4.2
illustrates these completed portions of the spreadsheet.
Shift Duration48035
Conveyor Specifications0.72
Normal Conveyor Speed (ft/min): 13.00Closepac Conveyor Speed (ft/min): 3.47
24020.00%80.00%
Available Minutes per ShiftMinutes per Shift:Breaks/Cleanup (minutes): 445
Conveyor Rate (minutes/pallet):
Percentage of Time in Closepac:
Materials Schedule Operation ScheduleEstimated Return Distance (feet):Percentage of Time in Normal: Add OperationAdd Operation Add OperationAdd Operation
Figure 4.2. “Shift Duration” and “Conveyor Specifications” data
Because the required number of pallets per shift has increased, a decrease in the
conveyor rate (available minutes per pallet) occurs. This decrease in the conveyor rate
translates into a faster conveyor speed. Once the information concerning the shift
duration and conveyor specifications is complete, the conveyor schedule needs to be
constructed. The load and unload operations are included by default and all other
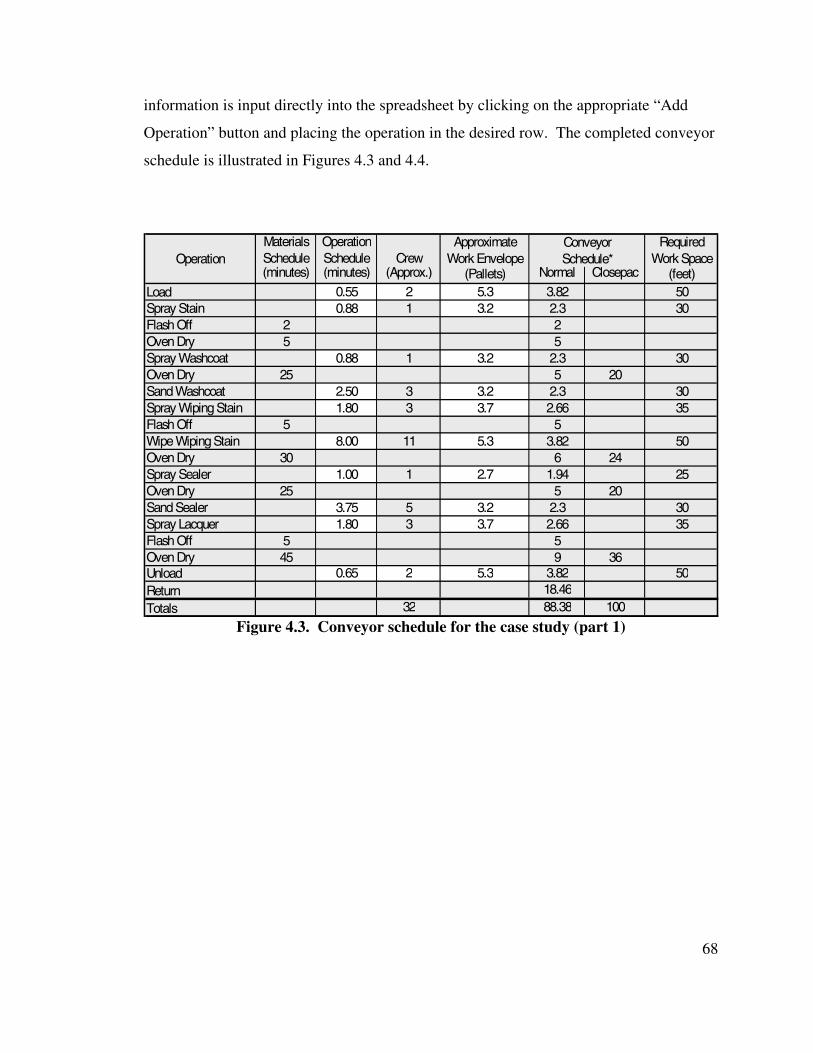
68
information is input directly into the spreadsheet by clicking on the appropriate “Add
Operation” button and placing the operation in the desired row. The completed conveyor
schedule is illustrated in Figures 4.3 and 4.4.
Materials Operation Approximate RequiredSchedule Schedule Crew Work Envelope Work Space(minutes) (minutes) (Approx.) (Pallets) Normal Closepac (feet)
0.55 2 5.3 3.82 50Spray Stain 0.88 1 3.2 2.3 30Flash Off 2 2Oven Dry 5 5Spray Washcoat 0.88 1 3.2 2.3 30Oven Dry 25 5 20Sand Washcoat 2.50 3 3.2 2.3 30Spray Wiping Stain 1.80 3 3.7 2.66 35Flash Off 5 5Wipe Wiping Stain 8.00 11 5.3 3.82 50Oven Dry 30 6 24Spray Sealer 1.00 1 2.7 1.94 25Oven Dry 25 5 20Sand Sealer 3.75 5 3.2 2.3 30Spray Lacquer 1.80 3 3.7 2.66 35Flash Off 5 5Oven Dry 45 9 36
0.65 2 5.3 3.82 5018.46
32 88.38 100Totals
Load
UnloadReturn
Operation Schedule*Conveyor
Figure 4.3. Conveyor schedule for the case study (part 1)
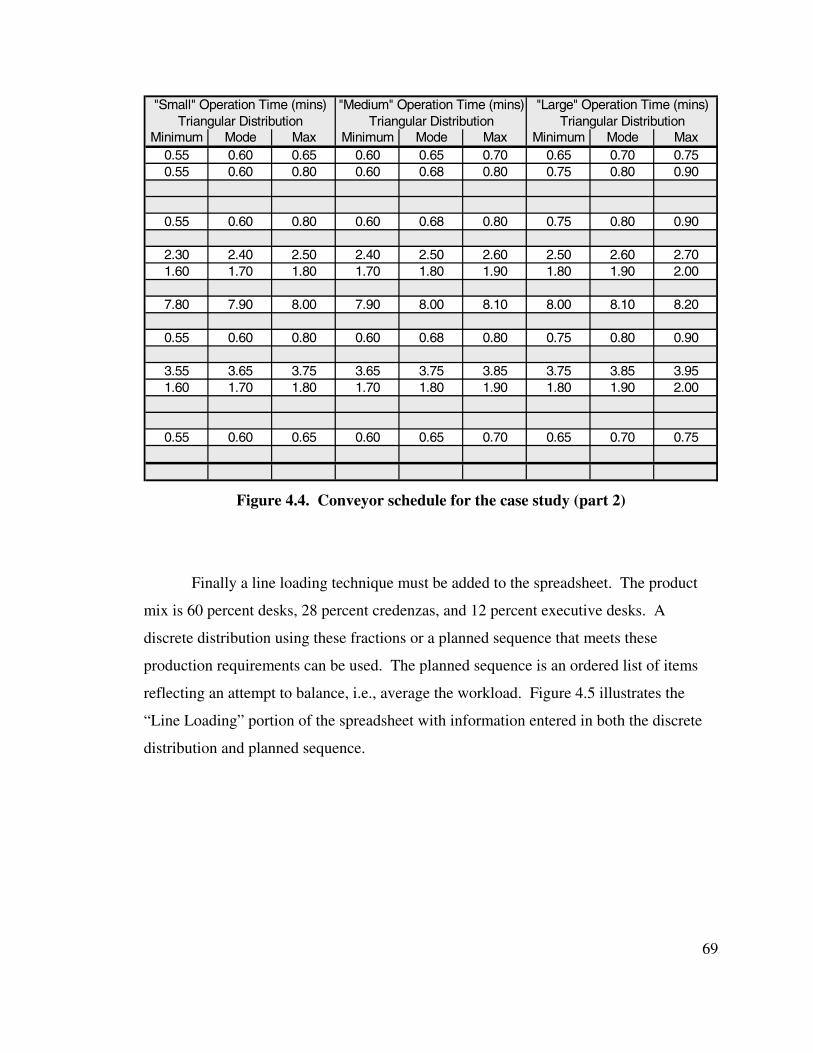
69
Minimum Mode Max Minimum Mode Max Minimum Mode Max0.55 0.60 0.65 0.60 0.65 0.70 0.65 0.70 0.750.55 0.60 0.80 0.60 0.68 0.80 0.75 0.80 0.90
0.55 0.60 0.80 0.60 0.68 0.80 0.75 0.80 0.90
2.30 2.40 2.50 2.40 2.50 2.60 2.50 2.60 2.701.60 1.70 1.80 1.70 1.80 1.90 1.80 1.90 2.00
7.80 7.90 8.00 7.90 8.00 8.10 8.00 8.10 8.20
0.55 0.60 0.80 0.60 0.68 0.80 0.75 0.80 0.90
3.55 3.65 3.75 3.65 3.75 3.85 3.75 3.85 3.951.60 1.70 1.80 1.70 1.80 1.90 1.80 1.90 2.00
0.55 0.60 0.65 0.60 0.65 0.70 0.65 0.70 0.75
"Small" Operation Time (mins) "Medium" Operation Time (mins) "Large" Operation Time (mins)Triangular Distribution Triangular Distribution Triangular Distribution
Figure 4.4. Conveyor schedule for the case study (part 2)
Finally a line loading technique must be added to the spreadsheet. The product
mix is 60 percent desks, 28 percent credenzas, and 12 percent executive desks. A
discrete distribution using these fractions or a planned sequence that meets these
production requirements can be used. The planned sequence is an ordered list of items
reflecting an attempt to balance, i.e., average the workload. Figure 4.5 illustrates the
“Line Loading” portion of the spreadsheet with information entered in both the discrete
distribution and planned sequence.
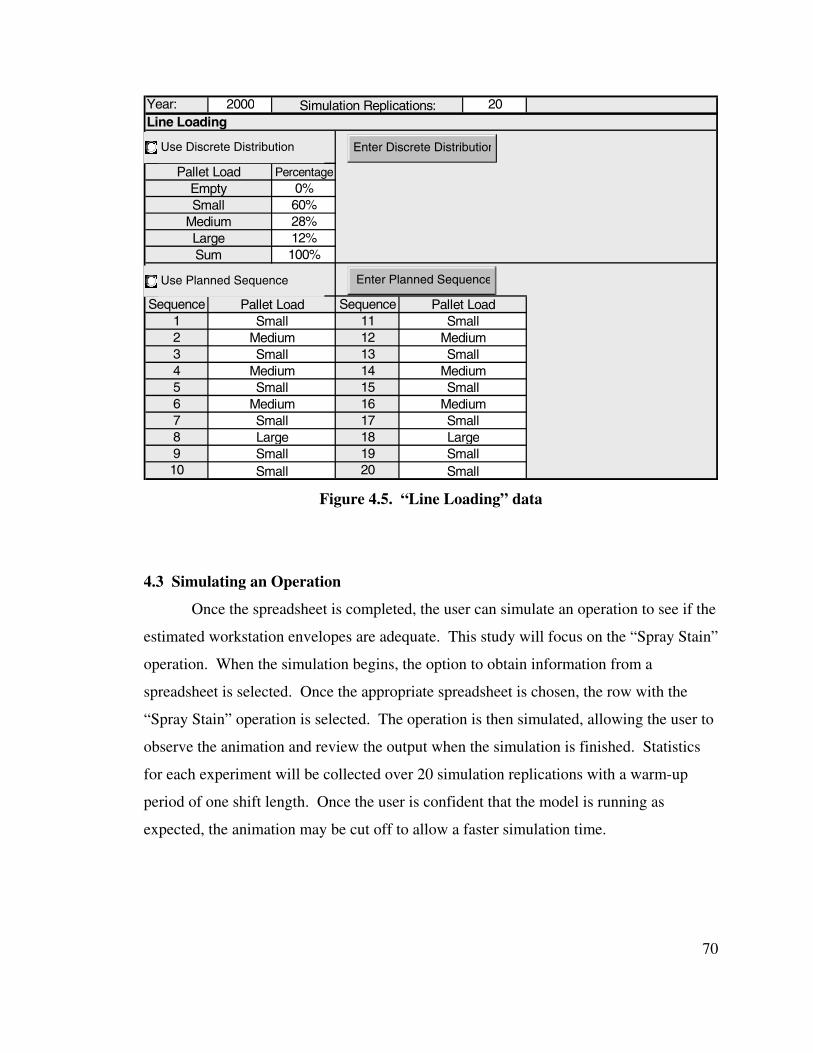
70
Year: 2000 20Line Loading
0
Percentage0%60%28%12%100%
Sequence Sequence1 112 123 134 145 156 167 178 189 1910 20
SmallMediumLargeSum
Pallet Load Pallet LoadSmall Small
Medium MediumSmall Small
Medium MediumSmall Small
Medium MediumSmall Small
Small Small
Simulation Replications:
Pallet LoadEmpty
Large LargeSmall Small
Enter Discrete Distribution
Enter Planned Sequence
Use Discrete Distribution
Use Planned Sequence
Figure 4.5. “Line Loading” data
4.3 Simulating an Operation
Once the spreadsheet is completed, the user can simulate an operation to see if the
estimated workstation envelopes are adequate. This study will focus on the “Spray Stain”
operation. When the simulation begins, the option to obtain information from a
spreadsheet is selected. Once the appropriate spreadsheet is chosen, the row with the
“Spray Stain” operation is selected. The operation is then simulated, allowing the user to
observe the animation and review the output when the simulation is finished. Statistics
for each experiment will be collected over 20 simulation replications with a warm-up
period of one shift length. Once the user is confident that the model is running as
expected, the animation may be cut off to allow a faster simulation time.
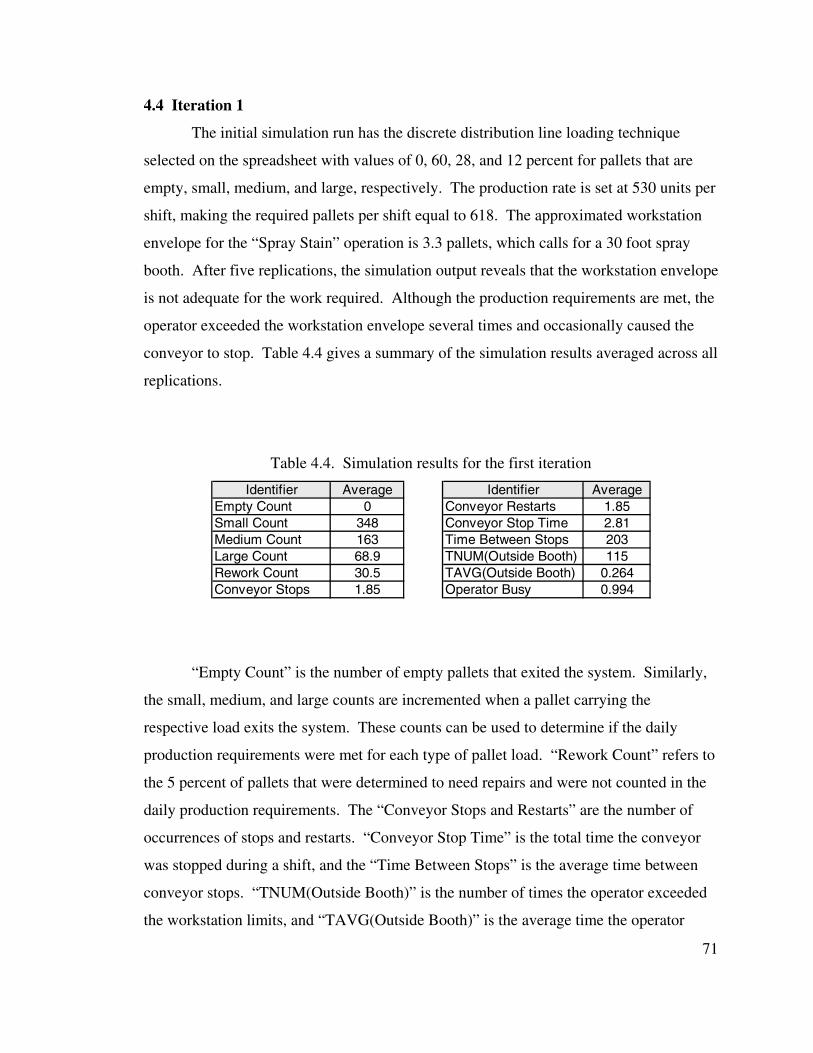
71
4.4 Iteration 1
The initial simulation run has the discrete distribution line loading technique
selected on the spreadsheet with values of 0, 60, 28, and 12 percent for pallets that are
empty, small, medium, and large, respectively. The production rate is set at 530 units per
shift, making the required pallets per shift equal to 618. The approximated workstation
envelope for the “Spray Stain” operation is 3.3 pallets, which calls for a 30 foot spray
booth. After five replications, the simulation output reveals that the workstation envelope
is not adequate for the work required. Although the production requirements are met, the
operator exceeded the workstation envelope several times and occasionally caused the
conveyor to stop. Table 4.4 gives a summary of the simulation results averaged across all
replications.
Table 4.4. Simulation results for the first iteration
Identifier Average Identifier AverageEmpty Count 0 Conveyor Restarts 1.85Small Count 348 Conveyor Stop Time 2.81Medium Count 163 Time Between Stops 203Large Count 68.9 TNUM(Outside Booth) 115Rework Count 30.5 TAVG(Outside Booth) 0.264Conveyor Stops 1.85 Operator Busy 0.994
“Empty Count” is the number of empty pallets that exited the system. Similarly,
the small, medium, and large counts are incremented when a pallet carrying the
respective load exits the system. These counts can be used to determine if the daily
production requirements were met for each type of pallet load. “Rework Count” refers to
the 5 percent of pallets that were determined to need repairs and were not counted in the
daily production requirements. The “Conveyor Stops and Restarts” are the number of
occurrences of stops and restarts. “Conveyor Stop Time” is the total time the conveyor
was stopped during a shift, and the “Time Between Stops” is the average time between
conveyor stops. “TNUM(Outside Booth)” is the number of times the operator exceeded
the workstation limits, and “TAVG(Outside Booth)” is the average time the operator
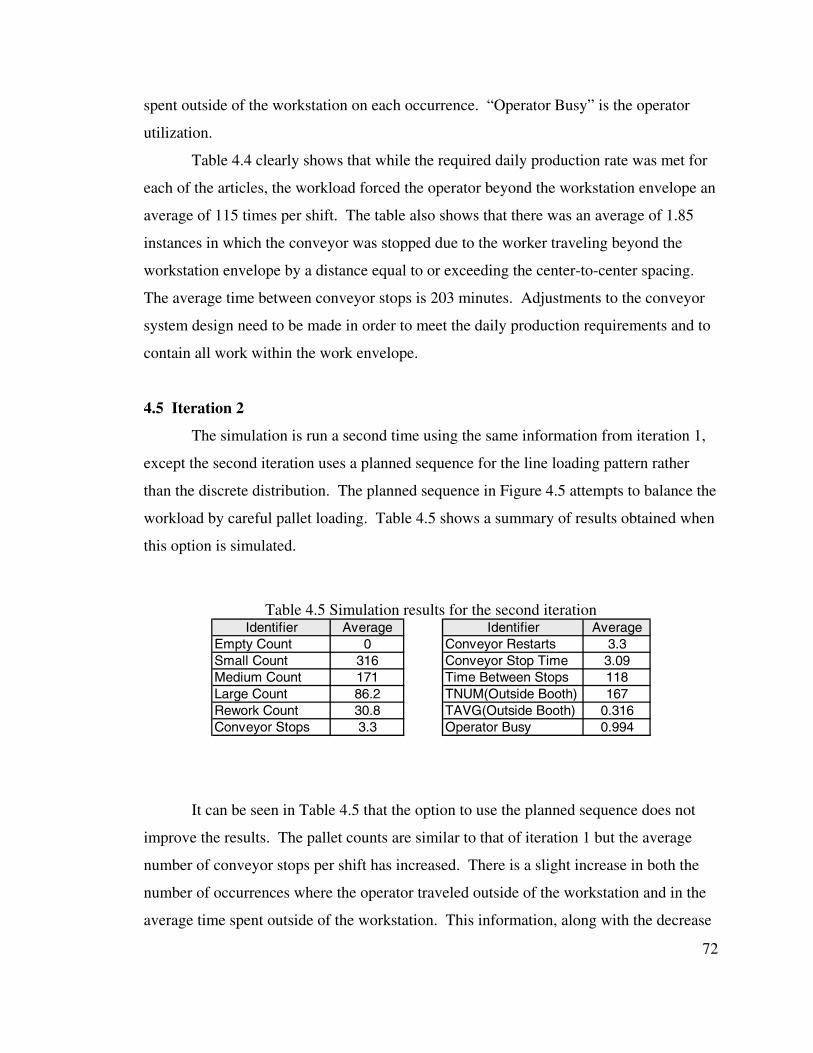
72
spent outside of the workstation on each occurrence. “Operator Busy” is the operator
utilization.
Table 4.4 clearly shows that while the required daily production rate was met for
each of the articles, the workload forced the operator beyond the workstation envelope an
average of 115 times per shift. The table also shows that there was an average of 1.85
instances in which the conveyor was stopped due to the worker traveling beyond the
workstation envelope by a distance equal to or exceeding the center-to-center spacing.
The average time between conveyor stops is 203 minutes. Adjustments to the conveyor
system design need to be made in order to meet the daily production requirements and to
contain all work within the work envelope.
4.5 Iteration 2
The simulation is run a second time using the same information from iteration 1,
except the second iteration uses a planned sequence for the line loading pattern rather
than the discrete distribution. The planned sequence in Figure 4.5 attempts to balance the
workload by careful pallet loading. Table 4.5 shows a summary of results obtained when
this option is simulated.
Table 4.5 Simulation results for the second iterationIdentifier Average Identifier Average
Empty Count 0 Conveyor Restarts 3.3Small Count 316 Conveyor Stop Time 3.09Medium Count 171 Time Between Stops 118Large Count 86.2 TNUM(Outside Booth) 167Rework Count 30.8 TAVG(Outside Booth) 0.316Conveyor Stops 3.3 Operator Busy 0.994
It can be seen in Table 4.5 that the option to use the planned sequence does not
improve the results. The pallet counts are similar to that of iteration 1 but the average
number of conveyor stops per shift has increased. There is a slight increase in both the
number of occurrences where the operator traveled outside of the workstation and in the
average time spent outside of the workstation. This information, along with the decrease
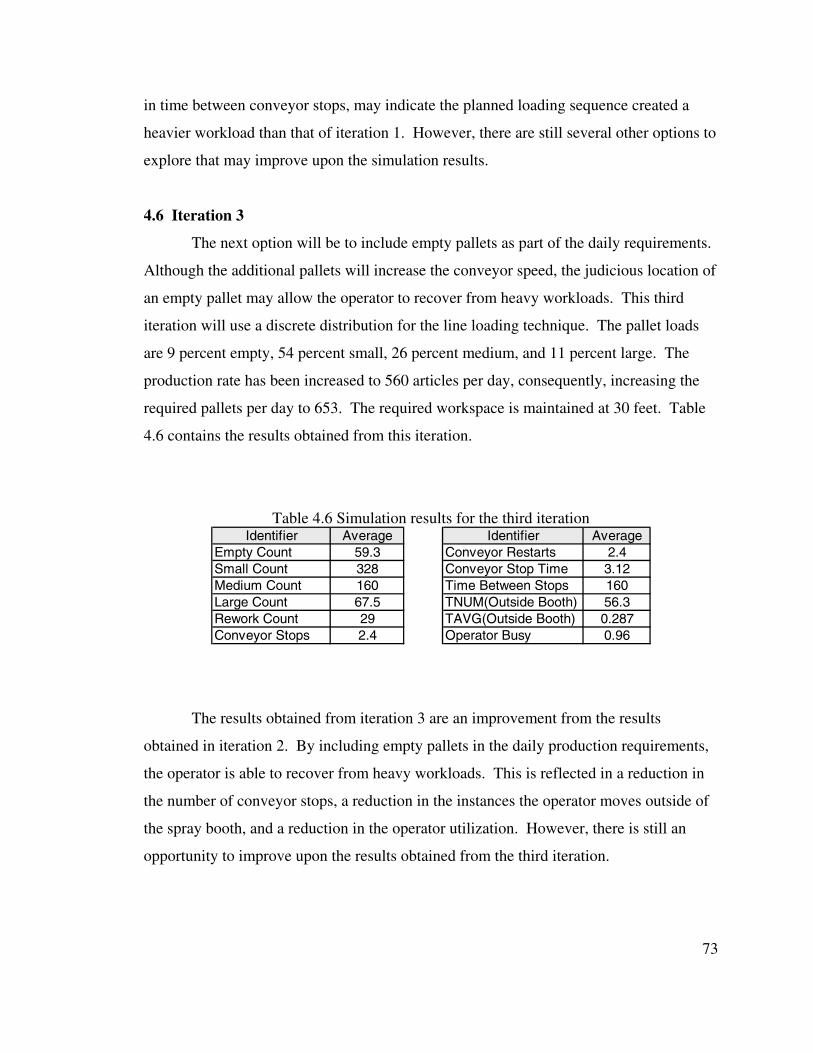
73
in time between conveyor stops, may indicate the planned loading sequence created a
heavier workload than that of iteration 1. However, there are still several other options to
explore that may improve upon the simulation results.
4.6 Iteration 3
The next option will be to include empty pallets as part of the daily requirements.
Although the additional pallets will increase the conveyor speed, the judicious location of
an empty pallet may allow the operator to recover from heavy workloads. This third
iteration will use a discrete distribution for the line loading technique. The pallet loads
are 9 percent empty, 54 percent small, 26 percent medium, and 11 percent large. The
production rate has been increased to 560 articles per day, consequently, increasing the
required pallets per day to 653. The required workspace is maintained at 30 feet. Table
4.6 contains the results obtained from this iteration.
Table 4.6 Simulation results for the third iterationIdentifier Average Identifier Average
Empty Count 59.3 Conveyor Restarts 2.4Small Count 328 Conveyor Stop Time 3.12Medium Count 160 Time Between Stops 160Large Count 67.5 TNUM(Outside Booth) 56.3Rework Count 29 TAVG(Outside Booth) 0.287Conveyor Stops 2.4 Operator Busy 0.96
The results obtained from iteration 3 are an improvement from the results
obtained in iteration 2. By including empty pallets in the daily production requirements,
the operator is able to recover from heavy workloads. This is reflected in a reduction in
the number of conveyor stops, a reduction in the instances the operator moves outside of
the spray booth, and a reduction in the operator utilization. However, there is still an
opportunity to improve upon the results obtained from the third iteration.
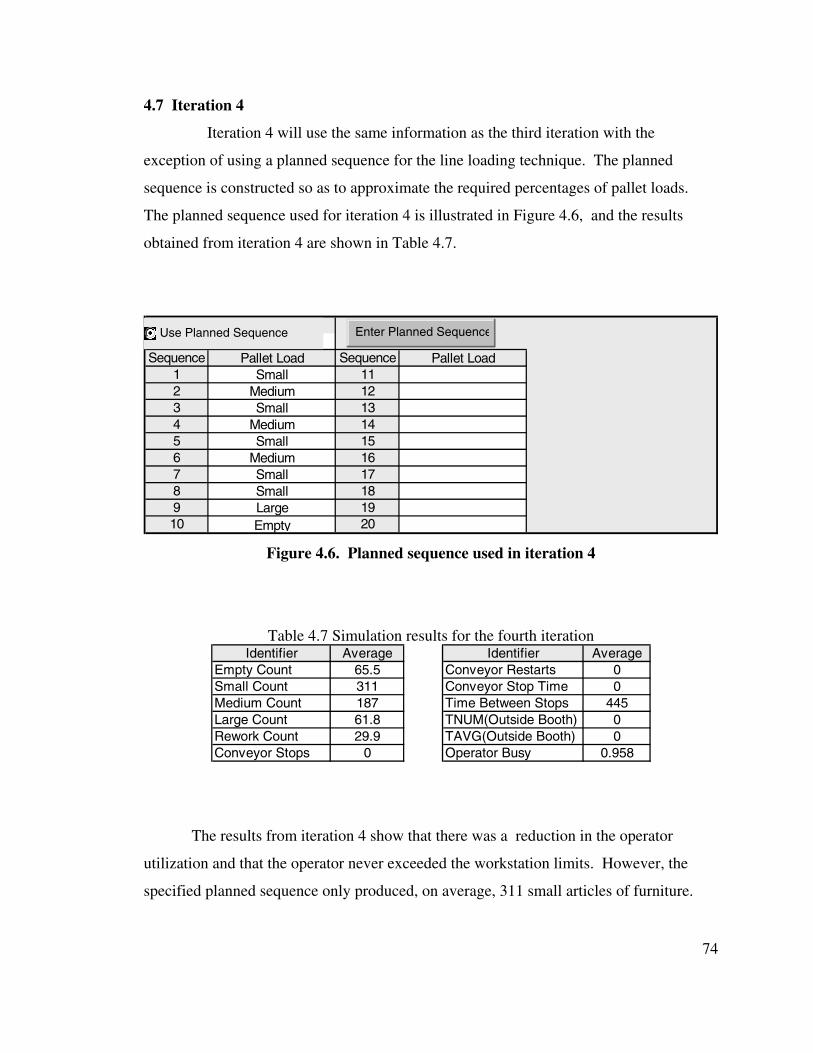
74
4.7 Iteration 4
Iteration 4 will use the same information as the third iteration with the
exception of using a planned sequence for the line loading technique. The planned
sequence is constructed so as to approximate the required percentages of pallet loads.
The planned sequence used for iteration 4 is illustrated in Figure 4.6, and the results
obtained from iteration 4 are shown in Table 4.7.
Sequence Sequence1 112 123 134 145 156 167 178 189 1910 20
Pallet Load Pallet LoadSmall
MediumSmall
MediumSmall
MediumSmall
Empty
SmallLarge
Enter Planned SequenceUse Planned Sequence
Figure 4.6. Planned sequence used in iteration 4
Table 4.7 Simulation results for the fourth iterationIdentifier Average Identifier Average
Empty Count 65.5 Conveyor Restarts 0Small Count 311 Conveyor Stop Time 0Medium Count 187 Time Between Stops 445Large Count 61.8 TNUM(Outside Booth) 0Rework Count 29.9 TAVG(Outside Booth) 0Conveyor Stops 0 Operator Busy 0.958
The results from iteration 4 show that there was a reduction in the operator
utilization and that the operator never exceeded the workstation limits. However, the
specified planned sequence only produced, on average, 311 small articles of furniture.
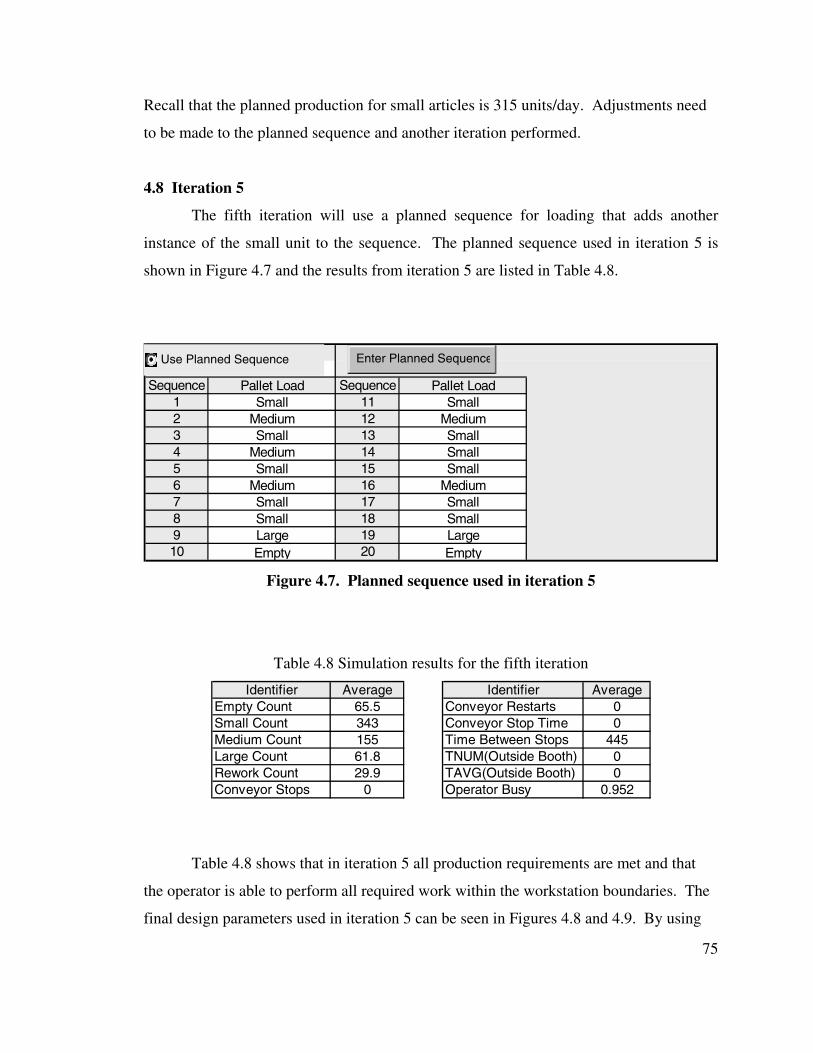
75
Recall that the planned production for small articles is 315 units/day. Adjustments need
to be made to the planned sequence and another iteration performed.
4.8 Iteration 5
The fifth iteration will use a planned sequence for loading that adds another
instance of the small unit to the sequence. The planned sequence used in iteration 5 is
shown in Figure 4.7 and the results from iteration 5 are listed in Table 4.8.
Sequence Sequence1 112 123 134 145 156 167 178 189 1910 20Empty Empty
Small SmallLarge Large
Medium MediumSmall Small
Medium SmallSmall Small
Medium MediumSmall Small
Pallet Load Pallet LoadSmall Small
Enter Planned SequenceUse Planned Sequence
Figure 4.7. Planned sequence used in iteration 5
Table 4.8 Simulation results for the fifth iteration
Identifier Average Identifier AverageEmpty Count 65.5 Conveyor Restarts 0Small Count 343 Conveyor Stop Time 0Medium Count 155 Time Between Stops 445Large Count 61.8 TNUM(Outside Booth) 0Rework Count 29.9 TAVG(Outside Booth) 0Conveyor Stops 0 Operator Busy 0.952
Table 4.8 shows that in iteration 5 all production requirements are met and that
the operator is able to perform all required work within the workstation boundaries. The
final design parameters used in iteration 5 can be seen in Figures 4.8 and 4.9. By using
76
an iterative process, a suitable solution has been found for the spray stain operation.
However, there are many other operations to be evaluated. Since it is desirable for the
finishing system to be balanced, the user must determine if the simulation parameters for
this spraying operation will work with the other manual operations in the finishing
system.
The user may also wish to plan for a worst-case scenario in which heavy
workloads are simulated. This worst-case planning may help ensure that the finishing
system is capable of handling future changes to the product line. While it is desirable for
workstation sizes to be kept to a minimum to reduce floor space and energy requirements,
it is imperative from a health and safety standpoint that spraying be confined to the booth.
In some cases, the initial workstation size may have been underestimated and the only
option may be to increase the workstation size. The iterative procedure demonstrated in
this case study provides a way to evaluate the initial workstation sizes generated by the
deterministic analysis. The simulation can be employed in an iterative process to
evaluate system design changes until all workstation sizes are adequate.

77
Month: 1 Day: 1Planned Production
560Length: 6Width: 2.5C-C: 9
5.00%.9
Shift Duration48035
Conveyor Specifications0.68
Normal Conveyor Speed (ft/min): 13.24Closepac Conveyor Speed (ft/min): 3.68
24020.00%80.00%
Materials Operation Approximate RequiredSchedule Schedule Crew Work Envelope Work Space(minutes) (minutes) (Approx.) (Pallets) Normal Closepac (feet)
0.55 2 5.6 3.81 50Spray Stain 0.88 1 3.3 2.24 30Flash Off 2 2Oven Dry 5 5Spray Washcoat 0.88 1 3.3 2.24 30Oven Dry 25 5 20Sand Washcoat 2.50 4 3.3 2.34 30Spray Wiping Stain 1.80 3 3.9 2.65 35Flash Off 5 5Wipe Wiping Stain 8.00 12 5.6 3.81 50Oven Dry 30 6 24Spray Sealer 1.00 1 2.8 1.9 25Oven Dry 25 5 20Sand Sealer 3.75 6 3.3 2.34 30Spray Lacquer 1.80 3 3.9 2.65 35Flash Off 5 5Oven Dry 45 9 36
0.65 2 5.6 3.81 5018.13 240
35 87.92 100
User Name: User
Production Rate (articles per day):Pallet Dimensions (feet):
Required Pallets per Shift653
Percentage of Rework:Average Products per Pallet:
Minutes per Shift: Available Minutes per ShiftBreaks/Cleanup (minutes): 445
Conveyor Rate (minutes/pallet):
Materials Schedule Operation ScheduleEstimated Return Distance (feet):Percentage of Time in Normal:Percentage of Time in Closepac:
ConveyorOperation Schedule*
Totals
Load
UnloadReturn
Add OperatioAdd Operatio
Figure 4.8. Final design parameters (part 1)
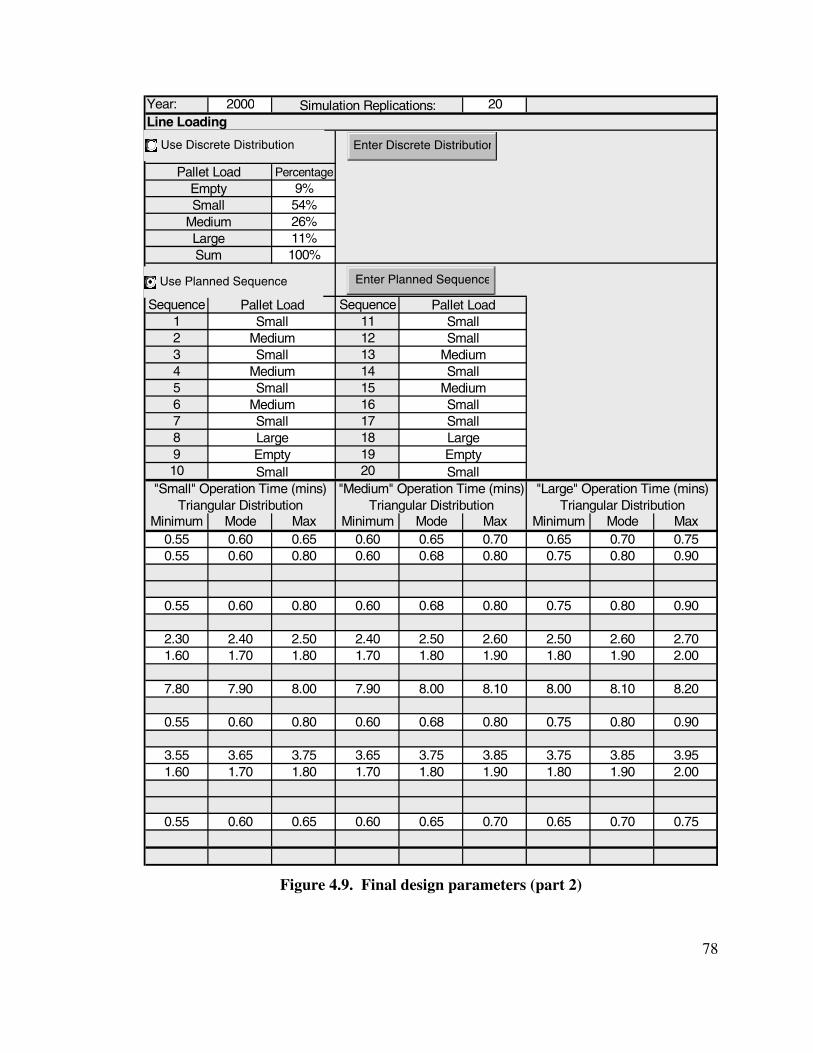
78
Year: 2000 20Line Loading
1
Percentage9%54%26%11%100%
Sequence Sequence1 112 123 134 145 156 167 178 189 1910 20
Minimum Mode Max Minimum Mode Max Minimum Mode Max0.55 0.60 0.65 0.60 0.65 0.70 0.65 0.70 0.750.55 0.60 0.80 0.60 0.68 0.80 0.75 0.80 0.90
0.55 0.60 0.80 0.60 0.68 0.80 0.75 0.80 0.90
2.30 2.40 2.50 2.40 2.50 2.60 2.50 2.60 2.701.60 1.70 1.80 1.70 1.80 1.90 1.80 1.90 2.00
7.80 7.90 8.00 7.90 8.00 8.10 8.00 8.10 8.20
0.55 0.60 0.80 0.60 0.68 0.80 0.75 0.80 0.90
3.55 3.65 3.75 3.65 3.75 3.85 3.75 3.85 3.951.60 1.70 1.80 1.70 1.80 1.90 1.80 1.90 2.00
0.55 0.60 0.65 0.60 0.65 0.70 0.65 0.70 0.75
Simulation Replications:
Pallet LoadEmptySmall
MediumLargeSum
Pallet Load Pallet LoadSmall Small
Medium SmallSmall Medium
Medium SmallSmall Medium
Medium SmallSmall Small
Small Small
Large LargeEmpty Empty
"Large" Operation Time (mins)Triangular Distribution Triangular Distribution Triangular Distribution
"Small" Operation Time (mins) "Medium" Operation Time (mins)
Enter Discrete Distribution
Enter Planned Sequence
Use Discrete Distribution
Use Planned Sequence
Figure 4.9. Final design parameters (part 2)
79
4.9 Case Conclusion
The spreadsheet-to-simulation interface acts as a tool that allows a user to easily
experiment with several options to determine the best solution for a particular finishing
system. The user has the ability to simulate several scenarios by manipulating input
parameters on the spreadsheet such as line loading techniques, required daily production,
and workstation sizes. This ability to quickly change input parameters allows an iterative
effort to obtain an optimal solution. An obvious advantage of the spreadsheet is that it
allows users with limited simulation experience to easily simulate and evaluate the
finishing system.
The steps used in this case study closely follow the steps in the proposed
methodology for finishing system capacity planning from Chapter 2. First a materials
schedule was developed and an average operation time for each finishing operation was
determined. The pallet size (6’ x 2.5’), the center-to-center spacing (9’), and the minutes
per shift (480) were obtained from the example in Chapter 1. Because of the large
products added to this case study, the average product per pallet was determined to be
0.9. The required products per shift were determined to be 315 traditional desks/day, 150
credenzas/day, and 65 executive desks/day, requiring a production rate of 530
products/shift.
This information was entered into the spreadsheet to translate products/shift into
pallets/shift, calculate conveyor speed, and shift duration. The operation time
information was used by the spreadsheet to calculate operation requirements such as the
required number of workers, the estimated work envelope (in pallets), the required
conveyor time, and the length of the required work area.
Stochastic operation times and their parameters for a triangular distribution were
determined for each operation. The simulation was then run using these stochastic times
in an effort to determine more accurate results for finishing system parameters. While
this case study only found a solution for the spray stain operation, the concept of
determining adequate finishing design parameters was illustrated. Each operation should
be simulated and the final design parameters for the finishing system should be
determined. The user will then obtain an estimate for the conveyor return distance, the

80
total conveyor length, the total cycle time, and the total number of pallets required.
Realize that these numbers are estimates and their final values cannot be determined until
a layout of the finishing system has been completed.
81
Conclusions and Recommendations
5.1 Conclusions
This thesis offers a methodology for finishing system capacity planning. The
following is a list of steps for the proposed methodology for finishing system capacity
planning taken from Chapter 2.
� Develop or obtain materials schedule� Determine operation times (deterministic, average times)
- Loading/Unloading- Spraying- Sanding- Wiping
� Product analysis- Determine pallet size- Determine the number of items/pallet
� Determine center-to-center spacing� Define shift duration� Translate products/shift into pallets/shift� Calculate conveyor speed� Calculate operation requirements
- Determine the number of workers required- Estimate a work envelope (in pallets)- Determine required conveyor time- Determine the length of required work area
� Determine stochastic operation times- Determine the type of distribution- Determine the distribution parameters
� Incorporate stochastic data into the simulation template to achieve more accurateresults- Include distributions for operation times- Include variations in line loading- Verify work areas are adequate
� Create a layout of the proposed system� Determine conveyor return distance� Determine total conveyor length
- Determine normal conveyor length- Determine closepac conveyor length
� Determine required number of pallets- Determine the number of pallets required in normal- Determine the number of pallets required in closepac- Calculate total cycle time
82
A tool has been designed to assist in the implementation of this methodology
consisting of an Excel/VBA interface and an Arena simulation model. The interface and
simulation model combine to provide a flexible mechanism for analyzing the required
capacity of finishing operations. The furniture industry could benefit from the many
advantages of computer simulation; however, many management staff personnel possess
little or no knowledge of simulation modeling. The simple interface connected to the
simulation model allows those persons with no prior experience in simulation to evaluate
a finishing system quickly and accurately. This tool can be used in an iterative fashion to
determine overall finishing system parameters and to accurately determine the required
number and size of each workstation in the proposed system.
The Excel interface provides a categorized template that allows users to easily
input finishing operation parameters. The template format is such that the users enter
information for both a rough-cut deterministic analysis and a more detailed stochastic
analysis. The required information is clearly specified and can be used to drive the
simulation once all information has been entered.
The stochastic simulation obtains relevant information from the spreadsheet and is
used to simulate one instance of a single finishing operation. Output from the simulation
can be evaluated to determine possible improvement opportunities. Changes to the
finishing system parameters can be made on the spreadsheet and the simulation re-run
using the new information. This iterative process allows a user to accurately determine
design parameters for a workstation and, ultimately, the entire finishing system. The
final design parameters obtained from the modeling tool provide useful insight to the
setup of a finishing system conveyor. However, the final design parameters will remain
uncertain until the layout of the finishing system is complete because of the many factors
to consider when planning a finishing system.
5.2 Recommendations for Future Work
The ultimate goal of this work is to create a simulation of an entire finishing
system that is easily modeled and can be driven from information contained in an Excel
83
template. The current simulation is somewhat limited in that it looks only at a single
workstation. A simulation of an entire finishing system is more desirable since most
industrial finishing systems involve multi-step processes. Possible future work may
include creating templates that allow for easy modeling of a complex finishing system.
The logic of the single workstation could be used as a building block in the
creation of an entire finishing system. Other building blocks constructed with similar
logic could be created for operations such as oven dry, flash off, and workstations that
involve multiple workers. Each of the separate building blocks could then be used as
components in the construction of a simulation model of a complete finishing system.
One of the most challenging and potentially beneficial candidates for further
research is the modeling of multiple employees in a workstation. Currently, the
simulation is limited to evaluating workstations with only a single operator. Because
there are many real-world occurrences of multiple employees in finishing line
workstations, it is important to address this issue. The validity of a finishing system
simulation model would increase greatly if an adequate solution were to be found for this
problem.
There exist several challenges to face when attempting to solve the problem of
multiple workers in a workstation. The first is the inclusion of conveyor stops in the
model. The logic required for conveyor stops with multiple employees in a workstation
may become very complex. A workstation such as a spray booth does not allow worker
overlap. Therefore, if one employee stops the conveyor, the remaining employees must
be made aware that the conveyor has been stopped. Each employee would continue to
work while the conveyor is stopped, giving them a chance to catch up with the workload.
Another challenge is the timing of restarting the conveyor. The conveyor could
be started when the employee who stopped the conveyor reaches the starting point of his
or her work envelope, or the conveyor may not restart until each employee has reached
the starting point of their work envelopes. In either case, the employee who starts the
conveyor must alert the rest of the employees of the restart.
A solution for a simulation of a multiple employee workstation could be used
along with the single employee workstation simulation, introduced in this thesis, to build

84
a model of an entire finishing system. The furniture industry could utilize such a
simulation to simultaneously design and evaluate all operations in a finishing system.
Simulation technology provides a method for a more accurate analysis of a proposed
system, and the furniture industry could realize the economic benefits from these
improved methods of capacity planning.
85
List of References
Adams, Larry and John Iwanski. (2000). “U.S. Economy Pushes Wood ProductsIndustry Onward and Upward,” Wood and Wood Products, Vance Publishing,Lincolnshire, IL, January, pp. 49-52.
Anonymous. (1997a). “Simulation optimizes system for Harley,” Modern MaterialsHandling, Cahners Business Information, A Division of Reed Elsevier, Inc., January 1,p. 2. http://www.manufacturing.net/magazine/mmh/archives/
Anonymous. (1997b). “Simulation optimizes JIT system design,” Modern MaterialsHandling, Cahners Business Information, A Division of Reed Elsevier, Inc.,September 1, p. 1. http://www.manufacturing.net/magazine/mmh/archives/
Culbreth, C. T. (2000) Furniture Manufacturing Systems Design Draft. North CarolinaState University. Raleigh, NC.
Feare, Tom. (1996a). “Simulating materials handling systems,” Modern MaterialsHandling, Cahners Business Information, A Division of Reed Elsevier, Inc., March 1,p. 1. http://www.manufacturing.net/magazine/mmh/archives/
Feare, Tom. (1996b). “Simulating materials handling systems,” Modern MaterialsHandling. p. 1.
Field, Karen. (1997a). “Data quality can make or break a simulation,” Modern MaterialsHandling, Cahners Business Information, A Division of Reed Elsevier, Inc., January 1,p. 1. http://www.manufacturing.net/magazine/mmh/archives/
Field, Karen. (1997b). “Data quality can make or break a simulation,” Modern MaterialsHandling. p. 3.
Graehl, David. (1992). Insights Into Carrier Control: A Simulation of a Power and FreeConveyor Through an Automotive Paint Shop for the Proceedings of the1992 WinterSimulation Conference. p. 1.
Henriksen, James and Thomas Schriber. (1986). Simplified Approaches to ModelingAccumulating and Non-accumulating Conveyor Systems for the Proceedings of the 1986Winter Simulation Conference. p. 1.
Kelton, David, Randall Sadowski and Deborah Sadowski. (1998a). Simulation withArena. McGraw-Hill Companies, Boston, MA, p. 129.
Kelton, David, Randall Sadowski and Deborah Sadowski. (1998b). Simulation withArena. p. 129.
86
Kelton, David, Randall Sadowski and Deborah Sadowski. (1998c). Simulation withArena. p. 419.
Laughrey, Ronald. (1995). A Micro Saint Model of Conveyor Management Strategies forthe Proceedings of the 1995 Winter Simulation Conference. p. 1.
McCluckie, Don. (1996a). “Designing a Conveyor for Finishing,” Products Finisihing,Gardner Publications, Inc., March 1, p. 1. http://www.pfonline.com/articles/
McCluckie, Don. (1996b). “Designing a Conveyor for Finishing,” Products Finisihing.p. 2.
Prak, Anco and Thomas Myers. (1981a). Furniture Manufacturing Processes.Department of Industrial Engineering, NCSU, Raleigh, NC, p. XII-5.
Prak, Anco and Thomas Myers. (1981b). Furniture Manufacturing Processes. p. XII-6.
Prak, Anco and Thomas Myers. (1981c). Furniture Manufacturing Processes. p. XIII-1.
Prak, Anco and Thomas Myers. (1981d). Furniture Manufacturing Processes. p. XIII-14.
Stauffer, J. L. (1993a). Finishing Systems Design and Implementation. Society ofManufacturing Engineers. Dearborn, MI, p. 311.
Stauffer, J. L. (1993b). Finishing Systems Design and Implementation. p. 311.
Stauffer, J. L. (1993c). Finishing Systems Design and Implementation. pp. 5-6.
Stauffer, J. L. (1993d). Finishing Systems Design and Implementation. p. 172.
U.S. Department of Commerce, U.S. Census Bureau. (1999a). Upholstered HouseholdFurniture Manufacturing. 1997 Economic Census, issued October 1999, p. 7.http://www.census.gov:80/prod/ec97/97m3371b.pdf
U.S. Department of Commerce, U.S. Census Bureau. (1999b). NonupholsteredHousehold Furniture Manufacturing. 1997 Economic Census, issued October 1999, p. 7.http://www.census.gov:80/prod/ec97/97m3371c.pdf
U.S. Department of Commerce, U.S. Census Bureau. (1999c). Wood Office FurnitureManufacturing. 1997 Economic Census, issued October 1999, p. 7.http://www.census.gov:80/prod/ec97/97m3372a.pdf

87
Appendix A
SIMAN Model File
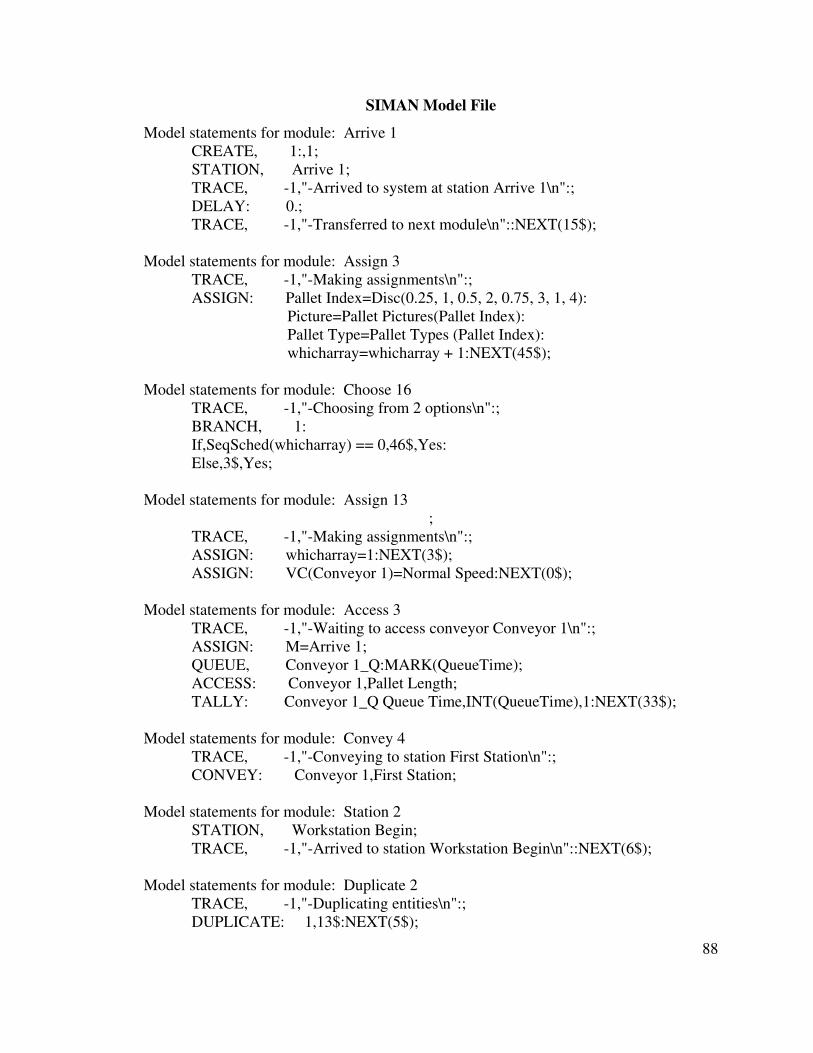
88
SIMAN Model File
Model statements for module: Arrive 1CREATE, 1:,1;STATION, Arrive 1;TRACE, -1,"-Arrived to system at station Arrive 1\n":;DELAY: 0.;TRACE, -1,"-Transferred to next module\n"::NEXT(15$);
Model statements for module: Assign 3TRACE, -1,"-Making assignments\n":;ASSIGN: Pallet Index=Disc(0.25, 1, 0.5, 2, 0.75, 3, 1, 4):
Picture=Pallet Pictures(Pallet Index):Pallet Type=Pallet Types (Pallet Index):whicharray=whicharray + 1:NEXT(45$);
Model statements for module: Choose 16TRACE, -1,"-Choosing from 2 options\n":;BRANCH, 1:If,SeqSched(whicharray) == 0,46$,Yes:Else,3$,Yes;
Model statements for module: Assign 13;
TRACE, -1,"-Making assignments\n":;ASSIGN: whicharray=1:NEXT(3$);ASSIGN: VC(Conveyor 1)=Normal Speed:NEXT(0$);
Model statements for module: Access 3TRACE, -1,"-Waiting to access conveyor Conveyor 1\n":;ASSIGN: M=Arrive 1;QUEUE, Conveyor 1_Q:MARK(QueueTime);ACCESS: Conveyor 1,Pallet Length;TALLY: Conveyor 1_Q Queue Time,INT(QueueTime),1:NEXT(33$);
Model statements for module: Convey 4TRACE, -1,"-Conveying to station First Station\n":;CONVEY: Conveyor 1,First Station;
Model statements for module: Station 2STATION, Workstation Begin;TRACE, -1,"-Arrived to station Workstation Begin\n"::NEXT(6$);
Model statements for module: Duplicate 2 TRACE, -1,"-Duplicating entities\n":;
DUPLICATE: 1,13$:NEXT(5$);
89
Model statements for module: Convey 2TRACE, -1,"-Conveying to station End Outside\n":;CONVEY: Conveyor 1,End Outside;
Model statements for module: Assign 2TRACE, -1,"-Making assignments\n":;ASSIGN: Enter Workstation=TNOW:
Operation Time=OperDistributions(Pallet Index): Operation Distance=AINT(Operation Time*Normal Speed + 1):
Picture=Default:NEXT(12$);ASSIGN: VT(Operator)=Normal Speed:NEXT(44$);
Model statements for module: Choose 14TRACE, -1,"-Choosing from 2 options\n":;BRANCH, 1:
If,Pallet Type == 1,9$,Yes:Else,27$,Yes;
DISPOSE;QUEUE, RequestOperatorQueue;REQUEST, 1,Obtaining1:Operator,200,Link(1, AINT((TNOW-EnterWorkstation)*Normal Speed)+1):NEXT(42$);
Model statements for module: Assign 11TRACE, -1,"-Making assignments\n":;ASSIGN: Past Workstation=(((TNOW - Enter Workstation)*Normal Speed))
+ Operation Distance:NEXT(39$);
Model statements for module: Choose 13TRACE, -1,"-Choosing from 3 options\n":;BRANCH, 1:
If,Past Workstation > Workstation Length .and. Past Workstation <=(Workstation Length + Center),
40$,Yes: If,Past Workstation > (Workstation Length + Center),43$,Yes:
Else,41$,Yes;
Model statements for module: Tally 7TRACE, -1,"-Updating Tally Outside Booth \n":;TALLY: Outside Booth,
((((TNOW - Enter Workstation)*Normal Speed)+Operation Distance) -Workstation Length)/Normal Speed,1:NEXT(38$);
TRANSPORT: Operator,Operator End,VT(Operator), Link(1, ((TNOW - Enter Workstation)* Normal Speed) + Operation
Distance);
90
TRANSPORT: Operator,Conveyor End,VT(Operator),Link(1,(WorkstationLength + 9));TRANSPORT: Operator,Operator End,VT(Operator),
Link(1, ((TNOW - Enter Workstation)* Normal Speed) + OperationDistance);
STATION, Operator End;FREE: Operator:NEXT(9$);
Model statements for module: Conveyor 1Conveyor 1_Acc ACCESS: Conveyor 1,1;DELAY: 0.0:NEXT(__ActionLabel);Conveyor 1_Exit EXIT: Conveyor 1:NEXT(__ActionLabel);
Model statements for module: Transporter 1CREATE, 1,0.0;ASSIGN: Operator_N=Operator_N+1:
NS=Operator_N;WAIT: -999;BRANCH, 1:
If,LT(Operator,NS)<>Int1,159$,Yes:Else,219$,Yes;
ALLOCATE, 1:Operator(NS);MOVE: ,FIRSTX(INTX(Int1));FREE::NEXT(220$);Operator_Req1 REQUEST, 1:Operator(SDS):NEXT(__ActionLabel);Operator_Req2 REQUEST, 1:Operator(SDS):NEXT(__ActionLabel);Operator_Free FREE: Operator;SIGNAL: -999:NEXT(__ActionLabel);
Model statements for module: Station 3STATION, Conveyor End;TRACE, -1,"-Arrived to station Conveyor End\n"::NEXT(16$);
Model statements for module: Stop 1TRACE, -1,"-Stopping conveyor Conveyor 1\n":;STOP: Conveyor 1:NEXT(29$);
Model statements for module: Count 3TRACE, -1,"-Updating counter Stops \n":;COUNT: Stops,1:NEXT(17$);
Model statements for module: Delay 2TRACE, -1,
"-Delaying for time (Past Workstation-(((TNOW - Enter Workstation)*NormalSpeed)))/Normal Speed\n":;
91
DELAY: (Past Workstation-(((TNOW - Enter Workstation)*NormalSpeed)))/Normal Speed:NEXT(21$);
Model statements for module: Assign 5TRACE, -1,"-Making assignments\n":;ASSIGN: OperatorNextLocation=Workstation Length:NEXT(18$);
Model statements for module: Choose 6TRACE, -1,"-Choosing from 2 options\n":;BRANCH, 1: If,OperatorNextLocation > 0,20$,Yes:
Else,23$,Yes;MOVE: Operator,Link(1,OperatorNextLocation),200:NEXT(32$);
Model statements for module: Choose 7TRACE, -1,"-Choosing from 2 options\n":;BRANCH, 1: If,NQ(RequestOperatorQueue) == 0,37$,Yes:
Else,30$,Yes;
Model statements for module: Delay 8TRACE, -1,"-Delaying for time Operation Distance/Normal Speed\n":;DELAY: Operation Distance/Normal Speed:NEXT(22$);
Model statements for module: Assign 6TRACE, -1,"-Making assignments\n":;ASSIGN: OperatorNextLocation=OperatorNextLocation-Center:NEXT(18$);REMOVE: 1,RequestOperatorQueue,37$;DISPOSE;MOVE: Operator,Link(1,1),200:NEXT(28$);
Model statements for module: Count 1TRACE, -1,"-Updating counter ReStarts \n":;COUNT: ReStarts,1:NEXT(24$);
Model statements for module: Tally 10
TRACE, -1,"-Updating Tally ConveyorStopTime \n":;TALLY: ConveyorStopTime,TNOW - Stop Time,1:NEXT(24$);
Model statements for module: Start 1TRACE, -1,"-Starting conveyor Conveyor 1\n":;START: Conveyor 1,Normal Speed:NEXT(25$);
Model statements for module: Free 1
92
TRACE, -1,"-Freeing transporter Operator(1)\n":;FREE: Operator(1);SIGNAL: -999:NEXT(26$);
Model statements for module: Dispose 1TRACE, -1,"-Disposing entity\n":;DISPOSE;
Model statements for module: Station 4STATION, First Station;TRACE, -1,"-Arrived to station First Station\n"::NEXT(14$);
Model statements for module: Duplicate 3TRACE, -1,"-Duplicating entities\n":;DUPLICATE: 1,15$:NEXT(2$);
Model statements for module: Convey 3TRACE, -1,"-Conveying to station Workstation Begin\n":;CONVEY: Conveyor 1,Workstation Begin;
Model statements for module: Station 5STATION, End Outside;TRACE, -1,"-Arrived to station End Outside\n"::NEXT(36$);
Model statements for module: Convey 5TRACE, -1,"-Conveying to station Depart 1\n":;CONVEY: Conveyor 1,Depart 1;
Model statements for module: Station 6STATION, Depart 1;TRACE, -1,"-Arrived to station Depart 1\n"::NEXT(48$);
Model statements for module: Choose 17TRACE, -1,"-Choosing from 2 options\n":;BRANCH, 1:
If,Pallet Type == 1,49$,Yes: Else,48$,Yes;
Model statements for module: Count 4TRACE, -1,"-Updating counter Pallets(Pallet Index) \n":;COUNT: Pallets(Pallet Index),1:NEXT(11$);
Model statements for module: Depart 1STATION, Depart;
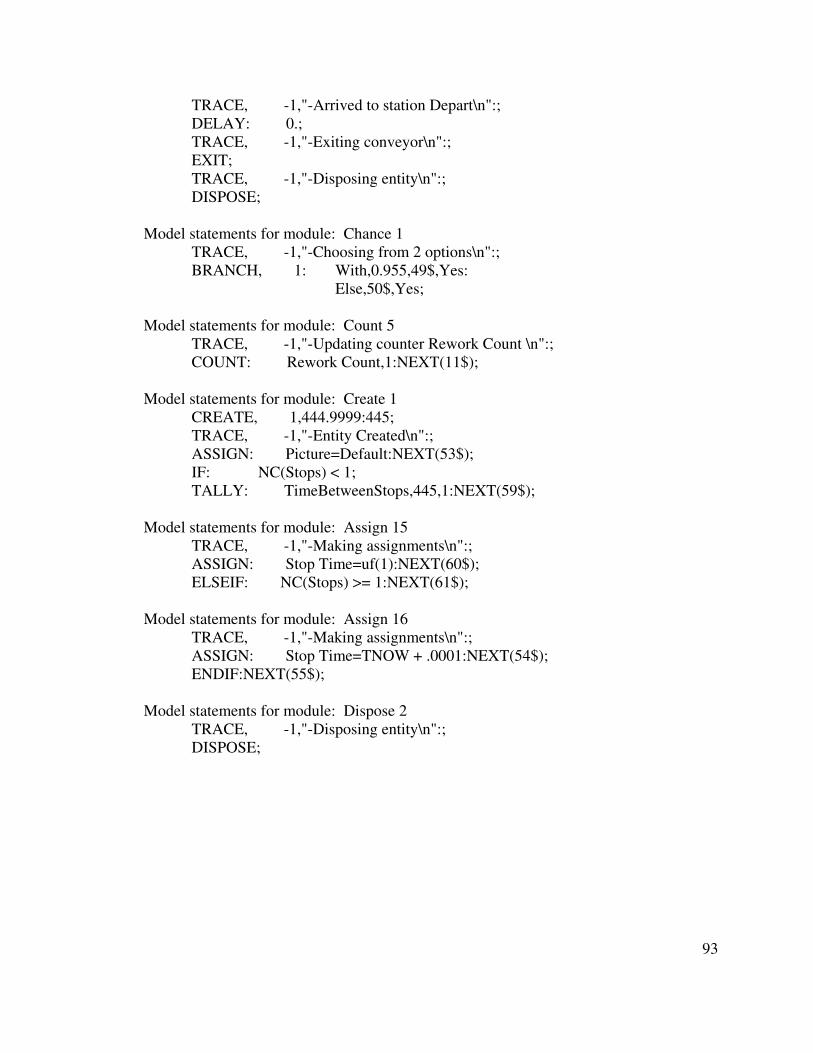
93
TRACE, -1,"-Arrived to station Depart\n":;DELAY: 0.;TRACE, -1,"-Exiting conveyor\n":;EXIT;TRACE, -1,"-Disposing entity\n":;DISPOSE;
Model statements for module: Chance 1TRACE, -1,"-Choosing from 2 options\n":;BRANCH, 1: With,0.955,49$,Yes:
Else,50$,Yes;
Model statements for module: Count 5TRACE, -1,"-Updating counter Rework Count \n":;COUNT: Rework Count,1:NEXT(11$);
Model statements for module: Create 1CREATE, 1,444.9999:445;TRACE, -1,"-Entity Created\n":;ASSIGN: Picture=Default:NEXT(53$);IF: NC(Stops) < 1;TALLY: TimeBetweenStops,445,1:NEXT(59$);
Model statements for module: Assign 15TRACE, -1,"-Making assignments\n":;ASSIGN: Stop Time=uf(1):NEXT(60$);ELSEIF: NC(Stops) >= 1:NEXT(61$);
Model statements for module: Assign 16TRACE, -1,"-Making assignments\n":;ASSIGN: Stop Time=TNOW + .0001:NEXT(54$);ENDIF:NEXT(55$);
Model statements for module: Dispose 2TRACE, -1,"-Disposing entity\n":;DISPOSE;

94
Appendix B
SIMAN Experiment File
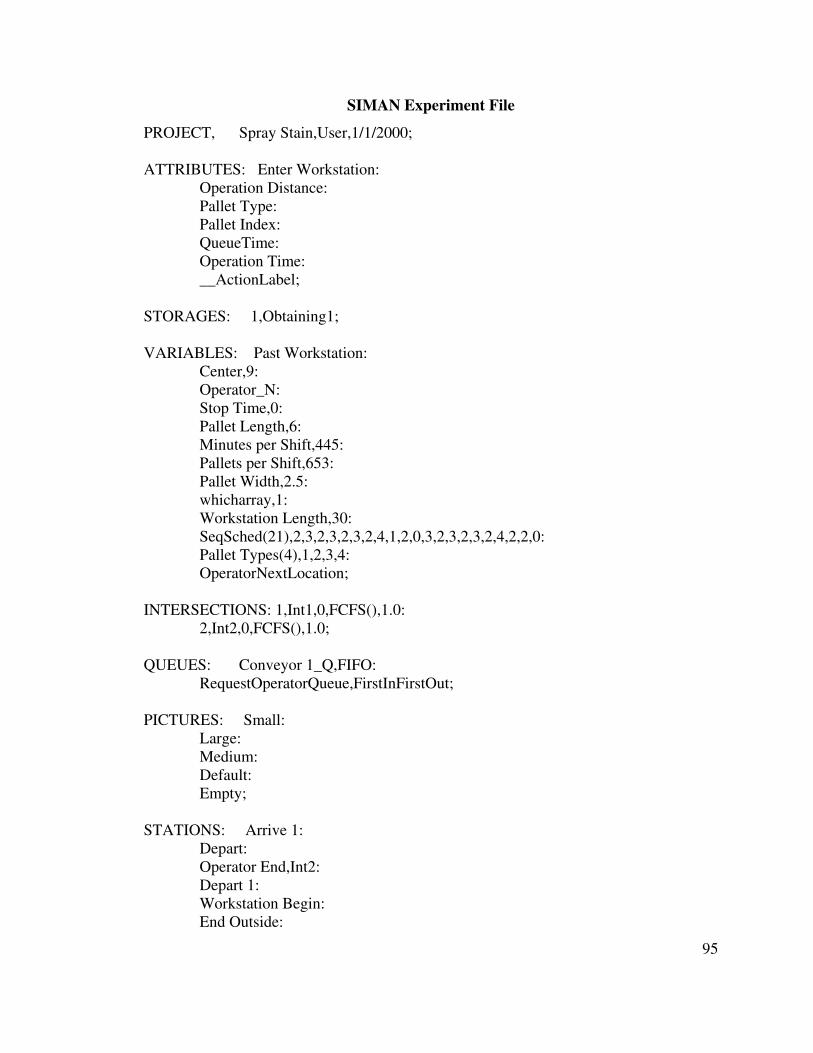
95
SIMAN Experiment File
PROJECT, Spray Stain,User,1/1/2000;
ATTRIBUTES: Enter Workstation: Operation Distance: Pallet Type: Pallet Index: QueueTime: Operation Time: __ActionLabel;
STORAGES: 1,Obtaining1;
VARIABLES: Past Workstation: Center,9: Operator_N: Stop Time,0: Pallet Length,6: Minutes per Shift,445: Pallets per Shift,653: Pallet Width,2.5: whicharray,1: Workstation Length,30: SeqSched(21),2,3,2,3,2,3,2,4,1,2,0,3,2,3,2,3,2,4,2,2,0: Pallet Types(4),1,2,3,4: OperatorNextLocation;
INTERSECTIONS: 1,Int1,0,FCFS(),1.0: 2,Int2,0,FCFS(),1.0;
QUEUES: Conveyor 1_Q,FIFO: RequestOperatorQueue,FirstInFirstOut;
PICTURES: Small: Large: Medium: Default: Empty;
STATIONS: Arrive 1: Depart: Operator End,Int2: Depart 1: Workstation Begin: End Outside:
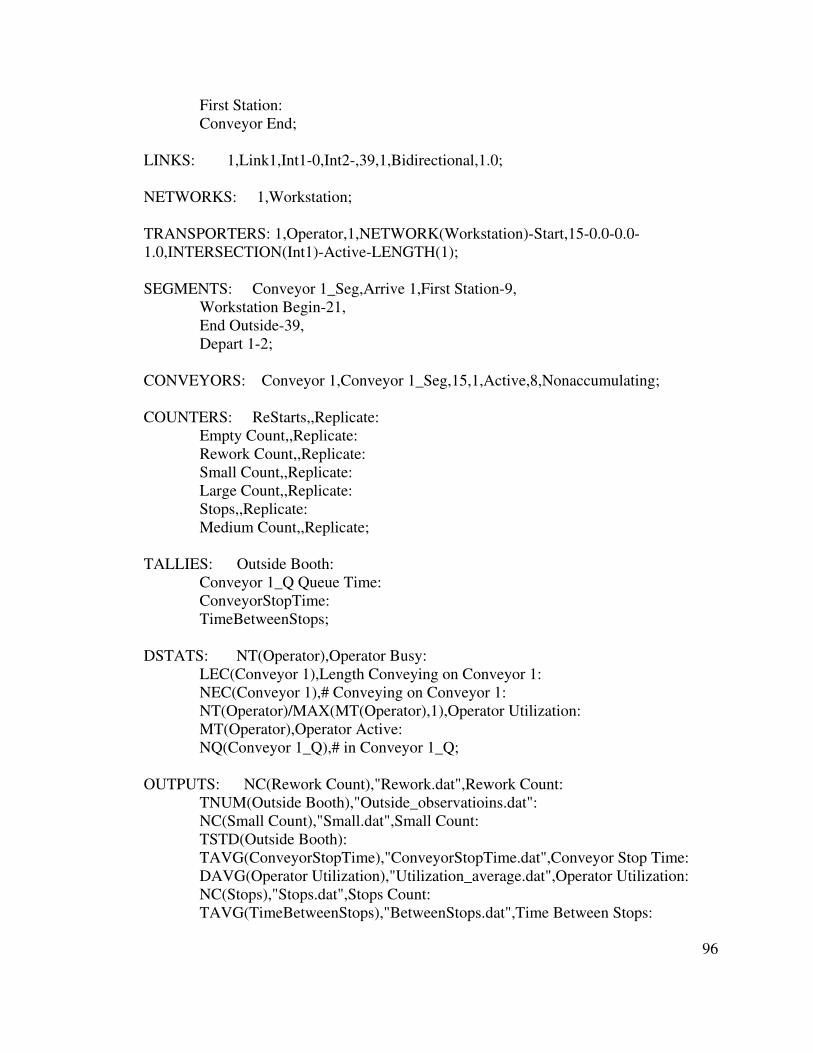
96
First Station: Conveyor End;
LINKS: 1,Link1,Int1-0,Int2-,39,1,Bidirectional,1.0;
NETWORKS: 1,Workstation;
TRANSPORTERS: 1,Operator,1,NETWORK(Workstation)-Start,15-0.0-0.0-1.0,INTERSECTION(Int1)-Active-LENGTH(1);
SEGMENTS: Conveyor 1_Seg,Arrive 1,First Station-9, Workstation Begin-21, End Outside-39, Depart 1-2;
CONVEYORS: Conveyor 1,Conveyor 1_Seg,15,1,Active,8,Nonaccumulating;
COUNTERS: ReStarts,,Replicate: Empty Count,,Replicate: Rework Count,,Replicate: Small Count,,Replicate: Large Count,,Replicate: Stops,,Replicate: Medium Count,,Replicate;
TALLIES: Outside Booth: Conveyor 1_Q Queue Time: ConveyorStopTime: TimeBetweenStops;
DSTATS: NT(Operator),Operator Busy: LEC(Conveyor 1),Length Conveying on Conveyor 1: NEC(Conveyor 1),# Conveying on Conveyor 1: NT(Operator)/MAX(MT(Operator),1),Operator Utilization: MT(Operator),Operator Active: NQ(Conveyor 1_Q),# in Conveyor 1_Q;
OUTPUTS: NC(Rework Count),"Rework.dat",Rework Count: TNUM(Outside Booth),"Outside_observatioins.dat": NC(Small Count),"Small.dat",Small Count: TSTD(Outside Booth): TAVG(ConveyorStopTime),"ConveyorStopTime.dat",Conveyor Stop Time: DAVG(Operator Utilization),"Utilization_average.dat",Operator Utilization: NC(Stops),"Stops.dat",Stops Count: TAVG(TimeBetweenStops),"BetweenStops.dat",Time Between Stops:
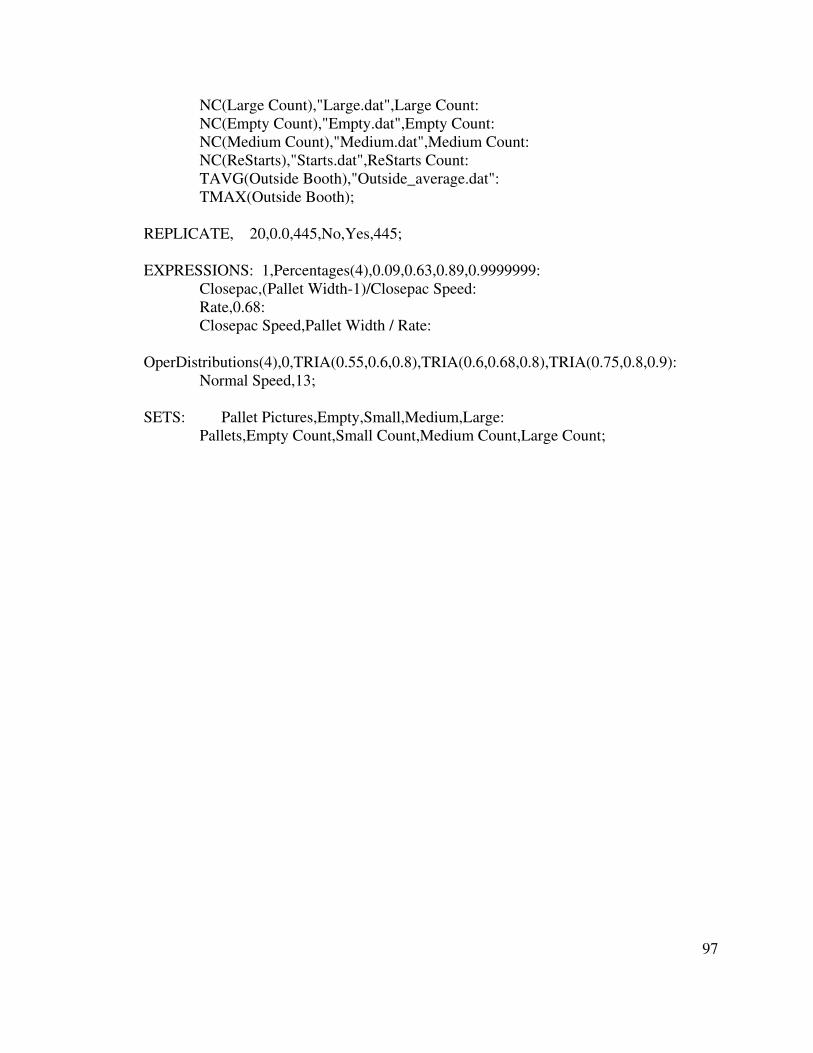
97
NC(Large Count),"Large.dat",Large Count: NC(Empty Count),"Empty.dat",Empty Count: NC(Medium Count),"Medium.dat",Medium Count: NC(ReStarts),"Starts.dat",ReStarts Count: TAVG(Outside Booth),"Outside_average.dat": TMAX(Outside Booth);
REPLICATE, 20,0.0,445,No,Yes,445;
EXPRESSIONS: 1,Percentages(4),0.09,0.63,0.89,0.9999999: Closepac,(Pallet Width-1)/Closepac Speed: Rate,0.68: Closepac Speed,Pallet Width / Rate:
OperDistributions(4),0,TRIA(0.55,0.6,0.8),TRIA(0.6,0.68,0.8),TRIA(0.75,0.8,0.9): Normal Speed,13;
SETS: Pallet Pictures,Empty,Small,Medium,Large: Pallets,Empty Count,Small Count,Medium Count,Large Count;

98
Appendix C
Arena VBA Code
99
Arena Simulation VBA Code
ThisDocument Code
Option Explicit
’Start Arena ModelPrivate Sub ModelLogic_RunBegin() Set ArenaModel = ThisDocument.Model i = ArenaModel.Modules.Find(smFindTag, "WorkstationSegment") Set mobj = ArenaModel.Modules(i) WL = mobj.Data("Length") - 9 With ArenaModel.NamedViews ArenaModel.ActiveView.ZoomView .Item(.Find(smFindName, "Animation")) End With ’Minimize Arena Model ArenaModel.Application.Show (smWindowStyleMinimize) ’Show Main Menu user form frmMainMenu.ShowEnd Sub
’Assign value Stop Time = Stop Time + Shift Duration to Assign ModulePrivate Function ModelLogic_UserFunction(ByVal entityID As Long, ByVal functionIDAs Long) As Double Dim stIndex As Long Dim st As Double stIndex = ThisDocument.Model.SIMAN.SymbolNumber("Stop Time") st = ThisDocument.Model.SIMAN.VariableValue(stIndex, 0, 0) ModelLogic_UserFunction = st + sdEnd Function
Module1 Code
Option ExplicitGlobal ArenaModel As Arena.ModelGlobal mobj As ModuleGlobal lobj As ModuleGlobal i As LongGlobal WL As DoubleGlobal sd As DoubleGlobal finishXL As Excel.ApplicationGlobal finishWB As Excel.WorkbookGlobal finishWS As Excel.WorksheetGlobal operationRange As rangeGlobal FName As VariantGlobal SmallArray(2) As Single
100
Global MedArray(2) As SingleGlobal LargeArray(2) As Single
frmMainMenu Code
Option Explicit’Dimension Local VariablesPublic currentInfo As IntegerPublic currentOperation As IntegerDim i As LongDim j As LongDim k As LongDim a As LongDim MyVariant As VariantDim sta1 As StationDim sta2 As StationDim sta3 As StationDim int1 As IntersectionDim int2 As IntersectionDim worksta As ShapeDim difference As Double ’existing length of conveyor in animation ’approximate 1 inch of screen is 500 units in animation spaceDim distanceToMove As Double ’how far second station moves
Private Sub UserForm_Initialize() Set ArenaModel = ThisDocument.Model i = ArenaModel.Modules.Find(smFindTag, "Variables") Set mobj = ArenaModel.Modules(i)End Sub
Private Sub cmdEndSim_Click() Me.Hide ArenaModel.PauseEnd Sub
Private Sub cmdInput_Click() ArenaModel.Application.Show smWindowStyleMinimize MsgBox "Use the following dialog to choose the appropriate Excel Finish Lineplanning spreadsheet." Set finishXL = CreateObject("Excel.Application") finishXL.Visible = False Do FName = finishXL.GetOpenFilename("Excel Files (*.xls), *.xls") Loop Until FName <> False Set finishWB = Workbooks.Open(Filename:=FName) Set finishWS = finishWB.Worksheets(1)
101
finishXL.Visible = True Do Set operationRange = Excel.Application.InputBox(Prompt:="Click on the rowwhose operation is being simulated.", Type:=8) ’Need an error check here for rows less than 27 ’If operationRange < $27:$27 Then ’Call MsgBox("Invalid Row. Try Again.", vbCritical, "Invalid Row") ’End If
’Assign minutes per shift as simulation length i = ArenaModel.Modules.Find(smFindTag, "Simulate") Set mobj = ArenaModel.Modules(i) mobj.Data("Title") = finishWS.Cells(operationRange.Row, 1)
’Assign value of Workstation Length + 9 to the Workstation Conveyor Segment i = ArenaModel.Modules.Find(smFindTag, "WorkstationSegment") Set mobj = ArenaModel.Modules(i) mobj.Data("Length") = (finishWS.Cells(operationRange.Row, 9) + 9)
’Assign value of Workstation Length + 9 to the Workstation Network Link i = ArenaModel.Modules.Find(smFindTag, "LINKS") Set mobj = ArenaModel.Modules(i) mobj.Data("Zones") = (finishWS.Cells(operationRange.Row, 9) + 9)
’Assign value of Workstation Length to the Assign module i = ArenaModel.Modules.Find(smFindTag, "Variables") Set mobj = ArenaModel.Modules(i) mobj.Data("Value(1,11)") = (finishWS.Cells(operationRange.Row, 9))
’create an animation of the workstation ’find the shapes and set the shapes reference j = ArenaModel.Shapes.Find(smFindTag, "Workstation") Set worksta = ArenaModel.Shapes.Item(j)
’need to make sure nothing is selected ArenaModel.ActiveView.Selection.DeselectAll
’now select station that the segment is attached to worksta.Selected = True difference = finishWS.Cells(operationRange.Row, 9) - WL If difference >= 0 Then worksta.Resize smHandleSouthEast, difference * 95, 0 Else worksta.Resize smHandleSouthEast, difference * 95, 0 End If
102
’cover bottom line of workstation box j = ArenaModel.Shapes.Find(smFindTag, "Workfill") Set worksta = ArenaModel.Shapes.Item(j)
’need to make sure nothing is selected ArenaModel.ActiveView.Selection.DeselectAll
’now select station that the segment is attached to worksta.Selected = True difference = finishWS.Cells(operationRange.Row, 9) - WL If difference >= 0 Then worksta.Resize smHandleSouthEast, difference * 95, 0 Else worksta.Resize smHandleSouthEast, difference * 95, 0 End If
’Set the animation length ’find the stations and set the station reference j = ArenaModel.Stations.Find(smFindTag, "WorkstationBegin") Set sta1 = ArenaModel.Stations.Item(j) j = ArenaModel.Stations.Find(smFindTag, "EndOutside") Set sta2 = ArenaModel.Stations.Item(j) j = ArenaModel.Stations.Find(smFindTag, "Depart") Set sta3 = ArenaModel.Stations.Item(j)
’need to make sure nothing is selected ArenaModel.ActiveView.Selection.DeselectAll
’now select station that the segment is attached to sta3.Shape.Selected = True difference = finishWS.Cells(operationRange.Row, 9) - WL If difference >= 0 Then ArenaModel.ActiveView.Selection.Move difference * 95, 0 Else ArenaModel.ActiveView.Selection.Move difference * 95, 0 End If
’need to make sure nothing is selected ArenaModel.ActiveView.Selection.DeselectAll
’now select station that the segment is attached to sta2.Shape.Selected = True difference = finishWS.Cells(operationRange.Row, 9) - WL If difference >= 0 Then
103
ArenaModel.ActiveView.Selection.Move difference * 95, 0 Else ArenaModel.ActiveView.Selection.Move difference * 95, 0 End If
’find the intersections and set the intersection reference j = ArenaModel.Intersections.Find(smFindTag, "Intersection1") Set int1 = ArenaModel.Intersections.Item(j) j = ArenaModel.Intersections.Find(smFindTag, "Intersection2") Set int2 = ArenaModel.Intersections.Item(j)
’need to make sure nothing is selected ArenaModel.ActiveView.Selection.DeselectAll
’now select the intersection that the network is attached to int2.Shape.Selected = True difference = finishWS.Cells(operationRange.Row, 9) - WL If difference >= 0 Then ArenaModel.ActiveView.Selection.Move difference * 95, 0 Else ArenaModel.ActiveView.Selection.Move difference * 95, 0 End If
’Assign values of Triangular Distribution from Excel into Arrays SmallArray(0) = finishWS.Cells(operationRange.Row, 10) SmallArray(1) = finishWS.Cells(operationRange.Row, 11) SmallArray(2) = finishWS.Cells(operationRange.Row, 12) MedArray(0) = finishWS.Cells(operationRange.Row, 13) MedArray(1) = finishWS.Cells(operationRange.Row, 14) MedArray(2) = finishWS.Cells(operationRange.Row, 15) LargeArray(0) = finishWS.Cells(operationRange.Row, 16) LargeArray(1) = finishWS.Cells(operationRange.Row, 17) LargeArray(2) = finishWS.Cells(operationRange.Row, 18)
Loop Until MsgBox("Is " + finishWS.Cells(operationRange.Row, 1) + " correct?",vbMsgBoxSetForeground + vbYesNo) = vbYes
’Assign values from Excel to Chance Module i = ArenaModel.Modules.Find(smFindTag, "Chance") Set mobj = ArenaModel.Modules(i) mobj.Data("Prob(1)") = 1 - finishWS.range("E7")
’Assign values from Excel to Expressions Module i = ArenaModel.Modules.Find(smFindTag, "Expressions") Set mobj = ArenaModel.Modules(i)
104
mobj.Data("Value(1, 1)") = finishWS.range("E16") mobj.Data("Value(1, 2)") = finishWS.range("E17") nor = mobj.Data("Value(1, 2)")
’Assign values from Excel to Simulate Module i = ArenaModel.Modules.Find(smFindTag, "Simulate") Set mobj = ArenaModel.Modules(i) mobj.Data("Length") = finishWS.range("G12") mobj.Data("Date1") = finishWS.range("G1") mobj.Data("Date2") = finishWS.range("I1") mobj.Data("Date3") = finishWS.range("K1") mobj.Data("NumReps") = finishWS.range("O1") mobj.Data("Analyst") = finishWS.range("C1") mobj.Data("Warmup") = finishWS.range("G12")
’Assign values from Excel to TALLY Block i = ArenaModel.Modules.Find(smFindTag, "TALLY") Set mobj = ArenaModel.Modules(i) mobj.Data("Value") = finishWS.range("G12")
’Assign values from Excel to Create Module i = ArenaModel.Modules.Find(smFindTag, "Create") Set mobj = ArenaModel.Modules(i) mobj.Data("Offset") = finishWS.range("G12") - 0.0001 mobj.Data("Interval") = finishWS.range("G12")
’Assign shift duration value to global variable sd sd = finishWS.range("G12")
’Assign discrete distribution values from Excel to EXPRESSIONS Element If finishWS.range("J3") <> "1" Then i = ArenaModel.Modules.Find(smFindTag, "EXPRESSIONS1") Set mobj = ArenaModel.Modules(i) a = ArenaModel.Modules.Find(smFindTag, "Assign1") Set lobj = ArenaModel.Modules(a) lobj.Data("Value(1)") = MyVariant MyVariant = "Disc(" Dim done As Boolean, percentage As Single Dim whichcol As Variant, whichcell done = False: i = 1: k = 1: whichcol = "L" percentage = 0 While Not done whichcell = whichcol & (5 + k) percentage = percentage + finishWS.range(whichcell) If Trim(percentage) < "1" And k <= 4 Then
105
mobj.Data("Expression(" & Str(i) & ",1)") = percentage MyVariant = MyVariant & percentage & "," & Str(i) & ", " i = i + 1 k = k + 1 Else MyVariant = MyVariant & percentage & "," & Str(i) & ")" done = True End If Wend lobj.Data("Value(1)") = MyVariant
’Assign sequence schedule from Excel to Simulation ElseIf finishWS.range("J3") = "1" Then i = ArenaModel.Modules.Find(smFindTag, "Variables") Set mobj = ArenaModel.Modules(i) a = ArenaModel.Modules.Find(smFindTag, "Assign1") Set lobj = ArenaModel.Modules(a) lobj.Data("Value(1)") = "SeqSched(whicharray)" Dim pallet As String done = False: i = 1: j = 1: whichcol = "K" While Not done pallet = whichcol & (13 + j) pallet = finishWS.range(pallet) If Trim(pallet) <> "" And j < 12 Then Select Case pallet Case "Large" mobj.Data("Value(" & Str(i) & ", 9)") = 4 Case "Medium" mobj.Data("Value(" & Str(i) & ", 9)") = 3 Case "Small" mobj.Data("Value(" & Str(i) & ", 9)") = 2 Case "Empty" mobj.Data("Value(" & Str(i) & ", 9)") = 1 End Select i = i + 1 j = j + 1 If i = 11 Then j = 1: whichcol = "N" End If Else mobj.Data("Value(" & Str(i) & ", 9)") = 0 done = True End If Wend End If
106
i = ArenaModel.Modules.Find(smFindTag, "EXPRESSIONS1") Set mobj = ArenaModel.Modules(i) mobj.Data("Expression(2, 2)") = "TRIA(" & SmallArray(0) & "," & SmallArray(1) &"," & SmallArray(2) & ")" mobj.Data("Expression(3, 2)") = "TRIA(" & MedArray(0) & "," & MedArray(1) & ","& MedArray(2) & ")" mobj.Data("Expression(4, 2)") = "TRIA(" & LargeArray(0) & "," & LargeArray(1) &"," & LargeArray(2) & ")" ’Hide Excel and make Arena visible finishXL.Visible = False ArenaModel.Application.Show (smWindowStyleNormal)End Sub
Private Sub cmdRunSim_Click() If Not finishXL Is Nothing Then finishXL.DisplayAlerts = False finishWB.Close finishXL.Quit Set finishXL = Nothing Set finishWB = Nothing Set finishWS = Nothing End If ArenaModel.Application.Show (smWindowStyleNormal) Me.Hide ’ArenaModel.GoEnd Sub
frmOpen Code
Option Explicit
Private Sub cmdDone_Click() If optSpreadsheet = True Then frmOpen.Hide MsgBox "Use the following dialog to choose the appropriate Excel Finish Lineplanning spreadsheet." Set finishXL = CreateObject("Excel.Application") finishXL.Visible = False Do FName = finishXL.GetOpenFilename("Excel Files (*.xls), *.xls") Loop Until FName <> False Set finishWB = Workbooks.Open(Filename:=FName) Set finishWS = finishWB.Worksheets(1) finishXL.Visible = True Do

107
Set operationRange = Excel.Application.InputBox(Prompt:="Click on the rowwhose operation is being simulated.", Type:=8) Loop Until MsgBox("Is " + finishWS.Cells(operationRange.Row, 1) + " correct?",vbMsgBoxSetForeground + vbYesNo) = vbYes finishXL.Visible = False Else frmOpen.Hide End IfEnd Sub

108
Appendix D
Excel VBA Code
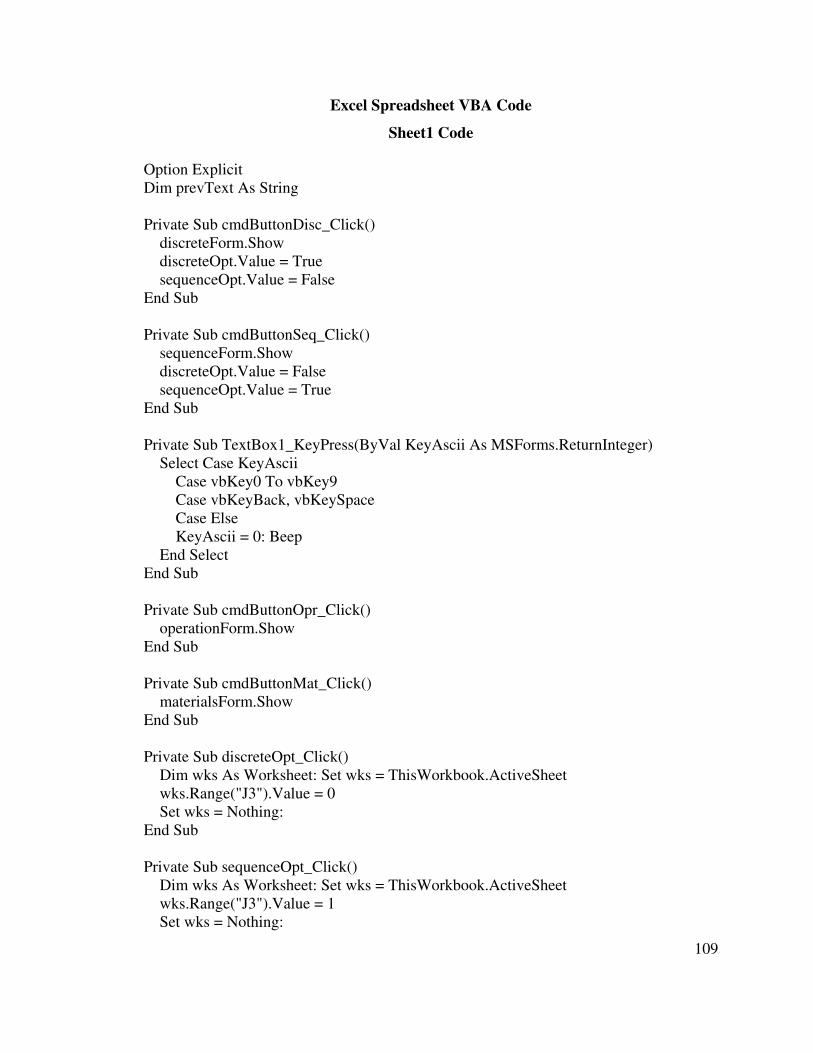
109
Excel Spreadsheet VBA Code
Sheet1 Code
Option ExplicitDim prevText As String
Private Sub cmdButtonDisc_Click() discreteForm.Show discreteOpt.Value = True sequenceOpt.Value = FalseEnd Sub
Private Sub cmdButtonSeq_Click() sequenceForm.Show discreteOpt.Value = False sequenceOpt.Value = TrueEnd Sub
Private Sub TextBox1_KeyPress(ByVal KeyAscii As MSForms.ReturnInteger) Select Case KeyAscii Case vbKey0 To vbKey9 Case vbKeyBack, vbKeySpace Case Else KeyAscii = 0: Beep End SelectEnd Sub
Private Sub cmdButtonOpr_Click() operationForm.ShowEnd Sub
Private Sub cmdButtonMat_Click() materialsForm.ShowEnd Sub
Private Sub discreteOpt_Click() Dim wks As Worksheet: Set wks = ThisWorkbook.ActiveSheet wks.Range("J3").Value = 0 Set wks = Nothing:End Sub
Private Sub sequenceOpt_Click() Dim wks As Worksheet: Set wks = ThisWorkbook.ActiveSheet wks.Range("J3").Value = 1 Set wks = Nothing:
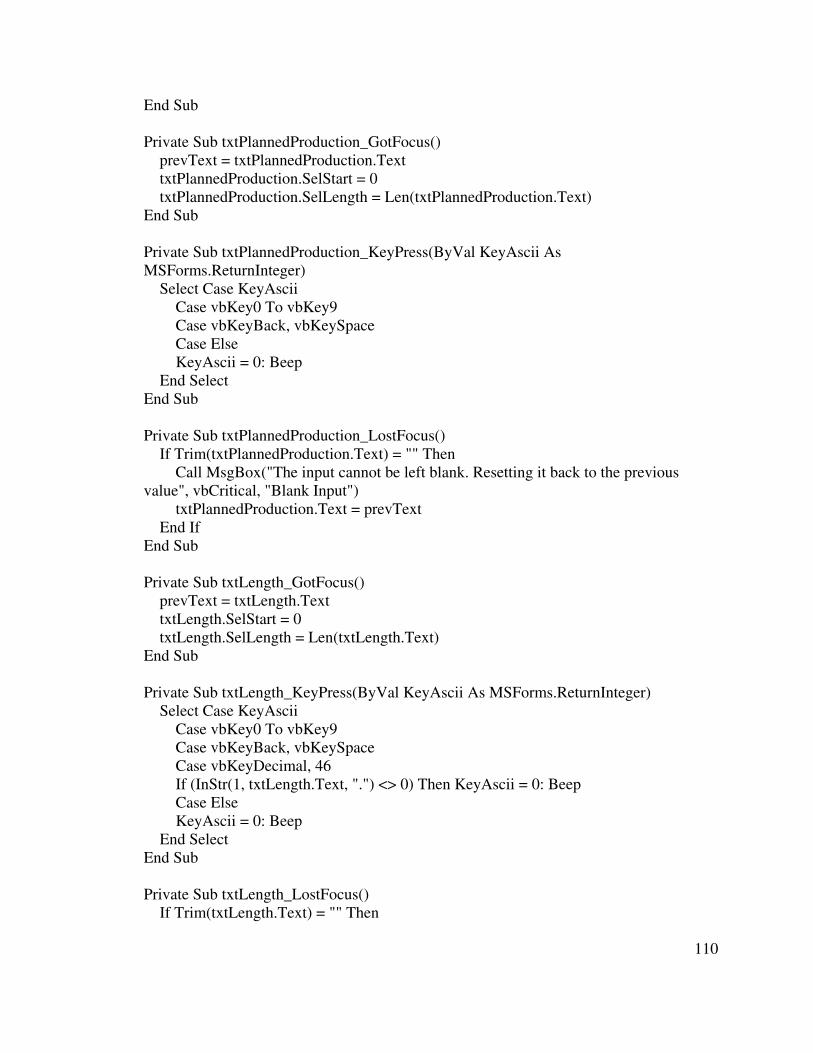
110
End Sub
Private Sub txtPlannedProduction_GotFocus() prevText = txtPlannedProduction.Text txtPlannedProduction.SelStart = 0 txtPlannedProduction.SelLength = Len(txtPlannedProduction.Text)End Sub
Private Sub txtPlannedProduction_KeyPress(ByVal KeyAscii AsMSForms.ReturnInteger) Select Case KeyAscii Case vbKey0 To vbKey9 Case vbKeyBack, vbKeySpace Case Else KeyAscii = 0: Beep End SelectEnd Sub
Private Sub txtPlannedProduction_LostFocus() If Trim(txtPlannedProduction.Text) = "" Then Call MsgBox("The input cannot be left blank. Resetting it back to the previousvalue", vbCritical, "Blank Input") txtPlannedProduction.Text = prevText End IfEnd Sub
Private Sub txtLength_GotFocus() prevText = txtLength.Text txtLength.SelStart = 0 txtLength.SelLength = Len(txtLength.Text)End Sub
Private Sub txtLength_KeyPress(ByVal KeyAscii As MSForms.ReturnInteger) Select Case KeyAscii Case vbKey0 To vbKey9 Case vbKeyBack, vbKeySpace Case vbKeyDecimal, 46 If (InStr(1, txtLength.Text, ".") <> 0) Then KeyAscii = 0: Beep Case Else KeyAscii = 0: Beep End SelectEnd Sub
Private Sub txtLength_LostFocus() If Trim(txtLength.Text) = "" Then
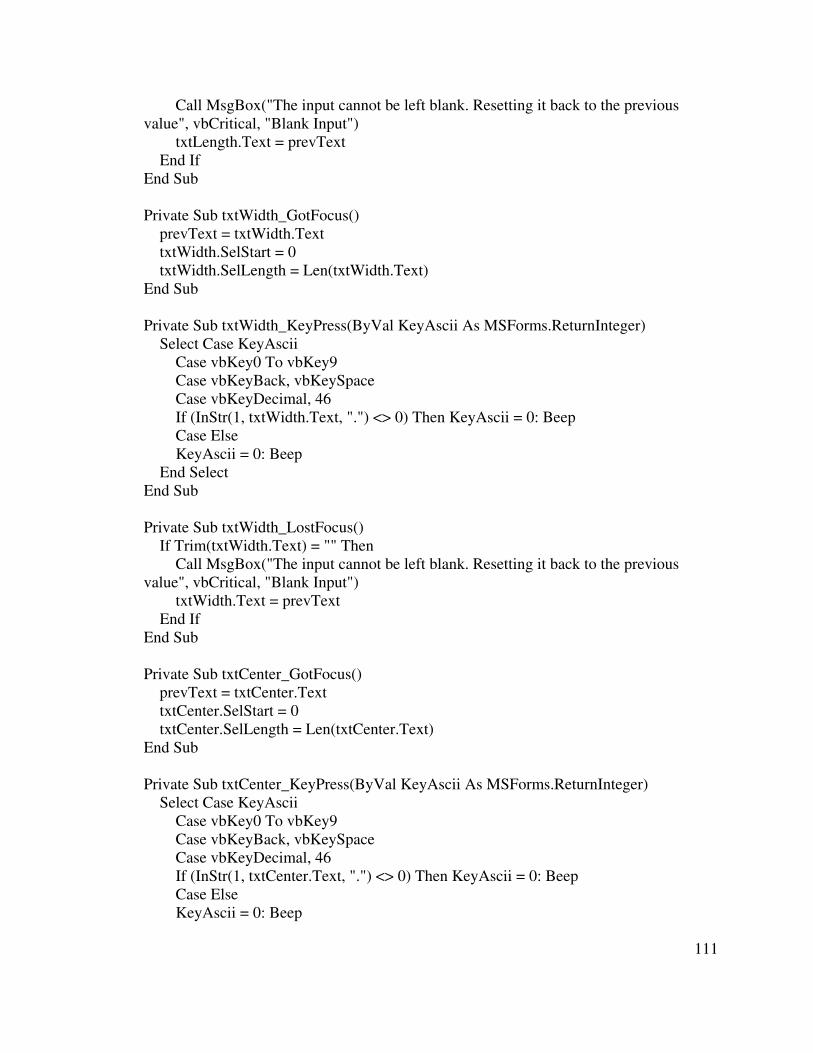
111
Call MsgBox("The input cannot be left blank. Resetting it back to the previousvalue", vbCritical, "Blank Input") txtLength.Text = prevText End IfEnd Sub
Private Sub txtWidth_GotFocus() prevText = txtWidth.Text txtWidth.SelStart = 0 txtWidth.SelLength = Len(txtWidth.Text)End Sub
Private Sub txtWidth_KeyPress(ByVal KeyAscii As MSForms.ReturnInteger) Select Case KeyAscii Case vbKey0 To vbKey9 Case vbKeyBack, vbKeySpace Case vbKeyDecimal, 46 If (InStr(1, txtWidth.Text, ".") <> 0) Then KeyAscii = 0: Beep Case Else KeyAscii = 0: Beep End SelectEnd Sub
Private Sub txtWidth_LostFocus() If Trim(txtWidth.Text) = "" Then Call MsgBox("The input cannot be left blank. Resetting it back to the previousvalue", vbCritical, "Blank Input") txtWidth.Text = prevText End IfEnd Sub
Private Sub txtCenter_GotFocus() prevText = txtCenter.Text txtCenter.SelStart = 0 txtCenter.SelLength = Len(txtCenter.Text)End Sub
Private Sub txtCenter_KeyPress(ByVal KeyAscii As MSForms.ReturnInteger) Select Case KeyAscii Case vbKey0 To vbKey9 Case vbKeyBack, vbKeySpace Case vbKeyDecimal, 46 If (InStr(1, txtCenter.Text, ".") <> 0) Then KeyAscii = 0: Beep Case Else KeyAscii = 0: Beep
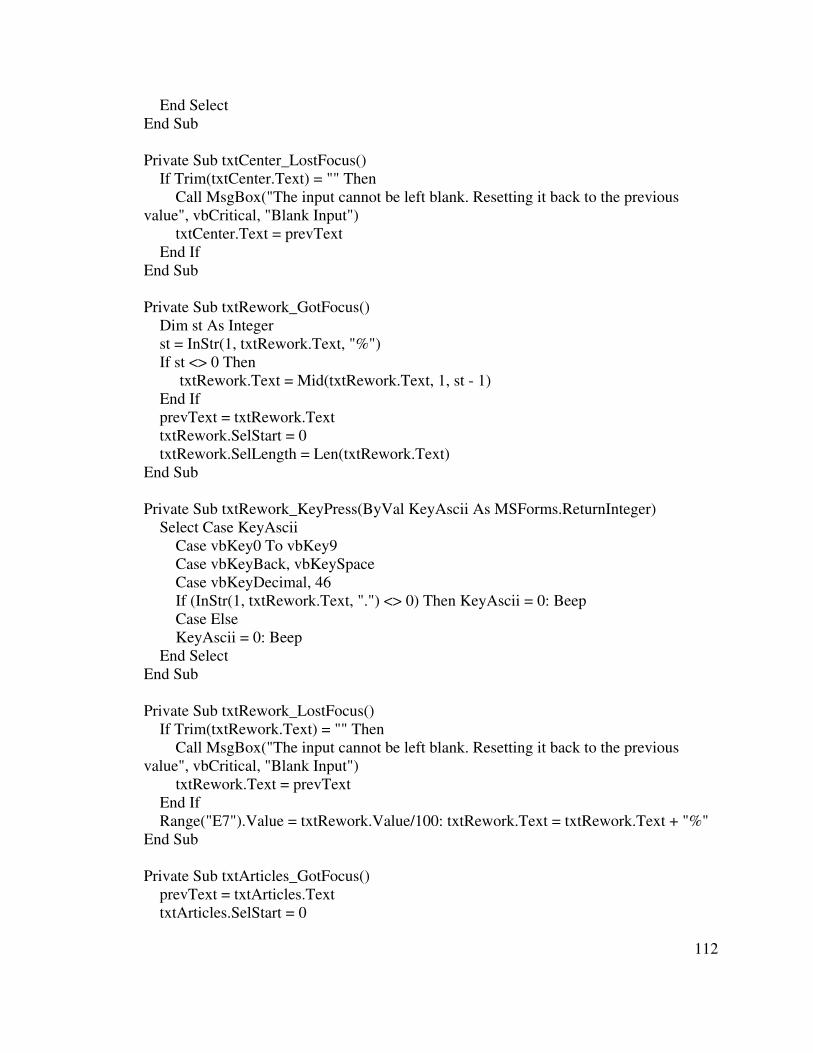
112
End SelectEnd Sub
Private Sub txtCenter_LostFocus() If Trim(txtCenter.Text) = "" Then Call MsgBox("The input cannot be left blank. Resetting it back to the previousvalue", vbCritical, "Blank Input") txtCenter.Text = prevText End IfEnd Sub
Private Sub txtRework_GotFocus() Dim st As Integer st = InStr(1, txtRework.Text, "%") If st <> 0 Then txtRework.Text = Mid(txtRework.Text, 1, st - 1) End If prevText = txtRework.Text txtRework.SelStart = 0 txtRework.SelLength = Len(txtRework.Text)End Sub
Private Sub txtRework_KeyPress(ByVal KeyAscii As MSForms.ReturnInteger) Select Case KeyAscii Case vbKey0 To vbKey9 Case vbKeyBack, vbKeySpace Case vbKeyDecimal, 46 If (InStr(1, txtRework.Text, ".") <> 0) Then KeyAscii = 0: Beep Case Else KeyAscii = 0: Beep End SelectEnd Sub
Private Sub txtRework_LostFocus() If Trim(txtRework.Text) = "" Then Call MsgBox("The input cannot be left blank. Resetting it back to the previousvalue", vbCritical, "Blank Input") txtRework.Text = prevText End If Range("E7").Value = txtRework.Value/100: txtRework.Text = txtRework.Text + "%"End Sub
Private Sub txtArticles_GotFocus() prevText = txtArticles.Text txtArticles.SelStart = 0
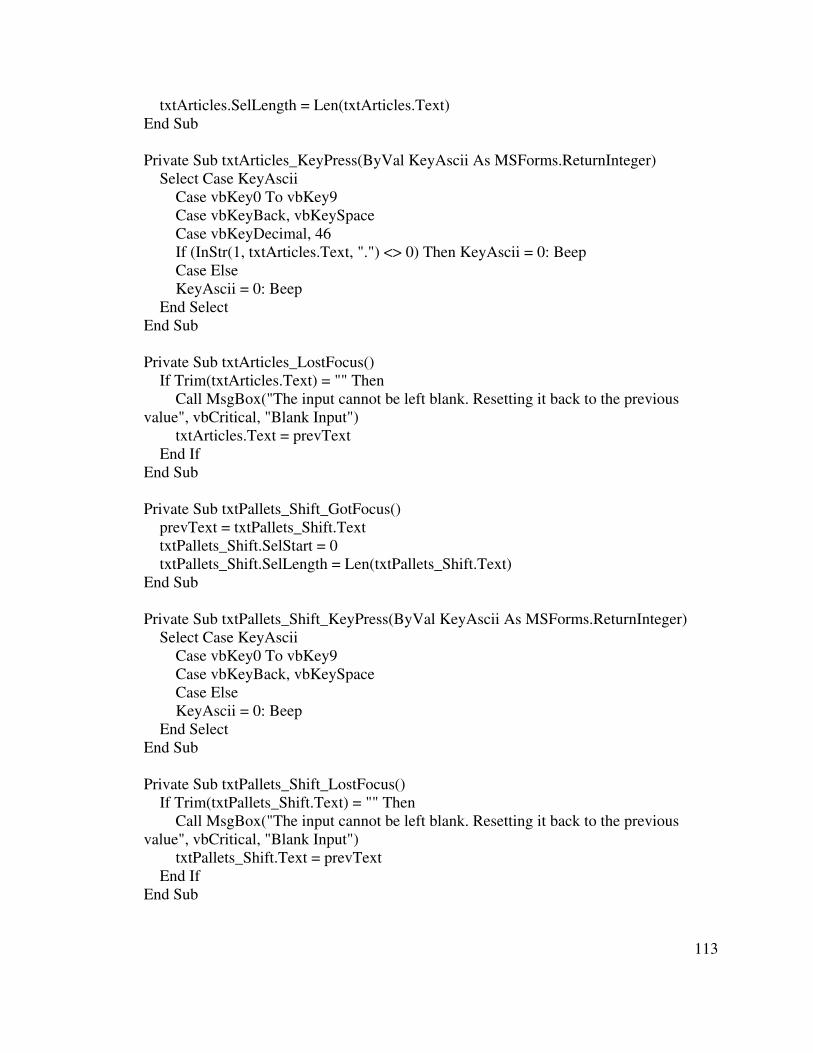
113
txtArticles.SelLength = Len(txtArticles.Text)End Sub
Private Sub txtArticles_KeyPress(ByVal KeyAscii As MSForms.ReturnInteger) Select Case KeyAscii Case vbKey0 To vbKey9 Case vbKeyBack, vbKeySpace Case vbKeyDecimal, 46 If (InStr(1, txtArticles.Text, ".") <> 0) Then KeyAscii = 0: Beep Case Else KeyAscii = 0: Beep End SelectEnd Sub
Private Sub txtArticles_LostFocus() If Trim(txtArticles.Text) = "" Then Call MsgBox("The input cannot be left blank. Resetting it back to the previousvalue", vbCritical, "Blank Input") txtArticles.Text = prevText End IfEnd Sub
Private Sub txtPallets_Shift_GotFocus() prevText = txtPallets_Shift.Text txtPallets_Shift.SelStart = 0 txtPallets_Shift.SelLength = Len(txtPallets_Shift.Text)End Sub
Private Sub txtPallets_Shift_KeyPress(ByVal KeyAscii As MSForms.ReturnInteger) Select Case KeyAscii Case vbKey0 To vbKey9 Case vbKeyBack, vbKeySpace Case Else KeyAscii = 0: Beep End SelectEnd Sub
Private Sub txtPallets_Shift_LostFocus() If Trim(txtPallets_Shift.Text) = "" Then Call MsgBox("The input cannot be left blank. Resetting it back to the previousvalue", vbCritical, "Blank Input") txtPallets_Shift.Text = prevText End IfEnd Sub
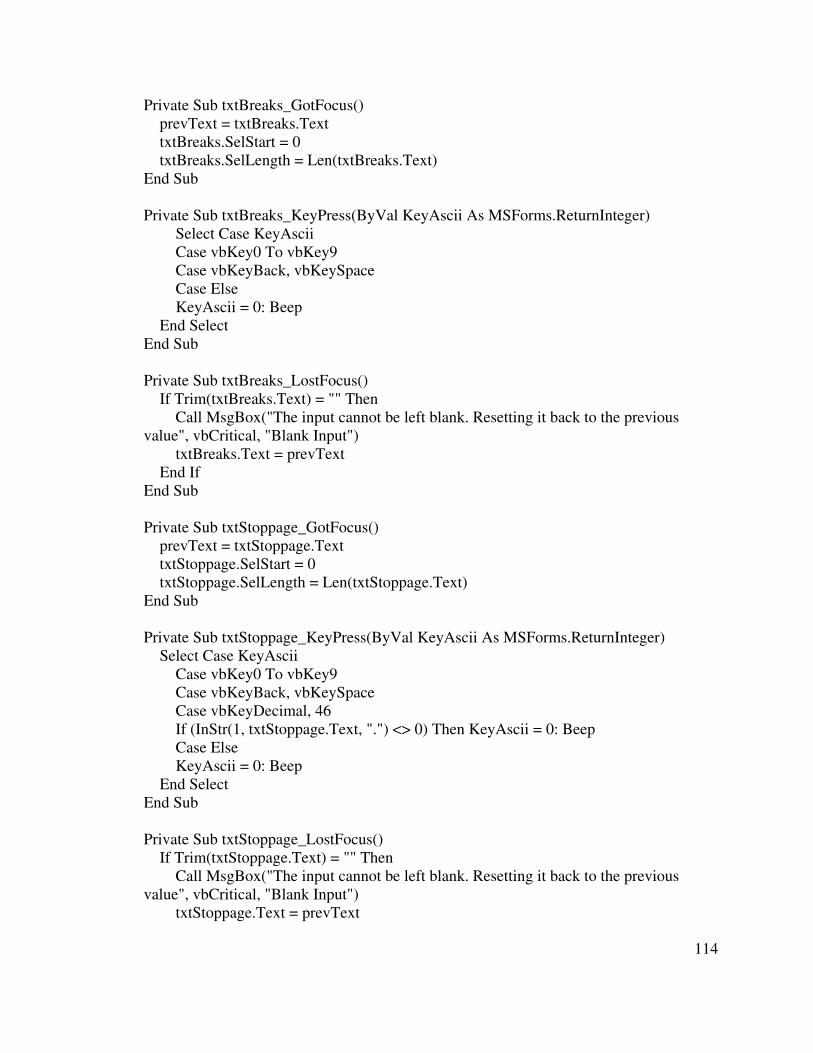
114
Private Sub txtBreaks_GotFocus() prevText = txtBreaks.Text txtBreaks.SelStart = 0 txtBreaks.SelLength = Len(txtBreaks.Text)End Sub
Private Sub txtBreaks_KeyPress(ByVal KeyAscii As MSForms.ReturnInteger) Select Case KeyAscii Case vbKey0 To vbKey9 Case vbKeyBack, vbKeySpace Case Else KeyAscii = 0: Beep End SelectEnd Sub
Private Sub txtBreaks_LostFocus() If Trim(txtBreaks.Text) = "" Then Call MsgBox("The input cannot be left blank. Resetting it back to the previousvalue", vbCritical, "Blank Input") txtBreaks.Text = prevText End IfEnd Sub
Private Sub txtStoppage_GotFocus() prevText = txtStoppage.Text txtStoppage.SelStart = 0 txtStoppage.SelLength = Len(txtStoppage.Text)End Sub
Private Sub txtStoppage_KeyPress(ByVal KeyAscii As MSForms.ReturnInteger) Select Case KeyAscii Case vbKey0 To vbKey9 Case vbKeyBack, vbKeySpace Case vbKeyDecimal, 46 If (InStr(1, txtStoppage.Text, ".") <> 0) Then KeyAscii = 0: Beep Case Else KeyAscii = 0: Beep End SelectEnd Sub
Private Sub txtStoppage_LostFocus() If Trim(txtStoppage.Text) = "" Then Call MsgBox("The input cannot be left blank. Resetting it back to the previousvalue", vbCritical, "Blank Input") txtStoppage.Text = prevText
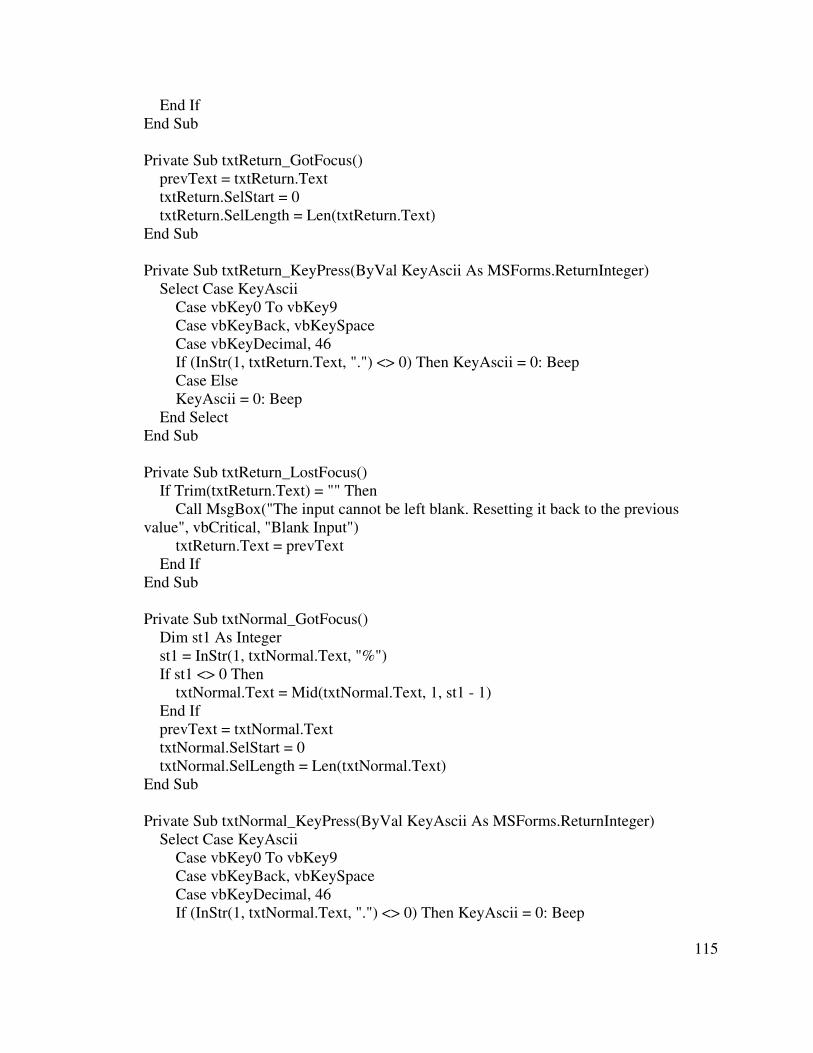
115
End IfEnd Sub
Private Sub txtReturn_GotFocus() prevText = txtReturn.Text txtReturn.SelStart = 0 txtReturn.SelLength = Len(txtReturn.Text)End Sub
Private Sub txtReturn_KeyPress(ByVal KeyAscii As MSForms.ReturnInteger) Select Case KeyAscii Case vbKey0 To vbKey9 Case vbKeyBack, vbKeySpace Case vbKeyDecimal, 46 If (InStr(1, txtReturn.Text, ".") <> 0) Then KeyAscii = 0: Beep Case Else KeyAscii = 0: Beep End SelectEnd Sub
Private Sub txtReturn_LostFocus() If Trim(txtReturn.Text) = "" Then Call MsgBox("The input cannot be left blank. Resetting it back to the previousvalue", vbCritical, "Blank Input") txtReturn.Text = prevText End IfEnd Sub
Private Sub txtNormal_GotFocus() Dim st1 As Integer st1 = InStr(1, txtNormal.Text, "%") If st1 <> 0 Then txtNormal.Text = Mid(txtNormal.Text, 1, st1 - 1) End If prevText = txtNormal.Text txtNormal.SelStart = 0 txtNormal.SelLength = Len(txtNormal.Text)End Sub
Private Sub txtNormal_KeyPress(ByVal KeyAscii As MSForms.ReturnInteger) Select Case KeyAscii Case vbKey0 To vbKey9 Case vbKeyBack, vbKeySpace Case vbKeyDecimal, 46 If (InStr(1, txtNormal.Text, ".") <> 0) Then KeyAscii = 0: Beep
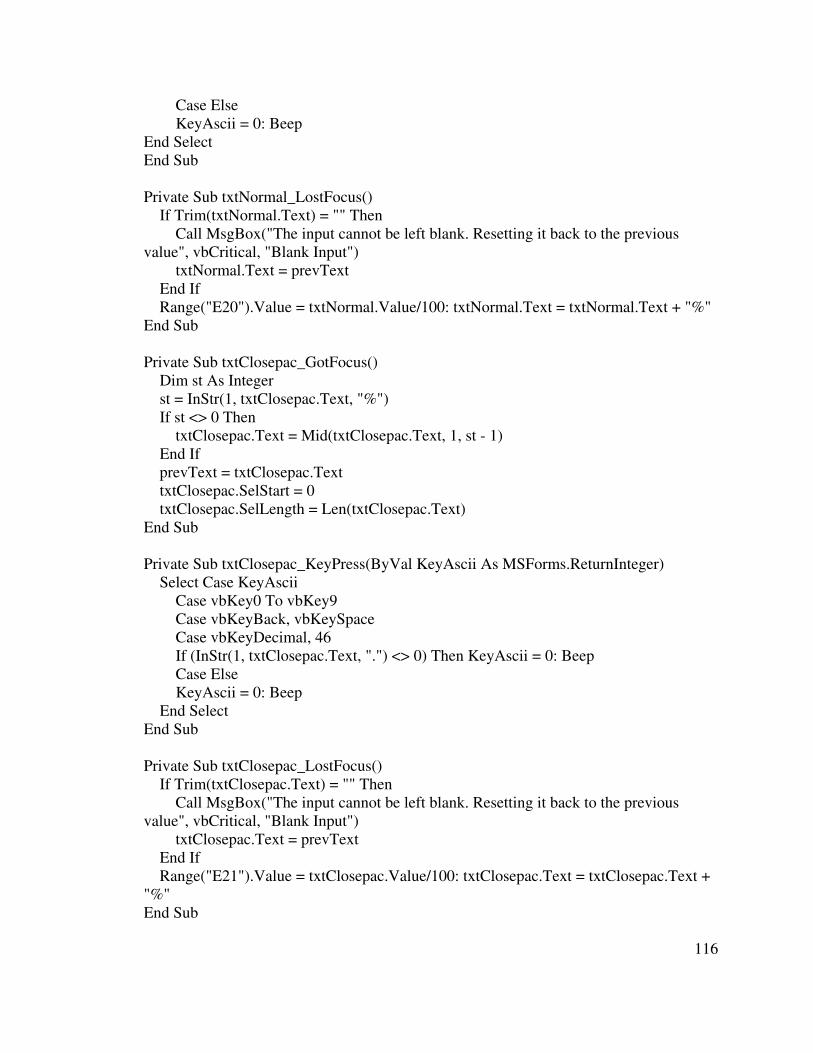
116
Case Else KeyAscii = 0: BeepEnd SelectEnd Sub
Private Sub txtNormal_LostFocus() If Trim(txtNormal.Text) = "" Then Call MsgBox("The input cannot be left blank. Resetting it back to the previousvalue", vbCritical, "Blank Input") txtNormal.Text = prevText End If Range("E20").Value = txtNormal.Value/100: txtNormal.Text = txtNormal.Text + "%"End Sub
Private Sub txtClosepac_GotFocus() Dim st As Integer st = InStr(1, txtClosepac.Text, "%") If st <> 0 Then txtClosepac.Text = Mid(txtClosepac.Text, 1, st - 1) End If prevText = txtClosepac.Text txtClosepac.SelStart = 0 txtClosepac.SelLength = Len(txtClosepac.Text)End Sub
Private Sub txtClosepac_KeyPress(ByVal KeyAscii As MSForms.ReturnInteger) Select Case KeyAscii Case vbKey0 To vbKey9 Case vbKeyBack, vbKeySpace Case vbKeyDecimal, 46 If (InStr(1, txtClosepac.Text, ".") <> 0) Then KeyAscii = 0: Beep Case Else KeyAscii = 0: Beep End SelectEnd Sub
Private Sub txtClosepac_LostFocus() If Trim(txtClosepac.Text) = "" Then Call MsgBox("The input cannot be left blank. Resetting it back to the previousvalue", vbCritical, "Blank Input") txtClosepac.Text = prevText End If Range("E21").Value = txtClosepac.Value/100: txtClosepac.Text = txtClosepac.Text +"%"End Sub
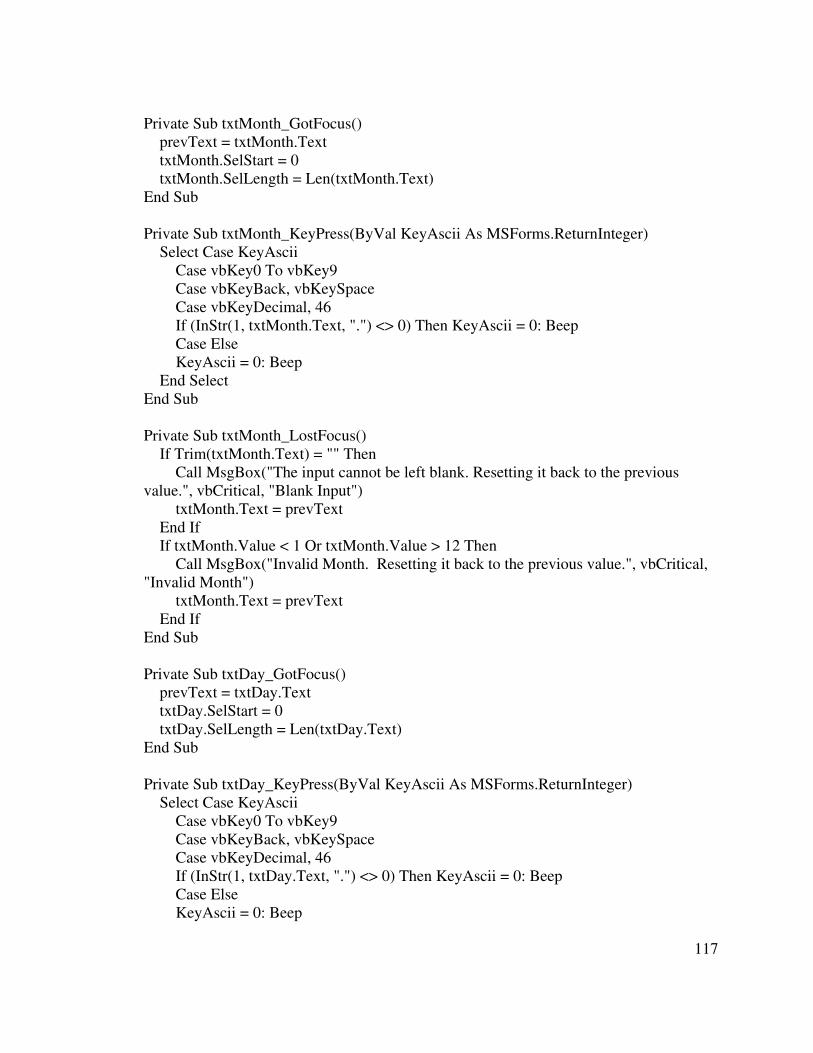
117
Private Sub txtMonth_GotFocus() prevText = txtMonth.Text txtMonth.SelStart = 0 txtMonth.SelLength = Len(txtMonth.Text)End Sub
Private Sub txtMonth_KeyPress(ByVal KeyAscii As MSForms.ReturnInteger) Select Case KeyAscii Case vbKey0 To vbKey9 Case vbKeyBack, vbKeySpace Case vbKeyDecimal, 46 If (InStr(1, txtMonth.Text, ".") <> 0) Then KeyAscii = 0: Beep Case Else KeyAscii = 0: Beep End SelectEnd Sub
Private Sub txtMonth_LostFocus() If Trim(txtMonth.Text) = "" Then Call MsgBox("The input cannot be left blank. Resetting it back to the previousvalue.", vbCritical, "Blank Input") txtMonth.Text = prevText End If If txtMonth.Value < 1 Or txtMonth.Value > 12 Then Call MsgBox("Invalid Month. Resetting it back to the previous value.", vbCritical,"Invalid Month") txtMonth.Text = prevText End IfEnd Sub
Private Sub txtDay_GotFocus() prevText = txtDay.Text txtDay.SelStart = 0 txtDay.SelLength = Len(txtDay.Text)End Sub
Private Sub txtDay_KeyPress(ByVal KeyAscii As MSForms.ReturnInteger) Select Case KeyAscii Case vbKey0 To vbKey9 Case vbKeyBack, vbKeySpace Case vbKeyDecimal, 46 If (InStr(1, txtDay.Text, ".") <> 0) Then KeyAscii = 0: Beep Case Else KeyAscii = 0: Beep
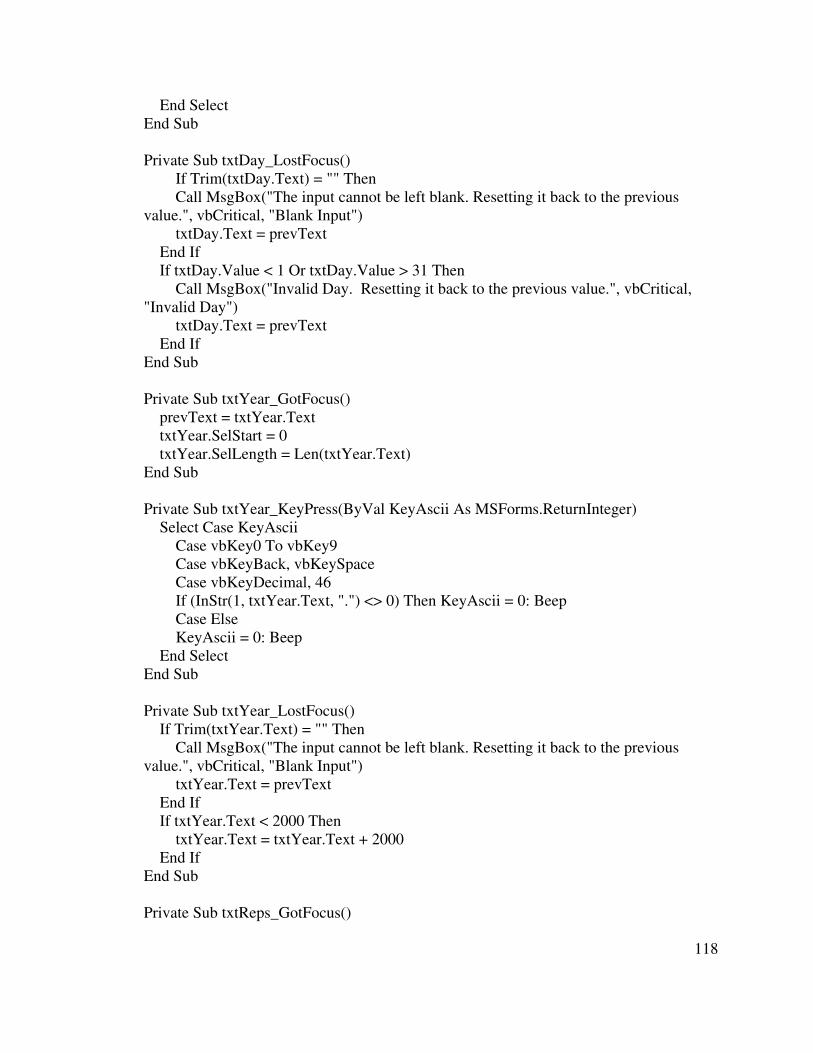
118
End SelectEnd Sub
Private Sub txtDay_LostFocus() If Trim(txtDay.Text) = "" Then Call MsgBox("The input cannot be left blank. Resetting it back to the previousvalue.", vbCritical, "Blank Input") txtDay.Text = prevText End If If txtDay.Value < 1 Or txtDay.Value > 31 Then Call MsgBox("Invalid Day. Resetting it back to the previous value.", vbCritical,"Invalid Day") txtDay.Text = prevText End IfEnd Sub
Private Sub txtYear_GotFocus() prevText = txtYear.Text txtYear.SelStart = 0 txtYear.SelLength = Len(txtYear.Text)End Sub
Private Sub txtYear_KeyPress(ByVal KeyAscii As MSForms.ReturnInteger) Select Case KeyAscii Case vbKey0 To vbKey9 Case vbKeyBack, vbKeySpace Case vbKeyDecimal, 46 If (InStr(1, txtYear.Text, ".") <> 0) Then KeyAscii = 0: Beep Case Else KeyAscii = 0: Beep End SelectEnd Sub
Private Sub txtYear_LostFocus() If Trim(txtYear.Text) = "" Then Call MsgBox("The input cannot be left blank. Resetting it back to the previousvalue.", vbCritical, "Blank Input") txtYear.Text = prevText End If If txtYear.Text < 2000 Then txtYear.Text = txtYear.Text + 2000 End IfEnd Sub
Private Sub txtReps_GotFocus()
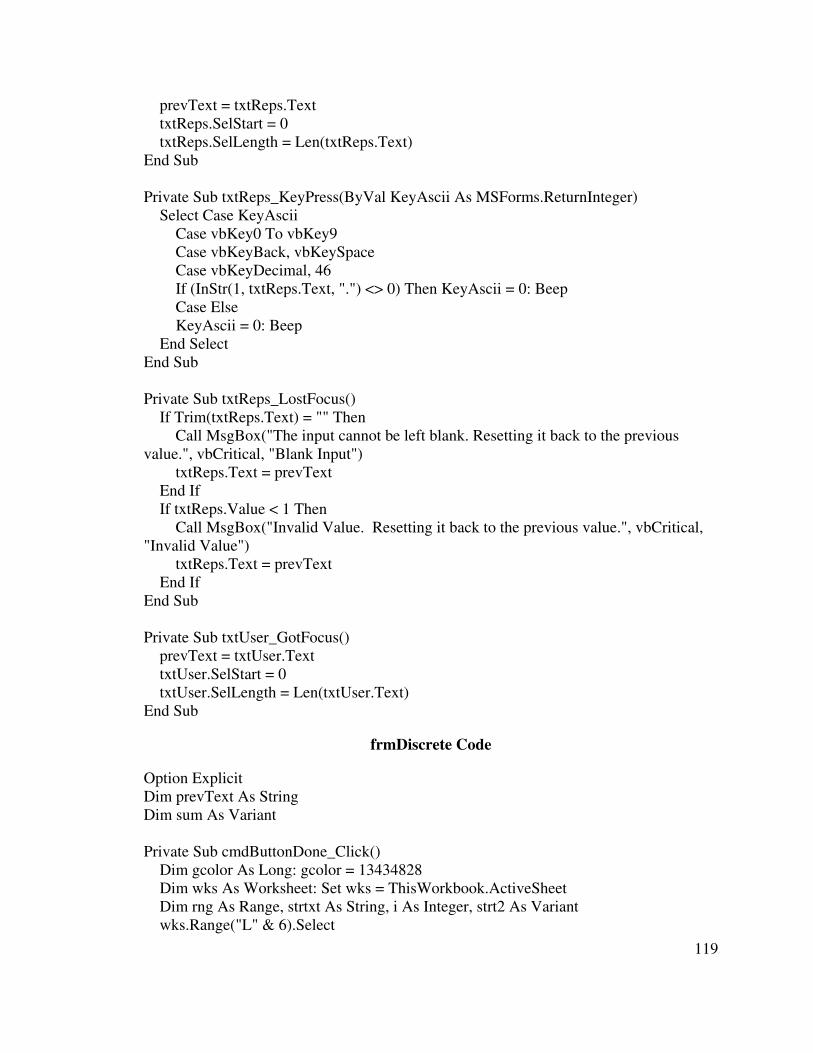
119
prevText = txtReps.Text txtReps.SelStart = 0 txtReps.SelLength = Len(txtReps.Text)End Sub
Private Sub txtReps_KeyPress(ByVal KeyAscii As MSForms.ReturnInteger) Select Case KeyAscii Case vbKey0 To vbKey9 Case vbKeyBack, vbKeySpace Case vbKeyDecimal, 46 If (InStr(1, txtReps.Text, ".") <> 0) Then KeyAscii = 0: Beep Case Else KeyAscii = 0: Beep End SelectEnd Sub
Private Sub txtReps_LostFocus() If Trim(txtReps.Text) = "" Then Call MsgBox("The input cannot be left blank. Resetting it back to the previousvalue.", vbCritical, "Blank Input") txtReps.Text = prevText End If If txtReps.Value < 1 Then Call MsgBox("Invalid Value. Resetting it back to the previous value.", vbCritical,"Invalid Value") txtReps.Text = prevText End IfEnd Sub
Private Sub txtUser_GotFocus() prevText = txtUser.Text txtUser.SelStart = 0 txtUser.SelLength = Len(txtUser.Text)End Sub
frmDiscrete Code
Option ExplicitDim prevText As StringDim sum As Variant
Private Sub cmdButtonDone_Click() Dim gcolor As Long: gcolor = 13434828 Dim wks As Worksheet: Set wks = ThisWorkbook.ActiveSheet Dim rng As Range, strtxt As String, i As Integer, strt2 As Variant wks.Range("L" & 6).Select
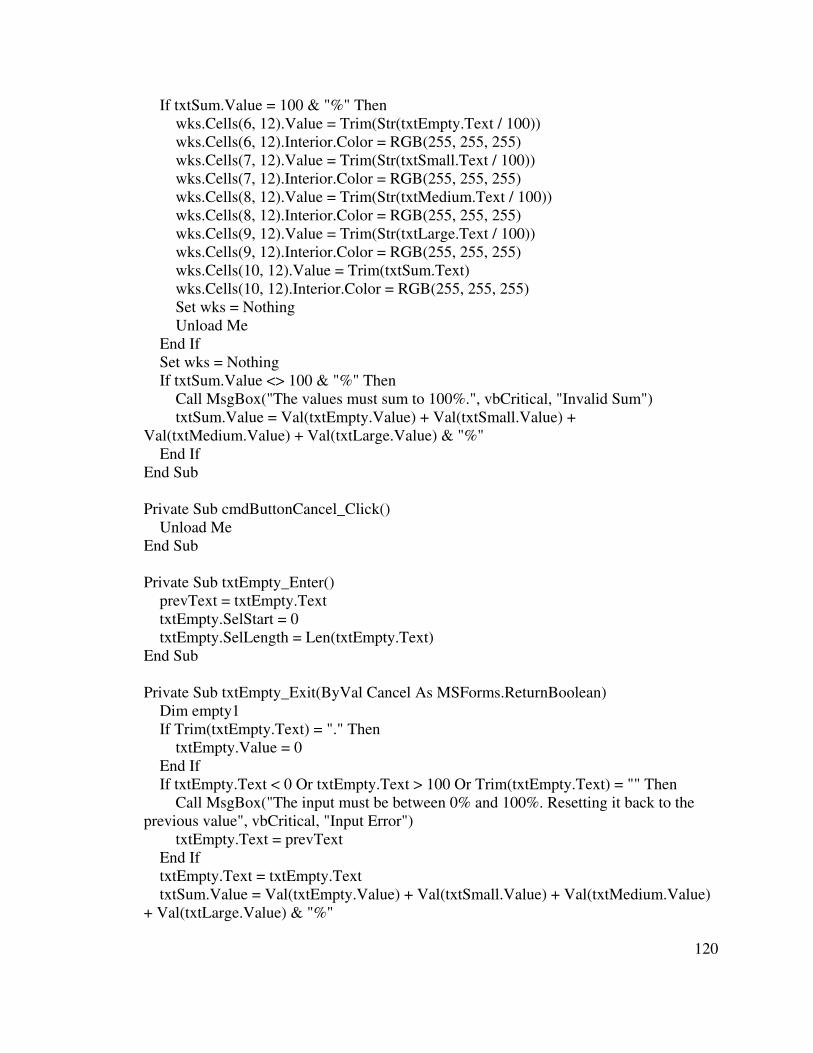
120
If txtSum.Value = 100 & "%" Then wks.Cells(6, 12).Value = Trim(Str(txtEmpty.Text / 100)) wks.Cells(6, 12).Interior.Color = RGB(255, 255, 255) wks.Cells(7, 12).Value = Trim(Str(txtSmall.Text / 100)) wks.Cells(7, 12).Interior.Color = RGB(255, 255, 255) wks.Cells(8, 12).Value = Trim(Str(txtMedium.Text / 100)) wks.Cells(8, 12).Interior.Color = RGB(255, 255, 255) wks.Cells(9, 12).Value = Trim(Str(txtLarge.Text / 100)) wks.Cells(9, 12).Interior.Color = RGB(255, 255, 255) wks.Cells(10, 12).Value = Trim(txtSum.Text) wks.Cells(10, 12).Interior.Color = RGB(255, 255, 255) Set wks = Nothing Unload Me End If Set wks = Nothing If txtSum.Value <> 100 & "%" Then Call MsgBox("The values must sum to 100%.", vbCritical, "Invalid Sum") txtSum.Value = Val(txtEmpty.Value) + Val(txtSmall.Value) +Val(txtMedium.Value) + Val(txtLarge.Value) & "%" End IfEnd Sub
Private Sub cmdButtonCancel_Click() Unload MeEnd Sub
Private Sub txtEmpty_Enter() prevText = txtEmpty.Text txtEmpty.SelStart = 0 txtEmpty.SelLength = Len(txtEmpty.Text)End Sub
Private Sub txtEmpty_Exit(ByVal Cancel As MSForms.ReturnBoolean) Dim empty1 If Trim(txtEmpty.Text) = "." Then txtEmpty.Value = 0 End If If txtEmpty.Text < 0 Or txtEmpty.Text > 100 Or Trim(txtEmpty.Text) = "" Then Call MsgBox("The input must be between 0% and 100%. Resetting it back to theprevious value", vbCritical, "Input Error") txtEmpty.Text = prevText End If txtEmpty.Text = txtEmpty.Text txtSum.Value = Val(txtEmpty.Value) + Val(txtSmall.Value) + Val(txtMedium.Value)+ Val(txtLarge.Value) & "%"
121
End Sub
Private Sub txtEmpty_KeyPress(ByVal KeyAscii As MSForms.ReturnInteger) Select Case KeyAscii Case vbKey0 To vbKey9 Case vbKeyBack, vbKeySpace Case vbKeyDecimal, 46 If (InStr(1, txtEmpty.Text, ".") <> 0) Then KeyAscii = 0: Beep Case Else KeyAscii = 0: Beep End SelectEnd Sub
Private Sub txtSmall_Enter() prevText = txtSmall.Text txtSmall.SelStart = 0 txtSmall.SelLength = Len(txtSmall.Text)End Sub
Private Sub txtSmall_Exit(ByVal Cancel As MSForms.ReturnBoolean) Dim small If Trim(txtSmall.Text) = "." Then txtSmall.Value = 0 End If If txtSmall.Text < 0 Or txtSmall.Text > 100 Or Trim(txtSmall.Text) = "" Then Call MsgBox("The input must be between 0% and 100%. Resetting it back to theprevious value", vbCritical, "Input Error") txtSmall.Text = prevText End If txtSmall.Text = txtSmall.Text txtSum.Value = Val(txtEmpty.Value) + Val(txtSmall.Value) +Val(txtMedium.Value) + Val(txtLarge.Value) & "%"End Sub
Private Sub txtSmall_KeyPress(ByVal KeyAscii As MSForms.ReturnInteger) Select Case KeyAscii Case vbKey0 To vbKey9 Case vbKeyBack, vbKeySpace Case vbKeyDecimal, 46 If (InStr(1, txtSmall.Text, ".") <> 0) Then KeyAscii = 0: Beep Case Else KeyAscii = 0: Beep End SelectEnd Sub
122
Private Sub txtMedium_Enter() prevText = txtMedium.Text txtMedium.SelStart = 0 txtMedium.SelLength = Len(txtMedium.Text)End Sub
Private Sub txtMedium_Exit(ByVal Cancel As MSForms.ReturnBoolean) Dim medium If Trim(txtMedium.Text) = "." Then txtMedium.Value = 0 End If If txtMedium.Text < 0 Or txtMedium.Text > 100 Or Trim(txtMedium.Text) = "" Then Call MsgBox("The input must be between 0% and 100%. Resetting it back to theprevious value", vbCritical, "Input Error") txtMedium.Text = prevText End If txtMedium.Text = txtMedium.Text txtSum.Value = Val(txtEmpty.Value) + Val(txtSmall.Value) +Val(txtMedium.Value) + Val(txtLarge.Value) & "%"End Sub
Private Sub txtMedium_KeyPress(ByVal KeyAscii As MSForms.ReturnInteger) Select Case KeyAscii Case vbKey0 To vbKey9 Case vbKeyBack, vbKeySpace Case vbKeyDecimal, 46 If (InStr(1, txtMedium.Text, ".") <> 0) Then KeyAscii = 0: Beep Case Else KeyAscii = 0: Beep End SelectEnd Sub
Private Sub txtLarge_Enter() prevText = txtLarge.Text txtLarge.SelStart = 0 txtLarge.SelLength = Len(txtLarge.Text)End Sub
Private Sub txtLarge_Exit(ByVal Cancel As MSForms.ReturnBoolean) Dim large If Trim(txtLarge.Text) = "." Then txtLarge.Value = 0 End If If txtLarge.Text < 0 Or txtLarge.Text > 100 Or Trim(txtLarge.Text) = "" Then
123
Call MsgBox("The input must be between 0% and 100%. Resetting it back to theprevious value", vbCritical, "Input Error") txtLarge.Text = prevText End If txtLarge.Text = txtLarge.Text txtSum.Value = Val(txtEmpty.Value) + Val(txtSmall.Value) +Val(txtMedium.Value) + Val(txtLarge.Value) & "%"End Sub
Private Sub txtLarge_KeyPress(ByVal KeyAscii As MSForms.ReturnInteger) Select Case KeyAscii Case vbKey0 To vbKey9 Case vbKeyBack, vbKeySpace Case vbKeyDecimal, 46 If (InStr(1, txtLarge.Text, ".") <> 0) Then KeyAscii = 0: Beep Case Else KeyAscii = 0: Beep End SelectEnd Sub
Private Sub txtSum_Deactivate() txtSum.Value = txtEmpty.Value + txtSmall.Value + txtMedium.Value +txtLarge.ValueEnd Sub
Private Sub txtSum_Exit(ByVal Cancel As MSForms.ReturnBoolean) txtSum.Value = txtEmpty.Value + txtSmall.Value + txtMedium.Value +txtLarge.ValueEnd Sub
Private Sub UserForm_Activate() Dim wks As Worksheet: Set wks = ThisWorkbook.ActiveSheet Dim rng As Range wks.Range("L" & 6).Select txtEmpty.Text = Trim(Str(100 * wks.Cells(6, 12).Value)) txtSmall.Text = Trim(Str(100 * wks.Cells(7, 12).Value)) txtMedium.Text = Trim(Str(100 * wks.Cells(8, 12).Value)) txtLarge.Text = Trim(Str(100 * wks.Cells(9, 12).Value)) txtSum.Text = Str(100 * wks.Cells(10, 12).Value) + "%" Set wks = NothingEnd Sub
frmSequence Code
Option ExplicitDim prevText As String
124
Dim MyArray(1, 4)
Private Sub cmdButtonDone_Click() Dim gcolor As Long: gcolor = 13434828 Dim wks As Worksheet: Set wks = ThisWorkbook.ActiveSheet Dim rng As Range, strtxt As String, i As Integer, strt2 As Variant wks.Cells(14, 11).Value = ComboBox1.Text wks.Cells(15, 11).Value = ComboBox2.Text wks.Cells(16, 11).Value = ComboBox3.Text wks.Cells(17, 11).Value = ComboBox4.Text wks.Cells(18, 11).Value = ComboBox5.Text wks.Cells(19, 11).Value = ComboBox6.Text wks.Cells(20, 11).Value = ComboBox7.Text wks.Cells(21, 11).Value = ComboBox8.Text wks.Cells(22, 11).Value = ComboBox9.Text wks.Cells(23, 11).Value = ComboBox10.Text wks.Cells(14, 14).Value = ComboBox11.Text wks.Cells(15, 14).Value = ComboBox12.Text wks.Cells(16, 14).Value = ComboBox13.Text wks.Cells(17, 14).Value = ComboBox14.Text wks.Cells(18, 14).Value = ComboBox15.Text wks.Cells(19, 14).Value = ComboBox16.Text wks.Cells(20, 14).Value = ComboBox17.Text wks.Cells(21, 14).Value = ComboBox18.Text wks.Cells(22, 14).Value = ComboBox19.Text wks.Cells(23, 14).Value = ComboBox20.Text Set wks = Nothing Unload MeEnd Sub
Private Sub cmdButtonCancel_Click() Unload MeEnd Sub
Private Sub ComboBox1_KeyPress(ByVal KeyAscii As MSForms.ReturnInteger) KeyAscii = 0End Sub
Private Sub ComboBox2_KeyPress(ByVal KeyAscii As MSForms.ReturnInteger) KeyAscii = 0End Sub
Private Sub ComboBox3_KeyPress(ByVal KeyAscii As MSForms.ReturnInteger) KeyAscii = 0End Sub
125
Private Sub ComboBox4_KeyPress(ByVal KeyAscii As MSForms.ReturnInteger) KeyAscii = 0End Sub
Private Sub ComboBox5_KeyPress(ByVal KeyAscii As MSForms.ReturnInteger) KeyAscii = 0End Sub
Private Sub ComboBox6_KeyPress(ByVal KeyAscii As MSForms.ReturnInteger) KeyAscii = 0End SubPrivate Sub ComboBox7_KeyPress(ByVal KeyAscii As MSForms.ReturnInteger) KeyAscii = 0End Sub
Private Sub ComboBox8_KeyPress(ByVal KeyAscii As MSForms.ReturnInteger) KeyAscii = 0End Sub
Private Sub ComboBox9_KeyPress(ByVal KeyAscii As MSForms.ReturnInteger) KeyAscii = 0End Sub
Private Sub ComboBox10_KeyPress(ByVal KeyAscii As MSForms.ReturnInteger) KeyAscii = 0End Sub
Private Sub ComboBox11_KeyPress(ByVal KeyAscii As MSForms.ReturnInteger) KeyAscii = 0End Sub
Private Sub ComboBox12_KeyPress(ByVal KeyAscii As MSForms.ReturnInteger) KeyAscii = 0End Sub
Private Sub ComboBox13_KeyPress(ByVal KeyAscii As MSForms.ReturnInteger) KeyAscii = 0End Sub
Private Sub ComboBox14_KeyPress(ByVal KeyAscii As MSForms.ReturnInteger) KeyAscii = 0End Sub
Private Sub ComboBox15_KeyPress(ByVal KeyAscii As MSForms.ReturnInteger)
126
KeyAscii = 0End Sub
Private Sub ComboBox16_KeyPress(ByVal KeyAscii As MSForms.ReturnInteger) KeyAscii = 0End SubPrivate Sub ComboBox17_KeyPress(ByVal KeyAscii As MSForms.ReturnInteger) KeyAscii = 0End Sub
Private Sub ComboBox18_KeyPress(ByVal KeyAscii As MSForms.ReturnInteger) KeyAscii = 0End Sub
Private Sub ComboBox19_KeyPress(ByVal KeyAscii As MSForms.ReturnInteger) KeyAscii = 0End Sub
Private Sub ComboBox20_KeyPress(ByVal KeyAscii As MSForms.ReturnInteger) KeyAscii = 0End Sub
Private Sub UserForm_Initialize() ComboBox1.ColumnCount = 1 ’The 1st Combo box contains 1 data columns ’Load column 1 of MyArray MyArray(0, 0) = "Empty" MyArray(0, 1) = "Small" MyArray(0, 2) = "Medium" MyArray(0, 3) = "Large" ’Load data into ComboBox1 ComboBox1.Column() = MyArray ComboBox2.Column() = MyArray ComboBox3.Column() = MyArray ComboBox4.Column() = MyArray ComboBox5.Column() = MyArray ComboBox6.Column() = MyArray ComboBox7.Column() = MyArray ComboBox8.Column() = MyArray ComboBox9.Column() = MyArray ComboBox10.Column() = MyArray ComboBox11.Column() = MyArray ComboBox12.Column() = MyArray ComboBox13.Column() = MyArray ComboBox14.Column() = MyArray
127
ComboBox15.Column() = MyArray ComboBox16.Column() = MyArray ComboBox17.Column() = MyArray ComboBox18.Column() = MyArray ComboBox19.Column() = MyArray ComboBox20.Column() = MyArrayEnd Sub
frmMaterials Code
Option ExplicitDim prevText As String
Private Sub cmdButtonAddMat_Click() Dim gcolor As Long: gcolor = 13434828 Dim wks As Worksheet: Set wks = ThisWorkbook.ActiveSheet Dim rng As Range, strtxt As String, i As Integer, strt2 As Variant i = txtRow.Value ’ThisWorkbook.ActiveSheet.Rows(i).Insert wks.Range("A" & i & ":I" & i).Select Rows(i).Insert ’Set rng = Nothing wks.Cells(i, 1).Value = txtMaterialsName.Text: wks.Cells(i, 1).Interior.Color = gcolor wks.Cells(i, 2).Value = "": wks.Range("A" & i).Borders(xlEdgeRight).LineStyle =xlLineStyleNone: wks.Cells(i, 2).Interior.Color = gcolor wks.Cells(i, 3).Value = txtSch.Text: wks.Cells(i, 3).Interior.Color = RGB(255, 255,255) wks.Cells(i, 4).Interior.Color = gcolor wks.Cells(i, 5).Interior.Color = gcolor wks.Cells(i, 6).Interior.Color = gcolor strtxt = "=IF(C" & i & "<20,C" & i & ",C" & i & "*$E$20)" Range("G" & i).Formula = strtxt: wks.Cells(i, 7).Interior.Color = gcolor strtxt = "=IF(C" & i & ">=20,C" & i & "*$E$21," + Chr(34) + Chr(34) + ")" Range("H" & i).Formula = strtxt: wks.Cells(i, 8).Interior.Color = gcolor wks.Cells(i, 9).Interior.Color = gcolor wks.Cells(i, 10).Interior.Color = gcolor wks.Cells(i, 11).Interior.Color = gcolor wks.Cells(i, 12).Interior.Color = gcolor wks.Cells(i, 13).Interior.Color = gcolor wks.Cells(i, 14).Interior.Color = gcolor wks.Cells(i, 15).Interior.Color = gcolor wks.Cells(i, 16).Interior.Color = gcolor wks.Cells(i, 17).Interior.Color = gcolor wks.Cells(i, 18).Interior.Color = gcolor Set wks = Nothing Unload Me
128
End Sub
Private Sub cmdButtonCancel_Click() Unload MeEnd Sub
Private Sub txtMaterialsName_Enter() txtMaterialsName.SelStart = 0 txtMaterialsName.SelLength = Len(txtMaterialsName.Text) prevText = txtMaterialsName.TextEnd Sub
Private Sub txtMaterialsName_Exit(ByVal Cancel As MSForms.ReturnBoolean) If Trim(txtMaterialsName.Text) = "" Then Call MsgBox("The input cannot be left blank. Resetting it back to the previousvalue", vbCritical, "Blank Input") txtMaterialsName.Text = prevText End IfEnd Sub
Private Sub txtRow_Enter() prevText = txtRow.TextEnd Sub
Private Sub txtRow_Exit(ByVal Cancel As MSForms.ReturnBoolean) If txtRow.Value < 28 Or txtRow.Value > Val(prevText) Or Trim(txtRow.Text) = ""Then Call MsgBox("The row value has to be between 28 and " & prevText & ". Resettingvalue", vbCritical, "Invalid") txtRow.Text = prevText End IfEnd Sub
Private Sub txtRow_KeyPress(ByVal KeyAscii As MSForms.ReturnInteger) Select Case KeyAscii Case vbKey0 To vbKey9 Case vbKeyBack, vbKeySpace Case Else KeyAscii = 0: Beep End SelectEnd Sub
Private Sub txtSch_Enter() txtSch.SelStart = 0 txtSch.SelLength = Len(txtSch.Text)
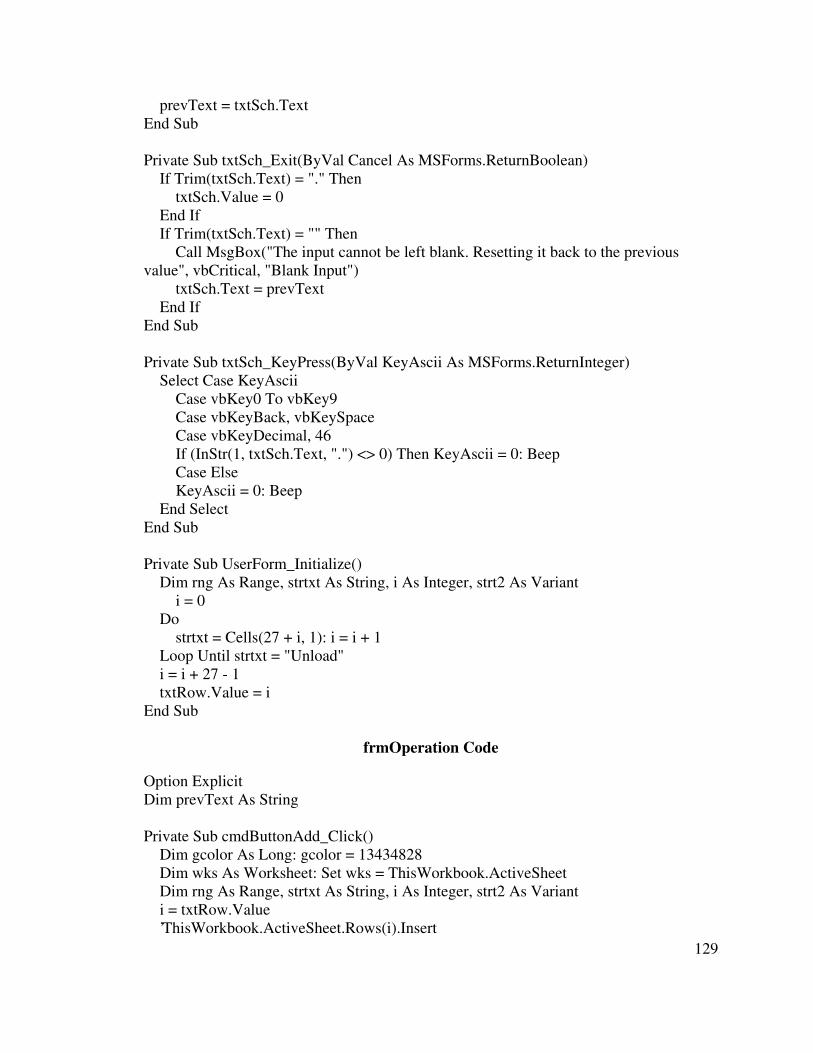
129
prevText = txtSch.TextEnd Sub
Private Sub txtSch_Exit(ByVal Cancel As MSForms.ReturnBoolean) If Trim(txtSch.Text) = "." Then txtSch.Value = 0 End If If Trim(txtSch.Text) = "" Then Call MsgBox("The input cannot be left blank. Resetting it back to the previousvalue", vbCritical, "Blank Input") txtSch.Text = prevText End IfEnd Sub
Private Sub txtSch_KeyPress(ByVal KeyAscii As MSForms.ReturnInteger) Select Case KeyAscii Case vbKey0 To vbKey9 Case vbKeyBack, vbKeySpace Case vbKeyDecimal, 46 If (InStr(1, txtSch.Text, ".") <> 0) Then KeyAscii = 0: Beep Case Else KeyAscii = 0: Beep End SelectEnd Sub
Private Sub UserForm_Initialize() Dim rng As Range, strtxt As String, i As Integer, strt2 As Variant i = 0 Do strtxt = Cells(27 + i, 1): i = i + 1 Loop Until strtxt = "Unload" i = i + 27 - 1 txtRow.Value = iEnd Sub
frmOperation Code
Option ExplicitDim prevText As String
Private Sub cmdButtonAdd_Click() Dim gcolor As Long: gcolor = 13434828 Dim wks As Worksheet: Set wks = ThisWorkbook.ActiveSheet Dim rng As Range, strtxt As String, i As Integer, strt2 As Variant i = txtRow.Value ’ThisWorkbook.ActiveSheet.Rows(i).Insert
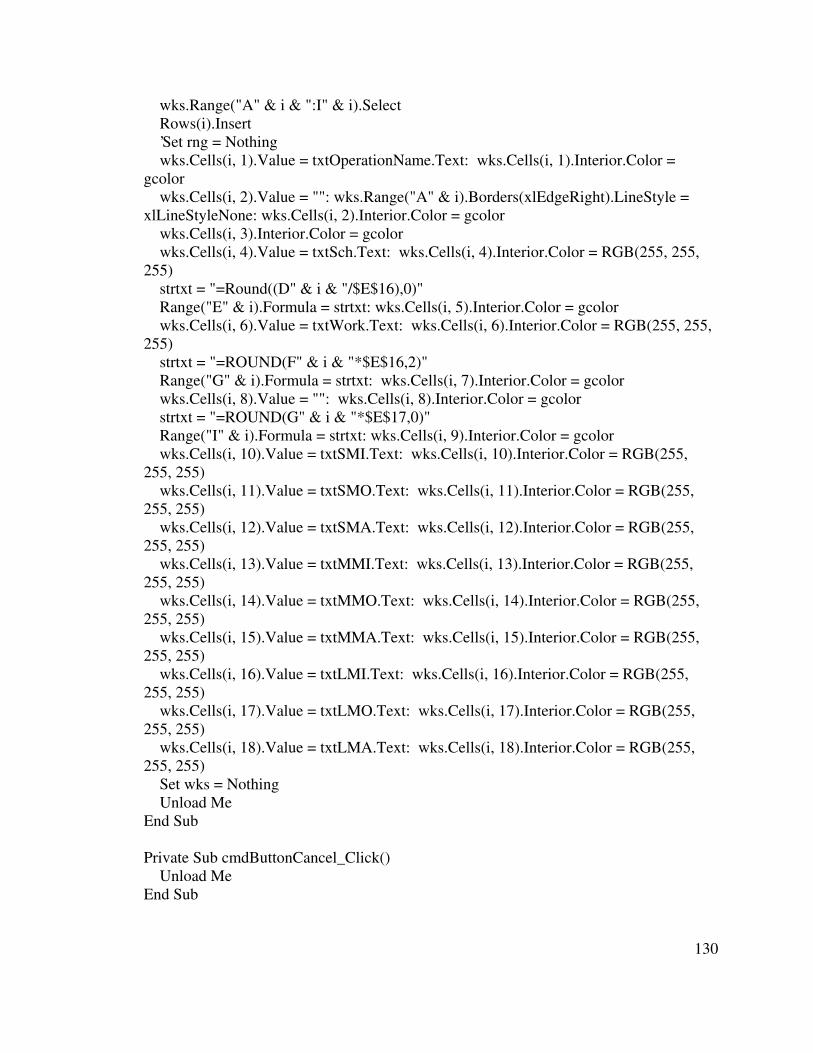
130
wks.Range("A" & i & ":I" & i).Select Rows(i).Insert ’Set rng = Nothing wks.Cells(i, 1).Value = txtOperationName.Text: wks.Cells(i, 1).Interior.Color =gcolor wks.Cells(i, 2).Value = "": wks.Range("A" & i).Borders(xlEdgeRight).LineStyle =xlLineStyleNone: wks.Cells(i, 2).Interior.Color = gcolor wks.Cells(i, 3).Interior.Color = gcolor wks.Cells(i, 4).Value = txtSch.Text: wks.Cells(i, 4).Interior.Color = RGB(255, 255,255) strtxt = "=Round((D" & i & "/$E$16),0)" Range("E" & i).Formula = strtxt: wks.Cells(i, 5).Interior.Color = gcolor wks.Cells(i, 6).Value = txtWork.Text: wks.Cells(i, 6).Interior.Color = RGB(255, 255,255) strtxt = "=ROUND(F" & i & "*$E$16,2)" Range("G" & i).Formula = strtxt: wks.Cells(i, 7).Interior.Color = gcolor wks.Cells(i, 8).Value = "": wks.Cells(i, 8).Interior.Color = gcolor strtxt = "=ROUND(G" & i & "*$E$17,0)" Range("I" & i).Formula = strtxt: wks.Cells(i, 9).Interior.Color = gcolor wks.Cells(i, 10).Value = txtSMI.Text: wks.Cells(i, 10).Interior.Color = RGB(255,255, 255) wks.Cells(i, 11).Value = txtSMO.Text: wks.Cells(i, 11).Interior.Color = RGB(255,255, 255) wks.Cells(i, 12).Value = txtSMA.Text: wks.Cells(i, 12).Interior.Color = RGB(255,255, 255) wks.Cells(i, 13).Value = txtMMI.Text: wks.Cells(i, 13).Interior.Color = RGB(255,255, 255) wks.Cells(i, 14).Value = txtMMO.Text: wks.Cells(i, 14).Interior.Color = RGB(255,255, 255) wks.Cells(i, 15).Value = txtMMA.Text: wks.Cells(i, 15).Interior.Color = RGB(255,255, 255) wks.Cells(i, 16).Value = txtLMI.Text: wks.Cells(i, 16).Interior.Color = RGB(255,255, 255) wks.Cells(i, 17).Value = txtLMO.Text: wks.Cells(i, 17).Interior.Color = RGB(255,255, 255) wks.Cells(i, 18).Value = txtLMA.Text: wks.Cells(i, 18).Interior.Color = RGB(255,255, 255) Set wks = Nothing Unload MeEnd Sub
Private Sub cmdButtonCancel_Click() Unload MeEnd Sub
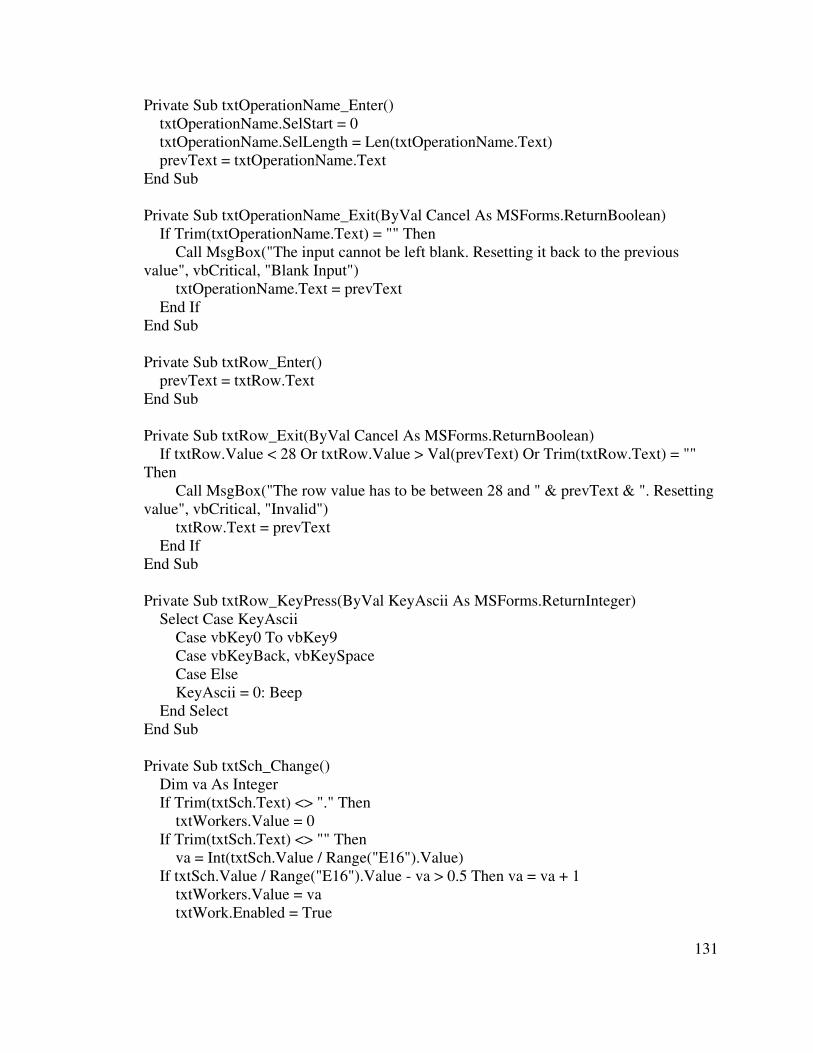
131
Private Sub txtOperationName_Enter() txtOperationName.SelStart = 0 txtOperationName.SelLength = Len(txtOperationName.Text) prevText = txtOperationName.TextEnd Sub
Private Sub txtOperationName_Exit(ByVal Cancel As MSForms.ReturnBoolean) If Trim(txtOperationName.Text) = "" Then Call MsgBox("The input cannot be left blank. Resetting it back to the previousvalue", vbCritical, "Blank Input") txtOperationName.Text = prevText End IfEnd Sub
Private Sub txtRow_Enter() prevText = txtRow.TextEnd Sub
Private Sub txtRow_Exit(ByVal Cancel As MSForms.ReturnBoolean) If txtRow.Value < 28 Or txtRow.Value > Val(prevText) Or Trim(txtRow.Text) = ""Then Call MsgBox("The row value has to be between 28 and " & prevText & ". Resettingvalue", vbCritical, "Invalid") txtRow.Text = prevText End IfEnd Sub
Private Sub txtRow_KeyPress(ByVal KeyAscii As MSForms.ReturnInteger) Select Case KeyAscii Case vbKey0 To vbKey9 Case vbKeyBack, vbKeySpace Case Else KeyAscii = 0: Beep End SelectEnd Sub
Private Sub txtSch_Change() Dim va As Integer If Trim(txtSch.Text) <> "." Then txtWorkers.Value = 0 If Trim(txtSch.Text) <> "" Then va = Int(txtSch.Value / Range("E16").Value) If txtSch.Value / Range("E16").Value - va > 0.5 Then va = va + 1 txtWorkers.Value = va txtWork.Enabled = True
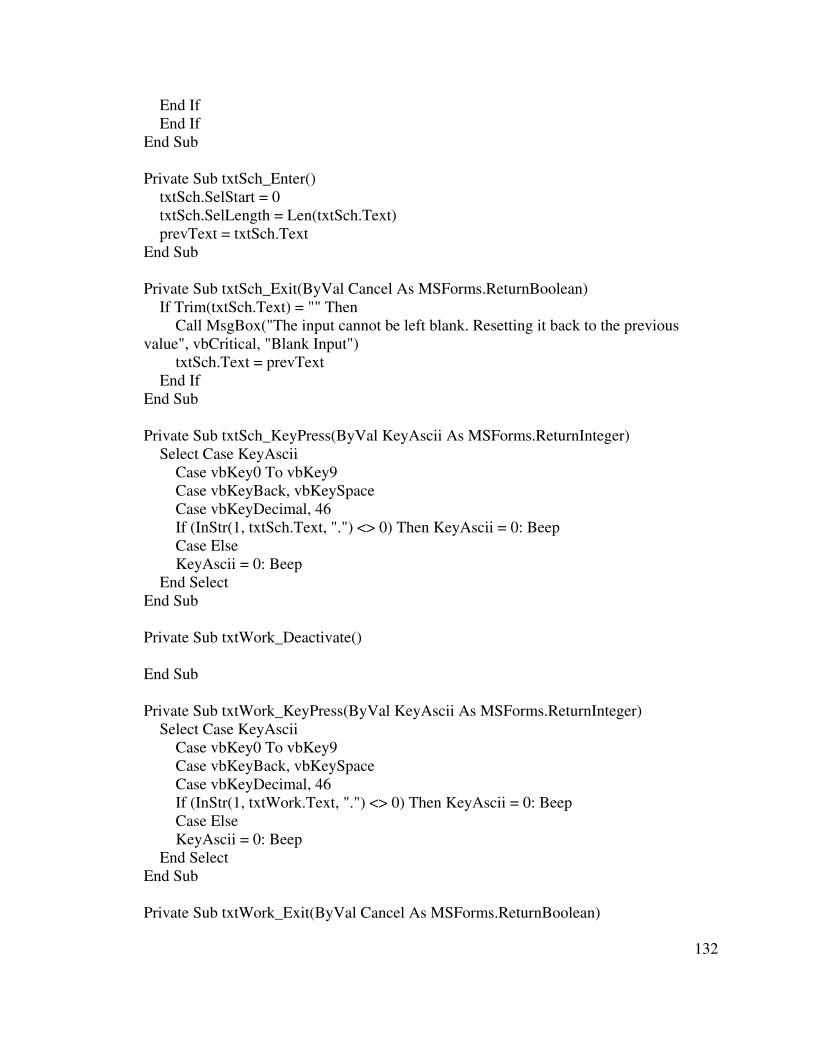
132
End If End IfEnd Sub
Private Sub txtSch_Enter() txtSch.SelStart = 0 txtSch.SelLength = Len(txtSch.Text) prevText = txtSch.TextEnd Sub
Private Sub txtSch_Exit(ByVal Cancel As MSForms.ReturnBoolean) If Trim(txtSch.Text) = "" Then Call MsgBox("The input cannot be left blank. Resetting it back to the previousvalue", vbCritical, "Blank Input") txtSch.Text = prevText End IfEnd Sub
Private Sub txtSch_KeyPress(ByVal KeyAscii As MSForms.ReturnInteger) Select Case KeyAscii Case vbKey0 To vbKey9 Case vbKeyBack, vbKeySpace Case vbKeyDecimal, 46 If (InStr(1, txtSch.Text, ".") <> 0) Then KeyAscii = 0: Beep Case Else KeyAscii = 0: Beep End SelectEnd Sub
Private Sub txtWork_Deactivate()
End Sub
Private Sub txtWork_KeyPress(ByVal KeyAscii As MSForms.ReturnInteger) Select Case KeyAscii Case vbKey0 To vbKey9 Case vbKeyBack, vbKeySpace Case vbKeyDecimal, 46 If (InStr(1, txtWork.Text, ".") <> 0) Then KeyAscii = 0: Beep Case Else KeyAscii = 0: Beep End SelectEnd Sub
Private Sub txtWork_Exit(ByVal Cancel As MSForms.ReturnBoolean)
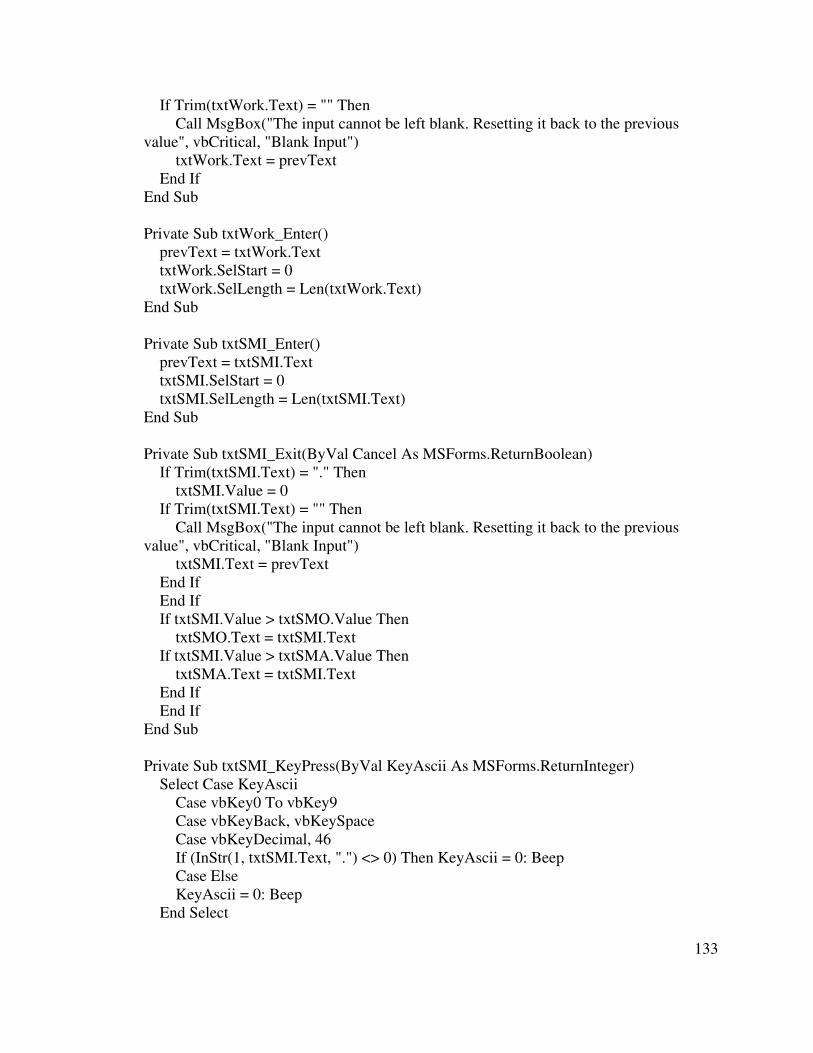
133
If Trim(txtWork.Text) = "" Then Call MsgBox("The input cannot be left blank. Resetting it back to the previousvalue", vbCritical, "Blank Input") txtWork.Text = prevText End IfEnd Sub
Private Sub txtWork_Enter() prevText = txtWork.Text txtWork.SelStart = 0 txtWork.SelLength = Len(txtWork.Text)End Sub
Private Sub txtSMI_Enter() prevText = txtSMI.Text txtSMI.SelStart = 0 txtSMI.SelLength = Len(txtSMI.Text)End Sub
Private Sub txtSMI_Exit(ByVal Cancel As MSForms.ReturnBoolean) If Trim(txtSMI.Text) = "." Then txtSMI.Value = 0 If Trim(txtSMI.Text) = "" Then Call MsgBox("The input cannot be left blank. Resetting it back to the previousvalue", vbCritical, "Blank Input") txtSMI.Text = prevText End If End If If txtSMI.Value > txtSMO.Value Then txtSMO.Text = txtSMI.Text If txtSMI.Value > txtSMA.Value Then txtSMA.Text = txtSMI.Text End If End IfEnd Sub
Private Sub txtSMI_KeyPress(ByVal KeyAscii As MSForms.ReturnInteger) Select Case KeyAscii Case vbKey0 To vbKey9 Case vbKeyBack, vbKeySpace Case vbKeyDecimal, 46 If (InStr(1, txtSMI.Text, ".") <> 0) Then KeyAscii = 0: Beep Case Else KeyAscii = 0: Beep End Select
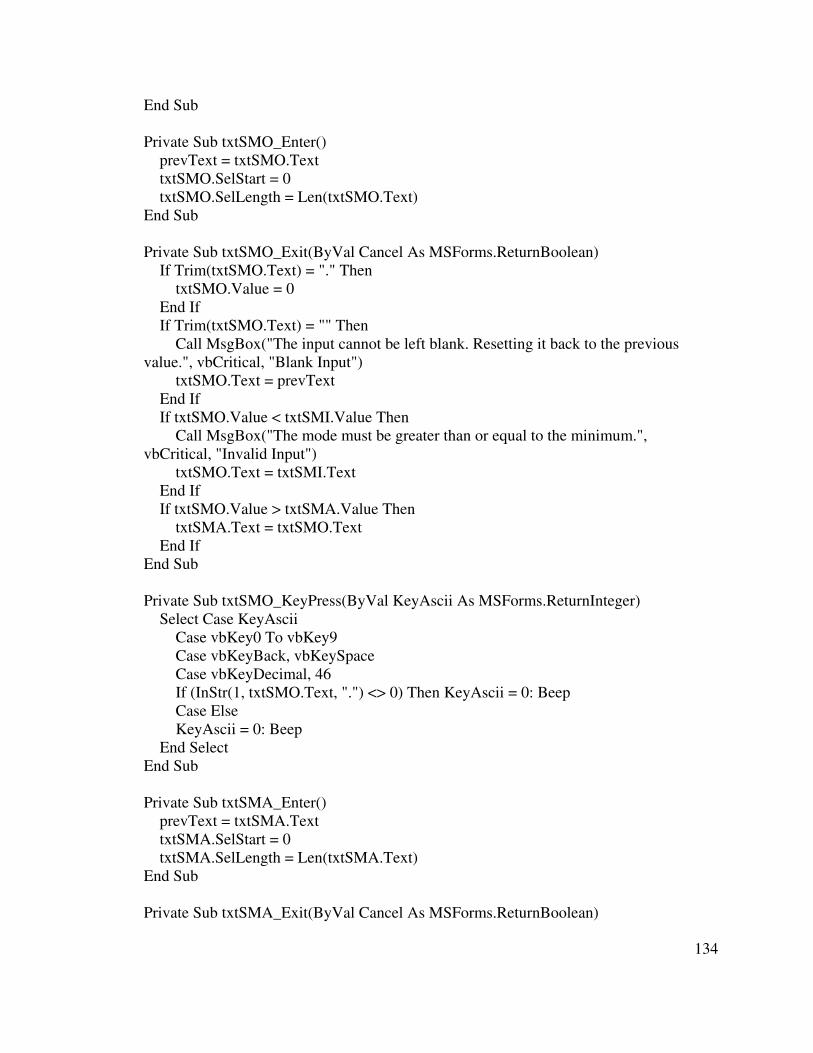
134
End Sub
Private Sub txtSMO_Enter() prevText = txtSMO.Text txtSMO.SelStart = 0 txtSMO.SelLength = Len(txtSMO.Text)End Sub
Private Sub txtSMO_Exit(ByVal Cancel As MSForms.ReturnBoolean) If Trim(txtSMO.Text) = "." Then txtSMO.Value = 0 End If If Trim(txtSMO.Text) = "" Then Call MsgBox("The input cannot be left blank. Resetting it back to the previousvalue.", vbCritical, "Blank Input") txtSMO.Text = prevText End If If txtSMO.Value < txtSMI.Value Then Call MsgBox("The mode must be greater than or equal to the minimum.",vbCritical, "Invalid Input") txtSMO.Text = txtSMI.Text End If If txtSMO.Value > txtSMA.Value Then txtSMA.Text = txtSMO.Text End IfEnd Sub
Private Sub txtSMO_KeyPress(ByVal KeyAscii As MSForms.ReturnInteger) Select Case KeyAscii Case vbKey0 To vbKey9 Case vbKeyBack, vbKeySpace Case vbKeyDecimal, 46 If (InStr(1, txtSMO.Text, ".") <> 0) Then KeyAscii = 0: Beep Case Else KeyAscii = 0: Beep End SelectEnd Sub
Private Sub txtSMA_Enter() prevText = txtSMA.Text txtSMA.SelStart = 0 txtSMA.SelLength = Len(txtSMA.Text)End Sub
Private Sub txtSMA_Exit(ByVal Cancel As MSForms.ReturnBoolean)
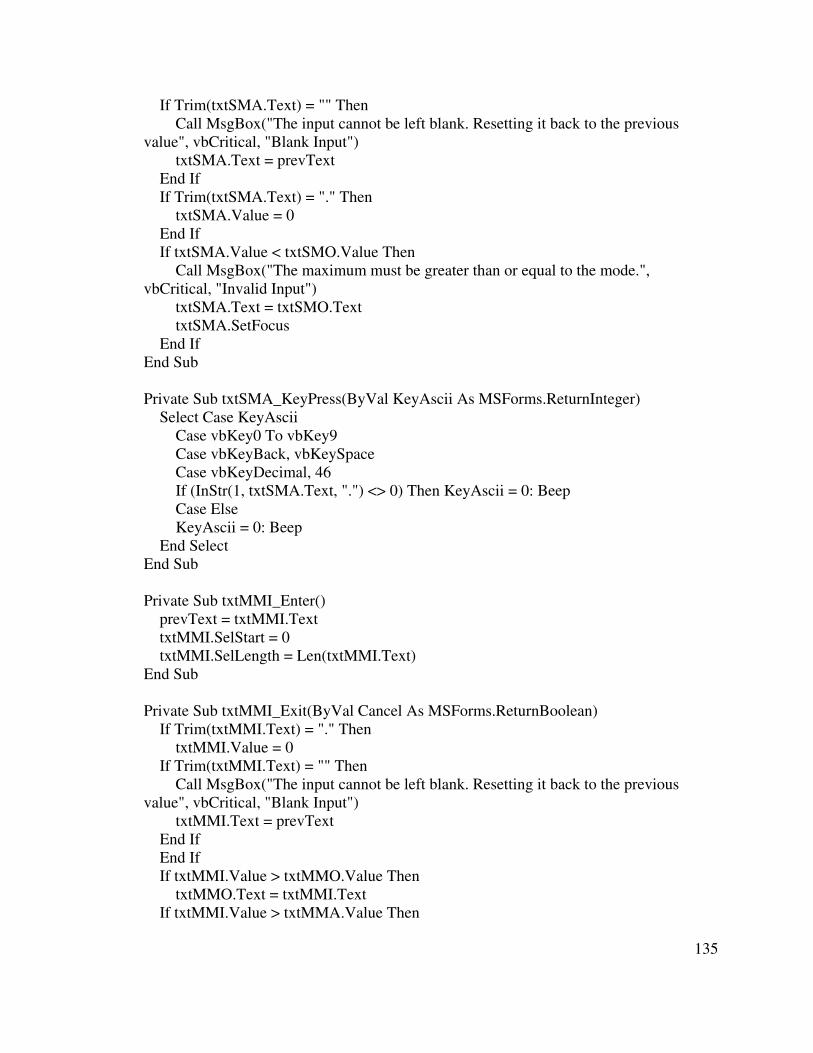
135
If Trim(txtSMA.Text) = "" Then Call MsgBox("The input cannot be left blank. Resetting it back to the previousvalue", vbCritical, "Blank Input") txtSMA.Text = prevText End If If Trim(txtSMA.Text) = "." Then txtSMA.Value = 0 End If If txtSMA.Value < txtSMO.Value Then Call MsgBox("The maximum must be greater than or equal to the mode.",vbCritical, "Invalid Input") txtSMA.Text = txtSMO.Text txtSMA.SetFocus End IfEnd Sub
Private Sub txtSMA_KeyPress(ByVal KeyAscii As MSForms.ReturnInteger) Select Case KeyAscii Case vbKey0 To vbKey9 Case vbKeyBack, vbKeySpace Case vbKeyDecimal, 46 If (InStr(1, txtSMA.Text, ".") <> 0) Then KeyAscii = 0: Beep Case Else KeyAscii = 0: Beep End SelectEnd Sub
Private Sub txtMMI_Enter() prevText = txtMMI.Text txtMMI.SelStart = 0 txtMMI.SelLength = Len(txtMMI.Text)End Sub
Private Sub txtMMI_Exit(ByVal Cancel As MSForms.ReturnBoolean) If Trim(txtMMI.Text) = "." Then txtMMI.Value = 0 If Trim(txtMMI.Text) = "" Then Call MsgBox("The input cannot be left blank. Resetting it back to the previousvalue", vbCritical, "Blank Input") txtMMI.Text = prevText End If End If If txtMMI.Value > txtMMO.Value Then txtMMO.Text = txtMMI.Text If txtMMI.Value > txtMMA.Value Then
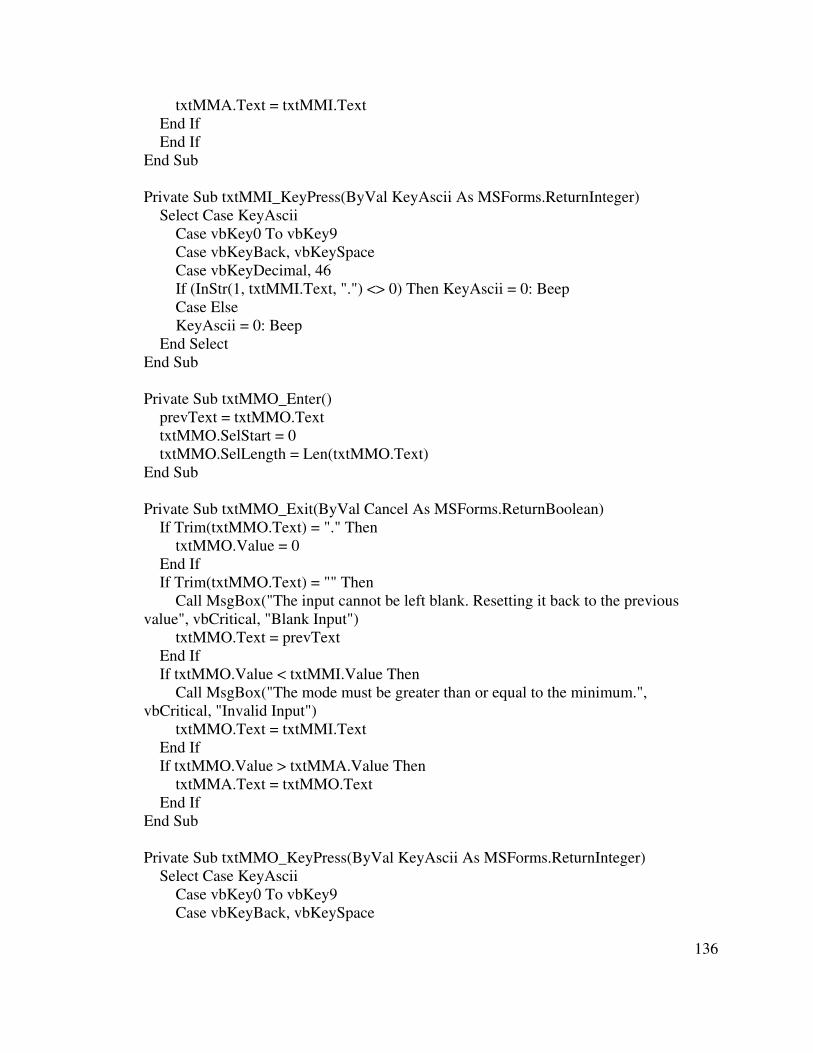
136
txtMMA.Text = txtMMI.Text End If End IfEnd Sub
Private Sub txtMMI_KeyPress(ByVal KeyAscii As MSForms.ReturnInteger) Select Case KeyAscii Case vbKey0 To vbKey9 Case vbKeyBack, vbKeySpace Case vbKeyDecimal, 46 If (InStr(1, txtMMI.Text, ".") <> 0) Then KeyAscii = 0: Beep Case Else KeyAscii = 0: Beep End SelectEnd Sub
Private Sub txtMMO_Enter() prevText = txtMMO.Text txtMMO.SelStart = 0 txtMMO.SelLength = Len(txtMMO.Text)End Sub
Private Sub txtMMO_Exit(ByVal Cancel As MSForms.ReturnBoolean) If Trim(txtMMO.Text) = "." Then txtMMO.Value = 0 End If If Trim(txtMMO.Text) = "" Then Call MsgBox("The input cannot be left blank. Resetting it back to the previousvalue", vbCritical, "Blank Input") txtMMO.Text = prevText End If If txtMMO.Value < txtMMI.Value Then Call MsgBox("The mode must be greater than or equal to the minimum.",vbCritical, "Invalid Input") txtMMO.Text = txtMMI.Text End If If txtMMO.Value > txtMMA.Value Then txtMMA.Text = txtMMO.Text End IfEnd Sub
Private Sub txtMMO_KeyPress(ByVal KeyAscii As MSForms.ReturnInteger) Select Case KeyAscii Case vbKey0 To vbKey9 Case vbKeyBack, vbKeySpace
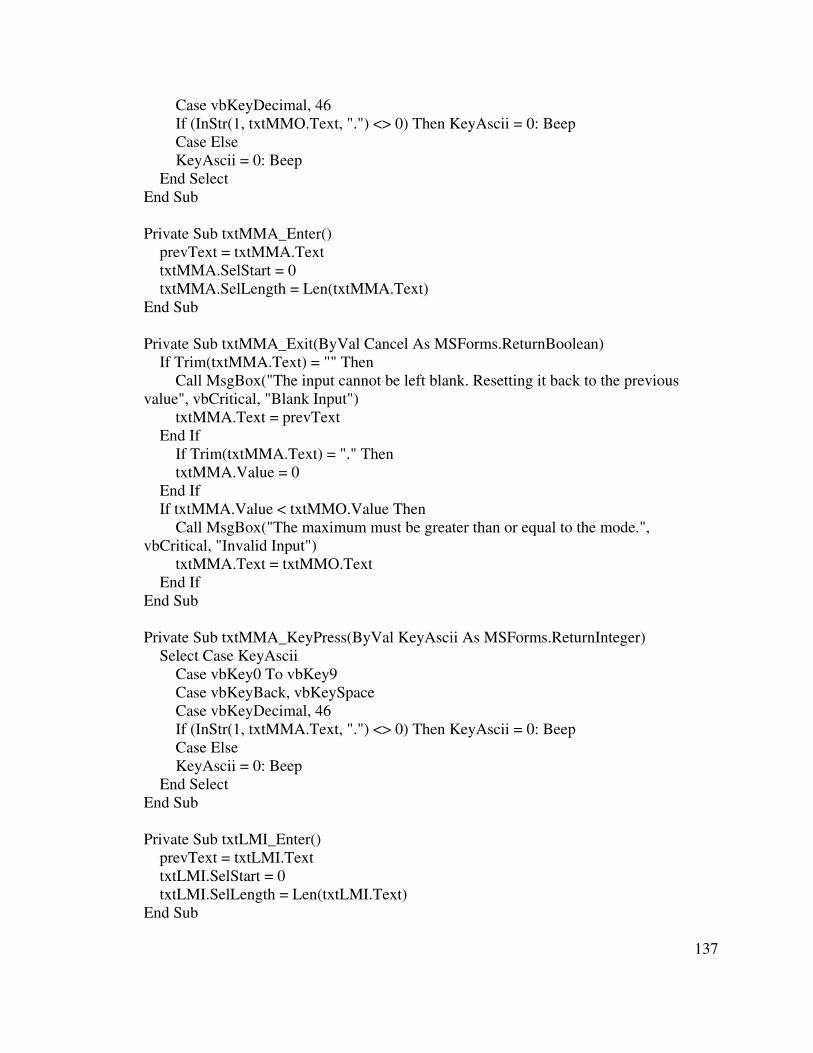
137
Case vbKeyDecimal, 46 If (InStr(1, txtMMO.Text, ".") <> 0) Then KeyAscii = 0: Beep Case Else KeyAscii = 0: Beep End SelectEnd Sub
Private Sub txtMMA_Enter() prevText = txtMMA.Text txtMMA.SelStart = 0 txtMMA.SelLength = Len(txtMMA.Text)End Sub
Private Sub txtMMA_Exit(ByVal Cancel As MSForms.ReturnBoolean) If Trim(txtMMA.Text) = "" Then Call MsgBox("The input cannot be left blank. Resetting it back to the previousvalue", vbCritical, "Blank Input") txtMMA.Text = prevText End If If Trim(txtMMA.Text) = "." Then txtMMA.Value = 0 End If If txtMMA.Value < txtMMO.Value Then Call MsgBox("The maximum must be greater than or equal to the mode.",vbCritical, "Invalid Input") txtMMA.Text = txtMMO.Text End IfEnd Sub
Private Sub txtMMA_KeyPress(ByVal KeyAscii As MSForms.ReturnInteger) Select Case KeyAscii Case vbKey0 To vbKey9 Case vbKeyBack, vbKeySpace Case vbKeyDecimal, 46 If (InStr(1, txtMMA.Text, ".") <> 0) Then KeyAscii = 0: Beep Case Else KeyAscii = 0: Beep End SelectEnd Sub
Private Sub txtLMI_Enter() prevText = txtLMI.Text txtLMI.SelStart = 0 txtLMI.SelLength = Len(txtLMI.Text)End Sub
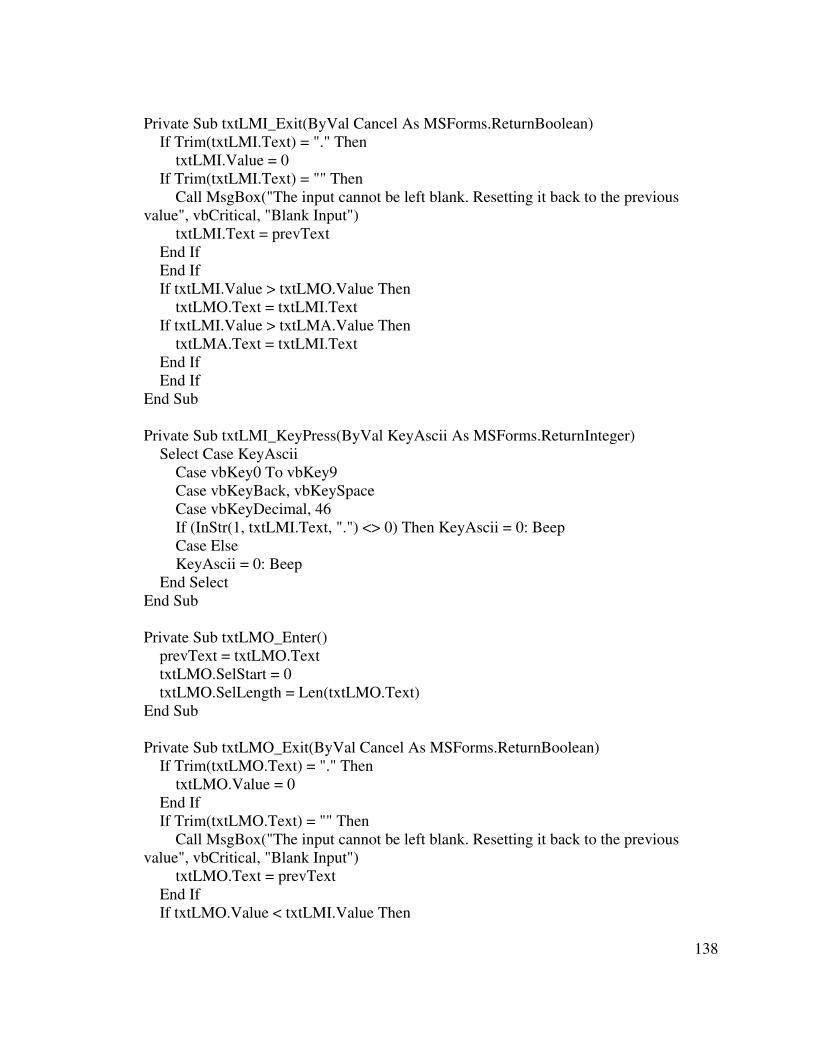
138
Private Sub txtLMI_Exit(ByVal Cancel As MSForms.ReturnBoolean) If Trim(txtLMI.Text) = "." Then txtLMI.Value = 0 If Trim(txtLMI.Text) = "" Then Call MsgBox("The input cannot be left blank. Resetting it back to the previousvalue", vbCritical, "Blank Input") txtLMI.Text = prevText End If End If If txtLMI.Value > txtLMO.Value Then txtLMO.Text = txtLMI.Text If txtLMI.Value > txtLMA.Value Then txtLMA.Text = txtLMI.Text End If End IfEnd Sub
Private Sub txtLMI_KeyPress(ByVal KeyAscii As MSForms.ReturnInteger) Select Case KeyAscii Case vbKey0 To vbKey9 Case vbKeyBack, vbKeySpace Case vbKeyDecimal, 46 If (InStr(1, txtLMI.Text, ".") <> 0) Then KeyAscii = 0: Beep Case Else KeyAscii = 0: Beep End SelectEnd Sub
Private Sub txtLMO_Enter() prevText = txtLMO.Text txtLMO.SelStart = 0 txtLMO.SelLength = Len(txtLMO.Text)End Sub
Private Sub txtLMO_Exit(ByVal Cancel As MSForms.ReturnBoolean) If Trim(txtLMO.Text) = "." Then txtLMO.Value = 0 End If If Trim(txtLMO.Text) = "" Then Call MsgBox("The input cannot be left blank. Resetting it back to the previousvalue", vbCritical, "Blank Input") txtLMO.Text = prevText End If If txtLMO.Value < txtLMI.Value Then
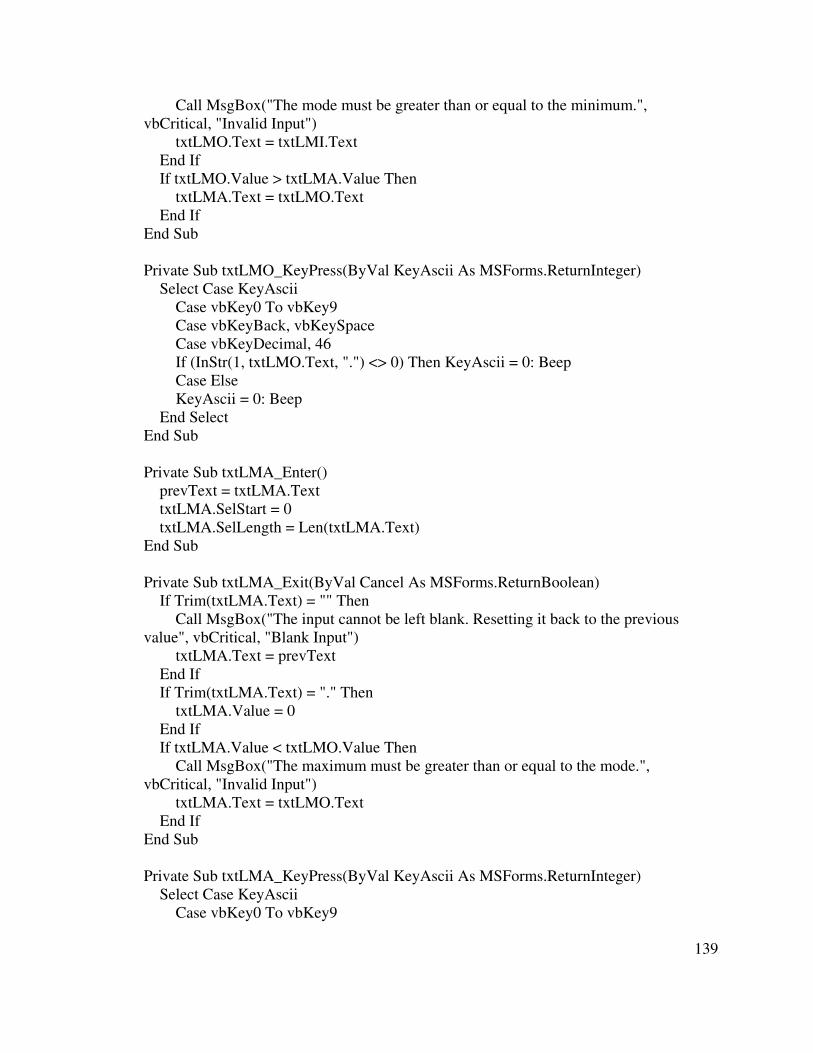
139
Call MsgBox("The mode must be greater than or equal to the minimum.",vbCritical, "Invalid Input") txtLMO.Text = txtLMI.Text End If If txtLMO.Value > txtLMA.Value Then txtLMA.Text = txtLMO.Text End IfEnd Sub
Private Sub txtLMO_KeyPress(ByVal KeyAscii As MSForms.ReturnInteger) Select Case KeyAscii Case vbKey0 To vbKey9 Case vbKeyBack, vbKeySpace Case vbKeyDecimal, 46 If (InStr(1, txtLMO.Text, ".") <> 0) Then KeyAscii = 0: Beep Case Else KeyAscii = 0: Beep End SelectEnd Sub
Private Sub txtLMA_Enter() prevText = txtLMA.Text txtLMA.SelStart = 0 txtLMA.SelLength = Len(txtLMA.Text)End Sub
Private Sub txtLMA_Exit(ByVal Cancel As MSForms.ReturnBoolean) If Trim(txtLMA.Text) = "" Then Call MsgBox("The input cannot be left blank. Resetting it back to the previousvalue", vbCritical, "Blank Input") txtLMA.Text = prevText End If If Trim(txtLMA.Text) = "." Then txtLMA.Value = 0 End If If txtLMA.Value < txtLMO.Value Then Call MsgBox("The maximum must be greater than or equal to the mode.",vbCritical, "Invalid Input") txtLMA.Text = txtLMO.Text End IfEnd Sub
Private Sub txtLMA_KeyPress(ByVal KeyAscii As MSForms.ReturnInteger) Select Case KeyAscii Case vbKey0 To vbKey9
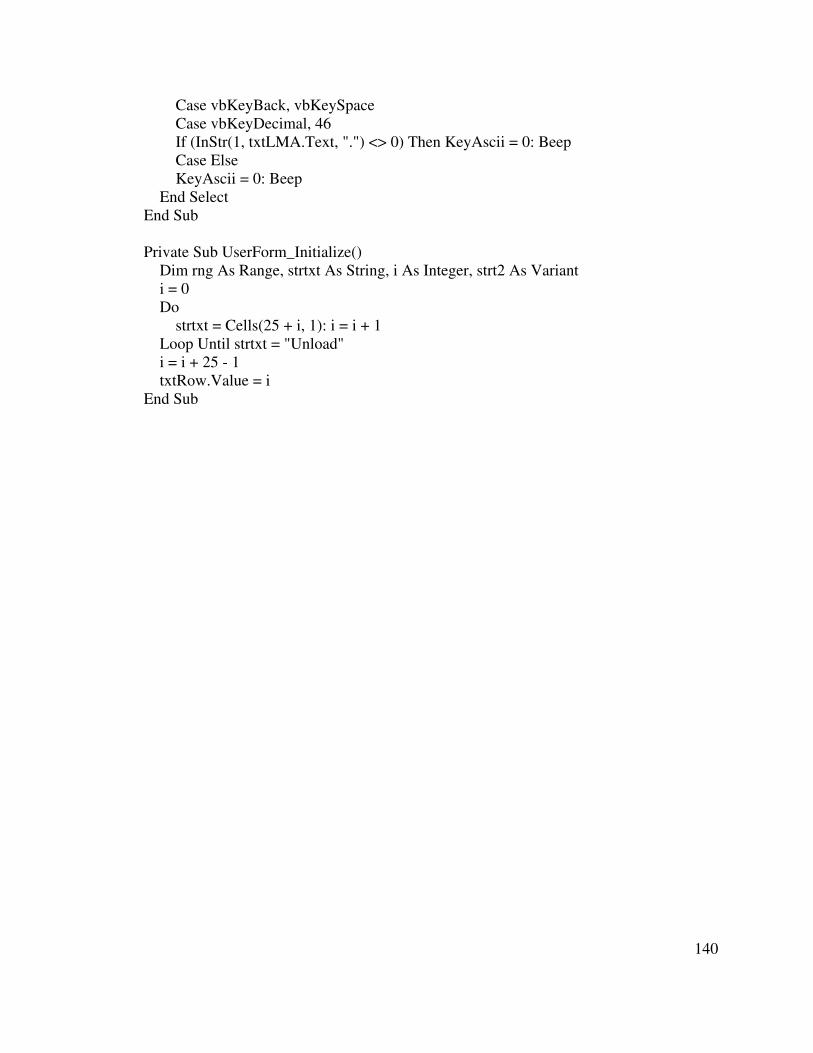
140
Case vbKeyBack, vbKeySpace Case vbKeyDecimal, 46 If (InStr(1, txtLMA.Text, ".") <> 0) Then KeyAscii = 0: Beep Case Else KeyAscii = 0: Beep End SelectEnd Sub
Private Sub UserForm_Initialize() Dim rng As Range, strtxt As String, i As Integer, strt2 As Variant i = 0 Do strtxt = Cells(25 + i, 1): i = i + 1 Loop Until strtxt = "Unload" i = i + 25 - 1 txtRow.Value = iEnd Sub

141
Appendix E
Instructions for Use
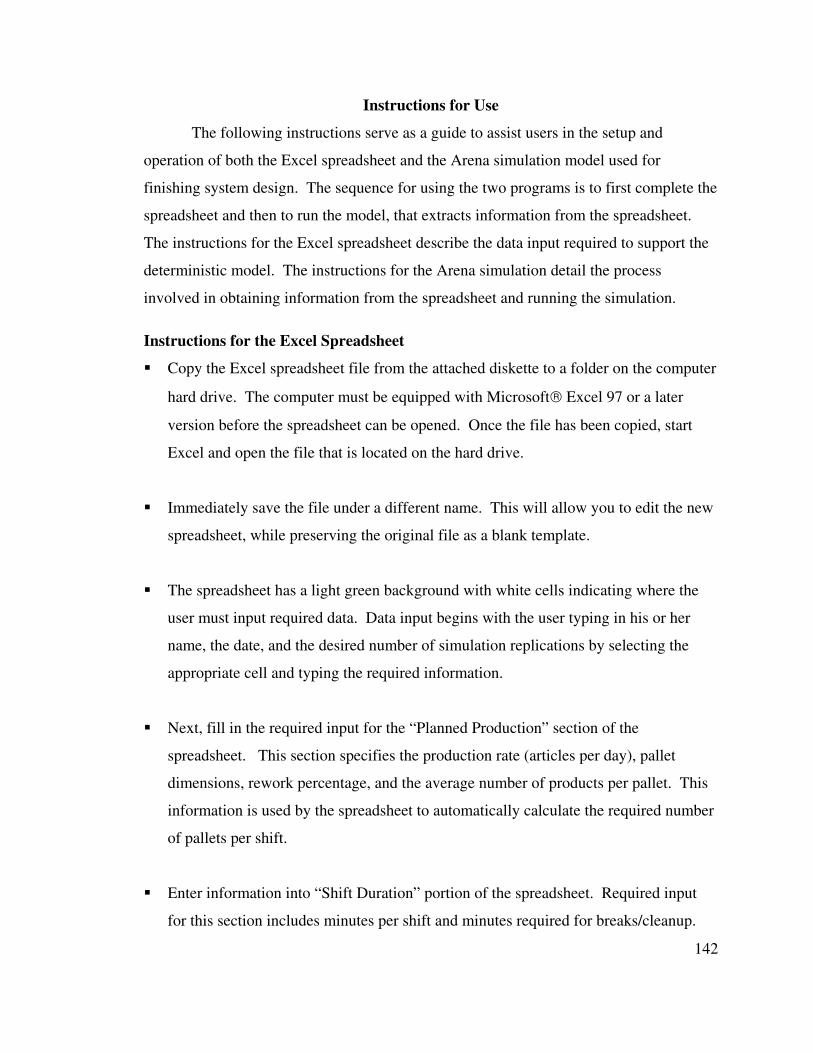
142
Instructions for Use
The following instructions serve as a guide to assist users in the setup and
operation of both the Excel spreadsheet and the Arena simulation model used for
finishing system design. The sequence for using the two programs is to first complete the
spreadsheet and then to run the model, that extracts information from the spreadsheet.
The instructions for the Excel spreadsheet describe the data input required to support the
deterministic model. The instructions for the Arena simulation detail the process
involved in obtaining information from the spreadsheet and running the simulation.
Instructions for the Excel Spreadsheet
� Copy the Excel spreadsheet file from the attached diskette to a folder on the computer
hard drive. The computer must be equipped with Microsoft Excel 97 or a later
version before the spreadsheet can be opened. Once the file has been copied, start
Excel and open the file that is located on the hard drive.
� Immediately save the file under a different name. This will allow you to edit the new
spreadsheet, while preserving the original file as a blank template.
� The spreadsheet has a light green background with white cells indicating where the
user must input required data. Data input begins with the user typing in his or her
name, the date, and the desired number of simulation replications by selecting the
appropriate cell and typing the required information.
� Next, fill in the required input for the “Planned Production” section of the
spreadsheet. This section specifies the production rate (articles per day), pallet
dimensions, rework percentage, and the average number of products per pallet. This
information is used by the spreadsheet to automatically calculate the required number
of pallets per shift.
� Enter information into “Shift Duration” portion of the spreadsheet. Required input
for this section includes minutes per shift and minutes required for breaks/cleanup.
143
This information is used to automatically calculate the available minutes per shift.
Once this is determined, the conveyor rate, normal speed, and closepac speed are
automatically calculated in the “Conveyor Specifications” portion of the spreadsheet.
� Enter the required input into the “Conveyor Specifications” portion of the
spreadsheet. This input includes the estimated return distance for the conveyor and
the percentages of times that a pallet will stay in closepac or normal mode.
� The deterministic model of the finishing schedule is built by adding finishing
operations to the spreadsheet. Since the operations load, unload, and return are a part
of every finishing line, they are included in the model by default. The input required
for the load and unload operations includes the average operation time, approximate
crew size, and a work envelope measured in number of pallets. This information is
used to create the conveyor schedule and the required work envelope. The user can
also enter the distribution parameters for the load and unload times that will be used
in the simulation model. To overwrite existing information, simply click in the
appropriate cell and enter in the correct data. There are no required inputs for the
return operation since it simply transforms the estimated return distance into minutes
based on conveyor speed.
� Other operations can be added to the finishing schedule as needed. To add an
operation that is part of the materials schedule, click on the “Add Operation” button
located under the caption “Materials Schedule.” This button will invoke a user form
that requests information about the operation to be added. The user form for the
materials schedule is illustrated in Figure F.1. The requested information includes the
operation name, the time required for this operation, and the row before which to
insert the operation. When this information has been entered, click on the “Add
Materials” button, and the operation will be added to the finishing schedule. All
operations must be placed between the load and unload operations.
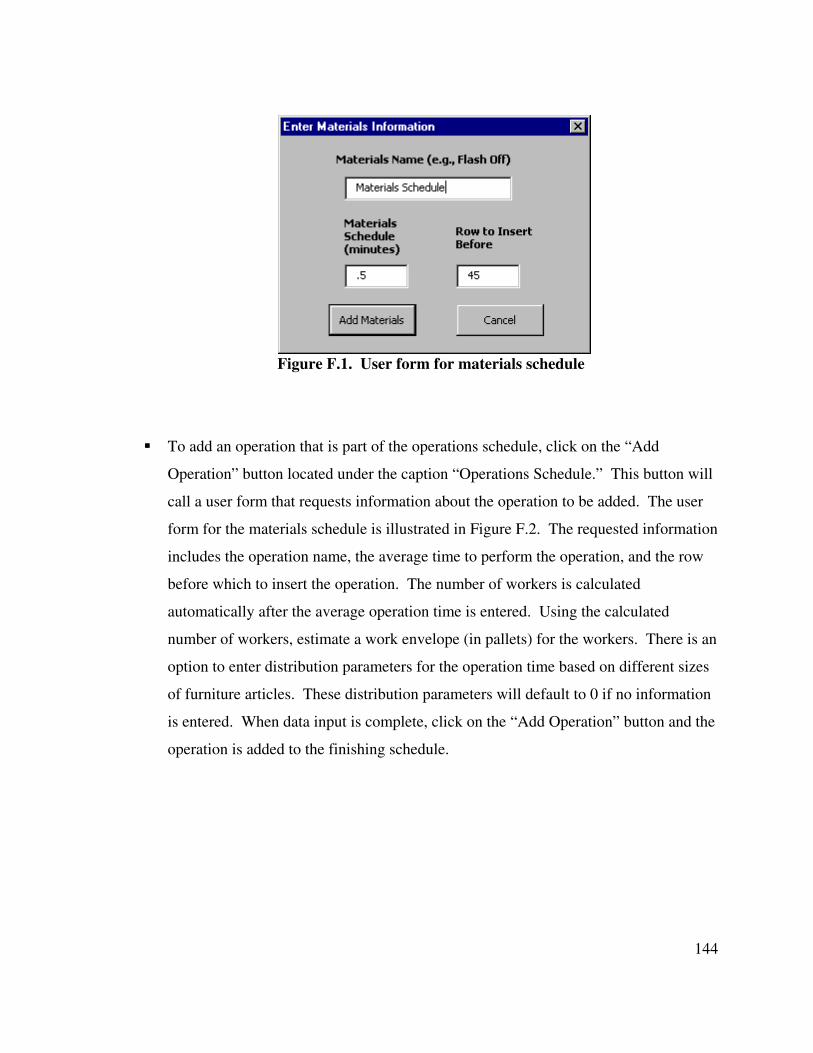
144
Figure F.1. User form for materials schedule
� To add an operation that is part of the operations schedule, click on the “Add
Operation” button located under the caption “Operations Schedule.” This button will
call a user form that requests information about the operation to be added. The user
form for the materials schedule is illustrated in Figure F.2. The requested information
includes the operation name, the average time to perform the operation, and the row
before which to insert the operation. The number of workers is calculated
automatically after the average operation time is entered. Using the calculated
number of workers, estimate a work envelope (in pallets) for the workers. There is an
option to enter distribution parameters for the operation time based on different sizes
of furniture articles. These distribution parameters will default to 0 if no information
is entered. When data input is complete, click on the “Add Operation” button and the
operation is added to the finishing schedule.
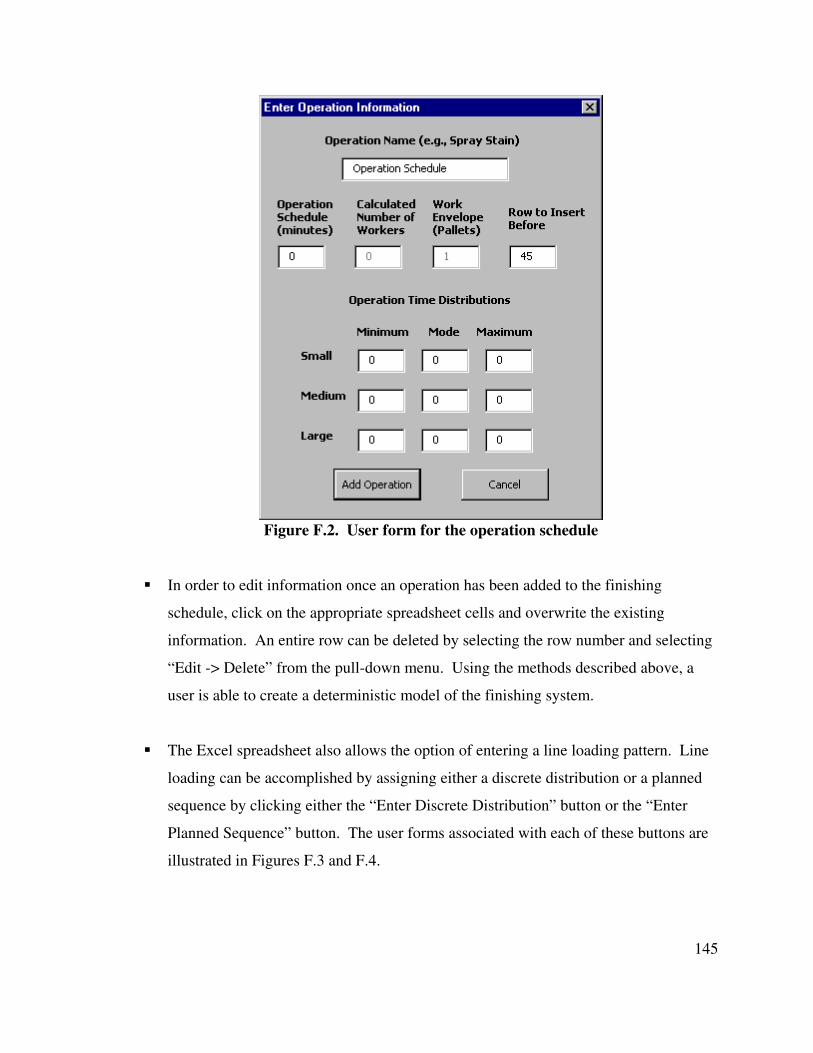
145
Figure F.2. User form for the operation schedule
� In order to edit information once an operation has been added to the finishing
schedule, click on the appropriate spreadsheet cells and overwrite the existing
information. An entire row can be deleted by selecting the row number and selecting
“Edit -> Delete” from the pull-down menu. Using the methods described above, a
user is able to create a deterministic model of the finishing system.
� The Excel spreadsheet also allows the option of entering a line loading pattern. Line
loading can be accomplished by assigning either a discrete distribution or a planned
sequence by clicking either the “Enter Discrete Distribution” button or the “Enter
Planned Sequence” button. The user forms associated with each of these buttons are
illustrated in Figures F.3 and F.4.
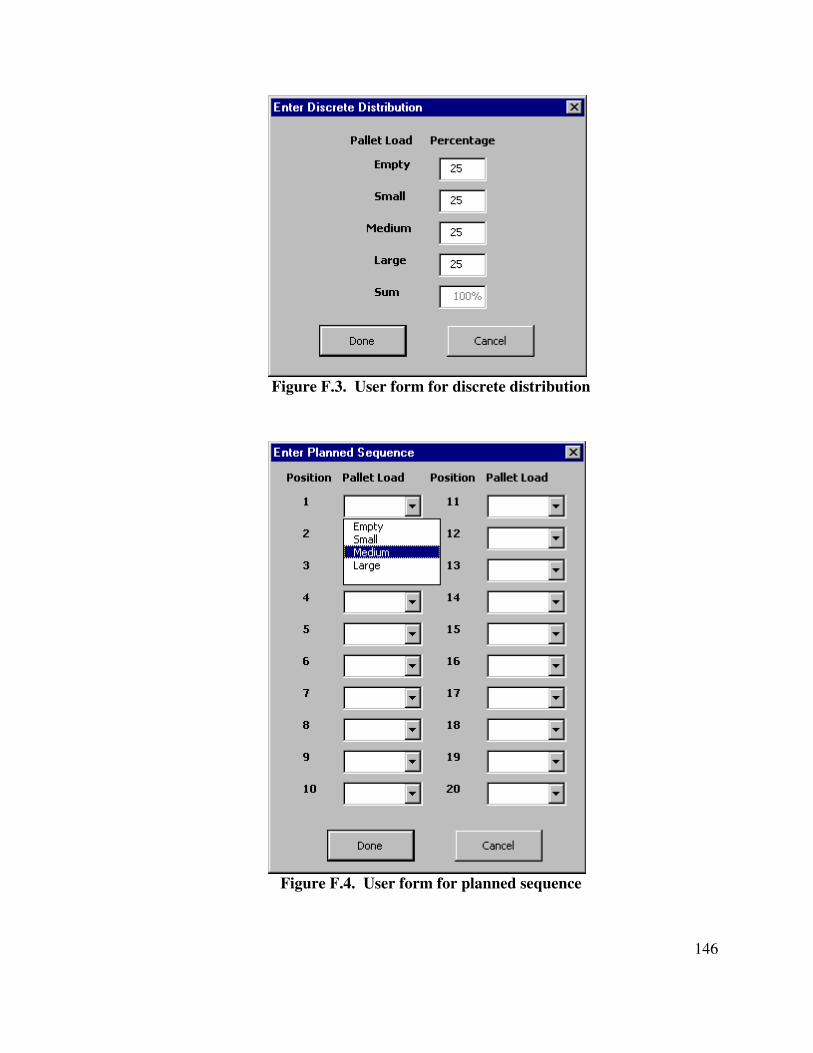
146
Figure F.3. User form for discrete distribution
Figure F.4. User form for planned sequence
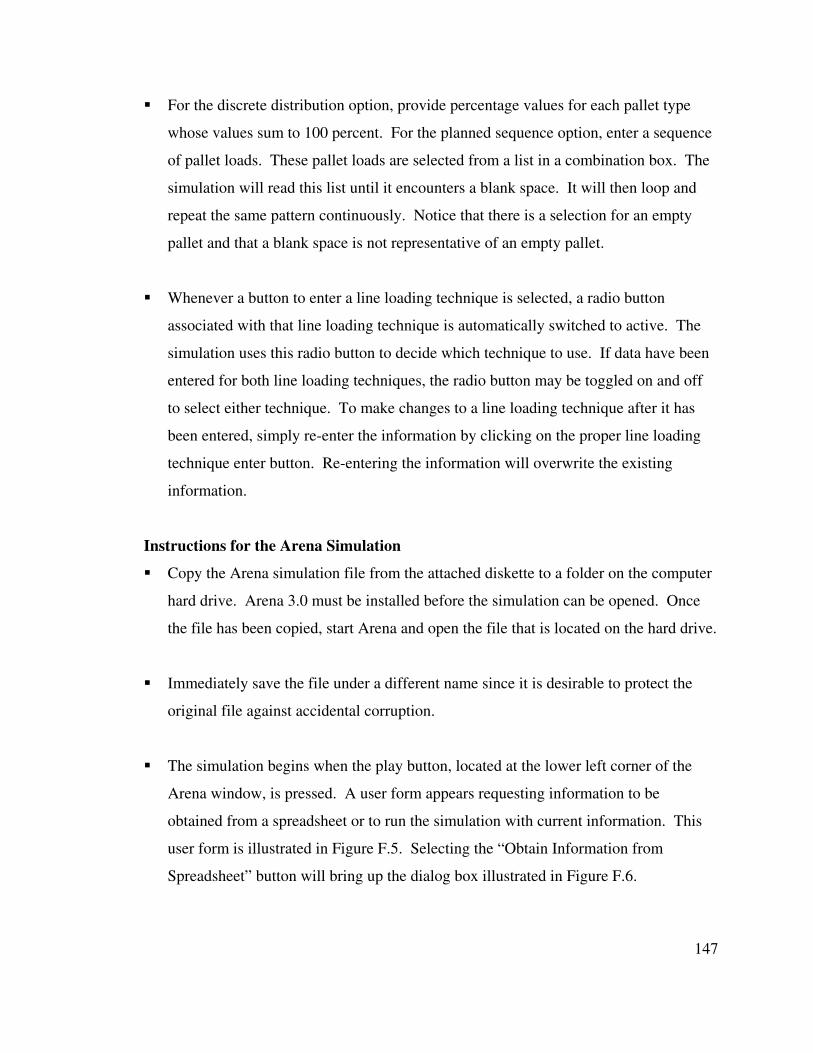
147
� For the discrete distribution option, provide percentage values for each pallet type
whose values sum to 100 percent. For the planned sequence option, enter a sequence
of pallet loads. These pallet loads are selected from a list in a combination box. The
simulation will read this list until it encounters a blank space. It will then loop and
repeat the same pattern continuously. Notice that there is a selection for an empty
pallet and that a blank space is not representative of an empty pallet.
� Whenever a button to enter a line loading technique is selected, a radio button
associated with that line loading technique is automatically switched to active. The
simulation uses this radio button to decide which technique to use. If data have been
entered for both line loading techniques, the radio button may be toggled on and off
to select either technique. To make changes to a line loading technique after it has
been entered, simply re-enter the information by clicking on the proper line loading
technique enter button. Re-entering the information will overwrite the existing
information.
Instructions for the Arena Simulation
� Copy the Arena simulation file from the attached diskette to a folder on the computer
hard drive. Arena 3.0 must be installed before the simulation can be opened. Once
the file has been copied, start Arena and open the file that is located on the hard drive.
� Immediately save the file under a different name since it is desirable to protect the
original file against accidental corruption.
� The simulation begins when the play button, located at the lower left corner of the
Arena window, is pressed. A user form appears requesting information to be
obtained from a spreadsheet or to run the simulation with current information. This
user form is illustrated in Figure F.5. Selecting the “Obtain Information from
Spreadsheet” button will bring up the dialog box illustrated in Figure F.6.
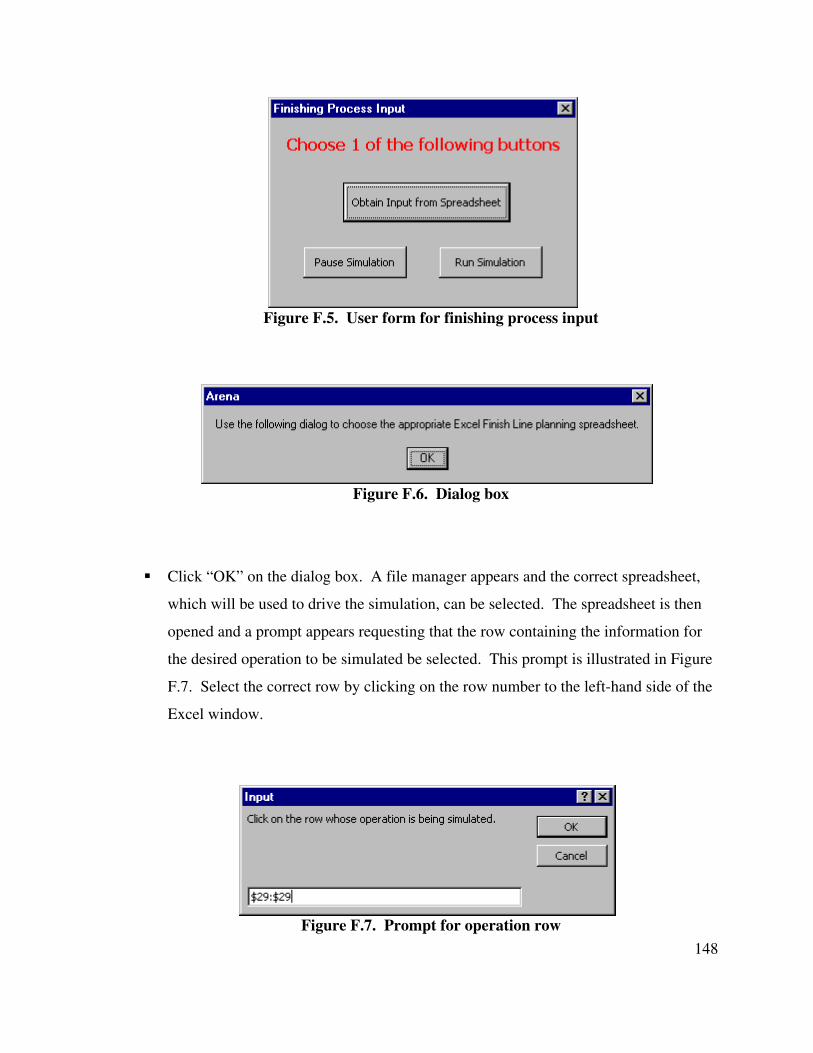
148
Figure F.5. User form for finishing process input
Figure F.6. Dialog box
� Click “OK” on the dialog box. A file manager appears and the correct spreadsheet,
which will be used to drive the simulation, can be selected. The spreadsheet is then
opened and a prompt appears requesting that the row containing the information for
the desired operation to be simulated be selected. This prompt is illustrated in Figure
F.7. Select the correct row by clicking on the row number to the left-hand side of the
Excel window.
Figure F.7. Prompt for operation row
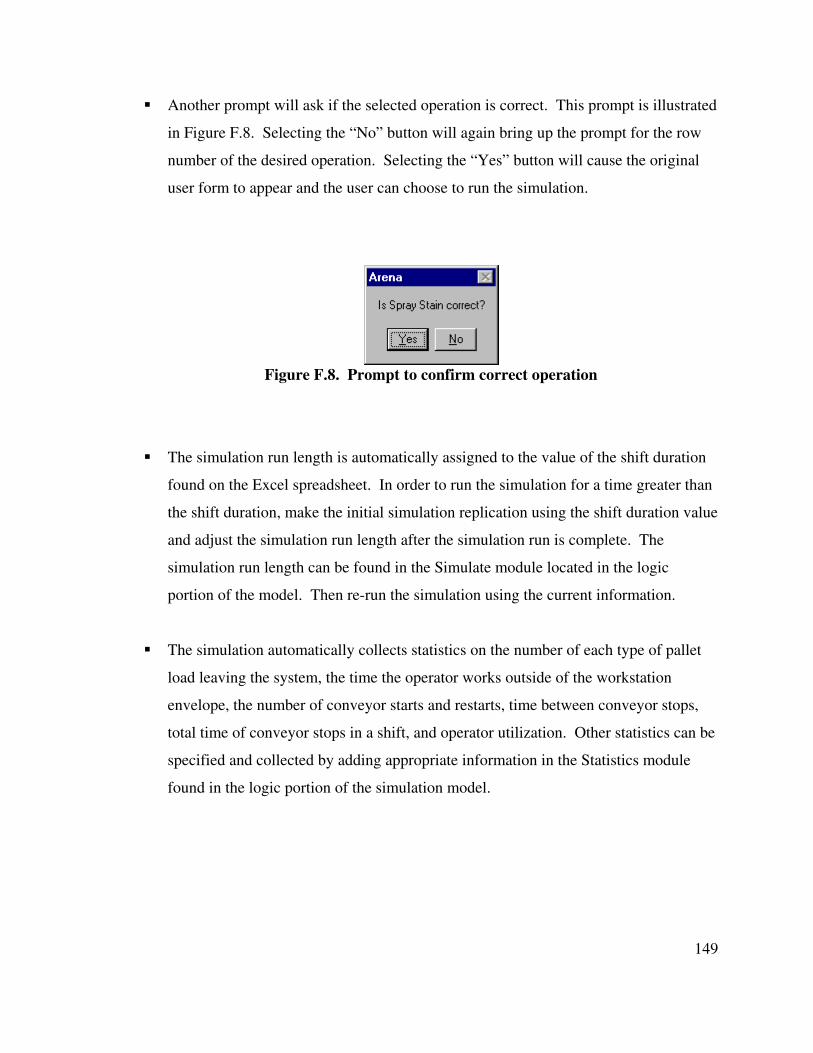
149
� Another prompt will ask if the selected operation is correct. This prompt is illustrated
in Figure F.8. Selecting the “No” button will again bring up the prompt for the row
number of the desired operation. Selecting the “Yes” button will cause the original
user form to appear and the user can choose to run the simulation.
Figure F.8. Prompt to confirm correct operation
� The simulation run length is automatically assigned to the value of the shift duration
found on the Excel spreadsheet. In order to run the simulation for a time greater than
the shift duration, make the initial simulation replication using the shift duration value
and adjust the simulation run length after the simulation run is complete. The
simulation run length can be found in the Simulate module located in the logic
portion of the model. Then re-run the simulation using the current information.
� The simulation automatically collects statistics on the number of each type of pallet
load leaving the system, the time the operator works outside of the workstation
envelope, the number of conveyor starts and restarts, time between conveyor stops,
total time of conveyor stops in a shift, and operator utilization. Other statistics can be
specified and collected by adding appropriate information in the Statistics module
found in the logic portion of the simulation model.
150
Instructions for the Output Analyzer
� The Output Analyzer can be used to view statistics that are averaged across all
simulation replications. Start the Output Analyzer by selecting “Tools -> Output
Analyzer” from the Arena pull-down menu.
� Create a new output file by selecting “File -> New” from the Output Analyzer pull-
down menu.
� Add data files to the output file by selecting the “Add...” button in the output file
screen. Selecting this button will bring up a file manager, and the appropriate data
file can be selected. The data file names are specified in the “Outputs” section of the
Statistics module. Save the output file after all desired data files have been added.
� Create confidence intervals for the data files by selecting the confidence interval
button in the Output Analyzer screen. This brings up a confidence interval screen
where data files can be loaded. Load desired data files by selecting the “Add...”
button from the confidence interval screen. Be sure to specify all data files as
“Lumped” in order to average statistics across all replications. Once all data files
have been loaded, select “OK” to create the confidence intervals.
Instructions for Iterative Process
� After the results of the simulation have been reviewed, an analysis can be made on
the finishing operation. Experiment with different parameters and input values to
determine if a more efficient operation can be achieved. A good example of this is to
stagger the line loading technique using a planned sequence. If it is obvious that large
articles of furniture result in a heavy workload, re-simulate the operation using an
assigned line loading pattern so that an empty pallet is placed after each pallet
carrying a large piece of furniture. This allows the operator a chance to recover from
the heavy workload required of him by the large furniture articles. System analysis
and adjustments such as this give the user the ability to continuously improve the
operations of the finishing system.
151
Instructions for Visual Verification
� It is recommended that the animation be observed for an initial simulation replication
for each iteration step. The animation provides an illustration that can be used for
visual verification of the model. Statistics such as workstation length, pallet counts,
and conveyor stops are all displayed in the animation view.
� The animation also allows the finishing operator’s behavior to be observed. If the
operator displays a trend of moving toward the workstation end, the workload may be
too heavy and input parameters need to be adjusted accordingly.
� Once it has been determined that the simulation is running as expected, the animation
may be turned off by selecting “Run -> Setup…” from the Arena pull-down menu
and checking the “Batch Run (No Animation)” box. The simulation is able to run
much faster with the animation turned off.