Embed Size (px)
Citation preview

Capacity Increasing in a Cellular Network Using Multibeam Antenna
Submitted by
Ifthakharul Hoque
ID: 14373001
A Project
Submitted as The Partial Fulfillment for the Degree of
Masters of Engineering in Electrical and Electronic Engineering
Department of Electrical and Electronic Engineering
Brac University
Dhaka-1212
Bangladesh
July 2016

1
Abstract
Today’s mobile subscribers have a voracious appetite for data. As smartphones flood the
wireless market, the demand for higher data throughput continues to skyrocket. As a result,
operators are searching for simple, cost-effective ways to add capacity. Timely rollout of new
3G and 4G services is key to addressing subscriber needs and protecting their reputation for
efficiency and reliability.
When operators need to add capacity, they typically build new cell sites or split sectors by
adding more antennas to existing sites. However, both options are time-consuming and
expensive.
To build new cell sites, the expense, time and effort required to deploy a new site is
significant. Deployment costs and regulatory approvals can easily delay the installation of
new sites for up to 2 years. Given these challenges, operators understand that this option is no
longer realistic.
Add more equipment to existing sites is also expensive and complex. The conversion process
overlays new technology onto older infrastructure, requiring a complete radio frequency path
to the base station for each new sector. You may also need filters, tower-mounted amplifiers
or multi-band combiners, which can cause compatibility issues and pile on the expenses.
Zoning challenges, leasing fees and extra wind load can add even more complexity to the
process.
Multi-beam antennas can give double, triple even nine times more capacity compare to
existing without adding more antennas on site.

2
Approval Sheet
We hereby verify that
Name: Ifthakharul Hoque
Student ID: 14373001
Project Title: Capacity Increasing of a Cellular Network Using Multibeam Antenna
Submission Date: July2016
_________________
Dr. Tarem Ahmed
Project Supervisor
Dept. of EEE
___________________
Ms. Sadia Kazi
External Examiner
Dept. of CSE
_____________________
Rachaen Huq
Internal Examiner
Dept. of EEE
Acknowledged
___________________
Dr. Md. Sayeed Salam
Chairperson
Dept. of EEE

1
Candidate Declaration
It is hereby declared that this project or any part of it has not been submitted elsewhere for
the award of any degree or diploma.
Author
__________________________________________________
Ifthakharul Hoque

2
Acknowledgement
I’m grateful to the almighty for directing me toward the right path in order to pursue the full
requirement of project and thesis work.
I would also like to give thanks to my project and thesis coordinator Dr. Tarem Ahmed for
his support.
At last I would like to give thanks to my family members and collegues who have supported
me during this work.

3
Table of Contents
Chapter 1: Introduction
1.1 Overview of Bangladesh Telecom Market………………………………………………7
1.2 Challenges of the Operators and Use of Multibeam Technology……..…………………9
Chapter 2: Back Ground Knowledge and Existing Solution to Meet the Data Demand
2.1 Present Technology………………..……………………………………………………..10
2.2 Planning Process and Objectives in 3G
2.2.1 Planning Process……………………………………………………………….10
2.2.2 Planning Objectives…………………………………………………………....11
2.3 Probable Solutions……………………………………………………...………………..11
2.4 Base Station Antenna
2.4.1 Antenna Selection Criteria…………………………………………………….12
2.4.2 Some Important Parameter
2.4.2.1 Antenna Gain………………………………………………………...13
2.4.2.2 Main Lobe……………………………………………………….…..13
2.4.2.3 Half Power Beam Width………………………………………….....14
2.4.2.4 Font to Back Ratio…………………………………………………..14
2.4.2.5 Side Lobe Level……………………………………………………..14
2.4.2.6 Null Filling……………………………………………………….....14
2.4.2.7 Upper Side Lobe Suppression……………………………………....15
2.5 Traditional Antenna Limitation and Capacity Solution…………………………….…..15
Chapter 3: Proposed Solution
3.1 Multi Beam Technology to Meet-up Data Growth/ Capacity Solution…………..…...17
3.1.1 Multi Beam Technology……………………………………………………..19
3.1.2 Multibeam Antenna Types and Application Cases……………………….…20
3.1.3 Comparison of Twin Beam antenna and Traditional Antenna…………..…..22

4
Chapter 4: Project Work
4.1 Background of the Project…………………………………………………….………26
4.2 Datasheet of Proposed Twin Beam Antenna and Traditional Alternative Antennas
4.2.1 Proposed Twin Beam Antenna……………………………………………..28
4.2.2 Other Alternative……………………………………………………...……29
4.3 Project Summary……………………………………………………………………..31
4.4 Project Flow Chart…………………………………………………………………....31
4.5 Responsibility Matrix……………………………………………………………...…32
4.5.1 Trial Proposal and Approval……………………………………………….32
4.5.2 Fix Up Evaluation Criteria…………………………………………………32
4.5.3 Site Selection……………………………………………………………….33
4.5.4 KPI Which Have to Be Checked……………………………………...……34
4.5.5 Pre KPI Data and Physical Data Collection………………………………..35
4.5.6 Additional RRU Installation……………………………………………..…35
4.5.7 Antenna SWAP………………………………………………………….….35
4.5.8 Post KPI Data Collection……………………………………………….......35
4.5.9 Data Analysis and Reporting…………………………………………….…35
Chapter 5: Conclusion and Future Work
5.1 Summary of the Project……………………………………………………………….40
5.2 Future Work…………………………………………………………………………..40
5.2.1 On This Particular Project…………………………………………………..40
5.2.2 Multibeam Antenna……………………………………………………...…40
5.2.2 Smart Antenna…………………………………………………………...…40

5
List of Figures
Fig 1: Bangladesh Telecom Market………………………………………………………..7
Fig 2: Internet Subscribers Chart………………………………………………………......8
Fig 3: Network Planning Procedure…………………………………………………..…..10
Fig 4: Data speed at the Edge of the Sector………………………………………………11
Fig 5: Antenna Patern…………………………………………………………………….14
Fig 6: Null Filling………………………………………………………………………...15
Fig 7: Upper Side Lobe Suppression……………………………………………………..15
Fig 8: Traditional Site Geometry………………………………………………………....16
Fig 9: How do you keep Smart Phone Users Happy?........................................................17
Fig 10: Sector Splitting…………………………………………………………………...18
Fig 11: Sector Splitting by Twin Beam………………………………………………..…19
Fig 12: Butler Matrix……………………………………………………………………..19
Fig 13: Five Beam…………………………………………………………………….…20
Fig 14: Nine Beam………………………………………………………………………..20
Fig 15: Picture of using Multi-Beam Antennas………………………………………..…21
Fig 17: Pattern Comparison of Traditional Antenna and Twin Beam Antenna……...…..22
Fig 18: Traditional 65 deg Antenna Pattern……………………………………………..22
Fig 19: Twin Beam Antenna Pattern…………………………………………………......23
Fig 20: Excellent Sidelobe Suppression……………………………………………….…23
Fig 21: Better Front to Back Ratio………………………………………………….……24
Fig 22: Sector Splitting and Twin Beam Antenna…………………………………….....26
Fig 23: Antenna Datasheet……………………………………………………………….28
Fig 24: Traditional 65deg Antenna Datasheet…………………………………………....29
Fig 25: Traditional 33deg Antenna Datasheet……………………………………….…...30
Fig 26: Project Flow Chart…………………………………………………………….....31
Fig 27: RSCP plot……………………………………………………………………......37
Fig 28: EcNo Plot………………………………………………………………………..37

6
List of Tables
Table 1: Number of Subscribers………………………………………………………….…...7
Table 2: Number of Mobile and Wimax Internet Users…………………………….….…......8
Table 3: Antenna Basic……………………………………………………………………....16
Table 4: Physical Parameter Comparison of Twin Beam and Traditional 65deg Antenna.…24
Table 5: Physical Parameter Comparison of Twin Beam and Traditional 33deg Antenna….25
Table 6: Responsibility Matrix……………………………………………………………....32
Table 7: Evaluation Criteria………………………………………………………………....33
Table 8: OSS KPI List for Site Selection…………………………………………………....33
Table 9: Pre Physical Parameter Audit……………………………………………………....36
Table 10: Post Physical Parameter Audit……………………………………………….…...36
Table 11: KPI Comparison………………………………………………………………......38
Table 12: Front to Back Ratio Comparison…………………………………………….…....38

7
Chapter 1: Introduction
1.1 Overview of Bangladesh Telecom Market:
Bangladesh is densely populated country. Present population is around 160.411 Million.
Population growth rate is 1.22. By considering number of connections, presently 75% of total
population are using mobile phone and among them only 6% is using smart phone.
Presently there are 6 mobile phone operators and 3wimax operators in Bangladesh. As
Bangladesh is a very densely populated country so the telecom market is not so small here.
Grameen phone is the leader in this market. Presently the subscribers of the mobile operators
as below.
Fig 1: Bangladesh Telecom Market
Table 1: Number of Subscribers
Sl Name Number of Subscriber
(Million)
1 Grameen Phone (GP) 56.679
2 Banglalink 32.865
3 Robi 28.317
4 Airtel 10.710
5 Teletalk 4.143
6 Citycell 1.007
41.96
25.68
21.35
6.69
3.28
Market Share of Different Operators (In Percantage)
Grameen Phone
Banglalink
Robi
Airtel
Teletalk
Citycell

8
Note: Data source BTRC, End of December 2015 report.
Now the total number of mobile phone users in Bangladesh is133.720million (Dec, 2015)
beyond this there are Wimax operators also. Except Citycell, all other operators already has
deployed 3G network.
Beside this there are a good number of mobile and wimax Internet users. Mobile internet
users’ number is increasing though wimax internet users are decreasing. Overall Internet
users’ growth rate is very promising. As per capital income of the country is increasing in a
good rate, so there are a big number of new internet users who will join to the data transfer
world within few years.
Table 2: Number of Mobile and Wimax Internet Users
Sl Types of Users Number (Million)
1 Mobile Internet 51.453
2 Wimax 0.148
Note: Data source BTRC, December 2015 report.
Grameen phone has a target to boost up their internet users number at 50milion milestone
within next few years.
Fig 2: Internet Subscribers Chart
Note: Data source BTRC(BTRC makesthis statistic by considering the people who are using internet at least
one time in last three months)
41
41.5
42
42.5
43
43.5
44
44.5
45
45.5
46
1-Jan 1-Feb 1-Mar 1-Apr 1-May
Internet Subscribers in Last 5 Months
Series 1

9
1.3 Challenges of the Operators and Solution
Now a day’s key challenge for a mobile phone operator is to meet the capacity demand.
Providing quality network in high traffic and high data demand area. As well as operators has
to keep in mind about the future readiness of the network.
10
Chapter 2: Back Ground Knowledge and Existing Solution to Meet
Data Demand
2.1 Present Technology
Third Generation (3G) radio networks are based on the code division multiple access
technology (CDMA) and are currently being installed in countries such as Japan and South
Korea. The aim of the technology is to fulfil the user requirement for innovative services such
as enhanced and multimedia messaging through high-speed data channels. CDMA is a digital
cellular technology that uses spread-spectrum techniques. It does not assign a specific
frequency to each user. Rather, every channel uses the full available spectrum. Individual
conversations are encoded with a pseudo-random digital sequence. Third Generation
networks may also be referred to as Universal Mobile Communication Telecommunication
System (UMTS), for example. There are three standards accepted by International
Telecommunication Union (ITU). They are Wide-band CDMA (WCDMA), CDMA2000 and
time-division synchronous CDMA (TDSCDMA).
2.2Planning Process and Objectives in 3G
2.2.1 Planning Process
Fig 3: Network Planning Procedure
In the 3G planning, since all carriers in the network use the same frequency range, frequency
planning is not required. Furthermore, coverage and capacity planning should be performed
in tandem since capacity requirement and traffic distribution influence the coverage.
Although there are three distinct standards in 3G networks (each used in different parts of the
world), WCDMA, CDMA2000 and TD-SCDMA, the general planning process and overall
objectives are the same.
Dimensioning
-Area types, propagation
-Network layout and elements
-Antenna heights
-Coverage, Capacity, QoS
-Traffic estimates (+growth)
-UL and DL load factor
Detailed Planning
-Traffic estimates
-Site configuration
-Coverage thresholds
-Capacity requirements
-Code and frequency
-Parameters
Optimisation and
Monitoring
-Traffic measurements
-Coverage verification
-Capacity verification
-Parameter tuning

11
2.2.2 Planning Objectives
Fig 4: Data speed at the Edge of the Sector
From the above picture it is clear that at the edge of the sector network quality is a big
challenge. The overall radio network planning goal is to maximizethe coverage and capacity
while meeting the key performance indicators (KPIs) and quality of service (QoS). So the
main objectives are
1. Maximize WCDMA Network Capacity
2. Maximize WCDMA Network Coverage
2.3Probable Solutions:
As the goal is to improve capacity and coverage so how these objectives can be achieved
those are summarized as follows.
Maximize WCDMA Network Capacity:
• DL capacity is considered more important than UL, asymmetric traffic
• Due to the less multipath microcell capacity better than macro cell
• Adding frequency layers for WCDMA brings more capacity
• Power splitting between frequencies
• Adding cells and sites is expensive and more possible interference
• Power splitting between sectors
• Sectorization
• Transmit diversity
• Lower bit rate codecs for speech (AMR 5,95 – 12.2 kbps supported)

12
• Multi-beam antennas
• Indoor cells with better interference isolation -> more capacity
• Network evolution with features like HSDPA, HSUPA, MIMO
Maximizing Network Coverage in WCDMA:
• Coverage is limited by UL due to the lower TX power of mobile and BTS RX-sensitivity
• Mast head amplifiers reduce the composite noise figure of the base station receiver
– Uplink link budget is improved and the service coverage improved
– Problems if cell is already DL limited -> DL capacity decreases more
• Active antennas include the low noise amplifier as an integrated part of the antenna itself
• Antenna bearing and tilting can reduce the interference leakage further
• Higher-order receive diversity not generally feasible to deploy with more than 4 branches
• Sectorization improves both system capacity and service coverage at the same time
– Antenna selection and placing is a critical part of planning
• Repeaters provide a solution for extending the coverage of an existing base station
– Problems if repeated cell is already DL limited -> DL capacity decreases more
• Adding more sites is expensive
• Enhance RX –sensitivity leads usually to higher equipment cost
• Multi-user detection and interference cancellation in the future
So from network planning point of view antenna is a very important part to increase coverage
and capacity. By considering the existing challenges and demand of the operators, multi-
beam antenna can be a very good and optimum solution to enhance coverage and capacity.
How it can add value from technical and commercial point of view that is described in next
chapters
2.4 Base Station Antenna:
An antenna is a device to transmit and/or receive electromagnetic waves. Electromagnetic
waves are often referredto as radio waves. Indeed, the antenna is one of the key points of
wireless network since it represents the last link in the chain that allows emission,
transmission and reception of the signal and therefore the information contained in it most
antennas are resonant devices, which operate efficiently over a relatively narrow frequency
band. An antenna must be tuned (matched) to the same frequency band as the radio system to
which it is connected, otherwise reception and/or transmission will be impaired.
2.4.1 Antenna Selection Criteria
To select antenna following issues are very important

13
Cost of increased capacity:
• Justifiable
Size/weight:
• Zoning issues
• Mounting requirements
Form Factor:
• Zoning issues
• Wind loading
System performance requirements:
• Horizontal & vertical pattern shape, gain, polarization, interference & isolation issues,
bandwidth and ports
2.4.2 Some Important Parameter of Antenna
Antenna is very important part of a network to meet data demand of a network. Some
parameters of an antenna have direct effect on key performance indicator (KPI) of a network.
Which are as follows.
2.4.2.1 Antenna Gain
Antenna gain is a comparison of the power/field characteristics of a device under test (DUT)
to a specified gain standard.Gain can be associated with coverage distance and/or obstacle
penetration (buildings, foliage, etc.).It is measured using data collected from antenna range
testing. The reference gain standard must always be specified.
• An isotropic antenna is a single point in space radiating in a perfect sphere (not physically
possible).
• A dipole antenna is one radiating element (physically possible).
• A gain antenna is two or more radiating elements phased together.
• Gain (dBi) = Directivity (dBi) – Losses (dB)
• Losses: Conductor, Dielectric, Impedance, Polarization
2.4.2.2 Main Lobe
The main lobe is the radiation pattern lobe that contains the majority portion of radiated
energy. Shaping of the pattern allows the contained coverage necessary for interference-
limited system designs.The main lobe is characterized using a number of the measurements
which will follow.

14
Fig 5: Antenna Patern
2.4.2.3 Half Power Beamwidth
The angular span between the half-power (-3 dB) points measured on the cut of the antenna’s
main lobe radiation pattern. It allows system designers to choose the optimum characteristics
for coverage vs. interference requirements. It is measured using data collected from antenna.
2.4.2.4 Font to Back Ratio
The ratio in dB of the maximum directivity of an antenna to its directivity in a specified
rearward direction. Note that on a dual-polarized antenna, it is the sum of co-pol and cross-
pol patterns. It characterizes unwanted interference on the backside of the main lobe. The
larger the number, the better. It is measured using data collected from antenna range testing.
2.4.2.5 Sidelobe Level
Sidelobe level is a measure of a particular sidelobe or angular group of sidelobes with
respect to the main lobe.
Sidelobe level or pattern shaping allows the minor lobe energy to be tailored to the antenna’s
intended use. See Null Fill and Upper Sidelobe Suppression.It is always measured with
respect to the main lobe in dB.
2.4.2.6 Null Filling
Null filling is an array optimization technique that reduces the null between the lower lobes
in the elevation plane. For arrays with a narrow vertical beam- width (less than 12°), null
filling significantly improves signal intensity in all coverage targets below the horizon.

15
Fig 6: Null Filling
2.4.2.7 Upper Sidelobe Suppression
Upper sidelobe suppression (USLS) is an array optimization technique that reduces the
undesirable sidelobes above the main lobe. For arrays with a narrow vertical beamwidth (less
than 12°), USLS can significantly reduce interference due to multi-path or when the antenna
is mechanically downtilted.
USLS is the relative dB difference between the peaks of the main beam peak of the first
upper sidelobe.
Fig 7: Upper Side Lobe Suppression
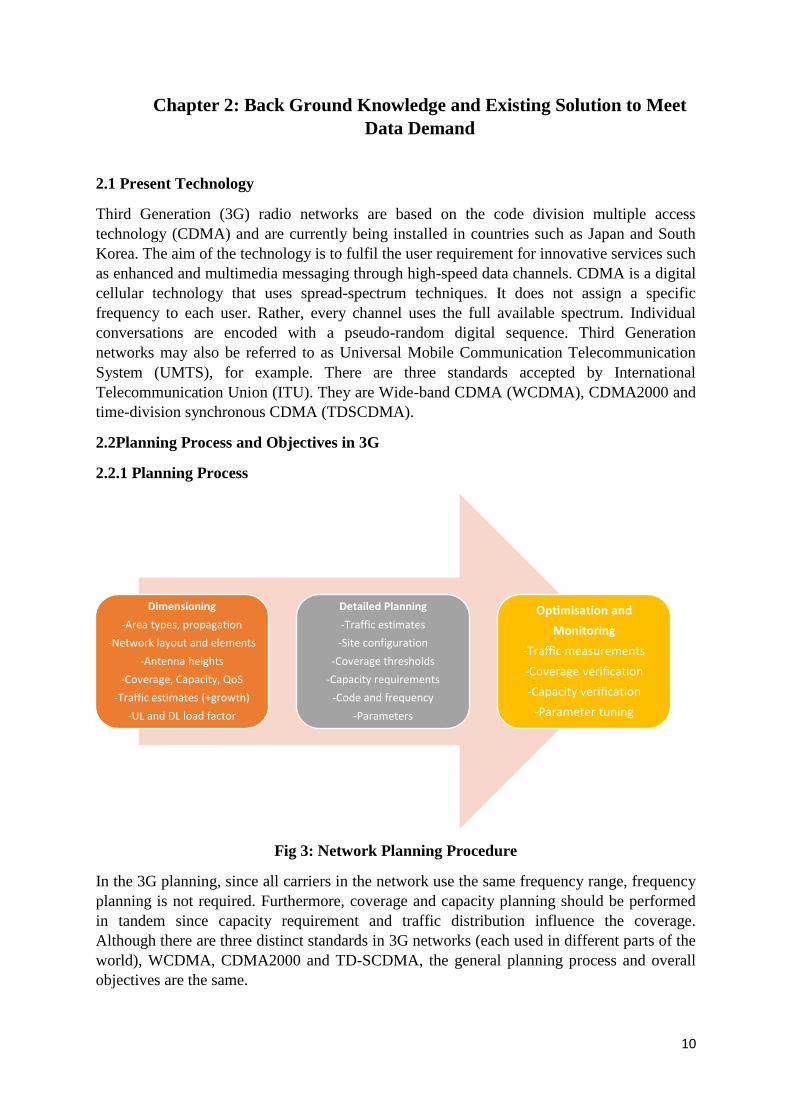
2.5 Traditional Antenna and Limitations for Capacity Solution
Traditional antennas have single beam with horizontal beam width of 90deg, 65deg, 45deg
and 33deg with different gain. But normally for three sector to cover 360 deg, 65deg HBW
antennas are commonly used.
16
Fig 8: Traditional Site Geometry
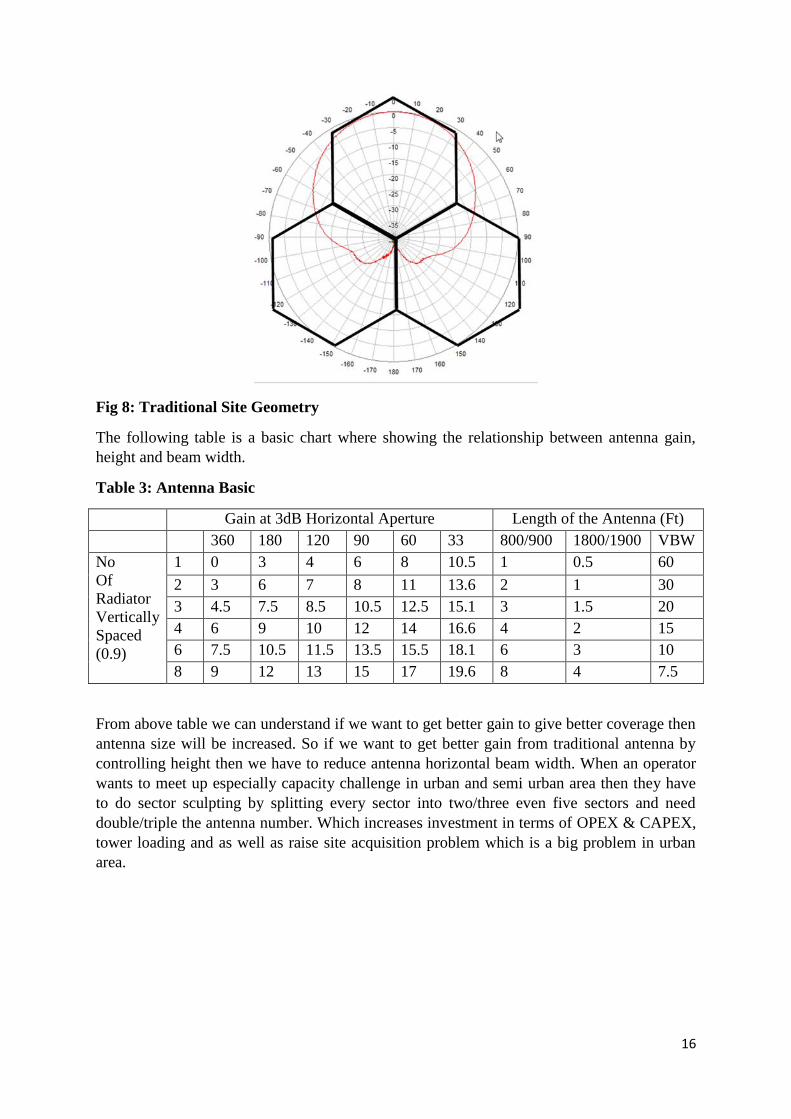
The following table is a basic chart where showing the relationship between antenna gain,
height and beam width.
Table 3: Antenna Basic
Gain at 3dB Horizontal Aperture Length of the Antenna (Ft)
360 180 120 90 60 33 800/900 1800/1900 VBW
No
Of
Radiator
Vertically
Spaced
(0.9)
1 0 3 4 6 8 10.5 1 0.5 60
2 3 6 7 8 11 13.6 2 1 30
3 4.5 7.5 8.5 10.5 12.5 15.1 3 1.5 20
4 6 9 10 12 14 16.6 4 2 15
6 7.5 10.5 11.5 13.5 15.5 18.1 6 3 10
8 9 12 13 15 17 19.6 8 4 7.5
From above table we can understand if we want to get better gain to give better coverage then
antenna size will be increased. So if we want to get better gain from traditional antenna by
controlling height then we have to reduce antenna horizontal beam width. When an operator
wants to meet up especially capacity challenge in urban and semi urban area then they have
to do sector sculpting by splitting every sector into two/three even five sectors and need
double/triple the antenna number. Which increases investment in terms of OPEX & CAPEX,
tower loading and as well as raise site acquisition problem which is a big problem in urban
area.

17
Chapter 3: Proposed Solution
3.1 Multi Beam Technology to Meet-up Data Growth/ Capacity Solution
From the discussion in initial part of this document, it’s clear that data demand is increasing
rapidly with time. In Bangladesh data growth rate more than 100%.
It’s very important to operators to give better quality network to keep this data growth but
considering their ROI and other practical challenges. From some statistics it is proved that
when customers get better upload and download speed, they use more data. Another
important point is when customers not using their smart phone but in the back ground smart
phones always update and download something. This usage should be high when the network
quality is good.
Note: This Survey Done by Ericsson
Fig 9: How do you keep Smart Phone Users Happy?
From the above statistic most of the smart phone users’ happiness depends on network
performance.
So to meet this data demand, operators have to split existing sectors and give more capacity
in all sectors all any particular sector. Multi-beam antennas are the best solution to fulfill this
demand of the operators in an optimum way with better ROI.

18
Basic principle of multi-beam antenna is multiple beams are generated from a single antenna
with a narrower horizontal beam width compare to most commonly used 65deg HBW
antenna. Each antenna acts like multiple antennas according to its number of beams. In this
way multi beam antenna can help to improve network coverage by adding gain and network
capacity by adding more cells in one antenna as well as reduce the operational cost.
Fig 10: Sector Splitting
For bigger sector inter-sector overlap is larger. Which normally have impact on capacity. As
well as faster roll off happen if we split the sector.
90 deg Sector 65 deg Sector 33 deg Sector
So, in this case I supposed that twin beam antenna will be the best solution which is better
than adding new antenna in same site from technical and commercial point of view.

19
Fig 11: Sector Splitting by Twin Beam
3.1.1 Multi-beam Technology
To increase the capacity the main challenges of antenna design are
1. Keeping Lighter weight
2. Keeping Smaller Size
3. Increase Gain
4. Sharper Pattern
5. Maintain Other Parameters Good
According to general antenna basic it is really tough to design such an antenna which can
meet all above requirements.
Switched Beam Arrays can be used to increase antenna capacity. Switched beam array can be
used in following way.
1. Butler Matrix Array
2. Blass Matrix
3. Rotman Matrix
Conceptual Operation of Butler Matrix
Fig 12: Butler Matrix
20
The conceptual operation of the Butler matrix is described briefly as follows. First, the Radio
Frequency (RF) signal excites each of the input ports, and, then, the signal goes through the
output ports, thereby feeding the array elements. Then, the signal is distributed equally with a
constant phase between them. As a result, beam radiations are generated at a certain angle.
Fig. 1 shows the topology of the Butler matrix, which is comprised of a branch-line coupler
(BLC), a crossover, and a phase shifter. The beam direction is illustrated with respect to each
input port. Therefore, by feeding any of input port,user can select the direction of the
radiation main beam asdesired. In addition, in order to reduce the manufacturingcost and
effectively integrate the Butler matrix and antenna elements, FR4 board is utilized during
printed circuit broad.
Butler Matrix Structure:
A new design is used that optimizes the size of the Butler Matrix structure. This is achievable
by reducing electrical length of the conventional BLC, which is the keyelement in designing
Butler Matrix by implementing the shunt arm to be half of the length of the through arm.
3.1.2 Multi Beam Antenna Types and Application Cases
Now a days antenna manufacturers are investing a lot for R&D of multibeam technology.
Available multibeam antennas are
1. Twin Beam
2. Tri-Beam
3. Five Beam
4. Nine Beam
5. Eighteen Beam
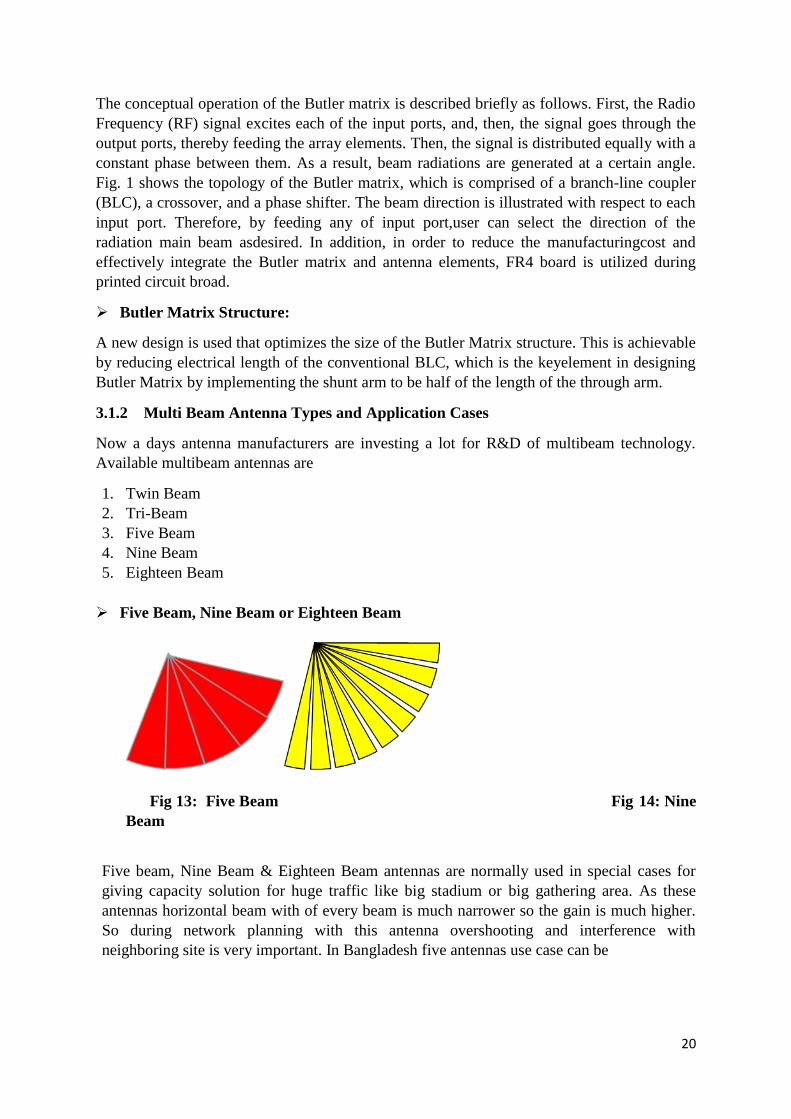
Five Beam, Nine Beam or Eighteen Beam
Fig 13: Five Beam Fig 14: Nine
Beam
Five beam, Nine Beam & Eighteen Beam antennas are normally used in special cases for
giving capacity solution for huge traffic like big stadium or big gathering area. As these
antennas horizontal beam with of every beam is much narrower so the gain is much higher.
So during network planning with this antenna overshooting and interference with
neighboring site is very important. In Bangladesh five antennas use case can be
21
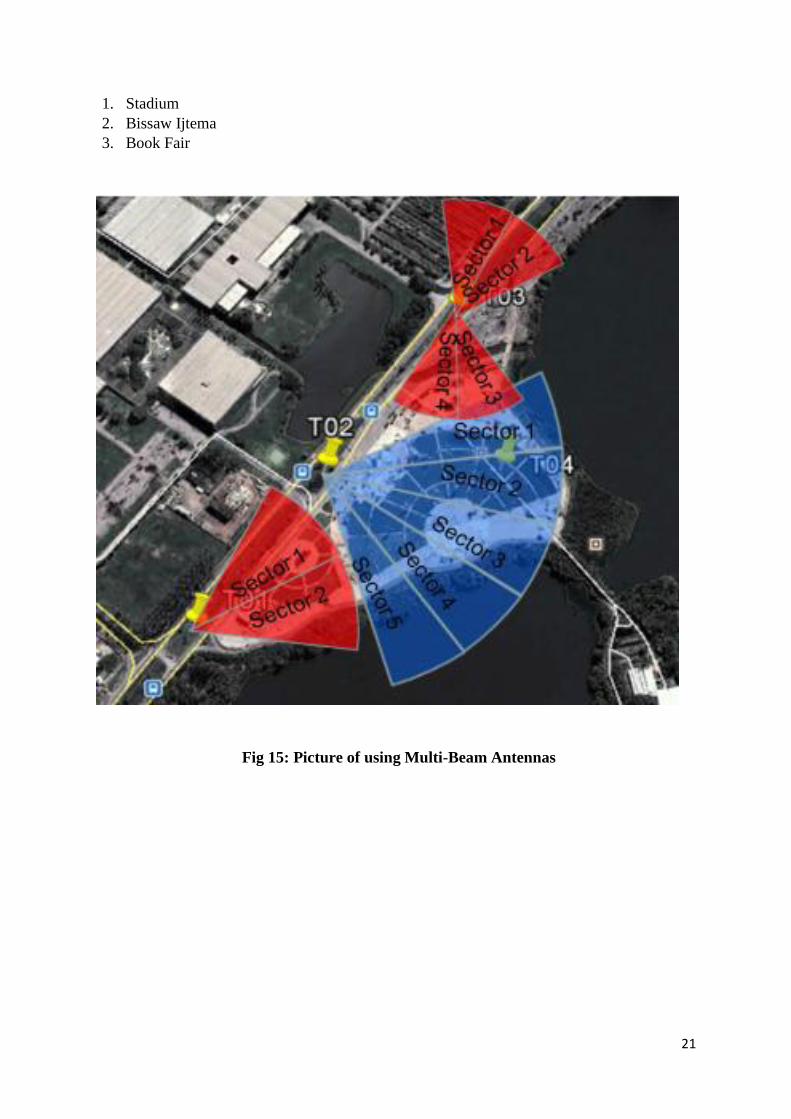
1. Stadium
2. Bissaw Ijtema
3. Book Fair
Fig 15: Picture of using Multi-Beam Antennas

22
Twin Beam & Tri-Beam
Normally twin beam and tri beam antenna is using for dense urban/dense semi urban area
where need to double or triple network capacity according to traffic.
Fig 16: Tri-Beam Antenna
In this project we are working with only twin beam antenna. Which is used alternative of
two 33deg horizontal beam width antenna or replacing of one existing 65deg horizontal
beam width antenna according to capacity requirement.
3.1.3 Comparison of Twin Beam antenna and Traditional Antenna
Better Gain and Wider Coverage:
Traditional 65° Pattern
Twin Beam Pattern
Wider Coverage

23
Fig 17: Pattern Comparison of Traditional Antenna and Twin Beam Antenna
Faster Roll Off:
Fig 18: Traditional 65 deg Antenna PatternFig 19: Twin Beam Antenna Pattern
From above antenna patter we can see that twin beam antenna has smaller handover region in
compare to two traditional 65 deg antenna which gives better handover success rate and
better call drop rate.Faster roll off compare to 65deg antenna. It has a very sharper pattern
which give a good coverage in sector edge.
Better Sidelobe Suppression:
Fig 20: Excellent Sidelobe Suppression
It has also excellent sidelobe suppression which increase interference rejection.

24
Better Front to Back Ratio:
Fig 21: Better Front to Back Ratio
Here in twin beam antenna Its front to back ratio allso very good which also increase
interference rejection and give a comfort zone for network planning.
Better in Size:
Physical dimension of twin beam antenna is not much bulky compare to traditional antenna.
If we replace 66 deg antenna by twin beam antenna and compare both as follows.
Table 4: Physical Parameter Comparison of Twin Beam and Traditional 65deg Antenna
Twin Beam Traditional 65 Deg
HBXX-3817TB1-VTM HBXX-6516DS-VTM
W 11.9 Inch 12.0 Inch
H 54.7 Inch 50.9 Inch
D 7.1 Inch 6.5 Inch
We 16.5 Kg 13.9 Kg
Note: Both antenna manufectured by Commscope

25
If we think a twin beam antenna intead of two traditional 33deg antenna then the physical
comperision as follows.
Table 4: Physical Parameter Comparison of Twin Beam and Traditional 33deg Antenna
Twin Beam Traditional 33 Deg
HBXX-3817TB1-VTM HBXX-3319DS-VTM
W 11.9 Inch 22.2 Inch
H 54.7 Inch 57.0 Inch
D 7.1 Inch 4.9 Inch
We 16.5 Kg 17.3 Kg
Note: Both antenna manufectured by Commscope
So, if we think to make three sectors to six secotrs by this 33deg horizontal beam width
antenna then tower loading and wind loading will be massive.
Key Benefits Compare to Traditional Antennas:
Improve utilization of existing network infrastructure
Address needs of high-density markets with limited site capacity
Delay addition of CDMA or W-CDMA carriers
Optimize data transfer rates for 3G/4G/LTE markets
More capacity due to increased sectorization
Ideal solution for high traffic sectors and events
Extends value of existing cells
Fast and easy deployment
Logistics / storage
SIX sectors in one single band site
TWELVE sectors in a dual band basis
Smaller windload requires less or no structure revision
No impact on contract / lease cost for antennas in third party structures
Sectors in the antenna optimized for small overlap
Lower softer handover / interference
Smaller possibility of miss-alignment
Sector sculpting offers narrower beam width that reflector-shaped lobe antennas
Each antenna downtilt can be independently adjusted for greater flexibility innetwork
optimization

26
Chapter 4: Project Work
4.1 Background of the Project:
3X1=6
Fig 22: Sector Splitting and Twin Beam Antenna
One of the leading operator of Bangladesh facing capacity problem in certain area/region.
They are thinking to add cell/sector to enhance the capacity on that particular base station. So
from traditional point of view, to add new cell or sector they need to add new antenna with
33deg HBW in same site or have to make new sites by using 65deg HBW antenna. Which
will
Increase number of antennas or number of sites. If increase number of antennas then
tower load will be increased which might be created house owner issues for RT sites.
If want to build a new site, then site acquisition will be a big issue in recent days.
Increase Capex and Opex

27
But if they use twin beam antenna then
Back-to-back Broadcast Channel (BCCH) re-use capability for 2G
Enhanced RF footprint (higher gain)
Better interference containment (better roll-off)
Faster site deployment
So objectives of this project
• Showing Customer the comparison of the performance of the existing cross pole antennas at
two chosen area of one site with that of Andrew’s Twin beam antenna HBXX-3817TB-VTM.
One site according to pre data number of sectors made doubled and another site an additional
sector added by replacing one single beam antenna.
• The data to be analyzed will be that of drive test plots (pre and post)and KPI data (pre and
post) collected through OSS/OMCR of Customer.
• Site performance should not degrade critically to that of existing antennas or better in terms
of carried capacity/all the calls related KPI’s like Total traffic, SD block, TCH block, TASR
& HOSR etc.

28
4.2 Datasheet of Proposed Twin Beam Antenna and Traditional Alternative Antennas
4.2.1 Proposed Twin Beam
Fig 23: Antenna Datasheet

29
4.2.2 Other Alternative
HBW 65 Deg Antenna
Fig 24: Traditional 65deg Antenna Datasheet

30
HBW 33 Deg Antenna
Fig 25: Traditional 33deg Antenna Datasheet

31
4.3 Project Summary:
• Comparing the performance of the existing single beam antennas at a chosen 1 site in
Mymensing Road, Tangail, Bangladesh with that of Andrew’s Twin beam antenna HBXX-
3817TB1-VTM.
• The data to be analyzed will be that of drive test plots (pre and post) and KPI data (pre and
post) collected through OSS/OMCR of Customer.
• Site performance should not degrade critically to that of existing antennas or better in terms
of carried capacity/all the calls related KPI’s like Total traffic, SD block, TCH block, TASR
& HOSR etc.
• Sites to evaluate the performance of HBXX-3817TB1-VTM were identified atTangail. This
Customer circle operates on the 2100 WCDMA band.
• Cluster sites are 3 sector GBT sites already radiating with one GSM antenna per sector.
• The trials were initiated on the 11th December 2015 for all selected sites in a cluster in
Tangail and installation for l sites got completed by 14th December 2015.
• Pre-drive test was already done by Customer/Customer drive test team. Post drive test and
optimization was done following the completion of installation at all trial sites.
• Optimization was done by Customer RF team and took almost a week to complete.
• The site details like azimuth and height are noted down and Andrew antennas were installed
where earlier existing antennas were installed. Pre & Post RSCP Dedicated.
4.4 Project Work Flow Chart
Fig 26: Project Flow Chart
Project Proposal and
ApprovalSite Selection
Pre KPI and Physical Data
Collection
RRU Installation
Antenna SWAPPost KPI Data
Colletion
Data Analysis and Reporting

32
4.5 Responsibility Matrix
Table 6: Responsibility Matrix
Responsibility Customer
My Team
(In-house) My self
Solution
Team
(From
Abroad)
1 Trial Proposal
2 Approval
3 Evaluation Criteria
4 Guideline of Trail Procedure (Details)
5 Site Selection
6 Set KPI which have to be checked
7
Pre KPI data and Physical Data
Collection
8 RRU Installation
9 Antenna Swap
10 Post KPI data collection
11 Data analysis
12 Reporting
Index
Main Role
Monitoring/Supportive Role
No Role
4.5.1 Trial Proposal and Approval:
At first submitted a project proposal to customer focusing on which value will be added in
customer network by introducing this multi-beam antenna. Theoretically customer have
understood the value added points according to present challenges which have been facing in
terms of network capacity and approved the project.
4.5.2 Fix-up Evaluation Criteria
Discussion with the customer evaluation criteria have been fixed and agreed. Here some
important points are noted as considerations according to the suggestion of this antenna
experts from antenna manufacturer end.
33
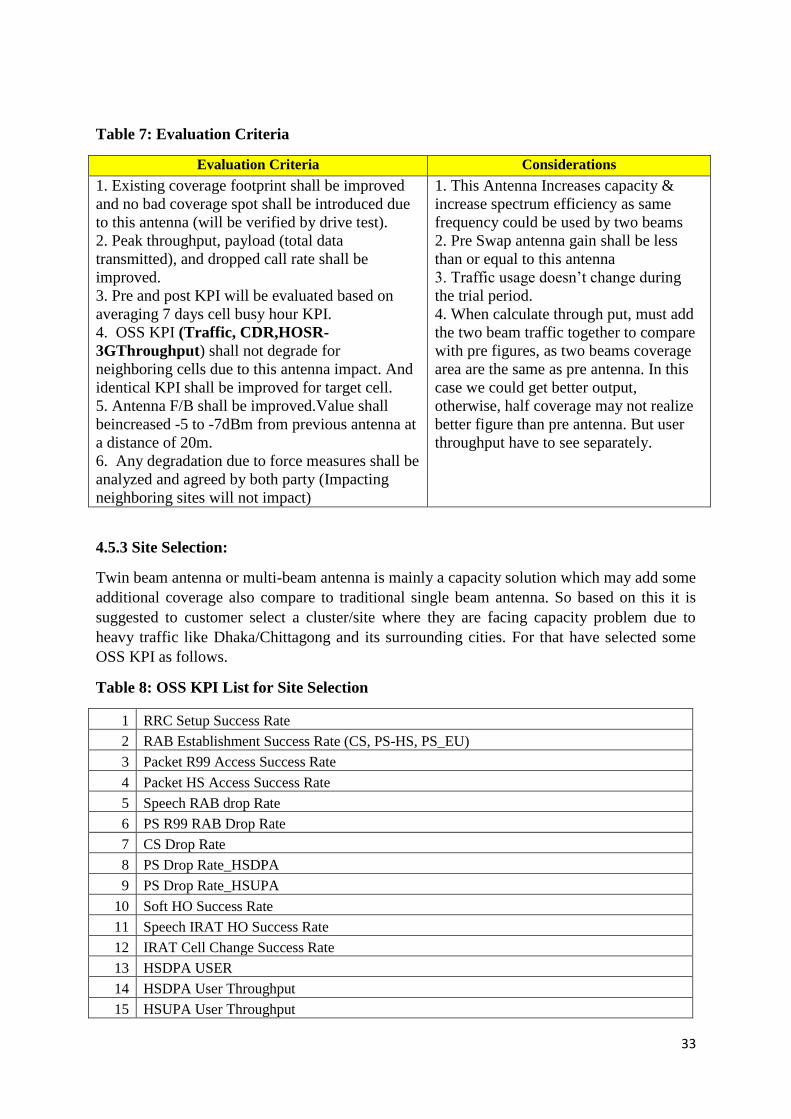
Table 7: Evaluation Criteria
Evaluation Criteria Considerations
1. Existing coverage footprint shall be improved
and no bad coverage spot shall be introduced due
to this antenna (will be verified by drive test).
2. Peak throughput, payload (total data
transmitted), and dropped call rate shall be
improved.
3. Pre and post KPI will be evaluated based on
averaging 7 days cell busy hour KPI.
4. OSS KPI (Traffic, CDR,HOSR-
3GThroughput) shall not degrade for
neighboring cells due to this antenna impact. And
identical KPI shall be improved for target cell.
5. Antenna F/B shall be improved.Value shall
beincreased -5 to -7dBm from previous antenna at
a distance of 20m.
6. Any degradation due to force measures shall be
analyzed and agreed by both party (Impacting
neighboring sites will not impact)
1. This Antenna Increases capacity &
increase spectrum efficiency as same
frequency could be used by two beams
2. Pre Swap antenna gain shall be less
than or equal to this antenna
3. Traffic usage doesn’t change during
the trial period.
4. When calculate through put, must add
the two beam traffic together to compare
with pre figures, as two beams coverage
area are the same as pre antenna. In this
case we could get better output,
otherwise, half coverage may not realize
better figure than pre antenna. But user
throughput have to see separately.
4.5.3 Site Selection:
Twin beam antenna or multi-beam antenna is mainly a capacity solution which may add some
additional coverage also compare to traditional single beam antenna. So based on this it is
suggested to customer select a cluster/site where they are facing capacity problem due to
heavy traffic like Dhaka/Chittagong and its surrounding cities. For that have selected some
OSS KPI as follows.
Table 8: OSS KPI List for Site Selection
1 RRC Setup Success Rate
2 RAB Establishment Success Rate (CS, PS-HS, PS_EU)
3 Packet R99 Access Success Rate
4 Packet HS Access Success Rate
5 Speech RAB drop Rate
6 PS R99 RAB Drop Rate
7 CS Drop Rate
8 PS Drop Rate_HSDPA
9 PS Drop Rate_HSUPA
10 Soft HO Success Rate
11 Speech IRAT HO Success Rate
12 IRAT Cell Change Success Rate
13 HSDPA USER
14 HSDPA User Throughput
15 HSUPA User Throughput

34
According to the guideline customer select some sites in Dhaka and Chittagong region.
Among those**8915(Site ID: **8915) at Mymensing Road, Tangail have been selected for
trail.
Another important thing to be noted that as capacity problem is mainly facing 3G network.
So it was suggested implement this antenna in 3G due to data demand at 3G. That’s why
selected site is a 3G site.
4.5.4KPI Which Have to be checked:
For the twin beam antenna case in a 3G scenario, the primary success criteria that would be
recommend were peak throughput, payload (total data transmitted) and dropped call rate,
along with radio resource efficiency, which can be related to overall capacity.
So following KPI can be summarized the above mentioned points.
RRC
Setu
p
Succ
ess
Rate
(%)
CS
RAB
Esta
blish
Succ
Rate
(%)
RAB
Establis
hment
Success
Rate PS
Interact
ive (%)
RAB
Establis
hment
Success
Rate PS
Interact
ive HS
(%)
RAB
Establi
shmen
t
Succes
s Rate
PS
Intera
ctive
EUL
(%)
Pack
et
R99
Acces
s
Succe
ss
Rate
(%)
Pac
ket
HS
Acc
ess
Suc
cess
Rat
e
(%)
PS
R99
RA
B
Dro
p
Rat
e
(%)
PS
HS
RA
B
Dro
p
Rat
e
(%)
Soft
HO
Suc
cess
Rat
e
Speec
h
IRA
T HO
Succe
ss
Rate
(%)
IRA
T cell
chan
ge
Succ
Rate
(%)
Numb
er of
Users
HSD
PA
Thro
ughp
ut(M
bps)
TCH Traffic: It measures carried traffic by traffic channel
CSSR: call setup success rate
SDCCH: The bi-directional Standalone Dedicated Control Channel (SDCCH) is
subsequently used for purposes such as call set-up, mobile station attach/detach, location
update and short message submission.
Radio Capacity: It measures throughput.
Radio Utilization: It measures utilization of remote radio unit.
Beside this for Coverage RSCP and for qualityEx/No are recommended.
RSCP:
RSCP stands for Received Signal Code Power – the energy per chip in CPICH averaged over
512 chips.
Eb/No:
By definition Eb/No is energy bit over noise density, i.e. is the ratio of the energy per
information bit to the power spectral density (of interference and noise) after dispreading.
Eb/No = Processing Gain + SIR

35
For example, if Eb/No is 5dB and processing gain is 25dB then the SIR should be -20dB or
better.
Eb/No target
The Eb/No targets are dependent on the service:
4.5.5Pre KPI Data and Physical Data Collection:
According to the above mentioned guideline customer collect the Pre KPI data and physical
data of existing single beam antenna. To collect KPI data they have used the following tools
and software.
1. Tems Software(Version 16.2)
2. Three Mobile Set
3. Data card
4. Laptop
5. Digital Power Hub
6. GPS
7. Camera
8. Car
4.5.6 Additional RRU Installation:
As this is a sector splitting solution so customer have to add additional RRU. If it is twin
beam antenna and existing sector are 3 then they have to double the number of RRU. Every
twin beam antenna have been connected with two RRU.
This portion have been done by customer.
4.5.7 Antenna Swap:
After installation of RRU, customer have to give NCR time and my team dismantled existing
antenna and installed new antenna.
Three manpower have engaged in this activities. Required tools are as follows.
Antenna tilt and height fix according to my guideline.
4.5.8 Post KPI Data Collection:
By same procedure of collection of pre KPI data, customer have collected post KPI data from
field and send to me.
4.5.9 Data Analysis and Reporting:
Data analysis and reporting done by myself according to the guidance of antenna
manufacturer experts based on following data which collected from site.

36
4.5.9.1 Physical Data
Pre:
Table 9: Pre Physical Parameter Audit
Post:
Table 10: Post Physical Parameter Audit
SiteName
Sectors
Electrical
Downtilt(
Deg)
Mecha
nicaltil
t(deg)
Azimuth
(deg)
Height(fro
mground)i
nmeters
Tower
Height
Antenna Gain (dBm)
XT89XX
Sector1 6 0 110 30.5 32 19.
7
Sector2 6 0 200 30.5 32 19.7
Sector3 7 0 300 30.5 32 19.7
Site
Na
me
Electricalt
ilt(Deg)
Mecha
nicaltil
t(deg)
Azimuth
(deg)
Height(fro
mground)i
nmeters
Tower
Height
Antenna Gain (dBm)
XT89XX
Sector1 4 0 90 30
.5
32 17.
7
Sector2 4 0 180 30
.5 32
17.7
Sector3 6 0 280 30
.5 32
17.7

37
4.5.9.2KPI Data analysis
Pre and Post RSCP(Coverage):
Pre Post
Fig 27: RSCP plot
From pre post drive test it is clearly identified after installation of twin beam antenna that
received signal code power is bit better at maximum area compare pre. So coverage is
improved slightly. Which clearly justify evaluation criteria of twin beam antenna.
Pre & Post Ec/No Dedicated(Quality):
Pre Post
Fig 28: EcNo Plot

38
From pre and post Ec/No it is clearly seen that energy per code or per bit to noise ratio is
significantly improved in post drive. So call quality improved significantly after twin beam
antenna installation. Which is the main objective of this project.
4.5.9.3KPI Comparison of Pre & Post
Table 11: KPI Comparison
RR
C
Setu
p
Succ
ess
Rate
(%)
CS
RAB
Esta
blish
Succ
Rate
(%)
RAB
Establis
hment
Success
Rate PS
Interac
tive
(%)
RAB
Establis
hment
Success
Rate PS
Interac
tive HS
(%)
RAB
Establ
ishme
nt
Succes
s Rate
PS
Intera
ctive
EUL
(%)
Pack
et
R99
Acce
ss
Succ
ess
Rate
(%)
Pac
ket
HS
Acc
ess
Suc
cess
Rat
e
(%)
PS
R99
RA
B
Dro
p
Rat
e
(%)
PS
HS
RA
B
Dro
p
Rat
e
(%)
Soft
HO
Suc
cess
Rat
e
Spee
ch
IRA
T
HO
Succ
ess
Rate
(%)
IRA
T
cell
chan
ge
Succ
Rate
(%)
Numb
er of
Users
HSD
PA
Thro
ughp
ut(M
bps)
P
re
98 99.1 99 99.1 98.2 99.1 98 0.6 0.6 97 89 98 35 0.3
98.9 99.9 98 99.1 99.9 99.1 98 0.5 0.5 97.8 80 100 33 0.2
99.1 99.1 98.5 98.9 99.1 98.9 99 0.4 0.7 98.9 75 99 38 0.2
99.5 99.9 99 99 99.9 99 98 0.4 0.63 99.8 90 99 29 0.1
99 99.9 97 99.2 97.9 99.2 99 0.4 0.62 99 92 97 45 0.3
98.7 100 97.8 98.9 99 98.8 99 0.4 0.31 98.7 90 98 28 0.2
98.7 100 97.9 99.1 97 99 99 0.3 0.3 98 96 98 36 0.1
P
o
st
99.6 99.9 99.1 99.1 99.1 99.3 98 0.4 0.6 99.8 89 98 55 0.4
99.6 100 99 99 99.9 99.4 98 0.3 0.6 99.9 80 100 45 0.3
99.5 100 98.9 98.9 98.9 99.6 99 0.4 0.65 99.8 68 100 46 0.4
99.5 100 99.1 99.1 99 98 99 0.4 0.58 99.9 90 99 34 0.2
99.5 100 99.2 99.2 99.2 99.5 99 0.3 0.56 99.8 92 97 54 0.5
99 100 98.9 98.9 98.9 99.7 99 0.2 0.23 99.9 90 98 43 0.3
98.7 100 99.1 99.1 99.1 99.9 99 0.2 0.28 99.9 96 98 60 0.2
From above table of 7days pre and post drive test data we see that most of the KPI have
improved after installation of twin beam antenna which had been fixed as evaluation criteria.
4.5.9.4 F/B Ratio Comparison
Table 12: Front to Back Ratio Comparison
RSCP at 20m
Distance
Sectors Front RSCP
Level
Back RSCP
Level
F/B Ratio
Previous
Antenna
Sector 1 -52dBm -140dbm 88dBm
Sector 2 -55dBm -151dBm 96dBm
Sector 3 -65dBm -145dBm 85dBm
Present Antenna Sector 1 -46dBm -145 99dBm
Sector 2 -48dBm -160 112dBm

39
Sector 3 -50dBm -152 102dBm
So, according to evaluation criteria F/B ratio should be improved -5 to -7dBm compare to
previous antenna. But in practical it is improved more. Which will reduce the interference
probability with the neighboring sites in back end.

40
Chapter 5: Conclusion and Future Work
5.1 Summary of the project:
By considering the present requirement, we can summarize this project as follows.
• Both sector has good coverage area and RSCP has been increased than before.
• Traffic in the trial site has significantly increased by approx. 40%.
• No critical degradation has been noticed in CSSR or any major Parameters.
• SDDCH blocking is either same as before or improved.
• TCCH blocking has improved significantly.
• TCH drop is either same as before or improved.
• Total Handover Success ratio is either same as before or improved
5.2 Future Work:
5.2.1 On This Particular Project:
1. KPI improvement was less than the expectation so in future need to do more optimization
as well as need to do some planning level change to get better result at this particular site.
2. Another experimental trail is going to happen very soon in different region.
5.2.2Multibeam
According to the requirement of massive data demand, in coming future five beam, nine
beam, even eighteen beam antenna can be introduced to meet the data demand.
5.2.3Smart Beam
Smart beam antenna will be a good solution to meet future requirement more preciously by
which we can control antenna azimuth, beam width and beam tilt remotely according to live
traffic position.

41
References
[1] Noorlindawaty MD. JIZAT1,2, Sharul Kamal ABD. RAHIM2, Muhammad Zairil M.
NOR2, Yusoff ABDULRAHMAN2, Mursyidul Idzam SABRAN2, Mohd. Faizal JAMLOS3;
Beamforming Network Using Dual Band-Dual Beam Reduced Size Butler Matrices
[2] Radio Network Planning for 2G and 3G, Yiming Sun
[3] K. Sandeep Rajeev et al Int. Journal of Engineering Research and Applications;
ISSN: 2248-9622, Vol. 4, Issue 5(Version 5), May 2014, pp.107-111
[4] Fundamentals of wireless communication [electronic resource] / DavidTse and Pramod
Viswanath. Tse, David. Cambridge: Cambridge University Press, 2005 (Norwood, Mass.:
Books24x7.com
[5]ITU-T Recommendation G.1000 (2001), Communication quality ofService: A framework
and definition.
[6] Jens Zander. „ Radio resource management for Wireless Networks‟. Artech House Inc.,
[7] S. Kyriazakos, G. Karetsos, E. Gkroustiotis, C. Kechagias, P. Fournogerakis “Congestion
Study and Resource Management inCellular Networks of present and Future Generation”,
IST MobileSummit 2001, Barcelona, Spain, 9-12 September 2001.
[8] Tayeb. A. Denidni and Taro Eric Libar, “Wide Band Four-Port Butler Matrix for
Switched Multibeam Antenna Arrays,” The 14th IEEE 2003 International Symposium on
Personal, Indoor and Mobile Radio Communication Proceedings, pp.2461-2464, 2003.
[9] Constantine A. Balanis, ‘Antenna theory analysis and design’, second edition, John willey
and sons, Inc., 1997.