Embed Size (px)
Citation preview
SP2 New Concepts for Efficient Freight systems
Capacity for Rail
SP2 New Concepts for Efficient Freight systemsWP2.3 Co-modal Transhipment and Interchange Logistics
Dissemination Workshop #2 – 3rd NOVEMBER 2016

TeamTeam
2

ScopesScopes
Contributions of terminals to rail freight systemsContributions of terminals to rail freight systems 2030 and 20502030 and 2050 Expected performances and requisites = What the terminals should do
Key Performance Indicators (KPI) = How to measure terminal performances
Integration of innovations = What the terminals can take onboard
Future scenarios = How the terminals could work
Methods and models to assess scenarios = How to assess scenarios
Assessment of scenarios = How much expected performances are performed
Typology of terminals (case studies)Typology of terminals (case studies)Typology of terminals (case studies)Typology of terminals (case studies) Rail-Road – inland freight interchanges
Munich Riem (DE)
Antwerp Combinant (BE)
Antwerp Hupac (BE)
Antwerp Zomerweg (BE)
Typical small scale automatic linear terminal
Rail-Rail - marshalling yards
Hallsberg (SE)
Rail-Sea – containers port terminals
Valencia Principe Felipe (ES)
3
“a modern, automated, intelligent and
fully-integrated system for efficient,
reliable freight Operations”

Key Performance IndicatorsKey Performance Indicators
Selection criteriaSelection criteria Sensibility to potential changes introduced by innovations: operational
measures and technologies
Meeting requests of operators
Identified KPIs by terminal typology: 13 (Rail-Road), 15 (Rail-Rail), 14 (Rail-
Sea)
Examples:
4

Innovations to be integratedInnovations to be integrated
Compatibility checkCompatibility check
5

Suggestions taken into accountSuggestions taken into account
From dissemination meeting in September 2015From dissemination meeting in September 2015 Self-propelled wagons to be included in all scenarios for marshalling
yards
Duo-locomotive are already reality
Business cases should take into account the added value of logistic
services
Increase of traffic from/to ports as key scope of future scenarios
6
Increase of traffic from/to ports as key scope of future scenarios
Future terminals to focus on effective traffic of parcels/carriers
services
Smaller shunting stations should be proposed and simulated
Digitalization of information to be included in all scenarios
Transparency in information exchanges between stakeholders
Best practices in info-management applied in ports/airports
communities
Vision papers on future logistics by various stakeholders to be
considered
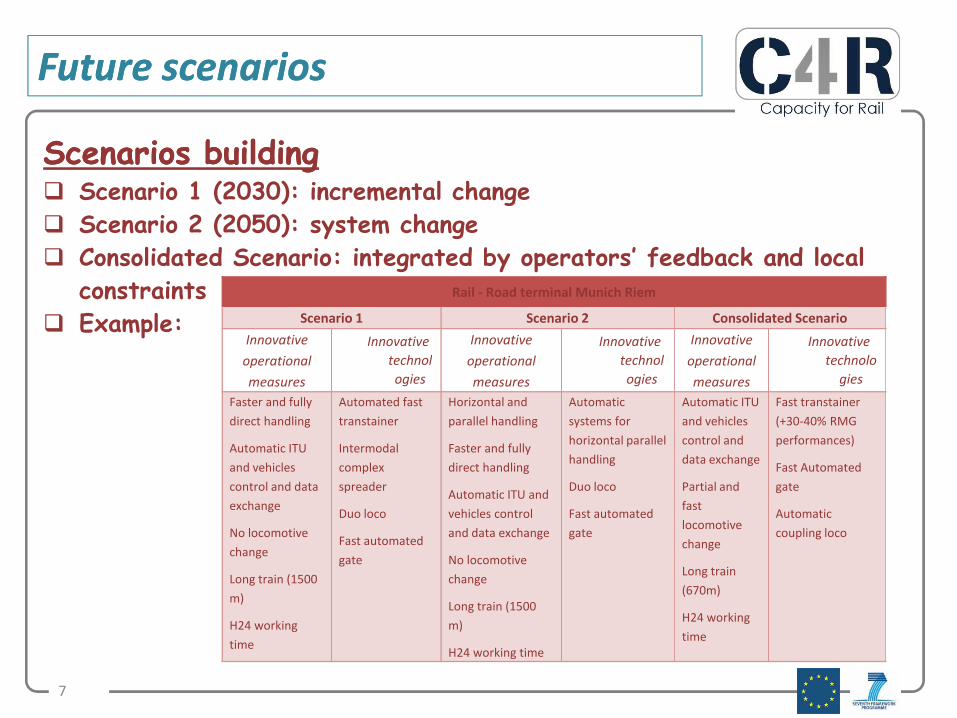
Future scenariosFuture scenarios
Scenarios buildingScenarios building Scenario 1 (2030): incremental change
Scenario 2 (2050): system change
Consolidated Scenario: integrated by operators’ feedback and local
constraints
Example:
Rail - Road terminal Munich Riem
Scenario 1 Scenario 2 Consolidated Scenario
Innovative
operational
Innovative
technol
Innovative
operational
Innovative
technol
Innovative
operational
Innovative
technolo
7
operational
measures
technol
ogiesoperational
measures
technol
ogiesoperational
measures
technolo
gies
Faster and fully
direct handling
Automatic ITU
and vehicles
control and data
exchange
No locomotive
change
Long train (1500
m)
H24 working
time
Automated fast
transtainer
Intermodal
complex
spreader
Duo loco
Fast automated
gate
Horizontal and
parallel handling
Faster and fully
direct handling
Automatic ITU and
vehicles control
and data exchange
No locomotive
change
Long train (1500
m)
H24 working time
Automatic
systems for
horizontal parallel
handling
Duo loco
Fast automated
gate
Automatic ITU
and vehicles
control and
data exchange
Partial and
fast
locomotive
change
Long train
(670m)
H24 working
time
Fast transtainer
(+30-40% RMG
performances)
Fast Automated
gate
Automatic
coupling loco

Assessment of scenariosAssessment of scenarios
RequirementsRequirements Capability to reproduce terminals’ operation
Sensibility to innovations: operational measures and technologies
Analytical methodsAnalytical methods Based on combined algorithms (e.g. queuing theory)
SimulationSimulation modelsmodels Synchronous and asynchronous event-based reproduction of
8
Synchronous and asynchronous event-based reproduction of
operational processes
Methodological processMethodological process Calibration on typical terminals
Identification of subsets of data describing the typical operation
Cross analysis of typical/calculated /simulated KPI
Tests for validation on case studies
Identification of application fields: most reliable tool for KPI
calculation
Extended application to selected scenarios

RailRail--Road: InlandRoad: Inland freightfreight interchangeinterchange
ITUsITUs total transit timetotal transit time Vehicles total transit timeVehicles total transit time
(by analytical method) (by analytical method)
0
2
4
6
8
10
TRUCK_TRAIN TRAIN_TRUCK
TTR
[h]
0
1
2
3
4
5
6
TRAIN TRUCK
TTR
[h]
-14% -59%
-66%
Consolidated Scenario
Automatic
ITU and
vehicles
control and
data
exchange
Partial and
fast
locomotive
change
Long train
(670m)
Fast
transtainer
(+30-40%
RMG
performance
s)
Fast
Automated
gate
Automatic
coupling loco
9
TRUCK_TRAIN TRAIN_TRUCK
State of art Consolidated Scenario 1 Scenario 2
TRAIN TRUCK
State of art Consolidated Scenario 1 Scenario 2
0
10
20
30
40
50
60
70
80
Ep[I
TUs/
h]
State of art Consolidated Scenario 1 Scenario 2
0
0,2
0,4
0,6
0,8
TRAIN TRUCK
SysU
R
State of art Consolidated Scenario 1 Scenario 2
Equipment performanceEquipment performance VehiclesVehicles utilisationutilisation raterate
(by simulation model) (by simulation model)
+25%
-49% -18%
(670m)
H24
working
time

RailRail--Rail: Marshalling yardRail: Marshalling yard
Average wagon transit timeAverage wagon transit time Tracks utilization rateTracks utilization rate
(by simulation model) (by simulation model)-62%
Consolidated Scenario
Tracks operative length till
1500 m
Multi Modal Marshalling
(MMM): classification tracks
accessible not only via hump
Automatic wagon
identification
Automatic coupling and
uncoupling
Automatic brakes on wagons
10
Maximum flow through the yardMaximum flow through the yard Average number of wagons inAverage number of wagons in
(by analytical method) (by simulation model)
-47%
Self-propelled wagons
Duo propulsion and driverless
loco
H24 working time

RailRail--Sea: Containers port terminalSea: Containers port terminal
ITUsITUs total transit timetotal transit time Vehicles total transit timeVehicles total transit time
(by analytical method) (by analytical method)
-29% -34%
-9%
Consolidated Scenario
Automatic
ITU and
vehicles
control and
data
exchange
Long train
(850-1000
m)
H24
working
time
Multi lift
spreader
handling
Fast
Automated
gate
Automatic
coupling
loco
-73%
11
Equipment performanceEquipment performance VehiclesVehicles utilisationutilisation raterate
(by simulation model) (by simulation model)
-51%
time

Traffic forecastTraffic forecast
Expected increaseExpected increase Main Source: EU White Paper
Increase factor Increase % per year
2015-2030 2030-2050 2015-2050 2015-2030 2030-2050 2015-2050
Business as
Usual1.16 1.17 1.37 1.0% 0.8% 0.95
12
Usual
Modal shift
Low scenario1.34 1.38 1.87 2.0% 1.6% 1.8%
Modal shift
High scenario1.65 1.84 3.06 3.4% 3.1% 3.2%
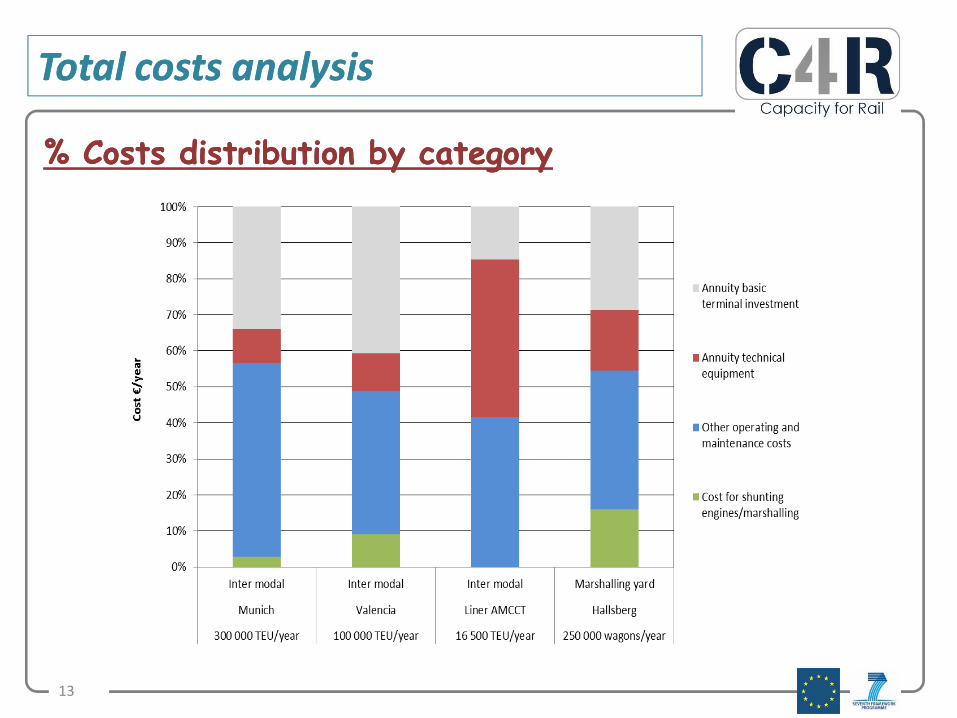
Total costs analysisTotal costs analysis
% Costs distribution by category% Costs distribution by category
13

Unit costs analysisUnit costs analysis
Costs / handled UTI distributed by categoryCosts / handled UTI distributed by category
14
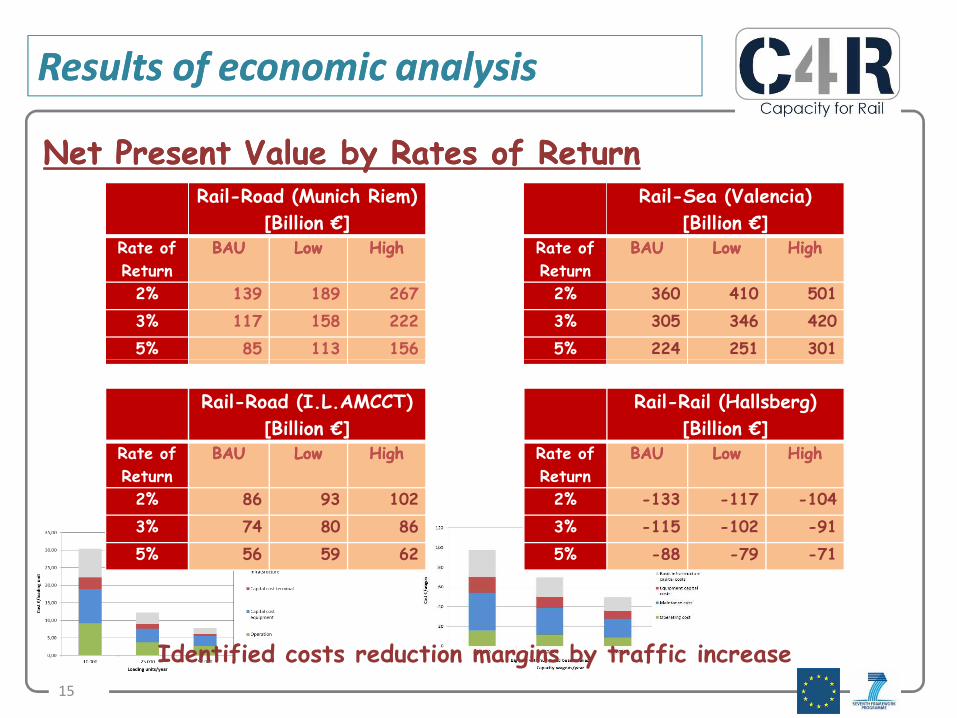
Results of economic analysisResults of economic analysis
Net Present Value by Rates of ReturnNet Present Value by Rates of ReturnRail-Road (Munich Riem)
[Billion €]
Rate of
Return
BAUBAU LowLow HighHigh
2% 139 189 267
3% 117 158 222
5% 85 113 156
Rail-Sea (Valencia)
[Billion €]
Rate of
Return
BAUBAU LowLow HighHigh
2% 360 410 501
3% 305 346 420
5% 224 251 301
15
Identified costs reduction margins by traffic increase
Rail-Rail (Hallsberg)
[Billion €]
Rate of
Return
BAUBAU LowLow HighHigh
2% -133 -117 -104
3% -115 -102 -91
5% -88 -79 -71
Rail-Road (I.L.AMCCT)
[Billion €]
Rate of
Return
BAUBAU LowLow HighHigh
2% 86 93 102
3% 74 80 86
5% 56 59 62

Summary of resultsSummary of results
Achieved milestonesAchieved milestonesa) Definition of terminals typologies capable to cover large majority of
rail freight traffic
b) Identification of set of KPI by terminal typology capable to represent
operational modes and to be sensitive to effects of innovations
c) Focused and enlarged case studies
d) Identification of innovations suitable to be included in consolidated
16
d) Identification of innovations suitable to be included in consolidated
scenario for each terminal typology and case study
e) Identification of innovations suitable to increase global efficiency of
logistic chains
f) Assessment of future terminal performances including effects of
innovative technologies and operational measures
g) Calculation of operational and investment costs of newly designed
terminals business case and cost-benefit analyses
h) Consolidation of methodology for future traffic estimation, financial
and cost-benefit analysis

FollowFollow--upsups
Generally valid feedbackGenerally valid feedback1) Achievable operational standards of intermodal and wagonload
terminals
2) Financial results concerning the business case of terminals
3) Economic results from the societal viewpoint useful to select future
European actions in freight transport and rail systems fields
Towards C4R next stepsTowards C4R next steps
17
Towards C4R next stepsTowards C4R next steps WP2.4, preparing catalogue of specifications for future rail freight
terminals
SP3, developing operation strategies increasingly using automation to
optimised performance and enhance capacity at network level
SP5, cross cutting technical work streams of various SP to ensure
whole-system approach to draw common vision of future affordable,
adaptable, automated, resilient and high-capacity railway system