Embed Size (px)
Citation preview

Building Institutional
Capacity and
International
Enrollment through
Public-Private
Partnerships
NACUBO Annual Meeting July 2012

Presenters
Andrew Colin
Chairman
INTO University Partnerships
Amy Parsons
Vice President for University Operations
Colorado State University
Nick Setteducato
Exec. Director for Financial Management & Resource Planning
Academic Affairs, University of South Florida
Brian Thorsness
Director of Business Services
Oregon State University

Challenging Times for Universities
• Funding and regulatory issues
• Increased student expectations
• New entrants and new strategies
• The challenge of institutional
development – adapting to changing
circumstances
Challenging Times for Public Universities
FY 2010 US public university state funding median of 29.1%)
Why Enhance International Enrollment?
• Provide new, independent revenue streams
• Enhance the quality of the college experience
• Provide a more global perspective
• Expand the university brand globally
• Maximize best use of resources and best practices
• and provide new, independent revenue streams

Megatrends Shaping Supply and Demand
Globalization Demand for quality
education Global policy
contexts
Unrealized power of HE brands
Technological Change
Employment Preparation
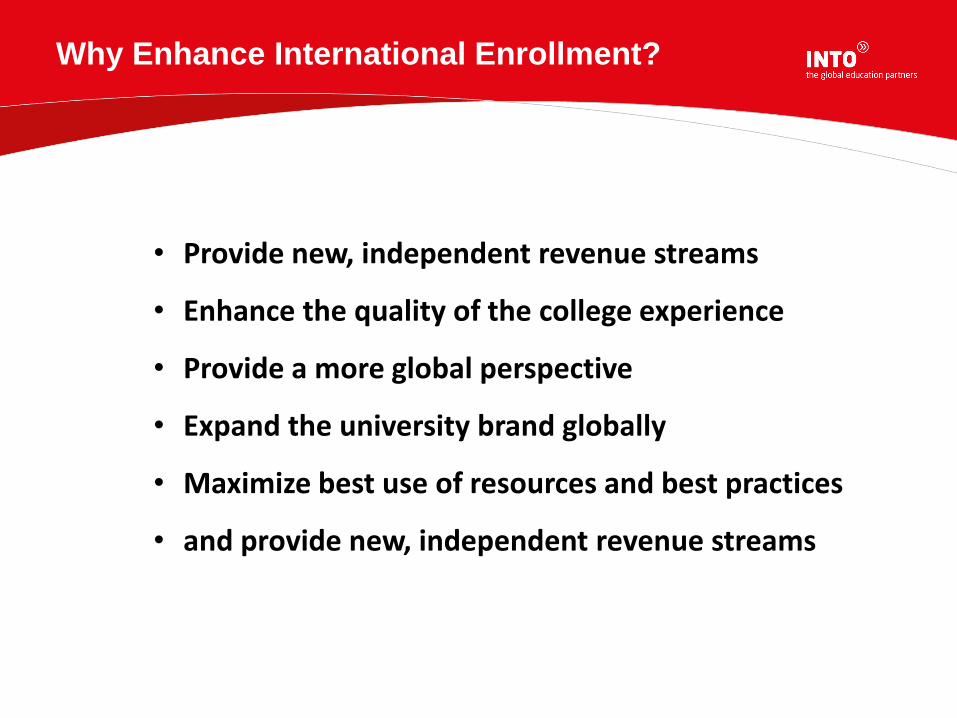
The number of higher education students has increased five-fold since 1970
Continuing Growth in Demand
1970
28m
1980
50m
1990
100m
2000 164m
2020 260m

In 1975, there were 800,000
students studying outside their own country
By 2020, there are projected to
be over 7,000,000
International Mobility

Strategic Options to Internationalize Enrollment
9
• Short term
• Loss of competitive edge
• Opportunity cost
Do Nothing DIY • Limited reach
• Scarce resources
• Lack of institutional buy-in
Outsource • Short term
• Risk to reputation
• Tactical NOT strategic
Partner
• Complementary assets
• Shared investment
• Shared risk • Shared reward

About INTO
Through innovative
partnerships with
leading universities,
we expand
opportunities for
higher education,
ensuring success
and transforming
the lives od our
students and staff.

Unique Public-Private Partnership Model
Joint Venture with leading universities
that offers
• Common academic principles
• A flexible business model
• 50/50 equity and risk
Deeply embedded
partnerships that engage
and benefit the entire
university long term

The INTO Model
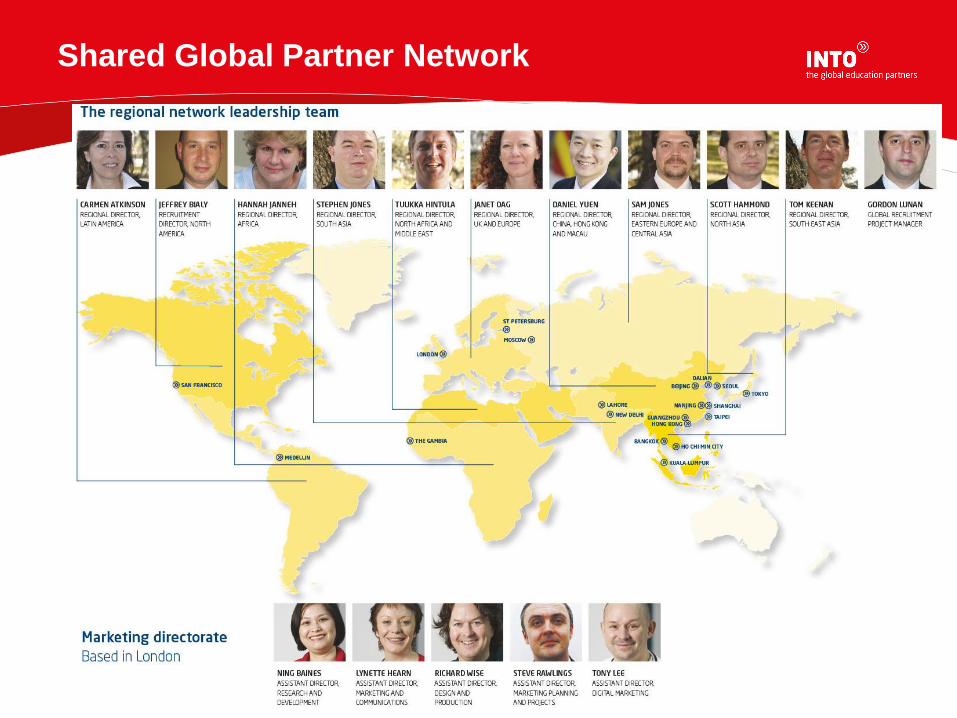
Shared Global Partner Network

Senior Management Team
Internationally Recognized Education Professionals

Growth of the INTO Network
Providing capacity building solutions to 15 partner universities since 2006
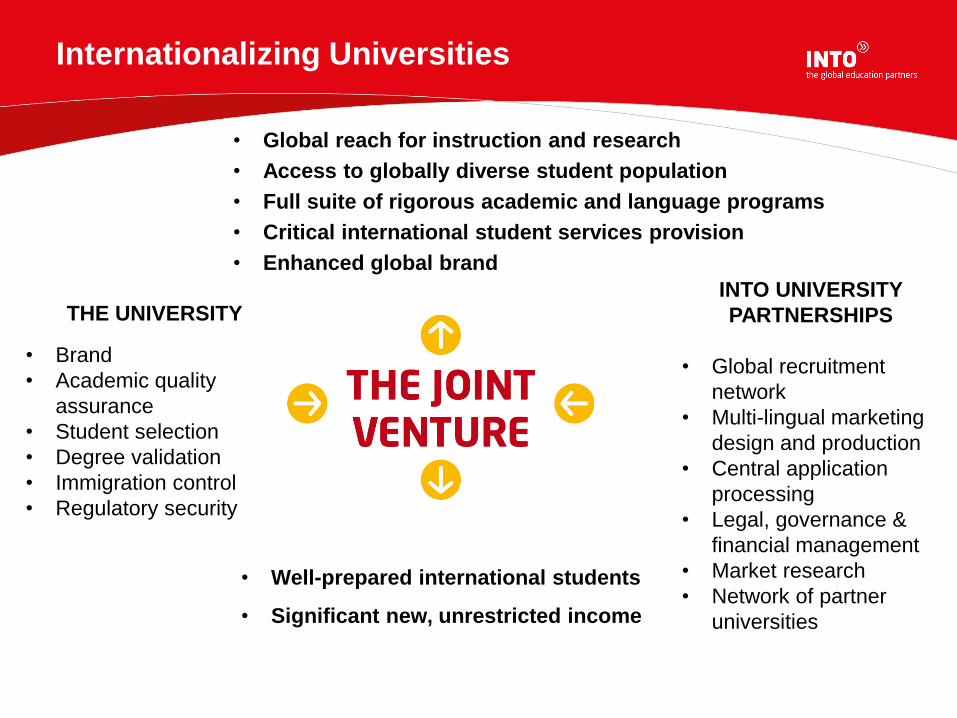
Internationalizing Universities
• Global reach for instruction and research
• Access to globally diverse student population
• Full suite of rigorous academic and language programs
• Critical international student services provision
• Enhanced global brand
• Well-prepared international students
• Significant new, unrestricted income
INTO UNIVERSITY
PARTNERSHIPS
• Global recruitment
network
• Multi-lingual marketing
design and production
• Central application
processing
• Legal, governance &
financial management
• Market research
• Network of partner
universities
THE UNIVERSITY
• Brand
• Academic quality
assurance
• Student selection
• Degree validation
• Immigration control
• Regulatory security
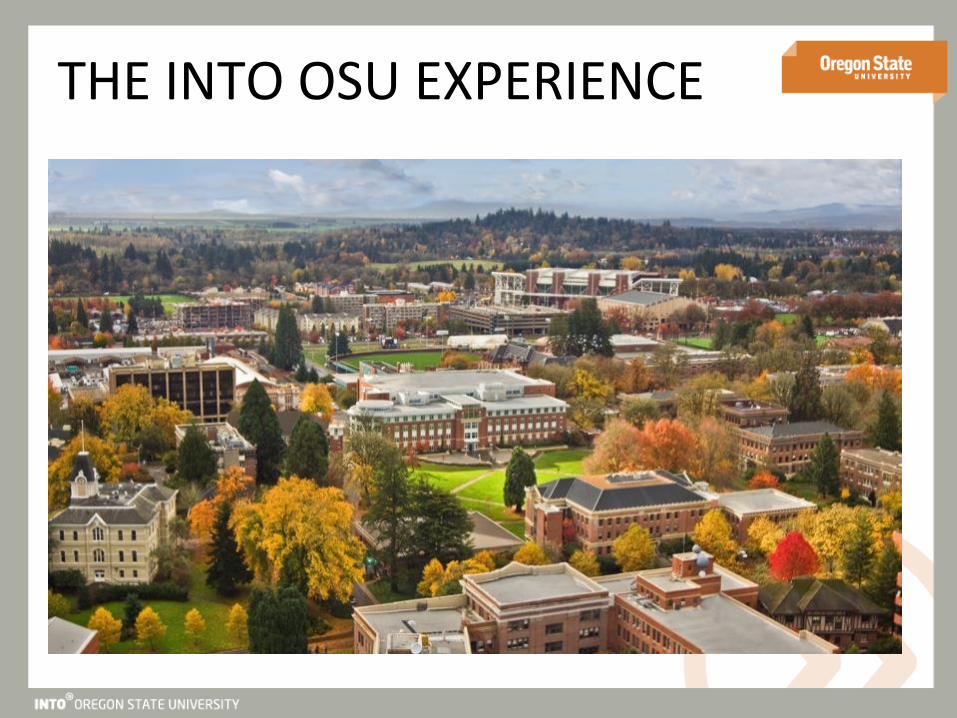
THE INTO OSU EXPERIENCE
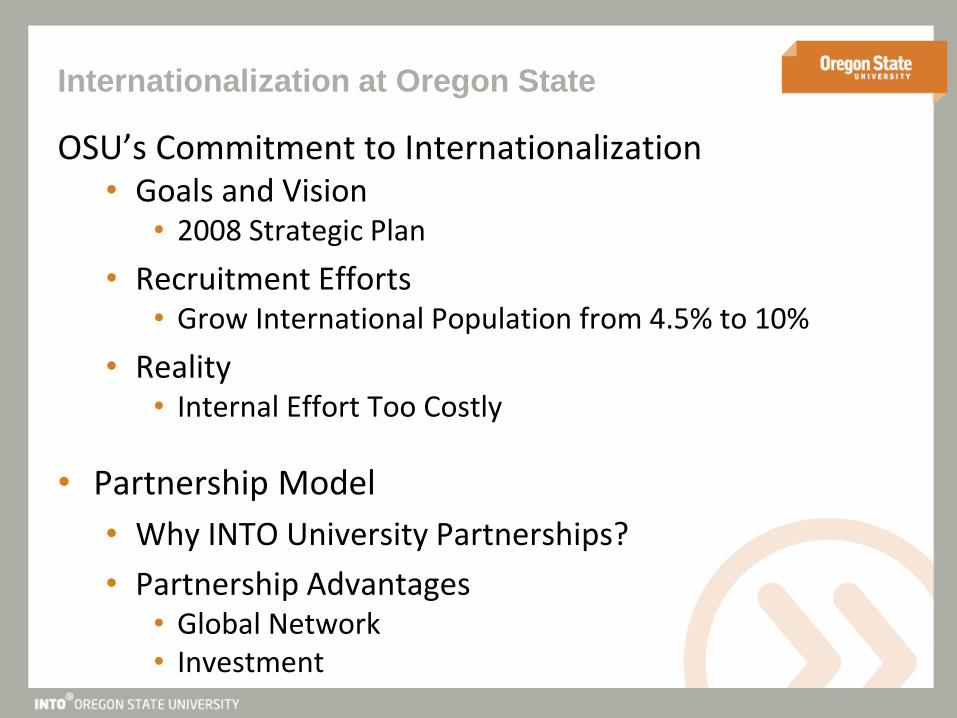
Internationalization at Oregon State
OSU’s Commitment to Internationalization • Goals and Vision
• 2008 Strategic Plan
• Recruitment Efforts • Grow International Population from 4.5% to 10%
• Reality • Internal Effort Too Costly
• Partnership Model
• Why INTO University Partnerships?
• Partnership Advantages • Global Network • Investment

275 308
399
468
624 593
710
776
85 114
155 184
145 151
270 278
11
68 83
141 172 169 184
360
433
622
735
910 916
1149
1238
0
200
400
600
800
1000
1200
1400
Fall 2009 (A) Spring 2010(A)
Fall 2010 (A) Spring 2011(A)
Fall 2011 (A) Spring 2012(A)
Fall 2012 (F) Spring 2012(F)
English
UG PW
Grad PW
Total
Snapshot Historical Performance & Forecast
|------Projected--------|
* Note: TOEFL entry requirement for UG Pathway was raised from 475 to 500 in Fall 2011. This change required many
students to take at least one term of Academic English prior to Pathway start, resulting in decreased PW and increased AE.

Progression Statistics & Predictions
Actual after 3 terms Predicted with 3+ terms
All INTO-OSU Pathway Students 61% (target 60-70%) 80% (exceeds target 60-70%)
UG Pathway 69% 85%
Grad Pathway MEng 60% (predicted*) 78%
Grad Pathway MBA 55% (predicted*) 77%
• 4.3% International Student Population
• Goal: Reach 10% by 2014 2008
• 8% International Student Population
• Reached 80% of Goal after only 3 years 2012
* Grad PW students are taking GRE and GMAT tests this summer.

The Partnership Model
Revenue Flow
INTO OSU
Oregon State University
OSU Student Services
Tuition and Fees from INTO OSU students
IUP: Supplies Mktng, other resources & receives 50% of surplus
OSU: Supplies academic programs, facilities, & receives 50% of surplus
OSU Colleges
OSU profits are reinvested in the University, not in the INTO OSU Center. ¾ of the surplus goes
directly to OSU academic colleges and
¼ goes to OSU student support units.

Focus for the Future
• Achieving closer integration with OSU
• Assuring academic quality and brand
• Integration of students
• Opportunities for domestic students
• New $52M living-learning center
• Updates to programs
• Admissions
• Embracing the network
• Assisting with Direct Admits

THE INTO USF EXPERIENCE

• Why Internationalization?
• USF Background
• Options considered
• Challenges
• Experience since start
• Successes
Consideration of a joint venture model

Why Internationalization?
USF’s strategic plan includes targets for an increase in the international student population in order to be better aligned with globally competitive institutions
Qualitative and quantitative metrics supporting:
1. Recruiting the best and brightest intellectual talent
2. Enhancing the quality and relevance of education at USF
3. Enhancing USF’s global reach
4. Providing for an economic stimulus for our community
5. Alternative revenue generation for reinvestment in the university

Background: The University of South Florida
• Three campuses: Tampa (Main Campus including USF Health), St. Petersburg, and Sarasota-Manatee
• > 47,000 students system-wide
• Carnegie-Designated Research University (Very High Research Activity), Community Engaged
• 27th Top American Research Universities (TARU)
• Economic impact $3.7bn
• Ranked 44th total research expenditures
• Awarding 11,000+ degrees annually
• 212,000 alumni in all 50 states and 124 nations
• Common dilemma of reduced state appropriations

-
500
1,000
1,500
2,000
2,500
3,000
3,500
4,000
4,500
5,000
UF * FIU UCF USF FSU
Source: International Edcuational Exchange (IIE) Open Doors database, 2008-09 data
4% of total student
population
9%
of total student
population
5% of total student
population
8% of total student
population
4% of total student
population
Background: International Students USF vs. State University System Peers
(2008-09)

What options were considered?
1. Invest in internal international recruitment located in Tampa – Cost prohibitive – Effectiveness questionable without local presence in country
2. Invest in internal international recruitment with presence in key international locations coordinated centrally from Florida – In addition to the issues cited above:
• Logistics • Lack of expertise
3. Third-party options: – Outsource expertise
• If only to compliment internal options cited above, the above barriers still pertain
– Public-private partnership with established presence and results
• Allows USF to focus on its core strengths
• Removes reliance upon public funding for out-of-state enrollment growth
• Short list included INTO_UP who was recognized as the most reputable and effective leader in this business model

Why INTO?
• Proven, powerful international recruiting model and regional network
• Several very successful JV’s already in existence at the time:
– 9 in UK – Oregon State in the US
• Planned future growth is centered within the US market
• Represented an opportunity for USF to get in on ‘bottom floor’ of their US expansion (Particularly in the Southeast region)
• Provided for a public/private partnership (i.e., 50% / 50% ownership) thereby creating potentially “fungible profits”

Successes
• Growing, integrated and engaged international student base
• Refreshing, dynamic and synergistic relationship
• Ahead-of-plan rates: Progression-to-degree-seeking / graduation rates: Over 275 student have matriculated from pathways to USF degree programs since inception in Fall 2010
Over 20 ‘former’ pathway students have graduated from their degree program
• Initial investments have ‘paid back’ ahead of plan: – Tuition funds are flowing back to colleges for instruction – Profits from partnership are accumulating for strategic use – More full fee paying internationals at USF (30% increase)
• JV is operating at profit ahead of planned timing
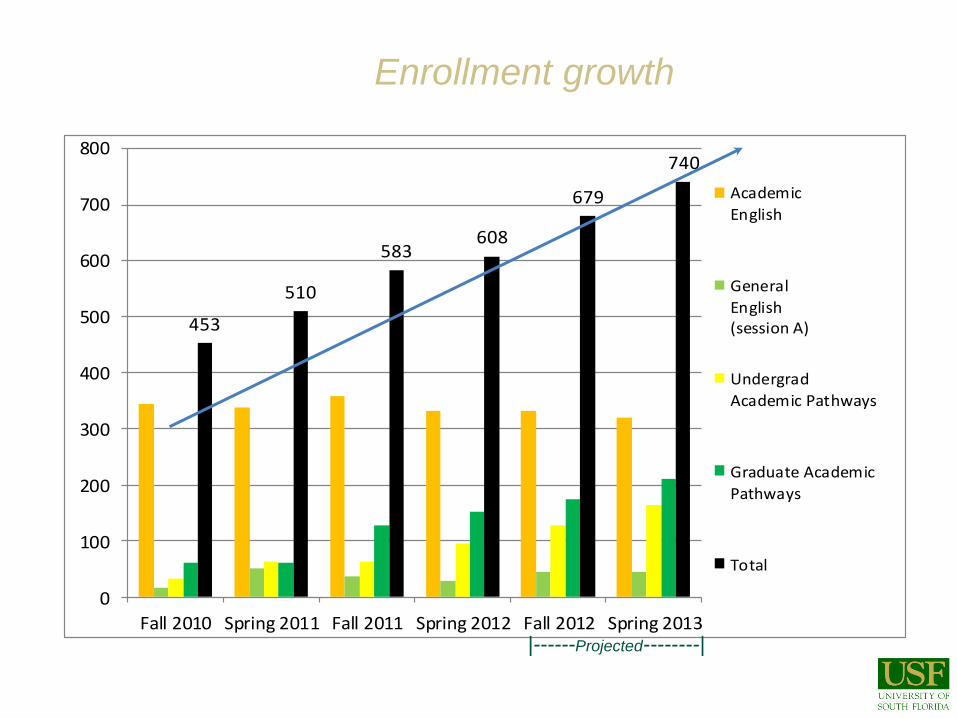
Enrollment growth
453
510
583608
679
740
0
100
200
300
400
500
600
700
800
Fall 2010 Spring 2011 Fall 2011 Spring 2012 Fall 2012 Spring 2013
Academic
English
General
English(session A)
Undergrad
Academic Pathways
Graduate Academic
Pathways
Total
|------Projected--------|

Challenges
• Creating the separation contractually and operationally
• Integrating systems and facilitating reporting needed – Tracking charges between USF and INTO USF – Communication and Processes
• Immigration and cultural challenges
• Providing ‘fast track’ processing for Admissions – Streamlined Application – Pre-screening – Outsourcing transcript evaluation
• General ‘growing pains’ – Staffing
– Academic progression
– Balancing private and public expectations
– Interim facilities vs. permanent

Looking to the future
• Continued growth expected
• Steady-state of organization staffing
• New International center on campus
• Continued innovations in joint recruiting and marketing
• Demographic distribution
• Customization and “niche” programs
• Win-win for both partners

THE INTO CSU EXPERIENCE
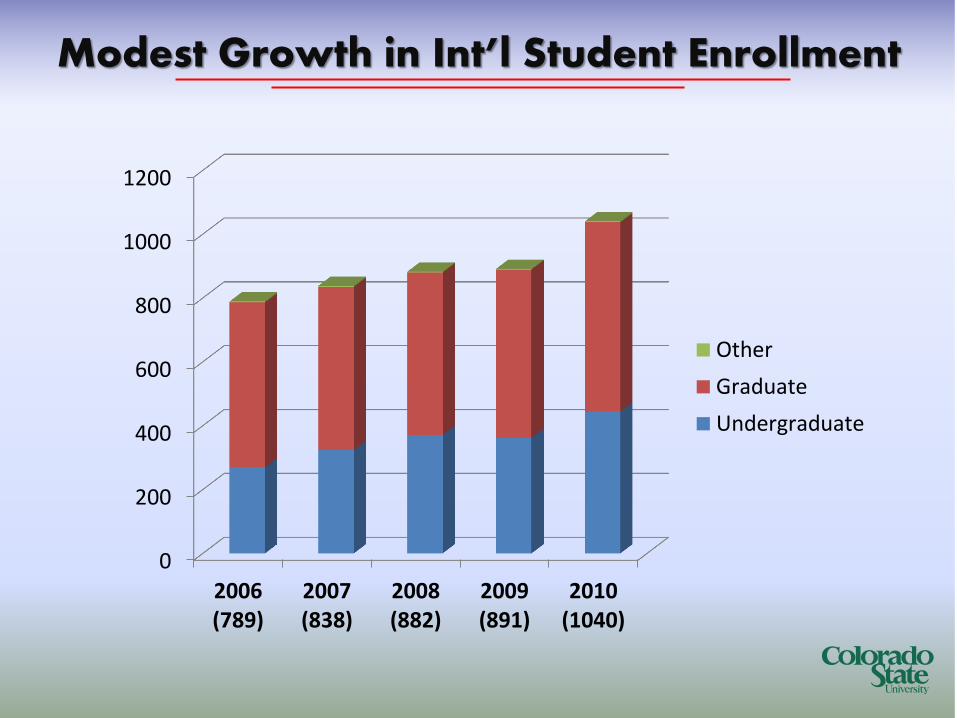
0
200
400
600
800
1000
1200
2006(789)
2007(838)
2008(882)
2009(891)
2010(1040)
Other
Graduate
Undergraduate
Modest Growth in Int’l Student Enrollment

Potential for Significant Growth International Students
as a Percent of the Total Student Population
______________________________________________________________________________________________________________________________________________________
Purdue University 15%
Iowa State University 11%
Michigan State University 11%
Texas A & M University 9%
North Carolina State University 8%
Ohio State University 8%
Oklahoma State University 8%
Oregon State University 8%
Washington State University 6%
Colorado State University 4%
University of California, Davis 4%

INTO’s Proposal to CSU INTO proposes the establishment of a long-term joint venture partnership with Colorado State University to develop a state-of-the-art international student center called INTO Colorado State University to support and expand the University’s comprehensive internationalization agenda
The partnership will have three key objectives:
1. To accelerate the internationalization of Colorado State University by increasing the quality, quantity, diversity and sustainability of the international student population.
2. To enhance the probability of success for international students to matriculate to, actively participate in and successfully complete CSU’s mainstream undergraduate and graduate degree programs by providing a wide range of academic pathways and English language programs.
3. To raise CSU’s global profile and yield significant financial returns to CSU by driving and sustaining revenue growth from non-resident tuition.

INTO CSU
May, 2011 Exploration of INTO Partnership
Oct., 2011 Signed MOU
Feb., 2012 Familiarization Visit
Signed Partnership Agreement
Recruitment Begins
Aug., 2012 First Students to Arrive at CSU
Jan., 2013 Projected Enrollment: 375

Alder Hall

Spruce Hall

INTO University Partnerships
IN SUMMARY

Positive Student Outcomes
90% overall student satisfaction

163% growth 2007/08 - 2011/12 (to date)
New Enrollments
30
2562
4177
5017
6004
6753
0
1000
2000
3000
4000
5000
6000
7000
8000
2006/7 2007/8 2008/9 2009/10 2010/11 2011/12(ytd)

University Impact

Financial Impact
Be
Success for partners
The additional revenue from our partnership with INTO has allowed us to invest in 75 new members of our tenure track faculty and support staff to complement those hires this year and next.
Mark McCambridge Vice-President for Finance and Administration
Oregon State University

QUESTIONS?
Please do not hesitate to contact us directly with questions
David Stremba Managing Director, North America [email protected]

Keep in touch