Embed Size (px)
Citation preview


CAPABLER E A D YS T R O N GS T E A D Y& T R U E

S T R O N G R E S U LTSST E L L A RRETURNS
,

3
As the world paused to confront a pandemic, MPT’s hospital operators never stopped working to help as many patients as possible. MPT didn’t stop either, with continued support for the healthcare community and with key transactions that further expanded the company’s global reach.

4
2020 SHOWED THE STRENGTH OF MPT’S INVESTMENT STRATEGY
In a year defined by the pandemic, Medical Properties Trust will remember 2020 as a year when MPT hospitals met acute care needs around the globe and showed their essential and undeniable value. I also will remember it as a signature year when MPT increased its position for even more growth, outperforming peers on nearly every financial metric available for comparison. This was the year that the very foundation of MPT’s business model—investing in hospitals—garnered a new level of attention as the world rallied around its hospital care infrastructure. I couldn’t be more proud.
Indeed, the 2020 stress test that was forced upon healthcare providers demonstrated why MPT invests in hospitals: They are the top of the pyramid of the healthcare delivery system. They are critical to a local community’s infrastructure. They are absolutely essential, and the performance of front-line workers within them is extraordinary—during a pandemic and every single day. And very importantly, we know hospitals.
In 2020, MPT showed just how essential it has become for investors in the healthcare sector, too, and its outperformance and global growth were truly extraordinary, by any standard in any year. I was proud to see operators of MPT hospitals perform flawlessly during the fight against a virus no one could
have seen coming and prouder still to give them the company’s unwavering support through it all.
ACCOMPLISHMENTS AMID A PANDEMIC
The pandemic environment makes what MPT achieved in 2020 even more impressive, outperforming benchmark indices such as the SNL U.S. REIT Healthcare Index and the SNL U.S. REIT Equity Index by substantial percentages of 15% and 14%, respectively. MPT also delivered investors a total shareholder return (TSR) of 9% in 2020, bringing TSR since MPT’s 2005 initial public offering (IPO) to an incomparable 566%.
The company continued its unrelenting growth, investing in almost $3.6 billion in domestic and international assets. MPT started the year with an almost $2 billion acquisition of 30 BMI Healthcare hospitals. By May, the company had established a joint venture for investing in the operations of international hospitals. This move laid the groundwork for a November $135 million investment in three acute care hospitals in Colombia, an exciting expansion to South America that adds a fourth continent to MPT’s portfolio.
Among other key transactions, MPT increased its ownership of Infracore SA, which owns the real estate assets of Swiss Medical Network, the second-largest private operator in Switzerland. Additionally, the company acquired
2020 was an unbelievably successful and transformational year for MPT, and while many will remember the year for other reasons, I am proud that the original idea behind MPT and the evolution of its model created success for the company and for shareholders.
LETTER TO INVESTORS
5
quality hospitals with established operators, such as Prime Healthcare, Circle Health Group and MEDIAN Kliniken, while opening new relationships with operators that include the National Health Service in the United Kingdom and Curahealth Hospitals, a leading U.S. operator of inpatient rehabilitation hospitals. MPT also commenced promising development projects in the U.S., including construction of two inpatient rehabilitation facilities in California that are pre-leased to Ernest Health.
Throughout 2020, the acquisitions team diligently worked toward a landmark transaction that closed in early 2021: For approximately $1.1 billion, MPT purchased interests in 35 behavioral health facilities operated by the Priory Group, a leading behavioral health operator in the United Kingdom, from Priory’s U.S. parent. As part of our joint bid with affiliates of Waterland Private Equity, the sponsor of our highly successful German post-acute operator MEDIAN Kliniken, we also acquired 9.9% of Priory Group operations. Expanding MPT’s footprint in the U.K. healthcare real estate market in a bold way, this
acquisition brings diversity to its portfolio by growing the company’s position in the behavioral health sector. MPT expects to develop a significant presence in this valuable area as more patients search for quality services and care for mental health needs.
Overall, MPT hospitals performed exceptionally well in 2020, with strong coverage ratios despite the forced shutdowns for elective surgeries and other disruptions caused by COVID-19. Inclusive of $706 million in grants through the CARES Act fund, MPT’s same-store portfolio EBITDARM coverage for all sectors for the trailing 12 months ending the third quarter of 2020 was 3.1x. This represents a 19.2% increase year over year. But remarkably, even when those grants are removed, the same-store portfolio EBITDARM coverage for all sectors for the trailing 12 months ending the third quarter of 2020 was still an incredibly strong 2.0x. These are impressive coverage ratio figures that demonstrate why paying the rent was never an issue for our tenants, even though normal operations at their facilities were essentially shut down for two to three months.
What I’m most proud of in 2020 is that the business model MPT envisioned nearly 20 years ago, and has continuously refined, put the company in a position to thrive in an adverse environment that could not have been predicted. Communities need the hospitals in which MPT chooses to invest, its operators are the best in the business, and MPT is excited to continue executing on what is a very exciting pipeline of opportunities in 2021 and beyond.
ONE OF THE STRONGEST, MOST DIVERSIFIED PORTFOLIOS
The transactions MPT executed during 2020 resulted in MPT pro forma total gross assets of approximately $20.4 billion—up from $16.5 billion one year earlier. That includes $15.1 billion in general acute care hospitals, $2.2 billion in inpatient rehabilitation hospitals, $1.7 billion in behavioral health facilities, and $0.6 billion in long-term acute care hospitals and other facilities. By year’s end, MPT’s portfolio included 392 properties, and MPT increased that number to 430 after a robust start to the new year. MPT now operates in 33 U.S. states, nine countries and on four continents, with 43,895 licensed beds.
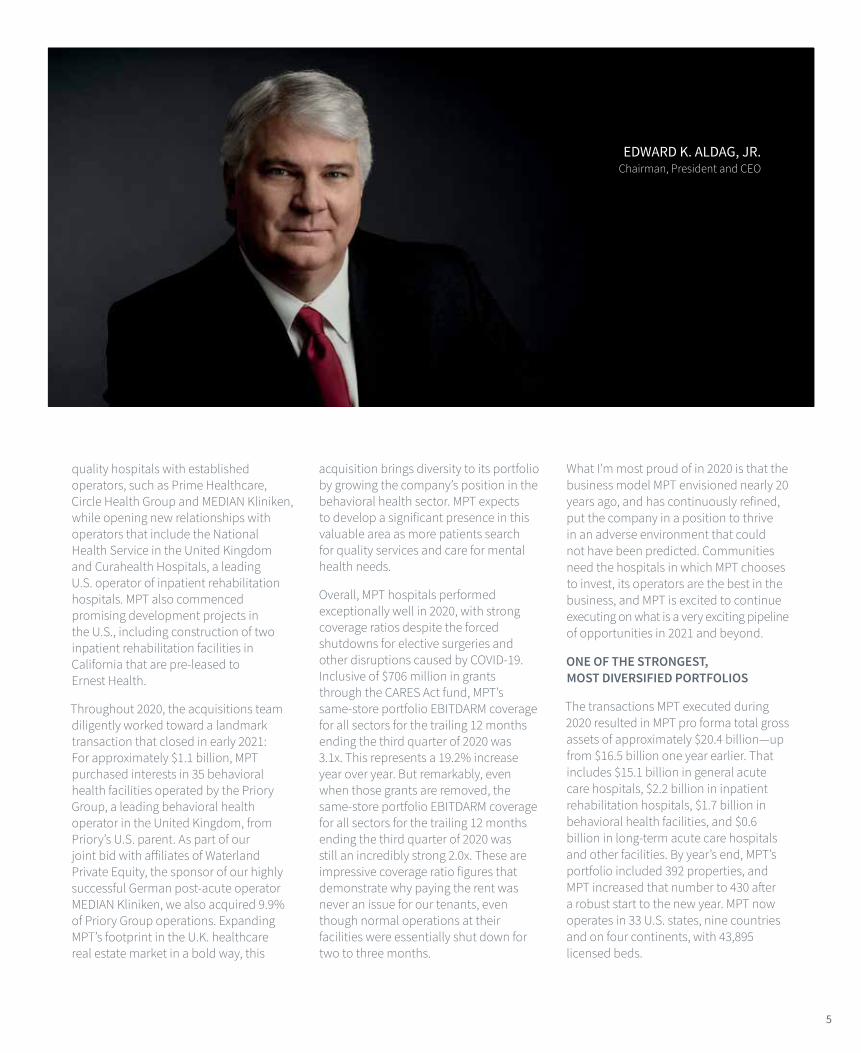
EDWARD K. ALDAG, JR. Chairman, President and CEO

6
I’m proud to have improved MPT’s concentration metrics so that no single property accounts for more than 3% of its total pro forma gross assets. The acquisitions and asset management teams painstakingly underwrite every individual hospital in which the company invests, and part of this process is developing specific local market contingencies for the rare day in which a tenant is in danger of not meeting its financial obligations. There will always be an operator willing and able to profitably operate an essential hospital.
Without a doubt, MPT has built one of the most enviable and formidable portfolios in the REIT universe. And I’m proud it has a 2020 market-leading normalized funds from operations per share growth rate of 21% year over year. That’s the highest growth rate among U.S. Equity REITs with over $5 billion in market cap.
FEELING OUR INTERNATIONAL PRESENCE
The challenges of not only maintaining constant contact with existing MPT operators around the world during a pandemic but also achieving the second largest investment total in the company’s history in that same year made it clear to me that further investing in people, relationships and office space internationally since our entry into Europe in 2013 was an important move. The physical presence of MPT’s Luxembourg office was critical in working with governments across Europe to ensure that MPT facilities and operators were available to best care for local populations. Simultaneously, the same personnel were executing successful transactions in the U.K., Switzerland and
Germany throughout 2020 and were ready to spring to action when the Priory Group portfolio came to market later in the year.
In the same spirit, MPT has opened an office in Sydney, Australia, which I expect to anchor an expanding presence in the Asia-Pacific region. The ability to make face-to-face contact with key relationships is a critical advantage in pursuing growth opportunities, and I am confident that the exponential growth the company has experienced in Europe through its long-established presence in Luxembourg will echo over to what MPT is doing in Australia. While the company’s initial investments in South America do not yet necessitate a physical presence, I am certainly excited to see what the future may bring.
The heart of everything MPT does is to make better healthcare available to more people around the world. I have no plans to stop the company’s growth trajectory, and MPT will continue to invest in physical and human assets as it expands its reach.
SHARING SUCCESS WITH INVESTORS
I’m grateful to the investors who have shared in the benefits of a more than doubling of MPT’s pro forma total gross assets to well above $20 billion since the end of 2018. While sheer scale has its benefits, the company grew in a manner that significantly increased earnings and dividends for shareholders. This is nothing new, as MPT has created an astounding $6.9 billion in shareholder value since its 2005 IPO and has increased its dividend at a 4% annual rate over the past 10 years, including a near 6% increase in 2020. I look forward
to executing on a promising pipeline of similar opportunities going forward.
MPT’s value proposition relies on its people, its relationships and its unwavering focus on investing in the essential hospital infrastructure of the world. 2020 was an unbelievably successful and transformational year for MPT, and while many will remember the year for other reasons, I am proud that the original idea behind MPT and the evolution of its model created success for the company and for shareholders. The bottom line is that MPT’s same-store portfolio, with government-mandated shutdowns of elective procedures for nearly a full quarter and prior to receipt of any related grant funds, earned double the amount of income necessary to pay the rent. This is not luck nor coincidence but a testament to the quality of the MPT portfolio, assembled over the course of almost two decades, and to the nimble operating mentality of MPT operators.
The world now knows without a doubt that hospitals are the only environment in which the most acute medical care can be delivered, period. This is logic long embedded in the culture at MPT. The culture and practices we have built over the past 18 years served us very well in 2020 and will continue to do so in the future.
Edward K. Aldag, Jr. Chairman, President and CEO

St. Francis Medical CenterLynwood, California

8
Edward K. Aldag, Jr., founded MPT with a singular, unwavering belief: It’s smart to invest in hospitals. That bedrock tenet vaulted MPT to a leadership position in the healthcare sector long before the pandemic. Now the company’s value proposition is more attractive than ever.
Co-founders R. Steven Hamner and Emmett E. McLean have helped cast this vision of a hospital-centric investment strategy, watching the company outperform with continual growth and success. “2020 absolutely proved that what we’ve been saying all these years has been accurate: Our facilities are
indispensable,” Hamner says, “every bit as permanent and required in a community as any other part of the infrastructure, whether it’s the utility systems or road systems. Investors have been rewarded for that and will be in the future.”
In 2020, Aldag, Hamner and McLean kept the company on track for intentional growth in the U.S., the U.K., Western Europe, Australia and now Colombia and beyond. Looking ahead, the company will rely on what it knows: hospitals. MPT hospitals are vital to the health of their communities.
With strong leadership during a pandemic-influenced year, the leadership of MPT led the company to new growth and greater global influence.
STRONG LEADERSHIP, STELLAR RESULTS

9
EDWARD K. ALDAG, JR. Chairman, President and Chief Executive Officer
Like every chief executive facing COVID-19, Aldag never could have imagined how the pandemic would shape the year. In February, he was scouting acquisitions in the U.K., but by March he was directing a fully functional, virtual workplace ahead of many other businesses. Despite the lockdown, MPT still outperformed, still grew and still set the table for more deliberate expansion in 2021. “I’m proudest of the business model we established over the 18 years leading up to the pandemic, when our model was so obviously validated,” Aldag says.
“Our focus has always been acute care, and in good times and bad, the acute care hospital is going to stay at the top of the pyramid when it comes to healthcare delivery.”
With compassionate leadership, grounded in personal knowledge of the healthcare industry, Aldag led MPT to achieve even more in 2020, at the same time caring more deeply than ever about how the world best delivers healthcare.
R. STEVEN HAMNER Executive Vice President and Chief Financial Officer
With a background as a certified public accountant and having oversight of the company’s finances, Hamner naturally watched the year unfold with a sharp eye on financial performance. As a co-founder of MPT, he also was gratified to see that MPT’s properties were fulfilling their mission. “Our buildings were being used to treat millions of patients,” he says.
The hospitals remained in constant operation. Because governments required hospitals to stop providing nonessential care to patients and focus on pandemic victims, many supplied hospitals with funding to ensure they remained fully operational. “This is why MPT offers such a great investment opportunity—because somebody is going to pay to have these hospitals open. The people demand it,” Hamner says.
The hospitals performed well, and so did MPT. According to Hamner, years from now, when outsiders look back at MPT’s numbers from 2020, they won’t be able to tell there was a pandemic. “We continued to grow, and we continued to collect our rent,” he says. Despite the year’s circumstances, it was, in many ways, business as usual for MPT.
EMMETT E. MCLEAN Executive Vice President and Chief Operating Officer
According to McLean, MPT has met obstacles with a can-do attitude throughout its history, including during the pandemic. “Think back to your mindset in March, April, May 2020—the uncertainty and fear,” he says. “Yet, it’s what you do with a challenge that matters more than what the challenge is. That perspective is ingrained in our way of doing business for the past 18 years and in how we deal with different challenges. The pandemic just happened to be an extraordinary example, and I’m hopeful it had a once-in-a-century kind of impact.”
When McLean joined MPT, he brought investment banking and healthcare finance skills to the trio, along with a heart for civic and charitable causes. An integral part of every potential acquisition, McLean brings a keen eye for assessing medical facilities to every site visit. He points to the strength of the hospital operators MPT has partnered with and to the talented MPT employees as reasons the company performed so well in 2020. He witnessed remarkable dedication and mission-minded work at MPT all year long.
“Maybe it’s our culture, but we believe in working together as a team. You do better if you’re all marching in the same direction,” he says. “In 2020, we just kept on doing what we do.”
From left to right: Charles R. Lambert – vice president, treasurer and managing director of Capital Markets; Rosa H. Hooper – vice president, managing director of Asset Management and Underwriting; R. Lucas Savage – vice president, head of Global Acquisitions; Edward K. Aldag, Jr. – chairman, president and CEO; R. Steven Hamner – executive vice president and chief financial officer; Emmett E. McLean – executive vice president, chief operating officer and secretary; J. Kevin Hanna – vice president, controller and chief accounting officer

�������������������������� ������
����
����
�����
�����
�����
�����
����
���
����
����
����
����
����
����
����
����
���
��������������������
�����������������
����������������
���������
�������������
�����������
�������� ������������������������������
��������������������
MPT PORTFOLIOEXPANSION & GROWTH CONTINUE
PROPERTIES
430
COUNTRIES
9
U.S. STATES
33
CONTINENTS
4
With an ever-increasing global presence, MPT forged new relationships and planted a stake in South America in 2020. Now poised for more opportunities in Colombia and within Australia, Western Europe and the U.S., the company continues to partner with world-class operators around the world.
Pro forma portfolio statistics are as of December 31, 2020, and assume fully funded commitments.

�������������������������� ������
����
����
�����
�����
�����
�����
����
���
����
����
����
����
����
����
����
����
���
��������������������
�����������������
����������������
���������
�������������
�����������
�������� ������������������������������
��������������������
OPERATORS
50
BEDS
43,895
12
MPT burst from the worldwide economic uncertainty caused by the pandemic to outperform on virtually every measure. That included cash flow, investment dollars, stock price and MPT’s consistently impressive total shareholder return (TSR), according to Edward K. Aldag, Jr., chairman, president and CEO.
Indeed, MPT boasts a stunning 566% TSR since its initial public offering in 2005, eclipsing the performance of the S&P 500 and REIT benchmark indices for the same period. Notes R. Steven Hamner, executive vice president and
chief financial officer, “In whatever period you look, MPT’s outperformance in TSR is just extraordinary. Those are objective numbers that measure the cash value we have created over the life of the company.” Beyond those impressive returns, MPT takes pride in the reasons behind them: sustained financial performance and perpetual growth and profitability. “We know better than anybody how to grow through hospital real estate investment,” Hamner says, “and as the market that we helped create has expanded, MPT is leading the way.” The numbers prove it.
MPT showed more than resilience during a challenging year. It showed stunning results that prove the company’s way of investing in the healthcare sector delivers for its investors—convincingly, as it has from the start.
IMPRESSIVE OUTPERFORMANCE
“Our business model is the reason why MPT performed so well in 2020. Hospitals are, without a doubt, essential.”
– Edward K. Aldag, Jr., Chairman, President and CEO
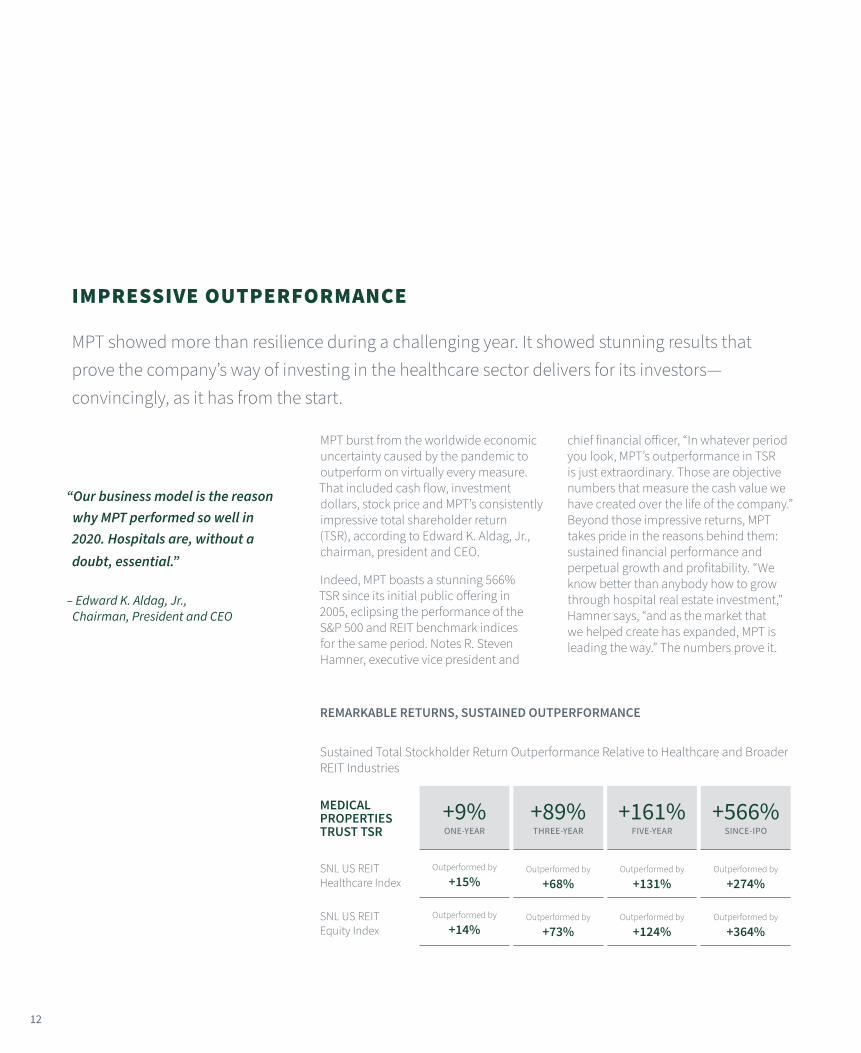
REMARKABLE RETURNS, SUSTAINED OUTPERFORMANCE
Sustained Total Stockholder Return Outperformance Relative to Healthcare and Broader REIT Industries
MEDICAL PROPERTIES TRUST TSR
+9%ONE-YEAR
+89%THREE-YEAR
+161%FIVE-YEAR
+566%SINCE-IPO
SNL US REIT Healthcare Index
Outperformed by
+15%Outperformed by
+68%Outperformed by
+131%Outperformed by
+274%
SNL US REIT Equity Index
Outperformed by
+14%Outperformed by
+73%Outperformed by
+124%Outperformed by
+364%

13
MPT GROWTH & PROFITABILITY CONTINUE
“We expect continued, double-digit per share
NFFO growth as we go into 2021.”
– R. Steven Hamner, Executive Vice President
and Chief Financial Officer
MARKET-LEADING NORMALIZED FUNDS FROM OPERATIONS (NFFO) PER SHARE GROWTH RATE
21% Year Over Year* The highest growth rate among U.S. equity REITs with over $5 billion in market cap.*As of December 31, 2020
NUMBER OF HOSPITAL OPERATORS
2019 412020 50
2018 30
2020 PRO FORMA TOTAL GROSS ASSETS
$20.4BUp from $16.5B in 2019
103%
INCREASE IN PRO FORMA TOTAL GROSS ASSETS SINCE 2018
2020 ASSETS CLOSED
Almost
$3.6B
DIVIDEND GROWTH IN 2020
Almost 6%
IMPRESSIVE COMP ON NFFO CAGR
Approximately 9%MPT’s Normalized Funds From
Operations Per Share CAGR over past 10 years
Approximately 3%Peer healthcare REITs (public
companies) over past 10 years
PRO FORMA TOTAL GROSS ASSETS
Increased at a
31%Compound Annual Growth Rate
(CAGR) from 2010-2020
2019
$16.
5B
2020
$20.
4B
2018
$10.
1B

C E N T E R O F T H EA C T I O N

15
MPT built its business plan on the cornerstone of investments in acute care hospitals. As 2020 revealed, it’s a foundation that serves the company—and the healthcare needs of global communities—very well. Indeed, during the pandemic, the world relied on first-rate facilities owned by MPT. Company leadership is proud of the hospital operators’ performance—and MPT’s.

16
MPT’s position as a leader in the healthcare real estate sector gave the company a unique perspective on how the pandemic swept across continental Europe and the United Kingdom—and on what was coming to the U.S. and other parts of the globe. As the disease crept across borders and moved in on unsuspecting emergency rooms, it found formidable battalions of medical workers and hospital personnel who stood up to it—and who are fighting still.
“The worldwide response to COVID-19 could not have been done without MPT facilities, where countless patients were treated,” says Edward K. Aldag, Jr., chairman, president and CEO of MPT. R. Steven Hamner, MPT executive vice president and chief financial officer, agrees, adding, “There isn’t another company or institution that has the breadth of vision into hospitals that we do.” In touch almost daily during the height of the pandemic, Aldag and counterparts at many hospital operators around the globe kept each other informed. Hospital administrators shared with Aldag and MPT what was happening in the corridors of their own facilities and how they were adapting to wage the 24-hour-per-day battle. Aldag in turn reassured them that the healthcare industry experts at MPT understood the fight and would support them in it.
MPT is proud to share three compelling firsthand accounts from executives at valued MPT hospitals in the United Kingdom, Italy and Spain. “These remarkable leaders and their hospitals are a testament to the quality of the facilities where MPT invests,” Aldag says.
PAOLO PIERI, CEOCIRCLE HEALTH, UNITED KINGDOM
Paolo Pieri had some early clues about how COVID could affect his hospital system in the U.K., thanks to information coming out of two hospitals operated by Circle Health in China, where the virus originated. “It was helpful to get that early feedback, to see the level of intensive care unit usage, the number of incubators and hospital beds needed,” he says. It was also alarming.
“The need for hospitals—and for hospital beds—was staggering,” Pieri says. Projections showed the government’s National Health Service (NHS) hospitals would need 200,000 beds. Circle had additional capacity that could help fill any gaps. “We went to the NHS early on—not just about helping COVID-19 patients, but about helping non-COVID patients in our hospitals across the U.K.,” he explains.
Circle played the valiant role of supporting the national effort to battle the pandemic by providing
WORLD VIEW
Look through the lens of MPT hospitals to see how the front-line fight against COVID-19 unfolded. Each story shows their brave and vital roles.

Circle Reading Hospital Reading, U.K.

Circle Reading Hospital Reading, U.K.
safe, specialized care for thousands. Specifically, it took in maternity patients, along with cancer and other immunosuppressed patients, providing a COVID-free environment in its private hospitals so NHS facilities could focus on COVID patients. Circle also shared staff with NHS facilities and welcomed NHS medical staffers to its hospitals.
Pieri is proud of data points that show how Circle interacted with NHS patients, introducing its services to citizens who may never have experienced care at a Circle Health hospital. And what’s more impressive, Circle made this contribution requesting only that the NHS cover costs during the period. “We did not ask for any premium or profit,” Pieri says.
“Basically, we said we’re just going to be an extension of the NHS during this pandemic.”
During the COVID crisis, Circle Health has:
• Logged more than 50,000 NHS patient admissions across its 53 hospitals,
• Made more than 280,000 NHS patient contacts during visits that included appointments, diagnostics and treatments, and
• Used more than 16 million units of personal protective equipment in providing care to patients.
In addition, Circle has been recognized in the medical community for its role in cancer care during the pandemic. “We believe we were the largest facility for esophageal cancer treatment, having essentially taken over that specialty area for the NHS during the pandemic,” Pieri says. He adds that Circle has demonstrated expertise in treating other
types of cancer as well, and patient outcomes to date have been excellent.
He remembers one patient who came to a Circle hospital in Nottingham for a cancer-related surgery in May 2020. Because NHS facilities were overstretched with the virus, she chose Circle rather than postponing care. “She probably wouldn’t have been treated so timely otherwise,” Pieri says. Throughout the pandemic, the leadership of MPT said yes to every innovation and reconfiguration that Circle proposed.
“I remember phoning Ed [Aldag] about 24 hours after talking with the NHS and telling him about repurposing our hospitals for the cause, including tearing down walls and bringing in other services and staff. He was very supportive, and immediately available in our subsequent conversations,” Pieri says.
19
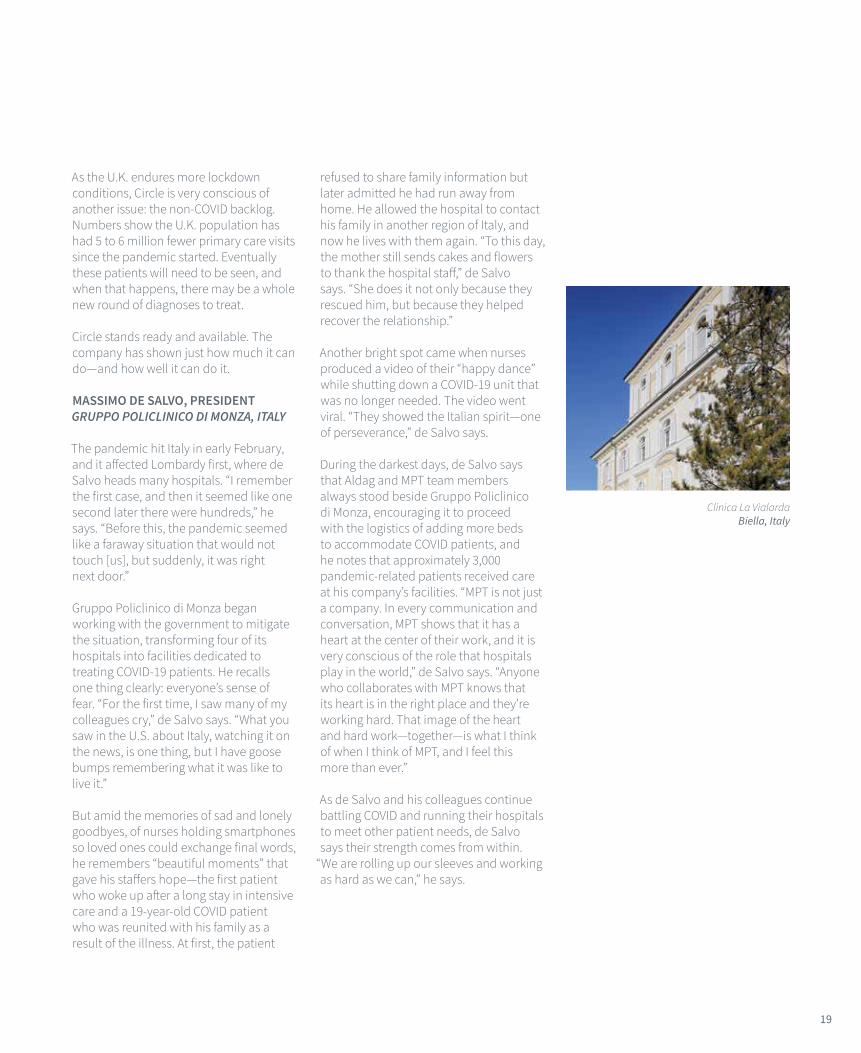
Clinica La VialardaBiella, Italy
As the U.K. endures more lockdown conditions, Circle is very conscious of another issue: the non-COVID backlog. Numbers show the U.K. population has had 5 to 6 million fewer primary care visits since the pandemic started. Eventually these patients will need to be seen, and when that happens, there may be a whole new round of diagnoses to treat.
Circle stands ready and available. The company has shown just how much it can do—and how well it can do it.
MASSIMO DE SALVO, PRESIDENTGRUPPO POLICLINICO DI MONZA, ITALY
The pandemic hit Italy in early February, and it affected Lombardy first, where de Salvo heads many hospitals. “I remember the first case, and then it seemed like one second later there were hundreds,” he says. “Before this, the pandemic seemed like a faraway situation that would not touch [us], but suddenly, it was right next door.”
Gruppo Policlinico di Monza began working with the government to mitigate the situation, transforming four of its hospitals into facilities dedicated to treating COVID-19 patients. He recalls one thing clearly: everyone’s sense of fear. “For the first time, I saw many of my colleagues cry,” de Salvo says. “What you saw in the U.S. about Italy, watching it on the news, is one thing, but I have goose bumps remembering what it was like to live it.”
But amid the memories of sad and lonely goodbyes, of nurses holding smartphones so loved ones could exchange final words, he remembers “beautiful moments” that gave his staffers hope—the first patient who woke up after a long stay in intensive care and a 19-year-old COVID patient who was reunited with his family as a result of the illness. At first, the patient
refused to share family information but later admitted he had run away from home. He allowed the hospital to contact his family in another region of Italy, and now he lives with them again. “To this day, the mother still sends cakes and flowers to thank the hospital staff,” de Salvo says. “She does it not only because they rescued him, but because they helped recover the relationship.”
Another bright spot came when nurses produced a video of their “happy dance” while shutting down a COVID-19 unit that was no longer needed. The video went viral. “They showed the Italian spirit—one of perseverance,” de Salvo says.
During the darkest days, de Salvo says that Aldag and MPT team members always stood beside Gruppo Policlinico di Monza, encouraging it to proceed with the logistics of adding more beds to accommodate COVID patients, and he notes that approximately 3,000 pandemic-related patients received care at his company’s facilities. “MPT is not just a company. In every communication and conversation, MPT shows that it has a heart at the center of their work, and it is very conscious of the role that hospitals play in the world,” de Salvo says. “Anyone who collaborates with MPT knows that its heart is in the right place and they’re working hard. That image of the heart and hard work—together—is what I think of when I think of MPT, and I feel this more than ever.”
As de Salvo and his colleagues continue battling COVID and running their hospitals to meet other patient needs, de Salvo says their strength comes from within.
“We are rolling up our sleeves and working as hard as we can,” he says.

20
DR. JUAN ABARCA, PRESIDENTHM HOSPITALES, SPAIN
Dr. Juan Abarca remembers the date when the Spanish government sounded the alarm on COVID-19: March 14, 2020. The rumblings heard and tremors felt about the fast-moving contagion became real. “There’s a tsunami coming,” Abarca thought at the time.
HM Hospitales immediately formed a COVID-19 committee to try to manage the impending flood of critically ill patients. The pandemic affected the country in three waves, with the first wave catching everyone by surprise. Hospitals were forced to put many everyday surgeries on hold and focus attention on the escalating crisis. “All other non-COVID activities had to be stopped,” Abarca says, adding that by the time the later waves hit, the hospitals had devised ways to keep COVID patients separate so that other operations could resume.
“Managing the two kinds of patients became very important,” he says.
Though HM Hospitales represents private hospitals in a country where government-run hospitals are common, the two types of facilities came together. “It didn’t become a competition, it became a collaboration,” Abarca says.
To help manage the overwhelming flow of patients, HM Hospitales found creative ways to use every bit of square footage within its hospitals’ walls, even turning a library into an intensive care unit for a time. The company managed to increase capacity 100% for ICUs and 50% for other types of units, all in a heroic effort to treat anyone in need. For months, the HM Hospitales team held morning meetings seven days a week to determine pandemic-related needs and to marshal resources. “The hospitals started working in tandem, moving staff and exchanging ventilators and other equipment as needed,” Abarca says.
Abarca became a familiar figure to many Spaniards, with his social media posts, media appearances and blog chronicling the crisis as it spread from Madrid and Barcelona to smaller towns. His words gave readers hard truth tinged with an inspiring charge to persevere and follow protocols. On March 31, 2020, he wrote in his blog, “One day less ... these days go by very slowly. I’m looking forward to … the victory ... and it will come, but we still have some very hard days, possibly more than the last.” And on December 22, 2020, as hope of the vaccine lifted spirits, Abarca reminded the public not to let down their guard: “Let’s not get distracted from what we have to do: mask, social distance, hand washing and ventilation. It all depends on each one of us.”
“I tried to keep it realistic and honest,” says Abarca. People listened, knowing he was a medical doctor and hospital administrator with contacts in the pharmaceutical industry, government and in healthcare-focused companies like MPT. The leadership at HM Hospitales appreciated that MPT could pass along information about the struggles and small triumphs other MPT properties were experiencing. Today, it’s difficult for Abarca to celebrate all HM Hospitales achieved; he primarily remembers the
“overwhelming suffering and patients’ fear.” He says, “All my memories are of the fatigue, the anguish.”
Yet at year’s end, HM Hospitales was able to create a bonus system to thank its hospital workers, from the maintenance staff to physicians, for their dedication in the battle against COVID-19. And because it was one of the first hospital groups to make anonymous patient data public for other healthcare companies, new strategies for treating COVID-19 emerged, along with a greater willingness in the international medical community to work together to solve problems (see sidebar, facing page). “That is a silver lining,” Abarca says.
Hospital Universitario HM SanchinarroMadrid, Spain

21
LEARNING TO SHARE
MPT marvels at the quality of the operators that run the hospitals MPT owns. One achievement of HM Hospitales stands out.
Early in the pandemic, the Spanish operator embarked on a “COVID-19 Data Saves Lives” initiative, which made anonymous patient results available to the international medical community. “There had to be a mental revolution that helped everyone overcome their tendencies to protect their own research, and that led to open sharing of the data,” says Dr. Juan Abarca, HM Hospitales president. “No one knew how to deal with this virus. There was no treatment. Everything was new for everyone.”
As the medical community worked to determine how to help patients, one of the best solutions was to create an online pool of patient data and make it available to experts across industry and international lines. “HM Hospitales was the first [hospital system] in the world to do it, to put aside protective tendencies about our research and data, and to share,” Abarca says. “Now we have learned that sharing information about health is how you solve the problem.”
The effort resulted in new technologies in the pandemic fight, such as the use of artificial intelligence (AI) and algorithms to:
• Track the evolution of the disease,
• Analyze patient prognoses and determine effective treatment, and
• Help doctors differentiate COVID from other diseases.
The sharing of data opened the medical community’s mind about how to work together, and it’s inspiring new ideas about how to approach other medical dilemmas. “People are saying, let’s do this with cancer,” Abarca says.
Now the best minds in the technology and AI industries are in league with the doctors and researchers to fight medical battles beyond COVID-19. “Data saves lives,” Abarca says.
Hospital HM TorrelodonesMadrid, Spain

22
Amid circumstances that had much of the business world out of sync, MPT maintained strong cash flow and executed key transactions in 2020. While the company monitored the health crisis closely, its own business plan proceeded uninterrupted. “Not only did we not miss a beat in conducting business, but our employees truly rose to the occasion,” says Emmett E. McLean, executive vice president and chief operating officer of MPT. “Our most important assets are our people, and you find out how good people are when there’s a crisis.”
Working from home became the reality for the MPT workforce by mid-March after a swift transition led by MPT Chairman, President and CEO Edward K. Aldag, Jr., who focused on employee safety. But that situation did little to hinder capable employees from assessing new business, maintaining existing relationships and facilitating day-to-day operations. “Early on, I was concerned our employees would feel disconnected and isolated, but leaders across the company did an incredible job of keeping everybody connected,” Aldag says.
The result was another standout year for MPT. “We did what we needed to do to maintain contact with operators and global markets, and that led to a tremendous year of growth, even during the depths of the pandemic,” says R. Steven Hamner, executive vice president and chief financial officer of MPT.
HOW THE YEAR UNFOLDED
In January, MPT completed a $2 billion acquisition of 30 BMI Healthcare hospitals in the United Kingdom and helped facilitate a related transaction in which trusted MPT operator Circle Health acquired BMI and assumed operation of 52 BMI facilities. The first quarter also saw MPT executives and acquisition teams deploy to the U.K. and Colombia to research additional investment opportunities. Then the pandemic locked down travel.
While many U.S.-based employees at MPT faced travel restrictions, the MPT office in Luxembourg gave the company a way to continue due diligence efforts in Western Europe, as employees based there were still able to travel with precautions.
DOING BUSINESS IN A YEAR LIKE NO OTHER
Strong relationships forged prior to the pandemic, a seamless transition to a virtual workplace and a rock-solid business plan elevated MPT to its strongest global position yet.
St. Francis Medical CenterLynwood, California

23
Asset managers dealing with limited travel became adept at checking in with operators often via the virtual world. “We always stay in contact with our tenants,” says Rosa H. Hooper, vice president, managing director of Asset Management and Underwriting of MPT. “We want to know how they are doing from a business standpoint, but we’ve also developed a genuine relationship with these people.” Hooper missed the face-to-face contact, but she and her team stayed in even closer touch with tenants and clients in the virtual world. “Naturally, there was more emphasis on how people were doing personally during the height of the pandemic,” she says.
At the same time, new relationships were getting established. “We announced new business decisions starting in May—significant transactions,” Hamner says, alluding to the formation of a joint venture for investing in international hospital operations and to several other transactions. “We accomplished all of that through maintaining as much face-to-face contact as was reasonable
and safe and pivoting when necessary to remote conversations.”
Midyear acquisitions included investments in hospital real estate in Salt Lake City and Los Angeles, an inpatient rehabilitation facility in Germany, and a new acute care facility in the U.K. In November, MPT entered the South American continent with a $135 million investment in three hospitals in Colombia. That transaction occurred after Aldag had spent nearly two years visiting the country, getting to know the markets, the providers and the current presidential administration, and after Hooper, McLean and teams from MPT had spent weeks there learning about the market needs and the facilities.
“The transaction stream was constant,” says R. Lucas Savage, vice president, head of Global Acquisitions of MPT. He sensed the pandemic would disrupt the business world and life in general when a March flight to Australia kept getting rescheduled due to COVID concerns. Based in MPT’s Luxembourg
office at the time, Savage oversaw the work conducted by colleagues focused on Western Europe. “Acquisitions take years to develop, so everything we were planning to do in 2020 was in process long before, and we really saw no slowdown,” he says.
Throughout the year, MPT continued its work in Australia, exploring new opportunities via existing and new operator relationships. In the U.K., MPT formed a first-time relationship with the National Health Service with the acquisition of a historic property-turned-acute care hospital in London’s Cavendish Square.
All told, MPT closed on nearly $3.6 billion in assets in 2020. In addition, the company laid the groundwork for a significant investment in the behavioral health sector that closed in January 2021―a $1.1 billion acquisition of select facilities operated by the U.K.’s Priory Group.
St. Francis Medical CenterLynwood, California

24
HOW RELATIONSHIPS INFLUENCE RESULTS
MPT was ready for the unusual business climate of 2020 because of relationships established in years past. “I do business with people, not with companies,” Aldag says.
He recalls the initial 2019 meeting in Australia with his Brookfield counterpart when MPT was eager to invest in Brookfield-affiliated Healthscope hospitals. “He asked me why I had flown from Alabama to Australia to meet, and I told him, ‘MPT wants to invest billions with you―not with your company, but with you. And I wanted to look you in the eye.’” After establishing that kind of candid rapport and trust, MPT now owns 11 Healthscope hospitals and has an office in Sydney. When COVID lockdowns struck, and Australian operators were discussing reimbursement with state governments, the personal relationship Aldag had established allowed for open conversations as the companies worked through the situation.
Similarly, one reason behind MPT’s 2020 investment in Colombia was the interaction Aldag had with Colombia’s president, Iván Duque, in 2019. After years exploring the business climate in Colombia, Aldag met with Duque in Cartagena, Colombia, in early 2019 and saw the leader’s earnest desire to facilitate foreign investments and his commitment to the healthcare of the people of Colombia. In December 2019, just before the pandemic, Aldag returned to visit with the president and the health minister in Bogatá.
When more conversations began taking place online in 2020, the virtual world of teleconference platforms even offered a new dimension to MPT relationships with clients and investors. “We saw a new side of people,” Aldag says. “We know their families and pets now, and we have been through this pandemic catastrophe together, with many losing loved ones. That added a very human element to our interactions.”
HOW QUALITY OPERATORS SHOWED THEIR STRENGTH
In frequent phone calls with top operators in the U.S., U.K., continental Europe and Australia, Aldag gained insight into how stressed the healthcare systems were.
“When COVID-19 first started, it was very frightening for everyone,” Aldag says. Yet on call after call, when Aldag checked on his counterparts’ personal welfare and the front-line situation, the operator CEOs assured him of their ability to serve patients and to ultimately meet financial obligations. “This is an incredible bunch of people running our hospitals,” Aldag says. “We have a great group of operators established over the last 18 years. I truly couldn’t be prouder of the way each of them handled the COVID-19 pandemic.”
Hamner points to the basic role of hospitals in a community’s infrastructure as one reason for MPT operators’ financial security throughout the pandemic. “For most real estate companies during the pandemic, their tenants struggled financially and with rent, but MPT saw almost 100% collection,” he says.
The operators’ financial stability in facing the pandemic added to MPT’s success in 2020―a year truly like no other.
Bakersfield Rehabilitation HospitalBakersfield, California

25
Bakersfield Rehabilitation HospitalBakersfield, California
PREPARED FOR VIRTUAL WORK
After a 2011 tornado outbreak knocked out internet at MPT headquarters for 10 days, Chairman, President and CEO Edward K. Aldag, Jr., directed the IT department to prepare the company to transition to a virtual work situation at a moment’s notice. “I didn’t plan for a pandemic, but we were ready with a plan in place,” Aldag says.
An email went out on Sunday, March 15, asking MPT employees to gather their things from the office the next morning. “Everybody was set up to work from home by Monday afternoon,” says Rosa H. Hooper, vice president, managing director of Asset Management and Underwriting. She wasn’t surprised by the move. “One of the wonderful things about working at MPT is Ed’s concern for our safety,” she says.
In 2014, the MPT accountants made a cloud-based, technological upgrade to aid the company’s international growth, and that
new platform prepped the team for a virtual workplace, according to J. Kevin Hanna, vice president, controller and chief accounting officer of MPT. In addition, the company’s disciplined, team-oriented employees, many of whom are accustomed to working on the road, made it an easy transition, with the accounting group setting up a structured method of working together remotely. “We stuck to our routines, which meant much less chance for error,” Hanna says, adding that regular, online meetings may even have improved internal communications.
Getting to know co-workers via videoconferencing from home, with spouses and dogs and children in the background, only added to the supportive company culture. And though face-to-face relationship-building is a hallmark of how MPT does business, the company used virtual meetings to its advantage all year long.

R E L A T E CONNECT PARTNER

27
MPT prides itself on building strong bonds with longtime partners and forging lasting relationships with new, long-term tenants. Lots of equity in face-to-face relationships prior to 2020 paid off last year and prepared the company for continued growth and expansion.

28
Having an international enterprise with an investment base of $20.4 billion and that consistently delivers strong shareholder returns makes onlookers marvel. “How do they do it?” some might ask. “We get that question often,” says Charles R. Lambert, vice president, treasurer and managing director of Capital Markets. Even in 2020, when many businesses struggled, MPT closed on approximately $3.6 billion in new assets and continued international and domestic growth.
“It’s amazing to work for a company that can flourish during a pandemic,” says J. Kevin Hanna, vice president, controller and chief accounting officer. “That tells you that the business model is right, the company structure is right, the executive team is right, and you’ve got great people working for you.”
All of those components have worked in MPT’s favor since the company was founded in 2003 by Edward K. Aldag, Jr., chairman, president and CEO, joined later that year by co-founders R. Steven Hamner, executive vice president and
chief financial officer, and Emmett E. McLean, executive vice president and chief operating officer. The trio developed a plan for growth that positions the right people in the right places, developing strategic infrastructure that has supported the company’s reputation as a global leader in healthcare real estate.
THE RIGHT PLACES
MPT orchestrates its business plan and manages its pipeline from its Birmingham, Alabama, headquarters, but it has offices in key locations: New York, which keeps MPT connected to the heart of the U.S. financial markets; Luxembourg, which provides quick access to Western Europe and the United Kingdom; and Sydney, Australia, which positions the company for more opportunities after it acquired 11 hospitals across Australia in 2019. With MPT’s growing presence in the United Kingdom, a new London office will soon play a vital role in future growth. “We want to have a permanent presence there with permanent personnel in place,” says Hamner.
MANAGING GLOBAL GROWTH
As MPT expands its portfolio and influence around the globe, find out how the company maintains a lean and agile infrastructure to support its success.
The adversity that the business world experienced in 2020 allowed MPT’s skillful management of its assets and international presence to stand out—thanks to its business model, use of technology and talented employees.
Hospital Universitario HM SanchinarroMadrid, Spain

29
With employees in each location, these international offices give MPT a significant advantage. They allow MPT to deploy teams for key meetings, conduct site visits at medical facilities and make business decisions swiftly. According to Hamner, simply having a physical presence signals a commitment that investors and potential business partners recognize. Plus, it helps with logistics.
“It’s nice to have personnel conducting business in the same time zones,” Hamner says.
Moreover, the investment of time and money in setting up these offices and in building relationships in a region or a country have profitable results. “That’s the way our business model works,” he says. “We have great leverage in developing the infrastructure to support our global growth, which includes offices, but mainly includes having people on the ground to maintain year-after-year relationships.”
Having those relationships may not yield new business transactions in the short term, but MPT has the patience and
fortitude to wait. “We’re in the game for the long term,” says R. Lucas Savage, vice president, head of Global Acquisitions.
THE RIGHT PEOPLE
Under the experience and success of its founders, MPT has a sterling reputation that draws top talent. According to Savage, the company’s organization chart might show who reports to whom, but many departments function more like a huddle on a football team. “There may be one person calling the play, but everyone has an important part in executing it,” he says.
Because of the company’s relatively small employee base, staffers find less bureaucracy and more opportunities once they come on board. “Getting new hires involved quickly is a philosophical commitment that the three founders share, especially on the client-facing, acquisitions side,” Hamner says. “MPT has our way of doing business, and it’s different than most others. There’s no better way to learn than to observe.”
“We love to meet people face to face and to go see hospitals.”
– Anderson Aldag, Manager of
Acquisitions at MPT
The Royal Marsden Private Care Unit – Cavendish Square London, U.K.
30
Anderson Aldag, manager of Acquisitions, had the opportunity to watch and learn when he first started at the company three years ago. He was dispatched to the Luxembourg office, where he observed Savage and Steve Nitschke, managing director, head of European Acquisitions, in action and saw firsthand that, given the chance to explain the financial freedom that MPT can offer with real estate-related financing, the company wins business. “In the U.S., that type of financing is more familiar, but in Europe it’s less so,” says Anderson Aldag, son of MPT’s chairman, president and CEO, Edward K. Aldag, Jr. The pre-pandemic Luxembourg office positioned the MPT acquisitions team with quick access to Western Europe and to the United Kingdom for in-person meetings. They could explain how MPT’s financial arrangements work and respond to more and more frequent requests from entities interested in doing business with the company. “I had a lot of immediate, hands-on experience seeing how transactions that we manage unfold, those we proceeded with and those that didn’t go through—and I learned the difference between the two,” Anderson Aldag says. “The first year I was in Luxembourg, I traveled every single week for the first 10 months.”
Now back in the U.S., and after a short period of pandemic-mandated travel curtailment, he and the other Acquisitions team members have begun visiting customers again. “We’re looking forward to getting back out there and looking people in the eye,” Savage says. In the meantime, Anderson Aldag is still learning from Savage, whom he’s supporting from the Birmingham headquarters. The whole team’s relationship skills and business acumen shine through via phone calls and video conferences, laying the groundwork for a future pipeline of potential projects.
“Acquisitions is a long-term, deliberate process,” Nitschke says, echoing Hamner.
“One transaction may take five years to develop, and all along, we’re regularly talking to people about what we are looking for to keep the pipeline going.”
The types of medical properties in that pipeline change little. “We’re consistent: MPT is interested in hospitals,” Savage says. “We build a business relationship with the operators running them, and then we grow that relationship as much as possible.”
THE MPT WAY
To develop and maintain its incredible portfolio of more than 400 medical facilities around the world, MPT has established offices in strategic locations―Sydney, Australia; Luxembourg; New York; and now London. But beyond office space, MPT manages its global growth by making sure employees understand the company’s way of doing business:
• Focusing on building and maintaining strong relationships
• Identifying quality operators and top facilities through due diligence with the highest of standards
• Involving the company’s founders with every potential acquisition, so that their expertise and experience is on display to advance any business at hand and to help others at MPT learn more about the company’s decision-making process
• Keeping the MPT mission in mind: to continue as the world’s leading source of capital for hospitals and to remain at the very heart of healthcare
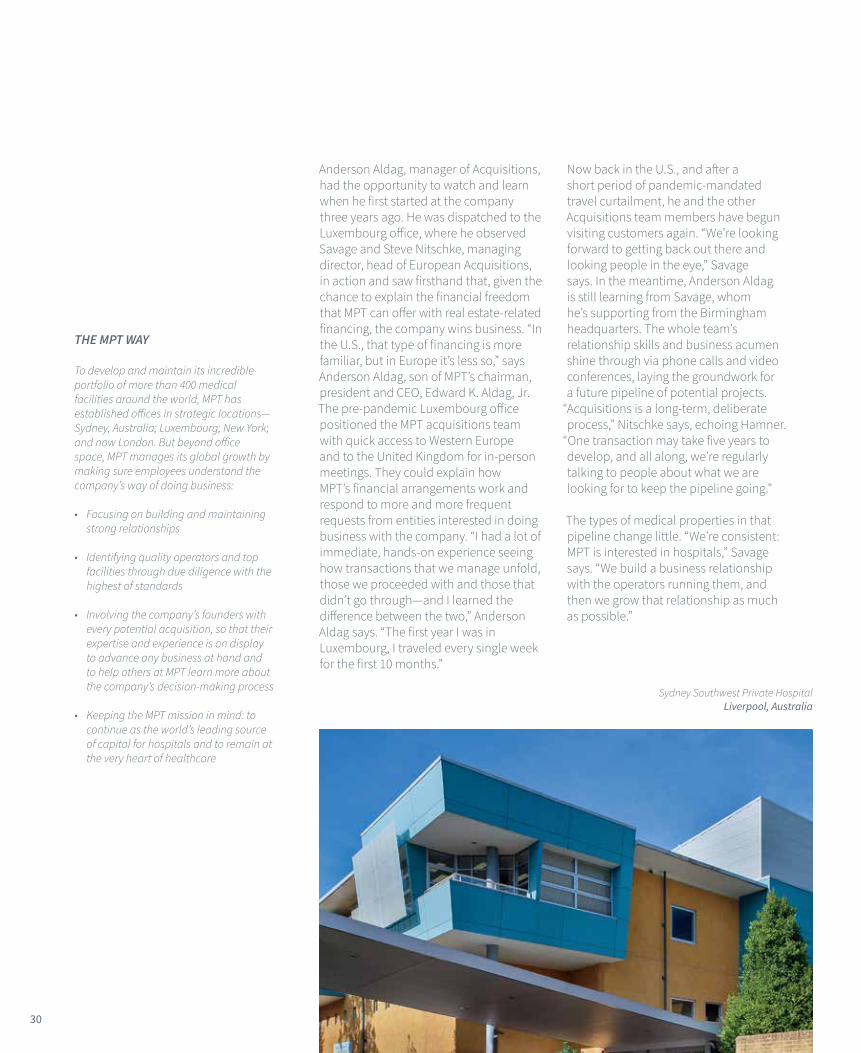
Sydney Southwest Private Hospital Liverpool, Australia

Hospital HM TorrelodonesMadrid, Spain

32
When MPT acquired a three-hospital portfolio in Colombia in November of 2020, it was the culmination of a lengthy discovery process and the start of a new phase of the company’s international exploration. Widening MPT’s global footprint to a fourth continent, the relatively modest $135 million transaction gives the company an official foothold within Colombia’s healthcare community.
“The government of Colombia has been committed for many years to being a very pro-business, pro-foreign investment country,” says Edward K. Aldag, Jr., chairman, president and CEO of MPT.
“Most importantly, it is committed to the healthcare of the people of Colombia.”
A RESULT OF LONG-TERM RESEARCH
Along with the MPT Asset Management and Underwriting team, Aldag has spent time in Colombia over several years exploring various opportunities. He’s convinced that now is the right time to establish MPT’s presence there with this particular investment.
Aldag has talked with insiders who know where the country has been politically and how stable it has become for business operations. He’s visited with the country’s president and other government leaders, and he’s led MPT teams on tours of hospitals there. What he and other MPT executives learned gave them confidence to make this initial investment in the three hospitals―Clínica Centenario and Hospital Universitario Clínica San Rafael located in the capital city of Bogotá, population 2.7 million, and Clínica Los Nevados in Pereira, a city of almost 500,000 located west of Bogatá in the coffee-producing region known as the Coffee Axis.
COLOMBIA: A STRATEGIC CHOICE
MPT’s entry into South America showcases the company’s thoughtful underwriting process and its deliberate approach to global growth.

Hospital Universitario Clínica San RafaelBogotá, Colombia

34
PROFITABLE HEALTHCARE SOLUTIONS
With the potential for physical upgrades and new technical systems that could overhaul the Colombian hospitals’ paper-reliant accounting and other systems, MPT’s investment will benefit local patients and the hospitals’ owner and operator. In this instance, MPT itself has a 49% share in a new entity that both owns and operates this trio of facilities. The Colombia transaction represents the first effort of this independent group.
MPT’s ownership in the recently acquired hospitals adds to the strong business case for pursuing more opportunities in Colombia. Emmett E. McLean, executive vice president and chief operating officer at MPT, saw the obvious need for quality hospitals firsthand during his site visit in early 2020. “It was clear that the hospitals were very, very busy,” McLean says. “It also was clear that they were very well run. It made me a believer in
investing here.” Adds Rosa H. Hooper, vice president, managing director of Asset Management and Underwriting,
“I’ve been in hundreds of hospitals in my career. The hospital I toured in Bogatá had, without a doubt, the busiest ER I have seen.”
Hooper learned that Bogatá and the entire country of Colombia has a need for additional hospital beds. “I was greatly impressed by the need,” she says. MPT has the means to help meet those needs, along with the relationships in the healthcare sector to bring valuable expertise to Colombia. “I think we could substantially increase our investment in Colombia by the end of 2021,” Aldag says.
“Some companies look to grow to put dots on a map. That’s not what we’re doing. We’re looking for the right type of investments, and we’re going to be selective wherever we go.”
– Emmett E. McLean, Executive Vice President and Chief Operating Officer at MPT
COLOMBIA UNDERWRITING CHECKLIST
MPT intends for every transaction to create shareholder value, and it underwrites each with a consistent process that earns investor trust. “We are very careful with our shareholders’ capital,” says Rosa H. Hooper, vice president, managing director of Asset Management and Underwriting. The 2020 Colombia hospital transaction ticks all the boxes on MPT underwriters’ list of requirements.
Clínica CentenarioBogotá, Colombia
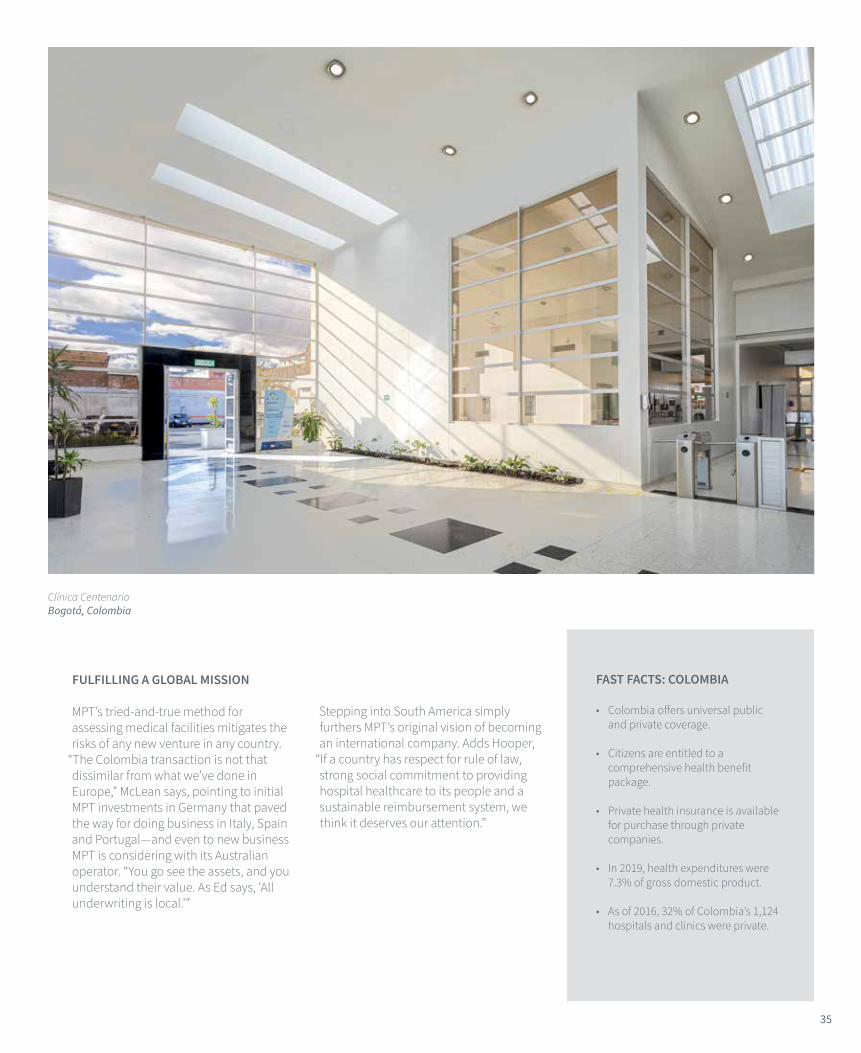
35
FAST FACTS: COLOMBIA
• Colombia offers universal public and private coverage.
• Citizens are entitled to a comprehensive health benefit package.
• Private health insurance is available for purchase through private companies.
• In 2019, health expenditures were 7.3% of gross domestic product.
• As of 2016, 32% of Colombia’s 1,124 hospitals and clinics were private.
Clínica CentenarioBogotá, Colombia
FULFILLING A GLOBAL MISSION
MPT’s tried-and-true method for assessing medical facilities mitigates the risks of any new venture in any country.
“The Colombia transaction is not that dissimilar from what we’ve done in Europe,” McLean says, pointing to initial MPT investments in Germany that paved the way for doing business in Italy, Spain and Portugal—and even to new business MPT is considering with its Australian operator. “You go see the assets, and you understand their value. As Ed says, ‘All underwriting is local.’”
Stepping into South America simply furthers MPT’s original vision of becoming an international company. Adds Hooper,
“If a country has respect for rule of law, strong social commitment to providing hospital healthcare to its people and a sustainable reimbursement system, we think it deserves our attention.”

36
MPT first acquired two hospitals in the United Kingdom in 2014. Today, it has more than 75, leased to some of the U.K.’s most respected operators and venerable healthcare institutions.
THE FIRST MOVE IN 2020
In early January 2020, the company acquired 30 hospitals from BMI Healthcare for $2 billion, the largest transaction in company history. Acquisition of the facilities was part of a hand-in-hand transaction that included the purchase of BMI by MPT’s trusted, long-term tenant, Circle Health. “When I toured these private hospitals with the CEO of Circle, I learned that they played a critical role in the health delivery system within the U.K.,” says Edward K. Aldag, Jr., chairman, president and CEO of MPT. “What I didn’t know was that the pandemic would come along and prove how right I was.”
The private hospitals that MPT had just acquired soon played an essential role during the pandemic, admitting cancer and other high-risk patients in an
agreement with National Health Service (NHS) hospitals, which were crowded with COVID-19 patients. Thousands of NHS patients experienced private hospital care at Circle hospitals as a result, and the NHS was able to rely on this important component of the overall healthcare delivery system in the U.K.
For more than five years, MPT executives and acquisition managers had maintained frequent contact with the owners of BMI, even informally advising its real estate group about how best to restructure its lease relationships. When BMI’s financial advisors commenced a process to sell the company and its highly attractive real estate, they made an early call to solicit MPT’s participation—and soon thereafter, MPT and Circle combined for the successful winning bid. “We know how they think, they know what we’re looking for, and we both knew that MPT could start putting numbers together and help facilitate the process,” says R. Lucas Savage, vice president and head of Global Acquisitions at MPT.
Along with Aldag, Savage and teams of other MPT executives and underwriters who toured the potential BMI acquisitions across the U.K., Steve Nitschke, managing director, head of European Acquisitions, recognized the significance of the opportunity and how swiftly MPT needed to act to take advantage of it. “It was a complex deal that needed a sophisticated counterparty to help lubricate the transaction and make it happen,” Nitschke says. “It grew our presence significantly with a great operator and a great tenant.” DEEPENING OLD RELATIONSHIPS, ESTABLISHING NEW ONES
MPT acquired and leased back two additional general acute care facilities to Circle in 2020. But its £50 million November acquisition of The Royal Marsden Private Care Unit, leased to and operated by The Royal Marsden NHS Foundation Trust, marks an exciting new operator relationship for MPT.
This Royal Marsden facility, located in the heart of London’s medical district
A LANDMARK YEAR IN THE UNITED KINGDOM
With milestone acquisitions from start to finish during 2020, MPT boosted its U.K. presence in a significant way. Now the company is poised to have an ever-increasing role in the healthcare delivery system there.

The Royal Marsden Private Care Unit – Cavendish Square
London, U.K.

38
at Cavendish Square, is housed within a renovated historic building that has the latest diagnostic technology and treatment services. Nitschke calls it a
“trophy asset.”
Aldag goes on to explain what a relationship with the NHS means for MPT’s future in the U.K. The NHS, the government-funded institution beloved by the people of the U.K. for consistently tending to their healthcare needs, has capital requirements and a backlog of patients, as the pandemic showed more clearly than ever. “The Cavendish Square facility is going to be a great entry for us with the NHS,” says Aldag, glad to have established what he views as only the beginning of a great collaboration.
ANNOUNCING GROWTH IN A NEW SECTOR AT YEAR’S END
MPT ended 2020 by paving the way for what would become a landmark, £800 million acquisition of 35 behavioral health hospitals operated by the U.K.’s largest behavioral health provider, Priory Group. That transaction closed in early 2021, giving MPT a high-quality investment in an important component of the nation’s hospital care delivery infrastructure. “I’m very proud of these facilities, and we got to pick the best of the best” Aldag says. “Sadly, there is growing need for mental healthcare in our world today, and I’m glad to have quality behavioral health assets find a place in our overall portfolio.”
The decision to make such a sizable investment in a collection of U.K. hospitals that addresses psychiatric problems, addictions and other mental health issues came after years of looking for the right opportunity to increase MPT’s holdings in that sector. “We’ve been looking into this sector for a long time, and there’s an absolute need for this type of care,” Savage says. “It’s essential for this day and time.”
LOOKING AHEAD
With the U.K. now representing MPT’s largest non-U.S. market, the company recently opened a permanent office there from which to continue to grow its investments and manage its critical relationships. “The United Kingdom continues to offer highly attractive investment opportunities for MPT, and we are committed there for years to come,” Savage says.
“The U.K. health system is poised for growth. The private need in the U.K. is large. The downstream potential
with private and public operators is significant.”
– Steve Nitschke, Managing Director, Head of European Acquisitions
The Royal Marsden Private Care Unit – Cavendish Square
London, U.K.

39
FAST FACTS: THE UNITED KINGDOM
• All English residents are entitled to public healthcare through the National Health Service, including hospital, physician and mental health care.
• In 2015, 10.5% of the U.K. population carried voluntary supplemental insurance to gain more rapid access to elective care.
• Approximately 515 private hospitals were located in the United Kingdom as of 2017.
• In 2019, the U.K. spent 10.3% of its gross domestic product on healthcare, which ranked seventh out of all European countries.
• In 2018, 75% of private healthcare for United Kingdom-based patients was funded by private insurance.
The Royal Marsden Private Care Unit – Cavendish Square London, U.K.
CROWN JEWEL: THE ROYAL MARSDEN
London has its crown jewels, but this is one of MPT’s―an impressive acute care hospital in Cavendish Square that’s new to its portfolio.
Several years ago, MPT’s R. Lucas Savage, vice president and head of Global Acquisitions, found himself walking around Cavendish Square near Harley Street. Long a hub of medical facilities in the heart of London, it is a prized location with enviable medical buildings, but he never imagined that MPT would own a hospital there one day. Now, the company counts The Royal Marsden Private Care Unit, a respected cancer center located at the edge of the square, as one of its most prestigious tenants.
This impressive hospital, housed in a historic building outfitted with the latest technology, is an expansion of the London locations of The Royal Marsden, Europe’s largest cancer center known for award-winning care. MPT leases the facilities to the National Health Service (NHS) under a long-term lease, and marks MPT’s first ever transaction with the NHS. Operating under a partnership between the NHS and private care services, The Royal Marsden ensures the highest standard of care for NHS and private patients.

G I V I N GC A R I N GSHARING

41
Never has MPT’s charitable work and contribution to society been more important. When people were required to isolate or to work from home, the company’s initiatives to help communities where it does business had more impact. It may have looked different in 2020, but MPT honored its commitments to colleagues, to communities and to the world.

42
In 2020, MPT charitable dollars stretched farther than ever―throughout its headquarters city of Birmingham, Alabama, to the front lines of its hospitals across the U.S. and even to the global frontier of medical research in the fight against COVID-19. “It’s consistent with what we’ve done as a charitably minded company,” says Emmett E. McLean, executive vice president and chief operating officer. “We’re very gratified to be in a position to help.”
HELPING AT HOME
In Birmingham, where MPT is known for its philanthropic support, springtime sees a flurry of fundraisers and events that benefit area charities and civic groups. In early 2020, the pandemic put a stop to all the golf tournaments, festivals and black-tie galas. The Birmingham Museum of Art’s Museum Ball, for instance, was postponed for an entire year until September 2021. The YWCA’s Purse & Passion luncheon became a virtual affair. The Jones Valley Teaching Farm canceled its magical Twilight Supper altogether. Yet those organizations didn’t lose any of the 2020 charitable dollars that MPT had promised them.
“We increased our giving compared to 2019, and all the sponsorships we committed to for 2020 were honored, whether a benefit ball became a virtual fundraiser or the funds applied to next year’s postponed event or the
sponsorship amount became a donation,” says McLean. “We said, ‘We don’t care whether you have the event or not. We want to support your mission.’” That heartfelt, action-oriented attitude translated into more than $300,000 in MPT contributions to more than 25 groups that rescheduled events, almost $75,000 to fund virtual events, and almost $40,000 in donations for canceled events.
MPT also maintained its presenting sponsorship of Racing for Children’s, a benefit for pediatric cancer patients that is normally held at Barber Motorsports Park each year, but there was a twist.
“Racing for Children’s became Drive-In for a Cure,” McLean says, explaining that the new family event was held at a drive-in theater with options to watch Talladega Nights or Madagascar. “It allowed Alabamians to gather safely and to keep up awareness of the Alabama Center for Childhood Cancer and Blood Disorders at Children’s of Alabama hospital.”
COMMUNITY SUPPORT IN A TIME OF COVID
MPT consistently gives back, but its charitable contributions and community support have never had more of an impact than in 2020.
“MPT had the resources to help during a trying year.”
– Emmett E. McLean,
Executive Vice President and Chief Operating Officer
at MPT

43
Beyond those donations, which matched or exceeded MPT’s regular annual giving to area nonprofits and key cultural organizations in the city, MPT gave more than $1.1 million in response to specific COVID-19 needs and requests.
“I don’t remember any group or not-for-profit organization coming to MPT during the pandemic and asking for some help that didn’t get it,” says Rosa H. Hooper, vice president, managing director of Asset Management and Underwriting, noting that she appreciated the MPT funds that went to Jones Valley Teaching Farm and Red Mountain Theatre Company. She serves on the boards of the two groups and says, “They’re both dear to my heart.”
BANDING TOGETHER FOR MORE GIVING POWER
True to its reputation for generous giving and reliable support, MPT also jumped at the opportunity to join about 40 top Birmingham foundations, corporations and companies that banded together to meet suddenly urgent, pandemic-related needs across the city and state.
“It was good for the community to come together, and it was good for MPT to participate,” McLean says.
On teleconference calls for months during the height of the pandemic, MPT worked with the Community Foundation of Greater Birmingham, Regions Bank, the Protective Life Foundation, United Way and many other organizations to meet pandemic-induced emergency funding needs. “MPT participated, and we brought some needs to the group,” McLean says,
“with the idea that if everyone chips in, we can really make a difference.” As part of
“On behalf of the staff of West Anaheim Medical Center, please accept our heartfelt thanks for your donation of over 800 Freshly meals. Your generosity and kindness warms our hearts and helps boost the morale of the staff as they care for our community. Your investment in hospitals, as well as your care for the people who work in them, is commendable.”
– Allen Stefanek, CEO, and Barbara Tenneson, RN, Chief Nursing Officer
44
this collaborative group, MPT helped fund initiatives such as the following:
• The Black Belt Community Foundation’s effort to loan money to smaller Alabama cities so they could purchase medical equipment and then qualify for reimbursement via the CARES Act. “These towns were required to spend cash up front before they could take advantage of the available CARES funds, but they didn’t have that money,” McLean says. “We helped fund loans organized by Black Belt, and said, ‘If you have any left over, keep it.’”
• The YMCA’s emergency childcare for first responders and healthcare workers fighting the pandemic.
• The United Way’s Community Crisis Fund, which helped low-income and jobless Alabamians buy food and pay rent and utilities during the crisis.
SENDING SUPPORT TO THE HOSPITAL FRONT LINES
As much as MPT did to help Alabamians and statewide nonprofits respond to the healthcare crisis, the company’s chairman, president and CEO, Edward K. Aldag, Jr., also wanted to help front-line workers at acute care hospitals in MPT’s portfolio. Moved by the stories he was hearing from operators firsthand and by images on TV of exhausted nurses, doctors and hospital personnel, he wondered if there was a way to send these medical professionals a warm, delicious meal to help get them through another day. He turned to Freshly, a leader in the prepared foods industry that specializes in chef-prepared, individually packaged, frozen meals. Soon, thousands of nutritious dinners were being shipped to MPT’s hospitals to fuel workers across the U.S.
“Ed thinks big,” says McLean, who has often seen Aldag green-light charitable dollars for opportunities presented to the MPT Charity Committee. In this case, the Freshly initiative called for a $350,000 expenditure that McLean says was worth every cent. “Rosa Hooper at MPT helped coordinate the logistics of the project, and it was just staggering—around 40,000 meals went out to these front-line workers,” McLean says, noting that details for shipping, receiving and coordinating freezer space in countless hospitals had to be researched and executed.
“We were in touch with our U.S. operators and also gave meals to Children’s of Alabama hospital locally, even though it’s not one of our own,” Hooper says.
“The idea was that at the end of their shift, workers could take home an easy, nutritious meal, without having to stop somewhere, and rest and recuperate.”
In 2020, MPT gave $1.1 million earmarked for pandemic-related needs to charitable causes.

45
FUNDING MEDICAL RESEARCH WITH INTERNATIONAL IMPACT
One of MPT’s most significant acts of philanthropy during 2020 was a $250,000 contribution to the COVID-19 clinical research fund of the University of Alabama at Birmingham (UAB) School of Medicine. “UAB was on the cutting edge, with their experts in the thick of the COVID response,” McLean says, noting UAB’s pioneering research on the antiviral drug remdesivir, the first FDA-approved medication used to treat COVID-19.
Back in 2014, remdesivir’s maker, Gilead Sciences, began a collaboration with the UAB-led Antiviral Drug Discovery and Development Center, headed by UAB professor Richard Whitley. They worked to examine the drug’s effect on coronaviruses similar to COVID-19. So when the pandemic hit in 2020, UAB was tapped as the site for a global clinical trial of remdesivir sponsored by the National Institutes of Health. “Giving those clinical research dollars went a long way,” McLean says.
Whether charitable dollars from MPT helped fill someone’s pantry in Birmingham or fund medical research that helped save someone’s life, the money made a powerful impact. “The pandemic did not negatively affect our business at all, and not everyone could say that,” McLean says. “MPT had the resources to help during a trying year.”

46
As one of the largest owners of hospitals and medical real estate in the world, MPT has a unique perspective on environmental sustainability in the healthcare sector.
“It’s just absolutely crucial that we have conversations with our operators about green initiatives, model great corporate sustainability practices in our own operations, and recognize the great things our tenants are doing in this area,” says Edward K. Aldag, Jr., chairman, president and CEO of MPT.
Due to the absolute or triple-net lease structure used by MPT, its tenants around the globe bear responsibility for their own environmental footprint and sustainability initiatives. However, MPT has long done due diligence on environmental risk management as part of its underwriting process for potential acquisitions and has ongoing discussions about environmental stewardship with long-term tenants and when initiating new development projects. The company has a mitigation plan in place should any environmental issues at its facilities come to light. And when MPT discovers innovative environmental efforts and achievements by its tenants, the company applauds them and helps spread the news.
10 MPT OPERATORS MAKING A DIFFERENCE
Here’s a look at recent environmental successes among MPT operators:
Steward Health Care – In 2020, this longtime MPT operator achieved greater than 15% in energy savings, reducing operating expenses by $3.8 million, cut electricity demands by 52.5 gigawatt-hours and eliminated carbon dioxide emissions by 87,140 metric tons per year.
Healthscope – With many environmental initiatives, such as the installation of LED lighting and water-efficient showerheads, the company has earned spots on the Dow Jones Sustainability Index and the FTSE4GOOD Index, which recognizes leading sustainability performance.
Prospect Medical Holdings – Improvement projects at MPT hospitals resulted in a reduction of more than 11,000 carbon metric tons in 2020, thanks to LED lighting upgrades, high-efficiency air handling unit replacement or upgrades, and roof replacements.
Ernest Health – At an inpatient rehabilitation facility currently under construction in Bakersfield, California, Ernest plans for this MPT-owned building to be solar-panel ready, use low-flow irrigation and offer 10 electric car
chargers. The property also will have high-efficiency LED lighting and HVAC systems with economizer cycles, features already in use at Ernest’s Elgin, South Carolina, rehabilitation hospital, which achieves substantial annual energy savings through a host of building and design choices.
LifePoint Health – As part of LifePoint’s Energy Optimization Plan, 2020 projects implemented at certain MPT hospitals will result in an expected annual energy savings of $613,000. Other in-progress initiatives include an energy analytics tool, a conservation education program for staffers, and a consolidation plan for waste removal and recycling efforts.
Prime Healthcare – Installation of combustion-free, low-oxide fuel cells at multiple California facilities will save hundreds of thousands of dollars at each. Two fuel cell projects at MPT-owned locations are expected to save more than $12 million over the length of the 20-year power purchase agreement. Together, these California fuel cell projects will save 51 million pounds in carbon emissions over the life of the contracts.
Surgery Partners – At Surgery Partners’ Idaho Falls Community Hospital, the many sustainability features include water-saving flow restrictors that will save 30%-60% of water used; variable volume
USING OUR INFLUENCE
As MPT’s global footprint grows, so do its efforts to practice and encourage environmental responsibility—especially now that the pandemic has reminded everyone that they breathe the same air and share the same resources.
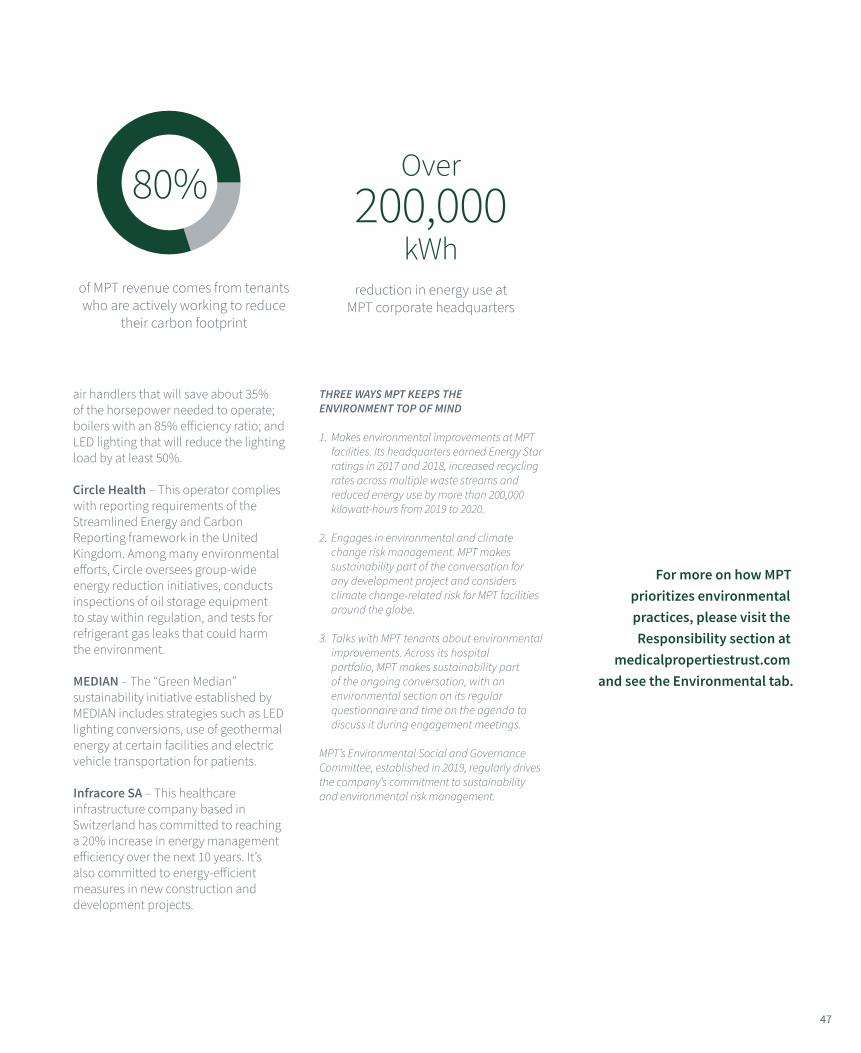
47
For more on how MPT prioritizes environmental practices, please visit the Responsibility section at
medicalpropertiestrust.com and see the Environmental tab.
air handlers that will save about 35% of the horsepower needed to operate; boilers with an 85% efficiency ratio; and LED lighting that will reduce the lighting load by at least 50%.
Circle Health – This operator complies with reporting requirements of the Streamlined Energy and Carbon Reporting framework in the United Kingdom. Among many environmental efforts, Circle oversees group-wide energy reduction initiatives, conducts inspections of oil storage equipment to stay within regulation, and tests for refrigerant gas leaks that could harm the environment.
MEDIAN – The “Green Median” sustainability initiative established by MEDIAN includes strategies such as LED lighting conversions, use of geothermal energy at certain facilities and electric vehicle transportation for patients.
Infracore SA – This healthcare infrastructure company based in Switzerland has committed to reaching a 20% increase in energy management efficiency over the next 10 years. It’s also committed to energy-efficient measures in new construction and development projects.
THREE WAYS MPT KEEPS THE ENVIRONMENT TOP OF MIND 1. Makes environmental improvements at MPT
facilities. Its headquarters earned Energy Star ratings in 2017 and 2018, increased recycling rates across multiple waste streams and reduced energy use by more than 200,000 kilowatt-hours from 2019 to 2020.
2. Engages in environmental and climate change risk management. MPT makes sustainability part of the conversation for any development project and considers climate change-related risk for MPT facilities around the globe.
3. Talks with MPT tenants about environmental improvements. Across its hospital portfolio, MPT makes sustainability part of the ongoing conversation, with an environmental section on its regular questionnaire and time on the agenda to discuss it during engagement meetings.
MPT’s Environmental Social and Governance Committee, established in 2019, regularly drives the company’s commitment to sustainability and environmental risk management.
of MPT revenue comes from tenants who are actively working to reduce
their carbon footprint
Over 200,000
kWh reduction in energy use at
MPT corporate headquarters
80%

48
A strong and respected board of directors led by MPT Chairman, President and CEO Edward K. Aldag, Jr., and on which Executive Vice President and Chief Financial Officer R. Steven Hamner also sits, sets the highest of standards for MPT. Its members, who have a wide range of expertise and experience, oversee the integrity of MPT business practices. The strength of the board pairs with the depth of the company’s employee pool, drawn from exemplary talent across many disciplines. With high retention rates and enviable benefits, MPT has a reputation as a prestigious place to work where employees know they are valued and each contributes to the company’s success.
From the governing body to the newest hires, the people involved with the company are its strongest asset. “It’s our highest honor to establish impeccable
standards for how we operate Medical Properties Trust,” says Aldag.
A STRONG, DIVERSE BOARD
MPT’s board represents experience across industries as varied as healthcare systems, finance, investment in publicly traded companies, real estate, corporate law, accounting, energy and legal counsel for healthcare systems. Members bring their own viewpoints and experience to the table, where they make decisions that impact the company’s outperformance.
With oversight of every key decision, the board has:
• Supported management and the company throughout its evolution into one of the world’s leading hospital real estate platforms,
• Established strong governance provisions and
• Helped create an executive compensation program that has averaged more than 95% say-on-pay approval over the past five years.
From inception, MPT has made board diversity a priority, ensuring the broadest range of perspectives as the company grows. Women have always made up a strong percentage of the board and currently represent 25% of its members. Of those women, one is Latina and adds a 13% minority component. The majority of members are independent of MPT, bringing unbiased perspectives to agenda items. Half of the board members have served less than six years, which allows fresh takes on the company’s strategy. And with a median age of 59, the membership brings both years of experience and vitality to the boardroom.
GREAT CULTURE, GREAT BENEFITS
At MPT, approximately 120 full-time employees have built and manage the company’s portfolio of hospitals and $20.4 billion in pro forma total gross assets. They represent some of the best talent in the U.S. and overseas, from valued, longtime employees to brand-new workers who quickly contribute to the company’s growth. “We are known as pioneers in our industry, and people want to come work for MPT,” says J. Kevin Hanna, vice president, controller and chief accounting officer.
TRANSPARENCY & TRUST
MPT demonstrates great corporate governance and excellent management of its most valuable resource: human capital.
BOARD OF DIRECTORS: BY THE NUMBERS
25% FEMALE
50% 6 YEARS OR LESS
59.4 AVERAGE
AGE
GENDER TENURE AGE
The MPT board of directors has a 13% minority component, with one Latina female member who is a native of Costa Rica.

49
MPT demonstrates from the start how much it cares for its workforce. When recruiting, a corporate psychologist who has worked with Aldag for more than 34 years is part of the hiring process to ensure MPT is a mutual fit. During onboarding, training opportunities help equip employees for success. And a competitive benefits package offers top-tier insurance, including coverages for health, secondary health, dental, vision and life, with no-cost individual plans; a 401(k) with employer match; stock awards; a monthly fitness allowance; reimbursement for concierge physician services; and an employee assistance program at no cost to the employee. Employees also get a full day of paid time off to participate in volunteer work of their choice.
With investments in countries throughout the world, it’s imperative that the employees of MPT reflect diverse cultures and backgrounds. The company has increased its diversity ratio, and it also emphasizes opportunities for women, who currently make up 41% of the MPT workforce. Plus, 40% of all MPT employees report to a female manager or director.
Once they are part of the MPT family, employees find security in the company’s financial stability and ongoing success, as demonstrated with strong compensation plans and a strong bonus structure.
TRAINING, HIGH EXPECTATIONS AND FEEDBACK
The employees at MPT each understand their mission as part of the company’s goal to be “at the very heart of healthcare.” Professional development plans ensure long-term personal growth and job satisfaction, and employees may receive specialized training in their areas of expertise.
MPT leaves nothing to guesswork when it comes to expectations for professional conduct. It publishes strong policies and codes of conduct in writing, but
the expectations are not one-way. The company leadership also wants to know what employees expect, conducting periodic employee surveys and acting on the feedback.
Training for employees extends beyond workplace issues and job performance to lessons on the intangibles of how MPT does business, mostly learned by observation during the day-to-day meetings and tasks. “We instill an MPT culture, an MPT way of doing things, and we help employees understand how we treat each other and how we treat people outside of MPT,” says Aldag.
See links to policies and learn more in the
Responsibility section at medicalpropertiestrust.com
A DIVERSE, INCLUSIVE
WORKFORCE41% FEMALE
40% REPORT TO
FEMALE MANAGER
39% WORKING PARENTS
21% UNDER 30
27% OVER 50

C H A R T S REPORTS AND DATA

51
Selected Financial Data
Non-GAAP Financial Measures
Forward-Looking Statements
Report of Independent Registered Public Accounting Firm
Consolidated Balance Sheets
Consolidated Statements of Net Income
Consolidated Statements of Comprehensive Income
Consolidated Statements of Equity
Consolidated Statements of Cash Flows
Notes to Consolidated Financial Statements
Corporate and Shareholder Information
52
53
56
58
60
61
62
63
64
66
88
Everything MPT did prior to 2020 prepared the company for a challenging year. While much of the business world locked down or took a pause, MPT led its industry sector and beyond. The data shows just how strong MPT fundamentals truly are. The company’s results and growth impress, and its potential seems limitless.

52
SELECTED FINANCIAL DATA
For the Years Ended December 31, 2020 2019 2018
OPERATING DATA
Total revenues $ 1,249,238 $ 854,197 $ 784,522
Expenses:
Interest 328,728 237,830 223,274
Real estate depreciation and amortization 264,245 152,313 133,083
Property-related 24,890 23,992 9,237
General and administrative 131,663 96,411 81,003
Total expenses 749,526 510,546 446,597
Other income (expense):
(Loss) gain on sale of real estate (2,833) 41,560 719,392
Real estate impairment charges (19,006) (21,031) (48,007)
Earnings from equity interests 20,417 16,051 14,165
Debt refinancing and unutilized financing costs (28,180) (6,106) —
Other (including mark-to-market adjustments on equity securities) (6,782) (345) (4,071)
Income tax (expense) benefit (31,056) 2,621 (927)
Net income 432,272 376,401 1,018,477
Net income attributable to non-controlling interests (822) (1,717) (1,792)
Net income attributable to MPT common stockholders $ 431,450 $ 374,684 $ 1,016,685
Net income attributable to MPT common stockholders per diluted share $ 0.81 $ 0.87 $ 2.76
Weighted-average shares outstanding – diluted 530,461 428,299 366,271
OTHER DATA
Dividends declared per common share $ 1.08 $ 1.02 $ 1.00
FFO(1) $ 757,677 $ 535,768 $ 485,335
Normalized FFO(1) $ 831,209 $ 557,413 $ 501,004
Normalized FFO per share(1) $ 1.57 $ 1.30 $ 1.37
Cash paid for acquisitions and other related investments $ 3,414,437 $ 4,565,594 $ 666,548
December 31, 2020 December 31, 2019 December 31, 2018
BALANCE SHEET DATA
Real estate assets – at cost $ 14,337,929 $ 11,438,078 $ 7,165,834
Real estate accumulated depreciation/amortization (833,529) (570,042) (464,984)
Cash and cash equivalents 549,884 1,462,286 820,868
Equity investments 1,123,623 926,990 520,058
Other loans 858,368 544,832 373,198
Other assets 792,739 665,187 428,669
Total assets $ 16,829,014 $ 14,467,331 $ 8,843,643
Debt, net $ 8,865,458 $ 7,023,679 $ 4,037,389
Other liabilities 619,699 415,498 245,316
Total Medical Properties Trust, Inc. stockholders’ equity 7,338,532 7,028,047 4,547,108
Non-controlling interests 5,325 107 13,830
Total equity 7,343,857 7,028,154 4,560,938
Total liabilities and equity $ 16,829,014 $ 14,467,331 $ 8,843,643
(1) See section titled “Non-GAAP Financial Measures” for an explanation of why these non-GAAP financial measures are useful along with a reconciliation to our GAAP earnings.
The following sets forth selected financial and operating information on a historical basis (in thousands except per share data):
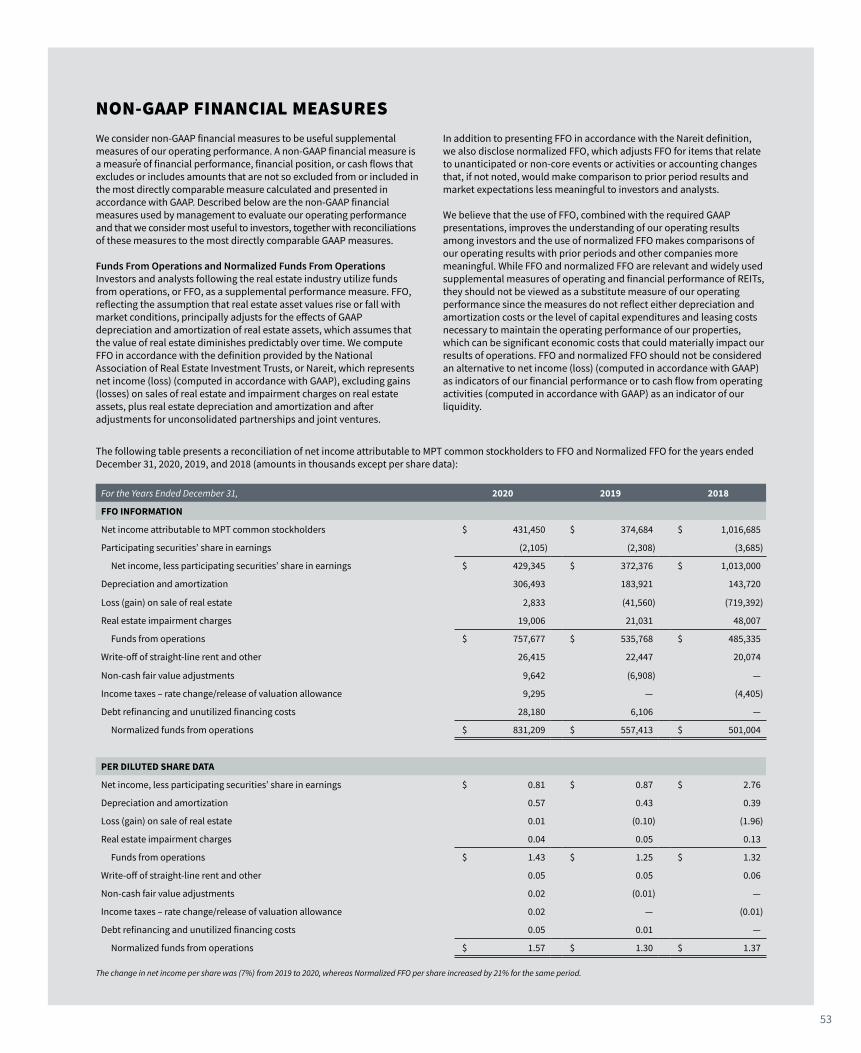
53
For the Years Ended December 31, 2020 2019 2018
FFO INFORMATION
Net income attributable to MPT common stockholders $ 431,450 $ 374,684 $ 1,016,685
Participating securities’ share in earnings (2,105) (2,308) (3,685)
Net income, less participating securities’ share in earnings $ 429,345 $ 372,376 $ 1,013,000
Depreciation and amortization 306,493 183,921 143,720
Loss (gain) on sale of real estate 2,833 (41,560) (719,392)
Real estate impairment charges 19,006 21,031 48,007
Funds from operations $ 757,677 $ 535,768 $ 485,335
Write-off of straight-line rent and other 26,415 22,447 20,074
Non-cash fair value adjustments 9,642 (6,908) —
Income taxes – rate change/release of valuation allowance 9,295 — (4,405)
Debt refinancing and unutilized financing costs 28,180 6,106 —
Normalized funds from operations $ 831,209 $ 557,413 $ 501,004
PER DILUTED SHARE DATA
Net income, less participating securities’ share in earnings $ 0.81 $ 0.87 $ 2.76
Depreciation and amortization 0.57 0.43 0.39
Loss (gain) on sale of real estate 0.01 (0.10) (1.96)
Real estate impairment charges 0.04 0.05 0.13
Funds from operations $ 1.43 $ 1.25 $ 1.32
Write-off of straight-line rent and other 0.05 0.05 0.06
Non-cash fair value adjustments 0.02 (0.01) —
Income taxes – rate change/release of valuation allowance 0.02 — (0.01)
Debt refinancing and unutilized financing costs 0.05 0.01 —
Normalized funds from operations $ 1.57 $ 1.30 $ 1.37
We consider non-GAAP financial measures to be useful supplemental measures of our operating performance. A non-GAAP financial measure is a measure of financial performance, financial position, or cash flows that excludes or includes amounts that are not so excluded from or included in the most directly comparable measure calculated and presented in accordance with GAAP. Described below are the non-GAAP financial measures used by management to evaluate our operating performance and that we consider most useful to investors, together with reconciliations of these measures to the most directly comparable GAAP measures.
Funds From Operations and Normalized Funds From OperationsInvestors and analysts following the real estate industry utilize funds from operations, or FFO, as a supplemental performance measure. FFO, reflecting the assumption that real estate asset values rise or fall with market conditions, principally adjusts for the effects of GAAP depreciation and amortization of real estate assets, which assumes that the value of real estate diminishes predictably over time. We compute FFO in accordance with the definition provided by the National Association of Real Estate Investment Trusts, or Nareit, which represents net income (loss) (computed in accordance with GAAP), excluding gains (losses) on sales of real estate and impairment charges on real estate assets, plus real estate depreciation and amortization and after adjustments for unconsolidated partnerships and joint ventures.
In addition to presenting FFO in accordance with the Nareit definition, we also disclose normalized FFO, which adjusts FFO for items that relate to unanticipated or non-core events or activities or accounting changes that, if not noted, would make comparison to prior period results and market expectations less meaningful to investors and analysts.
We believe that the use of FFO, combined with the required GAAP presentations, improves the understanding of our operating results among investors and the use of normalized FFO makes comparisons of our operating results with prior periods and other companies more meaningful. While FFO and normalized FFO are relevant and widely used supplemental measures of operating and financial performance of REITs, they should not be viewed as a substitute measure of our operating performance since the measures do not reflect either depreciation and amortization costs or the level of capital expenditures and leasing costs necessary to maintain the operating performance of our properties, which can be significant economic costs that could materially impact our results of operations. FFO and normalized FFO should not be considered an alternative to net income (loss) (computed in accordance with GAAP) as indicators of our financial performance or to cash flow from operating activities (computed in accordance with GAAP) as an indicator of our liquidity.
NON-GAAP FINANCIAL MEASURES
The following table presents a reconciliation of net income attributable to MPT common stockholders to FFO and Normalized FFO for the years ended December 31, 2020, 2019, and 2018 (amounts in thousands except per share data):
The change in net income per share was (7%) from 2019 to 2020, whereas Normalized FFO per share increased by 21% for the same period.
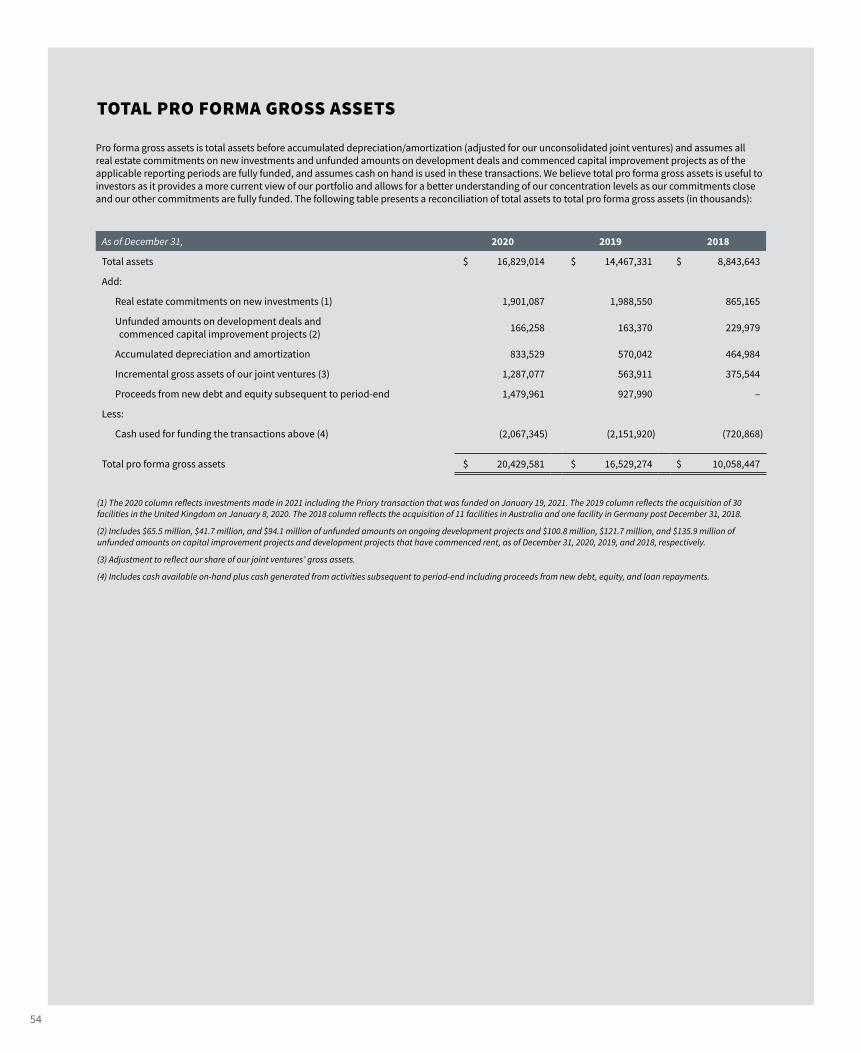
54
TOTAL PRO FORMA GROSS ASSETS
As of December 31, 2020 2019 2018
Total assets $ 16,829,014 $ 14,467,331 $ 8,843,643
Add:
Real estate commitments on new investments (1) 1,901,087 1,988,550 865,165
Unfunded amounts on development deals and commenced capital improvement projects (2) 166,258 163,370 229,979
Accumulated depreciation and amortization 833,529 570,042 464,984
Incremental gross assets of our joint ventures (3) 1,287,077 563,911 375,544
Proceeds from new debt and equity subsequent to period-end 1,479,961 927,990 –
Less:
Cash used for funding the transactions above (4) (2,067,345) (2,151,920) (720,868)
Total pro forma gross assets $ 20,429,581 $ 16,529,274 $ 10,058,447
(1) The 2020 column reflects investments made in 2021 including the Priory transaction that was funded on January 19, 2021. The 2019 column reflects the acquisition of 30 facilities in the United Kingdom on January 8, 2020. The 2018 column reflects the acquisition of 11 facilities in Australia and one facility in Germany post December 31, 2018.
(2) Includes $65.5 million, $41.7 million, and $94.1 million of unfunded amounts on ongoing development projects and $100.8 million, $121.7 million, and $135.9 million of unfunded amounts on capital improvement projects and development projects that have commenced rent, as of December 31, 2020, 2019, and 2018, respectively.
(3) Adjustment to reflect our share of our joint ventures’ gross assets.
(4) Includes cash available on-hand plus cash generated from activities subsequent to period-end including proceeds from new debt, equity, and loan repayments.
Pro forma gross assets is total assets before accumulated depreciation/amortization (adjusted for our unconsolidated joint ventures) and assumes all real estate commitments on new investments and unfunded amounts on development deals and commenced capital improvement projects as of the applicable reporting periods are fully funded, and assumes cash on hand is used in these transactions. We believe total pro forma gross assets is useful to investors as it provides a more current view of our portfolio and allows for a better understanding of our concentration levels as our commitments close and our other commitments are fully funded. The following table presents a reconciliation of total assets to total pro forma gross assets (in thousands):
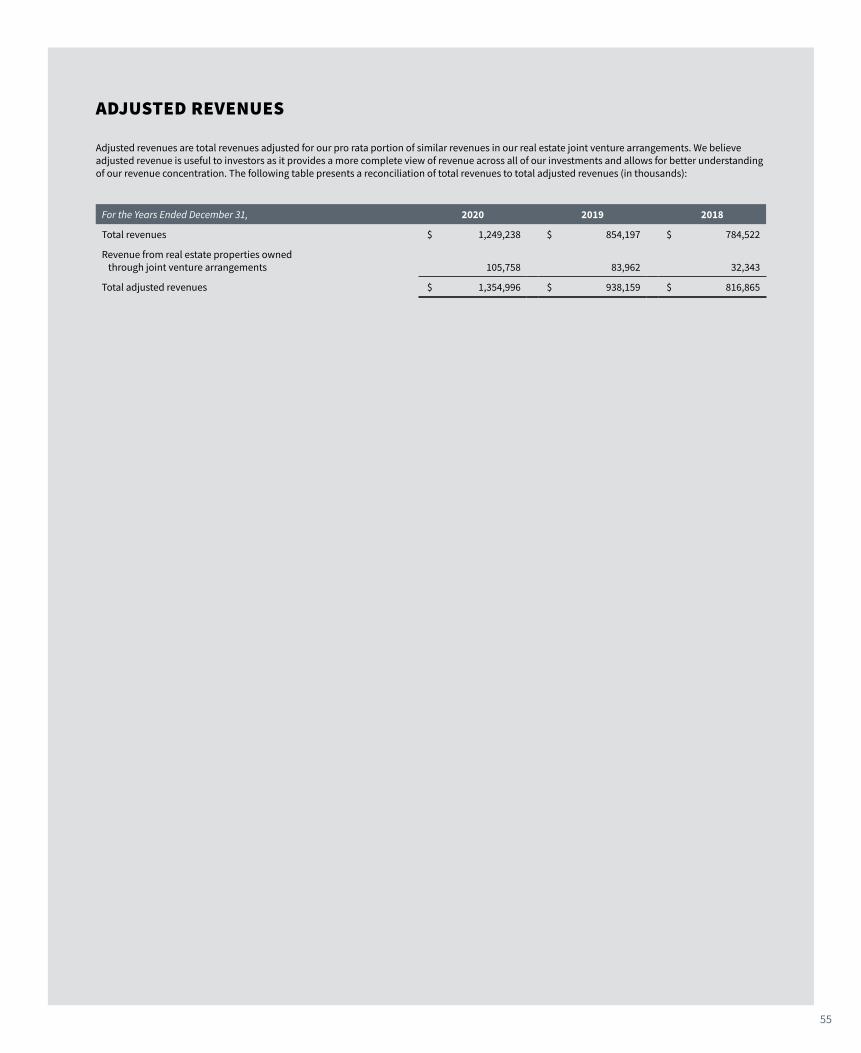
55
ADJUSTED REVENUES
For the Years Ended December 31, 2020 2019 2018
Total revenues $ 1,249,238 $ 854,197 $ 784,522
Revenue from real estate properties owned through joint venture arrangements 105,758 83,962 32,343
Total adjusted revenues $ 1,354,996 $ 938,159 $ 816,865
Adjusted revenues are total revenues adjusted for our pro rata portion of similar revenues in our real estate joint venture arrangements. We believe adjusted revenue is useful to investors as it provides a more complete view of revenue across all of our investments and allows for better understanding of our revenue concentration. The following table presents a reconciliation of total revenues to total adjusted revenues (in thousands):
56
FORWARD-LOOKING STATEMENTS
We make forward-looking statements in this Annual Report that are subject to risks and uncertainties. These forward-looking statements include information about possible or assumed future results of our business, financial condition, liquidity, results of operations, plans, and objectives. Statements regarding the following subjects, among others, are forward-looking by their nature:
• our business strategy;
• our projected operating results;
• our ability to close on any pending transactions discussed herein on the time schedule or terms described or at all;
• our ability to acquire, develop, and/or manage additional facilities in the United States (“U.S.”), Europe, Australia, South America, or other foreign locations;
• availability of suitable facilities to acquire or develop;
• our ability to enter into, and the terms of, our prospective leases and loans;
• our ability to raise additional funds through offerings of debt and equity securities, joint venture arrangements, and/or property disposals;
• our ability to obtain future financing arrangements;
• estimates relating to, and our ability to pay, future distributions;
• our ability to service our debt and comply with all of our debt covenants;
• our ability to compete in the marketplace;
• lease rates and interest rates;
• market trends;
• projected capital expenditures; and
• the impact of technology on our facilities, operations, and business.
Forward-looking statements are based on our beliefs, assumptions, and expectations of our future performance, taking into account information currently available to us. These beliefs, assumptions, and expectations can change as a result of many possible events or factors, not all of which are known to us. If a change occurs, our business, financial condition, liquidity, and results of operations may vary materially from those expressed in our forward-looking statements. You should carefully consider these risks before you make an investment decision with respect to our common stock and other securities, along with, among others, the following factors that could cause actual results to vary from our forward-looking statements:
• the factors referenced in the sections captioned “Risk Factors,” “Management’s Discussion and Analysis of Financial Condition and Results of Operations,” and “Business” in our Form 10-K for the year ended December 31, 2020;
• the political, economic, business, real estate, and other market conditions in the U.S. (both national and local), Europe (in particular the United Kingdom, Germany, Switzerland, Spain, Italy, and Portugal), Australia, South America (in particular Colombia), and other foreign jurisdictions where we may own healthcare facilities or transact business, which may have a negative effect on the following, among other things:
• the financial condition of our tenants, our lenders, or institutions that hold our cash balances or are counterparties to certain hedge agreements, which may expose us to increased risks of default by these parties;
• our ability to obtain equity or debt financing on attractive terms or at all, which may adversely impact our ability to pursue acquisition and development opportunities, refinance existing debt, and our future interest expense; and
• the value of our real estate assets, which may limit our ability to dispose of assets at attractive prices or obtain or maintain debt financing secured by our real estate assets or on an unsecured basis.

57
• the impact of the COVID-19 pandemic on our business, our joint ventures, and the business of our tenants/borrowers and the economy in general, as well as other factors that may affect our business, our joint ventures or that of our tenants/borrowers that are beyond our control, including natural disasters, health crises, or pandemics and subsequent government actions in reaction to such matters;
• the risk that a condition to closing under the agreements governing any or all of our pending transactions that have not closed as of the date hereof (including the transactions described in Note 8 of this Annual Report) may not be satisfied;
• the possibility that the anticipated benefits from any or all of the transactions we enter into will take longer to realize than expected or will not be realized at all;
• the competitive environment in which we operate;
• the execution of our business plan;
• financing risks;
• acquisition and development risks;
• potential environmental contingencies and other liabilities;
• adverse developments affecting the financial health of one or more of our tenants, including insolvency;
• other factors affecting the real estate industry generally or the healthcare real estate industry in particular;
• our ability to maintain our status as a REIT for income tax purposes;
• our ability to attract and retain qualified personnel;
• changes in foreign currency exchange rates;
• changes in federal, state, or local tax laws in the U.S., Europe, Australia, South America, or other jurisdictions in which we may own healthcare facilities or transact business; and
• healthcare and other regulatory requirements in the U.S., Europe, Australia, South America, and other foreign countries.
When we use the words “believe,” “expect,” “may,” “potential,” “anticipate,” “estimate,” “plan,” “will,” “could,” “intend,” or similar expressions, we are identifying forward-looking statements. You should not place undue reliance on these forward-looking statements. Except as required by law, we disclaim any obligation to update such statements or to publicly announce the result of any revisions to any of the forward-looking statements contained in this Annual Report.

58
REPORT OF INDEPENDENT REGISTERED PUBLIC ACCOUNTING FIRM
To the Board of Directors and Stockholders of Medical Properties Trust, Inc.
Opinions on the Financial Statements and Internal Control over Financial Reporting
We have audited the accompanying consolidated balance sheets of Medical Properties Trust, Inc. and its subsidiaries (the
“Company”) as of December 31, 2020 and 2019, and the related consolidated statements of net income, of comprehensive income, of equity and of cash flows for each of the three years in the period ended December 31, 2020 (collectively referred to as the “consolidated financial statements”). We also have audited the Company’s internal control over financial reporting as of December 31, 2020, based on criteria established in Internal Control – Integrated Framework (2013) issued by the Committee of Sponsoring Organizations of the Treadway Commission (COSO).
In our opinion, the consolidated financial statements referred to above present fairly, in all material respects, the financial position of the Company as of December 31, 2020 and 2019, and the results of its operations and its cash flows for each of the three years in the period ended December 31, 2020 in conformity with accounting principles generally accepted in the United States of America. Also in our opinion, the Company maintained, in all material respects, effective internal control over financial reporting as of December 31, 2020, based on criteria established in Internal Control – Integrated Framework (2013) issued by the COSO.
Basis for Opinions
The Company’s management is responsible for these consolidated financial statements, for maintaining effective internal control over financial reporting, and for its assessment of the effectiveness of internal control over financial reporting, included in Management’s Report on Internal Control over Financial Reporting presented within the 2020 Annual Report to Shareholders. Our responsibility is to express opinions on the Company’s consolidated financial statements and on the Company’s internal control over financial reporting based on our audits. We are a public accounting firm registered with the Public Company Accounting Oversight Board (United States) (PCAOB) and are required to be independent with respect to the Company in accordance with the U.S. federal securities laws and the applicable rules and regulations of the Securities and Exchange Commission and the PCAOB.
We conducted our audits in accordance with the standards of the PCAOB. Those standards require that we plan and perform the audits to obtain reasonable assurance about whether the consolidated financial statements are free of material misstatement, whether due to error or fraud, and whether effective internal control over financial reporting was maintained in all material respects.
Our audits of the consolidated financial statements included performing procedures to assess the risks of material misstatement of the consolidated financial statements, whether due to error or fraud, and performing procedures that respond to those risks. Such procedures included examining, on a test basis, evidence regarding the amounts and disclosures in the consolidated financial statements. Our audits also included evaluating the accounting principles used and significant estimates made by management, as well as evaluating the overall presentation of the consolidated financial statements. Our audit of internal control over financial reporting included obtaining an understanding of internal control over financial reporting, assessing the risk that a material weakness exists, and testing and evaluating the design and operating effectiveness of internal control based on the assessed risk. Our audits also included performing such other procedures as we considered necessary in the circumstances. We believe that our audits provide a reasonable basis for our opinions.
Definition and Limitations of Internal Control over Financial Reporting
A company’s internal control over financial reporting is a process designed to provide reasonable assurance regarding the reliability of financial reporting and the preparation of financial statements for external purposes in accordance with generally accepted accounting principles. A company’s internal control over financial reporting includes those policies and procedures that (i) pertain to the maintenance of records that, in reasonable detail, accurately and fairly reflect the transactions and dispositions of the assets of the company; (ii) provide reasonable assurance that transactions are recorded as necessary to permit preparation of financial statements in accordance with generally accepted accounting principles, and that receipts and expenditures of the company are being made only in accordance with authorizations of management and directors of the company; and (iii) provide reasonable assurance regarding prevention or timely detection of unauthorized acquisition, use, or disposition of the company’s assets that could have a material effect on the financial statements.

59
Because of its inherent limitations, internal control over financial reporting may not prevent or detect misstatements. Also, projections of any evaluation of effectiveness to future periods are subject to the risk that controls may become inadequate because of changes in conditions, or that the degree of compliance with the policies or procedures may deteriorate.
Critical Audit Matters
The critical audit matter communicated below is a matter arising from the current period audit of the consolidated financial statements that was communicated or required to be communicated to the audit committee and that (i) relates to accounts or disclosures that are material to the consolidated financial statements and (ii) involved our especially challenging, subjective, or complex judgments. The communication of critical audit matters does not alter in any way our opinion on the consolidated financial statements, taken as a whole, and we are not, by communicating the critical audit matter below, providing a separate opinion on the critical audit matter or on the accounts or disclosures to which it relates.
Acquired Real Estate Purchase Price Allocations
Management allocates the purchase price of acquired properties to tangible and identified lease intangible assets based on their fair values. In 2020, the Company acquired a total of $3.6 billion of land, building and intangible lease assets. In making estimates of fair values for purposes of allocating purchase prices of acquired real estate to tangible and identified lease intangible assets, management utilizes information from a number of sources including available real estate broker data, independent appraisals that may be obtained in connection with the acquisition of the respective property, internal data from previous acquisitions or developments, other market data, and significant assumptions such as capitalization rates and market rental rates.
The principal considerations for our determination that performing procedures relating to the acquired real estate purchase price allocations is a critical audit matter are (i) the significant judgment by management when developing the fair value measurements and allocating the purchase price of the acquired properties to the tangible and lease intangible assets acquired, which in turn led to a high degree of auditor judgment and subjectivity in performing procedures and evaluating audit evidence, (ii) significant audit effort was required in
assessing the reasonableness of significant assumptions such as capitalization rates and market rental rates used by management to estimate the fair value of each tangible and lease intangible asset component, and (iii) the audit effort involved the use of professionals with specialized skill and knowledge.
Addressing the matter involved performing procedures and evaluating audit evidence in connection with forming our overall opinion on the financial statements. These procedures included testing the effectiveness of controls relating to management’s acquired real estate purchase price allocations, including controls over the fair value of each tangible and lease intangible asset acquired. These procedures also included, among others, testing management’s process by evaluating the significant assumptions related to capitalization rates and market rental rates, and the methodology used by management in developing the estimated fair values and allocations of the purchase price to the tangible and lease intangible assets acquired. Testing management’s process included using professionals with specialized skill and knowledge to assist in evaluating the valuation methodologies and significant assumptions used by management, such as capitalization rates and market rental rates, for certain acquisitions. Evaluating the reasonableness of assumptions involved considering internal data from previous acquisitions, where relevant.
Birmingham, Alabama
March 1, 2021
We have served as the Company’s auditor since 2008.

60
MEDICAL PROPERTIES TRUST, INC. AND SUBSIDIARIESCONSOLIDAT E D BALANCE SH E E TS
December 31, 2020 2019
(Amounts in thousands, except for per share data)
ASSETS
Real estate assets
Land $ 1,463,200 $ 1,017,402
Buildings and improvements 9,286,507 6,295,084
Construction in progress 30,139 168,212
Intangible lease assets 1,299,081 622,056
Investment in financing leases 2,010,922 2,060,302
Mortgage loans 248,080 1,275,022
Gross investment in real estate assets 14,337,929 11,438,078
Accumulated depreciation (728,176) (504,651)
Accumulated amortization (105,353) (65,391)
Net investment in real estate assets 13,504,400 10,868,036
Cash and cash equivalents 549,884 1,462,286
Interest and rent receivables 46,208 31,357
Straight-line rent receivables 490,462 334,231
Equity investments 1,123,623 926,990
Other loans 858,368 544,832
Other assets 256,069 299,599
Total Assets $ 16,829,014 $ 14,467,331
LIABILITIES AND EQUITY
Liabilities
Debt, net $ 8,865,458 $ 7,023,679
Accounts payable and accrued expenses 438,750 291,489
Deferred revenue 36,177 16,098
Obligations to tenants and other lease liabilities 144,772 107,911
Total Liabilities 9,485,157 7,439,177
Commitments and Contingencies
Equity
Preferred stock, $0.001 par value. Authorized 10,000 shares; no shares outstanding — —
Common stock, $0.001 par value. Authorized 750,000 shares; issued and outstanding — 541,419 shares at December 31, 2020 and 517,522 shares at December 31, 2019
541 518
Additional paid-in capital 7,461,503 7,008,199
Retained (deficit) earnings (71,411) 83,012
Accumulated other comprehensive loss (51,324) (62,905)
Treasury shares, at cost (777) (777)
Total Medical Properties Trust, Inc. stockholders’ equity 7,338,532 7,028,047
Non-controlling interests 5,325 107
Total Equity 7,343,857 7,028,154
Total Liabilities and Equity $ 16,829,014 $ 14,467,331
See accompanying notes to consolidated financial statements.

61
MEDICAL PROPERTIES TRUST, INC. AND SUBSIDIARIESCONSOLIDAT E D STATE ME NTS O F NE T I NCOM E
For the Years Ended December 31, 2020 2019 2018
(Amounts in thousands, except for per share data)
REVENUES
Rent billed $ 741,311 $ 474,151 $ 473,343
Straight-line rent 158,881 110,456 74,741
Income from financing leases 206,550 119,617 73,983
Interest and other income 142,496 149,973 162,455
Total revenues 1,249,238 854,197 784,522
EXPENSES
Interest 328,728 237,830 223,274
Real estate depreciation and amortization 264,245 152,313 133,083
Property-related 24,890 23,992 9,237
General and administrative 131,663 96,411 81,003
Total expenses 749,526 510,546 446,597
OTHER INCOME (EXPENSE)
(Loss) gain on sale of real estate (2,833) 41,560 719,392
Real estate impairment charges (19,006) (21,031) (48,007)
Earnings from equity interests 20,417 16,051 14,165
Debt refinancing and unutilized financing costs (28,180) (6,106) —
Other (including mark-to-market adjustments on equity securities) (6,782) (345) (4,071)
Total other income (expense) (36,384) 30,129 681,479
Income before income tax 463,328 373,780 1,019,404
Income tax (expense) benefit (31,056) 2,621 (927)
Net income 432,272 376,401 1,018,477
Net income attributable to non-controlling interests (822) (1,717) (1,792)
Net income attributable to MPT common stockholders $ 431,450 $ 374,684 $ 1,016,685
Earnings per share – basic
Net income attributable to MPT common stockholders $ 0.81 $ 0.87 $ 2.77
Weighted-average shares outstanding – basic 529,239 427,075 365,364
Earnings per share – diluted
Net income attributable to MPT common stockholders $ 0.81 $ 0.87 $ 2.76
Weighted-average shares outstanding – diluted 530,461 428,299 366,271
See accompanying notes to consolidated financial statements.
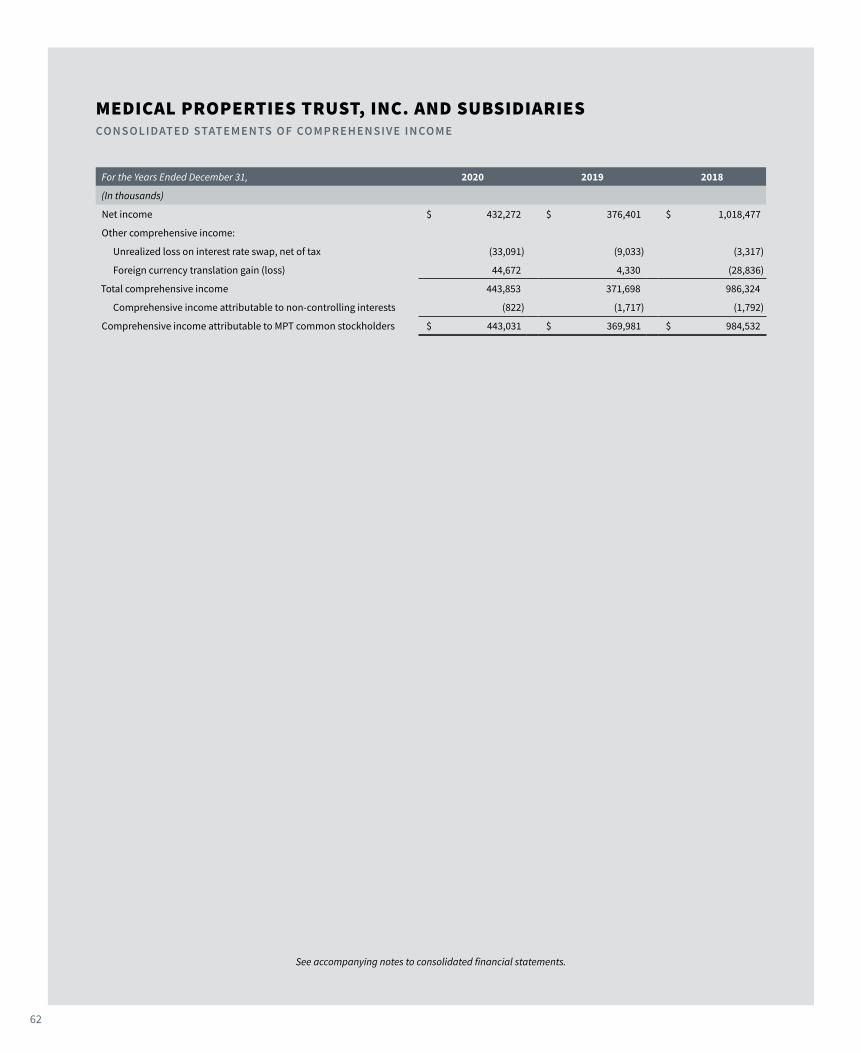
62
MEDICAL PROPERTIES TRUST, INC. AND SUBSIDIARIESCONSOLIDAT E D STATE ME NTS O F CO MPREHENSIVE INCOM E
For the Years Ended December 31, 2020 2019 2018
(In thousands)
Net income $ 432,272 $ 376,401 $ 1,018,477
Other comprehensive income:
Unrealized loss on interest rate swap, net of tax (33,091) (9,033) (3,317)
Foreign currency translation gain (loss) 44,672 4,330 (28,836)
Total comprehensive income 443,853 371,698 986,324
Comprehensive income attributable to non-controlling interests (822) (1,717) (1,792)
Comprehensive income attributable to MPT common stockholders $ 443,031 $ 369,981 $ 984,532
See accompanying notes to consolidated financial statements.

63
MEDICAL PROPERTIES TRUST, INC. AND SUBSIDIARIESCONSOLIDAT E D STATE ME NTS O F E Q UI TY FOR THE YEARS ENDED DEC EM B ER 31, 2020, 2019 AND 2018(Amounts in thousands, except per share data)
See accompanying notes to consolidated financial statements.
Preferred CommonAdditional
Paid-in Capital
Retained Earnings (Deficit)
Accumulated Other
Comprehensive Loss
Treasury Shares
Non- Controlling
InterestsTotal
EquitySharesPar
Value SharesPar
Value
Balance at December 31, 2017 — $ — 364,424 $ 364 $ 4,333,027 $ (485,932) $ (26,049) $ (777) $ 14,572 $ 3,835,205
Net income — — — — — 1,016,685 — — 1,792 1,018,477
Cumulative effect of change in accounting principles
— — — — — 1,938 — — — 1,938
Unrealized loss on interest rate swap, net of tax — — — — — — (3,317) — — (3,317)
Foreign currency translation loss — — — — — — (28,836) — — (28,836)
Stock vesting and amortization of stock-based compensation
— — 599 1 16,504 — — — — 16,505
Redemption of MOP units — — — — (816) — — — — (816)
Distributions to non-controlling interests — — — — — — — — (2,534) (2,534)
Proceeds from offering (net of offering costs) — — 5,614 6 94,233 — — — — 94,239
Dividends declared ($1.00 per common share) — — — — — (369,923) — — — (369,923)
Balance at December 31, 2018 — $ — 370,637 $ 371 $ 4,442,948 $ 162,768 $ (58,202) $ (777) $ 13,830 $ 4,560,938
Net income — — — — — 374,684 — — 1,717 376,401
Unrealized loss on interest rate swap, net of tax — — — — — — (9,033) — — (9,033)
Foreign currency translation gain — — — — — — 4,330 — — 4,330
Stock vesting and amortization of stock-based compensation
— — 1,536 2 32,186 — — — — 32,188
Distributions to non-controlling interests, net — — — — — — — — (15,440) (15,440)
Proceeds from offering (net of offering costs) — — 145,349 145 2,533,065 — — — — 2,533,210
Dividends declared ($1.02 per common share) — — — — — (454,440) — — — (454,440)
Balance at December 31, 2019 — $ — 517,522 $ 518 $ 7,008,199 $ 83,012 $ (62,905) $ (777) $ 107 $ 7,028,154
Net income — — — — — 431,450 — — 822 432,272
Cumulative effect of change in accounting principles
— — — — — (8,399) — — — (8,399)
Unrealized loss on interest rate swap, net of tax — — — — — — (33,091) — — (33,091)
Foreign currency translation gain — — — — — — 44,672 — — 44,672
Stock vesting and amortization of stock-based compensation
— — 2,893 2 47,152 — — — — 47,154
Sale of non-controlling interests — — — — — — — — 5,097 5,097
Redemption of MOP units — — — — (4,928) — — — — (4,928)
Distributions to non-controlling interests — — — — — — — — (701) (701)
Proceeds from offering (net of offering costs) — — 21,004 21 411,080 — — — — 411,101
Dividends declared ($1.08 per common share) — — — — — (577,474) — — — (577,474)
Balance at December 31, 2020 — $ — 541,419 $ 541 $ 7,461,503 $ (71,411) $ (51,324) $ (777) $ 5,325 $ 7,343,857

64
MEDICAL PROPERTIES TRUST, INC. AND SUBSIDIARIESCONSOLIDAT E D STATE ME NTS O F CASH F LOWS
See accompanying notes to consolidated financial statements.
For the Years Ended December 31, 2020 2019 2018
(Amounts in thousands)
OPERATING ACTIVITIES
Net income $ 432,272 $ 376,401 $ 1,018,477
Adjustments to reconcile net income to net cash provided by operating activities:
Depreciation and amortization 275,953 156,575 141,492
Amortization of deferred financing costs and debt discount 13,099 8,881 7,363
Straight-line rent revenue and other (226,906) (138,806) (100,594)
Share-based compensation 47,154 32,188 16,505
Loss (gain) from sale of real estate 2,833 (41,560) (719,392)
Impairment charges 19,006 21,031 48,007
Straight-line rent and other write-off 26,415 22,447 18,002
Debt refinancing and unutilized financing costs 28,180 6,106 —
Pre-acquisition rent collected – Circle Transaction (35,020) — —
Other adjustments 17,429 (2,271) (3,768)
Changes in:
Interest and rent receivables (2,438) 12,906 46,498
Other assets 18,264 (4,992) (18,051)
Accounts payable and accrued expenses (18,424) 39,630 (5,596)
Deferred revenue 19,819 5,581 145
Net cash provided by operating activities 617,636 494,117 449,088
INVESTING ACTIVITIES
Cash paid for acquisitions and other related investments (4,249,180) (4,565,594) (1,430,995)
Net proceeds from sale of real estate 94,177 111,766 1,513,666
Principal received on loans receivable 1,306,187 920 885,917
Investment in loans receivable (62,651) (54,088) (212,002)
Construction in progress and other (68,350) (83,798) (53,967)
Return of equity investment 69,224 — —
Capital additions and other investments, net (36,180) (293,163) (138,441)
Net cash (used for) provided by investing activities (2,946,773) (4,883,957) 564,178
FINANCING ACTIVITIES
Proceeds from term debt, net of discount 2,215,950 3,048,424 759,735
Payments of term debt (800,000) — —
Revolving credit facilities, net 162,633 (65,736) (811,718)
Dividends paid (567,969) (411,697) (363,906)
Lease deposits and other obligations to tenants 21,706 (12,260) (20,606)
Proceeds from sale of common shares, net of offering costs 411,101 2,533,210 94,239
Payment of debt refinancing, deferred financing costs and other financing activities (42,347) (50,057) (3,614)
Net cash provided by (used for) financing activities 1,401,074 5,041,884 (345,870)
(Decrease) increase in cash, cash equivalents, and restricted cash for the year (928,063) 652,044 667,396
Effect of exchange rate changes 16,441 (6,478) (17,218)
Cash, cash equivalents, and restricted cash at beginning of year 1,467,991 822,425 172,247
Cash, cash equivalents, and restricted cash at end of year $ 556,369 $ 1,467,991 $ 822,425

65
MEDICAL PROPERTIES TRUST, INC. AND SUBSIDIARIESCONSOLIDAT E D STATE ME NTS O F CASH FLOWS ( CONTINU ED)
Interest paid, including capitalized interest of $3,030 in 2020, $3,936 in 2019, and $1,480 in 2018 $ 309,920 $ 211,163 $ 221,779
Supplemental schedule of non-cash financing activities:
Dividends declared, unpaid $ 147,666 $ 138,161 $ 95,419
Cash, cash equivalents, and restricted cash are comprised of the following:
Beginning of period:
Cash and cash equivalents $ 1,462,286 $ 820,868 $ 171,472
Restricted cash, included in Other assets 5,705 1,557 775
$ 1,467,991 $ 822,425 $ 172,247
End of period:
Cash and cash equivalents $ 549,884 $ 1,462,286 $ 820,868
Restricted cash, included in Other assets 6,485 5,705 1,557
$ 556,369 $ 1,467,991 $ 822,425
For the Years Ended December 31, 2020 2019 2018
See accompanying notes to consolidated financial statements.

66
1. ORGANIZATION
Medical Properties Trust, Inc., a Maryland corporation, was formed on August 27, 2003, under the Maryland General Corporation Law for the purpose of engaging in the business of investing in, owning, and leasing healthcare real estate. Our operating partnership subsidiary, MPT Operating Partnership, L.P., (the “Operating Partnership”) through which we conduct all of our operations, was formed in September 2003. Through another wholly-owned subsidiary, Medical Properties Trust, LLC, we are the sole general partner of the Operating Partnership. At present, we directly own all of the limited partnership interests in the Operating Partnership and have elected to report our required disclosures and that of the Operating Partnership on a combined basis, except where material differences exist.
We have operated as a real estate investment trust (“REIT”) since April 6, 2004, and accordingly, elected REIT status upon the filing in September 2005 of the calendar year 2004 federal income tax return. Accordingly, we will generally not be subject to United States (“U.S.”) federal income tax, provided that we continue to qualify as a REIT and our distributions to our stockholders equal or exceed our taxable income. Certain non-real estate activities we undertake are conducted by entities which we elected to be treated as taxable REIT subsidiaries (“TRS”). Our TRS entities are subject to both U.S. federal and state income taxes. For our properties located outside the U.S., we are subject to the local taxes of the jurisdictions where our properties reside and/or legal entities are domiciled; however, we do not expect to incur substantial additional taxes in the U.S. from foreign based income as the majority of such income flows through our REIT.
Our primary business strategy is to acquire and develop real estate and improvements, primarily for long-term lease to providers of healthcare services, such as operators of general acute care hospitals, inpatient physical rehabilitation hospitals, long-term acute care hospitals, freestanding ER/urgent care facilities, and behavioral health facilities. We also make mortgage and other loans to operators of similar facilities. In addition, we may obtain profits or equity interests in our tenants, from time-to-time, in order to enhance our overall return.
Our business model facilitates acquisitions and recapitalizations, and allows operators of healthcare facilities to unlock the value of their real estate to fund facility improvements, technology upgrades, and other investments in operations. At December 31, 2020, we have investments in 392 facilities in 33 states in the U.S., in six countries in Europe, one country in South America, and across Australia. We manage our business as a single business segment.
2. SUMMARY OF SIGNIFICANT ACCOUNTING POLICIES
Use of Estimates: The preparation of our consolidated financial statements in conformity with accounting principles generally accepted in the U.S. requires management to make estimates
and assumptions that affect the reported amounts of assets and liabilities and disclosure of contingent assets and liabilities at the date of the financial statements and the reported amounts of revenues and expenses during the reporting period. During 2020, the global outbreak of a novel coronavirus, or COVID-19, spread all over the world including countries where we own and lease facilities. The World Health Organization designated COVID-19 as a pandemic, and numerous countries, including the U.S., declared national emergencies with respect to COVID-19. As the global impact of the outbreak evolved, many countries reacted by instituting quarantines and restrictions on travel, closing financial markets and/or restricting trade- including requiring medically necessary elective surgeries at hospitals to be deferred. Although hospitals are back accepting patients and performing medically necessary elective surgeries, many of these trade restrictions are still in place. We believe the estimates and assumptions underlying our consolidated financial statements are reasonable and supportable based on the information available as of December 31, 2020 (particularly as it relates to our assessments of the recoverability of our real estate and the adequacy of our credit loss reserves on loans and financing receivables). However, the ultimate impact to our tenants’ results of operations and liquidity and their ability to pay our rent and interest due to the impact of COVID-19 cannot be predicted with 100% confidence, particularly given the full scope, severity, and duration of the pandemic and the actions needed (including vaccine rollouts worldwide) to contain the pandemic or mitigate its impact is uncertain. This makes any estimates and assumptions as of December 31, 2020 inherently less certain than they would be absent the potential impact of COVID-19. Actual results could differ from those estimates.
Principles of Consolidation: Property holding entities and other subsidiaries of which we own 100% of the equity or have a controlling financial interest evidenced by ownership of a majority voting interest are consolidated. All inter-company balances and transactions are eliminated. For entities in which we own less than 100% of the equity interest, we consolidate the property if we have the direct or indirect ability to control the entities’ activities based upon the terms of the respective entities’ ownership agreements. For these entities, we record a non-controlling interest representing equity held by non-controlling interests.
We continually evaluate all of our transactions and investments to determine if they represent variable interests in a variable interest entity. If we determine that we have a variable interest in a variable interest entity, we then evaluate if we are the primary beneficiary of the variable interest entity. The evaluation is a qualitative assessment as to whether we have the ability to direct the activities of a variable interest entity that most significantly impact the entity’s economic performance. We consolidate each variable interest entity in which we, by virtue of or transactions with our investments in the entity, are considered to be the primary beneficiary.
MEDICAL PROPERTIES TRUST, INC. AND SUBSIDIARIESNOTES TO CO NS O LI DATE D F I NANCI AL STATEM ENTS

67
At December 31, 2020, we had loans and/or equity investments in certain variable interest entities approximating $230 million, which represents our maximum exposure to loss as a result of our involvement in such entities. We have determined that we were not the primary beneficiary of any variable interest entity in which we hold a variable interest because we do not control the activities (such as the day-to-day operations) that most significantly impact the economic performance of these entities.
Investments in Unconsolidated Entities: Investments in entities in which we have the ability to significantly influence (but not control) are accounted for by the equity method, such as our joint venture with Primotop Holdings S.à.r.l. (“Primotop”) as discussed in Note 3. Under the equity method of accounting, our share of the investee’s earnings or losses are included in the “Earnings from equity interests” line of our consolidated statements of net income. Except for our joint venture with Primotop, we have elected to record our share of such investee’s earnings or losses on a lag basis. The initial carrying value of investments in unconsolidated entities is based on the amount paid to purchase the interest in the investee entity. Subsequently, our investments are increased/decreased by our share in the investees’ earnings/losses and decreased by cash distributions from our investees. To the extent that our cost basis is different from the basis reflected at the investee entity level, the basis difference is generally amortized over the lives of the related assets and liabilities, and such amortization is included in our share of equity in earnings of the investee.
We evaluate our equity method investments for impairment based upon a comparison of the fair value of the equity method investment to its carrying value, when impairment indicators exist. If we determine a decline in the fair value of an investment in an unconsolidated investee entity below its carrying value is other-than-temporary, an impairment is recorded.
Investments in entities in which we do not control nor do we have the ability to significantly influence and for which there is no readily determinable fair value [such as our investments in Steward Health Care System LLC (“Steward”) and Median Kliniken S.á.r.l. (“MEDIAN”)] are accounted for at cost, less any impairment, plus or minus changes resulting from observable price changes in orderly transactions involving the investee. Any cash distributions on these types of investments are recorded to income upon receipt. For similar investments but for which there are readily determinable fair values, such investments are measured at fair value, with unrealized gains and losses recorded in income. Cash and Cash Equivalents: Certificates of deposit, short-term investments with original maturities of three months or less, and money-market mutual funds are considered cash equivalents. The majority of our cash and cash equivalents are held at major commercial banks, which at times may exceed the Federal Deposit Insurance Corporation limit. We have not experienced
any losses to-date on our invested cash. Cash and cash equivalents which have been restricted as to its use are recorded in other assets.
Revenue Recognition: Our revenues are primarily from leases and loans. On January 1, 2019, we adopted Accounting Standards Update (“ASU”) 2016-02, “Leases”, (“ASU 2016-02”). ASU 2016-02 sets out the principles for the recognition, measurement, presentation, and disclosure of leases for both parties to a contract (i.e. lessees and lessors). We adopted this standard using the modified retrospective approach and elected the package of practical expedients permitted under the transition guidance within the new standard, which among other things permitted the following: no reassessment of whether existing contracts were or contained a lease and no reassessment of lease classification for existing leases. In addition, we made certain elections permitted which (1) allowed entities to apply the transition provisions of the new standard at its adoption date instead of at the earliest comparative period presented and (2) permitted lessors to account for lease and non-lease components as a single lease component in a contract if certain criteria were met. For lessors, this new standard of accounting for leases was substantially equivalent to previous guidance, but there were some differences which we highlight below:
OPERATING LEASE REVENUE
We receive income from operating leases based on the fixed required rents (base rents) per the lease agreements. Rent revenue from base rents is recorded on the straight-line method over the terms of the related lease agreements for new leases and the remaining terms of existing leases for those acquired as part of a property acquisition. The straight-line method records the periodic average amount of base rents earned over the term of a lease, taking into account contractual rent increases over the lease term. The straight-line method typically has the effect of recording more rent revenue from a lease than a tenant is required to pay early in the term of the lease. During the later parts of a lease term, this effect reverses with less rent revenue recorded than a tenant is required to pay. Rent revenue, as recorded on the straight-line method, in the consolidated statements of net income is presented as two amounts: rent billed and straight-line rent. Rent billed revenue is the amount of base rent actually billed to our tenants each period as required by the lease. Straight-line rent revenue is the difference between rent revenue earned based on the straight-line method and the amount recorded as rent billed revenue. We record the difference between rent revenues earned and amounts due per the respective lease agreements, as applicable, as an increase or decrease to straight-line rent receivables.
Rental payments received prior to their recognition as income are classified as deferred revenue.

68
FINANCING LEASE REVENUE
Under the lease accounting rules adopted on January 1, 2019, if an acquisition and subsequent lease of a property to the seller does not meet the definition of a sale, we must account for the transaction as a financing with income recognized using the imputed interest method.
Another type of financing lease that we carried forward from the previous lease accounting guidance is a direct financing lease (“DFL”). For leases accounted for as DFLs, the future minimum lease payments are recorded as a receivable. The difference between the future minimum lease payments and the estimated residual values less the cost of the properties is recorded as unearned income. Unearned income is deferred and amortized to income over the lease terms to provide a constant yield when collectability of the lease payments is reasonably assured. Investments in DFLs are presented net of unearned income.
OTHER LEASING REVENUE
We begin recording base rent income from our development projects when the lessee takes physical possession of the facility, which may be different from the stated start date of the lease. Also, during construction of our development projects, we may be entitled to accrue rent based on the cost paid during the construction period (construction period rent). We accrue construction period rent as a receivable with a corresponding offset to deferred revenue during the construction period. When the lessee takes physical possession of the facility, we begin recognizing the deferred construction period revenue on the straight-line method over the term of the lease.
We also receive additional rent (contingent rent) under some leases based on increases in the consumer price index (“CPI”) (or similar index outside the U.S.) or when CPI exceeds the annual minimum percentage increase as stipulated in the lease. Contingent rents are recorded as rent billed revenue in the period earned.
Starting January 1, 2019 (with the adoption of ASU 2016-02), tenant payments for ground leases along with other operating expenses, such as property taxes and insurance, that are paid directly by us and reimbursed by our tenants are presented on a gross basis with the related revenues recorded in “Interest and other income” and the related expenses in “Property-related” in our consolidated statements of net income. All payments of other operating expenses made directly by the tenant to the applicable government or appropriate third-party vendor are recorded on a net basis, consistent with how all tenant payments or reimbursements pursuant to our “triple-net” leases were accounted for prior to the adoption of ASU 2016-02.
INTEREST REVENUE
We receive interest income from our tenants/borrowers on mortgage loans, working capital loans, and other long-term loans. Interest income from these loans is recognized as earned based upon the principal outstanding and terms of the loans.
OTHER REVENUE
Commitment fees received from lessees for development and leasing services are initially recorded as deferred revenue and recognized as income over the initial term of a lease to produce a constant effective yield on the lease (interest method). Commitment and origination fees from lending services are also recorded as deferred revenue initially and recognized as income over the life of the loan using the interest method.
Acquired Real Estate Purchase Price Allocation: We account for acquisitions of real estate under asset acquisition accounting rules. Under this accounting standard, we allocate the purchase price (including any third-party transaction costs directly related to the acquisition) of acquired properties to tangible and identified intangible assets acquired and liabilities assumed (if any) based on their fair values. In making estimates of fair values for purposes of allocating purchase prices of acquired real estate, we may utilize a number of sources, from time-to-time, including available real estate broker data, independent appraisals that may be obtained in connection with the acquisition, internal data from previous acquisitions or developments, and other market data, including market comparables for significant assumptions such as market rental, capitalization, and discount rates. We also consider information obtained about each property as a result of our pre-acquisition due diligence, marketing, and leasing activities in estimating the fair value of the tangible and intangible assets acquired.
We measure the aggregate value of lease intangible assets acquired based on the difference between (i) the property valued with new or in-place leases adjusted to market rental rates and (ii) the property valued as if vacant. Management’s estimates of value are made using methods similar to those used by independent appraisers (e.g., discounted cash flow analysis). Factors considered by management in our analysis include an estimate of carrying costs during hypothetical expected lease-up periods, considering current market conditions, and costs to execute similar leases. We also consider information obtained about each targeted facility as a result of our pre-acquisition due diligence, marketing, and leasing activities in estimating the fair value of the intangible assets acquired. In estimating carrying costs, management includes real estate taxes, insurance, and other operating expenses and estimates of lost rentals at market rates during the expected lease-up periods, which we expect to be about six months, but can be longer depending on specific local market conditions. Management also estimates costs to execute similar leases including leasing commissions, legal costs, and other related expenses to the extent that such costs are not already incurred in connection with a new lease origination as part of the transaction.
Other intangible assets acquired may include customer relationship intangible values which are based on management’s evaluation of the specific characteristics of each prospective tenant’s lease and our overall relationship with that tenant. Characteristics to be considered by management in allocating these values include the nature and extent of our existing business relationships with the tenant, growth prospects for developing new business with the tenant, the tenant’s credit quality, and expectations of lease renewals, including those existing under the terms of the lease agreement, among other factors.
69
We amortize the value of our lease intangible assets to expense over the term of the respective leases. If a lease is terminated early, the unamortized portion of the lease intangibles are charged to expense.
We record above-market and below-market in-place lease values, if any, for our facilities, which are based on the present value of the difference between (i) the contractual amounts to be paid pursuant to the in-place leases and (ii) management’s estimate of fair market lease rates for the corresponding in-place leases, measured over a period equal to the remaining non-cancelable term of the lease. We amortize any resulting capitalized above-market lease values as a reduction of rental income over the lease term. We amortize any resulting capitalized below-market lease values as an increase to rental income over the lease term. If a lease is terminated early, the unamortized portion of the capitalized above/below market lease value is recognized in rental income at that time.
Real Estate and Depreciation: Real estate, consisting of land, buildings and improvements, are maintained at cost. Although typically paid by our tenants, any expenditure for ordinary maintenance and repairs that we pay are expensed to operations as incurred. Significant renovations and improvements which improve and/or extend the useful life of the asset are capitalized and depreciated over their estimated useful lives. We record impairment losses on long-lived assets used in operations when events and circumstances indicate that the assets might be impaired and the undiscounted cash flows estimated to be generated by those assets, including an estimated liquidation amount, during the expected holding periods are less than the carrying amounts of those assets. Impairment losses are measured as the difference between carrying value and fair value of the assets. For assets held for sale, we cease recording depreciation expense and adjust the assets’ value to the lower of its carrying value or fair value, less cost of disposal. Fair value is based on estimated cash flows discounted at a risk-adjusted rate of interest. We classify real estate assets as held for sale when we have commenced an active program to sell the assets, and in the opinion of management, it is probable the asset will be sold within the next 12 months.
Construction in progress includes the cost of land, the cost of construction of buildings, improvements, and fixed equipment, and costs for design and engineering. Other costs, such as interest, legal, property taxes, and corporate project supervision, which can be directly associated with the project during construction, are also included in construction in progress. We commence capitalization of costs associated with a development project when the development of the future asset is probable and activities necessary to get the underlying property ready for its intended use have been initiated. We stop the capitalization of costs when the property is substantially complete and ready for its intended use.
Depreciation is calculated on the straight-line method over the estimated useful lives of the related real estate and other assets. Our weighted-average useful lives at December 31, 2020 are as follows:
CREDIT LOSSES:
Losses from Rent Receivables: For all leases, we continuously monitor the performance of our existing tenants including, but not limited to: admission levels and surgery/procedure volumes by type; current operating margins; ratio of our tenants’ operating margins both to facility rent and to facility rent plus other fixed costs; trends in cash collections; trends in revenue and patient mix; and the effect of evolving healthcare regulations, adverse economic and political conditions, and other events ongoing (such as the recent health crisis caused by the COVID-19 pandemic) on tenants’ profitability and liquidity.
LOSSES FROM OPERATING LEASE RECEIVABLES: We utilize the information above along with the tenant’s payment and default history in evaluating (on a property-by-property basis) whether or not a provision for losses on outstanding billed rent and/or straight-line rent receivables is needed. A provision for losses on rent receivables (including straight-line rent receivables) is ultimately recorded when it becomes probable that the receivable will not be collected in full. The provision is an amount which reduces the receivable to its estimated net realizable value based on a determination of the eventual amounts to be collected either from the debtor or from existing collateral, if any.
LOSSES ON FINANCING LEASE RECEIVABLES: Upon the adoption of ASU No. 2016-13 “Measurement of Credit Losses on Financial Instruments” (“ASU 2016-13”) on January 1, 2020, we began applying a new forward-looking “expected loss” model to all of our financing receivables, including financing leases and loans. With this change, we have grouped our financial instruments into two primary pools of similar credit risk: secured and unsecured. The secured instruments include our investments in financing receivables as all are secured by the underlying real estate among other collateral. Within the two primary pools, we further grouped our instruments into sub-pools based on several tenant/borrower characteristics, including years of experience in the healthcare industry and in a particular market or region and overall capitalization. We then determined a credit loss percentage per pool based on our history over a period of time that closely matches the remaining terms of the financial instruments being analyzed and adjusted as needed for current trends or unusual circumstances. We have applied these credit loss percentages to the book value of the related instruments to establish a credit loss reserve on our financing lease receivables and such credit loss reserve (including the underlying assumptions) is reviewed and adjusted quarterly. If a financing receivable is under performing and is deemed uncollectible based on the lessee’s overall financial condition, we will adjust the credit loss reserve based on the fair value of the underlying collateral.
Buildings and improvements 39.0 years
Lease intangibles 26.1 years
Leasehold improvements 17.0 years
Furniture, equipment, and other 9.8 years
70
With the adoption of ASU 2016-13, we made the accounting policy election to exclude interest receivables from the credit loss reserve analysis. Such receivables are impaired and an allowance recorded when it is deemed probable that we will be unable to collect all amounts due. Like operating lease receivables, the need for an allowance is based upon our assessment of the lessee’s overall financial condition, economic resources and payment record, the prospects for support from any financially responsible guarantors, and, if appropriate, the realizable value of any collateral. Financing leases are placed on non-accrual status when we determine that the collectability of contractual amounts is not reasonably assured. If on non-accrual status, we generally account for the financing lease on a cash basis, in which income is recognized only upon receipt of cash.
LOANS: Loans consist of mortgage loans, working capital loans, and other loans. Mortgage loans are collateralized by interests in real property. Working capital and other loans are generally collateralized by interests in receivables and corporate and individual guarantees. We record loans at cost. Like our financing lease receivables, we are using ASU 2016-13 to establish credit loss reserves on all outstanding loans based on historical credit losses on similar instruments. Such credit loss reserves, including the underlying assumptions, are reviewed and adjusted quarterly. If a loan’s performance worsens and foreclosure is deemed probable for our collateral-based loans (after considering the borrower’s overall financial condition as described above for leases), we will adjust the allowance for expected credit losses based on the current fair value of such collateral at the time the loan is deemed uncollectible. If the loan is not collateralized, the loan will be written-off once it is determined that such loan is no longer collectible. Interest receivables on loans are excluded from ASU 2016-13 and we assess their collectability similar to how we assess collectability for interest receivables on financing leases described above.
Upon adoption of ASU 2016-13, we recorded a credit loss reserve of $8.4 million with the effect recorded in equity as a cumulative effect of a change in accounting principle.
Earnings Per Share: Basic earnings per common share is computed by dividing net income by the weighted-average number of shares outstanding during the period. Diluted earnings per common share is calculated by including the effect of dilutive securities.
Our unvested restricted stock awards contain non-forfeitable rights to dividends, and accordingly, these awards are deemed to be participating securities. These participating securities are included in the earnings allocation in computing both basic and diluted earnings per common share.
Income Taxes: We conduct our business as a REIT under Sections 856 through 860 of the Internal Revenue Code of 1986, as amended (“the Code”). To qualify as a REIT, we must meet certain organizational and operational requirements, including a requirement to distribute to stockholders at least 90% of our REIT’s ordinary taxable income. As a REIT, we generally pay little U.S. federal and state income tax because of the dividends paid deduction that we are allowed to take. If we fail to qualify as a
REIT in any taxable year, we will then be subject to U.S. federal income taxes on our taxable income at regular corporate rates and will not be permitted to qualify for treatment as a REIT for federal income tax purposes for four years following the year during which qualification is lost, unless the Internal Revenue Service grants us relief under certain statutory provisions. Such an event could materially adversely affect our net income and net cash available for distribution to stockholders. However, we intend to operate in such a manner so that we will remain qualified as a REIT for U.S. federal income tax purposes.
Our financial statements include the operations of a TRS, MPT Development Services, Inc. (“MDS”), and with many other entities, which are single member LLCs that are disregarded for tax purposes and are reflected in the tax returns of MDS. MDS is not entitled to a dividends paid deduction and is subject to U.S. federal, state, and local income taxes. MDS is authorized to provide property development, leasing, and management services for third-party owned properties, and we will make non-mortgage loans to and/or investments in our lessees through this entity.
With the property acquisitions and investments in Europe, Australia, and South America, we are subject to income taxes internationally. However, we do not expect to incur any additional income taxes in the U.S. as such income from our international properties flows through our REIT income tax returns. For our TRS and international subsidiaries, we determine deferred tax assets and liabilities based on the differences between the financial reporting and tax bases of assets and liabilities using enacted tax rates in effect for the year in which the differences are expected to reverse. Any increase or decrease in our deferred tax assets/liabilities that results from a change in circumstances and that causes us to change our judgment about expected future tax consequences of events, is reflected in our tax provision when such changes occur. Deferred income taxes also reflect the impact of operating loss carryforwards. A valuation allowance is provided if we believe it is more likely than not that all or some portion of our deferred tax assets will not be realized. Any increase or decrease in the valuation allowance that results from a change in circumstances, and that causes us to change our judgment about our ability to realize the related deferred tax asset, is reflected in our tax provision when such changes occur.
The calculation of our income taxes involves dealing with uncertainties in the application of complex tax laws and regulations in a multitude of jurisdictions across our global operations. An income tax benefit from an uncertain tax position may be recognized when it is more likely than not that the position will be sustained upon examination, including resolutions of any related appeals or litigation processes, on the basis of technical merits. However, if a more likely than not position cannot be reached, we record a liability as an offset to the tax benefit and adjust the liabilities when our judgment changes as a result of the evaluation of new information not previously available. Because of the complexity of some of these uncertainties, the ultimate resolution may result in a payment that is materially different from our current estimate of the uncertain tax position liabilities. These differences will be
71
reflected as increases or decreases to income tax expense in the period in which new information is available.
Stock-Based Compensation: We adopted the 2019 Equity Incentive Plan (the “Equity Incentive Plan”) during the second quarter of 2019. Awards of restricted stock and other equity-based awards with service conditions are valued at the average stock price per share on the date of grant and are amortized to compensation expense over the service periods (typically three years), using the straight-line method. Awards that contain market conditions are valued on the grant date using a Monte Carlo valuation model and are amortized to compensation expense over the derived service periods, which correspond to the periods over which we estimate the awards will be earned, which generally range from three to five years, using the straight-line method. Awards with performance conditions are valued at the average stock price per share on the date of grant and are amortized using the straight-line method over the service period, adjusted for the probability of achieving the performance conditions. Forfeitures of stock-based awards are recognized as they occur.
Deferred Costs: Costs incurred that directly relate to the offerings of stock are deferred and netted against proceeds received from the offering. Leasing commissions and other leasing costs that would not have been incurred if the lease was not obtained are capitalized as deferred leasing costs and amortized on the straight-line method over the terms of the related lease agreements. Costs identifiable with loans made to borrowers are capitalized and recognized as a reduction in interest income over the life of the loan.
Deferred Financing Costs: We generally capitalize financing costs incurred in connection with new financings and refinancings of debt. These costs are amortized over the lives of the related debt as an addition to interest expense. For debt with defined principal re-payment terms, the deferred costs are amortized to produce a constant effective yield on the debt (interest method) and are included within “Debt, net” on our consolidated balance sheets. For debt without defined principal repayment terms, such as our revolving credit facility, the deferred costs are amortized on the straight-line method over the term of the debt and are included as a component of “Other assets” on our consolidated balance sheets.
Foreign Currency Translation and Transactions: Certain of our international subsidiaries’ functional currencies are the local currencies of their respective countries. We translate the results of operations of our foreign subsidiaries into U.S. dollars using average rates of exchange in effect during the period, and we translate balance sheet accounts using exchange rates in effect at the end of the period. We record resulting currency translation adjustments in “Accumulated other comprehensive income (loss)”, a component of stockholders’ equity on our consolidated balance sheets.
Certain of our U.S. subsidiaries will enter into short-term and long-term transactions denominated in a foreign currency from time-to-time. Gains or losses resulting from these foreign currency transactions are revalued into U.S. dollars at the rates of exchange prevailing at the dates of the transactions.
The effects of revaluation gains or losses on our short-term transactions are included in other income in the consolidated statements of income, while the revaluation effects on our long-term investments are recorded in “Accumulated other comprehensive income (loss)” on our consolidated balance sheets.
Derivative Financial Investments and Hedging Activities: During our normal course of business, we may use certain types of derivative instruments for the purpose of managing interest rate and/or foreign currency risk. We record our derivative and hedging instruments at fair value on the balance sheet. Changes in the estimated fair value of derivative instruments that are not designated as hedges or that do not meet the criteria for hedge accounting are recognized in earnings. For derivatives designated as cash flow hedges, the change in the estimated fair value of the effective portion of the derivative is recognized in “Accumulated other comprehensive income (loss)” on our consolidated balance sheets, whereas the change in the estimated fair value of the ineffective portion is recognized in earnings. For derivatives designated as fair value hedges, the change in the estimated fair value of the effective portion of the derivatives offsets the change in the estimated fair value of the hedged item, whereas the change in the estimated fair value of the ineffective portion is recognized in earnings.
To qualify for hedge accounting, we formally document all relationships between hedging instruments and hedged items, as well as our risk management objective and strategy for undertaking the hedge prior to entering into a derivative transaction. This process includes specific identification of the hedging instrument and the hedge transaction, the nature of the risk being hedged and how the hedging instrument’s effectiveness in hedging the exposure to the hedged transaction’s variability in cash flows attributable to the hedged risk will be assessed. Both at the inception of the hedge and on an ongoing basis, we assess whether the derivatives that are used in hedging transactions are highly effective in offsetting changes in cash flows or fair values of hedged items. In addition, for cash flow hedges, we assess whether the underlying forecasted transaction will occur. We discontinue hedge accounting if a derivative is not determined to be highly effective as a hedge or that it is probable that the underlying forecasted transaction will not occur.
Fair Value Measurement: We measure and disclose the estimated fair value of financial assets and liabilities utilizing a hierarchy of valuation techniques based on whether the inputs to a fair value measurement are considered to be observable or unobservable in a marketplace. Observable inputs reflect market data obtained from independent sources, while unobservable inputs reflect our market assumptions. This hierarchy requires the use of observable market data when available. These inputs have created the following fair value hierarchy:
• Level 1 — quoted prices for identical instruments in active markets;
• Level 2 — quoted prices for similar instruments in active markets; quoted prices for identical or similar instruments in markets that are not active; and model-derived

72
valuations in which significant inputs and significant value drivers are observable in active markets; and
• Level 3 — fair value measurements derived from valuation techniques in which one or more significant inputs or significant value drivers are unobservable.
We measure fair value using a set of standardized procedures that are outlined herein for all assets and liabilities which are required to be measured at their estimated fair value on either a recurring or non-recurring basis. When available, we utilize quoted market prices from an independent third party source to determine fair value and classify such items in Level 1. In some instances where a market price is available, but the instrument is in an inactive or over-the-counter market, we apply the dealer (market maker) pricing estimate and classify the asset or liability in Level 2.
If quoted market prices or inputs are not available, fair value measurements are based upon valuation models that utilize current market or independently sourced market inputs, such as interest rates, option volatilities, credit spreads, market capitalization rates, etc. Items valued using such internally-generated valuation techniques are classified according to the lowest level input that is significant to the fair value measurement. As a result, the asset or liability could be classified in either Level 2 or 3 even though there may be some significant inputs that are readily observable. Internal fair value models and techniques that have been used by us include discounted cash flow and Monte Carlo valuation models. We also consider counterparty’s and our own credit risk on derivatives and other liabilities measured at their estimated fair value.
Fair Value Option Election: For our equity investment in the new international joint venture along with any related investments such as loans (see Note 3 for more details), we have elected to account for these investments at fair value due to the size of the investments and because we believe this method is more reflective of current values. We have not made a similar election for other investments that existed at December 31, 2020.
Leases (Lessee)
Pursuant to ASU 2016-02, we are required to apply a dual approach, classifying leases as either financing or operating leases based on the principle of whether or not the lease is effectively a financed purchase by the lessee. This classification determines whether lease expense is recognized based on an effective interest method (for finance leases) or on a straight-line basis (for operating leases) over the term of the lease. Starting January 1, 2019, we began recording a right-of-use asset and a lease liability for all material leases with a term greater than 12 months regardless of their classification. Leases with a term of 12 months or less are off balance sheet with lease expense recognized on a straight-line basis over the lease term, similar to previous guidance for operating leases.
Reclassifications: Certain amounts in the consolidated financial statements for prior periods have been reclassified to conform to the current period presentation.
RECENT ACCOUNTING DEVELOPMENTS
Reference Rate Reform
In March 2020, the Financial Accounting Standards Board (“FASB”) issued ASU No. 2020-04, “Reference Rate Reform (Topic 848): Facilitation of the Effects of Reference Rate Reform on Financial Reporting” (“ASU 2020-04”) to simplify the accounting for contract modifications made to replace LIBOR or other reference rates that are expected to be discontinued because of reference rate reform. The guidance provides optional expedients and exceptions for applying U.S. GAAP to contracts, hedging relationships, and other transactions affected by reference rate reform if certain criterion are met. The optional expedients and exceptions can be applied to contract modifications made until December 31, 2022. On January 7, 2021, the FASB issued ASU No. 2021-01, “Reference Rate Reform (Topic 848)” (“ASU 2021-01”), which clarifies that certain optional expedients and exceptions in Topic 848 for contract modifications and hedge accounting apply to derivatives that are affected by the discounting transition. The amendments in ASU 2021-01 are elective and apply to our debt and derivative instruments that may be modified as a result of reference rate reform. We are continuing to evaluate these standards, as well as the timing of the transition of various rates in our debt and derivative instruments affected by reference rate reform.
3. REAL ESTATE ACTIVITIES
NEW INVESTMENTS
For the years ended December 31, 2020, 2019, and 2018, we acquired or invested in the following net assets (in thousands):
2020 2019 2018
Buildings. . . . . . . . . . . . . . . . . . . . . . 2,547,313 1,951,066 686,739
Inta ngible lease assets – subject toamortization (weighted-average useful life of 27.5 years in 2020, 19.1 years in 2019, and 27.9 years in 2018) . . . . . . . . . 642,699 227,468 90,651
Investment in financing leases . . . . . . . . 114,797 1,386,797 —
Equity investments . . . . . . . . . . . . . . . 233,593 415,836 245,267
Mortgage loans . . . . . . . . . . . . . . . . . . 176,840 51,267 —
Other loans and assets . . . . . . . . . . . . . 309,523 135,258 336,458
Liabilit ies assumed . . . . . . . . . . . . . . . (140,866) (2,637) —
Total assets acquired . . . . . . . . . . . $ 4,249,180 $ 4,565,594 $ 1,430,995
Loans repaid(1) . . . . . . . . . . . . (834,743) — (764,447)
(1) The 2020 column includes approximately $750 million of loans advanced to Steward in 2017 and exchanged for the fee simple real estate of two hospitals as described below, as well as approximately $100 million of loans advanced to Ernest Health, Inc. (“Ernest”) in 2012 and exchanged for the fee simple real estate of four hospitals as described below. The 2018 column includes $0.8 billion of loans advanced to Steward in 2016 and repaid in 2018 as part of sale leaseback conversion described below.

73
2020 ACTIVITY
Circle Transaction
On January 8, 2020, we acquired a portfolio of 30 acute care hospitals located throughout the United Kingdom for a net purchase price of approximately £1.5 billion from affiliates of BMI Healthcare, Inc. (“BMI”), as part of a share purchase in which we also inherited certain deferred income tax liabilities and £27.6 million of unearned rent revenue. In a related transaction, affiliates of Circle Health Ltd. (“Circle”) entered into definitive agreements to acquire BMI and assume operations of its 52 facilities in the United Kingdom. As part of our acquisition, we inherited 30 existing leases with the operator that had initial fixed terms ending in 2050, with no renewal options but with annual inflation-based escalators. Once final regulatory approval was received in the 2020 second quarter, these 30 leases with Circle were amended (effective June 16, 2020) to include two five-year renewal options and improve the annual inflation-based escalators. These 30 leases are cross-defaulted and guaranteed by Circle.
Other Transactions
On December 31, 2020, we acquired an inpatient rehabilitation hospital in South Carolina for approximately $17 million. As part of the transaction, we acquired the fee simple real estate of three inpatient rehabilitation hospitals and one long-term acute care hospital in exchange for the reduction of the mortgage loans made to Ernest for such properties in 2012. The approximate $115 million investment in all five of these facilities is leased to Ernest pursuant to an existing long-term master lease that has an initial term ending in December 2037 with multiple extension options and annual escalation provisions.
On December 29, 2020, we increased our equity ownership and related investment in Infracore SA (“Infracore”) by investing an additional CHF 206.5 million. We are accounting for our total investment in this joint venture (this investment along with our initial investment in 2019 as noted below) under the equity method.
On November 17, 2020, we invested in the real estate of three general acute care hospitals in Colombia for approximately $135 million. These properties will be operated by the new international joint venture discussed below.
On August 13, 2020, we acquired a general acute care hospital in Lynwood, California for a total investment of approximately $300 million. This property is leased to Prime Healthcare Services, Inc. (“Prime”), pursuant to an existing long-term master lease, which we extended its initial fixed term to August 2035 in connection with this transaction, with annual escalations and multiple extension options.
On July 8, 2020, we acquired the fee simple real estate of two general acute care hospitals located in the Salt Lake City, Utah area, Davis Hospital & Medical Center and Jordan Valley Medical Center, in exchange for the reduction of the mortgage loans made to Steward for such properties and additional cash consideration of $200 million based on their relative fair value.
The approximate $950 million investment in these two facilities is now subject to the Steward master lease that has an initial fixed term ending in October 2031 with multiple extension options and annual escalation provisions.
On June 24, 2020, we originated a CHF 45 million secured loan to Infracore, which was paid-in full on December 2, 2020.
On May 13, 2020, we formed a joint venture for the purpose of investing in the operations of international hospitals. As part of the formation, we originated a $205 million acquisition loan. We have a 49% interest in this joint venture and are accounting for our investment using the fair value option election. The joint venture simultaneously purchased from Steward the rights and existing assets related to all present and future international opportunities previously owned by Steward for strategic, regulatory, and risk management purposes.
Other acquisitions in 2020 included three inpatient rehabilitation hospitals, two general acute care hospitals, and one private acute care hospital totaling approximately $300 million. One inpatient rehabilitation facility, located in Dahlen, Germany, was acquired on August 5, 2020 for €12.5 million and is leased to MEDIAN Kliniken S.à.r.l. (“MEDIAN”) pursuant to the existing master lease. One of the general acute care facilities, located in Darlington, United Kingdom, was acquired on August 7, 2020 for £29.4 million and is leased to Circle pursuant to a long-term lease. The other general acute care hospital, located in London, United Kingdom, was acquired on November 25, 2020 for £50 million via the purchase of a 999-year ground lease and is leased to The Royal Marsden NHS Foundation Trust pursuant to a long-term lease. The inpatient rehabilitation hospitals, one in Texas and one in Indiana, were acquired on December 17, 2020 for approximately $58 million and are leased to Curahealth Hospitals pursuant to a long-term lease. The private acute care hospital, located in Reading, United Kingdom, was acquired on December 18, 2020 for £85.0 million and is leased to Circle pursuant to the existing long-term Circle master lease.
2019 ACTIVITY
LifePoint Acquisition
On December 17, 2019, we acquired a portfolio of 10 acute care hospitals owned and operated by LifePoint Health, Inc. (“LifePoint”) for a combined purchase price of approximately $700.0 million. The properties are leased to LifePoint under one master lease agreement. The master lease had a 20-year initial term and two five-year extension options, plus annual inflation-based escalators.
Prospect Transaction
On August 23, 2019, we invested in a portfolio of 14 acute care hospitals and two behavioral health facilities operated by Prospect Medical Holdings, Inc. (“Prospect”) for a combined purchase price of approximately $1.55 billion. Our investment included the acquisition of the real estate of 11 acute care hospitals and two behavioral health facilities for $1.4 billion. We are accounting for these properties as a financing (as presented in the “Investment in financing leases” line of the consolidated

74
balance sheets) under lease accounting rules due to certain lessee end-of-term purchase options. In addition, we originated a $51.3 million mortgage loan, secured by a first mortgage on an acute care hospital, and a $112.9 million term loan which we expect will be converted into the acquisition of two additional acute care hospitals upon the satisfaction of certain conditions. The master leases and mortgage loan have substantially similar terms, with a 15-year fixed term subject to three extension options, plus annual inflation-based escalators.
The agreements provide for the potential for a future purchase price adjustment of up to an additional $250.0 million, based on achievement of certain performance thresholds over a three-year period beginning August 23, 2019. Although such performance thresholds have not been met at this time, any future purchase price adjustment will be added to the lease base upon which we will earn a return in accordance with the master leases.
Ramsay Acquisition
On August 16, 2019, we acquired freehold interests in eight acute care hospitals located throughout England for an aggregate purchase price of approximately £347 million. The hospitals are leased to Ramsay pursuant to in-place net leases with remaining lease terms ending in 2037 and include annual fixed and periodic market-based escalations.
Australia Transaction
On June 6, 2019, we acquired 11 hospitals in Australia for a purchase price of approximately A$1.2 billion plus stamp duties and registration fees of A$66.6 million. The properties are leased to Healthscope, pursuant to master lease agreements that had an average initial term of 20 years, upon our acquisition, with annual fixed escalations and multiple extension options. Healthscope was acquired in a simultaneous transaction by Brookfield Business Partners L.P. and certain of its institutional partners.
Switzerland Transactions
On May 27, 2019, we invested in a portfolio of 13 acute care campuses and two additional properties in Switzerland for an aggregate purchase price of approximately CHF 236.6 million. The investment (which we account for under the equity method) was effected through our purchase of a stake in a Swiss healthcare real estate company, Infracore, from the previous majority shareholder, Aevis Victoria SA (“Aevis”). The facilities are leased to Swiss Medical Network, a wholly-owned Aevis subsidiary, pursuant to leases that had an average 23-year remaining term upon our acquisition and are subject to annual escalation provisions. Additionally, we purchased a 4.9% stake in Aevis for approximately CHF 47 million on June 28, 2019 that we are marking to fair value through income.
Other Transactions
On December 3, 2019, we invested in two acute care hospitals in Spain for a purchase price of approximately €117.3 million. The investment was effected through our purchase of a 45% stake in a Spanish entity. The facilities are leased to HM Hospitales pursuant to a master lease that had an initial lease term of 25 years upon our investment. The lease provides for annual
inflation-based escalators. We are accounting for our 45% interest in this joint venture under the equity method.
On November 28, 2019, we acquired an acute care hospital in Portugal for approximately €28.2 million. This facility is leased to José de Mello pursuant to an in-place lease with 17 years remaining on its initial term upon our acquisition. The lease provides for annual inflation-based escalators.
On August 30, 2019, we invested in a portfolio of facilities throughout various states for approximately $254 million. The properties are leased to Vibra Healthcare, LLC (“Vibra”) pursuant to a master lease agreement that had an initial lease term of 20 years upon acquisition. The lease provides for annual escalations and includes three five-year extension options.
On June 10, 2019, we acquired seven community hospitals in Kansas for approximately $145.4 million. The properties are leased to an affiliate of Saint Luke’s Health System (“SLHS”) pursuant to seven individual in-place leases that had an average remaining lease term of 14 years upon our acquisition. The leases provide for fixed escalations every five years and include two five-year extension options. All seven hospitals were constructed in either 2018 or 2019, and the leases are guaranteed by SLHS.
Other acquisitions during 2019 included three acute care hospitals and one inpatient rehabilitation hospital for an aggregate investment of approximately $135 million. One of the acute care hospitals, acquired on April 12, 2019 and located in Big Spring, Texas, is leased to Steward pursuant to the Steward master lease. The second facility, located in Poole, England, was acquired on April 3, 2019 and is leased to Circle. The third acute care facility was acquired on September 30, 2019 and located in Watsonville, California. The inpatient rehabilitation hospital, acquired on February 8, 2019, is located in Germany and leased to affiliates of MEDIAN.
2018 ACTIVITY
Joint Venture Transaction
On August 31, 2018, we completed a joint venture arrangement with Primotop pursuant to which we contributed 71 of our post-acute hospitals in Germany, with an aggregate fair value of €1.635 billion, for a 50% interest, while Primotop contributed cash for its 50% interest in the joint venture. As part of the transaction, we received an aggregate amount of approximately €1.14 billion, from the proceeds of the cash contributed by Primotop and the secured debt financing placed on the joint venture’s real estate, and we recognized an approximate €500 million gain on sale. At inception, our interest in the joint venture was made up of a 50% equity investment valued at approximately €210 million, which is being accounted for under the equity method of accounting, and a €290 million shareholder loan (with terms identical to Primotop’s shareholder loan).
Other Transactions
On August 31, 2018, we acquired an acute care facility in Pasco, Washington for $17.5 million. The property is leased to LifePoint, pursuant to the existing long-term master lease.
75
On August 28, 2018, we acquired three inpatient rehabilitation hospitals in Germany for €17.3 million (including real estate transfer taxes). Upon acquisition, the properties were leased to MEDIAN, pursuant to a 27-year master lease with annual inflation-based escalators.
During 2018, we acquired the fee simple real estate of five general acute care hospitals, four of which are located in Massachusetts and one located in Texas, from Steward in exchange for the reduction of $764.4 million of mortgage loans made to Steward in October 2016 and March 2018, along with additional cash consideration. These properties are being leased to Steward pursuant to the original master lease from October 2016.
DEVELOPMENT ACTIVITIES
2020 Activity
On November 23, 2020, we agreed to finance the development of and lease an inpatient rehabilitation facility in Stockton, California for $47.7 million. This facility will be leased to Ernest and is expected to commence rent in the first quarter of 2022.
On May 15, 2020, we agreed to finance the development of and lease an inpatient rehabilitation facility in Bakersfield, California for $47.9 million. This facility will be leased to Ernest and is expected to commence rent in the fourth quarter of 2021.
During the 2020 second quarter, we completed construction on one general acute care facility and one inpatient rehabilitation facility, both located in Birmingham, England. We began recognizing revenue on these two properties on June 29, 2020. These facilities are leased to Circle pursuant to a long-term lease.
During the 2020 first quarter, we completed construction and began recording rental income on a general acute care facility located in Idaho Falls, Idaho. This facility commenced rent on January 21, 2020 and is leased to Surgery Partners, Inc. pursuant to an existing long-term lease.
2019 Activity
On October 25, 2019, we entered into an agreement to finance the development of and lease a behavioral hospital in Houston, Texas, for $27.5 million. This facility commenced rent on December 18, 2020 and is leased to NeuroPsychiatric Hospitals pursuant to a long-term lease.
2018 Activity
During the year ended December 31, 2018, we completed the construction of Ernest Flagstaff. This $25.5 million inpatient rehabilitation facility located in Flagstaff, Arizona opened on March 1, 2018 and is being leased to Ernest pursuant to a master lease that was amended in 2020 to extend its initial fixed term to 2037. This lease has annual escalation provisions and multiple extension options.
See table below for a status summary of our current development projects (in thousands):
DISPOSALS
2020 Activity
During 2020, we completed the sale of nine facilities and six ancillary properties for approximately $94 million. The transactions resulted in a net loss of $2.8 million.
2019 Activity
During 2019, we completed the sale of five facilities resulting in a gain on real estate of $41.6 million.
2018 Activity
On October 4, 2018, we finalized a recapitalization agreement in which we sold our investment in the operations of Ernest and were repaid for our outstanding acquisition loans, working capital loans, and any unpaid interest. Total proceeds received from this transaction approximated $176 million. We retained ownership of the real estate and secured mortgage loans of our Ernest properties.
On August 31, 2018, we completed the previously described joint venture arrangement with Primotop, in which we contributed the real estate of 71 of our post-acute hospitals in Germany, with a fair value of approximately €1.635 billion, resulting in a gain of approximately €500 million. See “New Investments” in this Note 3 for further details on this transaction.
On August 31, 2018, we sold a general acute care hospital located in Houston, Texas that was leased and operated by North Cypress for $148 million. The transaction resulted in a gain on sale of $102.4 million, which was partially offset by a net $2.5 million non-cash charge to revenue to write-off related straight-line rent receivables.
On June 4, 2018, we sold three long-term acute care hospitals located in California, Texas, and Oregon, that were leased and operated by Vibra, which included our equity investment in operations of the Texas facility. Total proceeds from the transaction were $53.3 million in cash, a mortgage loan in the amount of $18.3 million, and a $1.5 million working capital loan. The transaction resulted in a gain on real estate of $24.2 million, which was partially offset by a $5.1 million non-cash charge to revenue to write-off related straight-line rent receivables.
On March 1, 2018, we sold the real estate of St. Joseph Medical Center in Houston, Texas, for approximately $148 million to Steward. In return, we received a mortgage loan equal to the

76
purchase price, with such loan secured by the underlying real estate. This transaction resulted in a gain of $1.5 million, offset by a $1.7 million non-cash charge to revenue to write-off related straight-line rent receivables on this property.
Summary of Operations for Disposed Assets in 2018
The following represents the operating results (excluding the St. Joseph sale in March 2018) of the properties sold in 2018 for the periods presented (in thousands):
INTANGIBLE ASSETS
At December 31, 2020 and 2019, our intangible lease assets were $1.3 billion ($1.2 billion, net of accumulated amortization) and $622.1 million ($556.7 million, net of accumulated amortization), respectively.
We recorded amortization expense related to intangible lease assets of $42.4 million, $21.5 million, and $17.6 million in 2020, 2019, and 2018, respectively, and expect to recognize amortization expense from existing lease intangible assets as follows (amounts in thousands):
As of December 31, 2020, capitalized lease intangibles have a weighted-average remaining life of 21.3 years.
LEASING OPERATIONS (LESSOR)
We acquire and develop healthcare facilities and lease the facilities to healthcare operating companies under long-term net leases (typical initial fixed terms of 15 years) and most include renewal options at the election of our tenants, generally in five year increments. Approximately 99% of our leases provide annual rent escalations based on increases in the CPI (or similar index outside the U.S.) and/or fixed minimum annual rent
escalations ranging from 0.5% to 3.0%. Many of our domestic leases contain purchase options with pricing set at various terms but in no case less than our total investment. For five properties with a carrying value of $229 million, our leases require a residual value guarantee from the tenant. Our leases typically require the tenant to handle and bear most of the costs associated with our properties including repair/maintenance, property taxes, and insurance. We routinely inspect our properties to ensure the residual value of each of our assets is being maintained. Except for leases classified as financing leases as noted below, all of our leases are classified as operating leases.
The following table summarizes total future minimum lease payments to be received, excluding operating expense reimbursements, from tenants under noncancelable leases as of December 31, 2020 (amounts in thousands):
At December 31, 2020, leases on 13 Ernest facilities and five Prime facilities are accounted for as DFLs and leases on 13 of our Prospect facilities and five of our Ernest facilities are accounted for as a financing. The components of our total investment in financing leases consisted of the following (in thousands):
Rent Deferrals
Due to the COVID-19 pandemic and its impact on our tenants’ business during 2020, we agreed to defer collection on less than 2% of our annual rent. The amount of this deferral, net of subsequent collections, is approximately $11.4 million as of December 31, 2020. Pursuant to our agreements with the tenants, we expect such deferred rent to be paid over specified periods in the future, with interest.
For the Year Ended December 31:
2021. . . . . . . . . . . . . . . . . . . . . . . . . . . . . . . . . . . . . . . . . . . . . . . . . . . . . . . . . . . . . . . . . $ 44,286
2022. . . . . . . . . . . . . . . . . . . . . . . . . . . . . . . . . . . . . . . . . . . . . . . . . . . . . . . . . . . . . . . . . 44,272
2023. . . . . . . . . . . . . . . . . . . . . . . . . . . . . . . . . . . . . . . . . . . . . . . . . . . . . . . . . . . . . . . . . 44,206
2024. . . . . . . . . . . . . . . . . . . . . . . . . . . . . . . . . . . . . . . . . . . . . . . . . . . . . . . . . . . . . . . . . 44,173
2025. . . . . . . . . . . . . . . . . . . . . . . . . . . . . . . . . . . . . . . . . . . . . . . . . . . . . . . . . . . . . . . . . 44,025
As of December 31,
2020
As of December 31,
2019
Minimum lease payments receivable . . . . . . . . . . . . $ 1,228,966 $ 1,884,921
Estimated residual values . . . . . . . . . . . . . . . . . . . 203,818 394,195
Less: Unearned income and allowance for credit loss . . (969,061) (1,618,252)
Net investment in direct financing leases . . . . . . . $ 463,723 $ 660,864
Other financing leases (net of allowance for credit loss) 1,547,199 1,399,438
Total investment in financing leases . . . . . . . . . . $ 2,010,922 $ 2,060,302

77
Adeptus Health
As discussed in previous filings, our original real estate portfolio of approximately 60 properties leased to Adeptus Health, Inc. (“Adeptus”) has gone through significant changes starting with Adeptus filing for Chapter 11 bankruptcy in 2017. With this filing and other subsequent events (including COVID-19 implications in 2020), we have transitioned all of the facilities away from Adeptus. These transition measures have resulted in impairment charges including approximately $20 million (of which one-half related to straight-line rent write-offs), $2 million, and $24 million (of which $6 million was straight-line rent write-offs) in 2020, 2019, and 2018, respectively. However, these transition measures have also provided for new tenant relationships being formed with strong credit worthy operators like Ochsner Health System, Dignity Health, UC Health, and HCA Healthcare (via a joint venture discussed below), that are now leasing approximately 40 of these transitional facilities under long-term leases. At December 31, 2020, 18 of these transitional properties, representing less than 1% of our total assets, remain vacant, and each of these properties are in various stages of being re-leased or sold. At December 31, 2020, we believe our investment in these real estate assets are fully recoverable, but no assurances can be given that we will not have any further impairments in future periods.
Alecto Facilities
As noted in previous filings, we originally leased four acute care facilities and had a mortgage loan on a fifth property (Olympia Medical Center) to Alecto Healthcare Services LLC (“Alecto”). During 2018 and 2019, we incurred approximately $30 million and $20 million in real estate impairment charges, respectively. During the second quarter of 2020, we re-leased one acute care facility to West Virginia University and sold another facility. We also donated the Wheeling facility to a local municipality, resulting in a $9.1 million real estate impairment charge in the first quarter of 2020. At December 31, 2020, we continue to lease one acute care facility to Alecto and have a mortgage loan on the second property, representing less than 0.5% of our total assets. Subsequent to year-end, Alecto completed the sale of Olympia Medical Center to the UCLA Health System. Our proceeds of approximately $43 million from this sale fully recovered our mortgage loan balance in addition to certain past due amounts.
Other Leasing Activity
On July 24, 2020, we re-leased our five San Antonio, Texas freestanding emergency facilities (with a total investment of approximately $30 million) to Methodist Healthcare System of San Antonio, a joint venture between HCA Healthcare and Methodist Healthcare Ministries of South Texas, pursuant to a long-term master lease. As a result, we recorded an approximate $1.5 million write-off of straight-line rent in the 2020 third quarter.
LOANS
The following is a summary of our loans (net of allowance for credit loss in 2020) ($ amounts in thousands):
Our mortgage loans at December 31, 2020 cover six of our properties with four operators. The decrease from the prior year primarily relates to the conversion of Steward mortgage loans for the underlying fee simple real estate of two general acute care hospitals as more fully described under “New Investments” in this same Note 3, along with the repayment of approximately $328 million mortgage loans from Prime.
The increase in acquisition loans primarily relates to the $205 million loan to the new international joint venture described under “New Investments” in this same Note 3.
Other loans consist of loans to our tenants for working capital and other purposes and include our shareholder loan made to the joint venture with Primotop on August 31, 2018 (as more fully described above in this Note 3) in the amount of €290 million.
CONCENTRATION OF CREDIT RISKS
We monitor concentration risk in several ways due to the nature of our real estate assets that are vital to the communities in which they are located and given our history of being able to replace inefficient operators of our facilities, if needed, with more effective operators:
1) Facility concentration – We had no investment in any single property greater than 4% of our total assets at December 31, 2020 or December 31, 2019.
2) Operator concentration – For the year ended December 31, 2020, revenue from Steward, Circle, and Prospect represented 30%, 13%, and 12%, respectively, of our total revenues. In comparison, Steward represented 42% of our total revenues for the year ended December 31, 2019, while Circle and Prospect represented less than 10%.
3) Geographic concentration – At December 31, 2020, investments in the U.S., Europe, Australia, and South America represented approximately 65%, 28%, 6%, and 1%, respectively, of our total assets. In comparison, investments in the U.S., Europe, and Australia represented approximately 74%, 20%, and 6%, respectively, of our total assets at December 31, 2019.
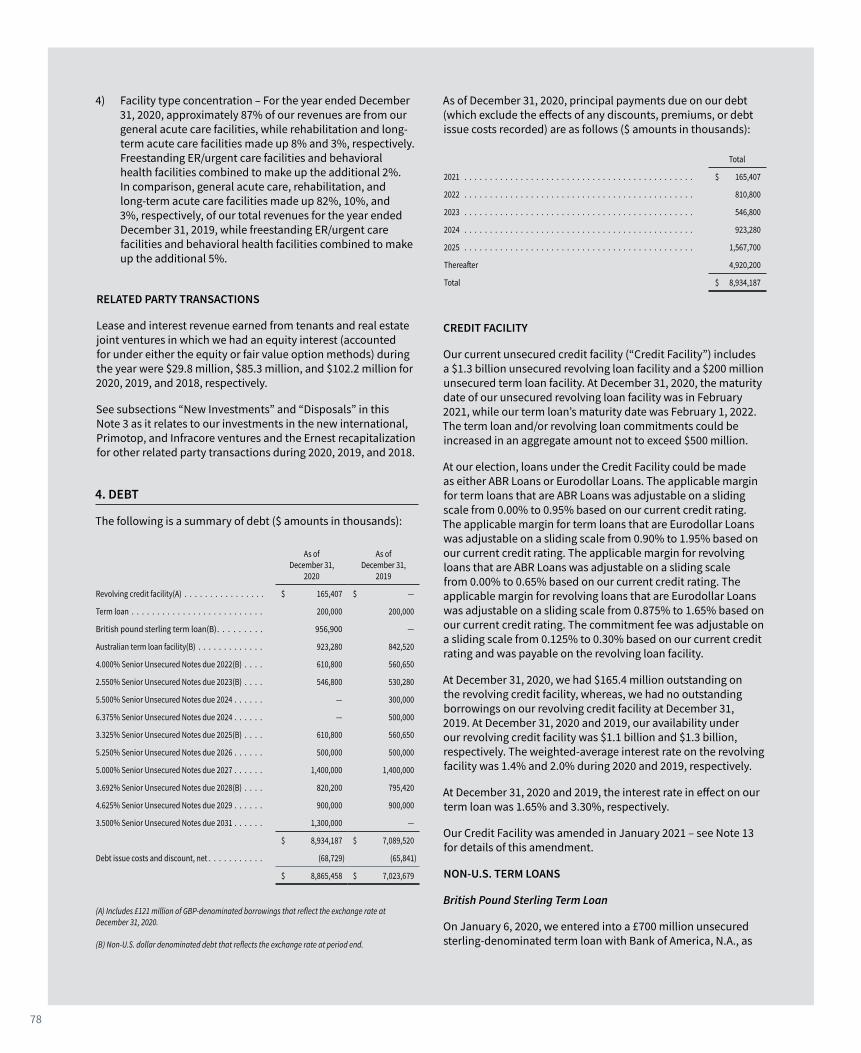
78
4) Facility type concentration – For the year ended December 31, 2020, approximately 87% of our revenues are from our general acute care facilities, while rehabilitation and long-term acute care facilities made up 8% and 3%, respectively. Freestanding ER/urgent care facilities and behavioral health facilities combined to make up the additional 2%. In comparison, general acute care, rehabilitation, and long-term acute care facilities made up 82%, 10%, and 3%, respectively, of our total revenues for the year ended December 31, 2019, while freestanding ER/urgent care facilities and behavioral health facilities combined to make up the additional 5%.
RELATED PARTY TRANSACTIONS
Lease and interest revenue earned from tenants and real estate joint ventures in which we had an equity interest (accounted for under either the equity or fair value option methods) during the year were $29.8 million, $85.3 million, and $102.2 million for 2020, 2019, and 2018, respectively.
See subsections “New Investments” and “Disposals” in this Note 3 as it relates to our investments in the new international, Primotop, and Infracore ventures and the Ernest recapitalization for other related party transactions during 2020, 2019, and 2018.
4. DEBT
The following is a summary of debt ($ amounts in thousands):
As of December 31, 2020, principal payments due on our debt (which exclude the effects of any discounts, premiums, or debt issue costs recorded) are as follows ($ amounts in thousands):
CREDIT FACILITY
Our current unsecured credit facility (“Credit Facility”) includes a $1.3 billion unsecured revolving loan facility and a $200 million unsecured term loan facility. At December 31, 2020, the maturity date of our unsecured revolving loan facility was in February 2021, while our term loan’s maturity date was February 1, 2022. The term loan and/or revolving loan commitments could be increased in an aggregate amount not to exceed $500 million.
At our election, loans under the Credit Facility could be made as either ABR Loans or Eurodollar Loans. The applicable margin for term loans that are ABR Loans was adjustable on a sliding scale from 0.00% to 0.95% based on our current credit rating. The applicable margin for term loans that are Eurodollar Loans was adjustable on a sliding scale from 0.90% to 1.95% based on our current credit rating. The applicable margin for revolving loans that are ABR Loans was adjustable on a sliding scale from 0.00% to 0.65% based on our current credit rating. The applicable margin for revolving loans that are Eurodollar Loans was adjustable on a sliding scale from 0.875% to 1.65% based on our current credit rating. The commitment fee was adjustable on a sliding scale from 0.125% to 0.30% based on our current credit rating and was payable on the revolving loan facility.
At December 31, 2020, we had $165.4 million outstanding on the revolving credit facility, whereas, we had no outstanding borrowings on our revolving credit facility at December 31, 2019. At December 31, 2020 and 2019, our availability under our revolving credit facility was $1.1 billion and $1.3 billion, respectively. The weighted-average interest rate on the revolving facility was 1.4% and 2.0% during 2020 and 2019, respectively.
At December 31, 2020 and 2019, the interest rate in effect on our term loan was 1.65% and 3.30%, respectively.
Our Credit Facility was amended in January 2021 – see Note 13 for details of this amendment.
NON-U.S. TERM LOANS
British Pound Sterling Term Loan
On January 6, 2020, we entered into a £700 million unsecured sterling-denominated term loan with Bank of America, N.A., as
As of December 31,
2020
As of December 31,
2019
Revolving credit facility(A) . . . . . . . . . . . . . . . . $ 165,407 $ —
Term loan . . . . . . . . . . . . . . . . . . . . . . . . . . 200,000 200,000
British pound sterling term loan(B). . . . . . . . . 956,900 —
Australian term loan facility(B) . . . . . . . . . . . . . 923,280 842,520
4.000% Senior Unsecured Notes due 2022(B) . . . . 610,800 560,650
2.550% Senior Unsecured Notes due 2023(B) . . . . 546,800 530,280
5.500% Senior Unsecured Notes due 2024 . . . . . . — 300,000
6.375% Senior Unsecured Notes due 2024 . . . . . . — 500,000
3.325% Senior Unsecured Notes due 2025(B) . . . . 610,800 560,650
5.250% Senior Unsecured Notes due 2026 . . . . . . 500,000 500,000
5.000% Senior Unsecured Notes due 2027 . . . . . . 1,400,000 1,400,000
3.692% Senior Unsecured Notes due 2028(B) . . . . 820,200 795,420
4.625% Senior Unsecured Notes due 2029 . . . . . . 900,000 900,000
3.500% Senior Unsecured Notes due 2031 . . . . . . 1,300,000 —
$ 8,934,187 $ 7,089,520
Debt issue costs and discount, net . . . . . . . . . . . (68,729) (65,841)
$ 8,865,458 $ 7,023,679
(A) Includes £121 million of GBP-denominated borrowings that reflect the exchange rate at December 31, 2020. (B) Non-U.S. dollar denominated debt that reflects the exchange rate at period end.
Total
2021 . . . . . . . . . . . . . . . . . . . . . . . . . . . . . . . . . . . . . . . . . . . . . $ 165,407
2022 . . . . . . . . . . . . . . . . . . . . . . . . . . . . . . . . . . . . . . . . . . . . . 810,800
2023 . . . . . . . . . . . . . . . . . . . . . . . . . . . . . . . . . . . . . . . . . . . . . 546,800
2024 . . . . . . . . . . . . . . . . . . . . . . . . . . . . . . . . . . . . . . . . . . . . . 923,280
2025 . . . . . . . . . . . . . . . . . . . . . . . . . . . . . . . . . . . . . . . . . . . . . 1,567,700
Thereafter 4,920,200
Total $ 8,934,187
79
administrative agent, and several lenders from time-to-time are parties thereto. The term loan matures on January 15, 2025. The applicable margin under the term loan is adjustable based on a pricing grid from 0.85% to 1.65% dependent on our current credit rating. On March 4, 2020, we entered into an interest rate swap transaction (effective March 6, 2020) to fix the interest rate to approximately 0.70% for the duration of the loan. The current applicable margin for the pricing grid (which can vary based on our credit rating) is 1.25% for an all-in fixed rate of 1.95%.
Australian Term Loan
On May 23, 2019, we entered into an A$1.2 billion term loan with Bank of America, N.A., as administrative agent, and several lenders from time-to-time are parties thereto. The term loan matures on May 23, 2024. The interest rate under the term loan is adjustable based on a pricing grid from 0.85% to 1.65%, dependent on our current senior unsecured credit rating. On June 27, 2019, we entered into an interest rate swap transaction (effective July 3, 2019) to fix the interest rate to approximately 1.20% for the duration of the loan as long as the reference rate stays above 0.00%. The current applicable margin for the pricing grid (which can vary based on our credit rating) is 1.25% for an all-in fixed rate of 2.45%.
At December 31, 2020 and 2019, we had a derivative liability of approximately $51.3 million and $5.6 million, respectively, included in “Accounts payable and accrued expenses” in our consolidated balance sheets associated with these interest rate swaps.
SENIOR UNSECURED NOTES
The following are the basic terms of our senior unsecured notes. Typically, we may redeem some or all of the notes at any time, but may require a redemption premium that will decrease over time. In the event of a change of control, each holder of the notes may require us to repurchase some or all of our notes at a repurchase price equal to 101% of the aggregate principal amount of the notes plus accrued and unpaid interest to the date of purchase.
4.000% SENIOR UNSECURED NOTES DUE 2022
On August 19, 2015, we completed a €500 million senior unsecured notes offering. Interest on the notes is payable annually on August 19 of each year. The notes pay interest in cash at a rate of 4.000% per year. The notes mature on August 19, 2022.
2.550% SENIOR UNSECURED NOTES DUE 2023
On December 5, 2019, we completed a £400 million senior unsecured notes offering. Interest on the notes is payable annually on December 5 of each year. The notes pay interest in cash at a rate of 2.550% per year. The notes mature on December 5, 2023.
5.500% SENIOR UNSECURED NOTES DUE 2024
On April 17, 2014, we completed a $300 million senior unsecured notes offering. Interest on the notes was payable semi-annually on May 1 and November 1 of each year. The notes paid interest
in cash at a rate of 5.500% per year. The notes were to mature on May 1, 2024; however, we redeemed the notes on December 19, 2020.
6.375% SENIOR UNSECURED NOTES DUE 2024
On February 22, 2016, we completed a $500 million senior unsecured notes offering. Interest on the notes was payable on March 1 and September 1 of each year. Interest on the notes was paid in cash at a rate of 6.375% per year. The notes were to mature on March 1, 2024; however, we redeemed the notes on December 19, 2020.
3.325% SENIOR UNSECURED NOTES DUE 2025
On March 24, 2017, we completed a €500 million senior unsecured notes offering. Interest on the notes is payable annually on March 24 of each year. The notes pay interest in cash at a rate of 3.325% per year. The notes mature on March 24, 2025.
5.250% SENIOR UNSECURED NOTES DUE 2026
On July 22, 2016, we completed a $500 million senior unsecured notes offering. Interest on the notes is payable on February 1 and August 1 of each year. Interest on the notes is to be paid in cash at a rate of 5.250% per year. The notes mature on August 1, 2026.
5.000% SENIOR UNSECURED NOTES DUE 2027
On September 7, 2017, we completed a $1.4 billion senior unsecured notes offering. Interest on the notes is payable on April 15 and October 15 of each year. The notes pay interest in cash at a rate of 5.000% per year. The notes mature on October 15, 2027.
3.692% SENIOR UNSECURED NOTES DUE 2028
On December 5, 2019, we completed a £600 million senior unsecured notes offering. The notes were issued at 99.998% of par value. Interest on the notes is payable on June 5 of each year. The notes pay interest in cash at a rate of 3.692% per year. The notes mature on June 5, 2028.
4.625% SENIOR UNSECURED NOTES DUE 2029
On July 26, 2019, we completed a $900 million senior unsecured notes offering. Interest on the notes is payable on February 1 and August 1 of each year, commencing on February 1, 2020. The notes were issued at 99.5% of par value, pay interest at a rate of 4.625% per year and mature on August 1, 2029.
3.500% SENIOR UNSECURED NOTES DUE 2031
On December 4, 2020, we completed a $1.3 billion senior unsecured notes offering. Interest on the notes is payable semi-annually on March 15 and September 15 of each year. The notes pay interest in cash at a rate of 3.500% per year. The notes mature on March 15, 2031.
OTHER ACTIVITY
In preparation of the joint venture with Primotop described under “2018 Activity” in Note 3, we issued secured debt on August 3, 2018, resulting in gross proceeds of €655 million.
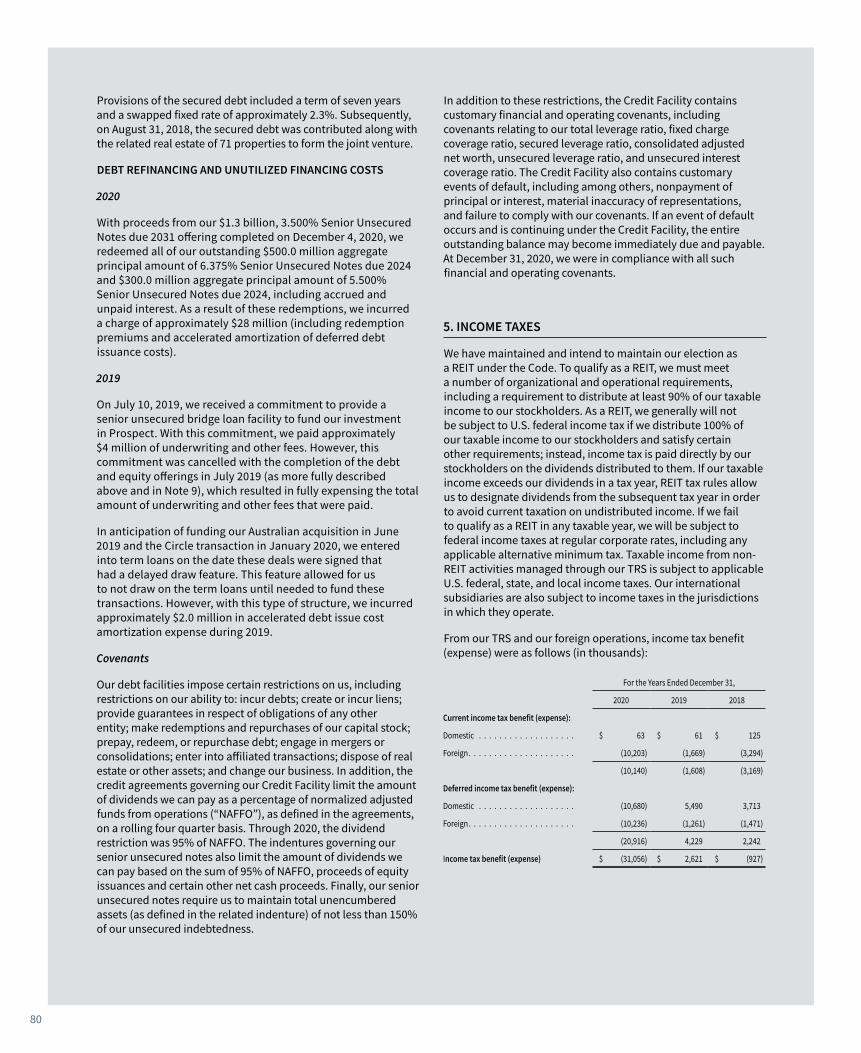
80
Provisions of the secured debt included a term of seven years and a swapped fixed rate of approximately 2.3%. Subsequently, on August 31, 2018, the secured debt was contributed along with the related real estate of 71 properties to form the joint venture.
DEBT REFINANCING AND UNUTILIZED FINANCING COSTS
2020
With proceeds from our $1.3 billion, 3.500% Senior Unsecured Notes due 2031 offering completed on December 4, 2020, we redeemed all of our outstanding $500.0 million aggregate principal amount of 6.375% Senior Unsecured Notes due 2024 and $300.0 million aggregate principal amount of 5.500% Senior Unsecured Notes due 2024, including accrued and unpaid interest. As a result of these redemptions, we incurred a charge of approximately $28 million (including redemption premiums and accelerated amortization of deferred debt issuance costs).
2019
On July 10, 2019, we received a commitment to provide a senior unsecured bridge loan facility to fund our investment in Prospect. With this commitment, we paid approximately $4 million of underwriting and other fees. However, this commitment was cancelled with the completion of the debt and equity offerings in July 2019 (as more fully described above and in Note 9), which resulted in fully expensing the total amount of underwriting and other fees that were paid.
In anticipation of funding our Australian acquisition in June 2019 and the Circle transaction in January 2020, we entered into term loans on the date these deals were signed that had a delayed draw feature. This feature allowed for us to not draw on the term loans until needed to fund these transactions. However, with this type of structure, we incurred approximately $2.0 million in accelerated debt issue cost amortization expense during 2019.
Covenants
Our debt facilities impose certain restrictions on us, including restrictions on our ability to: incur debts; create or incur liens; provide guarantees in respect of obligations of any other entity; make redemptions and repurchases of our capital stock; prepay, redeem, or repurchase debt; engage in mergers or consolidations; enter into affiliated transactions; dispose of real estate or other assets; and change our business. In addition, the credit agreements governing our Credit Facility limit the amount of dividends we can pay as a percentage of normalized adjusted funds from operations (“NAFFO”), as defined in the agreements, on a rolling four quarter basis. Through 2020, the dividend restriction was 95% of NAFFO. The indentures governing our senior unsecured notes also limit the amount of dividends we can pay based on the sum of 95% of NAFFO, proceeds of equity issuances and certain other net cash proceeds. Finally, our senior unsecured notes require us to maintain total unencumbered assets (as defined in the related indenture) of not less than 150% of our unsecured indebtedness.
In addition to these restrictions, the Credit Facility contains customary financial and operating covenants, including covenants relating to our total leverage ratio, fixed charge coverage ratio, secured leverage ratio, consolidated adjusted net worth, unsecured leverage ratio, and unsecured interest coverage ratio. The Credit Facility also contains customary events of default, including among others, nonpayment of principal or interest, material inaccuracy of representations, and failure to comply with our covenants. If an event of default occurs and is continuing under the Credit Facility, the entire outstanding balance may become immediately due and payable. At December 31, 2020, we were in compliance with all such financial and operating covenants.
5. INCOME TAXES
We have maintained and intend to maintain our election as a REIT under the Code. To qualify as a REIT, we must meet a number of organizational and operational requirements, including a requirement to distribute at least 90% of our taxable income to our stockholders. As a REIT, we generally will not be subject to U.S. federal income tax if we distribute 100% of our taxable income to our stockholders and satisfy certain other requirements; instead, income tax is paid directly by our stockholders on the dividends distributed to them. If our taxable income exceeds our dividends in a tax year, REIT tax rules allow us to designate dividends from the subsequent tax year in order to avoid current taxation on undistributed income. If we fail to qualify as a REIT in any taxable year, we will be subject to federal income taxes at regular corporate rates, including any applicable alternative minimum tax. Taxable income from non-REIT activities managed through our TRS is subject to applicable U.S. federal, state, and local income taxes. Our international subsidiaries are also subject to income taxes in the jurisdictions in which they operate.
From our TRS and our foreign operations, income tax benefit (expense) were as follows (in thousands):
For the Years Ended December 31,
2020 2019 2018
Current income tax benefit (expense):
Domestic . . . . . . . . . . . . . . . . . . . $ 63 $ 61 $ 125
Foreign . . . . . . . . . . . . . . . . . . . . . (10,203) (1,669) (3,294)
(10,140) (1,608) (3,169)
Deferred income tax benefit (expense):
Domestic . . . . . . . . . . . . . . . . . . . (10,680) 5,490 3,713
Foreign . . . . . . . . . . . . . . . . . . . . . (10,236) (1,261) (1,471)
(20,916) 4,229 2,242
Income tax benefit (expense) $ (31,056) $ 2,621 $ (927)

81
A reconciliation of income tax benefit (expense) from the statutory income tax rate to the effective tax rate based on income before income taxes for the years ended December 31, 2020, 2019, and 2018 is as follows (in thousands):
The foreign provision for income taxes is based on foreign profit before income taxes of $62.1 million, $10.7 million, and $18.6 million in 2020, 2019, and 2018, respectively.
The domestic provision for income taxes is based on income before income taxes of $6.4 million in 2020 as compared with a loss before income taxes of $(44.1) million in 2019 from our TRS and income before income taxes of $8.0 million in 2018.
At December 31, 2020 and 2019, components of our deferred tax assets and liabilities were as follows (in thousands):
At December 31, 2020, we had net NOL and other tax attribute carryforwards as follows (in thousands):
VALUATION ALLOWANCE
A valuation allowance has been recorded on certain foreign and domestic net operating loss carryforwards and other net deferred tax assets that may not be realized. As of each reporting date, we consider all new evidence that could impact the future realization of our deferred tax assets. In the evaluation of the need for a valuation allowance on our deferred income tax assets, we consider all available positive and negative evidence, including scheduled reversals of deferred income tax liabilities, carryback of future period losses to prior periods, projected future taxable income, tax planning strategies, and recent financial performance.
During 2020, a valuation allowance of $25.6 million has been recorded against a portion of our international deferred tax assets to recognize only the components of the deferred tax assets that is more likely than not to be realized. The valuation allowance was primarily recorded against deferred tax assets for NOLs, non-depreciable basis of real property, and other tax attributes that we believe will not be realized.
We have no material uncertain tax position liabilities and related interest or penalties.
REIT STATUS
We have met the annual REIT distribution requirements by payment of at least 90% of our taxable income in 2020, 2019, and 2018. Earnings and profits, which determine the taxability of such distributions, will differ from net income reported for financial reporting purposes due primarily to differences in cost basis, differences in the estimated useful lives used to compute depreciation, and differences between the allocation of our net income and loss for financial reporting purposes and for tax reporting purposes.
A schedule of per share distributions we paid and reported to our stockholders is set forth in the following:
For the Years Ended December 31,
2020 2019 2018
Income before income tax . . . . . . . . . . . . . . . . $ 463,328 $ 373,780 $ 1,019,404
Income tax at the U.S. statutory federal rate (21% in 2020, 2019 and 2018) . . . . . . . . . . . . . . (97,299) (78,494) (214,075)
Decrease (increase) in income tax resulting from:
Foreign rate differential . . . . . . . . . . . . . . . 2,160 438 2,643
State income taxes, net of federal benefit . . . . 970 1,621 (379)
U.S. earnings not subject to federal income tax 82,921 85,495 208,472
Equity investments . . . . . . . . . . . . . . . . . . 380 1,091 46
Change in valuation allowance . . . . . . . . . . . (8,514) (7,911) 2,668
Statutory tax rate change . . . . . . . . . . . . . . (9,471) – –
Other items, net . . . . . . . . . . . . . . . . . . . . (2,203) 381 (302)
Total income tax benefit (expense) $ (31,056) $ 2,621 $ (927)
2020 2019
Deferred tax assets:
Operating loss and interest deduction carryforwards $ 150,001 $ 28,684
Interest rate swap . . . . . . . . . . . . . . . . . . . . . 9,150 843
Other. . . . . . . . . . . . . . . . . . . . . . . . . . . . . . 6,973 868
Total deferred tax assets . . . . . . . . . . . . . . . . . . 166,124 30,395
Valuation allowance . . . . . . . . . . . . . . . . . . . . (36,977) (11,355)
Total net deferred tax assets . . . . . . . . . . . . . . . $ 129,147 $ 19,040
Deferred tax liabilities:
Property and equipment . . . . . . . . . . . . . . . . . $ (211,018) $ (7,324)
Net unbilled revenue . . . . . . . . . . . . . . . . . . . . (14,776) (1,449)
Other. . . . . . . . . . . . . . . . . . . . . . . . . . . . . . (4,010) (737)
Total deferred tax liabilities . . . . . . . . . . . . . . . . (229,804) (9,510)
Net deferred tax asset (liability). . . . . . . . . . . . . . . . $ (100,657) $ 9,530
U.S. Foreign
Gross NOL carryforwards . . . . . . . . . . . . . . . . . . . $ 159,895 $ 528,567
Tax-effected NOL carryforwards . . . . . . . . . . . . . . $ 16,298 $ 133,703
Valuation allowance . . . . . . . . . . . . . . . . . . . . . . (6,193) (30,784)
Net deferred tax asset – NOL carryforwards . . . . . . . $ 10,105 $ 102,919
Expiration periods . . . . . . . . . . . . . . . . . . . . . . . 2029-indefinite indefinite
For the Years Ended December 31,
2020 2019 2018
Common share distribution . . . . . . . $ 1.070000 $ 1.010000 $ 0.990000
Ordinary income . . . . . . . . . . . . . . 0.603050 0.701910 0.438792
Capital gains(1) . . . . . . . . . . . . . . . — 0.275040 0.551208
Unrecaptured Sec. 1250 gain . . . . . . — 0.041160 0.132280
Section 199A Dividends . . . . . . . . . . 0.603050 0.701910 0.438792
Return of capital . . . . . . . . . . . . . . 0.466950 0.033050 —
(1) Capital gains include unrecaptured Sec. 1250 gains.

82
6. EARNINGS PER SHARE
Our earnings per share were calculated based on the following (amounts in thousands):
7. STOCK AWARDS
STOCK AWARDS
Our Equity Incentive Plan, adopted during the second quarter of 2019 and replaced the previous plan, authorizes the issuance of common stock options, restricted stock, restricted stock units, deferred stock units, stock appreciation rights, performance units, and awards of interests in our Operating Partnership. Our Equity Incentive Plan is administered by the Compensation Committee of the Board of Directors. We have reserved 12.9 million shares of new common stock for awards under the Equity Incentive Plan, out of which 8.4 million shares remain available for future stock awards as of December 31, 2020. The Equity Incentive Plan contains a limit of 5 million shares as the maximum number of shares of common stock that may be awarded to an individual in any fiscal year. Awards under the Equity Incentive Plan are subject to forfeiture due to termination of employment prior to vesting and/or from not achieving the respective performance/market conditions. In the event of a change in control, outstanding and unvested options will immediately vest, unless otherwise provided in the participant’s award or employment agreement, and restricted stock, restricted stock units, deferred stock units, and other stock-based awards will vest if so provided in the participant’s award agreement. The term of the awards is set by the Compensation Committee, though Incentive Stock Options may not have terms of more than ten years. Forfeited awards are returned to the Equity Incentive Plan and are then available to be re-issued as future awards.
For the past three years, we have only granted restricted stock and restricted stock units pursuant to our Equity Incentive Plan. These stock-based awards have been granted in the form of service-based awards and performance awards based on company-specific performance hurdles. See below for further details on each of these stock-based awards:
Service-Based Awards
In 2020, 2019, and 2018, the Compensation Committee granted service-based awards to employees and non-employee directors. Service-based awards vest as the employee/director provides the required service (typically over three years). Dividends are generally paid on these awards prior to vesting.
Performance-Based Awards
In 2020, 2019, and 2018, the Compensation Committee granted performance-based awards to employees. Generally, dividends are not paid on performance awards until the award is earned. See below for details of such performance-based award grants:
In 2020, 2019, and 2018, a target number of stock awards were granted to employees that could be earned based on the achievement of specific performance thresholds as set by our Compensation Committee. The performance thresholds were based on a three-year period with the opportunity to earn a portion of the award earlier. More or less shares than the target number of shares are available to be earned based on our performance compared to the set thresholds. At the end of each of the performance periods, any earned shares during such period will vest on January 1 of the following calendar year. The performance thresholds for 2020 awards were based on funds from operations growth, EBITDA, and acquisitions; whereas, the 2019 and 2018 performance thresholds were based on return on equity, EBITDA, and acquisitions.
Certain performance awards granted were subject to a modifier which increases or decreases the actual shares earned in each performance period. The modifier for the 2020 awards was based on two components: 1) how our total shareholder return (“TSR”) compared to the SNL U.S. REIT Healthcare Index (“SNL Index”) and 2) how our TSR compared to a threshold set by the Compensation Committee. For 2019 and 2018 awards, the modifier was based on how our TSR compared to the SNL Index.
The following summarizes stock-based award activity in 2020 and 2019 (which includes awards granted in 2020, 2019, 2018, and any applicable prior years), respectively:
For the Year Ended December 31, 2020:
Vesting Based on Service
Vesting Based on Market/Performance
Conditions
Shares
Weighted-Average Value at
Award Date Shares
Weighted-Average Value at
Award Date
Nonvested awards at beginning of the year . . . . 1,122,440 $ 17.11 5,481,155 $ 11.66
Awarded . . . . . . . . . . . . 635,855 $ 19.65 1,800,898 $ 19.42
Vested . . . . . . . . . . . . . (699,215) $ 16.80 (2,193,906) $ 11.35
Forfeited . . . . . . . . . . . . (2,026) $ 18.40 (1,164) $ 18.22
Nonvested awards at end of year . . . . . . . . . . 1,057,054 $ 18.79 5,086,983 $ 14.41
For the Years Ended December 31,
2020 2019 2018
Numerator:
Net income . . . . . . . . . . . . . . . . . . . . . . $ 432,272 $ 376,401 $ 1,018,477
Non-controlling interests’ share in earnings . . (822) (1,717) (1,792)
Participating securities’ share in earnings . . . (2,105) (2,308) (3,685)
Net income, less participating securities’ share in earnings . . . . . . . . . . . . . . . . . . $ 429,345 $ 372,376 $ 1,013,000
Denominator:
Basic weighted-average common shares . . . 529,239 427,075 365,364
Dilutive potential common shares . . . . . . . . 1,222 1,224 907
Diluted weighted-average common shares . . 530,461 428,299 366,271

83
Vesting Based on Service
Vesting Based on Market/Performance
Conditions
Shares
Weighted-Average Value at
Award Date Shares
Weighted-Average Value at
Award Date
Nonvested awards at beginning of the year . . . 923,848 $ 14.29 4,133,435 $ 9.21
Awarded . . . . . . . . . . . 681,378 $ 19.24 2,438,292 $ 15.25
Vested . . . . . . . . . . . . (478,104) $ 14.73 (1,051,637) $ 10.43
Forfeited . . . . . . . . . . . (4,682) $ 13.44 (38,935) $ 10.13
Nonvested awards at end of year . . . . . . . . 1,122,440 $ 17.11 5,481,155 $ 11.66
For the Year Ended December 31, 2019:
The value of stock-based awards is charged to compensation expense over the service periods. For the years ended December 31, 2020, 2019, and 2018, we recorded $47.2 million, $32.2 million, and $16.5 million, respectively, of non-cash compensation expense. The remaining unrecognized cost from stock-based awards at December 31, 2020, is $53.6 million, which will be recognized over a weighted-average period of 1.3 years. Stock-based awards that vested in 2020, 2019, and 2018, had a value of $58.9 million, $25.9 million, and $8.4 million, respectively.
8. COMMITMENTS AND CONTINGENCIES
COMMITMENTS
On December 30, 2020, we entered into definitive agreements to acquire a portfolio of between 35 and 40 behavioral health facilities located throughout the United Kingdom for an aggregate purchase price of approximately £800 million from the Priory Group. The transaction is structured to occur in two primary phases. On December 30, 2020, an affiliate of Waterland Private Equity Fund VII C.V. (“Waterland VII”) entered into definitive agreements to acquire all of the outstanding equity interests in the entity that owns the Priory Group from its current owner, Acadia Healthcare Company, Inc. In separate agreements entered into with Waterland VII on the same date, we agreed to provide a short-term interim acquisition loan to Waterland VII at the closing of Waterland VII’s acquisition of Priory Group.
Upon closing of the first phase of the transaction on January 19, 2021, we funded an £800 million interim acquisition loan secured by mortgages on an identified portfolio of Priory Group real estate assets. In phase two, in a series of transactions we expect will be completed during the first half of 2021, we will acquire a portfolio of select real estate assets from Priory Group (now owned by Waterland VII) in individual sale-and-leaseback transactions, subject to customary real estate and other closing conditions. As all conditions to closing for a particular asset are satisfied, the applicable purchase price for the asset will be paid by us by proportionally converting and reducing the principal
balance of the interim acquisition loan we made to Waterland VII in phase one. The aggregate purchase price for the real estate assets we acquire from the Priory Group is thus expected to be approximately £800 million, being the total amount of the interim acquisition loan, plus customary stamp duty, tax and other transaction costs.
The properties we acquire will be subject to a master lease type structure with an initial term of 25 years and two 10-year extension options, with annual inflation-based escalators. Pending its conversion and offset, the initial interim acquisition loan will bear interest at a rate similar to the initial lease rate we will receive under the lease transactions.
In addition to the £800 million initial interim acquisition loan described above, we also agreed to provide Waterland VII with a 364-day £250 million acquisition loan, which we funded on January 19, 2021, in connection with the closing of Waterland VII’s acquisition of the Priory Group. The loan is secured by the same security assets securing the £800 million interim acquisition loan.
In connection with these transactions, we also acquired a 9.9% passive equity interest in the Waterland VII affiliate that indirectly owns the Priory Group for a nominal amount.
To help fund this acquisition, we entered into a $900 million interim credit facility on January 15, 2021, of which we utilized £500 million along with £350 million from our revolving facility and the rest from cash on-hand.
CONTINGENCIES
We are a party to various legal proceedings incidental to our business. In the opinion of management, after consultation with legal counsel, the ultimate liability, if any, with respect to these proceedings is not presently expected to materially affect our financial position, results of operations, or cash flows.
9. COMMON STOCK
2020 ACTIVITY
In 2020, we sold 21.0 million shares of common stock under our at-the-market equity offering program, resulting in net proceeds of approximately $411 million.
2019 ACTIVITY
On November 4, 2019, we filed Articles of Amendment to our charter with the Maryland State Department of Assessments and Taxation increasing the number of authorized shares of common stock, par value $0.001 per share, available for issuance from 500 million to 750 million.
On November 8, 2019, we completed an underwritten public offering of 57.5 million shares (including the exercise of the underwriters’ 30-day option to purchase an additional 7.5

84
million shares) of our common stock, resulting in net proceeds of $1.026 billion, after deducting underwriting discounts and commissions and offering expenses.
On July 18, 2019, we completed an underwritten public offering of 51.75 million shares (including the exercise of the underwriters’ 30-day option to purchase an additional 6.75 million shares) of our common stock, resulting in net proceeds of $858.1 million, after deducting underwriting discounts and commissions and offering expenses.
In 2019, we sold 36.1 million shares of common stock under our at-the-market equity offering program, resulting in net proceeds of approximately $650 million.
On December 27, 2019, we entered into a new at-the-market equity offering program, which gives us the ability to sell up to $1.0 billion of stock with a commission rate up to 2.0%.
2018 ACTIVITY
In the 2018 fourth quarter, we sold 5.6 million shares of common stock under our at-the-market equity offering program, resulting in net proceeds of approximately $95 million.
10. FAIR VALUE OF FINANCIAL INSTRUMENTS
We have various assets and liabilities that are considered financial instruments. We estimate that the carrying value of cash and cash equivalents and accounts payable and accrued expenses approximate their fair values. We estimate the fair value of our interest and rent receivables using Level 2 inputs such as discounting the estimated future cash flows using the current rates at which similar receivables would be made to others with similar credit ratings and for the same remaining maturities. The fair value of our mortgage loans and other loans are estimated by using Level 2 inputs such as discounting the estimated future cash flows using the current rates which similar loans would be made to borrowers with similar credit ratings and for the same remaining maturities. We determine the fair value of our senior unsecured notes using Level 2 inputs such as quotes from securities dealers and market makers. We estimate the fair value of our revolving credit facility and term loans using Level 2 inputs based on the present value of future payments, discounted at a rate which we consider appropriate for such debt.
Fair value estimates are made at a specific point in time, are subjective in nature, and involve uncertainties and matters of significant judgment. Settlement of such fair value amounts may not be a prudent management decision.
The following table summarizes fair value estimates for our financial instruments (in thousands):
ITEMS MEASURED AT FAIR VALUE ON A RECURRING BASIS
Our equity investment and related loan to the new international joint venture and our loan investment in the real estate of three hospitals operated by subsidiaries of the international joint venture in Colombia are measured at fair value on a recurring basis as we elected to account for these investments using the fair value option at the point of initial investment during 2020. Our Ernest mortgage loans were measured at fair value on a recurring basis in prior periods as we elected to account for these investments using the fair value option method in 2012 when we acquired an equity interest in Ernest. Such equity interest was sold in October 2018, and the mortgage loans were converted to fee simple real estate on December 31, 2020 as discussed in Note 3. We elected to account for each of these investments at fair value due to the size of the investments and because we believe this method was more reflected of current values.
At December 31, 2020 and 2019, the amounts recorded under the fair value option method were as follows (in thousands):
Our loans to the new international joint venture and its subsidiaries are recorded at fair value based on Level 2 inputs by discounting the estimated cash flows using the market rates which similar loans would be made to borrowers with similar credit ratings and the same remaining maturities. Our equity investment in the international joint venture is recorded at fair value based on Level 3 inputs, by using a discounted cash flow model, which requires significant estimates of our investee such as projected revenue and expenses and appropriate consideration of the underlying risk profile of the forecasted assumptions associated with the investee. We classify the equity investment as Level 3, as we use certain unobservable inputs to the valuation methodology that are significant to the fair
December 31, 2020 December 31, 2019
Asset (Liability)Book Value
Fair Value
Book Value
Fair Value
Interest and rent receivables . . . . .
$ 46,208 $ 45,381 $ 31,357 $ 30,472
Loans(1) . . . . . . . . . . 751,341 756,608 1,704,854 1,742,153
Debt, net . . . . . . . . . . (8,865,458) (9,226,564) (7,023,679) (7,331,816)
(1) Excludes the $205 million acquisition loan to the new international joint venture and investment in the real estate of three hospitals in Colombia discussed in Note 3 as they are recorded at fair value and discussed below.
As of December 31, 2020
As of December 31, 2019
Asset (Liability) Fair ValueOriginal
Cost Fair ValueOriginal
CostAsset Type
Classification
Mortgage loans $ 136,332 $ 136,332 $ 115,000 $ 115,000 Mortgage loans
Equity investment and other loans 218,775 218,775 – –
Equity investments/Other loans

85
value measurement, and the valuation requires management judgment due to absence of quoted market prices. For this cash flow model, our observable inputs include use of a capitalization rate and discount rate (which is based on a weighted-average cost of capital) and our unobservable input includes an adjustment for a marketability discount (“DLOM”).
In regard to the underlying projections used in the discounted cash flow model, such projections are provided by the investee. However, we will modify such projections as needed based on our review and analysis of historical results, meetings with key members of management, and our understanding of trends and developments within the healthcare industry. Given our equity investment is in an entity that was a start-up company in 2020, we have not recognized any unrealized gain/loss on such investment in 2020.
ITEMS MEASURED AT FAIR VALUE ON A NONRECURRING BASIS
In addition to items that are measured at fair value on a recurring basis, we have assets and liabilities that are measured at fair value on a nonrecurring basis, such as long-lived asset impairments (see Note 3). Fair value is based on estimated cash flows discounted at a risk-adjusted rate of interest by using either Level 2 or 3 inputs as more fully described in Note 2.
11. LEASES (LESSEE)
We lease the land underlying certain of our facilities (for which we sublease to our tenants), along with corporate office and equipment. Our leases have remaining lease terms that vary in years, and some of the leases have initial fixed terms (or renewal options available) that extend the leases up to, or just beyond, the depreciable life of the properties that occupy the leased land. Renewal options that we are reasonably certain to exercise are recognized in our right-of-use assets and lease liabilities. As most of our leases do not provide an implicit rate, we use our incremental borrowing rate based on the information available at lease commencement date in determining the present value of future payments.
The following is a summary of our lease expense (in thousands):
For 2018, our total lease expense was $9.4 million, which was offset by sublease rental income of $4.3 million.
Fixed minimum payments due over the remaining lease term under non-cancelable leases of more than one year and amounts to be received in the future from non-cancelable subleases over their remaining lease term at December 31, 2020 are as follows (amounts in thousands):
Income StatementClassification
For the Years Ended December 31,
2020 2019
Operating lease cost (1) (2) $ 9,910 $ 9,262
Finance lease cost:
Amortization ofright-of-use assets
Real estate depreciation
and amortization 51 51
Interest on lease liabilities Interest 128 117
Sublease income Other (2,614) (3,478)
Total lease cost $ 7,475 $ 5,952
(1) Includes short-term leases.(2) $6.0 million and $5.8 million included in “Property-related”, with the remainder reflected in the “General and administrative” line of our consolidated statements of net income for 2020 and 2019, respectively.
Operating Leases
Finance Leases
Amounts To Be Received
From Subleases
Net Payments
2021 . . . . . . . . . . . . . . . $ 7,186 $ 126 $ (2,952) $ 4,360
2022 . . . . . . . . . . . . . . . 7,384 128 (3,238) 4,274
2023 . . . . . . . . . . . . . . . 7,451 129 (3,240) 4,340
2024 . . . . . . . . . . . . . . . 6,557 130 (3,259) 3,428
2025 . . . . . . . . . . . . . . . 5,660 131 (3,303) 2,488
Thereafter . . . . . . . . . . . . 257,730 4,783 (78,494) 184,019 (1)
Total undiscounted minimum lease payments . . $ 291,968 $ 5,427 $ (94,486) $ 202,909
Less: interest . . . . . . . . . . (201,962) (3,492)
Present value of lease liabilities . . . . . . . . . . . . . $ 90,006 $ 1,935
(1) Reflects certain ground leases, in which we are the lessee, that have longer initial fixed terms than our existing sublease to our tenants. However, we would expect to either renew the related sublease, enter into a lease with a new tenant, or early terminate the ground lease to reduce or avoid any significant impact from such ground leases.
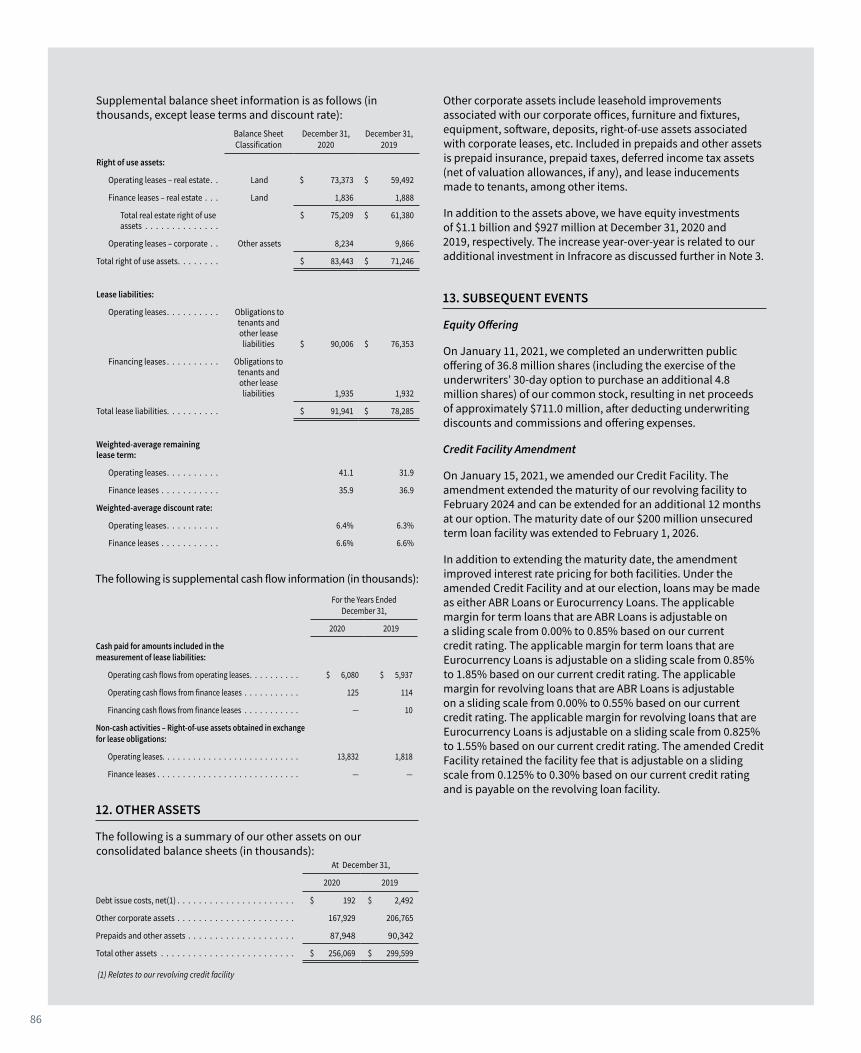
86
Supplemental balance sheet information is as follows (in thousands, except lease terms and discount rate):
The following is supplemental cash flow information (in thousands):
12. OTHER ASSETS
The following is a summary of our other assets on our consolidated balance sheets (in thousands):
Other corporate assets include leasehold improvements associated with our corporate offices, furniture and fixtures, equipment, software, deposits, right-of-use assets associated with corporate leases, etc. Included in prepaids and other assets is prepaid insurance, prepaid taxes, deferred income tax assets (net of valuation allowances, if any), and lease inducements made to tenants, among other items.
In addition to the assets above, we have equity investments of $1.1 billion and $927 million at December 31, 2020 and 2019, respectively. The increase year-over-year is related to our additional investment in Infracore as discussed further in Note 3.
13. SUBSEQUENT EVENTS
Equity Offering
On January 11, 2021, we completed an underwritten public offering of 36.8 million shares (including the exercise of the underwriters’ 30-day option to purchase an additional 4.8 million shares) of our common stock, resulting in net proceeds of approximately $711.0 million, after deducting underwriting discounts and commissions and offering expenses.
Credit Facility Amendment
On January 15, 2021, we amended our Credit Facility. The amendment extended the maturity of our revolving facility to February 2024 and can be extended for an additional 12 months at our option. The maturity date of our $200 million unsecured term loan facility was extended to February 1, 2026.
In addition to extending the maturity date, the amendment improved interest rate pricing for both facilities. Under the amended Credit Facility and at our election, loans may be made as either ABR Loans or Eurocurrency Loans. The applicable margin for term loans that are ABR Loans is adjustable on a sliding scale from 0.00% to 0.85% based on our current credit rating. The applicable margin for term loans that are Eurocurrency Loans is adjustable on a sliding scale from 0.85% to 1.85% based on our current credit rating. The applicable margin for revolving loans that are ABR Loans is adjustable on a sliding scale from 0.00% to 0.55% based on our current credit rating. The applicable margin for revolving loans that are Eurocurrency Loans is adjustable on a sliding scale from 0.825% to 1.55% based on our current credit rating. The amended Credit Facility retained the facility fee that is adjustable on a sliding scale from 0.125% to 0.30% based on our current credit rating and is payable on the revolving loan facility.
For the Years Ended December 31,
2020 2019
Cash paid for amounts included in the measurement of lease liabilities:
Operating cash flows from operating leases . . . . . . . . . . $ 6,080 $ 5,937
Operating cash flows from finance leases . . . . . . . . . . . 125 114
Financing cash flows from finance leases . . . . . . . . . . . — 10
Non-cash activities – Right-of-use assets obtained in exchange for lease obligations:
Operating leases. . . . . . . . . . . . . . . . . . . . . . . . . . . 13,832 1,818
Finance leases . . . . . . . . . . . . . . . . . . . . . . . . . . . . — —
Balance Sheet Classification
December 31, 2020
December 31, 2019
Right of use assets:
Operating leases – real estate . . Land $ 73,373 $ 59,492
Finance leases – real estate . . . Land 1,836 1,888
Total real estate right of use assets . . . . . . . . . . . . . .
$ 75,209 $ 61,380
Operating leases – corporate . . Other assets 8,234 9,866
Total right of use assets . . . . . . . . $ 83,443 $ 71,246
Lease liabilities:
Operating leases . . . . . . . . . . Obligations to tenants and other lease
liabilities $ 90,006 $ 76,353
Financing leases . . . . . . . . . . Obligations to tenants and other lease
liabilities 1,935 1,932
Total lease liabilities . . . . . . . . . . $ 91,941 $ 78,285
Weighted-average remaining lease term:
Operating leases . . . . . . . . . . 41.1 31.9
Finance leases . . . . . . . . . . . 35.9 36.9
Weighted-average discount rate:
Operating leases . . . . . . . . . . 6.4% 6.3%
Finance leases . . . . . . . . . . . 6.6% 6.6%
At December 31,
2020 2019
Debt issue costs, net(1) . . . . . . . . . . . . . . . . . . . . . . $ 192 $ 2,492
Other corporate assets . . . . . . . . . . . . . . . . . . . . . . 167,929 206,765
Prepaids and other assets . . . . . . . . . . . . . . . . . . . . 87,948 90,342
Total other assets . . . . . . . . . . . . . . . . . . . . . . . . . $ 256,069 $ 299,599
(1) Relates to our revolving credit facility
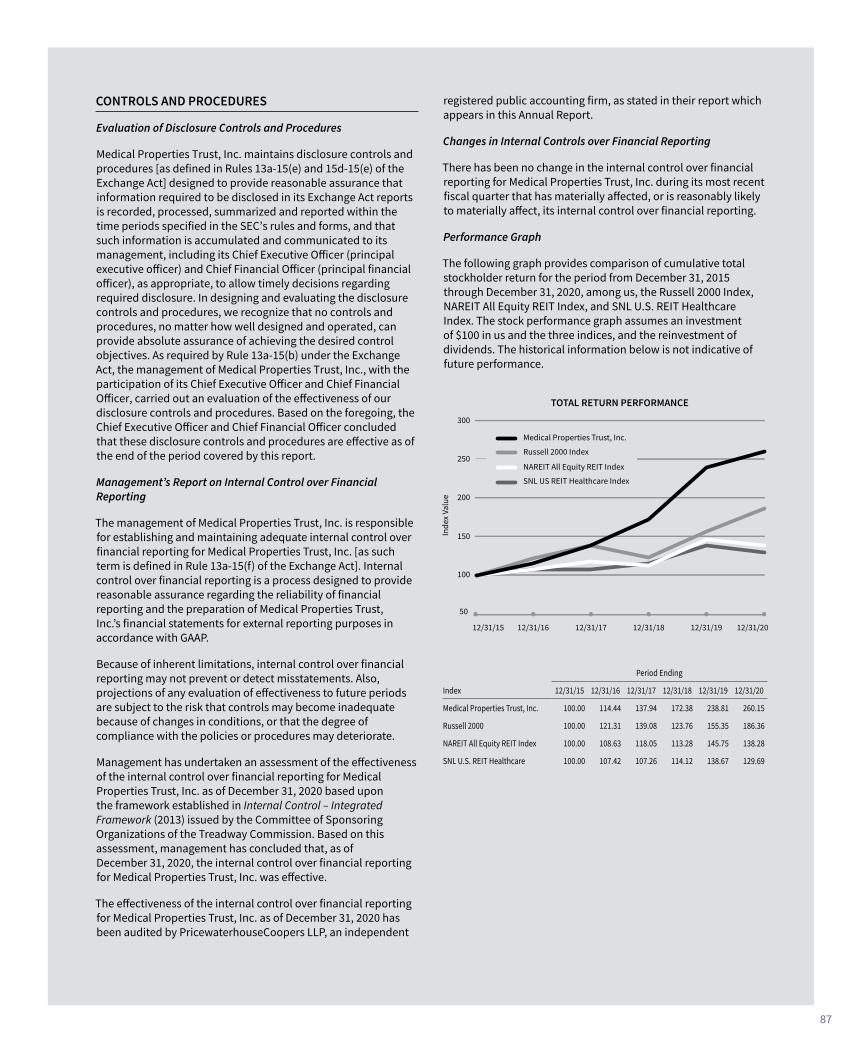
87
CONTROLS AND PROCEDURES
Evaluation of Disclosure Controls and Procedures
Medical Properties Trust, Inc. maintains disclosure controls and procedures [as defined in Rules 13a-15(e) and 15d-15(e) of the Exchange Act] designed to provide reasonable assurance that information required to be disclosed in its Exchange Act reports is recorded, processed, summarized and reported within the time periods specified in the SEC’s rules and forms, and that such information is accumulated and communicated to its management, including its Chief Executive Officer (principal executive officer) and Chief Financial Officer (principal financial officer), as appropriate, to allow timely decisions regarding required disclosure. In designing and evaluating the disclosure controls and procedures, we recognize that no controls and procedures, no matter how well designed and operated, can provide absolute assurance of achieving the desired control objectives. As required by Rule 13a-15(b) under the Exchange Act, the management of Medical Properties Trust, Inc., with the participation of its Chief Executive Officer and Chief Financial Officer, carried out an evaluation of the effectiveness of our disclosure controls and procedures. Based on the foregoing, the Chief Executive Officer and Chief Financial Officer concluded that these disclosure controls and procedures are effective as of the end of the period covered by this report.
Management’s Report on Internal Control over Financial Reporting
The management of Medical Properties Trust, Inc. is responsible for establishing and maintaining adequate internal control over financial reporting for Medical Properties Trust, Inc. [as such term is defined in Rule 13a-15(f) of the Exchange Act]. Internal control over financial reporting is a process designed to provide reasonable assurance regarding the reliability of financial reporting and the preparation of Medical Properties Trust, Inc.’s financial statements for external reporting purposes in accordance with GAAP.
Because of inherent limitations, internal control over financial reporting may not prevent or detect misstatements. Also, projections of any evaluation of effectiveness to future periods are subject to the risk that controls may become inadequate because of changes in conditions, or that the degree of compliance with the policies or procedures may deteriorate.
Management has undertaken an assessment of the effectiveness of the internal control over financial reporting for Medical Properties Trust, Inc. as of December 31, 2020 based upon the framework established in Internal Control – Integrated Framework (2013) issued by the Committee of Sponsoring Organizations of the Treadway Commission. Based on this assessment, management has concluded that, as of December 31, 2020, the internal control over financial reporting for Medical Properties Trust, Inc. was effective.
The effectiveness of the internal control over financial reporting for Medical Properties Trust, Inc. as of December 31, 2020 has been audited by PricewaterhouseCoopers LLP, an independent
registered public accounting firm, as stated in their report which appears in this Annual Report.
Changes in Internal Controls over Financial Reporting
There has been no change in the internal control over financial reporting for Medical Properties Trust, Inc. during its most recent fiscal quarter that has materially affected, or is reasonably likely to materially affect, its internal control over financial reporting.
Performance Graph
The following graph provides comparison of cumulative total stockholder return for the period from December 31, 2015 through December 31, 2020, among us, the Russell 2000 Index, NAREIT All Equity REIT Index, and SNL U.S. REIT Healthcare Index. The stock performance graph assumes an investment of $100 in us and the three indices, and the reinvestment of dividends. The historical information below is not indicative of future performance.
��
���
���
���
�����������
���
������������������������������� ����������������
��������������������������
���������������������������
������������������
����������������������������
������������������������
���
Period Ending
Index 12/31/15 12/31/16 12/31/17 12/31/18 12/31/19 12/31/20
Medical Properties Trust, Inc. 100.00 114.44 137.94 172.38 238.81 260.15
Russell 2000 100.00 121.31 139.08 123.76 155.35 186.36
NAREIT All Equity REIT Index 100.00 108.63 118.05 113.28 145.75 138.28
SNL U.S. REIT Healthcare 100.00 107.42 107.26 114.12 138.67 129.69

88
CORPORATE & SHAREHOLDER INFORMATION
OFFICERS
Edward K. Aldag, Jr.Chairman, President and Chief Executive Officer
R. Steven HamnerExecutive Vice President and Chief Financial Officer
Emmett E. McLeanExecutive Vice President, Chief Operating Officer and Secretary
J. Kevin Hanna Vice President, Controller and Chief Accounting Officer
Rosa H. Hooper Vice President, Managing Director of Asset Management and Underwriting
Charles R. LambertVice President, Treasurer and Managing Director of Capital Markets
R. Lucas SavageVice President, Head of Global Acquisitions
DIRECTORS
Edward K. Aldag, Jr.Chairman, President and Chief Executive Officer
G. Steven DawsonPrivate Investor
R. Steven HamnerExecutive Vice President and Chief Financial Officer
Caterina A. Mozingo, CPA, PFSShareholder, Taxation at Aldridge, Borden & Company, PC
Elizabeth N. Pitman, JD, CHPCPartner at Waller Lansden Dortch & Davis, LLP
D. Paul Sparks, Jr.Retired Senior Vice President, Energen Corporation
Michael G. StewartPrivate Investor
C. Reynolds Thompson IIIChairman and Chief Investment Officer of Select Strategies Realty
LEGAL COUNSEL
Baker, Donelson, Bearman, Caldwell & Berkowitz, PC Birmingham, AL
Goodwin Procter, LLP – New York, NY
INDEPENDENT REGISTERED PUBLIC ACCOUNTING FIRM
PricewaterhouseCoopers LLP – Birmingham, AL
ANNUAL MEETING
The Annual Meeting of Shareholders of Medical Properties Trust, Inc., is scheduled for May 26, 2021, at 10:30 a.m. CDT at the Corporate Office located at 1000 Urban Center Drive, Suite 501, Birmingham, AL 35242.
CERTIFICATIONS
Medical Properties Trust, Inc.’s Chief Executive Officer and Chief Financial Officer have filed their certifications required by the SEC regarding the quality of the company’s public disclosure (these are included in the 2020 Annual Report on Form 10-K filed with the Securities and Exchange Commission). Further, the company’s Chief Executive Officer has certified to the NYSE that he is not aware of any violation by Medical Properties Trust, Inc., of NYSE corporate governance listing standards, as required by Section 303A.12(a) of the NYSE listing standards.
TRANSFER AGENT AND REGISTRAR
American Stock Transfer & Trust Company, LLC 6201 15th Avenue, Brooklyn, NY 11219 (800) 937-5449 [email protected] www.amstock.com TTY: (Teletypewriter for the hearing impaired) (718) 921-8386 or (866) 703-9077
CORPORATE OFFICE
Medical Properties Trust, Inc. 1000 Urban Center Drive, Suite 501 Birmingham, AL 35242 (205) 969-3755 (205) 969-3756 fax www.medicalpropertiestrust.com
The MPT Annual Report on Form 10-K for the year ended December 31, 2020, has been filed with the Securities and Exchange Commission and may be obtained without charge by any shareholder (including beneficial owners) upon written request to Investor Relations, Medical Properties Trust, Inc., 1000 Urban Center Drive, Suite 501, Birmingham, AL 35242.


Medical Properties Trust, Inc.1000 Urban Center Drive, Suite 501
Birmingham, AL 35242(205) 969-3755
medicalpropertiestrust.com NYSE: MPW