Embed Size (px)
Citation preview

GULF SHRIMP C A N N l NG PLANT WASTEWATER PROCESS1 NG **
by A . Frank Mauldin and A. J. Szabo *
INTRODUCTION
The canning of shrimp was first successfully done i n 1867 by George W. Dunbar, an enterprising New Englander who settled i n New Orleans and operated a cannery after the C iv i l War. From this dif f icult and trying beginning, an industry has deve- loped which consists of approximately 70 shrimp canners i n the United States, 25 of which are located on the coast of the Gul f o f Mexico. are primarily i n Louisiana and Mississippi on bays or bayous or within short trucking distance of the docks. remain family enterprises. The canneries compete for the available supplies of raw shrimp and generally obtain and process the smaller sizes, Therefore, the economi- cal operating period i s generally during the short spring and fal l seasons when shrimp may be taken i n the regulated coastal waters. the variables of supply and the market price, the competition for the raw shrimp i s great and no plant i s assured that i t w i l l operate on a continuous schedule. Never- theless, each plant which operates must be able to handle i t s perishable raw shrimp supply i n a short time. efficient mechanical operating basis. Most of the equipment i s o f the same or similar manufacture and the wastes created by the operating units have very similar charac- teristics.
The Gu l f Coast Canneries
These canning plants have for many years been and most
Because of the controlled seasons,
Therefore, plants hove developed along the same, most
Because of the high strength and relatively large volume of wastewater discharged by shrimp canneries, a joint effort at developing an economical pollution control technology through cooperative effort was aimed at accomplishing what many small canners could not individually achieve. and the American Shrimp Canners Association, consisting of twenty-two member plants sponsored this study for this purpose.
The Environmental Protection Agency
* Domingue, Szabo & 4ssociates, Inc., Consulting Engineers, Lafayette , Louisiana.
** T h i s study was supported by funds from the Environmental Protection Agency, Off ice of Rescarch and Development, under Grant No. S 800 904 and the American Shrimp Canners Association.
199

SHRIMP PROCESSING AND CANNING
The operations i n a shrimp cannery are basically the same the world over, as shown in Figure 1 ( 1 ) . or trash and unsuitable materials. mechanical devices developed especially for the shrimp industry. Heads and hul I s are removed, pieces of shell and legs are separated and the remaining tai l meat i s separated from the waste.
Raw shrimp are first thoroughly washed and separated from debris The raw shrimp are peeled and deveined with
Raw shrimp are mechanically peeled by Laitram Model A peelers. moves the head and shell by mechanical and hydraulic action. of inclined steel and rubber coated rollers which form a squeezing gap where the head and shell i s loosened and removed from the shrimp meat. Water i s used pri- marily to facil i tate movement of the shrimp down the inclined rollers.
This machine re- It basically consists
In the deveining operation the back of the shrimp i s split by a unique razor edge device. The shrimp with the exposed vein then drops into a rotating drum with inside "fingers" which remove the vein. The veins are then washed out o f the drum and are discharged with the wastewater. processed but only on the larger sizes.
The deveining operation i s generally not used on a l l shrimp
After deveining, the shrimp are pre-cooked or blanched for approximately 3 minutes i n a boil ing brine solution which curls the meat, extracts moisture and solubles and develops the pink or red color of the finished product. Blanching can either be a batch process, where the blanching water i s dumped several times daily, or conti- nuous, where the shrimp are fed through the tank on a conveyor and brine water i s continuously added and washed from the tanks.
After cooling, drying, further inspection and grading, the shrimp are packed, on a scaled weight basis, into the appropriate size can, then mechanically sealed and retorted for 12 minutes at 2500 F. After cooling, the cans are labeled and are ready for shipment to market.
W AS TE W A TER C H AR AC TER I S TI C S
Table 1 shows BOD-5 and suspended solids characterization for the primary shrimp processing and canning operations. 70 % of these parameters to the total discharge. The miscellaneous operations in- clude water flume dumps, canning, retort cooling and inspection. centration for the total discharge varies from 1,000 mg/l to 1800 mg/l and the suspended solids concentration for the total discharge varies from 400 mg/l to 800 mg/l.
The peeling operation contributes approximately
The BOD-5 con-
200

GENERAL PROCESS SCHEMATIC
SHRIMPMEAT, DEBRIS
,SALT WATER )I
HOT WATER -b
WATER b
SHRIMP CANNING
GRADING c=J
-=3=+ PRODUCT FLOW
-B W A S T E FLOW
201

T A B U 1 WASTEWATER CHARACTERIZATION
SHRIMP PROCESSING AND CANNING
Plant Operat ion
Peeling
Deveining
Blanching
Receiving & Raw Washing
MisceI laneous
Total Discharge Processing Only (No Washdown)
BOD4 bs/l00 Ibs ShrimD
4.89
0.51
0.15
0.66
0.62
6.83
% Total
Discharge
72
7
2
10
9
100
Suspended So I ids
bs/l00 Ibs ShrimD
2.63
0.45
0.19
0.25
0.35
3.87
% Toto I
Discharge
68
12
5
6
9
100

TREATMENT BY SCREEN1 NG J
Several different screens were pi lot tested during the study. The purpose of the screening tests was to evaluate the efficiency and ease of operation of the tested screens. Several of the larger canners had obtained experience i n screening the shells and the heads from their peeler wastewater with vibrating screens. These screens operated satisfactorily but were expensive to purchase and maintain. It was fel t that ease of operation and economical maintenance should be a prime con- sideration i n evaluating the pi lot screens.
The following screens were tested with raw peeler wastewaters:
1. Sweco "Vibro-Energy Separator". 2. 3. Bauer "Hydrasieve". 4. Dorr Ol iver "DSM". 5.
Hydroc yc Ion i cs "Ro tostra i ne r I ' .
H ydroc yc I on ics I ' Hydroscreen ' I .
A description and evaluation of each of these screens follows:
Sweco "Vibro-Energy Separator'' . T h i s screen was 48" i n diameter with a 20 mesh (approximately 0.84 mm opening) screen fabric. This screen was circular, mounted on coi l springs, and wastewater enters from the top. The underflow passed through the screen and the screened solids were vibrated with a spiral roll ing motion to the sides of the screen where they were discharged through two ports 180 degrees apart. The vibrations were caused by an electric motor whose shaft was eccentrically loaded. This screen was a permanent plant installation at the test cannery. Wastewater from eight peeling machines and four separators was l i f ted by centrifugal pumps to the screen. With eight peeling machines operating (the usual practice), the flow to the screen was approximately 500 gpm.
T h i s screen was effective i n removing suspended solids, approaching 40%. was not the most effective for removing settleable solids; the removal was less than 60% leaving a mean settleable solids residual of approximately 20 ml/l i n the under flow. BOD-5 and total solids removal appear to average at around 15% reduction. The screened solids were fair ly dry with an average value of 84% moisture.
The screen
Hydrocyclonics "Rotostrainerll . This screen had a diameter of 25 inches and a length of 24 inches. The pi lot unit had a screen opening of 0.5 mm (32 mesh equivalent). The cylindrical screen had the appearance of a water well screen with a wedge wire grid. The unit was equipped with a weir influent box for even influent distribution to the screen. The water passed through the screen openings on the top of the screen, fel l through the center of the cylinder and passed through the screen openings again on the bottom, thus backwashing any solids trapped i n the screen. The solids
203
were carried on the top surface of the screen to a scraper bar where the solids were removed.
The removal of suspended and settleable solids was somewhat less for t h i s screen than for the vibrating screen even though the screen opening for the rotating screen (0.5 mm) was less than for the vibrating screen (0.84 mm). The screenings, at 22% dry solids were fair ly dry.
Bauer "Hydrasieve". high. (32 mesh), 0.030 inches (22 mesh), 0.040 inches (16 mesh) and 0.060 inches ( 1 1 mesh).
This pi lot tangential screen was 18 inches wide and 33.5 inches The test screen was supplied with four different screen openings: 0.020 inches
This screen had a headbox and a weir for even influent distribution and for feeding the wastewater onto the screen tangentially. The screen bars were wedgewire and ran transverse across the screen. The wedgewire bars curved downward between the vertical supports to cause the flow to divide into separate streams between the vertical supports. The manufacturer claims this helps prevent clogging and blinding,
This screen was tested as a primary screen on raw peeler wastewater. A l l the screen openings available were tested at 50 gpm. because only one short run was made with each screen opening. These results indi- cate that the 0.020 inch opening screen produced the best results. T h i s size tended to blind fair ly quickly with a slime build-up. opening screen performed excellently during the short test run. Residual settleable solids i n the under f low was only 14 ml/l. The other screen openings (1.0 mm and 0.5 mm) also performed without blinding problems but solids removal was inferior to the 0.75 mm opening screen. The screened solids were extremely wet upon leaving the screen but tended to gravity drain very quickly. The screenings were 92% mois- ture at the point of leaving the screen. amount of water continuously trickling from the end of the screen. had been used at many locations and the seals between the sides of the wedge wire screen and frame were worn causing water to channel down the inside walls. T h i s was probably the maior cause of the wetness of the screenings solids.
The evaluation was limited, however,
T h i s unit with a 0.030 inch (0.75 mm)
T h i s was due probably to a noticeable The test unit
Dorr-Oliver "DSM". This pi lot tangential screen was 12 inches wide and approxi- mately 6 feet ta l l . 0.040 inch were made. The velocity across the face of the screen was very fast. As a consequence, a slight blinding of the 0.020 inch screen caused a complete failure with water discharged over the end of the screen. With the 0.030 inch opening screen, residual settleable solids of only 13 ml/l i n the underflow was found. cation of blinding was observed with these two screens. approximately 82% moisture when leaving the screen.
Test runs with screen openings of 0.020 inch, 0.030 inch and
The 0.040 inch opening had residual settleable solids of 18 ml/l. No indi- The screened material had
204

Hydrocyclonics "Hydroscreen". This pi lot tangential screen was also tested wifh raw peeler wastewater. differences included: the screening surface was actually three separate screens, a l l at slightly different angles to the vertical; the influent weir did not direct the water tangentially to the screen but was actually a small iump; and the screening surface of the test unit was about one foot longer than the Bauer screen. uni t was apparently new and was in excellent condition.
T h i s screen was similar i n design to the Bauer screen. Several
T h i s screen
The differences i n the screen design were apparently significant. settleable solids in the underflow was 22 ml/l. the Bauer screen. when leaving the screen. longer, and no noticeable amount o f water was discharged from the end of the screen. Only one test run was made with this screen, using a 0.020 inch screen opening and a flow of 50gpm.
The residual This was considerably higher than
However, screenings contained approximately 18% dry solids This was due to the solids staying on the screen much
No blinding problems were observed during the test run.
Figures 2 and 3 show a comparison of effluent and screenings quality with the above screens tested on raw peeler wastewater.
O n screening peeling wastewaters, the investigators evaluations are:
Of the three types of screens, the tangential screens produced the best and the poorest effluent as evaluated by residual settleable sol ids concentration i n the effluent. The rotating screen produced the driest screenings and the vibrating screen performed midway to the other two types for both criteria.
The tangential screens consumed no power, therefore, were best for this category. The vibrating screen was the poorest and the rotating screen was only slightly more power demanding than the tangential screens, because i t was physically lower than the tangential screens and the pumping head required was lower.
In ease of operation, the rotating screen was best. i t showed no tendency to bl ind or clog. frequent water hosing and was midway i n this category. screens required frequent hosing and periodic brushing with a steel brush.
During a short evaluation
The tangential The vibrating screen required a
In anticipated operating cost, the rotating screen may be the best because maintenance should be minimal. rate high if equipped to provide maintenance from blinding i n l ieu of man power. cause of expected high maintenance costs and the need for operating manpower.
The tangential screen would likewise
The vibrating screen because of i t s mechanical nature i s last be-
205

PILOT SCREEN EVALUATION WITH
PEELER WASTEWATER Figure 2
Sueco Vibro- Energy
z w w W tn
a
Dorr - 01 iver
DSM
$ ' Hydrocyclonics
5 Rotostrainer
-
SCREENJNGS MOISTURE
tn .Sweco Vibro- Energy
Hjdrocyclonics
Hydr oscrecn
+
Figure 3
I Bouer
Hydrasieve
206

TREATMENT BY DISSOLVED AIR FLOTATION (DAF)
The DAF pi lot plant evaluation was made during the fall, 1972 and the summer, 1973 canning seasons. variables of the DAF process while treating shrimp canning wastewaters. objective of the pi lot plant studies was to develop design criteria for full scale plant design.
Objectives were to intensely evaluate the operational The ultimate
The purpose o f any DAF treatment system i s to separate and concentrate suspended and colloidal particles i n the feed wastewater. Larger particles of the settleable solids size should be removed prior to DAF treatment by screens and cyclones i f high density particles are present. Separation of small suspended and colloidal solids depends more on their structure and surface properties than on their size and density. Therefore, DAF treatment plants can not be designed theoretically or rationally by mathematical equations, but must be planned by the use o f laboratory (bench scale) and pi lot scale studies. DAF plants are as follows (2):
Factors of greatest importance i n designing
1 . 2. Chemical Optimization. 3. Air/solids Ratio. 4. Cell solids loading. 5. Sludge Concentration.
Pressurization Piping (Ful I flow or recycle).
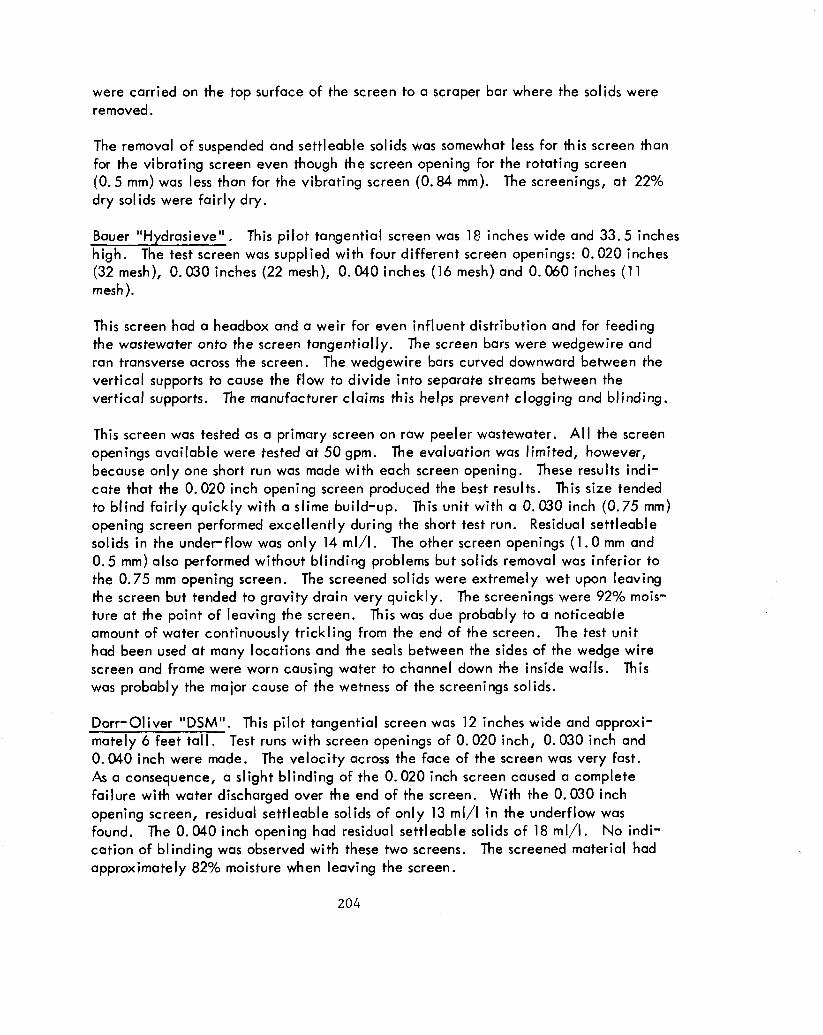
The selection of a pressurization piping mode for the p i lo t plant unit was one o f the first maior decision points that the investigators faced. pressurization DAF and recycle pressurization DAF are shown in Figures 4 and 5, respectively (3). recycle i s only for protection of the process pump during periods of low influent flow. The recycle pressurization system pressurizes only a recycle stream. The raw influent i s fed to the flotation cel l by gravity.
Schematics o f ful l flow
The full flow pressurization system i s a single pass system. The
The ful I flow pressurization system offered the very large advantage of lower capital costs. prior to pressurization would be sheared i n the pressurization pump. would then have to occur i n a short period within the flotation ce l l and could result i n immature floc and poor separation. would not be suitable for treating shrimp canning wastewaters.
The major disadvantage to this system, technically, was that any flocculation A l l flocculatian
If this occurred, then this type o f system
The recycle pressurization system had the reported disadvantage of high capital costs. I t s advantage was that a floc could be preformed i n a separate flocculation tank and be fed to the air flotation ce l l by gravity, thus preserving the fu l ly matured floc. This would facil i tate good separation of the floc fromthe remaining water.
207
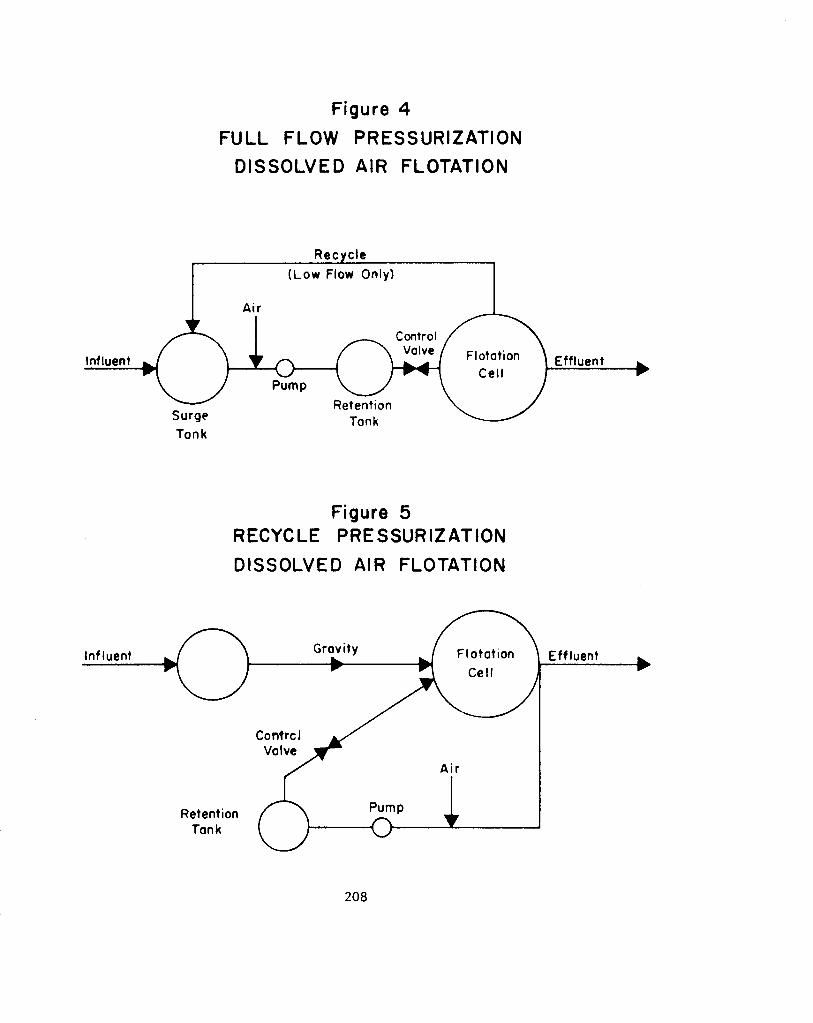
Figure 4
FULL FLOW PRESSURIZATION DISSOLVED AIR FLOTATION
Recycle ( L o w Flow Only)
Influent
W Retention Tank Surge
Tonk
Figure 5 RECYCLE PRESSURIZATION DISSOLVED AIR FLOTATION
Influent
208

Preliminary iar testing was performed at the study plant during the summer of 1972. coagulant system consisting o f pH adjustment, alum and anionic polymer was found to give an extremely tough, stable floc. total pressurization system for the first season and, i f results were unacceptable, to then change to a recycle pressurization system.
A
The decision was then made to pi lot test a
A total pressurization DAF pi lot system, shown i n Figure 6, manufactured by the Carborundum Company was tested during the Fall, 1972 canning season. There was considerable lost time during this season because of mechanical problems, the investi- gators inexperience with the pi lot test equipment and short canning runs. However, the test unit did show good potential, because when the proper controls could be maintained, very efficient treatment resulted. Because of the potential this uni t demonstrated, i t was decided to pi lot test the unit a second season.
Bench scale iar tests and pressure bomb tests (2) were performed i n the summer of 1972. Acid titration tests showed the protein isoelectric point to be about pH 4.5. The raw wastewater had a pH of about 6.9, therefore, pH adjustment was necessary for protein precipitation. Many combinations of coagulants, polymers and water conditioners were tried i n the iar tests, but the best combination found was as follows:
Coagulant: Aluminum sulfate - 75 mg/l Polymer: Magnifloc 835 A - 2 mg/l pH: 5.2 0.2.
These chemicals and dosages were confirmed with the pi lot unit to be optimum.
Floc carryover was a minor problem with the DAF unit during the testing period. was no observable relationship between effluent COD and minor degrees of floc carry- over. COD demanding solids. The processing water used by the plant was high in chlorides (1000 mg/l). A maior floc carryover problem was observed when runs were made with polymer dosages of less than 2.0 mg/l. where good separations were made with lower polymer dosages. T h i s probably demon- strates the economic trade off necessary when using a fu l l pressurization system; capital costs w i l l be lower but operating costs w i l l probably be somewhat higher.
There
The minor floc carryover was probably an after-floc formed by inorganic non-
This was i n contradiction to the iar tests
Several preliminary runs or parts of runs were made using no chemicals or pH ad- justment but using air flotation only. no observable treatment. as the influent and the floated sludge was extremely l ight and bubbly. Very few captured solids were observed i n this type of sludge. Flotation bomb bench scale tests were made with no chemicals but with ful l air. Virtual ly no reduction in TOC resulted. and virtual ly no removals of COD, turbidity or suspended solids occurred. These facts
The effluent was not tested because there was The effluent appeared to be of exactly the same quality
Runs were made with the DAF pi lot plant with inefficient coagulant systems
209

Figure 6 DISSOLVED AIR FLOTATION
PILOT PLANT SCHEMATIC
TA NGE N TI AL SCREEN
SCREENED SOL I OS SCREEN INFLUENT *
4
PRS!jURIZ ATlON TANK
SCREEN TANK
ti t RECXLE
COAGULANT @ n POLY MER
TREATEO EFFLUENT AIR FLOTATION TANK
SLUDGE
SLUDGE COLLECTION +1 I TANK
BASKET CENTRIFUGE SLUDGE SLUDGE DEWATERING
RAW CANNERY WASTEWATER AFTER SCREENING THROUGH 20 MESH VIBRATING SCREEN
210

made i t very clear to the investigators that an efficient coagulant system must be used i f significant pollutant reductions are to be achieved.
Table 2 shows the average operating conditions for the pi lot DAF testing and Table 3 shows the pollutant removal efficiencies for this testing. BOD-5 removals averaged 65% but had a range of 80 % to 50 % with suspended solids removal being about the same. less than 20 units. small amount of turbidity. The effluent BOD-5 for good runs was below 400 mg/l, the effluent COD was below 1200 mg/l, the effluent suspended solids was below 100 mg/l and the effluent protein was below 600 mg/l. This range of results has generally been confirmed by Petersen (4) and Claggett (5 and 6) with shrimp and salmon wastes, respectively.
The effluent during good runs was almost crystal clear with a turbidity of The small amount of floc carryover that persisted caused this
The effluent was visually clear between floc particles.
Three runs were made for the purpose of optimizing the ce l l solids loading rate. of the runs were performed with optimum chemical dosages developed previously. Three runs were completed with influent flow rates of 25 gpm, 50 gpm and 75 gpm. The influent suspended solids concentration for each run was slightly different; therefore, flow and solids loading were not direct ly proportional. The results are shown i n Figure 7.
All
From F iguy 7 i t appears that optimum cel l solids loading was approximately 0.25 Ibs/’hr./ft and for the particular pi lot uni t tested, the optimum influent f low was approximately 40 gpm.
Several values of air/soIids ratios were computed from similar runs made during the testing program. ratios are plotted against removal of suspended solids. From Figure 8 i t appears optimum A/S ratios are within the range of 0.10 and 0. 15.
The results of these computations are shown i n Figure 8 where .4 ‘S
The concentration and flow rate of the flotation sludge was measured for most of the pi lot runs. Mean results are shown i n Table 4.
SLUDGE DEWATER1 NG BY CENTRIFUGATION
The flotation sludge skimmed from the top of the DAF pi lot plant was concentrated in u basket type pi lot centrifuge manufactured by De Laval. following characteristics:
The centrifuge had the
Method of Feed: Batch Feed Volume: 2.5 gallons Basket Type: Sol id Material Removal Method: Skimmer
211

TABLE 2 DAF PILOT PLANT
AVERAGE OPERATING CON D IT1 ON S
Flow: Pressurization : Airbol ids Cell Solids Loading: Acid Addition: Alum Addition: Polymer Add i t ion :
TABLE 3 DAF PILOT PLANT EVALUATION
Pollutant Remova I Efficiencies
Parameter
BOD-5
COD
Total Solids
Suspended So lids
Protein
Tu rb id i t y
Ortho Phosphate
Total Organic Carbon
50 gpm 40 psig 0.14 0.33 Ibs/hr/ft* Surge Tank Screen Tank Flotation Cell Influent
Mean Remova I
%
65.1
59.0
14.9
65.6
52.5
83.0
27.5
61.4
Maximum Removal
%
80.0
69.5
42.9
85.8
91.1
97.5
38.2
62.0
Minimum Remova I
%
50.0
43.5
0.0
7.0
25.7
61.9
15.4
60.0
212

0.70
0.60
0.50
0.40
0.30
0.20
0.1 (3
7 5 8 0 8s 90 95 I O 0
Figure 7 PILOT DAF PLANT EVALUATION
SOLIDS LOADING VS. TURBIDITY REMOVAL
Influent F l o w
Influent F l o w
1 I I I 1
213

0.25
0.20
0.15
v) \
a .
0 . I C
O.O!
O.O(
Figure 8 PILOT D A F PLANT EVALUATION
A / S RATIO VS. SUSPENDED SOLIDS REMOVAL
1 1 1 1 60 70 80 90 50
SUSPENDED SOLIDS ("10 REMOVAL)
214

TABLE 4 DAF PILOT PLANT EVALUATION
F lo ta t ion S ludge Characteristics
Parameter
Dry Solids
Flow
Pro te in
Units Mean Maximum Minimum
% 2.98 4.02 1.58
gpm 4.28 5.97 1.17
mg/l 15,819 26,318 6,963
TABLE 5 PILOT CENTRIFUGE EVALUATION
Mean Results
Para meter
Feed Sludge
Centrifuge Cake
Centrate
Air
Mean % Dry Solids
3.36
6.23
1.05
0.0
Mean Volume (Sa I Ions)
2.50
0.58
0.98
0.94
215
Average results obtained are shown in Table 5.
TREATMENT ECONOMICS
The total costs of wastewater treatment for seafood processors are d i f f icu l t to present i n general. Total costs involve the characteristics of the wastewater, plant piping, capital costs of equipment, operation and maintenance costs, administrative costs, engineering costs and the salaries of operating personnel. These costs can vary widely from plant to plant.
A cost of a waste treatment system for a hypothetical 8 peeler shrimp processing plant i s presented here. dewatered sludge are assumed hauled to a land fill.( The alternative to hauling would be a reduction plant where screenings and sludge would be dried and sold as by product waste meal. Because the capital and operating costs of a reduction plant are large and the market conditions for waste meal are very uncertain (7), this alternative has not been considered).
The assumed wastewater flow i s 600 gpm. Screenings and
The treatment system consists of screening, dissolved air flotation, chemical addition system, sludge dewatering,centrifuge sludge and screenings holding tank, tank truck and a l l necessary pumps and conveyers. The operation and maintenance costs/day assume eight hours of processing and include chemical costs, power costs, a plant operator, a truck driver and a land f i l l fee.
The installed capital costs for the above described treatment system, the operation and maintenance costs/day and the amortized cost /'day (assumed 10 year life, 7% cost of money and 120 days operation/year) are as follows:
Capital Costs - $2 10,000.00 Operation and Maintenance
costs $ 155.OO/day Amortized Costs $ 280.OO/day
216

REFERENCES ?
1. Soderquist, M. R. , Canned and Preserved Fish and Seafoods Processing Industry Development Document for Effluent Limitations Guidelines and Standards of Performance, EPA. Contract No. 68-01-1526, July, 1973,
2. Eckenfelder, W. W., Jr. , Industrial Water Pollution Control, McGraw- Hill, 1966.
3. Snider, lrvin, Corborundum Company, Knoxville, Tennessee, (Personal Communication).
4. Peterson, P. L., Treatment of Shellfish Processing Water by Screening and Air Flotation, (unpublished), National Marine Fisheries Services, Kodiak, Alaska, 1972.
5. Claggett, F. G., and Wong, J., Salmon Canning Wastewater Clarification, Part I I . Fisheries Research Board of Canada, Vancouver Laboratory, British Columbia, February, 1969.
6. Claggett, F. G., and Wong, J., Salmon Canning Wastewater Clarification, Part I. Fisheries Research Board of Canada, Vancouver Laboratory, British Columbia, January, 1968.
7. Mendenhall, V., Utilization and Disposal of Crab and Shrimp Wastes, University of Alaska, Marine Advisory Bulletin No. 2. NTIS, COM- 71-01092, March, 1971.
217


![Absecon Brochure Update Planning Process1 [1]](https://img.dokumen.tips/doc/110x75/577cd9af1a28ab9e78a3ed52/absecon-brochure-update-planning-process1-1.jpg)