Embed Size (px)
Citation preview

Publication Date: November 14, 2017
CANCER AMONG THE NAVAJO
2005-2013

2
TABLE OF CONTENTS
Executive Summary………………………………….……..………………………………………………………………………………………3
Introduction………………………………………………………….…………………………………………………………………………………5
Incidence……………………….………………………………………………………………………………………………………………………10
Stage of Diagnosis……….…………………………………………………………………………………………………………………………17
Screening…………………………..………………………………………………………….………………………………………………………22
Mortality.………………………...…………………………………………………………………………..………………….……….…………..25
Discussion…………………………………………..……………………..…………………………………..…..…………………………………31
Recommendations…………………………………………………………………..………………..………………………………………….34
Resources………………………….………………………………………………………………..………………………………………………..35
Definitions……………………………………………………………………………………………….…………………….…………….……….36
References………………….………………………………………………..…………………….…………………………………………………38
Appendices……………………………………………………………………………………………………………………………………………40

3
EXECUTIVE SUMMARY
Foreword
In response to professional and community concerns that cancer is a major health issue among Navajo
residents of the Navajo Nation, the Navajo Cancer Workgroup presents Cancer Among the Navajo, 2005-
2013. This report was produced to update the findings of a previous report, ‘Cancer Among the Navajo,
1995-2004,’ and help broaden our current understanding of cancer in this community. Patients, family
members, medical and public health professionals, educators, community members, legislation and
policy makers, and program administrators and staff are encouraged to use this report to broaden our
current understanding of cancer among the Navajo people and strategize to improve cancer prevention,
education, and treatment.
Acknowledgements
The report was prepared by the Navajo Cancer Workgroup to support the efforts of Navajo Nation to
improve cancer prevention and care by utilizing and improving cancer data. The workgroup consists of
representatives from the Navajo Epidemiology Center, Navajo Department of Health Programs, New
Mexico Tumor Registry, Arizona Cancer Registry, Navajo Area Indian Health Service, Non-Profit
Organizations, Universities, and Centers for Disease Control and Prevention (CDC).
Dedication
Cancer has greatly impacted the lives of the Navajo people over the years. Therefore, we would like to
dedicate this report to cancer survivors, those who have lost their lives to cancer, and their loved ones
who cared for them. The amount of courage, determination and resilience of cancer survivors is
immeasurable, and we send them continuous strength and support. May they be a symbol of hope for
all who have been affected by cancer. As for those who have lost their battle to cancer, their families
and friends are in our prayers. We hope this report will provide the Navajo people with the information,
awareness and resources needed to decrease the burden of cancer.
Background
This report aims to summarize epidemiological cancer surveillance data among the Navajo, a large tribal
nation, both geographically and by population. Cancer is currently the second leading cause of death
among the Navajo, representing an estimated 7.3 percent of all deaths. The Navajo Cancer Workgroup
was formed in 1999 to support the efforts of Navajo Nation leaders to improve cancer prevention and
care by utilizing and improving cancer data. This report updates ‘Cancer Among the Navajo 1995-2004,’
with more recent data of cancer incidence (new cases), stage of diagnosis, mortality and cancer
screening behaviors for the years 2005-2013.

4
Methodology
In this report, Navajo Cancer Workgroup obtained high-quality, population-based cancer surveillance
cancer incidence, stage at diagnosis, and mortality data reported to the Arizona Cancer Registry, New
Mexico Tumor Registry and Utah Cancer Registry. The Navajo cancer incidence and mortality rates were
based on data from American Indians and Alaska Natives (AI/AN) who resided in a six-county (Coconino,
Navajo and Apache counties in Arizona; San Juan and McKinley counties in New Mexico; and San Juan
county in Utah) region that comprise the Navajo Nation. In these six counties Navajos represent about
eighty percent of the total AI/AN population; therefore, cancer data for AI/AN serves as proxy for
Navajo. For the screening behaviors, data were used from the Navajo Nation Health Survey (Chinle and
Northern Agencies), Indian Health Service (IHS), federal and tribal clinical outcome measures reported
as part of the Government Performance and Results Act (GPRA), as well as the Behavioral Risk Factor
Surveillance Survey (BRFSS) – a well-established national, telephone-based health survey supported by
CDC.
Findings
Findings show that from 2005-2013, the ten most commonly diagnosed cancers (by counts) among the
Navajos were female breast, colorectal, prostate, kidney, uterine, stomach, non-Hodgkin lymphoma,
pancreas, thyroid, liver, and lung. Prostate cancer was the most commonly diagnosed cancer among
Navajo males (85 cases per 100,000 males, 226 total number of cases), followed by colorectal cancer
and kidney cancer. Among Navajo females, breast cancer was the most commonly diagnosed cancer
(282 new cases, 64.4 per 100,000 females), followed by colorectal cancer and uterine cancer. Compared
to the non-Hispanic white (NHW) population in Arizona and New Mexico, Navajo had a lower incidence
of prostate, female breast, non-Hodgkin lymphoma, thyroid, and lung cancers, but higher incidence and
mortality of liver, kidney, stomach, and gallbladder cancers.
Navajos are diagnosed in later stages compared to NHW, with 8-9 percent fewer breast and colorectal
cancer patients being diagnosed in the localized stages.
Cancer screening among the Navajos is low, particularly for colorectal cancer. However, there are
substantial differences in breast cancer screening based on the data sources, with Navajo area-wide
GPRA (clinic-reported) suggesting much lower rates than the self-reported Navajo Nation Health Survey
and BRFSS data. The BRFSS data suggests that NHW females receive mammography and pap test
screenings at almost the same rates as AI/AN females in the six-counties included, but colorectal cancer
screening rates are much lower (57.4 percent NHW vs. 32.4 percent AI/AN). Within the Navajo Nation
Health Survey, screening rates for mammography, pap test, and colorectal cancer screening were 12-25
percent lower in the Chinle Agency compared to the Northern Agency.
The most common causes of cancer mortality among Navajo males were prostate (23.3 deaths per
100,000 males), colorectal, and stomach cancers, and among Navajo females breast (13.1 deaths per

5
100,000 females), colorectal and ovarian cancers. This is a stark difference from NHW, for whom the
leading cause of cancer death was lung cancer, at rates 6.6 times higher than the Navajo.
Conclusion and Recommendations
Cancer among the Navajo remains a substantial public health challenge on the Navajo Nation. The most
common cancers remain prostate, breast, and colorectal cancers, with higher incidence rates in 2005-
2013 compared to 1995-2004. Although the incidence and mortality of the most common cancers
(prostate, breast, colorectal) remain lower than NHW population, the Navajos suffer from comparatively
high rates of kidney, liver, stomach and gallbladder cancers.
Navajos continue to be diagnosed at relatively advanced disease stages, although improvement (7
percent increase) is noted in patients being diagnosed in the localized stage of colorectal cancer (males
and females combined) compared to 1995-2004. Cancer screening (particularly for breast cancer) was
higher than in the report from 1995-2004, but rates remain low for colorectal cancer, with substantial
variability between the Chinle and Northern Agencies.
The workgroup recommends continuing the partnership with state cancer registries and cancer control
planners to maintain and improve on-going surveillance of cancer among the Navajos, and to promote
research that examines risk factors and causes, as well as appropriate approaches to promote screening,
early detection, and treatment. In addition, the workgroup recommends increasing education and
training for health care providers regarding current cancer screening practices and guidelines, and
expanding collaboration among Navajo tribal health programs, Navajo Senior Centers, Indian Health
Service, and tribally operated facilities and local communities in order to translate these data into
targeted and culturally appropriate cancer prevention and intervention programs.
INTRODUCTION
Until the advent of population-based cancer surveillance in the 1970’s, reports of cancer among the
Navajo were mostly based on case-series that were derived from the experiences of individual
physicians or organizations that served American Indians and Alaska Natives (AI/AN) communities, and
on data using vital records. Reports of cancer among the Navajo people were published in the medical
literature as early as the 1930s.1-3 A common finding in these reports was the relative low number of
cancers observed among the Navajo. For example, C.G. Salsbury, M.D., a physician who worked among
the Navajo in Ganado, Arizona, wrote in the Arizona Medicine that cancer rates were lower among the
Navajo compared to whites and questioned whether the Navajos were protected from diabetes and
cancer by their diet and nutrition.4
Following World War II, uranium mining swept onto the Navajo Nation and settled within uranium-rich
regions including Arizona communities of Cove and Monument Valley, and New Mexico communities of
Sanostee and Church Rock. Tailing from the milling process were left abandoned in Shiprock, New
Mexico, Tuba City, Arizona, and Kayenta, Arizona.5 Decades later, increasing rates of lung cancer in this

6
generally non-smoking population was attributed to occupational exposure while working in the
uranium mines.5-7
A report covering years 1989-1993 revealed that the mortality for all cancers among AI/AN remained
lower compared to whites.8 Yet, mortality rates, a population comparative measure, for cancers of the
liver, stomach, kidney, and gallbladder were much higher than whites. AI/AN females also had
significantly higher mortality rates from cancer of the cervix than white females. In a report covering
years 1999-2004, incidence rates for all cancers among AI/AN, including the Navajo in the southwest
were lower than whites, while cancers of the stomach, liver, kidney, gallbladder, and cervix for females
were much higher.9
Today, cancer has become one of the leading cause of disease and death for the Navajo people. The
Indian Health Service estimated that 7.3 percent of all deaths in the Navajo Area Indian Health Service
region were due to cancer from 1999 to 2001.10 Clearly, the reality observed from the 1930s to 1950s is
much different than today. In this report, data from the Arizona Cancer Registry, New Mexico Tumor
Registry and Utah Cancer Registry were used to provide Navajo proxy cancer incidence and stage of
diagnosis. The cancer mortality data were provided by National Center for Health Statistics. These data
focus on contiguous Navajo Nation but excludes the three satellite communities of Ramah, Alamo, and
Tohajiilee in New Mexico (see map insert below). These satellite communities are served by the
Albuquerque Area Indian Health Service in New Mexico and were excluded because the Navajo Cancer
Workgroup did not have access to Albuquerque Area Indian Health Service Resource Patient
Management System (RPMS), a health care information system, for population estimate data.

7
Health Care on the Navajo Nation
The Navajo Nation is a large tribe in the United States (U.S.), both geographically and by population. It
spans into three states and with more than 300,000 enrolled individuals. The Navajo Nation spans over
27,000 square miles, bordering Arizona, Colorado, New Mexico, and Utah. Based on the U.S. 2010
Census, 332,129 individuals living in the U.S. claimed to have Navajo ancestry with approximately one-
half living on the Navajo Nation and the other half in border towns or metropolitan areas. The Navajo
population comprises approximately forty-eight percent male and fifty-two percent female, and a
median age of twenty-five years old, which is much younger when compared to the U.S. general
population of thirty-five years old.11,12
According to Navajo culture some Navajo people believe that the Holy People bestowed special
teachings upon them.11 These teachings tell how to live in balance with nature and all of Mother Earth’s
inhabitants; this balance is known as K’e. When out of balance, some people who follow the Navajo

8
tradition seek traditional healing from native healers or traditional practitioners for mental, spiritual,
and physical wellbeing. The practitioners specialize in specific areas for diagnosis and care that ranges
from diagnosticians such as hand tremblers and crystal gazers and individuals who perform healing
ceremonies involving herbs, balms and purgatives.11,13,14
Parallel to native healing is the western medicine system. The IHS, an agency within the U.S. Department
of Health and Human Services, is responsible for providing health care services to American Indians and
Alaska Natives. Within the Navajo Area IHS there are five hospitals, seven health centers, fifteen health
stations and twenty-two dental clinics, including five contract (or “638”) facilities that are administered
by Navajo organizations. These facilities are geographically divided into eight NAIHS service areas called
service units. The NAIHS primarily serves people from the Navajo Nation, the Southern Band of San Juan
Paiute, Hopi, and Zuni. Their services include inpatient care, ambulatory care, contract health, and
public health programs.15
A key provider of health, education, and prevention services is the Navajo Department of Health
(NDOH). In 1977, the NDOH was established within the Navajo government system to promote and
protect the overall health of the Navajo people by developing tribal health programs that focus on
health promotion and disease prevention. The NDOH programs include:
Breast and Cervical Cancer Prevention
Community Health Representatives
Public Health Nursing
Public Health Emergency Preparedness
Planning, Research and Evaluation
Aging
Diabetes
Behavioral Health
Food Distribution
Women, Infants and Children
Office of Navajo Uranium Workers
Environmental Health
New Dawn Program (horticulture)
Health Education
Food Access Navigation
Epidemiology Center
Disseminate
Navajo Cancer
Data Report Develop
Infrastructure
Empower and
Engage Our
Community Ensure Data
Quality

9
Navajo Cancer Workgroup
The Navajo Cancer Workgroup was formed in 1999 to support the efforts of Navajo Nation leaders to
improve cancer prevention and care by utilizing and improving cancer data. The workgroup aims to:
1) Evaluate and improve cancer data quality and monitoring;
2) Empower and engage communities around cancer prevention;
3) Support and improve Navajo Area health programs;
4) Produce Navajo-specific cancer report to inform and educate public health professionals,
medical providers, Navajo Nation health programs and local, state and federal agencies;
5) Produce Navajo-specific cancer report to inform tribal leaders and laypersons.
Representatives (listed below) from these organizations make up the Navajo Cancer Workgroup and are
recognized and commended for their contribution to this report:
Christine J. Benally Navajo Area Indian Health Service
Austin Dungan Utah Department of Health
Carol Goldtooth Partnership for Native American Cancer Prevention
Timothy Flood Arizona Cancer Registry
Melissa Jim Centers for Disease Control and Prevention
Linda Knedler Northern Navajo Medical Center
Angela Meisner New Mexico Tumor Registry
Chris Newton Arizona Cancer Registry
Dornell Pete Albuquerque Area Southwest Tribal Epidemiology Center
Priscilla Sanderson Northern Arizona University
Hannah Sehn Community Outreach and Patient Empowerment Project
Samuel Swift New Mexico Department of Health
Charles Wiggins New Mexico Tumor Registry
Del Yazzie Navajo Epidemiology Center
Hendrik Deheer Northern Arizona University
Sara Selig Brigham and Women’s Hospital, Community Outreach and Patient
Empowerment Project

10
We extend further appreciation to the following organizations for their contributions and support:
Arizona Department of Health Services
Dinè College
Navajo Area Indian Health Service
Navajo Nation Department of Health
Navajo Nation Human Research Review Board
New Mexico Department of Health
Northern Arizona University
University of New Mexico
University of Arizona
Utah Department of Health
Partnership for Native American Cancer Prevention
CANCER INCIDENCE
Cancer incidence refer to new cancers, a measure that informs us about the burden of cancer within a
population.
The terms cancer incidence and cancer incidence rate are often used interchangeably, however there is
a difference in definition. Cancer incidence (synonymous with incident number) is defined as the
number of new cancers of a specific site or type diagnosed in a specified period of time.
Cancer incidence rate is the number of new cancers of a specific site or type diagnosed in a specified
period of time among a defined population. In other words, it is the cancer incidence count divided by
the number of people in the entire population at risk. The numerator is the number of new cancers; the
denominator is the population size.
𝐼𝑛𝑐𝑖𝑑𝑒𝑛𝑐𝑒 𝑅𝑎𝑡𝑒 =𝑁𝑢𝑚𝑏𝑒𝑟 𝑜𝑓 𝑛𝑒𝑤 𝑐𝑎𝑛𝑐𝑒𝑟𝑠 𝑑𝑖𝑎𝑔𝑛𝑜𝑠𝑒𝑑
𝑃𝑜𝑝𝑢𝑙𝑎𝑡𝑖𝑜𝑛 𝑎𝑡 𝑟𝑖𝑠𝑘 × 100,000
In this report, the incidence rates were age-adjusted. It is known that older people are more likely to
have cancer than younger people and the age-distribution of different populations often differ. For
example, group A may tend to be older on average than group B because they are at higher risk simply
because they represent an older population. Therefore, to accurately compare rates of two populations
with differing age distributions, the age groups of one population needs to be weighted to the age
distribution of the comparison population. This technique is called age standardization. Age
standardization results in a weighted average of the age-specific rates. The standardization produces the
rate expected if the populations being compared had identical age distributions. In this report, the rates
were age standardized to the 2000 U.S. standard population.

11
Methodology
Population-based cancer incidence data were obtained from New Mexico Tumor Registry, Arizona
Cancer Registry and Utah Cancer Registry that jointly cover the geographic area of the Navajo Nation.
The New Mexico Tumor Registry and Utah Cancer Registry participate in the National Cancer Institute's
Surveillance, Epidemiology, and End Results (SEER) Program. The Arizona Cancer Registry participates in
the Center for Disease Control and Prevention’s National Program of Cancer Registries (NPCR). All three
state cancer registries met the same high standards for complete, accurate, and timely data collection.
Data from these registries are routinely linked with the Indian Health Service (IHS) patient records to
identify cases as Navajo. These data are used as numerators for the cancer incidence rate calculations.
Cancers were coded and classified according to International Classification of Diseases – Oncology (ICD-
1O).16 The site recode as defined by the National Cancer Institute’s Surveillance, Epidemiology, and End
Results (SEER) Program was used.17 Unless otherwise specified, all ages are included in the analyses.
The comparison group used in this report were non-Hispanic whites (NHW) living in CHSDA counties of
Arizona and New Mexico. We used county-level population estimates produced by the US Census
Bureau as denominators in the rate calculations. We calculated standardized rate ratios for Navajos
using NHW rates as comparisons (Appendix A). Differences in rates between Navajos and NHW were
determined to be statistically different by P-values <0.05.
Data Summary
Navajos are twenty-nine percent less likely to be diagnosed with all cancers than NHWs. Navajos
are also eighty-two percent less likely to be diagnosed with lung cancer, forty-five percent less
likely to be diagnosed with thyroid cancer, thirty-nine percent less likely to be diagnosed with
leukemia, and twenty-seven percent less likely to be diagnosed with non-Hodgkin lymphoma
than NHWs.
In contrast, Navajos are 3.5 times more likely to be diagnosed with stomach cancer, 2 times
more likely to be diagnosed with liver cancer, and 1.8 times more likely to be diagnosed with
kidney cancer than NHWs.
Navajo males were twenty-eight percent less likely to be diagnosed with all cancers than NHW
males.
o Prostate cancer was the most commonly diagnosed cancer among Navajo males,
followed by colorectal cancer, kidney cancer, and stomach cancer.
o Navajo males were seventy-five percent less likely to be diagnosed with lung cancer,
forty-eight percent less likely to be diagnosed with thyroid cancer, forty-one percent
less likely to be diagnosed with leukemia, thirty-seven percent less likely to be
diagnosed with non-Hodgkin lymphoma, and nineteen percent less likely to be
diagnosed with prostate cancer than Navajo males.
o Navajo males are 3.4 times more likely to be diagnosed with stomach cancer, 2 times
more likely to be diagnosed with kidney cancer, and 1.5 times more likely to be
diagnosed with liver cancer than NHW males.

12
Navajo females were twenty-eight percent less likely to be diagnosed with all cancers than NHW
females.
o Among Navajo females, breast cancer was the most commonly diagnosed cancer,
followed by colorectal cancer and uterine cancer, and kidney cancer.
o Navajo females were eighty-seven percent less likely to be diagnosed with lung cancer,
forty-eight less likely to be diagnosed with thyroid cancer, forty-six percent less likely to
be diagnosed with breast cancer, and thirty-two percent less likely to be diagnosed with
leukemia than NHW females.
o Navajo females were 4.2 times more likely to be diagnosed with stomach cancer, 3.5
times more likely to be diagnosed with liver cancer, and 1.7 times more likely to be
diagnosed with kidney cancer than NHWs.

13
Figure 1. From 2005-2013, the cancers with the highest incidence counts among the Navajo
were female breast, colon and rectum (colorectal), prostate, kidney and renal pelvis (kidney),
corpus and uterus, NOS (uterine), stomach, non-Hodgkin lymphoma, pancreas, thyroid, liver and
intrahepatic bile duct (liver), and lung and bronchus (lung).

14
Figure 2. The leading cancer incidence for Navajo compared to NHW of Arizona and New
Mexico, among males and females combined are shown above. Significantly lower incidence of
female breast (RR=0.54), prostate (RR=0.81), non-Hodgkin lymphoma (RR=0.73), thyroid
(RR=0.55), and lung cancers (RR=0.18) were observed among the Navajo than the NHW
comparison group. Significantly higher incidence of kidney (RR=1.84), stomach (RR=3.52), and
liver (RR=2.05) cancers were observed for the Navajo compared to NHW. The incidence of
colorectal, uterine, and pancreatic cancers were similar for both Navajos and NHWs.

15
Figure 3. The leading cancer incidence for Navajo males and how they compare to NHW males
of Arizona and New Mexico are shown above. Prostate cancer is the most commonly diagnosed
cancer among Navajo males. Compared to NHW males, Navajo males had significantly higher
incidence for kidney (RR=2.04), stomach (RR=3.38) and liver (RR=1.52) cancers. Navajo males
had significantly lower incidence for prostate (RR=0.81), non-Hodgkin lymphoma (RR=0.63), lung
(RR=0.25) and leukemia (RR=0.59) compared to NHW males. The incidence of colorectal,
pancreas, and myeloma cancers were similar for both Navajo and NHW males.

16
Figure 4. The leading cancer incidence for Navajo females compared to NHW females of Arizona
and New Mexico. Among Navajo females incidence of kidney (RR=1.69), stomach (RR=4.15), and
liver (RR=3.53) cancers were significantly higher than NHW females. For breast (RR=0.54) and
thyroid (RR=0.52) cancers the incidence were significantly lower compared to NHW females. The
incidence for colorectal, uterine, ovarian, non-Hodgkin lymphoma, and pancreatic cancers were
similar for both Navajo and NHW females.

17
STAGE OF DIAGNOSIS
Cancer staging describes the extent to which the patient’s cancer has spread. Doctors design a treatment
plan that is best for addressing a patient’s disease, and identify clinical trials that may be helpful based
on cancer staging. Staging can also be used to estimate a person’s prognosis or likely outcome from
cancer treatment.
Staging is based on knowledge of the way cancer develops. Cancer cells divide and grow without control
or order. They can break away from the primary site of growth and enter the bloodstream or lymphatic
system to form new tumors in other organs of the body. This spread of cancer is called metastasis. As
we learn more about cancer, different staging systems have evolved over time.
Staging systems that are used by doctors are generally more detailed and complex than are those used
by cancer registries. In this report, we used a cancer registry summary staging system that can be
expressed in the following categories:
In situ cancer that is present only in the layer of cells in which it began.
Localized cancer that is limited to the organ in which it began, without evidence of spread.
Regional cancer that has spread beyond the original (primary) growth site to nearing lymph
nodes or organs and tissues.
Distant cancer that has spread from the primary growth site to distant organs or distant lymph
nodes.
Unknown or Unstaged is used to describe cases for which there is not enough information to
indicate a stage.
Methodology
We examined derived summary stage 2000 cancer staging data obtained from the New Mexico Tumor
Registry (SEER), Arizona Cancer Registry (NPCR) and Utah Cancer Registry (SEER) for cases that were
diagnosed during the period 2005-2013.18
Data for NHW in Arizona and New Mexico are presented in this report for comparison. Cancer staging
data are presented in proportions – the number of cases diagnosed in a particular stage category divided
by the total cases diagnosed for that particular cancer. The categories of stages used were localized,
regional, distant, and unstaged or unknown. When looking at some cancer sites we limited them to
certain age groups corresponding to standard cancer screening recommendations by the U.S. Preventive
Services Task Force (USPSTF) and supported by CDC. For example, female breast cancer stage data was
limited to cases diagnosed in women 50 years of age and older because USPSTF recommends
mammography screening in average-risk women in this age group. Racial differences in stage were
tested using Chi-square statistics (Appendix B). Statistical significance was set at P<0.05.

18
Data Summary
Colorectal cancer cases among Navajo males and females were mostly diagnosed in the regional
stage whereas most cases were diagnosed in localized stage for non-Hispanic whites.
Among Navajo females over half of breast cancer cases were diagnosed in the local stage but
this proportion of early stage cancers was even higher among non-Hispanic white females.
Navajo females (52.9%) were less likely to be diagnosed at the local stage than non-Hispanic
white females (61.7%).
Cervical cancer cases among Navajo females were equally as likely to be diagnosed in the local
and regional stages and were similar to the proportions for non-Hispanic white females.

19
Figure 5. The percent distribution of stage for colorectal cancer is statistically different for Navajos and
NHWs. A slightly higher percentage (52.4%) of colorectal cancer cases were diagnosed in the regional
and distant stage among Navajo adults (ages 50+) compared to NHW of Arizona and New Mexico
(48.2%). Cancer diagnosed in the localized stage is easier to treat and has better survival than distant
cancer; however, fewer colorectal cancer cases were diagnosed at the local stage among Navajo adults
(31.3%) compared to NHW of Arizona and New Mexico (39.2%).
20
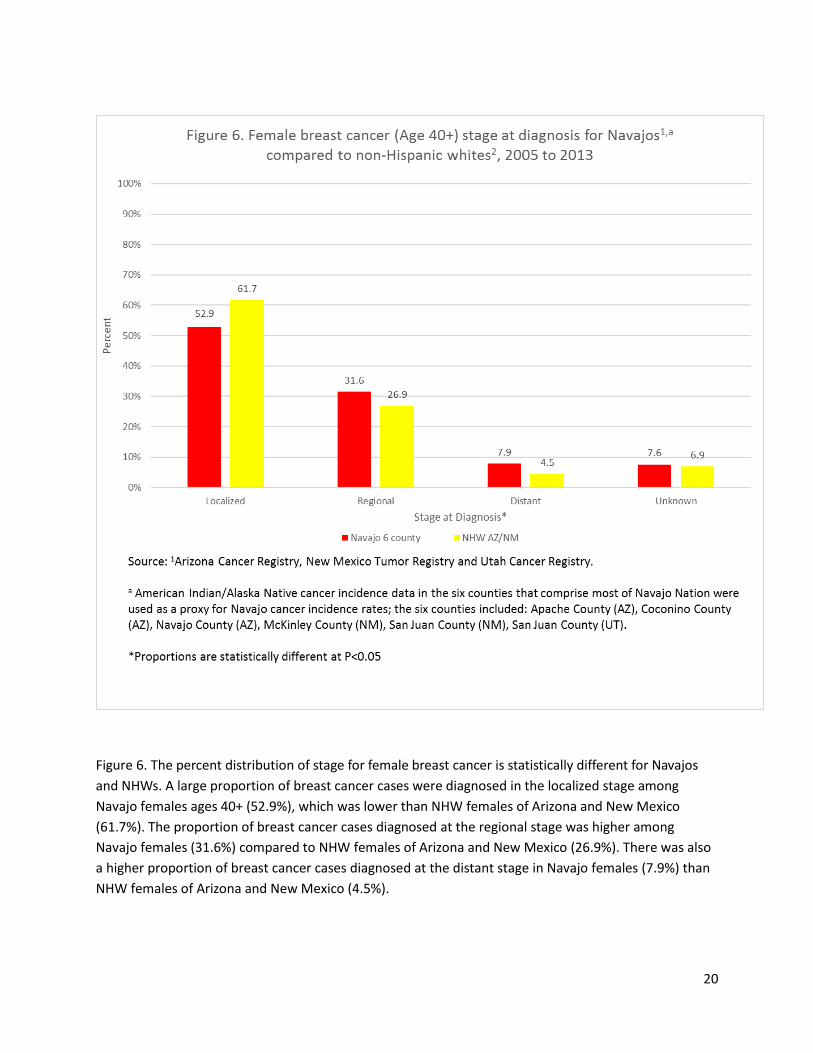
Figure 6. The percent distribution of stage for female breast cancer is statistically different for Navajos
and NHWs. A large proportion of breast cancer cases were diagnosed in the localized stage among
Navajo females ages 40+ (52.9%), which was lower than NHW females of Arizona and New Mexico
(61.7%). The proportion of breast cancer cases diagnosed at the regional stage was higher among
Navajo females (31.6%) compared to NHW females of Arizona and New Mexico (26.9%). There was also
a higher proportion of breast cancer cases diagnosed at the distant stage in Navajo females (7.9%) than
NHW females of Arizona and New Mexico (4.5%).

21
Figure 7. The percent distribution of stage for cervical cancer was not statistically different for Navajos
and NHWs. A large proportion of cervical cancer cases were diagnosed in the local and regional stage
among Navajo females (age 20+), which was 77.1 percent.

22
SCREENING
Cancer screening tests are designed to clinically test asymptomatic or symptomatic individuals that may
be at (average) risk for a particular type of cancer. The main purpose of screening is to detect cancers
early in their development and implement a treatment plan to improve survival outcome. This chapter
focuses on three common cancer screening tests – Papanicolaou (Pap) test for cervical cancer,
mammography for breast cancer, and fecal occult blood test, sigmoidoscopy, or colonoscopy for
colorectal cancer. The screening test for lung cancer was not available during the time period of this
report (2005-2013).
Methodology
Navajo-specific screening estimates were selected from the Navajo Area IHS Government Performance
and Results Act (GPRA) measures.19 The GPRA is a federal reporting system that evaluates the
performance of the healthcare system of the Navajo Area IHS by monitoring key health measurements
using data from the IHS Resource and Patient Management System (RPMS). Within the panel of IHS
GPRA health measures are the cancer screening measurements, which report annual screening rates for
pap test, mammogram, and colorectal screening. Pap test, mammography, and colorectal screening
rates have specific numerator and denominator definitions. In general, the numerators are the number
of patients with documented screening test and patients who refused the test in the past year of the
reporting period; and the denominators are the number of patients who were seen in the Navajo Area
IHS during the reporting period.
Another Navajo-specific screening measurement tool used was the Navajo Nation Health Survey (only
data from Chinle and Northern Agencies were available at the time of report), a Navajo-adapted version
of the CDC Behavioral Risk Factor Surveillance System (BRFSS).20 The CDC BRFSS is a well-established
telephone-based health survey that collects self-reported data on U.S. residents regarding their health-
related risk behaviors, chronic health conditions, and use of preventive services. Included in the survey
are questions about cancer screening related to Pap test, mammography, and colorectal screening tests.
Additionally, the AI/AN and NHW cancer screening estimates were collected from the BRFSS for the six
counties.
The Healthy People 2020 target measurement for screening was also used to show established
benchmarks for improving the health of all U.S. residents. The U.S. Department of Health and Human
Services provides the benchmarks for the U.S. with regard to health promotion and disease prevention.
Data Summary
Mammography screenings are lowest among the Navajo females in the IHS GPRA data, with
over half of Navajo females having a recommended mammogram. In contrast, a much higher
estimate (90 percent) of mammography screening was observed in Navajo females in the
Northern Agency survey.
Likewise, Pap screenings were observed to be the lowest for Navajo females in the IHS GPRA
data, with over half of Navajo females having a recommended Pap test. Regardless of the data

23
source, Navajo females have not met the Healthy People 2020 target percentages for
recommended Pap tests.
For colorectal screenings, Navajos report lower recommended colorectal screenings than the
non-Hispanic white population. In addition, colorectal screening estimates for Navajos are
below the recommended Health People target of 70.5 percent.
1 Pap test in the past 3 years for females age 24-64yrs, or Pap test in the past 3 years for females age 30-64; or either a
Pap test in the past 3 years and a HPV DNA documented in the past 5 years, includes active clinical patients in IHS
facilities only (Chinle, Crownpoint, Gallup, Kayenta, and Shiprock). Mammography among females aged 50-74;
Colorectal cancer screening among adults aged 50 to 75 years; https://www.healthypeople.gov/2020/topics-
objectives/topic/cancer. Note: Tuba City, Utah Navajo Health Systems, and Sage Memorial Hospital do not participate in
GPRA reporting.
2 As above including tribal facilities (Fort Defiance and Winslow).
3 Navajo-adapted version (Navajo language translation) of the Centers for Disease Control and Prevention Behavioral Risk
Factor Surveillance System; http://www.cdc.gov/brfss/index.html. Pap test in the past 3 years for females age 24-64yrs,
or Pap test in the past 3 years for females age 30-64; Mammography among females aged 50-74; Colorectal cancer
screening among adults aged 50 to 75 years; https://www.healthypeople.gov/2020/topics-objectives/topic/cancer.
4 Pap test in the past 3 years for females age 21-65yrs, and without hysterectomy; Mammography in past 2 years for
females age 50-74yrs; Fecal occult blood or endoscopy in past 5 years, age 50-74yrs; includes any AI/AN in the 6 counties
of Arizona (Apache, Coconino, Navajo), Utah (San Juan), and New Mexico (San Juan and McKinley). Note: weighted
percentages.
5 Pap test among females aged 21-65 years; Mammography among females aged 50-74; Colorectal cancer screening
among adults aged 50 to 75 years; https://www.healthypeople.gov/2020/topics-objectives/topic/cancer.
N/A= Not Available
TABLE 1: Cancer screening prevalence for Navajo, American Indians/Alaska Natives, and non-Hispanic white adults from
multiple data sources.
Data Source Year Mammography Papanicolaou (Pap) Test Colorectal
Percent (%) Percent (%) Percent (%)
Navajo Area IHS GPRA1 2015 52.0 53.5 35.7
Area-Wide GPRA (federal & tribal)1,2 2015 52.2 54.3 34.6
Navajo Nation Health Survey3 Chinle Agency Northern Agency
2013 2015
70.6 90.3
64.7 76.5
20.8 44.1
AI/AN in six counties, BRFSS4 2006, 2008, 2010 75.2 83.6 32.4
Non-Hispanic white in six Counties, BRFSS3
2006, 2008, 2010 78.4
86.2
57.4
Healthy People 2020 Target5 N/A 81.1 93.0 70.5

24
52.254.3
34.6
70.6
64.7
20.8
90.3
76.5
44.1
78.4
86.2
57.4
81.1
93.0
70.5
0
10
20
30
40
50
60
70
80
90
100
Mammography Papanicolaou (Pap) Test Colorectal
Pe
rce
nt
Figure 8. Cancer screening prevalence for Navajo and non-Hispanic whites
Navajo Area-Wide GPRA(Federal & Tribal), 2015
Navajo Nation HealthSurvey, Chinle Agency,2013
Navajo Nation HealthSurvey, Northern Agency,2015
Non-Hispanic White in 6counties, BRFSS, 2006-2010
Healthy People 2020Target

25
MORTALITY
Cancer mortality rates measure, at the population level, either the risk of dying from a specific type of
cancer or from all cancers. These rates are important indicators of the burden of cancer, and are the
preferred measure for evaluating secondary prevention programs. Reduction in cancer mortality is the
standard measure for evaluating cancer control efforts.21
The definition of cancer mortality rate is the number of persons dying during a specified period over in a
specified population. The cancer mortality rate is expressed as cancer deaths per 100,000 population.
𝑀𝑜𝑟𝑡𝑎𝑙𝑖𝑡𝑦 𝑅𝑎𝑡𝑒 =𝑁𝑢𝑚𝑏𝑒𝑟 𝑜𝑓 𝑐𝑎𝑛𝑐𝑒𝑟 𝑑𝑒𝑎𝑡ℎ𝑠
𝑃𝑜𝑝𝑢𝑙𝑎𝑡𝑖𝑜𝑛 𝑎𝑡 𝑟𝑖𝑠𝑘 × 100,000
Given that the AI/AN population was younger than the U.S. NHW population, and for reasons of
comparability with recent analyses and publications, mortality rates presented in this report have been
age-adjusted by the direct method (or age standardization) with the U.S. 2000 standard population.
Methodology
The AI/AN vital events data were collected from data furnished by National Centers for Health Statistics
(NCHS) to the IHS. NCHS obtains birth and death records for all U.S. residents from the state health
departments on the basis of information reported on official state birth and death certificates. The
records received from NCHS by IHS do not contain names, addresses, tribal identity, or medical record
identification numbers. Each vital record includes the single underlying cause of death and this is
determined by following a standard criteria and data listed on the death certificate. The records also
contain county of residence, which allowed selection of deaths of residents in the six counties that
comprise the Navajo Nation.12 For this report we examined only those AI/AN deaths for which the
underlying cause of death was cancer, as determined by International Classification of Diseases, (ICD-10)
codes. The cause of death recode as defined by the National Cancer Institute’s Surveillance,
Epidemiology, and End Results (SEER) Program was used.22 These data were used as numerators in the
cancer mortality rate calculations.
The AI/AN population counts (i.e., the denominator in the mortality rate calculations) were based on
2000 U.S. Census Bureau county population estimates. During the decennial census, the U.S. Census
Bureau counts those persons who identify themselves as AI/AN.
The Arizona and New Mexico NHW mortality and population data were derived from the National
Cancer Institute’s SEER database.23 We calculated standardized rate ratios for Navajos using NHW rates
as comparisons (Appendix C). P-values were also calculated and were used to determine whether rate
differences between Navajos and NHW were statistically different. Statistical significance was set at
P<0.05.

26
Data Summary
The most common causes of cancer deaths (by counts) among the Navajo were from colon and
rectum (colorectal) cancer, followed by stomach, pancreas, female breast, liver and intrahepatic
bile duct (liver), prostate, kidney and renal pelvis (kidney), lung and bronchus (lung), ovary, and
gallbladder cancers (Figure 9).
o Navajos are eighty-five percent less likely to pass away from lung cancer and thirty-nine
percent less likely to pass away from female breast cancer than non-Hispanic whites.
o Navajos are 7.2 times more likely to pass away from gallbladder cancer, 4.4 times more
likely to pass away from stomach cancer, 2.1 times more likely to pass away from kidney
cancer, and 1.8 times more likely to pass away from liver cancer than non-Hispanic
whites.
Among Navajo males the leading causes of death from cancer were from prostate cancer,
followed by stomach, colorectal, pancreas, kidney, liver, lung, lymphoma, esophageal, leukemia,
and gallbladder cancers (Figure 11).
o Navajo males are eighty-three percent less likely to pass away from lung cancer, fifty-
nine percent less likely to pass away from leukemia, forty-eight less likely to pass away
from esophageal cancer, and forty-three percent less likely to pass away from
lymphoma cancer than non-Hispanic white males.
o Navajo males are 7.3 times more likely to pass away from gallbladder cancer, 4.9 times
more likely to pass away from stomach cancer, and 2.1 times more likely to pass away
from kidney cancer than non-Hispanic white males.
Among Navajo females the leading causes of death from cancer were from breast cancer
followed by colorectal, ovary, pancreas, liver, stomach, kidney, lung, lymphoma, and gallbladder
cancers (Figure 12).
o Navajo females are eighty-seven percent less likely to pass away from lung cancer and
thirty-nine percent less likely to pass away from breast cancer than non-Hispanic white
females.
o Navajo females are 6.8 times more likely to pass away from gallbladder cancer, 4.1
times more likely to pass away from stomach cancer, 2.3 times more likely to pass away
from liver cancer, and 2.2 times more likely to pass away from kidney cancer than non-
Hispanic white females.

27
Figure 9. The most common causes of cancer deaths (by counts) among the Navajo were from colorectal
cancer, followed by stomach, pancreas, female breast, liver, prostate, kidney, lung, ovarian, and
gallbladder cancers.
192
150
138
124
123
121
110
96
87
43
0 50 100 150 200 250
Colorectal
Stomach
Pancreas
Female Breast
Liver
Prostate
Kidney
Lung
Ovary
Gallbladder
Can
cer
sit
e
Figure 9. Leading causes of death by cancer site among the
Navajo1,a , counts of deaths 2005-2013, all ages
Source: 1Mortality data provided by National Center for Health Statistics.
a American Indian/Alaska Native cancer mortality data in the six counties that comprise most of Navajo Nation were used as a proxy for Navajo cancer mortality rates; the six counties included: Apache County (AZ), Coconino County (AZ), Navajo County (AZ), McKinley County (NM), San Juan County (NM), San Juan County (UT).

28
Figure 10. Death rates from cancers of the stomach (RR=4.41), liver (RR=1.78), kidney (RR=2.06), and
gallbladder (7.19) were significantly higher among the Navajos compared to NHWs. Conversely, death
rates of female breast (RR=0.61) and lung (RR=0.15) cancers among the Navajo were significantly lower
than NHW. Navajo cancer death rates of colorectal, pancreas, prostate, and ovary cancers were similar
to NHWs.
12
.2
9.8
9.3
13
.1
8.1
23
.3
7.2
6.4
9.4
2.9
14
.0
2.2
9.9
21
.3
4.6
20
.0
3.5
42
.5
8.0
0.4
Colorectal Stomach* Pancreas FemaleBreast*
Liver* Prostate Kidney* Lung* Ovary Gallbladder*
Rat
e p
er 1
00
,00
0
Figure 10. Age-adjusted cancer mortality rates1,a among the Navajo in Arizonab, New Mexico, and Utah by cancer site and ethnicity,
2005-2013, males and females combined, all ages
Navajo six counties non-Hispanic white AZ/NM
Source: 1Mortality data provided by National Center for Health Statistics.
a Rates are per 100,000 persons and are age-adjusted to the 2000 U.S. standard population.
b American Indian/Alaska Native cancer mortality data in the six counties that comprise most of Navajo Nation were used as a proxy for Navajo cancer mortality rates; the six counties included: Apache County (AZ), Coconino County (AZ), Navajo County (AZ), McKinley County (NM), San Juan County (NM), San Juan County (UT).
*Rates are statistically different at p-value <0.05

29
Figure 11. For Navajo males the mortality rates for gallbladder (RR=6.41), stomach (RR=4.89), liver
(RR=1.53), and kidney (RR=2.05) cancer were significantly higher compared to NHW males. Significantly
lower mortality rates for Navajo males were observed for lung (RR=0.17), lymphoma (RR=0.57),
esophageal (RR=0.52), and leukemia (RR=0.41) cancers than NHW males. No differences were seen
between Navajos and NHWs for prostate, colorectal, and pancreatic cancers.

30
Figure 12. Compared to NHW females, Navajo females had significantly lower mortality rates for breast
(RR=0.61) and lung (RR=0.13) cancers. Significantly higher mortality rates among Navajo females were
observed for gallbladder (RR=7.49), stomach (RR=4.10), liver (RR=2.35), and kidney (RR=2.22) cancer.
Lymphoma and colorectal, ovarian, and pancreatic cancer mortality rates were similar for both Navajo
and NHW females.
13
.1
10
.8
9.4
7.6
7.0
6.5
5.1
4.8
3.8
3.4
21
.3
11
.9
8.0 8.5
3.0
1.6 2.3
35
.9
4.9
0.5
0.0
5.0
10.0
15.0
20.0
25.0
30.0
35.0
40.0
Breast* Colorectal Ovary Pancreas Liver* Stomach* Kidney* Lung* Lymphoma Gallbladder*
Dea
ths
per
10
0,0
00
per
son
s
Cancer site
Figure 12. Age-adjusted cancer mortality ratesa among the Navajob
females in Arizona, New Mexico, and Utah by cancer site and ethnicity, 2005-2013, females only, all ages
Navajo six counties non-Hispanic white AZ/NM
Source: 1Mortality data provided by National Center for Health Statistics.
a Rates are per 100,000 persons and are age-adjusted to the 2000 U.S. standard population.
b American Indian/Alaska Native cancer mortality data in the six counties that comprise most of Navajo Nation were used as a proxy for Navajo cancer mortality rates; the six counties included: Apache County (AZ), Coconino County (AZ), Navajo County (AZ), McKinley County (NM), San Juan County (NM), San Juan County (UT).
*Rates are statistically different at p-value <0.05
31
DISCUSSION
As the leading cause of death among Navajo females, and the second leading cause of death regardless
of sex,24 cancer is a major public health concern for the Navajo Nation. This report “Cancer Among the
Navajo, 2005-2013,” includes the latest information on cancer epidemiology for Navajo residents of the
Navajo Nation served by the Navajo Area IHS. This report used data from New Mexico Tumor Registry,
Arizona Cancer Registry and Utah Cancer Registry.
To inform and educate the Navajo Nation. By better understanding the occurrence and patterns of
cancer among Navajos, the Navajo Nation will be better positioned to develop solutions, interventions
and relevant research.
The Navajo people have different patterns of cancer incidence, stage at diagnosis, screening rates and
cancer mortality, when compared to NHW populations in these areas. They also appear to have
different cancer screening prevalence.
Incidence
The three cancers with the highest incidence rates among the Navajo Nation were cancers of the
prostate, female breast, and colon and rectum. In comparison to NHW, Navajo Nation residents had
more than 3 times higher incidence rates of stomach cancer and almost double the incidence rates of
liver and kidney cancer, but lower incidence rates of non-Hodgkin lymphoma, leukemia, thyroid, and
lung cancers.
The three cancers with the highest incidence rates among Navajo males were prostate, kidney, and
colorectal. Compared with NHW males, Navajo males had higher incidence rates of stomach, kidney,
and liver cancer and lower incidence rates of prostate cancer, non-Hodgkin lymphoma, leukemia, and
lung cancers.
For Navajo females, breast cancer was the most commonly diagnosed cancer, followed by colorectal,
uterine, and kidney cancer. Compared with NHW females, Navajo females had higher incidence rate of
stomach, liver, and kidney cancer and lower incidence rates of breast and thyroid cancers.
Stage at Diagnosis
The stage at diagnosis data tell us that there is an opportunity to address cancer through increased
screening among Navajo Nation residents, especially for colorectal cancer and cervical cancer which
were most commonly diagnosed in the regional stage. Breast cancer was commonly diagnosed in the
localized stage. In comparison with NHW females, Navajo females had higher proportions of later-stage
diagnosis of cervical cancer and breast cancer.
Screening
The available sources of cancer screening data suggest that cancer screening among the Navajo is low,
particularly for colorectal cancer. However, there are substantial differences for breast cancer screening
based on data sources, with Navajo Area IHS GPRA suggesting much lower rates than the Navajo Nation

32
Health Survey and BRFSS data. The BRFSS data suggests that NHW females receive mammography and
pap test screenings at almost the same rates as AI/AN females in the six counties included, although
colorectal cancer screening rates are much lower (57.4 percent NHW vs. 32.4 percent AI/AN). Notably,
within the Navajo Nation Health survey, screening rates for mammography, pap test and colorectal
cancer screening were 12-25 percent lower in the Chinle Agency compared to the Northern Agency.
Further, comprehensive and culturally appropriate education and awareness around screening and
additional research to identify barriers to cancer screening in different regions are needed.
Mortality
According to the mortality data presented in this report, the cancers with the highest mortality rates
among the Navajo were colorectal, stomach, pancreas, and female breast cancer. In comparison with
NHW, Navajo had much higher mortality rates for cancers of the stomach (more than four times higher
mortality rate per 100,000 people), liver (double the mortality rate), kidney (double the mortality rate),
gallbladder (more than 7 times higher mortality rate) and lower rates for female breast and lung cancer.
Among Navajo males, mortality from prostate, colorectal, and stomach cancer were most common. And,
among Navajo females’ mortality from breast, colorectal, and ovarian cancer were most common.
Potential causes associated with findings
While the focus of this report was to report cancer data incidence, stage of diagnosis, screening, and
mortality, the findings have to be evaluated in the context of the area. As mentioned, it is notable that
this report (consistent with other reports8.9) found elevated rates of stomach, kidney, liver and
gallbladder cancers. Potential environmental (for example, heavy metals in the environment),
behavioral (for example, substance abuse), or genetic risk factors may be associated with the higher
rates. For example, exposure to arsenic in drinking water has been associated with higher risk of liver,
kidney and bladder cancers,25 and one study that tested wells on the Navajo Nation found elevated
uranium, arsenic and bicarbonate concentrations in several wells used for drinking water.26
Other driving factors could potentially include diet27 and physical inactivity,28 which are influenced by
both behavioral and environmental factors. For example, lack of availability of nutritious foods may lead
to eating unhealthy foods, large portion meals, consuming red meat and processed food, preparing food
under intense heat, and not eating enough fruits and vegetables. Similarly, safety concerns discourage
physical activity and include the lack of or not properly maintained sidewalks and street lights, bicycle
paths, drinking fountains, walkways, and parks. These issues may be particularly relevant for vulnerable
populations such as children, youth, women, pregnant women, elderly and individuals with disabilities
living in rural and remote areas of the Navajo Nation. Further research into these exposures may lead to
greater insight into potential underlying causes and inform prevention efforts.

33
Changes from the ‘1995-2004 Cancer Among the Navajo’ to the current report
Interpretation of any comparisons between the ‘Cancer Among the Navajo 1995-2004’ report in
incidence, stage of diagnosis and mortality have to be interpreted with caution, given the use of
different data, methodologies and population numbers used in the reports.
Of the most commonly diagnosed cancers among the Navajo, age adjusted incidence rates were
higher in 2005-2013 data for male prostate cancer (85.0 vs. 59.1 per 100,000 in 1995-2004),
female breast cancer (64.4 vs 44.7), and combined male and female colorectal cancer (32.7 vs.
18.2) and kidney cancers (25.6 vs. 14.1).
Modest increases (7 percent) in patients being diagnosed in the localized stage of colorectal
cancer (males and females combined) were reported.
Screening rates for mammography and colorectal cancer appear to have improved from 1995-
2004, particularly in the Navajo Nation Health Survey Northern Agency and BRFSS reports.
However, the data is based on different sources.
Mortality rates are very similar to 1995-2004, both in overall mortality rates (overall 121.8 vs.
124.6 per 100,000 in 1995-2004) and in cancer specific mortality. Rates of stomach, kidney and
liver cancer remain higher than NHW populations.
Data Limitations
Several limitations should be considered when interpreting the results presented in this report including
racial misclassifications, migration and limited capture of all Navajo data.29,30
Cancer incidence, mortality and stage of diagnosis data was limited to Navajos residing in the six county
regions and captured in the New Mexico Tumor Registry, Arizona Cancer Registry and Utah Cancer
Registry. Therefore, the report excluded Navajos who resided outside the six county regions.
Tuba City Regional Health Care Corporation, Utah Navajo Health System, Inc., and Sage Memorial
Hospital do not participate in GPRA reporting therefore Navajos seeking cancer screenings in the clinical
facilities are not captured in the GPRA reporting.
Data presented focus on the contiguous Navajo Nation, excluding the three Navajo satellite
communities of Ramah, Alamo and Tohajiilee in New Mexico. They are non-contiguous with the larger
Navajo Nation land base. These satellite communities are served by the Albuquerque Area Indian Health
Service were excluded because the Navajo Cancer Workgroup did not have access to the Albuquerque
Area IHS RPMS.
At the time of data analysis, Navajo-specific cancer incidence and mortality data were not available. The
cancer incidence and mortality rates among AI/AN who resided in a six county region that comprised the
Navajo Nation were used to serve as a proxy for estimating the Navajo cancer incidence and mortality
rates. Navajos residing in these six counties represent about eighty percent of the total AI/AN
population in these counties.

34
Racial misclassification is a common issue regarding AI/AN cancer data, which leads to underestimation
of the true burden of cancer.31 To decrease misclassification, cancer registry data were linked with IHS
data. Some cases with race coded as AI/AN were not able to be linked to IHS data while many cases
which are not coded as AI/AN were able to be linked to IHS data and are reclassified as AI/AN. However,
such data linkage did not completely resolve all misclassification issues. This method of correcting
misclassification did not address AI/AN who did not receive health care within IHS.
RECOMMENDATIONS
Using cancer data from the Arizona Cancer Registry (NPCR), New Mexico Tumor Registry (SEER), Utah
Cancer Registry (SEER), NCHS Vital Statistics Data, and Navajo Nation Health Survey, the Navajo Cancer
Workgroup was able to identify the leading cancers that impact the health of the Navajo people. The
data showed differences in cancer burden between the Navajo and NHW of Arizona and New Mexico
and also indicated that both Navajo males and females have different cancer experiences.
In view of these results, the following recommendations constitute a framework that public health
professionals, healthcare providers, and communities can use to reduce the cancer burden of the
Navajo people:
1. Expand collaboration among Navajo tribal health programs, Navajo Senior Centers, Indian
Health Service, and tribally operated facilities and local communities in order to translate these
data into targeted and culturally appropriate cancer prevention and intervention programs.
2. Continue meaningful partnership with state cancer registries to further utilize and improve
population-based cancer surveillance data and maintain on-going surveillance of cancer among
the Navajo. This should include continued efforts to improve racial classification of individuals in
a variety of health and surveillance data systems.
3. Promote research that examines risk factors for many of these cancers, potential causes behind
later diagnoses for screenable cancers, and research on culturally appropriate and effective
approaches to improve screening.
4. Promote research on possible causes of cancers that have higher incidence and mortality
among Navajo compared to NHW populations (stomach, kidney, and liver cancer), and
approaches to promote early detection and treatment in these populations.
5. In the context of regional variations in screening rates, increase targeted and culturally
appropriate education and awareness, screening and prevention among those geographic areas
within the Navajo Nation with the lowest screening rates and highest incidence and mortality
rates.
6. Increase education and training for health care providers regarding current cancer screening
practices and guidelines. Offer Continuing Medical Education (CME) for medical health care
professionals.

35
RESOURCES
American Cancer Society
www.cancer.org
Arizona Cancer Registry, Arizona Department of Health Services
www.azdhs.gov/phs/phstats/acr/index.htm
Cancer Control P.L.A.N.E.T.
Cancercontrolplanet.cancer.gov
Centers for Disease Control and Prevention (CDC) Cancer Prevention and Control
www.cdc.gov/cancer
Community Outreach and Patient Empowerment (COPE) Project
www.copeprogram.org
Indian Health Service
www.ihs.gov/epi/index.cfm?module=epi_cancer_main
National Cancer Institute
www.cancer.gov
Native American Cancer Prevention – Northern Arizona University and University of Arizona
Tel: 928-523-8593
Nau.edu/NACP
Native American Cancer Research
natamcancer.org/index.html
Navajo Epidemiology Center
Tel: (928) 871-6359
www.nec.navajo-nsn.gov
Navajo Nation Breast and Cervical Cancer Screening Program
Tel: (928) 871-6348
www.nndoh.org/bccp
New Mexico Cancer Center, Gallup, NM
Tel: 505-726-2400
www.nmcancercenter.org/about/locations/gallup

36
New Mexico Department of Health
nmhealth.org
New Mexico Tumor Registry
Nmtrweb.unm.edu
San Juan Regional Cancer Center
Tel: (505) 609-6259
www.ourcancercenter.com
Tribal Epidemiology Centers
Tribalepicenters.org
University of New Mexico Comprehensive Cancer Center
cancer.unm.edu
University of Utah, Huntsman Cancer Institute
www.huntsmancancer.org
DEFINITIONS
Term Definition
RPMS The Resource and Patient Management System (RPMS) is a decentralized
automated information system of over 50 integrated software applications.
RPMS software modules fall into three major categories: clinical,
administrative, and infrastructure applications.
GPRA Government Performance Results Act mandates federal measures to monitor
the performance of federal agencies according to specific health and
treatment guidelines. Meeting these target measures demonstrates the
effectiveness of the federal agency to comply with identified strategic and
annual performance goals.
Derived Summary
Stage 2000
Derived Summary Stage 2000 is a one-digit code which summarizes the stage
of disease at time of initial diagnosis and/or treatment that is derived from
Collaborative Stage. The derived stage codes are ideally suited for data
analysis because of the consistency that can be obtained with objectively-
recorded, identically-processed data items.
37
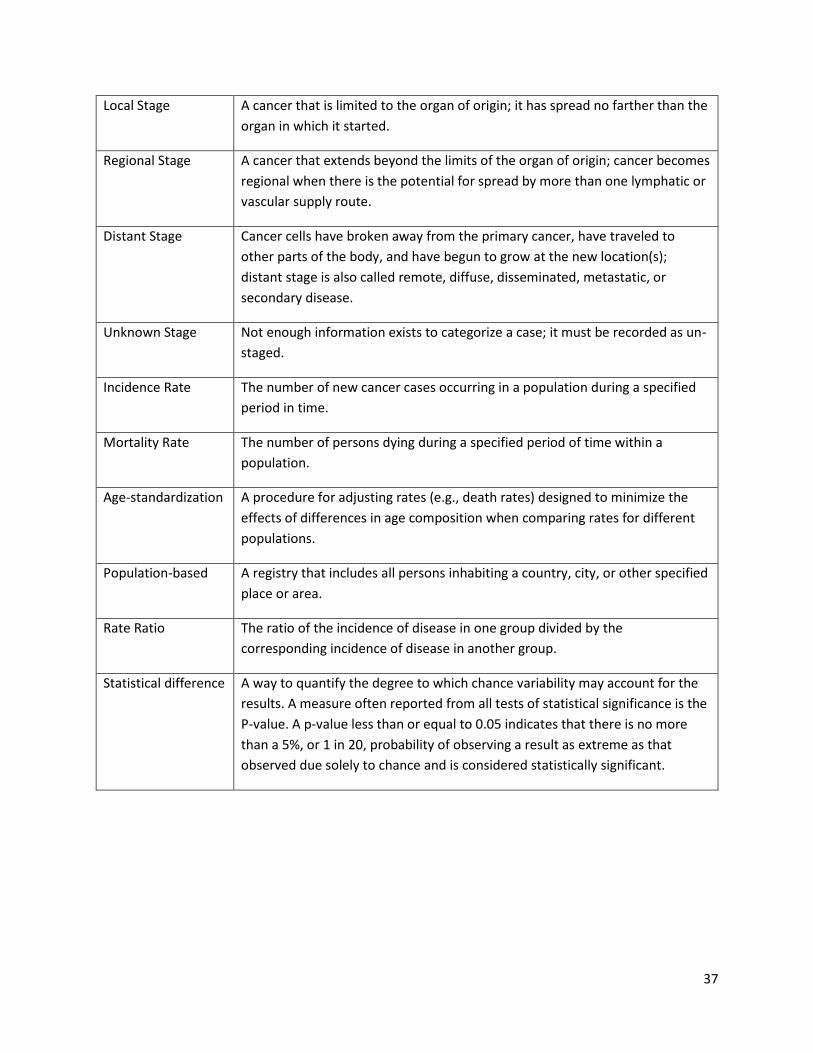
Local Stage A cancer that is limited to the organ of origin; it has spread no farther than the
organ in which it started.
Regional Stage A cancer that extends beyond the limits of the organ of origin; cancer becomes
regional when there is the potential for spread by more than one lymphatic or
vascular supply route.
Distant Stage Cancer cells have broken away from the primary cancer, have traveled to
other parts of the body, and have begun to grow at the new location(s);
distant stage is also called remote, diffuse, disseminated, metastatic, or
secondary disease.
Unknown Stage Not enough information exists to categorize a case; it must be recorded as un-
staged.
Incidence Rate The number of new cancer cases occurring in a population during a specified
period in time.
Mortality Rate The number of persons dying during a specified period of time within a
population.
Age-standardization A procedure for adjusting rates (e.g., death rates) designed to minimize the
effects of differences in age composition when comparing rates for different
populations.
Population-based A registry that includes all persons inhabiting a country, city, or other specified
place or area.
Rate Ratio The ratio of the incidence of disease in one group divided by the
corresponding incidence of disease in another group.
Statistical difference A way to quantify the degree to which chance variability may account for the
results. A measure often reported from all tests of statistical significance is the
P-value. A p-value less than or equal to 0.05 indicates that there is no more
than a 5%, or 1 in 20, probability of observing a result as extreme as that
observed due solely to chance and is considered statistically significant.

38
REFERENCES
1. Lee, BJ. The Incidence of Cancer among the Indians in the Southwest. Surgery, Gynecology and
Obstetrics. 50: 196-199, 1930.
2. Palmer, EP. Cancer among the Indians of the United States, with an Analysis of Cancer in Arizona.
Southwestern Medicine 22 (December): 483-487, 1938.
3. Smith, RL, C.G. Salsbury, A.G. Gilliam. Recorded and expected mortality among the Navajo, with
special reference to cancer. Journal of National Cancer Institute. 1956, July; 17(1): 77-89.
4. Salsbury, C.G., MD. Cancer Immunity in the Navajo. Arizona Medicine. Vol. 13, No. 8, 309-310, 1956.
5. Brugge, D. and R. Goble. The History of Uranium Mining and the Navajo People. American Journal of
Public Health. September 2002, Vol. 92, No. 9.
6. Samet, JM et al. Uranium mining and lung cancer in Navajo men. New England Journal of Medicine.
1984; 310: 1481-1484.
7. Gilliland, FD et al. Uranium mining and lung cancer among Navajo men in New Mexico and Arizona,
1969-1993. Journal of Occupational Environmental Medicine. 2000; 42: 278-283.
8. Cobb, N. and R.E. Paisano. Patterns of Cancer Mortality among Native Americans. Cancer.
December, 1998: Vol 83, No. 11: 2377-2383.
9. Wiggins CL, et al. “Cancer Among American Indians and Alaska Natives in the United States, 1999-
2004.” Cancer, 2008; 113(4): 1142-52.
10. “Regional Differences in Indian Health 2002-2003”. U.S. Department of Health and Human Services,
Indian Health Service, Office of Public Health, Division of Community and Environmental Health
Program Statistics Team.
11. Choudhary, T. Comprehensive Economic Development Strategy of the Navajo Nation. Division of
Economic Development of the Navajo Nation. 2008.
12. Benally, CJ et al. 2005 Navajo Community Health Status Assessment. Navajo Area Indian Health
Service, Office of Program Planning and Evaluation. 2005.
13. Kim, C. and S. Kwok. Navajo Use of Native Healers. Arch Intern Medicine. November 9, 1998. Vol.
158: 2245-2249.
14. Sadner, D. Navajo Symbols of Healing. Orlando, Fla: Harcourt Brace & Co; 1979.
15. Navajo Area Indian Health Service Website.
http://www.ihs.gov/Navajo/index.cfm?module=nao_about.
16. Fritz, A., et al. 2000; International classification of diseases of oncology, Third Edition. Geneva,
Switzerland, World Health Organization.
17. Available on-line at the following URL: https://seer.cancer.gov/siterecode/ (last accessed on March
10, 2017).
18. Young JL Jr, Roffers SD, Ries LAG, Fritz AG, Hurlbut AA (eds). SEER Summary Staging Manual - 2000:
Codes and Coding Instructions, National Cancer Institute, NIH Pub. No. 01-4969, Bethesda, MD,
2001.
19. https://www.ihs.gov/crs/gprareporting/
20. http://www.cdc.gov/brfss/index.html
21. Adami, H., D. Hunter, and D. Trichopoulos. Textbook of Cancer Epidemiology. Oxford University
Press, New York, NY. 2002.

39
22. Available on-line at the following URL: https://seer.cancer.gov/codrecode/ (last accessed on March
10, 2017).
23. National Cancer Institute. Surveillance, Epidemiology, and End Results (SEER) Program. Statistical
Resources. U.S. Population Data 1969-2004. Available at: http://seer.cancer.gov/resources.
24. Navajo Epidemiology Center. Navajo Nation Mortality Report, 2006-2009: Arizona & New Mexico
Data. Available at: http://www.nec.navajo-
nsn.gov/Portals/0/Reports/Vital%20Statistics%20Report%202006%20to%202009%20FINAL.pdf
25. Smith AH, Hopenhayn-Rich C, Bates MN, Goeden HM, Hertz-Picciotto I, Duggan HM, Wood R,
Kosnett MJ, Smith MT. Cancer risks from arsenic in drinking water. Environmental health
perspectives. 1992 Jul; 97:259.
26. Salinas S, Ingram J. Uranium and arsenic characterization of well water and sediment in Black Falls,
Arizona. Proceedings of the American Association for Cancer Research, 2005. 65(9):515.
27. Steinmetz KA, Potter JD. Vegetables, fruit, and cancer prevention: a review. Journal of the American
Dietetic Association. 1996;31;96(10):1027-39.
28. Moore SC, Lee IM, Weiderpass E, Campbell PT, Sampson JN, Kitahara CM, Keadle SK, Arem H, de
Gonzalez AB, Hartge P, Adami HO. Association of leisure-time physical activity with risk of 26 types
of cancer in 1.44 million adults. JAMA internal medicine. 2016;176(6):816-25.
29. Espey, D., et al. (2008). "Methods for improving cancer surveillance data in American Indian and
Alaska Native populations." Cancer 113(5 suppl): 1120-1130.
30. Espey, D. K., et al. (2014). "Methods for improving the quality and completeness of mortality data
for American Indians and Alaska Natives." Am J Public Health 104 Suppl 3: S286-294.
31. Jim, M. A., et al. (2014). "Racial misclassification of American Indians and Alaska Natives by Indian
Health Service Contract Health Service Delivery Area." Am J Public Health 104 Suppl 3: S295-302.

40
Appendix A
Cancer incidence rates and rate ratios for the top cancers among Navajos compared to NHWs, CHSDA,
2005-2013, All Ages
Navajo (6-county) AZ & NM NHW Navajo: AZ & NM NHW
Site Rate 95% CI Count Rate 95% CI Count Rate Ratio 95% CI P-value
Males and Females
All Sites* 291.31 278.63-304.38 2,131 409.31 407.58-411.04
228,166 0.71* 0.68-0.74 0.00
Colon and Rectum
32.72 28.62-37.21 245 35.72 35.22-36.22 20,264 0.92 0.80-1.04 0.19
Kidney and Renal Pelvis*
25.62 21.98-29.66 189 13.96 13.64-14.29 7,718 1.84* 1.57-2.13 0.00
Stomach* 14.96 12.02-18.34 95 4.25 4.08-4.43 2,420 3.52* 2.81-4.33 0.00
Non-Hodgkin Lymphoma*
12.02 9.58-14.86 90 16.53 16.19-16.89 9,101 0.73* 0.58-0.90 0.00
Pancreas 12.62 9.98-15.69 83 10.87 10.61-11.15 6,365 1.16 0.92-1.45 0.22
Thyroid* 8.46 6.55-10.73 70 15.46 15.08-15.84 6,918 0.55* 0.42-0.70 0.00
Liver* 9.91 7.59-12.67 65 4.84 4.66-5.03 2,818 2.05* 1.56-2.63 0.00
Lung and Bronchus*
10.44 7.99-13.33 65 56.60 55.99-57.22 33,358 0.18* 0.14-0.24 0.00
Leukemia* 6.70 5.06-8.71 62 10.99 10.70-11.29 5,863 0.61* 0.46-0.79 0.00
Myeloma* 6.60 4.80-8.81 47 4.48 4.31-4.66 2,612 1.47* 1.07-1.97 0.02
Males
All Sites* 318.57 297.60-340.51 971 443.55 440.97-446.14
118,136 0.72* 0.67-0.77 0.00
Prostate* 84.95 73.77-97.19 226 104.59 103.39-105.80
29,774 0.81* 0.70-0.93 0.00
Colon and Rectum
37.73 31.24-45.10 131 40.52 39.74-41.31 10,655 0.93 0.77-1.11 0.46
Kidney and Renal Pelvis*
37.78 30.88-45.66 118 18.49 17.96-19.03 4,854 2.04* 1.67-2.48 0.00
Stomach* 20.70 15.34-27.15 55 6.12 5.82-6.43 1,615 3.38* 2.49-4.46 0.00
Non-Hodgkin Lymphoma*
12.43 8.69-17.14 41 19.66 19.10-20.22 5,016 0.63* 0.44-0.87 0.00
Lung and Bronchus*
15.94 11.20-21.80 40 63.64 62.69-64.61 17,351 0.25* 0.18-0.34 0.00
Pancreas 13.39 9.24-18.59 37 12.38 11.95-12.81 3,350 1.08 0.75-1.51 0.70
Leukemia* 8.09 5.31-11.76 32 13.78 13.31-14.26 3,437 0.59* 0.38-0.85 0.00
Liver* 11.30 7.56-16.09 32 7.44 7.11-7.77 2,043 1.52* 1.01-2.17 0.04
Myeloma 8.05 5.03-12.09 24 5.55 5.27-5.85 1,484 1.45 0.90-2.19 0.12
Thyroid* 3.88 2.19-6.40 16 7.39 7.03-7.76 1,729 0.53* 0.30-0.87 0.01
Females
All Sites* 277.48 261.41-294.24 1,160 383.92 381.55-386.31
110,030 0.72* 0.68-0.77 0.00

41
Appendix B
Cancer stage at diagnosis for Navajo and NHWs in Arizona and New Mexico, 2005-2013, All Ages
Group Local Regional Distant Unknown P-value
Colorectal cancer (50+ years)
Navajo* 121 31.3% 128 33.2% 74 19.2% 63 16.3% 0.0083
AZ & NM NHW 7,377 39.2% 5,884 31.3% 3,169 16.9% 2,372 12.6%
Female breast cancer (40+ years)
Navajo* 280 52.9% 167 31.6% 42 7.9% 40 7.6% 0.0000
AZ & NM NHW 20,094 61.7% 8,754 26.9% 1,454 4.5% 2,252 6.9%
Cervical cancer (20+ years)
Navajo 25 35.7% 29 41.4% 8 11.4% 8 11.4% 0.3751
AZ & NM NHW 609 44.5% 436 31.8% 170 12.4% 154 11.2%
Appendix C
Death rates and rate ratios for the leading cancer causes of death among Navajos compared to NHWs,
All Ages, CHSDA, 2005-2013
Navajo (6-county) AZ & NM NHW Navajo: AZ & NM NHW
COD Rate 95% CI Count Rate 95% CI Count Rate Ratio 95% CI P-
value
Males and Females
All cancers 121.8 116.2-127.6 1,883 157.3 156.3-158.4 91,206 0.77 0.7383-0.8112 0.0000
CRC 12.2 10.5-14.1 192 14.0 13.7-14.3 8,081 0.87 0.7482-1.0081 0.0648
Stomach* 9.8 8.3-11.6 150 2.2 2.1-2.4 1,269 4.41* 3.678-5.2364 0.0000
Breast* 64.44 57.04-72.52 282 118.69 117.37-120.03
33,586 0.54* 0.48-0.61 0.00
Colon and Rectum
28.25 23.21-34.01 114 31.46 30.81-32.12 9,609 0.9 0.74-1.08 0.27
Uterus 21.63 17.50-26.43 97 20.49 19.95-21.03 6,060 1.06 0.85-1.29 0.63
Kidney and Renal Pelvis*
16.79 13.04-21.25 71 9.93 9.55-10.32 2,864 1.69* 1.31-2.15 0.00
Ovary 15.54 11.96-19.82 66 12.01 11.59-12.44 3,437 1.29 0.99-1.66 0.06
Thyroid* 12.23 9.15-16.00 54 23.49 22.82-24.18 5,189 0.52* 0.39-0.68 0.00
Non-Hodgkin Lymphoma
11.76 8.63-15.61 49 13.79 13.35-14.24 4,085 0.85 0.62-1.13 0.30
Pancreas 12.12 8.82-16.18 46 9.53 9.19-9.88 3,015 1.27 0.92-1.70 0.14
Stomach* 10.99 7.80-14.96 40 2.65 2.46-2.84 805 4.15* 2.92-5.70 0.00
Liver* 8.85 6.05-12.43 33 2.51 2.33-2.70 775 3.53* 2.39-5.00 0.00
Leukemia* 5.84 3.88-8.45 30 8.64 8.28-9.01 2,426 0.68* 0.45-0.98 0.04
Lung and Bronchus*
6.71 4.31-9.89 25 50.86 50.07-51.67 16,007 0.13* 0.08-0.19 0.00
Myeloma 5.59 3.51-8.41 23 3.57 3.36-3.79 1,128 1.56 0.98-2.36 0.06

42
Pancreas 9.3 7.8-11.0 138 9.9 9.6-10.2 5,839 0.94 0.7869-1.1174 0.5164
Female Breast* 13.1 10.8-15.6 124 21.3 20.7-21.8 6,467 0.61* 0.5088-0.7350 0.0000
Liver* 8.1 6.7-9.7 123 4.6 4.4-4.7 2,668 1.78* 1.4644-2.1337 0.0000
Prostate 23.3 19.2-27.8 121 20.0 19.5-20.6 5,045 1.16 0.9578-1.3936 0.1267
Kidney* 7.2 5.9-8.7 110 3.5 3.3-3.6 2,033 2.06* 1.6761-2.5034 0.0000
Lung* 6.4 5.2-7.9 96 42.5 42.0-43.0 25,090 0.15* 0.1217-0.1850 0.0000
Ovary 9.4 7.5-11.6 87 8.0 7.7-8.3 2,485 1.17 0.9327-1.4555 0.1716
Gallbladder* 2.9 2.1-3.9 43 0.4 0.4-0.5 239 7.19* 5.0214-9.9867 0.0000
Males
All cancers 142.4 132.8-152.4 908 186.1 184.5-187.8 49,042 0.76 0.7130-0.8191 0.0000
Prostate 23.3 19.2-27.8 121 20 19.5-20.6 5,045 1.16 0.9578-1.3936 0.1267
CRC 13.8 11.1-16.9 98 16.4 15.9-16.9 4,277 0.84 0.6728-1.0343 0.1040
Stomach* 14.8 11.8-18.2 93 3 2.8-3.2 779 4.89* 3.854-6.1011 0.0000
Pancreas 11.7 9.1-14.8 73 11.4 11.0-11.9 3,088 1.03 0.7926-1.2988 0.8755
Kidney* 10.1 7.7-12.9 67 4.9 4.6-5.2 1,308 2.05* 1.5601-2.6431 0.0000
Liver* 9.7 7.3-12.4 61 6.3 6.0-6.6 1,722 1.53* 1.1489-1.9765 0.0039
Lung* 8.8 6.5-11.5 54 50.6 49.7-51.4 13,690 0.17* 0.1287-0.2278 0.0000
Lymphoma* 4.5 3.0-6.4 33 7.9 7.6-8.3 2,029 0.57* 0.3839-0.8141 0.0011
Leukemia* 3.6 2.3-5.3 29 8.7 8.4-9.1 2,222 0.41* 0.2665-0.6065 0.0000
Esophageal* 3.9 2.5-5.8 26 7.5 7.2-7.9 2,054 0.52* 0.3337-0.7721 0.0005
Gallbladder* 2.2 1.1-3.8 13 0.3 0.3-0.4 93 6.41* 3.1894-11.4260 0.0000
Females
All cancers 108.8 102.0-116.0 975 134.9 133.6-136.2 42,164 0.8069 0.7557-0.8605 0.0000
Breast* 13.1 10.8-15.6 124 21.3 20.7-21.8 6,467 0.61* 0.5088-0.7350 0.0000
Colorectal 10.8 8.7-13.3 94 11.9 11.5-12.3 3,804 0.91 0.7311-1.1169 0.3894
Ovary 9.4 7.5-11.6 87 8.0 7.7-8.3 2,485 1.17 0.9327-1.4555 0.1716
Pancreas 7.6 5.9-9.7 65 8.5 8.2-8.9 2,751 0.90 0.6865-1.1442 0.4047
Liver* 7.0 5.4-9.0 62 3.0 2.8-3.2 946 2.35* 1.7822-3.0477 0.0000
Stomach* 6.5 4.9-8.4 57 1.6 1.4-1.7 490 4.10* 3.0403-5.4045 0.0000
Kidney* 5.1 3.6-6.8 43 2.3 2.1-2.5 725 2.22* 1.5864-3.0232 0.0000
Lung* 4.8 3.4-6.5 42 35.9 35.2-36.6 11,400 0.13* 0.0953-0.1800 0.0000
Lymphoma 3.8 2.6-5.3 33 4.9 4.7-5.2 1,570 0.77 0.5235-1.0805 0.1395
Gallbladder* 3.4 2.3-4.9 30 0.5 0.4-0.5 146 7.49* 4.8254-11.1545 0.0000

43
CONTACT INFORMATION
Navajo Epidemiology Center, Navajo Department of Health, Navajo Nation
Window Rock Boulevard, Administration Building #2, Window Rock, AZ 86515
Telephone: (928) 871-6539
Email: [email protected]
Website: http://www.nec.navajo-nsn.gov
ACKNOWLEDGEMENTS
1. This report was supported by the Indian Health Service, Division of Epidemiology and Disease
Prevention, Grant #U1B1IHS0011-12-00.
2. This publication was support by a Small Community Grant from the Partnership for Native
American Cancer Prevention (NACP) Outreach Core (#2U54CA143924/#2U54CA143925) from
the National Cancer Institute (NCI).