Embed Size (px)
Citation preview

CANBERRA SECONDARY SCHOOL
2015 Preliminary Examination 2
Secondary Four (Normal Academic)
COMBINED HUMANITIES 11 August 2015
Geography Elective (2194/02) 1 hour 40 minutes 10.30 – 12.10
Name: ______________________________________ ( ) Class: ________
MARKING SCHEME
Section A
Answer either Question 1 or Question 2 from this section.
1 A group of students recorded the temperature and relative humidity in different parts of their school. The data is recorded in Table 1 below.
Site A B C D E
Average temperature
(00C)
29.5
30
31
24
33
Average relative humidity
(%)
68.9
73.5
71
70
71.2
Site where the data
was taken
Classroom
(ground floor)
School garden
(shaded)
School field
School foyer
Basketball
court
Table 1
The hypothesis that the students wanted to test was “the higher the temperature, the lower the relative humidity”.
(a) Identify the two instruments used to collect the data on Table 1. [2]
Thermometer and sling psychrometer
(b) Explain the precautions the students had to take to ensure that the instrument to measure temperature is used correctly.
[3]
Do not hold the glass bulb when measuring the temperature. You will measuring your body temperature instead.
Do not put it too close to your body as your body heat might affect the temperature.
Hold at least 1m above the ground to prevent the heat from the ground
2
____________________________________________________________________________________________________________ Canberra Secondary School Geography Elective (2194/02) 2015 Preliminary Examinations 2 Secondary Four Normal Academic
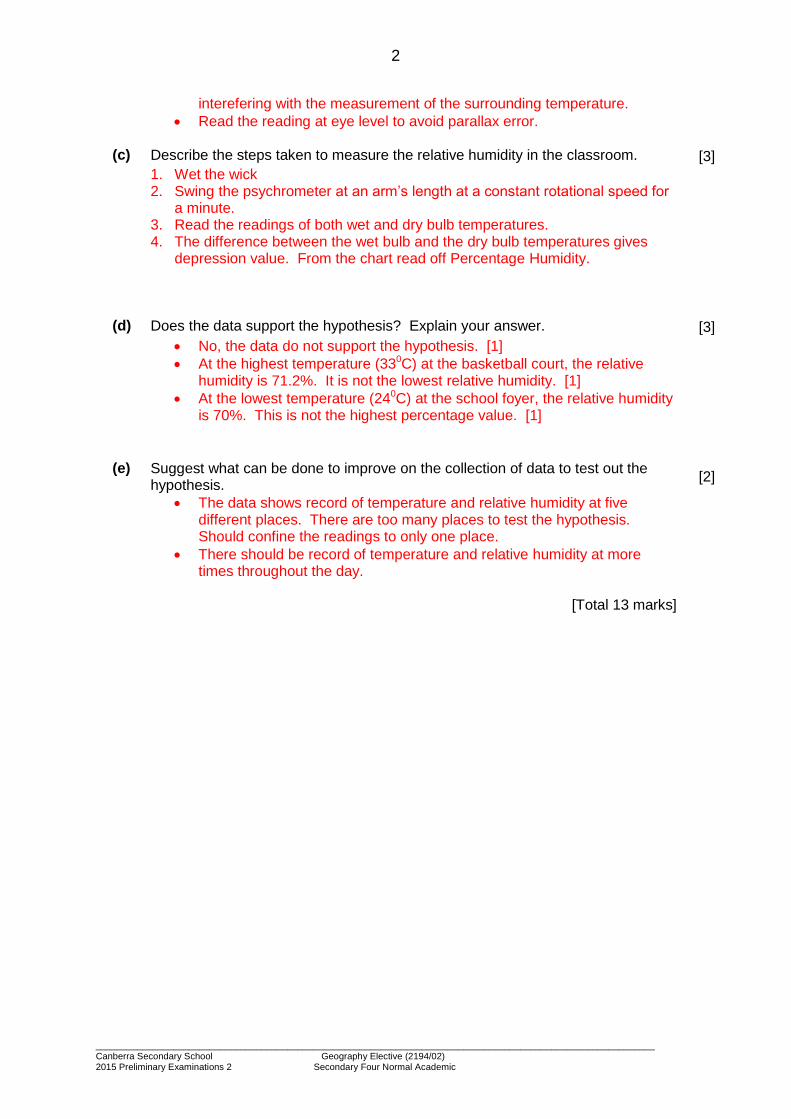
interefering with the measurement of the surrounding temperature.
Read the reading at eye level to avoid parallax error.
(c) Describe the steps taken to measure the relative humidity in the classroom. [3]
1. Wet the wick 2. Swing the psychrometer at an arm’s length at a constant rotational speed for
a minute. 3. Read the readings of both wet and dry bulb temperatures. 4. The difference between the wet bulb and the dry bulb temperatures gives
depression value. From the chart read off Percentage Humidity.
(d) Does the data support the hypothesis? Explain your answer. [3]
No, the data do not support the hypothesis. [1]
At the highest temperature (330C) at the basketball court, the relative humidity is 71.2%. It is not the lowest relative humidity. [1]
At the lowest temperature (240C) at the school foyer, the relative humidity is 70%. This is not the highest percentage value. [1]
(e) Suggest what can be done to improve on the collection of data to test out the hypothesis.
[2]
The data shows record of temperature and relative humidity at five different places. There are too many places to test the hypothesis. Should confine the readings to only one place.
There should be record of temperature and relative humidity at more times throughout the day.
[Total 13 marks]

3
____________________________________________________________________________________________________________ Canberra Secondary School Geography Elective (2194/02) 2015 Preliminary Examinations 2 Secondary Four Normal Academic
2 A group of students did a survey on the tourists and tourist activities in Chinatown. The students interviewed 50 tourists using a questionnaire. They wanted to test out the hypothesis that “The tourists that visit Chinatown are mainly Europeans”. The findings are recorded in Table 2.
1. Which region do you come from?
Asia North America
South America
Europe Africa
15
9
5
13
8
2. How many days are you staying in Singapore?
1 – 2 days 3 – 4 days 5 – 6 days 7 days
15 25 8 2
3. Which age group do you belong to?
0 - 20 21 - 30 31 - 40 41 - 50 51 and above
4 15 18 8 5
4. What do you like about Chinatown?
The food 18
The culture 11
The people 8
The shopping 13
Table 2
(a) How far does the data collected support the hypothesis? Give evidence from
data collected. [2]
The data collected do not support the hypothesis.
This is because there are more Asians who visit Chinatown (15 Asians) compared to the Europeans (13 Europeans)

4
____________________________________________________________________________________________________________ Canberra Secondary School Geography Elective (2194/02) 2015 Preliminary Examinations 2 Secondary Four Normal Academic
(b) The students interviewed the tourists in their data collection. What are some advantages and disadvantages of using such a method of data collection?
[4]
Advantages
The data collected will be up-to-date and obtained from the primary source [1]
The interviews can be conducted quickly and easily [1] Disadvantages
The data collected may not be accurate as the tourists may not give truthful answers. [1]
Interviews may not be able to obtain certain information like how the tourists feel about the place (feelings) [1]
(c) The students decided to use a pie chart to represent their data on the age groups of the tourists interviewed. Fig. 1 shows the pie chart done.
Fig. 1
(i) Fill in the missing information in the box on Fig. 1
(ii) Describe the steps taken to draw the pie chart.
[1]
[4] 1) Convert the number of tourists into a percentage.
2) Using the percentage, find the angle needed for the slice in a pie chart. To do so, multiply the percentage of the variable by 3.6.
3) Repeat steps 1 and 2 to find out the angles for all the other age groups 4) Draw a circle. Use a protractor to draw the sector for the variable with the
largest angle. Begin at 12 o’clock and move in a clockwise direction.
(d) One of the questions the tourists were asked was what they liked about Chinatown. Suggest what the students can do to ensure that the answers they obtain are accurate and reliable.
[2]
The tourists may not be truthful with their answers. Check that the tourist is willing to do the interview before proceeding.
Be polite when doing the interview
0-12 8%
21-30 30%
31-40 36%
41-50 16%
above 50 10%
Age Groups of Tourists to Chinatown

5
____________________________________________________________________________________________________________ Canberra Secondary School Geography Elective (2194/02) 2015 Preliminary Examinations 2 Secondary Four Normal Academic
The students must not pass comments or make faces at the responses. Accept any plausible answer.
[Total 13 marks]
Section B
Answer Question 3 from this section.
3 Study Fig. 2, which shows the number of visitors to a national park in England.
Fig. 2
(a) Using Fig. 2, describe the number of visitors to the park in a year. [3]
There are visitors to the park all year round..
The more popular months are from May to September, more than 600 thousand visitors every month.
August has the most number of visitors. (1200 thousand)
The less popular months are from November to February, less than 200 thousand.
Any plausible answer
110 220
300 320
750 650
900
1200
820
450
180 160
0
200
400
600
800
1000
1200
1400
Nu
mb
er o
f v
isit
ors
(th
ou
san
ds)

6
____________________________________________________________________________________________________________ Canberra Secondary School Geography Elective (2194/02) 2015 Preliminary Examinations 2 Secondary Four Normal Academic
(b) Study Fig. 3, which shows the complaints of visitors to the national park.
Fig. 3
Using Fig. 3, state the top three problems encountered by the visitors to the national park.
[3]
Most of the complaints were about overcrowding in the park. (23%) The next highest number was about traffic congestion (21%) 16% of the visitors also complained that the park was too touristy.
(c) “Tourism has brought about more benefits than problems to local community”. How far do you agree with this statement?
[6]
Economic Benefits Employment opportunities Growth in income Increase in foreign exchange Infrastructure development Problems: Seasonal unemployment Underuse of facilities Shortage of services Social-cultural Benefits: Preservation of culture and local customs Problems: Dilution of culture and local customs Increased crime Environmental Benefits: Conservation of natural environments Problems

7
____________________________________________________________________________________________________________ Canberra Secondary School Geography Elective (2194/02) 2015 Preliminary Examinations 2 Secondary Four Normal Academic
Increased congestion Vandalism Pollution and littering Destruction of habitats Increased carbon footprint
Level 1 (0-2m)
At this level, answers are general or have minimal support, if any stand was given at all.
Reasoning is weak and expression may be unclear.
Answers are basic with little development.
Level 2 (3-4m)
Positive or negative is supported by appropriate detail
Positive and negative are considered, but support is patchy and answers are not complete
Good reasoning and logic in parts of the answer with good expression in places
Level 3 (5-6m)
At this level, answers are comprehensive and supported by sound knowledge.
Both positive and negative are considered and well-supported.
Reasoning is clear and logical with good expression of language.
[Total 12 marks]

8
____________________________________________________________________________________________________________ Canberra Secondary School Geography Elective (2194/02) 2015 Preliminary Examinations 2 Secondary Four Normal Academic
Section C
Answer either Question 4 or Question 5 from this section.
4 Study Fig. 4, which shows the natural disasters around the world.
Fig. 4
(a) Identify the hazards that are tectonic-related. [3]
Tsunami, volcanic eruption and landslide [1x3]
(b) Study Fig. 5 (insert), which shows the world map and the crustal plate boundaries.
(i) With reference to Fig. 5, what are convergent plate boundaries and give two examples of where they can be found.
[3]
Convergent plate boundaries are edges of the crustal plates which move towards each other and become faulted, folded and sometimes subducted. [1] They are found along the north of the Pacific Plate and the North American Plate [1] And between the Philippine Plate and the Eurasian Plate [1]
Year Location Type Notes
2004 Indian Ocean Tsunami The second most powerful ever recorded killed nearly 200,000 people
1928 Mt Etna, Italy Volcano The eruption destroyed the entire town of Mascali.
1974 Cyclone Tracy, Darwin, Australia
Hurricane A category 4 storm destroyed 70% of the city of Darwin.
1931 Huang He River, China
Flood The most deadly natural disaster of the 20th
century killed an estimated 1 to 4 million people.
2006 Philippines Landslide A small earthquake caused a mudslide on the island of Leyte.
1999 Moore, Oklahoma Tornado Wind speeds of 512 kph severely damaged the city.

9
____________________________________________________________________________________________________________ Canberra Secondary School Geography Elective (2194/02) 2015 Preliminary Examinations 2 Secondary Four Normal Academic
(ii) With the help of a well-labelled diagram, name and describe the formation of the landform circled and labelled A in Fig.5.
[5]
Landform A is a range of fold mountains, the Himalayas [1]
This convergent plate boundary is where the Indo-Australian / Indian Plate moves towards the Eurasian Plate. [1]
It results in the Indian Plate subducting under the Eurasian Plate, pushing the Eurasian Plate up and creating a range fold mountains. [1]
Fold mountains occur when the layers of rocks are compressed. [1]
Under immense pressure, the rocks buckle and fold and are pushed to great heights. [1]
1m for drawing, 1m for labels 3m for explanation
(c) Study Fig. 6 which shows a cross-section of the Earth.
Fig. 6
Fold mountains

10
____________________________________________________________________________________________________________ Canberra Secondary School Geography Elective (2194/02) 2015 Preliminary Examinations 2 Secondary Four Normal Academic
On Fig. 6, draw arrows to show the movement of convection currents in the earth’s interior. Explain how convection currents formed in the earth’s interior cause sea-floor spreading.
[4]
Material in the mantle is heated up by the core, causing the mantle material to expand, rise and spread out beneath the plates. [1]
This causes the plates to be dragged along and to move away from each other. [1]
Then the hot mantle material cools slightly and sinks, pulling the plates along. [1]
The molten material heats up again as it enters the core and the whole process repeats. [1]
Im for set of two arrows. No mark for only one arrow. 3m for explanation.
(d) Study Fig. 7a and 7b. Fig. 7a shows an extract of a news article of the volcanic eruption of Mount Sinabung, Indonesia in October 2014. Fig. 7b shows Mount Sinabung’s eruption from a distance.
Fig. 7a Fig. 7b
October 2014. Indonesian Volcano Mount Sinabung spews out rivers of molten lava and giant plumes of ash as it continues to erupt for a fourth successive day. Indonesian authorities said the flow of ash and molten rock has now reached four and half kilometers down the slope and is threatening nearby populated villages. The ash clouds have reached three kilometers to the sky. The latest series of eruptions which began on October 5, spewed out pyroclasts and viscous lava flows from the summit vent, forcing hundreds of people to leave their homes. But despite volcanos being notoriously hard to predict, it is difficult to keep the people living on the slopes of the mountain away. http://www.dailymail.co.uk/news/article-2787764/Rock-awe-Indonesian-volcano-Mount-Sinabung-spews-lava-ash-continues-erupt-fourth-successive-day.html

11
____________________________________________________________________________________________________________ Canberra Secondary School Geography Elective (2194/02) 2015 Preliminary Examinations 2 Secondary Four Normal Academic
With reference to Fig 7a and 7b, what type of a volcano is Mount Sinabung? Give evidence to support your answer.
[4]
Mount Sinabung is a stratovolcano. [1] Evidence:
Fig 7a says Mount Sinabung “spews out molten lava and giant plumes”. This shows that it is a stratovolcano because stratovolcanoes erupt with explosions and huge plumes which can be seen kilometres around. [1]
Fig 7a shows the volcano has huge ash clouds. This shows that it is a stratovolcano because of the ash and rocks it spews out. They quickly solidify and form layers of fertile volcanic soils on the slopes of the mountain. [1]
Fig. 7b shows a picture of a mountain with steep sides. The shape is steeper at the top and gentler at the base. Stratovolcanoes have highly viscous lava which solidifies quickly. Hence stratovolcanoes have steep sides. [1]
1m for name 3m for point with evidence.
(e) “There are more risks than benefits for people living in active volcanic regions.” With reference to examples you have studied, explain to what extent you would agree with this statement.
[6]
Risks
Threat of tsunamis
Destruction by volcanic materials: volcanic bombs, pyroclastic flow, hot ashes and gases, pollution
Fire, Landslides
Destruction of properties, infrastructure
Loss of lives Benefits
Fertile volcanic soil
Precious stones and minerals, building materials
Tourism
Geothermal energy
Level 1 (0-2m)
At this level, answers are general or have minimal support, if any stand was given at all.
Reasoning is weak and expression may be unclear.
Answers are basic with little development.
Level 2 (3-4m)
Positive or negative is supported by appropriate detail
Positive and negative are considered, but support is patchy and answers are not complete
Good reasoning and logic in parts of the answer with good expression in places
Level 3 (5-6m)
At this level, answers are comprehensive and supported by sound knowledge.
Both positive and negative are considered and well-supported.

12
____________________________________________________________________________________________________________ Canberra Secondary School Geography Elective (2194/02) 2015 Preliminary Examinations 2 Secondary Four Normal Academic
Reasoning is clear and logical with good expression of language.
Total 25 marks]
5 Study Fig. 8 which shows a climograph of Mangalore, India.
Fig. 8
(a) (i) Identify the climatic zone represented the climograph above. Describe the characteristics of this type of climate.
[3]
The climograph shows tropical monsoon climate. [1] Characteristics
High mean annual temperatures of about 300C
Mean monthly temperature is around 300C
Annual temperature range is about 60C
Distinct wet and dry season.
Concentrated rainfall in the summer (between June and September)
Average of 2000 mm of rainfall during wet season between June and September. Average of 750 mm of rainfall between Oct and May.
1m for identifying climatic zone 3m for characteristics
(ii) Mangalore is a city located on the western coast of India. Account for the unusually high amount of rainfall in the middle of the year.
[3]
The unusually high amount of rainfall in the middle of the year is due to the

13
____________________________________________________________________________________________________________ Canberra Secondary School Geography Elective (2194/02) 2015 Preliminary Examinations 2 Secondary Four Normal Academic
Southwest monsoon. [1]
During summer (between June - August, there is an area of low pressure in continental Asia and an area of high pressure in Australia. [1]
Air moves from places with high pressure to places with low pressure [1]
Thus the southwest monsoon that develops brings heavy rainfall to western part of India.
(b) With the help of a well-labelled diagram, explain the formation of convectional rainfall.
[5]
The sun’s energy reaches the earth.
The earth’s surface is heated by the sun’s energy. This in turn heats up the surrounding air.
Air expands and rises.
As the air rises, it cools. Air reaches dew point temperature and condensation occurs.
Cumulonimbus clouds are often formed.
When the water droplets become large and
heavy enough, they fall to the ground as rain.
2m for diagram/s with labels 3m for explanation
(c) Explain how human activities can lead to enhanced greenhouse effect. [4]
Through human activities like burning fossil fuels to produce power for industries and homes, more carbon dioxide has been added to the atmosphere.
In industrialisation, humans have added more carbon dioxide into the atmosphere through the manufacture of goods. The by-products also contributed to the greenhouse gases..
In agriculture, the growing of food crops, especially rice, and the rearing of

14
____________________________________________________________________________________________________________ Canberra Secondary School Geography Elective (2194/02) 2015 Preliminary Examinations 2 Secondary Four Normal Academic
cattle has significantly added more greenhouse gases.
Through the process of urbanisation more land is acquired to provide homes and infrastructure to the growing population. This also increases the amount of carbon dioxide and other greenhouse gases into the atmosphere.
(d) Study Fig. 9, which shows the weather elements that can affect the spread of insect-borne diseases. With reference to Fig. 9, explain how climate change can affect the spread of insect-borne diseases.
[4]
Climate change results in increased temperatures and rainfall and mosquitoes thrive in these favourable conditions [1]
An increase in temperature will encourage the expansion of mosquito population. [1]
Regions with moderate temperatures, such as Europe and North America, are facing these diseases once confined to the tropics.
Dengue fever areas were also extended to cooler areas of Nepal and Bhutan. [1]
An increase in temperature will also encourage an increase in the feeding rate of mosqitoes, hence the spread of malaria and dengue fever [1]
An increase in rainfall will result in an expansion of breeding sites and the population size of mosquitoes. [1]
Mosquitoes have a higher chance of survival due to the increased humidity [1] Any 4 points
(e) Discuss the successes and limitations of Singapore’s response to climate change. Give examples to support your answer.
[6]
SINGAPORE GREEN PLAN 2012 Description:
Launched by Ministry of Environment in 2002
Aims to generate 60% of Singapore’s energy needs using natural gas by 2012
Cleaner form of energy than coal Successes: In 2010, about 79% of Singapore’s electricity generated from natural gas Exceeded the ministry’s target Limitations: Natural gas requires complex treatment plants to process and pipelines to transport High maintenance cost 2. GREEN MARK SCHEME: CONSTRUCTING ‘GREEN’ BUILDINGS Description: Launched by Building Construction Authority (BCA) Allows buildings to be evaluated and certified according to energy-efficiency and environmental friendliness E.g. Buildings that run partly on solar energy

15
____________________________________________________________________________________________________________ Canberra Secondary School Geography Elective (2194/02) 2015 Preliminary Examinations 2 Secondary Four Normal Academic
Successes: Cuts down GHG emissions by reducing use of fossil fuels E.g. Plaza by the Park, National Library Building have energy savings of 15 % to 35 % Limitations: Singapore companies tend to be conservative about new ideas Cost more to build as ‘green’ materials like bamboo or recycled metal are more expensive PLANT-A-TREE Programme Description: Started in 1971 Started by the Garden City fund and Singapore Environment Council to maintain Singapore’s status as a Garden City Residents donate money to buy a tree or take part in tree planting events Successes: Contributed to about 60,000 trees planted yearly throughout Singapore by Nparks Trees are the green lungs of the environment = remove CO2 from the atmosphere Limitations: Trees take many years to mature, it takes time to materialise E.g. Fast-growing trees like angsanas, raintrees planted by NParks took 25 years to reach full height Conclusion:
Each agreement has its successes and limitations.
No one agreement alone can or has been able to effectively bring down the greenhouse gases emission of the country.
Cooperation of different strategies and all people in the country is essential to keep our greenhouse emissions low.
Level 1 (0-2m)
At this level, answers are general or have minimal support, if any stand was given at all.
Reasoning is weak and expression may be unclear.
Answers are basic with little development.
Level 2 (3-4m)
Positive or negative is supported by appropriate detail
Positive and negative are considered, but support is patchy and answers are not complete
Good reasoning and logic in parts of the answer with good expression in places
Level 3 (5-6m)
At this level, answers are comprehensive and supported by sound knowledge.
Both positive and negative are considered and well-supported.
Reasoning is clear and logical with good expression of language.
[25 marks]
End of paper


![[SS] [Sembawang Secondary] [4E5N] [Preliminary Examination] [2012]](https://img.dokumen.tips/doc/110x75/577cd1731a28ab9e789478e9/ss-sembawang-secondary-4e5n-preliminary-examination-2012.jpg)