Embed Size (px)
Citation preview
Canadian Travel to the United States—2004
Source: Department of Commerce, ITA, Office of Travel and Tourism Industries; Statistics Canada 1
Canadian Travel to the United States 2004
September 2007
U.S. DEPARTMENT OF COMMERCE International Trade Administration
Office of Travel and Tourism Industries
Canadian Travel to the United States—2004
Source: Department of Commerce, ITA, Office of Travel and Tourism Industries; Statistics Canada 2
TABLE OF CONTENTS
Page
INTRODUCTION .............................................................................................................4
EXECUTIVE SUMMARY.................................................................................................5
DETAILED FINDINGS.....................................................................................................7 TRAVELER METRICS .....................................................................................................................7
Visitors .................................................................................................................................7 Visits ....................................................................................................................................7 Visitor-Nights .......................................................................................................................7 Visitor Spending ..................................................................................................................8 Currency Exchange Rate ....................................................................................................8
TRIP CHARACTERISTICS ..............................................................................................................8 Province of Residence.........................................................................................................8 U.S. States Visited...............................................................................................................8 Purpose of Trip ....................................................................................................................9 Activities.............................................................................................................................10 Length of Stay....................................................................................................................12 Mode of Transportation .....................................................................................................12 Accommodations ...............................................................................................................13 Season/Month of Travel ....................................................................................................13 Visitor Spending ................................................................................................................14
TRAVELER DEMOGRAPHICS......................................................................................................15 Composition and Size of Travel Party ...............................................................................15 Age ....................................................................................................................................15 Gender...............................................................................................................................16
APPENDIX A— BACKGROUND & METHODOLOGY.................................................17 Travel and the Balance of Payments ................................................................................18 Receipts or Payments IMF concept ..................................................................................18 Description of methods......................................................................................................18 Frontier counts...................................................................................................................18 Questionnaire surveys.......................................................................................................19 Processing and imputation of questionnaires....................................................................20 Weighting...........................................................................................................................21 Production schedule ..........................................................................................................21 Reliability indicators...........................................................................................................21
APPENDIX B— OTTI WEBSITE...................................................................................24
APPENDIX C— RESEARCH AND MARKETING ASSISTANCE.................................25
2004 DATA TABLES ....................................................................................................27

Canadian Travel to the United States—2004
Source: Department of Commerce, ITA, Office of Travel and Tourism Industries; Statistics Canada 3
CHARTS Page Chart 1: Canadian Traveler Volume to the U.S.—1990-2004...........................................................7 Chart 2: Currency Exchange Rate Trend..........................................................................................8 Chart 3: Top States Visited ...............................................................................................................9 Chart 4: Main Purpose of Trip ...........................................................................................................9 Chart 5: Trip Purpose Differences Across Destinations..................................................................10 Chart 6: Activities by Trip Purpose ..................................................................................................11 Chart 7: Length of Stay Distribution ................................................................................................12 Chart 8: Mode of Transportation (U.S. Entry) .................................................................................13 Chart 9: Month of Travel..................................................................................................................13 Chart 10: Quarter of Travel by Main Purpose of Trip ........................................................................13 Chart 11: Quarter of Travel by Destination........................................................................................14 Chart 12: How a Travel Dollar is Spent .............................................................................................15 Chart 13: Composition of Travel Party ..............................................................................................15 Chart 14: Traveler Age ......................................................................................................................15
Canadian Travel to the United States—2004
Source: Department of Commerce, ITA, Office of Travel and Tourism Industries; Statistics Canada 4
INTRODUCTION
This edition of Canadian Travel to the United States—2004 is the 25th publication in a series of annual reports, which began in 1980. The Office of Travel and Tourism Industries wishes to thank the International Travel Section of Statistics Canada for providing the data used in this report.
This report provides a comprehensive analysis of Canadian travelers staying one or more nights in the United States in 2004. This travel segment accounted for about 29 percent of visitors, but a much higher share of state visits and visitor spending. Trends over the past several years are included for enhanced perspective. The 2004 survey sample is drawn from 18,922 voluntary responses to Statistics Canada's International Travel Survey of Canadian Residents traveler survey.
The 2004 edition presents findings in the major topic areas of traveler metrics (visitors, visits, visitor-nights, spending), trip characteristics (origin province, destination states, trip purpose, activities, length of stay, etc.), and traveler demographics (travel party composition, gender, and age).
An interpretive analysis is provided for each category, complete with tables and graphs to illustrate salient points. Data Tables A-J provide state-by-state traveler characteristics and totals for each travel attribute and offer comparative measures against other states or regions, or previous years. Traveler volume and characteristics are reported in the data tables for nine U.S. regions and all 50 states and the District of Columbia. Year-to-year comparisons are not available for Alabama, Arkansas, Delaware, Kansas, Mississippi, Oklahoma, or Rhode Island due to insufficient sample sizes in 2004.
This report has been designed to meet the needs of a variety of readers. While there is sufficient detail to meet the needs of those who may need in-depth data to consider changes that flow from the research, it is possible to gain key insights by reading only selected portions of the report. Listed below is a guideline for readers who seek varying depths of understanding of this study.
A basic understanding is possible by reading just the Executive Summary, designed to be a two-page standalone document for those interested in the “big picture” findings from this study.
A general understanding is possible by reading the Executive Summary and the numbered paragraphs in the Detailed Findings, either in full or just the underlined portions that highlight the main point.
A broad and deep understanding is possible by reading the bulleted points in the Detailed Findings, as well as the underlined sentences in the first paragraph of each new section. The bulleted points consistently cover three main detailed analyses and provide supporting detail or further clarification:
1) Trends for the variable over the past five years (or longer where appropriate).
2) Comparisons between the aggregated main trip purposes of business/convention, visiting friends or relatives, holiday/vacation, and all other purposes. These aggregated purposes are defined in the report section on trip purpose.
3) Comparisons across state destinations. Typically, these analyses focus on differences between states, not in their performance or share of U.S. totals. For example, the mode of transportation analysis focuses on the finding that 60 percent of visitors to Florida travel by air, not that Florida has a 25 percent market share of all air travelers to the U.S. For perspective, most data are provided for border states—the 11 states that border Canada by land.
Additional insight is possible from exploring the attached data tables in more detail. Data for past years are available as individual PDF files downloadable directly from the www.tinet.ita.doc.gov website. If interested, go to the Inbound page, and click on Canada.
IMPORTANT TECHNICAL NOTE: The reader should note that two Canadian traveler volume totals will be used throughout the report and appendix data tables. The official visitor count (one or more nights) for 2004 is 13,857,000 (U.S. Net), an unduplicated total or the total number of travelers that cross the border into the U.S. If a traveler visits multiple states on a U.S. trip, each state visit is counted in the reported regional total and in the duplicated U.S. total of 19,467,000 (U.S. Sum). Another way to view this is 13,857,000 net travelers produced 19,467,000 gross person-visits.
Please use the 13,857,000 volume estimate when computing volume of travel sub-segments based on proportions.
Canadian Travel to the United States—2004
Source: Department of Commerce, ITA, Office of Travel and Tourism Industries; Statistics Canada 5
EXECUTIVE SUMMARY
Background and Overview
Background: Canadian Travel to the United States—2004 represents a comprehensive analysis of Canadian travelers who stayed one or more nights in the U.S. in 2004. The report is prepared by the Department of Commerce’s Office of Travel and Tourism Industries (OTTI) and is based on 18,922 surveys conducted by Statistics Canada for their International Travel Survey of Canadian Residents traveler survey program. Additional information on Canadian travel to the U.S., OTTI, or Statistics Canada can be found on the OTTI website (www.tinet.ita.doc.gov) or the Statistics Canada website (http://www.statcan.ca/).
Overview: Canada is the number one origin country for the U.S. in terms of visitors (ahead of Mexico) and number three in terms of visitor spending (behind Japan and the U.K.). Thus, the nine percent gain in visitors from Canada in 2004 contributed significantly to the U.S. overall visitor increase of 12 percent from all countries combined. The increase is consistent with the ten percent increase in world arrivals as reported by the United Nations World Tourism Organization (UNWTO). Conversely, the U.S. share of total Canada outbound travelers in 2004 was 71 percent, a level that has declined over the past four years.
Although OTTI has not attempted to relate travel volume to specific economic variables, a few key factors may have contributed to the increase in visitors. First, the economy leading into 2004 was growing at a nominal rate of 1.7 percent on a year-to-year basis, which increased to 2.8 percent by the end of 2004. Second, the currency exchange rate for converting Canadian dollars to U.S. dollars began improving for Canadians early in 2003 and continued well into 2004. Third, a potentially important factor that is not well documented is the combined effort by the U.S. travel industry to promote the U.S. to Canadians. U.S. state destinations’ marketing budgets for Canada generally declined in FY2004, the time period in which travel marketing for 2004 would occur (source: Travel Industry Association, 2003-2004 Survey of State and Territory Office Budgets, July 2004). Promotional spending on Canada by other sources such as cities and attractions may have overcome the states’ spending decline.
Traveler Metrics
Visitors and Visits: Total Canadian visitors staying one or more nights in the United States in 2004 was 13.86 million, a nine percent increase from the 2003 level of 12.67 million and a turnaround following three consecutive years of visitor declines. However, the 2004 solid performance falls well short of the record 19.1 million visitor level set in 1991. The 13.86 million Canadian visitors to the U.S. in 2004 generated 19.47 million visits when taking into account travelers visiting more than one state destination.
Visitor-Nights: Visitor-nights is a travel metric that combines visitors (persons) with length of stay (nights). Canadian visitor-nights in the U.S. was 107.1 million in 2004, up ten percent from 2003. This performance reflects the nine percent increase in travelers and a one percent increase in average length of stay.
Visitor Spending: Canadians spent US$6.63 billion while in the U.S. in 2004, up 16 percent from 2003. This performance reflects the combination of a ten percent increase in travel parties coupled with a six percent increase in travel party spending.
Trip Characteristics
Province of Residence: Ontario generated the greatest number of travelers to the U.S. This province accounts for 39 percent of the population, but produced 6.51 million visitors in 2004, or 47 percent of all Canadians visiting the United States. The provinces following Ontario were Quebec (18%), British Columbia (17%), Alberta (8%), and Manitoba (4%).
U.S. States Visited: All states benefit from Canadian travelers, but a few border states and a few distant destination states dominate in Canadian volumetrics. The border state of New York received 2.26 million Canadian visitors, the most of any state. Other top destination states were Florida, Washington, Michigan, and California. Florida accounted for ten percent of visits, but 33 percent of visitor-nights. Conversely, the 11 land or water border states accounted for 60 percent of visits, but only 22 percent of visit-nights.
Trip Purpose: Holiday/Vacation was the dominant reason for Canadian travel to the U.S., accounting for 5.93 million, or 43 percent, of all Canadian
Canadian Travel to the United States—2004
Source: Department of Commerce, ITA, Office of Travel and Tourism Industries; Statistics Canada 6
visitors. Visits to friends or relatives was a distant second-most important trip purpose (21%). Trip purpose distributions have been stable over the past five years, but differ greatly across the state destinations. Hawaii had the highest proportion of visitors traveling for leisure purposes, while Washington, D.C., Colorado, Louisiana, and Illinois had the highest proportions of visitors traveling for business or convention reasons. Visitors to the border states most often traveled for leisure purposes as well, but these states collectively had a higher proportion of visitors traveling for other purposes, which includes shopping.
Activities: Canadians are active travelers during their U.S. visits based on participation rates for 19 leisure-oriented activities. Go shopping (68%), go sightseeing (44%), visit friends or relatives (41%), and participate in outdoor sports or outdoor activities (32%), had the highest participation rates among all travelers. Activity participation differed greatly depending on main purpose of trip, but is relatively high for all categories of the aggregated categories of leisure, business, visiting friends or relatives, and other miscellaneous. For example, 31 percent of business/convention travelers go sightseeing—a relatively high level compared to the 53 percent of leisure visitors who participate in the same activity.
Length of stay: About 71 percent of all Canadian visitors to the U.S. were on day trips in 2004. However, this report focuses on trips to the U.S. of one or more nights. Canadian overnight visitors stayed an average 7.7 nights in the U.S., but this average is strongly influenced by a few state destinations, such as Florida and Arizona, where large numbers of visitors stay for nearly three weeks on average. In fact, the greatest number of Canadians stayed two nights (the mode), while four nights was the length of stay at which half of Canadians have a shorter stay and half have a longer stay (the median). Average length of stay has changed minimally over the past five years.
Transportation Mode: Automobile is the dominant mode of transportation of entry to the U.S., accounting for 8.1 million, or 59 percent, of all Canadian visitors and 64 percent of all visits. Other modes of transportation of entry into the U.S. were airplane (33%), bus (4%), boat (1%) and all other modes (3%, mostly pedestrian). Business travelers most often traveled by air (72%).
Accommodations: Canadians most often stayed in hotels or motels (48%) during their U.S. visit. Other
accommodations types are camping or trailer park (11%), homes of friends or relatives (9%), cottage or cabin (7%), or other miscellaneous types or combinations of accommodations types (22%).
Season/Month of Visit: The third quarter (July-September) attracted 4.4 million, or 32 percent of all Canadians. Visitation in other quarters of the year were 2nd quarter (25%), 1st quarter (22%), and 4th quarter (22%). The greatest number of visitors arrived in August (12%) and July (11%). All other months produced between six percent and nine percent of annual visitors. The trend in seasonality has been stable across time and trip purposes. A shift occurred in the 4th quarter following 9/11, but visitation returned to a typical quarterly pattern the following year. Season of travel differs greatly across the state destinations. In general, Canadian travel statistics were impacted by 1st quarter “snow-birds” visiting southern states for extended periods of time.
Spending: Canadian visitors spent a total of $6.63 billion dollars in the U.S. in 2004. Accommodations accounted for the largest share of this amount (35%) followed by food and beverage (24%). Lower shares of total spending were made for shopping, souvenirs, etc. (16%), transportation while in the U.S. (13%), and recreation and entertainment (12%). Spending per visitor increased in 2004 to $479 per person, a six percent increase from 2003. Spending per-person per-day increased slightly to $62.
Traveler Demographics
Composition of Travel Party: Canadian travel parties to the U.S. are dominated by two-adult parties (42%). Half as many contained three or more adults (21%), while fewer still contained an adult traveling alone (16%). Twenty-one percent of all travel parties contained one or more children under age 20 (net). The average party size in 2004 was 2.1 persons and has been at that level for several years.
Age: The age of Canadian travelers is centered around the 45-54 age group (21%). Children are a member of 21 percent of all travel parties, but accounted for only 12 percent of all travelers. The 55-64 (19%) and the 35-44 age groups (17%) also accounted for many Canadian travelers.
Gender: Women travelers slightly outnumbered men, 53 percent to 47 percent, respectively.
Canadian Travel to the United States—2004
Source: Department of Commerce, ITA, Office of Travel and Tourism Industries; Statistics Canada 7
DETAILED FINDINGS
TRAVELER METRICS
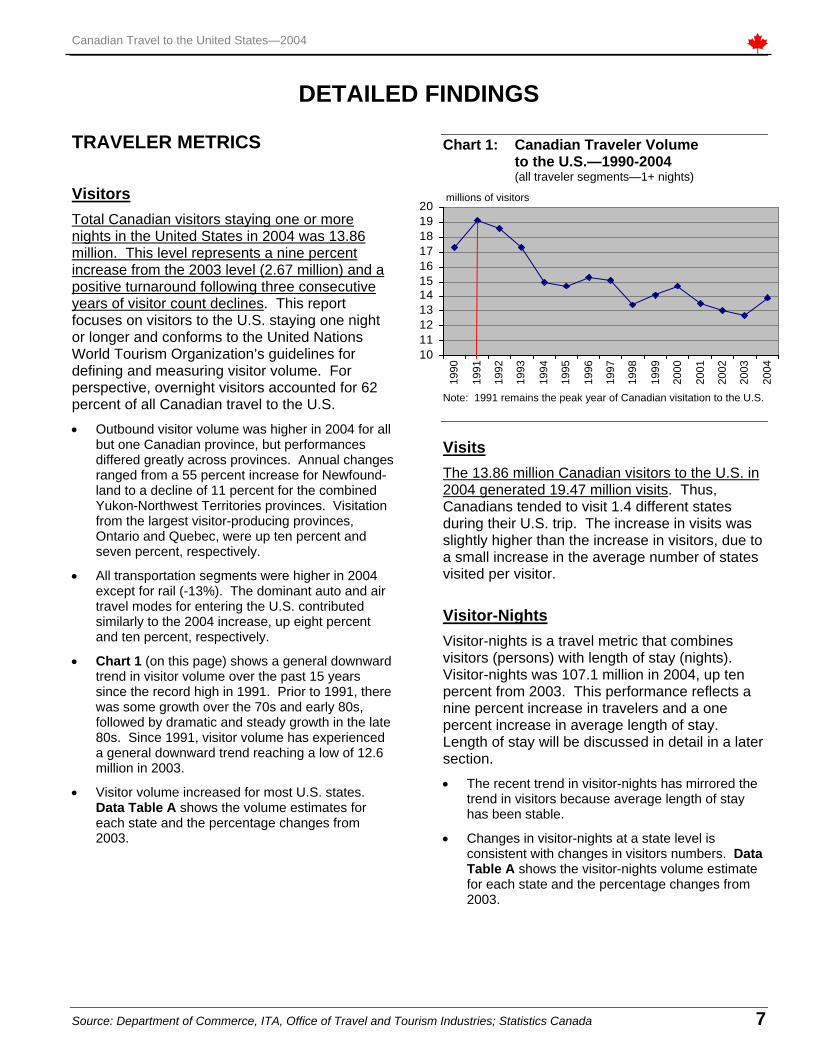
Visitors Total Canadian visitors staying one or more nights in the United States in 2004 was 13.86 million. This level represents a nine percent increase from the 2003 level (2.67 million) and a positive turnaround following three consecutive years of visitor count declines. This report focuses on visitors to the U.S. staying one night or longer and conforms to the United Nations World Tourism Organization’s guidelines for defining and measuring visitor volume. For perspective, overnight visitors accounted for 62 percent of all Canadian travel to the U.S.
• Outbound visitor volume was higher in 2004 for all but one Canadian province, but performances differed greatly across provinces. Annual changes ranged from a 55 percent increase for Newfound-land to a decline of 11 percent for the combined Yukon-Northwest Territories provinces. Visitation from the largest visitor-producing provinces, Ontario and Quebec, were up ten percent and seven percent, respectively.
• All transportation segments were higher in 2004 except for rail (-13%). The dominant auto and air travel modes for entering the U.S. contributed similarly to the 2004 increase, up eight percent and ten percent, respectively.
• Chart 1 (on this page) shows a general downward trend in visitor volume over the past 15 years since the record high in 1991. Prior to 1991, there was some growth over the 70s and early 80s, followed by dramatic and steady growth in the late 80s. Since 1991, visitor volume has experienced a general downward trend reaching a low of 12.6 million in 2003.
• Visitor volume increased for most U.S. states. Data Table A shows the volume estimates for each state and the percentage changes from 2003.
Chart 1: Canadian Traveler Volume to the U.S.—1990-2004 (all traveler segments—1+ nights)
Note: 1991 remains the peak year of Canadian visitation to the U.S.
Visits The 13.86 million Canadian visitors to the U.S. in 2004 generated 19.47 million visits. Thus, Canadians tended to visit 1.4 different states during their U.S. trip. The increase in visits was slightly higher than the increase in visitors, due to a small increase in the average number of states visited per visitor.
Visitor-Nights Visitor-nights is a travel metric that combines visitors (persons) with length of stay (nights). Visitor-nights was 107.1 million in 2004, up ten percent from 2003. This performance reflects a nine percent increase in travelers and a one percent increase in average length of stay. Length of stay will be discussed in detail in a later section.
• The recent trend in visitor-nights has mirrored the trend in visitors because average length of stay has been stable.
• Changes in visitor-nights at a state level is consistent with changes in visitors numbers. Data Table A shows the visitor-nights volume estimate for each state and the percentage changes from 2003.
1011121314151617181920
1990
1991
1992
1993
1994
1995
1996
1997
1998
1999
2000
2001
2002
2003
2004
millions of visitors

Canadian Travel to the United States—2004
Source: Department of Commerce, ITA, Office of Travel and Tourism Industries; Statistics Canada 8
Visitor Spending Canadian visitors spent US$6.63 billion in the U.S. in 2004, up 16 percent from 2003. Thus, Canadian visitor spending rose faster than visitor volume.
• The 2004 spending performance was the second consecutive increase following two years of declines.
• Spending by the pleasure/recreation/holiday segment was US$4.21 billion, or 63 percent, of total spending in 2004. The business/convention sector accounted for 21 percent of the total. The remaining segments of visiting friends/relatives and all other accounted for 11 percent and five percent, respectively. On a per-trip basis, business travelers spent the most, with an average spending of US$687 followed by the leisure segment at US$551. Those visiting friends and relatives spent the least at US$239.
• Visitor spending differs greatly by state visited regardless of spending metric measure (for example: total, per-party, or per-visitor. These will be presented in the trip characteristics section). Florida dominated in share of total visitor spending (24%) due to the large volume of visitors, long duration of stay, and high average spending per visitor per night. Chart 3 (on the following page) shows the visitor spending values for the most-visited states. Data Table B shows a state-by-state comparison of visitor spending.
Currency Exchange Rate A strong relationship exists between the exchange rate for converting Canadian dollars to U.S. dollars and travel party spending levels; on average, Canadians spend more per party when the exchange rate is relatively more favorable for them. Thus, when the exchange rate is higher, Canadians get a better value for a given amount of spending and actually spend more. Chart 2 (on this page) shows an eight-year trend in the exchange rate. Over this time, the value of the Canadian dollar averaged $0.69 in U.S. dollars, but was well above this level during 2004.
Chart 2: Currency Exchange Rate Trend (quarterly 1 1997-2004)
1 The quarterly exchange rate represents the mean average of the daily
(noon) rate across all the business days in the quarter as reported by the Bank of Canada.
TRIP CHARACTERISTICS
Province of Residence Ontario generated the greatest number of travelers to the U.S., producing 6.51 million visitors in 2004, or 47 percent of all Canadians visiting the United States. The provinces following Ontario were Quebec (18%), British Columbia (17%), Alberta (8%), and Manitoba (4%). The other seven provinces accounted for the remaining six percent of visitors.
• Ontario accounts for 39 percent of the Canadian population, but generated 47 percent of Canadian travelers to the U.S. British Columbia also generated a higher share of visitors than of residents (17% versus 13%, respectively).
• Ontario produced 47 percent of all visitors, but an even higher proportion of business/ conventions (55%) and visiting friends and relatives (51%) travelers.
• Ontario is the dominant visitor origin province for 31 out of 45 U.S. destination states for which volume is provided. Data Table C shows the visitor volume from each Canadian province to each U.S. Bureau of Census division and state.
U.S. States Visited All states benefited from Canadian travel, but a few border states and a few distant destination states dominated in Canadian traveler metrics. One state—Florida—completely dominated in the
0.50
0.55
0.60
0.65
0.70
0.75
0.80
0.85
0.90
1997
Q1
1997
Q2
1997
Q3
1997
Q4
1998
Q1
1998
Q2
1998
Q3
1998
Q4
1999
Q1
1999
Q2
1999
Q3
1999
Q4
2000
Q1
2000
Q2
2000
Q3
2000
Q4
2001
Q1
2001
Q2
2001
Q3
2001
Q4
2002
Q1
2002
Q2
2002
Q3
2002
Q4
2003
Q1
2003
Q2
2003
Q3
2003
Q4
2004
Q1
2004
Q2
2004
Q3
2004
Q4
$US equivalent of $1CN
Canadian Travel to the United States—2004
Source: Department of Commerce, ITA, Office of Travel and Tourism Industries; Statistics Canada 9
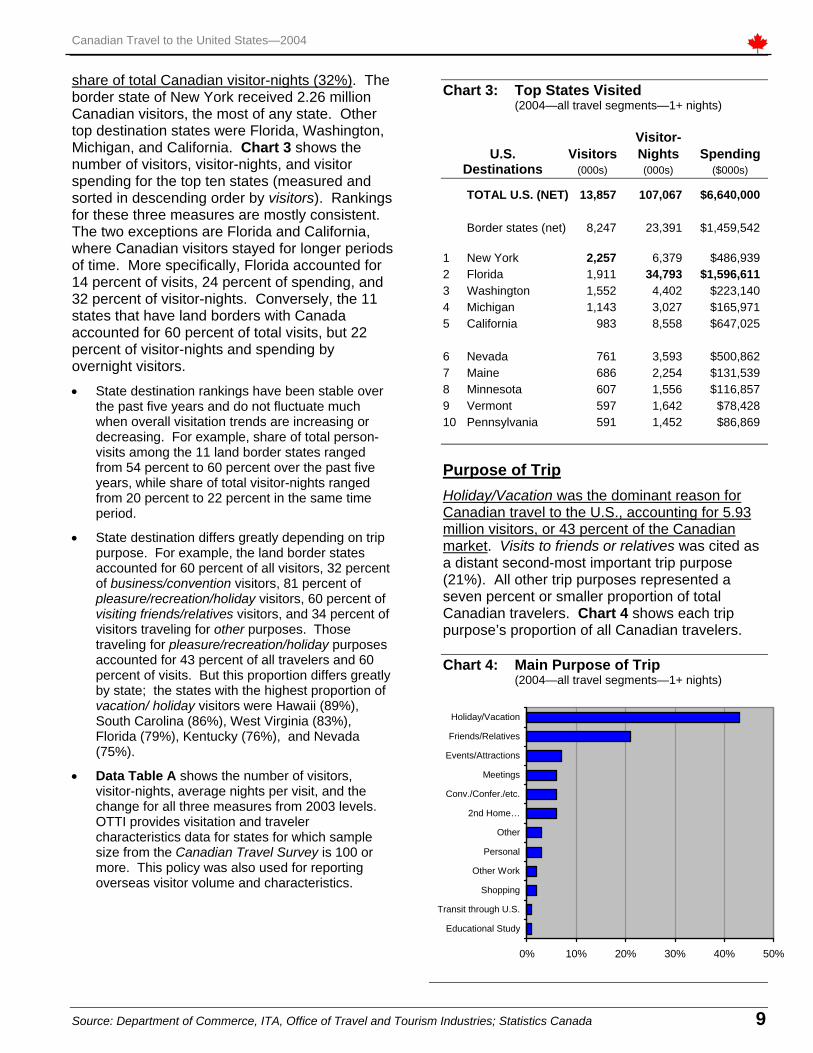
share of total Canadian visitor-nights (32%). The border state of New York received 2.26 million Canadian visitors, the most of any state. Other top destination states were Florida, Washington, Michigan, and California. Chart 3 shows the number of visitors, visitor-nights, and visitor spending for the top ten states (measured and sorted in descending order by visitors). Rankings for these three measures are mostly consistent. The two exceptions are Florida and California, where Canadian visitors stayed for longer periods of time. More specifically, Florida accounted for 14 percent of visits, 24 percent of spending, and 32 percent of visitor-nights. Conversely, the 11 states that have land borders with Canada accounted for 60 percent of total visits, but 22 percent of visitor-nights and spending by overnight visitors.
• State destination rankings have been stable over the past five years and do not fluctuate much when overall visitation trends are increasing or decreasing. For example, share of total person-visits among the 11 land border states ranged from 54 percent to 60 percent over the past five years, while share of total visitor-nights ranged from 20 percent to 22 percent in the same time period.
• State destination differs greatly depending on trip purpose. For example, the land border states accounted for 60 percent of all visitors, 32 percent of business/convention visitors, 81 percent of pleasure/recreation/holiday visitors, 60 percent of visiting friends/relatives visitors, and 34 percent of visitors traveling for other purposes. Those traveling for pleasure/recreation/holiday purposes accounted for 43 percent of all travelers and 60 percent of visits. But this proportion differs greatly by state; the states with the highest proportion of vacation/ holiday visitors were Hawaii (89%), South Carolina (86%), West Virginia (83%), Florida (79%), Kentucky (76%), and Nevada (75%).
• Data Table A shows the number of visitors, visitor-nights, average nights per visit, and the change for all three measures from 2003 levels. OTTI provides visitation and traveler characteristics data for states for which sample size from the Canadian Travel Survey is 100 or more. This policy was also used for reporting overseas visitor volume and characteristics.
Chart 3: Top States Visited (2004—all travel segments—1+ nights)
Visitor- U.S. Visitors Nights Spending Destinations (000s) (000s) ($000s)
TOTAL U.S. (NET) 13,857 107,067 $6,640,000 Border states (net) 8,247 23,391 $1,459,542 1 New York 2,257 6,379 $486,939 2 Florida 1,911 34,793 $1,596,611 3 Washington 1,552 4,402 $223,140 4 Michigan 1,143 3,027 $165,971 5 California 983 8,558 $647,025 6 Nevada 761 3,593 $500,862 7 Maine 686 2,254 $131,539 8 Minnesota 607 1,556 $116,857 9 Vermont 597 1,642 $78,428 10 Pennsylvania 591 1,452 $86,869
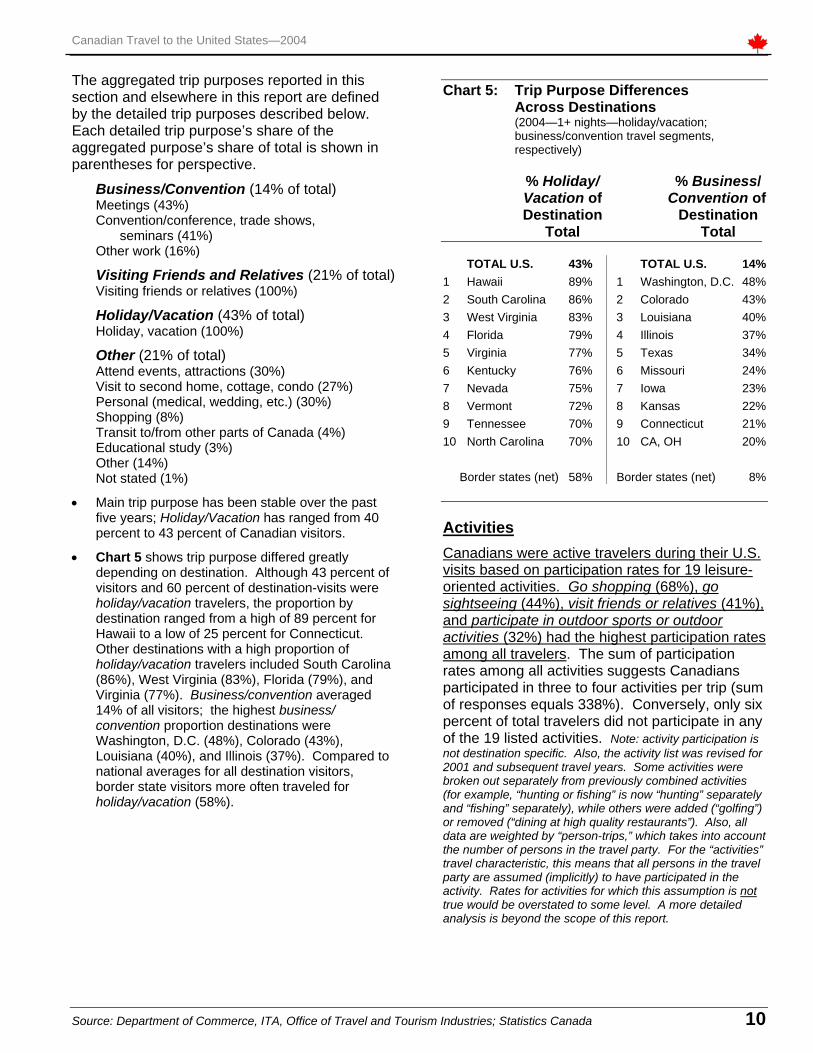
Purpose of Trip Holiday/Vacation was the dominant reason for Canadian travel to the U.S., accounting for 5.93 million visitors, or 43 percent of the Canadian market. Visits to friends or relatives was cited as a distant second-most important trip purpose (21%). All other trip purposes represented a seven percent or smaller proportion of total Canadian travelers. Chart 4 shows each trip purpose’s proportion of all Canadian travelers.
Chart 4: Main Purpose of Trip (2004—all travel segments—1+ nights)
0% 10% 20% 30% 40% 50%
Educational Study
Transit through U.S.
Shopping
Other Work
Personal
Other
2nd Home…
Conv./Confer./etc.
Meetings
Events/Attractions
Friends/Relatives
Holiday/Vacation
Canadian Travel to the United States—2004
Source: Department of Commerce, ITA, Office of Travel and Tourism Industries; Statistics Canada 10
The aggregated trip purposes reported in this section and elsewhere in this report are defined by the detailed trip purposes described below. Each detailed trip purpose’s share of the aggregated purpose’s share of total is shown in parentheses for perspective.
Business/Convention (14% of total) Meetings (43%) Convention/conference, trade shows, seminars (41%) Other work (16%)
Visiting Friends and Relatives (21% of total) Visiting friends or relatives (100%)
Holiday/Vacation (43% of total) Holiday, vacation (100%)
Other (21% of total) Attend events, attractions (30%) Visit to second home, cottage, condo (27%)
Personal (medical, wedding, etc.) (30%) Shopping (8%) Transit to/from other parts of Canada (4%) Educational study (3%) Other (14%) Not stated (1%)
• Main trip purpose has been stable over the past five years; Holiday/Vacation has ranged from 40 percent to 43 percent of Canadian visitors.
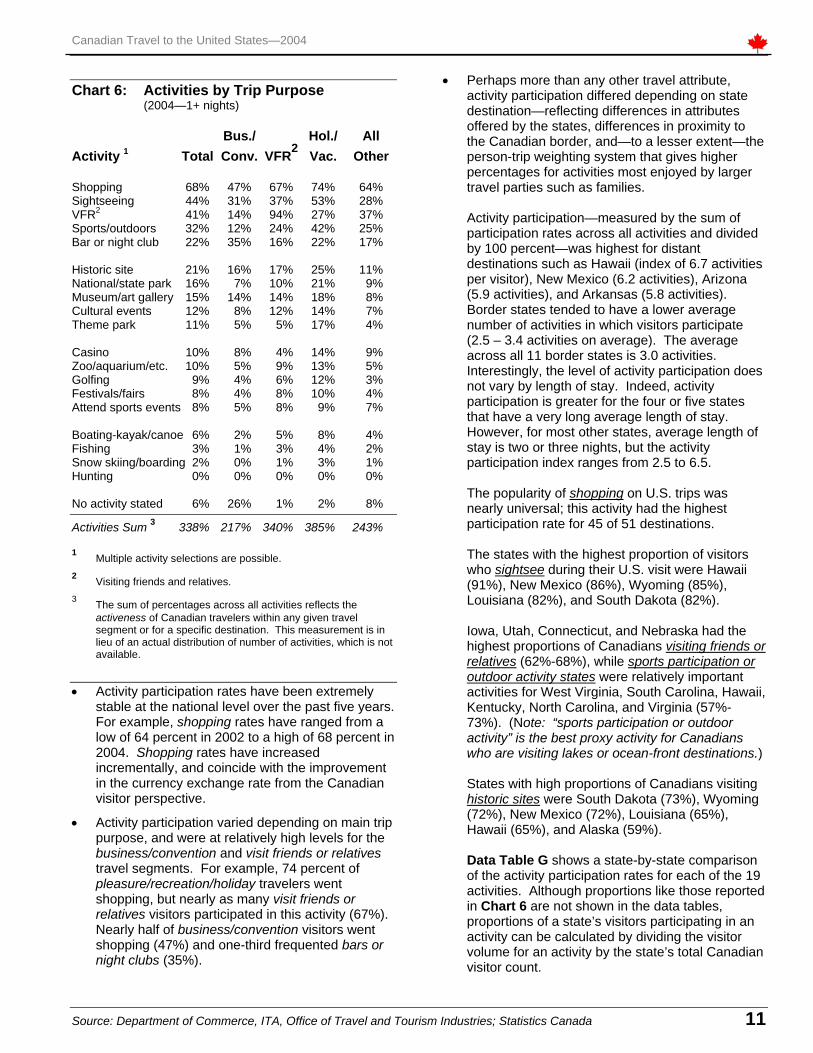
• Chart 5 shows trip purpose differed greatly depending on destination. Although 43 percent of visitors and 60 percent of destination-visits were holiday/vacation travelers, the proportion by destination ranged from a high of 89 percent for Hawaii to a low of 25 percent for Connecticut. Other destinations with a high proportion of holiday/vacation travelers included South Carolina (86%), West Virginia (83%), Florida (79%), and Virginia (77%). Business/convention averaged 14% of all visitors; the highest business/ convention proportion destinations were Washington, D.C. (48%), Colorado (43%), Louisiana (40%), and Illinois (37%). Compared to national averages for all destination visitors, border state visitors more often traveled for holiday/vacation (58%).
Chart 5: Trip Purpose Differences Across Destinations (2004—1+ nights—holiday/vacation; business/convention travel segments, respectively)
% Holiday/ % Business/ Vacation of Convention of Destination Destination Total Total
TOTAL U.S. 43% TOTAL U.S. 14% 1 Hawaii 89% 1 Washington, D.C. 48% 2 South Carolina 86% 2 Colorado 43% 3 West Virginia 83% 3 Louisiana 40% 4 Florida 79% 4 Illinois 37% 5 Virginia 77% 5 Texas 34% 6 Kentucky 76% 6 Missouri 24% 7 Nevada 75% 7 Iowa 23% 8 Vermont 72% 8 Kansas 22% 9 Tennessee 70% 9 Connecticut 21% 10 North Carolina 70% 10 CA, OH 20% Border states (net) 58% Border states (net) 8%
Activities Canadians were active travelers during their U.S. visits based on participation rates for 19 leisure-oriented activities. Go shopping (68%), go sightseeing (44%), visit friends or relatives (41%), and participate in outdoor sports or outdoor activities (32%) had the highest participation rates among all travelers. The sum of participation rates among all activities suggests Canadians participated in three to four activities per trip (sum of responses equals 338%). Conversely, only six percent of total travelers did not participate in any of the 19 listed activities. Note: activity participation is not destination specific. Also, the activity list was revised for 2001 and subsequent travel years. Some activities were broken out separately from previously combined activities (for example, “hunting or fishing” is now “hunting” separately and “fishing” separately), while others were added (“golfing”) or removed (“dining at high quality restaurants”). Also, all data are weighted by “person-trips,” which takes into account the number of persons in the travel party. For the “activities” travel characteristic, this means that all persons in the travel party are assumed (implicitly) to have participated in the activity. Rates for activities for which this assumption is not true would be overstated to some level. A more detailed analysis is beyond the scope of this report.
Canadian Travel to the United States—2004
Source: Department of Commerce, ITA, Office of Travel and Tourism Industries; Statistics Canada 11
Chart 6: Activities by Trip Purpose (2004—1+ nights)
Bus./ Hol./ All Activity 1 Total Conv. VFR2 Vac. Other Shopping 68% 47% 67% 74% 64% Sightseeing 44% 31% 37% 53% 28% VFR2 41% 14% 94% 27% 37% Sports/outdoors 32% 12% 24% 42% 25% Bar or night club 22% 35% 16% 22% 17% Historic site 21% 16% 17% 25% 11% National/state park 16% 7% 10% 21% 9% Museum/art gallery 15% 14% 14% 18% 8% Cultural events 12% 8% 12% 14% 7% Theme park 11% 5% 5% 17% 4% Casino 10% 8% 4% 14% 9% Zoo/aquarium/etc. 10% 5% 9% 13% 5% Golfing 9% 4% 6% 12% 3% Festivals/fairs 8% 4% 8% 10% 4% Attend sports events 8% 5% 8% 9% 7% Boating-kayak/canoe 6% 2% 5% 8% 4% Fishing 3% 1% 3% 4% 2% Snow skiing/boarding 2% 0% 1% 3% 1% Hunting 0% 0% 0% 0% 0% No activity stated 6% 26% 1% 2% 8%
Activities Sum 3 338% 217% 340% 385% 243%
1 Multiple activity selections are possible. 2 Visiting friends and relatives. 3 The sum of percentages across all activities reflects the
activeness of Canadian travelers within any given travel segment or for a specific destination. This measurement is in lieu of an actual distribution of number of activities, which is not available.
• Activity participation rates have been extremely
stable at the national level over the past five years. For example, shopping rates have ranged from a low of 64 percent in 2002 to a high of 68 percent in 2004. Shopping rates have increased incrementally, and coincide with the improvement in the currency exchange rate from the Canadian visitor perspective.
• Activity participation varied depending on main trip purpose, and were at relatively high levels for the business/convention and visit friends or relatives travel segments. For example, 74 percent of pleasure/recreation/holiday travelers went shopping, but nearly as many visit friends or relatives visitors participated in this activity (67%). Nearly half of business/convention visitors went shopping (47%) and one-third frequented bars or night clubs (35%).
• Perhaps more than any other travel attribute, activity participation differed depending on state destination—reflecting differences in attributes offered by the states, differences in proximity to the Canadian border, and—to a lesser extent—the person-trip weighting system that gives higher percentages for activities most enjoyed by larger travel parties such as families. Activity participation—measured by the sum of participation rates across all activities and divided by 100 percent—was highest for distant destinations such as Hawaii (index of 6.7 activities per visitor), New Mexico (6.2 activities), Arizona (5.9 activities), and Arkansas (5.8 activities). Border states tended to have a lower average number of activities in which visitors participate (2.5 – 3.4 activities on average). The average across all 11 border states is 3.0 activities. Interestingly, the level of activity participation does not vary by length of stay. Indeed, activity participation is greater for the four or five states that have a very long average length of stay. However, for most other states, average length of stay is two or three nights, but the activity participation index ranges from 2.5 to 6.5. The popularity of shopping on U.S. trips was nearly universal; this activity had the highest participation rate for 45 of 51 destinations. The states with the highest proportion of visitors who sightsee during their U.S. visit were Hawaii (91%), New Mexico (86%), Wyoming (85%), Louisiana (82%), and South Dakota (82%). Iowa, Utah, Connecticut, and Nebraska had the highest proportions of Canadians visiting friends or relatives (62%-68%), while sports participation or outdoor activity states were relatively important activities for West Virginia, South Carolina, Hawaii, Kentucky, North Carolina, and Virginia (57%-73%). (Note: “sports participation or outdoor activity” is the best proxy activity for Canadians who are visiting lakes or ocean-front destinations.) States with high proportions of Canadians visiting historic sites were South Dakota (73%), Wyoming (72%), New Mexico (72%), Louisiana (65%), Hawaii (65%), and Alaska (59%). Data Table G shows a state-by-state comparison of the activity participation rates for each of the 19 activities. Although proportions like those reported in Chart 6 are not shown in the data tables, proportions of a state’s visitors participating in an activity can be calculated by dividing the visitor volume for an activity by the state’s total Canadian visitor count.
Canadian Travel to the United States—2004
Source: Department of Commerce, ITA, Office of Travel and Tourism Industries; Statistics Canada 12
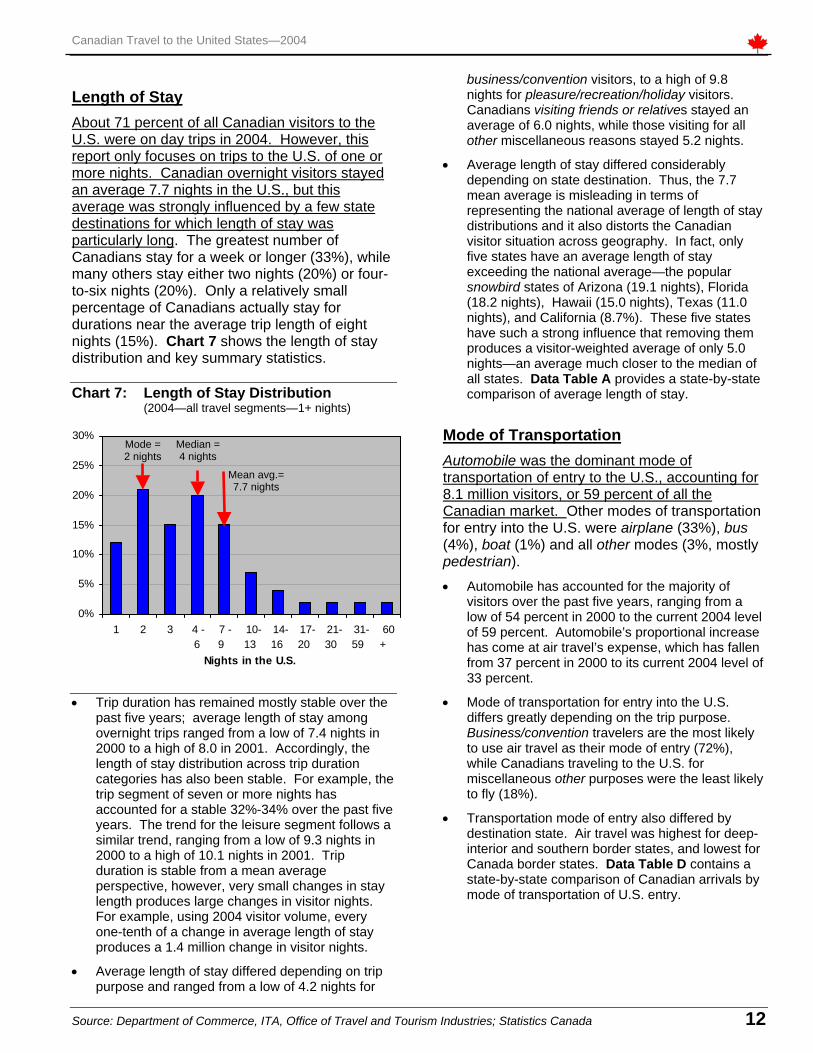
Length of Stay About 71 percent of all Canadian visitors to the U.S. were on day trips in 2004. However, this report only focuses on trips to the U.S. of one or more nights. Canadian overnight visitors stayed an average 7.7 nights in the U.S., but this average was strongly influenced by a few state destinations for which length of stay was particularly long. The greatest number of Canadians stay for a week or longer (33%), while many others stay either two nights (20%) or four-to-six nights (20%). Only a relatively small percentage of Canadians actually stay for durations near the average trip length of eight nights (15%). Chart 7 shows the length of stay distribution and key summary statistics.
Chart 7: Length of Stay Distribution (2004—all travel segments—1+ nights)
• Trip duration has remained mostly stable over the
past five years; average length of stay among overnight trips ranged from a low of 7.4 nights in 2000 to a high of 8.0 in 2001. Accordingly, the length of stay distribution across trip duration categories has also been stable. For example, the trip segment of seven or more nights has accounted for a stable 32%-34% over the past five years. The trend for the leisure segment follows a similar trend, ranging from a low of 9.3 nights in 2000 to a high of 10.1 nights in 2001. Trip duration is stable from a mean average perspective, however, very small changes in stay length produces large changes in visitor nights. For example, using 2004 visitor volume, every one-tenth of a change in average length of stay produces a 1.4 million change in visitor nights.
• Average length of stay differed depending on trip purpose and ranged from a low of 4.2 nights for
business/convention visitors, to a high of 9.8 nights for pleasure/recreation/holiday visitors. Canadians visiting friends or relatives stayed an average of 6.0 nights, while those visiting for all other miscellaneous reasons stayed 5.2 nights.
• Average length of stay differed considerably depending on state destination. Thus, the 7.7 mean average is misleading in terms of representing the national average of length of stay distributions and it also distorts the Canadian visitor situation across geography. In fact, only five states have an average length of stay exceeding the national average—the popular snowbird states of Arizona (19.1 nights), Florida (18.2 nights), Hawaii (15.0 nights), Texas (11.0 nights), and California (8.7%). These five states have such a strong influence that removing them produces a visitor-weighted average of only 5.0 nights—an average much closer to the median of all states. Data Table A provides a state-by-state comparison of average length of stay.
Mode of Transportation Automobile was the dominant mode of transportation of entry to the U.S., accounting for 8.1 million visitors, or 59 percent of all the Canadian market. Other modes of transportation for entry into the U.S. were airplane (33%), bus (4%), boat (1%) and all other modes (3%, mostly pedestrian).
• Automobile has accounted for the majority of visitors over the past five years, ranging from a low of 54 percent in 2000 to the current 2004 level of 59 percent. Automobile’s proportional increase has come at air travel’s expense, which has fallen from 37 percent in 2000 to its current 2004 level of 33 percent.
• Mode of transportation for entry into the U.S. differs greatly depending on the trip purpose. Business/convention travelers are the most likely to use air travel as their mode of entry (72%), while Canadians traveling to the U.S. for miscellaneous other purposes were the least likely to fly (18%).
• Transportation mode of entry also differed by destination state. Air travel was highest for deep-interior and southern border states, and lowest for Canada border states. Data Table D contains a state-by-state comparison of Canadian arrivals by mode of transportation of U.S. entry.
0%
5%
10%
15%
20%
25%
30%
1 2 3 4 -6
7 -9
10-13
14-16
17-20
21-30
31-59
60+
Nights in the U.S.
Mean avg.= 7.7 nights
Median = 4 nights
Mode = 2 nights
Canadian Travel to the United States—2004
Source: Department of Commerce, ITA, Office of Travel and Tourism Industries; Statistics Canada 13
Chart 8: Mode of Transportation (U.S. Entry) (2004—all travel segments—1+ nights)
Accommodations Canadians most often stayed in hotels or motels (48%) during their U.S. visits. Other accom-modations types were homes of friends or relatives (17%), camping or trailer park (7%), cottage or cabin (4%), or other miscellaneous or combinations of types (22%). Note: Seven percent of visitors did not state their accommodations, and have been excluded in the base for analysis. Also, multiple-responses are possible for accommodations type, and thus the sum of share of total may exceed 100 percent. Not counting hotel/motel, about nine percent of Canadians stayed in more than one type of accommodations during the U.S. trip.
• Hotel/motel has been the dominant accom-modations type over the past five years, ranging from 46-48 percent.
• Type of accommodations differs significantly with the trip purpose. Business travelers were the most likely to stay in a hotel or motel (84%) compared to 51 percent of leisure travelers. A fourth of those visiting friends or relatives included one or more nights in a hotel/motel.
• Nearly all fifty-one U.S. destination states had the greatest number of visitors stay in hotel and/or motel accommodations. Compared to the national average of 48 percent who used hotels and/or motels, use of hotel/motel as a proportion of total state visitors differed from a low of 34 percent for Washington to a high of 89 percent for West Virginia.
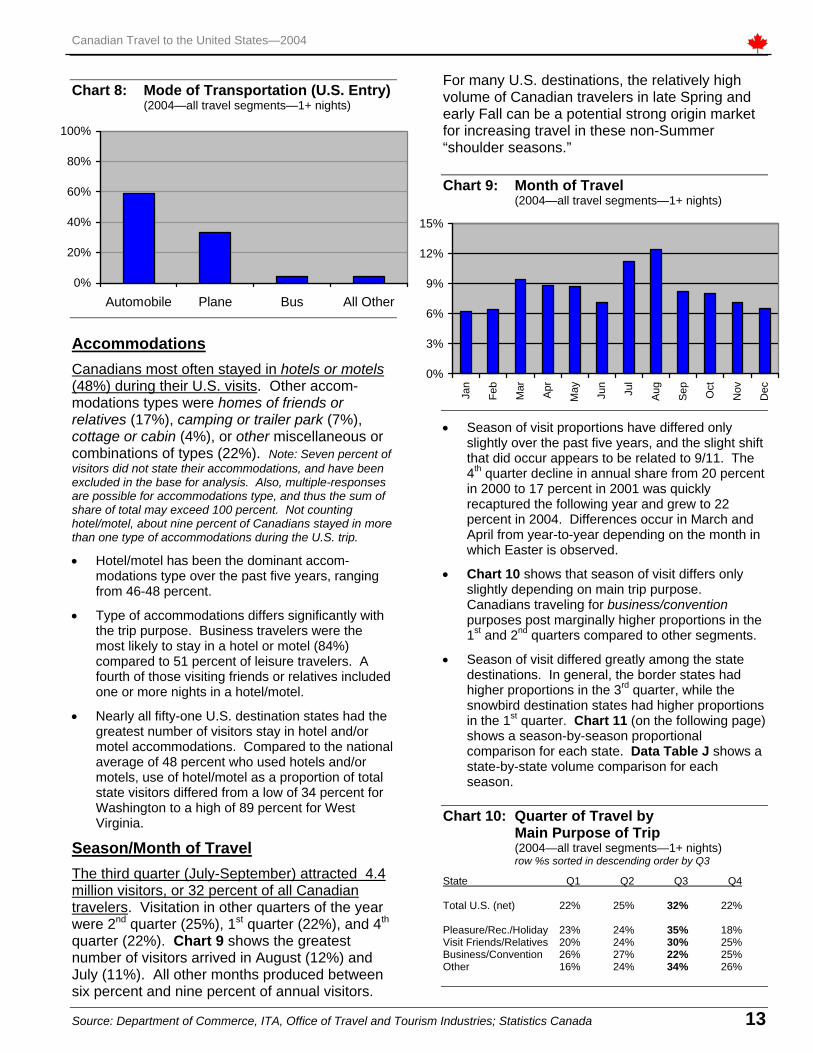
Season/Month of Travel The third quarter (July-September) attracted 4.4 million visitors, or 32 percent of all Canadian travelers. Visitation in other quarters of the year were 2nd quarter (25%), 1st quarter (22%), and 4th quarter (22%). Chart 9 shows the greatest number of visitors arrived in August (12%) and July (11%). All other months produced between six percent and nine percent of annual visitors.
For many U.S. destinations, the relatively high volume of Canadian travelers in late Spring and early Fall can be a potential strong origin market for increasing travel in these non-Summer “shoulder seasons.”
Chart 9: Month of Travel (2004—all travel segments—1+ nights)
• Season of visit proportions have differed only slightly over the past five years, and the slight shift that did occur appears to be related to 9/11. The 4th quarter decline in annual share from 20 percent in 2000 to 17 percent in 2001 was quickly recaptured the following year and grew to 22 percent in 2004. Differences occur in March and April from year-to-year depending on the month in which Easter is observed.
• Chart 10 shows that season of visit differs only slightly depending on main trip purpose. Canadians traveling for business/convention purposes post marginally higher proportions in the 1st and 2nd quarters compared to other segments.
• Season of visit differed greatly among the state destinations. In general, the border states had higher proportions in the 3rd quarter, while the snowbird destination states had higher proportions in the 1st quarter. Chart 11 (on the following page) shows a season-by-season proportional comparison for each state. Data Table J shows a state-by-state volume comparison for each season.
Chart 10: Quarter of Travel by Main Purpose of Trip (2004—all travel segments—1+ nights) row %s sorted in descending order by Q3
State Q1 Q2 Q3 Q4 Total U.S. (net) 22% 25% 32% 22% Pleasure/Rec./Holiday 23% 24% 35% 18% Visit Friends/Relatives 20% 24% 30% 25% Business/Convention 26% 27% 22% 25% Other 16% 24% 34% 26%
0%
3%
6%
9%
12%
15%
Jan
Feb
Mar
Apr
May Jun
Jul
Aug
Sep Oct
Nov
Dec
0%
20%
40%
60%
80%
100%
Automobile Plane Bus All Other
Canadian Travel to the United States—2004
Source: Department of Commerce, ITA, Office of Travel and Tourism Industries; Statistics Canada 14
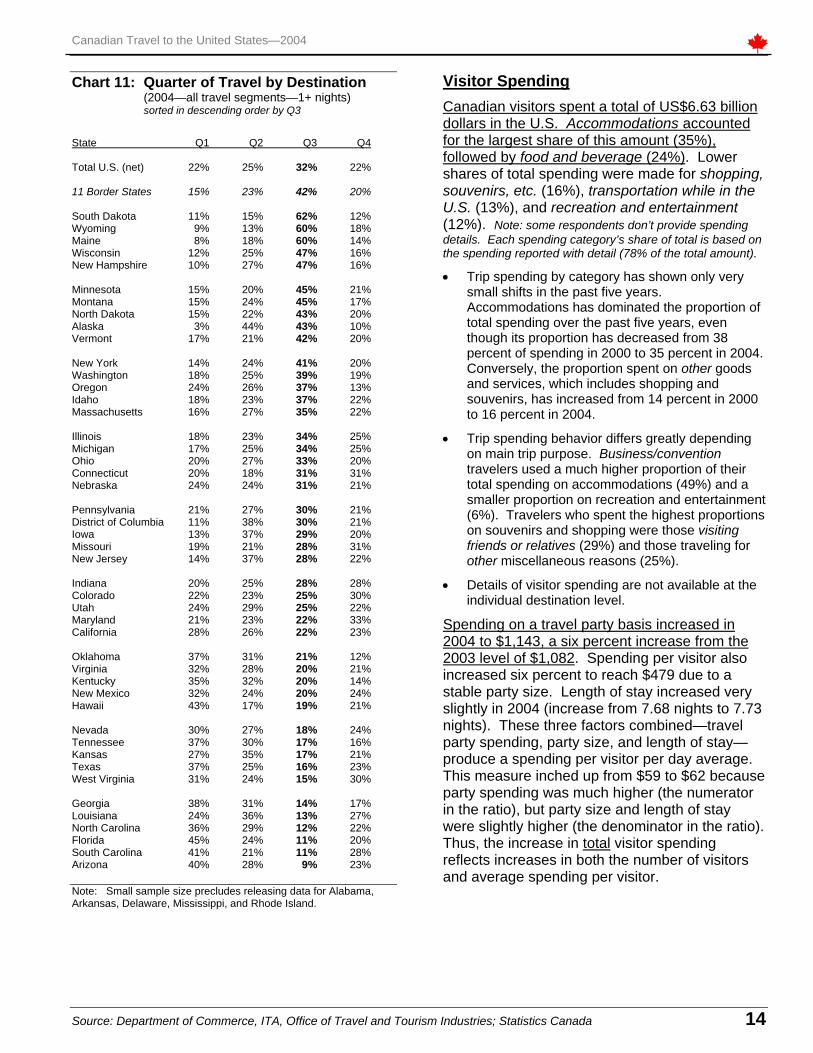
Chart 11: Quarter of Travel by Destination (2004—all travel segments—1+ nights) sorted in descending order by Q3
State Q1 Q2 Q3 Q4 Total U.S. (net) 22% 25% 32% 22% 11 Border States 15% 23% 42% 20% South Dakota 11% 15% 62% 12% Wyoming 9% 13% 60% 18% Maine 8% 18% 60% 14% Wisconsin 12% 25% 47% 16% New Hampshire 10% 27% 47% 16% Minnesota 15% 20% 45% 21% Montana 15% 24% 45% 17% North Dakota 15% 22% 43% 20% Alaska 3% 44% 43% 10% Vermont 17% 21% 42% 20% New York 14% 24% 41% 20% Washington 18% 25% 39% 19% Oregon 24% 26% 37% 13% Idaho 18% 23% 37% 22% Massachusetts 16% 27% 35% 22% Illinois 18% 23% 34% 25% Michigan 17% 25% 34% 25% Ohio 20% 27% 33% 20% Connecticut 20% 18% 31% 31% Nebraska 24% 24% 31% 21% Pennsylvania 21% 27% 30% 21% District of Columbia 11% 38% 30% 21% Iowa 13% 37% 29% 20% Missouri 19% 21% 28% 31% New Jersey 14% 37% 28% 22% Indiana 20% 25% 28% 28% Colorado 22% 23% 25% 30% Utah 24% 29% 25% 22% Maryland 21% 23% 22% 33% California 28% 26% 22% 23% Oklahoma 37% 31% 21% 12% Virginia 32% 28% 20% 21% Kentucky 35% 32% 20% 14% New Mexico 32% 24% 20% 24% Hawaii 43% 17% 19% 21% Nevada 30% 27% 18% 24% Tennessee 37% 30% 17% 16% Kansas 27% 35% 17% 21% Texas 37% 25% 16% 23% West Virginia 31% 24% 15% 30% Georgia 38% 31% 14% 17% Louisiana 24% 36% 13% 27% North Carolina 36% 29% 12% 22% Florida 45% 24% 11% 20% South Carolina 41% 21% 11% 28% Arizona 40% 28% 9% 23% Note: Small sample size precludes releasing data for Alabama, Arkansas, Delaware, Mississippi, and Rhode Island.
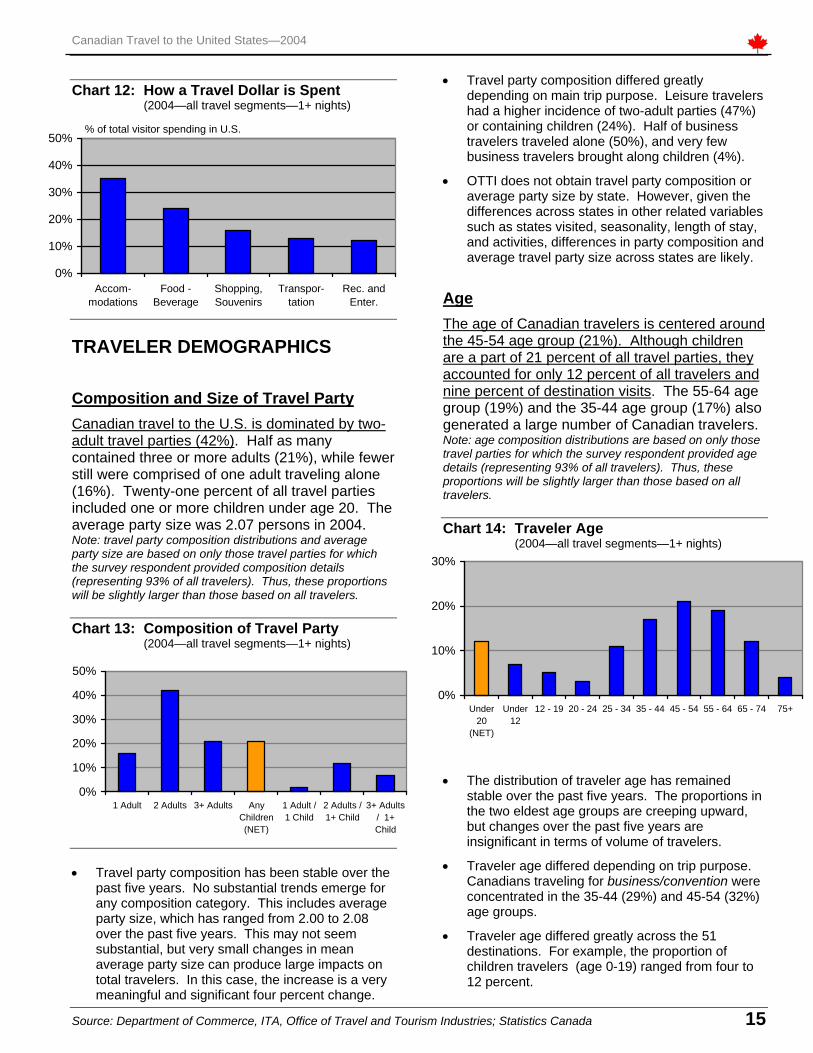
Visitor Spending Canadian visitors spent a total of US$6.63 billion dollars in the U.S. Accommodations accounted for the largest share of this amount (35%), followed by food and beverage (24%). Lower shares of total spending were made for shopping, souvenirs, etc. (16%), transportation while in the U.S. (13%), and recreation and entertainment (12%). Note: some respondents don’t provide spending details. Each spending category’s share of total is based on the spending reported with detail (78% of the total amount). • Trip spending by category has shown only very
small shifts in the past five years. Accommodations has dominated the proportion of total spending over the past five years, even though its proportion has decreased from 38 percent of spending in 2000 to 35 percent in 2004. Conversely, the proportion spent on other goods and services, which includes shopping and souvenirs, has increased from 14 percent in 2000 to 16 percent in 2004.
• Trip spending behavior differs greatly depending on main trip purpose. Business/convention travelers used a much higher proportion of their total spending on accommodations (49%) and a smaller proportion on recreation and entertainment (6%). Travelers who spent the highest proportions on souvenirs and shopping were those visiting friends or relatives (29%) and those traveling for other miscellaneous reasons (25%).
• Details of visitor spending are not available at the individual destination level.
Spending on a travel party basis increased in 2004 to $1,143, a six percent increase from the 2003 level of $1,082. Spending per visitor also increased six percent to reach $479 due to a stable party size. Length of stay increased very slightly in 2004 (increase from 7.68 nights to 7.73 nights). These three factors combined—travel party spending, party size, and length of stay—produce a spending per visitor per day average. This measure inched up from $59 to $62 because party spending was much higher (the numerator in the ratio), but party size and length of stay were slightly higher (the denominator in the ratio). Thus, the increase in total visitor spending reflects increases in both the number of visitors and average spending per visitor.
Canadian Travel to the United States—2004
Source: Department of Commerce, ITA, Office of Travel and Tourism Industries; Statistics Canada 15
Chart 12: How a Travel Dollar is Spent (2004—all travel segments—1+ nights)
TRAVELER DEMOGRAPHICS
Composition and Size of Travel Party Canadian travel to the U.S. is dominated by two-adult travel parties (42%). Half as many contained three or more adults (21%), while fewer still were comprised of one adult traveling alone (16%). Twenty-one percent of all travel parties included one or more children under age 20. The average party size was 2.07 persons in 2004. Note: travel party composition distributions and average party size are based on only those travel parties for which the survey respondent provided composition details (representing 93% of all travelers). Thus, these proportions will be slightly larger than those based on all travelers.
Chart 13: Composition of Travel Party (2004—all travel segments—1+ nights)
• Travel party composition has been stable over the
past five years. No substantial trends emerge for any composition category. This includes average party size, which has ranged from 2.00 to 2.08 over the past five years. This may not seem substantial, but very small changes in mean average party size can produce large impacts on total travelers. In this case, the increase is a very meaningful and significant four percent change.
• Travel party composition differed greatly depending on main trip purpose. Leisure travelers had a higher incidence of two-adult parties (47%) or containing children (24%). Half of business travelers traveled alone (50%), and very few business travelers brought along children (4%).
• OTTI does not obtain travel party composition or average party size by state. However, given the differences across states in other related variables such as states visited, seasonality, length of stay, and activities, differences in party composition and average travel party size across states are likely.
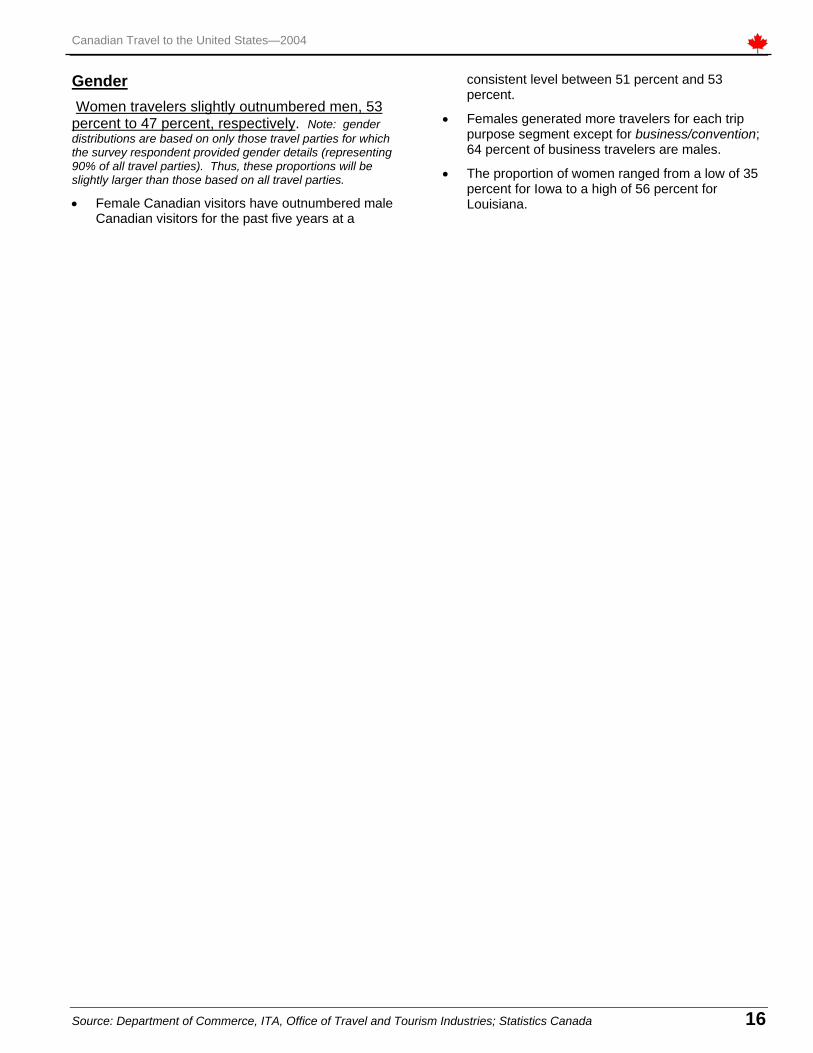
Age The age of Canadian travelers is centered around the 45-54 age group (21%). Although children are a part of 21 percent of all travel parties, they accounted for only 12 percent of all travelers and nine percent of destination visits. The 55-64 age group (19%) and the 35-44 age group (17%) also generated a large number of Canadian travelers. Note: age composition distributions are based on only those travel parties for which the survey respondent provided age details (representing 93% of all travelers). Thus, these proportions will be slightly larger than those based on all travelers.
Chart 14: Traveler Age (2004—all travel segments—1+ nights)
• The distribution of traveler age has remained stable over the past five years. The proportions in the two eldest age groups are creeping upward, but changes over the past five years are insignificant in terms of volume of travelers.
• Traveler age differed depending on trip purpose. Canadians traveling for business/convention were concentrated in the 35-44 (29%) and 45-54 (32%) age groups.
• Traveler age differed greatly across the 51 destinations. For example, the proportion of children travelers (age 0-19) ranged from four to 12 percent.
0%
10%
20%
30%
40%
50%
1 Adult 2 Adults 3+ Adults AnyChildren(NET)
1 Adult /1 Child
2 Adults /1+ Child
3+ Adults/ 1+Child
0%
10%
20%
30%
Under20
(NET)
Under12
12 - 19 20 - 24 25 - 34 35 - 44 45 - 54 55 - 64 65 - 74 75+
0%
10%
20%
30%
40%
50%
Accom-modations
Food -Beverage
Shopping,Souvenirs
Transpor-tation
Rec. andEnter.
% of total visitor spending in U.S.
Canadian Travel to the United States—2004
Source: Department of Commerce, ITA, Office of Travel and Tourism Industries; Statistics Canada 16
Gender Women travelers slightly outnumbered men, 53 percent to 47 percent, respectively. Note: gender distributions are based on only those travel parties for which the survey respondent provided gender details (representing 90% of all travel parties). Thus, these proportions will be slightly larger than those based on all travel parties. • Female Canadian visitors have outnumbered male
Canadian visitors for the past five years at a
consistent level between 51 percent and 53 percent.
• Females generated more travelers for each trip purpose segment except for business/convention; 64 percent of business travelers are males.
• The proportion of women ranged from a low of 35 percent for Iowa to a high of 56 percent for Louisiana.

Canadian Travel to the United States—2004
Source: Department of Commerce, ITA, Office of Travel and Tourism Industries; Statistics Canada 17
Appendix A— BACKGROUND & METHODOLOGY
[From Statistics Canada]
Statistical series on travel between Canada and other countries originated in the early 1920s primarily as a requirement for the Canadian Balance of International Payments.
The method of collection relied heavily on the detailed administrative records of the Canada Border Services Agency (CBSA) and Citizenship and Immigration Canada authorities to obtain the number of border crossings and on the officers from these departments to distribute questionnaires to a sample of travelers in order to collect information on their trip spending.
The accuracy of these methods depended on the completeness of the records of traveler movements and the representativeness of the sample expenditures derived for each category of traveler.
The statistical processes continued to rely on the administrative records of co-operating departments until 1972. Several changes in the methods of documenting visitors and resident travelers, resultant from policy revisions by the Customs and Immigration programs, have led in the past to changes in definitions and breaks in statistical continuity. The purpose of the change in 1972 was to standardize definitions, methods and requirements for the collection of traveler counts, in light of the movement toward facilitation of traffic flows, and as a means of more adequately controlling the survey results.
The original purpose of the questionnaire surveys was to collect expenditure data only, to be applied to the traveler movements, to derive aggregate expenditures on visitors to Canada and residents returning from abroad. The first questionnaires were short and contained only three or four questions. Response was large and consistent.
As travel gained in size and importance to the Canadian economy, the tourism industry voiced the need for more detailed information on the traveler for market research and industry planning. The questionnaires were gradually expanded to include as many as 19 questions on different characteristics, including purpose of trip, duration, locations visited, types of accommodation used, activities and expenditures. The last major changes to the questionnaires were made in 1990. However, minor modifications were introduced in 2001.
Prior to 1990, questionnaires for United States residents visiting Canada were distributed to these
travelers when returning to their country by United States Customs officials. The questionnaires were processed by the United States Department of Commerce and the results were sent to Statistics Canada. Since 1990, questionnaires are distributed to residents of the United States upon entering Canada during sampling periods by CBSA officials. Completed questionnaires are mailed to Statistics Canada for processing.
Between 2000 and 2001, several methodological initiatives were developed to improve the quality of the estimates based on the questionnaire surveys. These initiatives include a bias adjustment to the population weights, a procedure for imputing international transportation fares and total trip spending, an air exit survey of overseas visitors, regional weighting of questionnaires from overseas visitors, a new production schedule to accommodate the inclusion of new questionnaires and a new method for calculating the coefficients of variation.
In 2003, the 2000 and 2001 data from the questionnaire surveys have been revised to incorporate the results of these initiatives. Since 2003, these initiatives are part of the new methodology used to produce estimates from the questionnaire surveys. This new methodology is summarized under “Questionnaire surveys” in the “Description of methods” section. Also, documents describing in a more detailed fashion the new methodology and each of the new initiatives are available upon request.
The introduction of this new methodology results in a break in the time series of estimates based on the questionnaire surveys. Consequently, data from previous years are not comparable to revised 2000 and 2001 data and data published since 2003. However, revised 2000 and 2001 data allow users to make comparisons back to 2000.
The methodology used may be subject to two types of bias: a distribution bias, that is, the questionnaires may not be handed to a random selection of travelers and a non-response bias, that is, returns may not be representative of the traveling public.
Although about 51,300 questionnaires obtained from non-resident parties entering Canada and 48,200 from returning residents were used to produce the 2004 estimates, these numbers represent less than 1.0 percent of the total traffic.
Given the size of the sample, the basic purpose of the questionnaire surveys (the estimation of visitors’
Canadian Travel to the United States—2004
Source: Department of Commerce, ITA, Office of Travel and Tourism Industries; Statistics Canada 18
spending at the Canada and regional level and spending of resident travelers by region of the world) continues to be met with reasonable levels of reliability providing the assumption of negligible biases is not violated. Estimations of expenditures and other characteristics at lower levels of aggregation, such as certain provincial data and detailed cross-classifications, strain the capacity of the survey; the resultant estimates are less reliable and several of them are not sufficiently reliable to be published, as can be seen in several tables of this publication.
Travel and the Balance of Payments
Spending by non-residents visiting Canada (receipts) and spending by Canadian residents returning from trips abroad (payments) are incorporated in the travel account which is an integral part of the current account of the Canadian Balance of International Payments. In 2003, travel receipts, included in exports as “services,” accounted for about 3.0 percent of all current receipts while travel payments, included in imports as “services,” represented approximately 3.9 percent of all current payments.
In the context of the Canadian Balance of Payments, receipts on travel account are defined to include all expenses incidental to travel in Canada by non-residents. Among these are expenditures in Canada for lodging, food, entertainment, local and intercity transportation and all other purchases of goods and services (including gifts) made by travelers. The series thus includes any purchases of personal goods to be exported by travelers. Also included are medical expenses and education expenses of non-residents in Canada as well as foreign crew members’ spending in the country.
Payments on travel account are correspondingly defined to include all expenses incidental to travel abroad by residents of Canada. Among these are expenditures abroad for lodging, food, entertainment, local and intercity transportation and all other purchases of goods and services (including gifts) made by the travelers. The series thus includes any purchases of goods to be imported for personal use by travelers. Also included are medical expenses and education expenses of Canadian residents outside Canada as well as Canadian crew members’ spending in other countries.
The travel account does not conform precisely to the concepts recommended by the International Monetary Fund (IMF). Under those concepts, the following expenditures items which are included in the Canadian international travel account should be shown in other balance of payments accounts:
Receipts or Payments IMF concept
It should be noted that travel receipts exclude international transportation fares paid by non-resident travelers to Canadian carriers. Also, travel payments do not include international transportation fares paid by Canadian residents to foreign carriers. In both cases, these expenditures are included in another balance of payments account, in accordance to the IMF conceptual framework.
Description of methods
Two methods are presently used to collect international travel statistics: the “Frontier counts” and the “Questionnaire surveys.” Both of these methods depend greatly on the co-operation of CBSA in the collection of the number of border crossings and the distribution of questionnaires to international travelers.
Frontier counts
All ports of entry across Canada participate in determining the number of travelers by selected categories and by type of transportation, as well as the number of cars, trucks, motorcycles, snowmobiles and bicycles in the case of highway and ferry points.
The forms used by Customs officials in the enumeration process are described as follows:
E-62 Entry Tally. Form used to record the number of daily travelers and vehicles arriving by land and by ferry, at points of entry on the United States-Canada border. Each form indicates the number of automobiles, trucks, motorcycles, bicycles, snowmobiles and their associated travelers cleared for entry by CBSA agents, as well as the travelers coming in to Canada by other modes of transport such as bus, train and on foot. In 1998, the Primary Automated Lookout System (PALS) was introduced at a few test ports to replace the manual E-62 tally. Presently, 32 ports across Canada utilize this automated system to record over 87.0 percent of Canada’s international automobile traffic.
E-63 Commercial and Private Craft/Passenger and Crew Arrivals. Form used to record travelers entering Canada by private plane or boat. This form is also used to record travelers and crews on commercial freighters, passenger ferries, cruises and some commercial air flights.
The CANPASS telephone reporting system also records the number of travelers entering Canada by private plane or boat. The CANPASS system also allows pre-authorized travelers, as well as special permit holders, to cross the border by car without CBSA’s agents’ interaction.
Canadian Travel to the United States—2004
Source: Department of Commerce, ITA, Office of Travel and Tourism Industries; Statistics Canada 19
E-311 Customs Declaration Card. Form used to record on a census basis travelers entering Canada by commercial plane, including schedule and charter arrivals, at the 18 major international airports. The family Customs Declaration Card was introduced in April 1999. The purpose of this card is to facilitate the clearing of international travelers at the point of entry. Up to four family members living at the same address are allowed on the same card compared to only one person on the old individual E-311 card. In order to estimate the number of travelers recorded on the family Customs Declaration Cards, data capture is done on a sample or census basis depending on the traveler type and airport size (see table). For other airports, census based administrative data is obtained from E-63 forms to produce the estimates.
Detailed instructions are provided to aid Customs officials in the task of collecting data on these documents. A continual liaison function is performed by the International Travel Section with the supplying department, CBSA, to review, discuss and resolve inconsistencies in the reported figures.
A monitoring system has been established to compare incoming data with information available from independent sources, such as airport management reports, toll figures, provincial road counters, etc. The above, as well as reference to weather reports, special events and direct contacts with port authorities, helps the verification and the explanation of irregular fluctuations in reported figures.
The completed forms are submitted continuously to Statistics Canada for processing, analysis and publication. In 2004, the number of documents processed was estimated as follows: 164,300 E-62; 363,200 E-63; and 12,837,800 E-311.
Questionnaire surveys
Continuous questionnaire surveys are used to secure information on the expenditures and other characteristics of international trips and travelers to and from Canada.
Collection methods and questionnaires
Mail-back questionnaires are handed out each quarter to the travel party on entry (non-residents) or re-entry (residents of Canada) by CBSA officials according to pre-arranged schedules. Five different questionnaires are used in the collection process.
Since 1979, a stint distribution system is used to distribute these questionnaires to travelers at all border ports sampled. A stint consists of a selected period of several days during which questionnaires are to be distributed to eligible travelers. Each port involved in this scheme receives, for each of its stints,
a specific quantity of numbered questionnaires and a date on which to start the distribution. On the start date, the officers hand out the questionnaires on a continuous basis to the appropriate traveling population until they have all been distributed. The Liaison staff of the International Travel Section call each port the day before the stint is to start to make sure the questionnaires have arrived and to remind the officers to start the distribution the next day. In this way, the questionnaire return rate of each stint and the length of the stint can all be used as a measure of performance for each stint.
The number of questionnaires distributed in each port for each quarter is set by taking into account the number of travelers who cleared customs through the port in that quarter during the previous year, as estimated by the frontier counts. Respondents are requested to mail back their completed questionnaires in Canada (for Canadian and overseas travelers) or from the United States (for U.S. travelers).
Here is a brief description of the mail-back questionnaires.
Questionnaire (8-2200-356) for United States travelers visiting Canada. Distributed by CBSA officials during sampling periods to travelers residing in the United States at most land, air and some sea ports. However, at land ports, questionnaires are distributed only to United States residents taking an overnight car trip to Canada or entering Canada by a mode of transportation other than auto. The questionnaires are completed by the travelers and returned to Statistics Canada for processing.
Questionnaire (8-2200-337) for residents of countries other than the United States visiting Canada. Distributed by CBSA officials during sampling periods to travelers residing in overseas countries at most land, air and some sea ports; the questionnaires are completed by the travelers and returned to Statistics Canada for processing.
Questionnaire (8-2200-336) for Canadian residents returning from trips outside Canada. Distributed by CBSA officials during sampling periods to Canadian residents re-entering Canada, at most land, air and some sea ports. However, at land ports, questionnaires are distributed to all Canadian residents who took a trip abroad except those returning from a same-day car trip to the United States. The questionnaires are completed by the travelers and mailed to Statistics Canada for processing.
Questionnaire (8-2200-338) for Canadian residents returning from a same-day trip to the United States by auto (a visit of less than 24 hours). Distributed by CBSA officials to the drivers of Canadian vehicles who

Canadian Travel to the United States—2004
Source: Department of Commerce, ITA, Office of Travel and Tourism Industries; Statistics Canada 20
return to Canada after a same-day trip to the United States by auto. The questionnaires are completed and mailed to Statistics Canada for processing. Since the same-day traffic is considered to be fairly homogeneous, a less frequent sample is taken than for the longer-term traffic.
Questionnaire (8-2200-345) for United States residents entering Canada by auto for a same-day trip (a visit of less than 24 hours). Distributed by CBSA officials to the drivers of United States vehicles taking a same-day trip to Canada. The questionnaires are completed and mailed to Statistics Canada for processing. Since the same-day traffic is considered to be fairly homogeneous, a less frequent sample is taken than for the longer-term traffic.
In the case of overseas travelers returning directly (as opposed to via the United States) to selected overseas countries, additional questionnaires are obtained via the Air-Exit Survey of Overseas Visitors (AES).
This survey has been conducted by Statistics Canada since 2000. Its primary objective is to improve the quality of estimates on the characteristics of trips and travelers by air from overseas countries. Personal interviews are conducted in designated airports in Canada. It is an add-on to mail-back questionnaires distributed by CBSA officials to residents of overseas countries visiting Canada.
At the international airports in five cities (Vancouver, Calgary, Toronto, Montreal and Halifax), Statistics Canada’s interviewers conduct personal interviews with a sample of overseas travelers as they await their return flights to targeted overseas countries. The countries targeted are those from whom we attract the most visitors. They include principally the United Kingdom, France, Germany and Japan, as well as a number of smaller markets, such as Switzerland and South Korea. These interviews are conducted each month and the collection period lasts three to five days.
The number of interviews targeted at each airport for a particular month and a particular overseas country is obtained by selecting a representative sample of flights to the selected country. During the collection period, interviewers arrive at the departure lounges for the selected flights in order to interview departing overseas visitors. All overseas visitors on the selected flights are interviewed until the first boarding call whether or not they are of the targeted countries. The interviewing team consists of interviewers of different language skills, enabling interviews to be conducted in the native language of the travelers where possible. The questionnaire used
(Questionnaire 8-2200-400) is a customized version of questionnaire 8-2200-337 and is available in ten languages.
About 7,300 interviews were completed in 2003. Since 2000, this collection method has achieved a response rate of over 90.0 percent.
Processing and imputation of questionnaires
All mail-back and AES questionnaires for a given quarter are submitted to a complex control system and the reported data are captured, coded and verified. Only questionnaires accepted by the system are ultimately used for the production of the estimates for the quarter.
A certain amount of data imputation is performed in specific fields of accepted questionnaires. Missing international transportation fares and/or total trip spending are imputed if the remainder of the fields on the questionnaire are valid. The imputed values of the recipient questionnaire are calculated by taking into account the mean of corresponding fields on donor questionnaires that have trip characteristics identical to those of the recipient questionnaire.
Total imputation (i.e. imputation of complete questionnaires) is carried out for all Port Factor groups (PFGs)1 or strata that are outside the scope of mail-back questionnaire distribution. There are 123 Canadian and American PFGs for which Statistics Canada never receives questionnaires. These PFGs refer to modes of entry that are not targeted by the questionnaire distribution (train, private plane or boat, motorcycle, bicycle, pedestrians, etc.) or to ports of entry that do not participate in the distribution of questionnaires. For these out-of-scope PFGs, the characteristics of travelers and trips are estimated, using imputed questionnaires. These imputed questionnaires are duplicates of questionnaires that were obtained in 1990 for the same quarter and same PFGs. In 2004, these questionnaires represented only 3.3 percent of total visitors from the United States to Canada and 1.9 percent of Canadian residents who traveled outside Canada.
Total imputation is also performed for any in-scope PFG for which we have received an insufficient number of questionnaires for the quarter. In these instances, all the questionnaires from the same quarter of the previous year that belong to the PFG are brought forward and added to the sample of that PFG for the reference quarter. 1 In the International Travel Survey, the target populations (American, overseas and Canadian international travelers) are partitioned into 608 Port Factor Groups, based on selected characteristics such as country of residence, mode of entry and duration of stay.

Canadian Travel to the United States—2004
Source: Department of Commerce, ITA, Office of Travel and Tourism Industries; Statistics Canada 21
In 2003, 51,300 questionnaires from non-resident travelers and 48,200 questionnaires completed by resident travelers were used to produce estimates.
Weighting
For estimation purposes, the responses obtained through the questionnaire surveys must be treated as a simple random sample from the total traffic in each stratum (port or group of ports, by type of traffic, by quarter). The data may in fact be subject to some degree of “distribution bias,” due to the fact that the questionnaires may not be handed to a random selection of travelers, or to a “non-response bias” due to the fact that the individuals replying may not be representative of the population.
Weighting techniques used in the estimation process attempt to reduce the effect of these two types of bias. In order to do so, the questionnaires completed by the international travelers are disaggregated by known characteristics into homogenous groups referred to as Port Factor Groups (PFG). In the case of questionnaires obtained from the United States and Canadian travelers, those characteristics are port of entry, type of traveler, mode of entry and duration of stay. In the case of questionnaires obtained from overseas travelers, the characteristics used are country of residence and type of entry. For example, three of the main factor groups include questionnaires from American travelers entering and leaving on the same day by car, those from American travelers staying one night and those from American travelers staying two or more nights.
The questionnaires for each PFG are first weighted according to frontier counts. The weights assigned to all questionnaires for a given PFG are such that the estimate of the number of travelers derived from these questionnaires matches the frontier count for that PFG.
A second stage of weighting called the bias adjustment is done for questionnaires completed by certain categories of air travelers. These include U.S. travelers, Canadian travelers returning from the U.S. and Canadian travelers returning directly from overseas countries who all came through the international airports of Vancouver, Toronto, and Montreal. They also include overseas air travelers originating from the United Kingdom, Germany, France and Japan.
This second stage consists of modifying the initial weights of questionnaires that were obtained from these travelers in order to incorporate more reliable information on trip purpose and duration. This information is derived from a sample of Customs declaration cards (E-311 cards) completed by these travelers. Adjustments to the initial weights are such
that estimates on trip purpose and duration compiled from the questionnaires correspond to those obtained from the E-311 cards.
By using more data from the E-311 cards, the procedure for weighting air traveler questionnaires has become more accurate. The use of more precise weights provides better quality estimates and limits the possibility of bias in the questionnaire results obtained for air travelers.
In addition, a supplementary adjustment, called the regional weighting adjustment, is done to the weights assigned to overseas questionnaires to take into account the region of entry of the travelers. Using the raking-ratio statistical technique, this adjustment ensures that the derived estimates of the number of travelers from the questionnaires closely match the frontier counts at the region of entry level (by type of entry), while maintaining an exact match at the country of residence level. The provincial composition of the five regions used in the process is as follows: Atlantic (Newfoundland, Prince Edward Island, Nova Scotia, New Brunswick), Quebec, Ontario, Prairies (Saskatchewan, Manitoba, Alberta) and British Columbia (including Yukon, Northwest Territories and Nunavut).
In general, this adjustment allows for the production of more consistent and more reliable estimates on the characteristics of overseas visitors at the regional level. However, the raking-ratio does not guarantee the matching estimates by country of residence, region of entry as well as type of entry.
Production schedule
Each quarter’s data on the characteristics of international trips are first released as preliminary estimates, about five months after the end of the quarter. These estimates are based on all questionnaires for the quarter that are obtained before the preliminary cut-off date for the collection, which is about two and a half months after the end of the quarter.
Three months later, the revised estimates for the quarter are released, together with the preliminary estimates for the next quarter. Included in the production of the revised estimates are all questionnaires for the quarter that are received before the final cut-off date for the collection, which is about five and a half months after the end of the quarter.
Reliability indicators
In sample surveys, since inference is made about the entire population covered by the survey on the basis of data obtained from only a part (sample) of the
Canadian Travel to the United States—2004
Source: Department of Commerce, ITA, Office of Travel and Tourism Industries; Statistics Canada 22
population, the results are likely to be different from the “true” population values. The true population values in this context refer to the values that would have been obtained when the entire population was surveyed under the same conditions. The error arising due to drawing inferences about the population on the basis of information from the sample is termed sampling error.
The sampling error, in addition to the size of the sample, depends on factors such as variability in the population, sampling design and method of estimation.
Additionally, even if the sample design, the size of the sample, and the estimation procedure were the same, different characteristics (on which data have been collected from the sample) would possess different sampling errors, due to the fact that they have different degrees of variability in the population. For instance, the sampling error for expenditure estimates would be different from the sampling error for length of stay, both estimates being based on the same sample. Each of the possible samples would yield somewhat different sets of results. The sampling errors are measures of the variation of all the possible sample estimates around the true values.
The expected value of a variable is the average of the variable taken over all possible samples weighted by the probability of drawing the sample. The difference between the expected value of an estimate and the corresponding true value is called the bias of the estimate. The mean square error of an estimate is defined as the expected value of the square of the deviation of the estimate from the true value. The variance of an estimate is defined as the expected value of the square of the deviation of the estimate from its expected value. Thus, when an estimate is unbiased (i.e., its bias is zero), its variance and mean square error are equal.
The accuracy of estimates from sample surveys is affected by both variance and bias. Under the assumption of simple random sampling within each stratum and with the further assumption of absence of bias, the variance of an estimated characteristic value is a good indicator of its reliability. Since the true variance of the estimate depends, like the estimate itself, on the whole population, it must be estimated from the available sample.
A notable feature of probability sampling is that the quality of the estimates may be estimated from the sample itself. The estimated coefficient of variation is defined as the ratio of the square root of the estimated variance to the estimate itself. Guides to the potential size of sampling errors are provided by the estimated coefficients of variation. The quality of the estimate increases as the corresponding coefficient of variation decreases.
Given the complex nature of the sampling design of the questionnaire surveys, simple calculations of the variance using standard methods tend to underestimate it. Consequently, Statistics Canada uses the “bootstrap” method for estimating the variance. Under this method, the sample units are sub-sampled and re-weighted many times over. From these sub-samples, an estimated variance is obtained to calculate the estimated coefficient of variation.
In all tables in the publication, the estimated coefficients of variation were used to evaluate the reliability of estimates derived from the questionnaire surveys. The reliability of these estimates is identified as follows:
Coefficient Reliability Identification of variation level in tables
0.0-16.5 Good Estimates released without restrictions
16.6-25.0 Fair Estimates followed by the letter E
25.1 and over Poor to very poor Estimates are not released and replaced by the letter F
Dissemination
In addition to this publication, international travel statistics can be obtained by accessing or purchasing the following products.
Data from the frontier counts are available in CANSIM, Tables 427-0001 to 427-0006. Data on the international travel account are also available in CANSIM, Table 376-0003. Annual data on the characteristics of international trips are available free of charge on Statistics Canada’s website, under the heading “Canada in Statistics.”
Statistics Canada Daily, Travel between Canada and other countries, Catalogue no. 11-001-XIE. Publishes preliminary monthly international travelers frontier counts as soon as they become available – usually six weeks after the reference month. This release covers the four traveling populations at the national level: United States residents visiting Canada, residents from overseas countries visiting Canada, Canadian residents returning from the United States and Canadian residents returning from overseas countries.
Statistics Canada Daily, Characteristics of international travelers, Catalogue no.11-001-XIE.
Approximately five months after the end of the quarter, an analytical text about the trends in the main characteristics of international travelers is released in the Daily to announce the availability of preliminary data on international travelers characteristics.
Canadian Travel to the United States—2004
Source: Department of Commerce, ITA, Office of Travel and Tourism Industries; Statistics Canada 23
Statistics Canada Daily, International travel account, Catalogue no.11-001-XIE. Approximately two months after the end of the quarter, an analysis of the trends in the international travel account is released in the Daily to announce the availability of preliminary data on international travel account.
International Travel, Advance Information, Catalogue no. 66-001-XIE. A monthly four-page document listing preliminary figures on international travelers is usually available six weeks after the reference month. Page one breaks down the number of foreign visitors and Canadian residents returning to Canada by mode of transport and length of stay. Page two outlines a selected list of categories of foreign overnight travelers to Canada by province of entry. Page three gives a detailed list of Canada’s major overseas travel markets and page four provides a breakdown of Canadian overnight travelers returning by province of re-entry from both the United States and all other countries.
Micro-data files. Available per flow per quarter. Three flows exist: Canadian residents returning from the United States, Canadian residents returning from overseas countries, United States residents visiting Canada and residents from overseas countries visiting Canada. It is also possible to obtain a sub-flow which
could be, for example, Ontario residents, aged 55 or older, visiting Florida or residents of Asian countries on a business trip to Canada and visiting British Columbia.
For More Information
Specific inquiries about tourism statistics should be directed to:
Client Services Culture, Tourism and the Centre for Educational Statistics, Statistics Canada, Ottawa, Ontario, K1A 0T6 CANADA 1-800-307-3382 [email protected]
You can also get information on a wide range of data on tourism and other statistics as well as a description of survey methodology on the Statistics Canada website at www.statcan.ca.
Custom tabulations on the data from which this report is based can be purchased directly from Statistics Canada. Data can be purchased and downloaded directly from the website using a credit card.
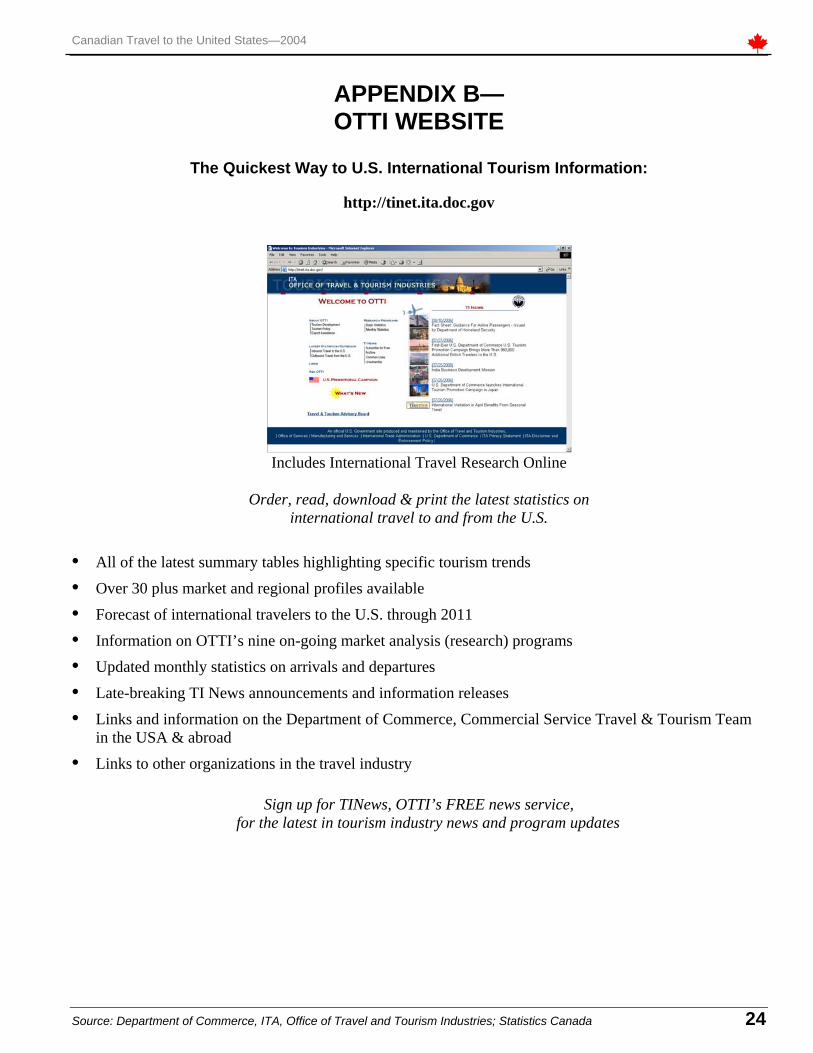
Canadian Travel to the United States—2004
Source: Department of Commerce, ITA, Office of Travel and Tourism Industries; Statistics Canada 24
APPENDIX B— OTTI WEBSITE
The Quickest Way to U.S. International Tourism Information:
http://tinet.ita.doc.gov
Includes International Travel Research Online
Order, read, download & print the latest statistics on
international travel to and from the U.S.
• All of the latest summary tables highlighting specific tourism trends • Over 30 plus market and regional profiles available
• Forecast of international travelers to the U.S. through 2011 • Information on OTTI’s nine on-going market analysis (research) programs • Updated monthly statistics on arrivals and departures • Late-breaking TI News announcements and information releases
• Links and information on the Department of Commerce, Commercial Service Travel & Tourism Team in the USA & abroad
• Links to other organizations in the travel industry
Sign up for TINews, OTTI’s FREE news service, for the latest in tourism industry news and program updates
Canadian Travel to the United States—2004
Source: Department of Commerce, ITA, Office of Travel and Tourism Industries; Statistics Canada 25
Appendix C— RESEARCH AND MARKETING ASSISTANCE
For additional research information or assistance in marketing your U.S. destination in the Canadian market, please use the following resources:
• Monthly Arrivals tables posted to the OTTI website include historical monthly arrivals for the past ten years. Go to: http://www.tinet.ita.doc.gov/view/m-2006-I-001/table1.html
• The Canadian data page provides reports & other links for assistance on the market. Go to: http://www.tinet.ita.doc.gov/outreachpages/inbound.country_in_north_america.canada.html
• For more information on the Canadian research program administered by OTTI, go to: http://www.tinet.ita.doc.gov/research/programs/canada/index.html
• For any other specific questions on the Canadian travel market, please contact the OTTI office at (202) 482-0140. Mr. Mark Brown, Market Research Analyst for OTTI, manages this program and can be reached at (202)-482-4754.
• The Commercial Service is a network of export and industry specialists located in more than 100 U.S. cities and more than 80 countries worldwide. These trade professionals provide counseling and a variety of products and services to assist small and midsized U.S. businesses. The primary Canada Commercial Service Specialists are:
Cheryl Schell Commercial Specialist—Travel & Tourism U.S. Commercial Service—Vancouver 1095 West Pender St., 19th Floor Vancouver, British Columbia V6E 2M6 CANADA Telephone: (604) 642-6679 Email: [email protected] Viktoria Palfi Commercial Specialist—Travel & Tourism U.S. Commercial Service—Toronto Suite 602 - 480 University Avenue Toronto, Ontario, M5G 1V2 CANADA Telephone: (416)-595-5412 (ext. 229) Email: [email protected]
U.S. Commercial Service Products and Services
The U.S. Commercial Service is part of the International Trade Administration but delivers its online content through the U.S. Government’s export portal, www.Export.gov. Available programs are described below.
Counseling and Advocacy
Counseling
U.S. Commercial Service trade specialists near you work directly with our team of in-market experts in getting you the information and advice that you need to succeed. We can help you:
• Determine the best markets for your products and services
• Develop an effective export strategy • Evaluate international competitors • Identify and comply with legal and regulatory
issues • Locate export financing • Settle disputes • Win contract bids • Learn about cultural issues and business protocol • Find a U.S. Export Assistance Center near you or
call 1-800-USA-Trade Advocacy
Get a competitive edge with U.S. Commercial Service Advocacy. U.S. diplomats and other officials help your company when unanticipated problems arise—resolve payment issues, settle disputes, win contracts, and overcome regulatory hurdles. Support can include government-to-government meetings by U.S. Commercial Service officers and ambassadors with high-level foreign government officials, in addition to direct intervention with international companies.
Platinum Key Service
Get long-term, comprehensive, customized support to achieve your business goals. The Platinum Key Service is solution-oriented and custom-tailored to your needs. Identify markets, launch products, develop major project opportunities, resolve market entry questions, and receive assistance on regulatory matters. Our in-country trade specialists will work closely with you to identify needs, provide progress reports, and ensure timely resolution.
Market Research
Canadian Travel to the United States—2004
Source: Department of Commerce, ITA, Office of Travel and Tourism Industries; Statistics Canada 26
Market Research Library
Accurate, up-to-date information lets you target the best international markets. Our comprehensive market research includes overviews on doing business in more than 120 countries and profiles of 110 industry sectors. You can also get updates on new regulations, currency fluctuations, business trends, and government-financed projects. Much of this research is available at no charge.
Customized Market Research
Receive specific intelligence on the export prospects for your product or service in a potential market.
Finding International Partners
International Partner Search
Find qualified buyers, partners, or agents without traveling overseas with the International Partner Search. U.S. Commercial Service specialists will deliver detailed company information about up to five international companies that have expressed an interest in your company's products and services.
Gold Key Matching Service
Save time and money by letting the U.S. Commercial Service help you find a buyer, partner, agent or distributor. The Gold Key Service provides you with one-on-one appointments with pre-screened potential agents, distributors, sales representatives, association and government contacts, licensing or joint venture partners, and other strategic business partners in your targeted export market.
Commercial News USA
Promote your products and services to more than 400,000 international buyers in 145 countries. Commercial News USA is a product catalog distributed by U.S. embassies and consulates worldwide, and has a proven track record of high response rates and solid sales results.
Trade Leads
View announcements from qualified international companies looking to source U.S. products and services and advertise government tender projects through our trade leads database. All of our trade leads are pre-screened by our U.S. embassy or consulate staff overseas and are provided as a free service for U.S. exporters. Search the Trade Leads List.
International Company Profile
Prevent costly mistakes with quick, low-cost credit checks or due-diligence reports on international companies. Before you do business with a prospective agent, distributor, or partner, the International Company Profile will give you the background information you need to evaluate the company.
Trade Events and Related Services
Trade Fair Certification
Exhibiting at a trade show abroad can lead to tremendous export opportunities for U.S. companies. This is why the Trade Fair Certification Program was created: to help companies like yours make important exhibiting decisions and free you of many of the concerns you may have about exhibiting outside the United States.
International Buyer Program
Find new international business partners at U.S. trade shows with the International Buyer Program. The IBP recruits more than 125,000 foreign buyers and distributors to 32 U.S. trade shows per year. U.S. Commercial Service trade specialists arrange meetings for U.S. exporters and international delegates and provide export counseling at the shows' International Business Centers.
Trade Missions
Meet face-to-face with prescreened international business contacts in promising markets with U.S. Commercial Service trade missions. Trade missions save you time and money by allowing you to maximize contact with qualified distributors, sales representatives, or partners in one to four countries. Search the Trade Events List for current trade missions.
Catalog Events
Looking for an affordable, low-risk way to promote your products and services in promising markets around the world? Increase your company's international sales potential by showcasing your products and services with the International Catalog Exhibition Program. Search the Trade Events List for current Catalog Events.
Canadian Travel to the United States—2004
Source: Department of Commerce, ITA, Office of Travel and Tourism Industries; Statistics Canada 27
2004 DATA TABLES
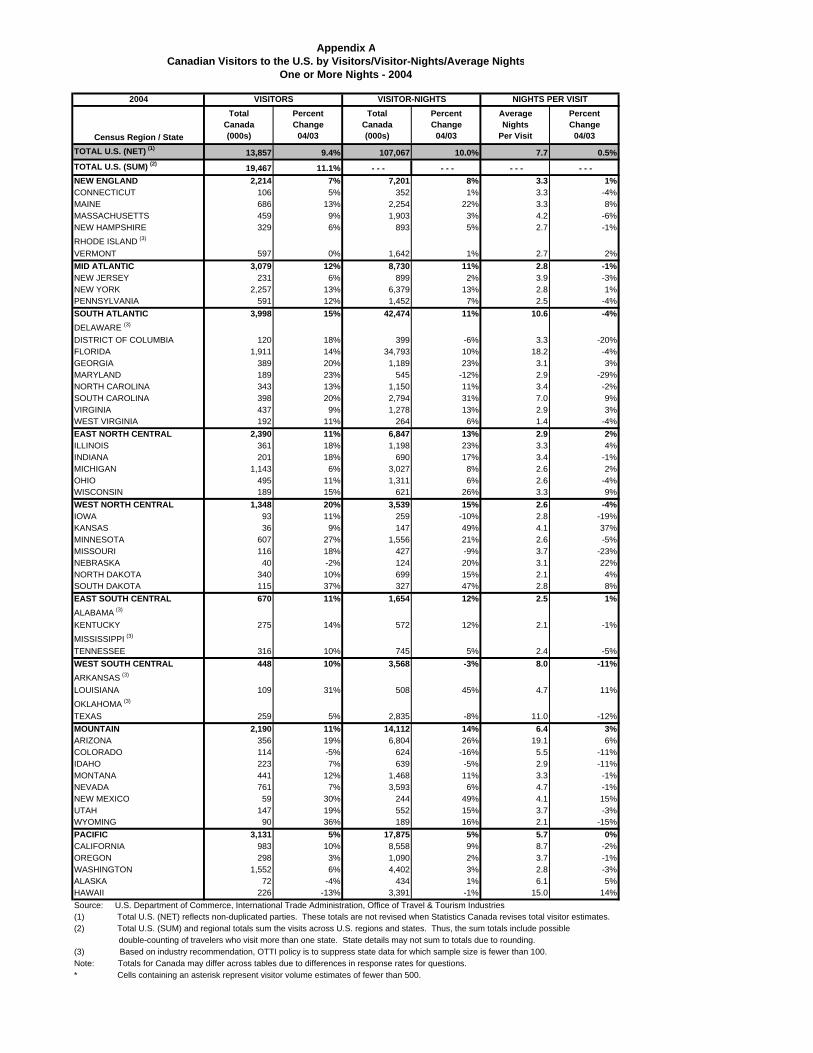
Appendix ACanadian Visitors to the U.S. by Visitors/Visitor-Nights/Average Nights
One or More Nights - 2004
2004 VISITORS VISITOR-NIGHTS NIGHTS PER VISIT
Census Region / State
TotalCanada(000s)
PercentChange
04/03
TotalCanada(000s)
PercentChange
04/03
AverageNights
Per Visit
PercentChange
04/03
TOTAL U.S. (NET) (1) 13,857 9.4% 107,067 10.0% 7.7 0.5%TOTAL U.S. (SUM) (2) 19,467 11.1% - - - - - - - - - - - -NEW ENGLAND 2,214 7% 7,201 8% 3.3 1%CONNECTICUT 106 5% 352 1% 3.3 -4%MAINE 686 13% 2,254 22% 3.3 8%MASSACHUSETTS 459 9% 1,903 3% 4.2 -6%NEW HAMPSHIRE 329 6% 893 5% 2.7 -1%RHODE ISLAND (3)
VERMONT 597 0% 1,642 1% 2.7 2%MID ATLANTIC 3,079 12% 8,730 11% 2.8 -1%NEW JERSEY 231 6% 899 2% 3.9 -3%NEW YORK 2,257 13% 6,379 13% 2.8 1%PENNSYLVANIA 591 12% 1,452 7% 2.5 -4%SOUTH ATLANTIC 3,998 15% 42,474 11% 10.6 -4%DELAWARE (3)
DISTRICT OF COLUMBIA 120 18% 399 -6% 3.3 -20%FLORIDA 1,911 14% 34,793 10% 18.2 -4%GEORGIA 389 20% 1,189 23% 3.1 3%MARYLAND 189 23% 545 -12% 2.9 -29%NORTH CAROLINA 343 13% 1,150 11% 3.4 -2%SOUTH CAROLINA 398 20% 2,794 31% 7.0 9%VIRGINIA 437 9% 1,278 13% 2.9 3%WEST VIRGINIA 192 11% 264 6% 1.4 -4%EAST NORTH CENTRAL 2,390 11% 6,847 13% 2.9 2%ILLINOIS 361 18% 1,198 23% 3.3 4%INDIANA 201 18% 690 17% 3.4 -1%MICHIGAN 1,143 6% 3,027 8% 2.6 2%OHIO 495 11% 1,311 6% 2.6 -4%WISCONSIN 189 15% 621 26% 3.3 9%WEST NORTH CENTRAL 1,348 20% 3,539 15% 2.6 -4%IOWA 93 11% 259 -10% 2.8 -19%KANSAS 36 9% 147 49% 4.1 37%MINNESOTA 607 27% 1,556 21% 2.6 -5%MISSOURI 116 18% 427 -9% 3.7 -23%NEBRASKA 40 -2% 124 20% 3.1 22%NORTH DAKOTA 340 10% 699 15% 2.1 4%SOUTH DAKOTA 115 37% 327 47% 2.8 8%EAST SOUTH CENTRAL 670 11% 1,654 12% 2.5 1%ALABAMA (3)
KENTUCKY 275 14% 572 12% 2.1 -1%MISSISSIPPI (3)
TENNESSEE 316 10% 745 5% 2.4 -5%WEST SOUTH CENTRAL 448 10% 3,568 -3% 8.0 -11%ARKANSAS (3)
LOUISIANA 109 31% 508 45% 4.7 11%OKLAHOMA (3)
TEXAS 259 5% 2,835 -8% 11.0 -12%MOUNTAIN 2,190 11% 14,112 14% 6.4 3%ARIZONA 356 19% 6,804 26% 19.1 6%COLORADO 114 -5% 624 -16% 5.5 -11%IDAHO 223 7% 639 -5% 2.9 -11%MONTANA 441 12% 1,468 11% 3.3 -1%NEVADA 761 7% 3,593 6% 4.7 -1%NEW MEXICO 59 30% 244 49% 4.1 15%UTAH 147 19% 552 15% 3.7 -3%WYOMING 90 36% 189 16% 2.1 -15%PACIFIC 3,131 5% 17,875 5% 5.7 0%CALIFORNIA 983 10% 8,558 9% 8.7 -2%OREGON 298 3% 1,090 2% 3.7 -1%WASHINGTON 1,552 6% 4,402 3% 2.8 -3%ALASKA 72 -4% 434 1% 6.1 5%HAWAII 226 -13% 3,391 -1% 15.0 14%Source: U.S. Department of Commerce, International Trade Administration, Office of Travel & Tourism Industries(1) Total U.S. (NET) reflects non-duplicated parties. These totals are not revised when Statistics Canada revises total visitor estimates.(2) Total U.S. (SUM) and regional totals sum the visits across U.S. regions and states. Thus, the sum totals include possible double-counting of travelers who visit more than one state. State details may not sum to totals due to rounding.(3) Based on industry recommendation, OTTI policy is to suppress state data for which sample size is fewer than 100.Note: Totals for Canada may differ across tables due to differences in response rates for questions.* Cells containing an asterisk represent visitor volume estimates of fewer than 500.

Appendix BCanadian Visitors to the U.S. by Expenditures
One or More Nights - 2004
2004 VISITORS
Census Region / State
TotalCanada(000s)
1+ Nights($US 000s)
PercentChange
04/03
SpendingPer Visitor1+ Nights
($US)
PercentChange
04/03
AverageDaily Per Person
1+ Nights($US)
PercentChange
04/03
TOTAL U.S. (NET) (1) 13,857 6,628,170$ 15.6% 478$ 5.6% 62$ -12.8%TOTAL U.S. (SUM) (2) 19,467 $ 6,542,142 15.6% - - - - - - - - - - - -NEW ENGLAND 2,214 432,038$ 20% 195$ 12% 60$ 10%CONNECTICUT 106 24,487$ 17% 231$ 12% 70$ 16%MAINE 686 131,539$ 29% 192$ 14% 58$ 6%MASSACHUSETTS 459 133,178$ 11% 290$ 1% 70$ 8%NEW HAMPSHIRE 329 52,902$ 19% 161$ 13% 59$ 14%RHODE ISLAND (3)
VERMONT 597 78,428$ 21% 131$ 22% 48$ 20%MID ATLANTIC 3,079 634,069$ 24% 206$ 11% 73$ 12%NEW JERSEY 231 60,261$ -6% 261$ -11% 67$ -9%NEW YORK 2,257 486,939$ 32% 216$ 17% 76$ 16%PENNSYLVANIA 591 86,869$ 13% 147$ 1% 60$ 6%SOUTH ATLANTIC 3,998 2,086,411$ 20% 522$ 4% 49$ 8%DELAWARE (3)
DISTRICT OF COLUMBIA 120 51,279$ 13% 427$ -5% 129$ 20%FLORIDA 1,911 1,596,611$ 17% 836$ 2% 46$ 7%GEORGIA 389 83,950$ 28% 216$ 6% 71$ 3%MARYLAND 189 32,140$ 24% 170$ 1% 59$ 42%NORTH CAROLINA 343 60,120$ 32% 175$ 16% 52$ 19%SOUTH CAROLINA 398 175,669$ 44% 441$ 20% 63$ 10%VIRGINIA 437 67,913$ 17% 155$ 7% 53$ 3%WEST VIRGINIA 192 10,760$ 28% 56$ 16% 41$ 21%EAST NORTH CENTRAL 2,390 476,501$ 16% 199$ 5% 70$ 3%ILLINOIS 361 133,278$ 11% 369$ -6% 111$ -10%INDIANA 201 41,903$ 54% 209$ 30% 61$ 31%MICHIGAN 1,143 165,971$ 7% 145$ 1% 55$ -1%OHIO 495 87,128$ 11% 176$ 0% 66$ 4%WISCONSIN 189 48,221$ 59% 255$ 39% 78$ 27%WEST NORTH CENTRAL 1,348 252,962$ 18% 188$ -1% 71$ 3%IOWA 93 15,315$ 9% 165$ -2% 59$ 21%KANSAS 36 7,800$ -17% 216$ -24% 53$ -45%MINNESOTA 607 116,857$ 26% 193$ -1% 75$ 4%MISSOURI 116 39,298$ 4% 339$ -12% 92$ 14%NEBRASKA 40 5,448$ -23% 136$ -21% 44$ -36%NORTH DAKOTA 340 48,053$ 22% 141$ 10% 69$ 6%SOUTH DAKOTA 115 20,191$ 49% 175$ 9% 62$ 1%EAST SOUTH CENTRAL 670 104,215$ 6% 156$ -4% 63$ -5%ALABAMA (3)
KENTUCKY 275 29,020$ 21% 105$ 7% 51$ 8%MISSISSIPPI (3)
TENNESSEE 316 53,534$ -4% 170$ -13% 72$ -9%WEST SOUTH CENTRAL 448 252,594$ 12% 564$ 2% 71$ 15%ARKANSAS (3)
LOUISIANA 109 71,161$ 35% 652$ 3% 140$ -7%OKLAHOMA (3)
TEXAS 259 167,680$ 8% 648$ 3% 59$ 17%MOUNTAIN 2,190 1,023,472$ 15% 467$ 3% 73$ 0%ARIZONA 356 282,729$ 22% 794$ 2% 42$ -3%COLORADO 114 59,032$ -18% 519$ -14% 95$ -3%IDAHO 223 33,642$ 4% 151$ -2% 53$ 9%MONTANA 441 80,256$ 36% 182$ 21% 55$ 23%NEVADA 761 500,862$ 14% 658$ 7% 139$ 8%NEW MEXICO 59 19,714$ 22% 335$ -6% 81$ -18%UTAH 147 34,353$ 2% 233$ -15% 62$ -12%WYOMING 90 12,885$ 31% 144$ -4% 68$ 13%PACIFIC 3,131 1,279,881$ 6% 409$ 1% 72$ 1%CALIFORNIA 983 647,025$ 11% 658$ 1% 76$ 2%OREGON 298 60,157$ 5% 202$ 2% 55$ 3%WASHINGTON 1,552 223,140$ 9% 144$ 2% 51$ 5%ALASKA 72 41,814$ -17% 583$ -14% 96$ -18%HAWAII 226 307,745$ -2% 1,362$ 13% 91$ -1%Source: U.S. Department of Commerce, International Trade Administration, Office of Travel & Tourism Industries(1) Total U.S. (NET) reflects non-duplicated parties. These totals are not revised when Statistics Canada revises total visitor estimates.(2) Total U.S. (SUM) and regional totals sum the visits across U.S. regions and states. Thus, the sum totals include possible double-counting of travelers who visit more than one state. State details may not sum to totals due to rounding.(3) Based on industry recommendation, OTTI policy is to suppress state data for which sample size is fewer than 100.Note: Totals for Canada may differ across tables due to differences in response rates for questions.* Cells containing an asterisk represent visitor volume estimates of fewer than 500.
VISITOR SPENDING (1+ NIGHTS)
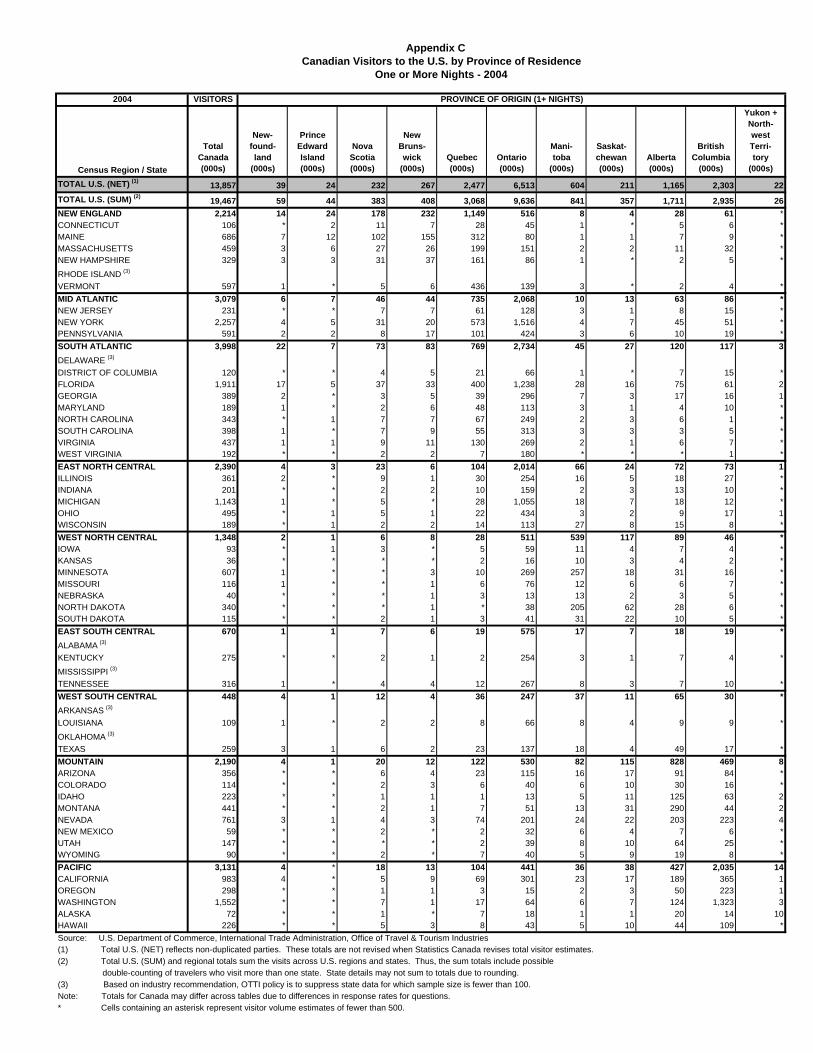
Appendix C Canadian Visitors to the U.S. by Province of Residence
One or More Nights - 2004
2004 VISITORS PROVINCE OF ORIGIN (1+ NIGHTS)
Census Region / State
TotalCanada(000s)
New-found-land
(000s)
PrinceEdwardIsland(000s)
NovaScotia(000s)
NewBruns-wick
(000s)Quebec(000s)
Ontario(000s)
Mani-toba
(000s)
Saskat-chewan(000s)
Alberta(000s)
BritishColumbia
(000s)
Yukon +North-westTerri-tory
(000s)
TOTAL U.S. (NET) (1) 13,857 39 24 232 267 2,477 6,513 604 211 1,165 2,303 22TOTAL U.S. (SUM) (2) 19,467 59 44 383 408 3,068 9,636 841 357 1,711 2,935 26NEW ENGLAND 2,214 14 24 178 232 1,149 516 8 4 28 61 *CONNECTICUT 106 * 2 11 7 28 45 1 * 5 6 *MAINE 686 7 12 102 155 312 80 1 1 7 9 *MASSACHUSETTS 459 3 6 27 26 199 151 2 2 11 32 *NEW HAMPSHIRE 329 3 3 31 37 161 86 1 * 2 5 *RHODE ISLAND (3)
VERMONT 597 1 * 5 6 436 139 3 * 2 4 *MID ATLANTIC 3,079 6 7 46 44 735 2,068 10 13 63 86 *NEW JERSEY 231 * * 7 7 61 128 3 1 8 15 *NEW YORK 2,257 4 5 31 20 573 1,516 4 7 45 51 *PENNSYLVANIA 591 2 2 8 17 101 424 3 6 10 19 *SOUTH ATLANTIC 3,998 22 7 73 83 769 2,734 45 27 120 117 3DELAWARE (3)
DISTRICT OF COLUMBIA 120 * * 4 5 21 66 1 * 7 15 *FLORIDA 1,911 17 5 37 33 400 1,238 28 16 75 61 2GEORGIA 389 2 * 3 5 39 296 7 3 17 16 1MARYLAND 189 1 * 2 6 48 113 3 1 4 10 *NORTH CAROLINA 343 * 1 7 7 67 249 2 3 6 1 *SOUTH CAROLINA 398 1 * 7 9 55 313 3 3 3 5 *VIRGINIA 437 1 1 9 11 130 269 2 1 6 7 *WEST VIRGINIA 192 * * 2 2 7 180 * * * 1 *EAST NORTH CENTRAL 2,390 4 3 23 6 104 2,014 66 24 72 73 1ILLINOIS 361 2 * 9 1 30 254 16 5 18 27 *INDIANA 201 * * 2 2 10 159 2 3 13 10 *MICHIGAN 1,143 1 * 5 * 28 1,055 18 7 18 12 *OHIO 495 * 1 5 1 22 434 3 2 9 17 1WISCONSIN 189 * 1 2 2 14 113 27 8 15 8 *WEST NORTH CENTRAL 1,348 2 1 6 8 28 511 539 117 89 46 *IOWA 93 * 1 3 * 5 59 11 4 7 4 *KANSAS 36 * * * * 2 16 10 3 4 2 *MINNESOTA 607 1 * * 3 10 269 257 18 31 16 *MISSOURI 116 1 * * 1 6 76 12 6 6 7 *NEBRASKA 40 * * * 1 3 13 13 2 3 5 *NORTH DAKOTA 340 * * * 1 * 38 205 62 28 6 *SOUTH DAKOTA 115 * * 2 1 3 41 31 22 10 5 *EAST SOUTH CENTRAL 670 1 1 7 6 19 575 17 7 18 19 *ALABAMA (3)
KENTUCKY 275 * * 2 1 2 254 3 1 7 4 *MISSISSIPPI (3)
TENNESSEE 316 1 * 4 4 12 267 8 3 7 10 *WEST SOUTH CENTRAL 448 4 1 12 4 36 247 37 11 65 30 *ARKANSAS (3)
LOUISIANA 109 1 * 2 2 8 66 8 4 9 9 *OKLAHOMA (3)
TEXAS 259 3 1 6 2 23 137 18 4 49 17 *MOUNTAIN 2,190 4 1 20 12 122 530 82 115 828 469 8ARIZONA 356 * * 6 4 23 115 16 17 91 84 *COLORADO 114 * * 2 3 6 40 6 10 30 16 *IDAHO 223 * * 1 1 1 13 5 11 125 63 2MONTANA 441 * * 2 1 7 51 13 31 290 44 2NEVADA 761 3 1 4 3 74 201 24 22 203 223 4NEW MEXICO 59 * * 2 * 2 32 6 4 7 6 *UTAH 147 * * * * 2 39 8 10 64 25 *WYOMING 90 * * 2 * 7 40 5 9 19 8 *PACIFIC 3,131 4 * 18 13 104 441 36 38 427 2,035 14CALIFORNIA 983 4 * 5 9 69 301 23 17 189 365 1OREGON 298 * * 1 1 3 15 2 3 50 223 1WASHINGTON 1,552 * * 7 1 17 64 6 7 124 1,323 3ALASKA 72 * * 1 * 7 18 1 1 20 14 10HAWAII 226 * * 5 3 8 43 5 10 44 109 *Source: U.S. Department of Commerce, International Trade Administration, Office of Travel & Tourism Industries(1) Total U.S. (NET) reflects non-duplicated parties. These totals are not revised when Statistics Canada revises total visitor estimates.(2) Total U.S. (SUM) and regional totals sum the visits across U.S. regions and states. Thus, the sum totals include possible double-counting of travelers who visit more than one state. State details may not sum to totals due to rounding.(3) Based on industry recommendation, OTTI policy is to suppress state data for which sample size is fewer than 100.Note: Totals for Canada may differ across tables due to differences in response rates for questions.* Cells containing an asterisk represent visitor volume estimates of fewer than 500.
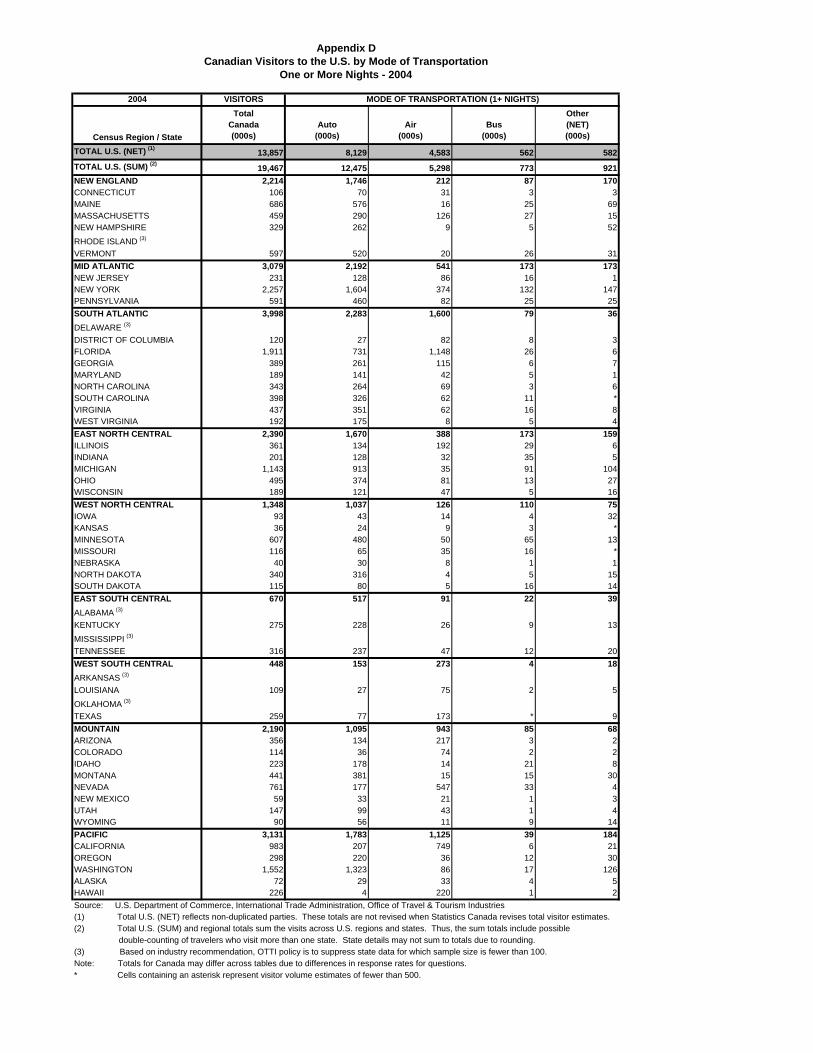
Appendix DCanadian Visitors to the U.S. by Mode of Transportation
One or More Nights - 2004
2004 VISITORS MODE OF TRANSPORTATION (1+ NIGHTS)
Census Region / State
TotalCanada(000s)
Auto(000s)
Air(000s)
Bus(000s)
Other(NET)(000s)
TOTAL U.S. (NET) (1) 13,857 8,129 4,583 562 582TOTAL U.S. (SUM) (2) 19,467 12,475 5,298 773 921NEW ENGLAND 2,214 1,746 212 87 170CONNECTICUT 106 70 31 3 3MAINE 686 576 16 25 69MASSACHUSETTS 459 290 126 27 15NEW HAMPSHIRE 329 262 9 5 52RHODE ISLAND (3)
VERMONT 597 520 20 26 31MID ATLANTIC 3,079 2,192 541 173 173NEW JERSEY 231 128 86 16 1NEW YORK 2,257 1,604 374 132 147PENNSYLVANIA 591 460 82 25 25SOUTH ATLANTIC 3,998 2,283 1,600 79 36DELAWARE (3)
DISTRICT OF COLUMBIA 120 27 82 8 3FLORIDA 1,911 731 1,148 26 6GEORGIA 389 261 115 6 7MARYLAND 189 141 42 5 1NORTH CAROLINA 343 264 69 3 6SOUTH CAROLINA 398 326 62 11 *VIRGINIA 437 351 62 16 8WEST VIRGINIA 192 175 8 5 4EAST NORTH CENTRAL 2,390 1,670 388 173 159ILLINOIS 361 134 192 29 6INDIANA 201 128 32 35 5MICHIGAN 1,143 913 35 91 104OHIO 495 374 81 13 27WISCONSIN 189 121 47 5 16WEST NORTH CENTRAL 1,348 1,037 126 110 75IOWA 93 43 14 4 32KANSAS 36 24 9 3 *MINNESOTA 607 480 50 65 13MISSOURI 116 65 35 16 *NEBRASKA 40 30 8 1 1NORTH DAKOTA 340 316 4 5 15SOUTH DAKOTA 115 80 5 16 14EAST SOUTH CENTRAL 670 517 91 22 39ALABAMA (3)
KENTUCKY 275 228 26 9 13MISSISSIPPI (3)
TENNESSEE 316 237 47 12 20WEST SOUTH CENTRAL 448 153 273 4 18ARKANSAS (3)
LOUISIANA 109 27 75 2 5OKLAHOMA (3)
TEXAS 259 77 173 * 9MOUNTAIN 2,190 1,095 943 85 68ARIZONA 356 134 217 3 2COLORADO 114 36 74 2 2IDAHO 223 178 14 21 8MONTANA 441 381 15 15 30NEVADA 761 177 547 33 4NEW MEXICO 59 33 21 1 3UTAH 147 99 43 1 4WYOMING 90 56 11 9 14PACIFIC 3,131 1,783 1,125 39 184CALIFORNIA 983 207 749 6 21OREGON 298 220 36 12 30WASHINGTON 1,552 1,323 86 17 126ALASKA 72 29 33 4 5HAWAII 226 4 220 1 2Source: U.S. Department of Commerce, International Trade Administration, Office of Travel & Tourism Industries(1) Total U.S. (NET) reflects non-duplicated parties. These totals are not revised when Statistics Canada revises total visitor estimates.(2) Total U.S. (SUM) and regional totals sum the visits across U.S. regions and states. Thus, the sum totals include possible double-counting of travelers who visit more than one state. State details may not sum to totals due to rounding.(3) Based on industry recommendation, OTTI policy is to suppress state data for which sample size is fewer than 100.Note: Totals for Canada may differ across tables due to differences in response rates for questions.* Cells containing an asterisk represent visitor volume estimates of fewer than 500.
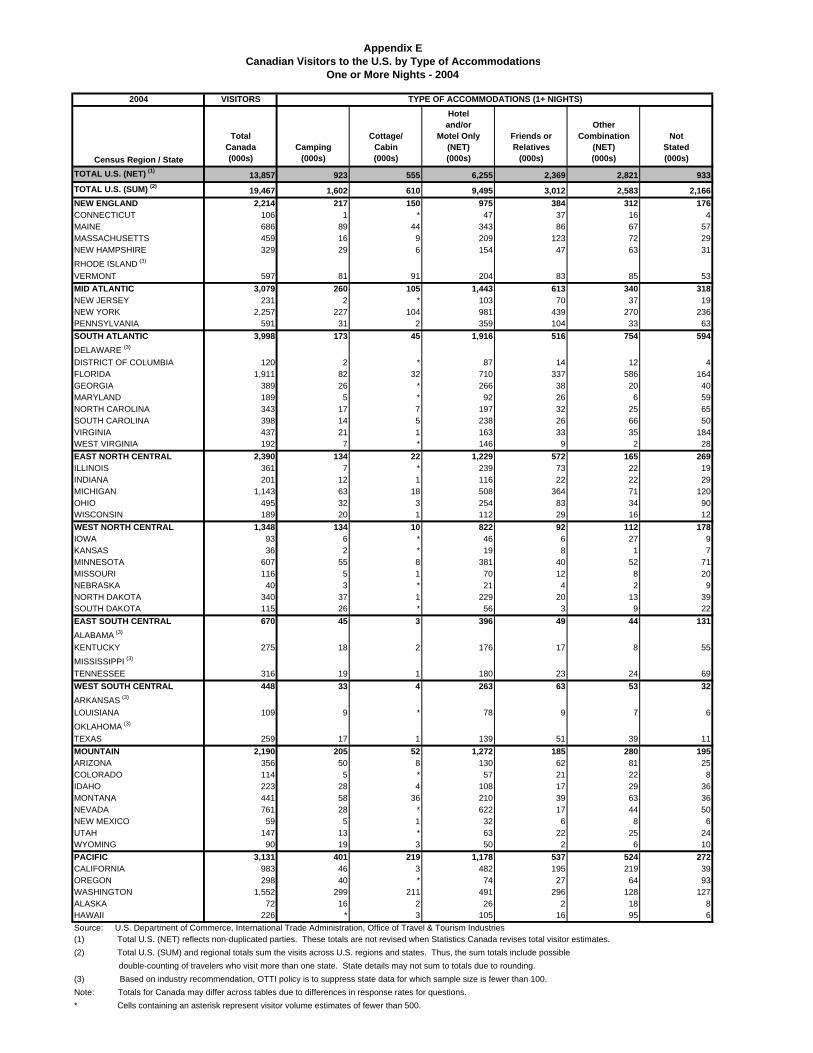
Appendix ECanadian Visitors to the U.S. by Type of Accommodations
One or More Nights - 2004
2004 VISITORS TYPE OF ACCOMMODATIONS (1+ NIGHTS)
Census Region / State
TotalCanada(000s)
Camping(000s)
Cottage/Cabin(000s)
Hoteland/or
Motel Only(NET)(000s)
Friends orRelatives
(000s)
OtherCombination
(NET)(000s)
NotStated(000s)
TOTAL U.S. (NET) (1) 13,857 923 555 6,255 2,369 2,821 933TOTAL U.S. (SUM) (2) 19,467 1,602 610 9,495 3,012 2,583 2,166NEW ENGLAND 2,214 217 150 975 384 312 176CONNECTICUT 106 1 * 47 37 16 4MAINE 686 89 44 343 86 67 57MASSACHUSETTS 459 16 9 209 123 72 29NEW HAMPSHIRE 329 29 6 154 47 63 31RHODE ISLAND (3)
VERMONT 597 81 91 204 83 85 53MID ATLANTIC 3,079 260 105 1,443 613 340 318NEW JERSEY 231 2 * 103 70 37 19NEW YORK 2,257 227 104 981 439 270 236PENNSYLVANIA 591 31 2 359 104 33 63SOUTH ATLANTIC 3,998 173 45 1,916 516 754 594DELAWARE (3)
DISTRICT OF COLUMBIA 120 2 * 87 14 12 4FLORIDA 1,911 82 32 710 337 586 164GEORGIA 389 26 * 266 38 20 40MARYLAND 189 5 * 92 26 6 59NORTH CAROLINA 343 17 7 197 32 25 65SOUTH CAROLINA 398 14 5 238 26 66 50VIRGINIA 437 21 1 163 33 35 184WEST VIRGINIA 192 7 * 146 9 2 28EAST NORTH CENTRAL 2,390 134 22 1,229 572 165 269ILLINOIS 361 7 * 239 73 22 19INDIANA 201 12 1 116 22 22 29MICHIGAN 1,143 63 18 508 364 71 120OHIO 495 32 3 254 83 34 90WISCONSIN 189 20 1 112 29 16 12WEST NORTH CENTRAL 1,348 134 10 822 92 112 178IOWA 93 6 * 46 6 27 9KANSAS 36 2 * 19 8 1 7MINNESOTA 607 55 8 381 40 52 71MISSOURI 116 5 1 70 12 8 20NEBRASKA 40 3 * 21 4 2 9NORTH DAKOTA 340 37 1 229 20 13 39SOUTH DAKOTA 115 26 * 56 3 9 22EAST SOUTH CENTRAL 670 45 3 396 49 44 131ALABAMA (3)
KENTUCKY 275 18 2 176 17 8 55MISSISSIPPI (3)
TENNESSEE 316 19 1 180 23 24 69WEST SOUTH CENTRAL 448 33 4 263 63 53 32ARKANSAS (3)
LOUISIANA 109 9 * 78 9 7 6OKLAHOMA (3)
TEXAS 259 17 1 139 51 39 11MOUNTAIN 2,190 205 52 1,272 185 280 195ARIZONA 356 50 8 130 62 81 25COLORADO 114 5 * 57 21 22 8IDAHO 223 28 4 108 17 29 36MONTANA 441 58 36 210 39 63 36NEVADA 761 28 * 622 17 44 50NEW MEXICO 59 5 1 32 6 8 6UTAH 147 13 * 63 22 25 24WYOMING 90 19 3 50 2 6 10PACIFIC 3,131 401 219 1,178 537 524 272CALIFORNIA 983 46 3 482 195 219 39OREGON 298 40 * 74 27 64 93WASHINGTON 1,552 299 211 491 296 128 127ALASKA 72 16 2 26 2 18 8HAWAII 226 * 3 105 16 95 6Source: U.S. Department of Commerce, International Trade Administration, Office of Travel & Tourism Industries(1) Total U.S. (NET) reflects non-duplicated parties. These totals are not revised when Statistics Canada revises total visitor estimates.(2) Total U.S. (SUM) and regional totals sum the visits across U.S. regions and states. Thus, the sum totals include possible double-counting of travelers who visit more than one state. State details may not sum to totals due to rounding.(3) Based on industry recommendation, OTTI policy is to suppress state data for which sample size is fewer than 100.Note: Totals for Canada may differ across tables due to differences in response rates for questions.* Cells containing an asterisk represent visitor volume estimates of fewer than 500.
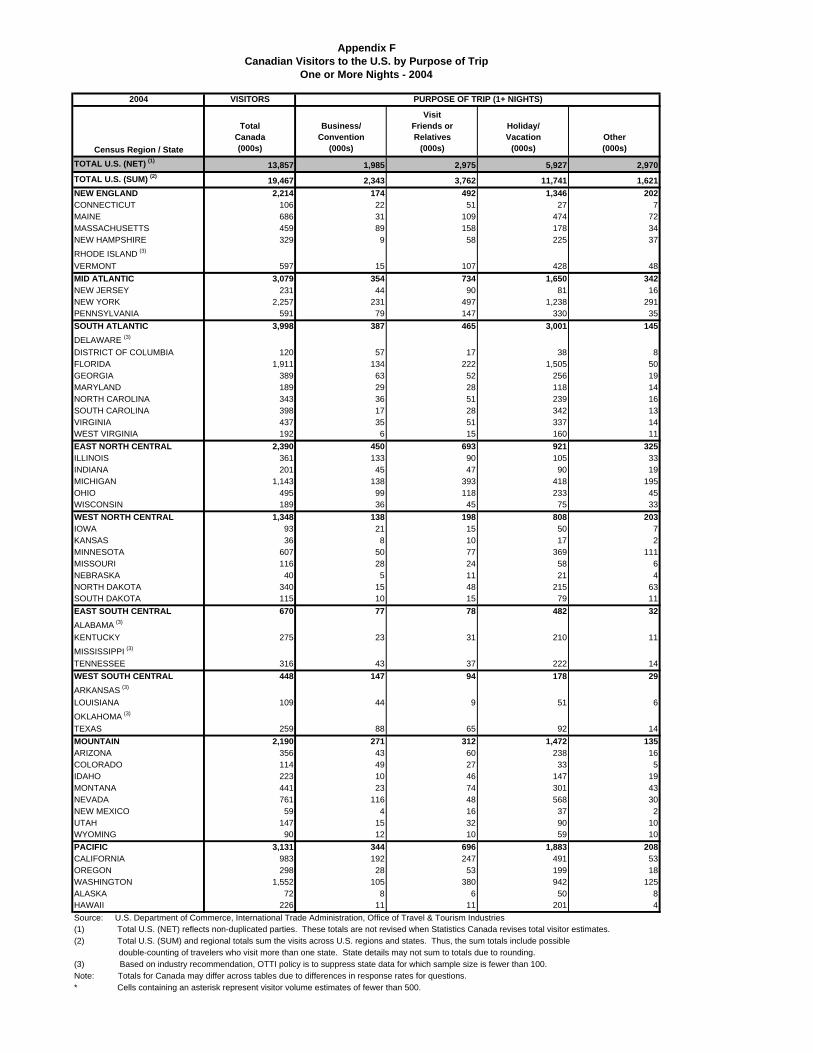
Appendix FCanadian Visitors to the U.S. by Purpose of Trip
One or More Nights - 2004
2004 VISITORS PURPOSE OF TRIP (1+ NIGHTS)
Census Region / State
TotalCanada(000s)
Business/Convention
(000s)
VisitFriends orRelatives
(000s)
Holiday/Vacation
(000s)Other(000s)
TOTAL U.S. (NET) (1) 13,857 1,985 2,975 5,927 2,970TOTAL U.S. (SUM) (2) 19,467 2,343 3,762 11,741 1,621NEW ENGLAND 2,214 174 492 1,346 202CONNECTICUT 106 22 51 27 7MAINE 686 31 109 474 72MASSACHUSETTS 459 89 158 178 34NEW HAMPSHIRE 329 9 58 225 37RHODE ISLAND (3)
VERMONT 597 15 107 428 48MID ATLANTIC 3,079 354 734 1,650 342NEW JERSEY 231 44 90 81 16NEW YORK 2,257 231 497 1,238 291PENNSYLVANIA 591 79 147 330 35SOUTH ATLANTIC 3,998 387 465 3,001 145DELAWARE (3)
DISTRICT OF COLUMBIA 120 57 17 38 8FLORIDA 1,911 134 222 1,505 50GEORGIA 389 63 52 256 19MARYLAND 189 29 28 118 14NORTH CAROLINA 343 36 51 239 16SOUTH CAROLINA 398 17 28 342 13VIRGINIA 437 35 51 337 14WEST VIRGINIA 192 6 15 160 11EAST NORTH CENTRAL 2,390 450 693 921 325ILLINOIS 361 133 90 105 33INDIANA 201 45 47 90 19MICHIGAN 1,143 138 393 418 195OHIO 495 99 118 233 45WISCONSIN 189 36 45 75 33WEST NORTH CENTRAL 1,348 138 198 808 203IOWA 93 21 15 50 7KANSAS 36 8 10 17 2MINNESOTA 607 50 77 369 111MISSOURI 116 28 24 58 6NEBRASKA 40 5 11 21 4NORTH DAKOTA 340 15 48 215 63SOUTH DAKOTA 115 10 15 79 11EAST SOUTH CENTRAL 670 77 78 482 32ALABAMA (3)
KENTUCKY 275 23 31 210 11MISSISSIPPI (3)
TENNESSEE 316 43 37 222 14WEST SOUTH CENTRAL 448 147 94 178 29ARKANSAS (3)
LOUISIANA 109 44 9 51 6OKLAHOMA (3)
TEXAS 259 88 65 92 14MOUNTAIN 2,190 271 312 1,472 135ARIZONA 356 43 60 238 16COLORADO 114 49 27 33 5IDAHO 223 10 46 147 19MONTANA 441 23 74 301 43NEVADA 761 116 48 568 30NEW MEXICO 59 4 16 37 2UTAH 147 15 32 90 10WYOMING 90 12 10 59 10PACIFIC 3,131 344 696 1,883 208CALIFORNIA 983 192 247 491 53OREGON 298 28 53 199 18WASHINGTON 1,552 105 380 942 125ALASKA 72 8 6 50 8HAWAII 226 11 11 201 4Source: U.S. Department of Commerce, International Trade Administration, Office of Travel & Tourism Industries(1) Total U.S. (NET) reflects non-duplicated parties. These totals are not revised when Statistics Canada revises total visitor estimates.(2) Total U.S. (SUM) and regional totals sum the visits across U.S. regions and states. Thus, the sum totals include possible double-counting of travelers who visit more than one state. State details may not sum to totals due to rounding.(3) Based on industry recommendation, OTTI policy is to suppress state data for which sample size is fewer than 100.Note: Totals for Canada may differ across tables due to differences in response rates for questions.* Cells containing an asterisk represent visitor volume estimates of fewer than 500.
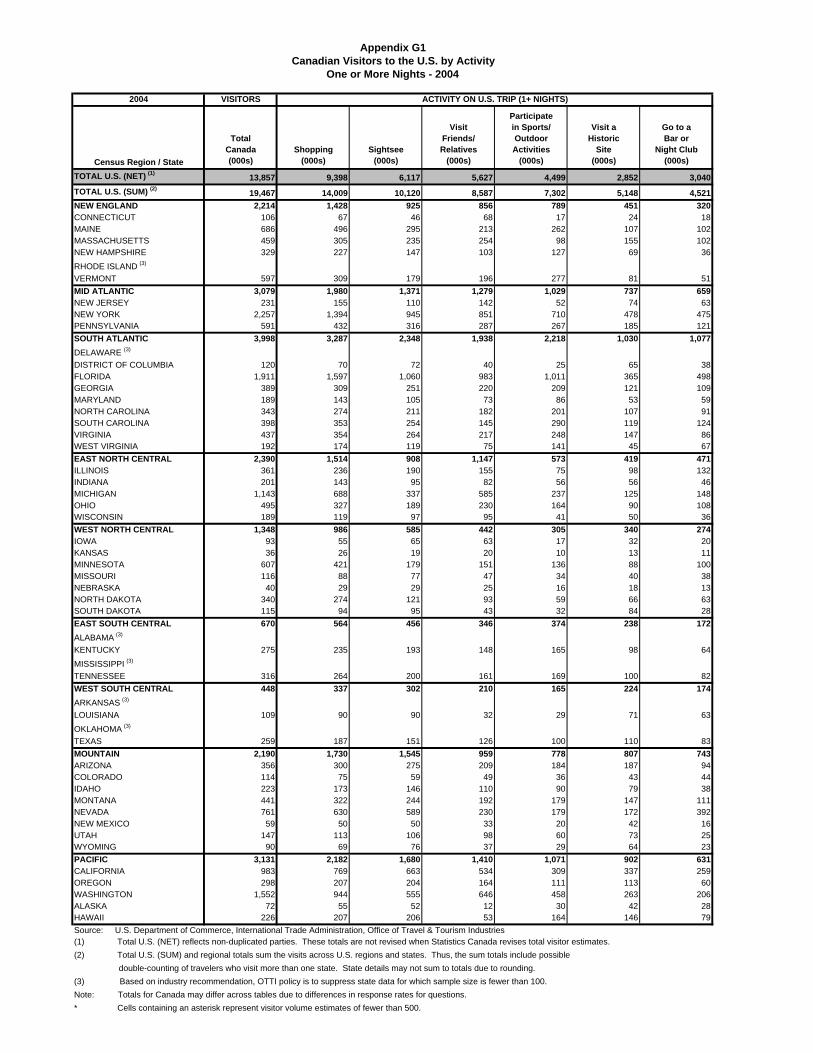
2004 VISITORS ACTIVITY ON U.S. TRIP (1+ NIGHTS)
Census Region / State
TotalCanada(000s)
Shopping(000s)
Sightsee(000s)
VisitFriends/Relatives
(000s)
Participatein Sports/OutdoorActivities
(000s)
Visit aHistoric
Site(000s)
Go to aBar or
Night Club(000s)
TOTAL U.S. (NET) (1) 13,857 9,398 6,117 5,627 4,499 2,852 3,040TOTAL U.S. (SUM) (2) 19,467 14,009 10,120 8,587 7,302 5,148 4,521NEW ENGLAND 2,214 1,428 925 856 789 451 320CONNECTICUT 106 67 46 68 17 24 18MAINE 686 496 295 213 262 107 102MASSACHUSETTS 459 305 235 254 98 155 102NEW HAMPSHIRE 329 227 147 103 127 69 36RHODE ISLAND (3)
VERMONT 597 309 179 196 277 81 51MID ATLANTIC 3,079 1,980 1,371 1,279 1,029 737 659NEW JERSEY 231 155 110 142 52 74 63NEW YORK 2,257 1,394 945 851 710 478 475PENNSYLVANIA 591 432 316 287 267 185 121SOUTH ATLANTIC 3,998 3,287 2,348 1,938 2,218 1,030 1,077DELAWARE (3)
DISTRICT OF COLUMBIA 120 70 72 40 25 65 38FLORIDA 1,911 1,597 1,060 983 1,011 365 498GEORGIA 389 309 251 220 209 121 109MARYLAND 189 143 105 73 86 53 59NORTH CAROLINA 343 274 211 182 201 107 91SOUTH CAROLINA 398 353 254 145 290 119 124VIRGINIA 437 354 264 217 248 147 86WEST VIRGINIA 192 174 119 75 141 45 67EAST NORTH CENTRAL 2,390 1,514 908 1,147 573 419 471ILLINOIS 361 236 190 155 75 98 132INDIANA 201 143 95 82 56 56 46MICHIGAN 1,143 688 337 585 237 125 148OHIO 495 327 189 230 164 90 108WISCONSIN 189 119 97 95 41 50 36WEST NORTH CENTRAL 1,348 986 585 442 305 340 274IOWA 93 55 65 63 17 32 20KANSAS 36 26 19 20 10 13 11MINNESOTA 607 421 179 151 136 88 100MISSOURI 116 88 77 47 34 40 38NEBRASKA 40 29 29 25 16 18 13NORTH DAKOTA 340 274 121 93 59 66 63SOUTH DAKOTA 115 94 95 43 32 84 28EAST SOUTH CENTRAL 670 564 456 346 374 238 172ALABAMA (3)
KENTUCKY 275 235 193 148 165 98 64MISSISSIPPI (3)
TENNESSEE 316 264 200 161 169 100 82WEST SOUTH CENTRAL 448 337 302 210 165 224 174ARKANSAS (3)
LOUISIANA 109 90 90 32 29 71 63OKLAHOMA (3)
TEXAS 259 187 151 126 100 110 83MOUNTAIN 2,190 1,730 1,545 959 778 807 743ARIZONA 356 300 275 209 184 187 94COLORADO 114 75 59 49 36 43 44IDAHO 223 173 146 110 90 79 38MONTANA 441 322 244 192 179 147 111NEVADA 761 630 589 230 179 172 392NEW MEXICO 59 50 50 33 20 42 16UTAH 147 113 106 98 60 73 25WYOMING 90 69 76 37 29 64 23PACIFIC 3,131 2,182 1,680 1,410 1,071 902 631CALIFORNIA 983 769 663 534 309 337 259OREGON 298 207 204 164 111 113 60WASHINGTON 1,552 944 555 646 458 263 206ALASKA 72 55 52 12 30 42 28HAWAII 226 207 206 53 164 146 79Source: U.S. Department of Commerce, International Trade Administration, Office of Travel & Tourism Industries(1) Total U.S. (NET) reflects non-duplicated parties. These totals are not revised when Statistics Canada revises total visitor estimates.(2) Total U.S. (SUM) and regional totals sum the visits across U.S. regions and states. Thus, the sum totals include possible double-counting of travelers who visit more than one state. State details may not sum to totals due to rounding.(3) Based on industry recommendation, OTTI policy is to suppress state data for which sample size is fewer than 100.Note: Totals for Canada may differ across tables due to differences in response rates for questions.* Cells containing an asterisk represent visitor volume estimates of fewer than 500.
Appendix G1Canadian Visitors to the U.S. by Activity
One or More Nights - 2004
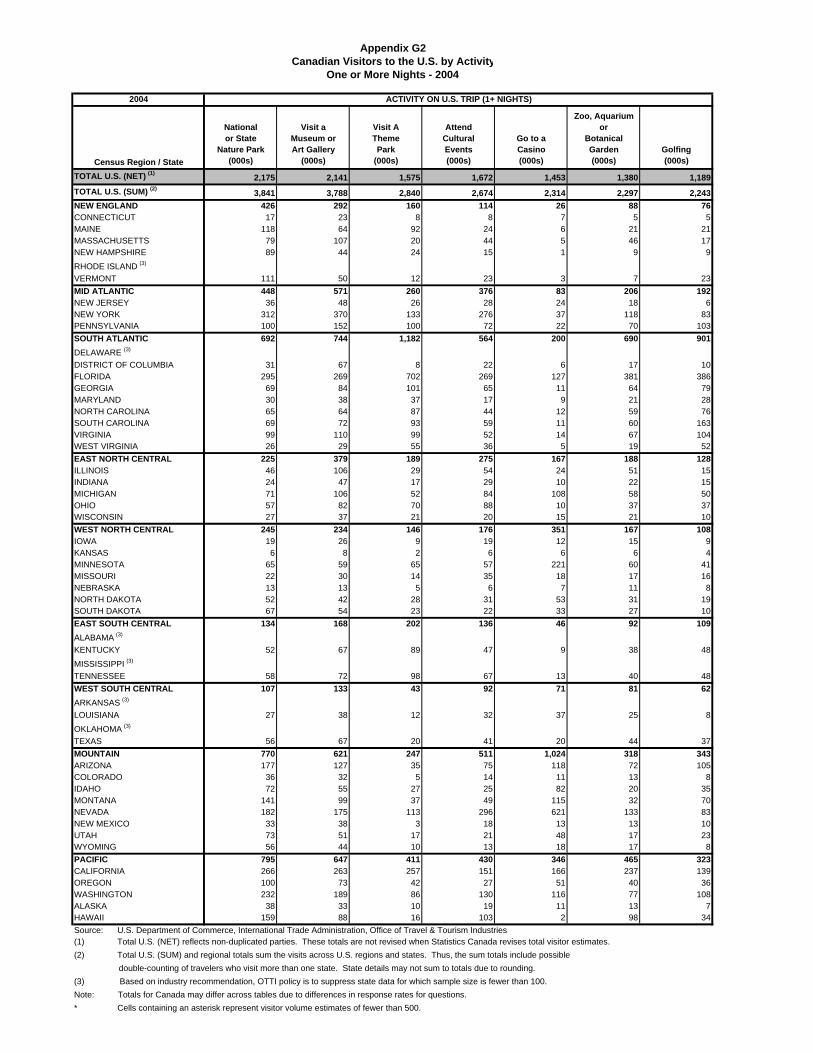
Appendix G2Canadian Visitors to the U.S. by Activity
One or More Nights - 2004
2004 ACTIVITY ON U.S. TRIP (1+ NIGHTS)
Census Region / State
Nationalor State
Nature Park(000s)
Visit aMuseum orArt Gallery
(000s)
Visit AThemePark
(000s)
AttendCulturalEvents(000s)
Go to a Casino(000s)
Zoo, Aquarium or
BotanicalGarden(000s)
Golfing(000s)
TOTAL U.S. (NET) (1) 2,175 2,141 1,575 1,672 1,453 1,380 1,189TOTAL U.S. (SUM) (2) 3,841 3,788 2,840 2,674 2,314 2,297 2,243NEW ENGLAND 426 292 160 114 26 88 76CONNECTICUT 17 23 8 8 7 5 5MAINE 118 64 92 24 6 21 21MASSACHUSETTS 79 107 20 44 5 46 17NEW HAMPSHIRE 89 44 24 15 1 9 9RHODE ISLAND (3)
VERMONT 111 50 12 23 3 7 23MID ATLANTIC 448 571 260 376 83 206 192NEW JERSEY 36 48 26 28 24 18 6NEW YORK 312 370 133 276 37 118 83PENNSYLVANIA 100 152 100 72 22 70 103SOUTH ATLANTIC 692 744 1,182 564 200 690 901DELAWARE (3)
DISTRICT OF COLUMBIA 31 67 8 22 6 17 10FLORIDA 295 269 702 269 127 381 386GEORGIA 69 84 101 65 11 64 79MARYLAND 30 38 37 17 9 21 28NORTH CAROLINA 65 64 87 44 12 59 76SOUTH CAROLINA 69 72 93 59 11 60 163VIRGINIA 99 110 99 52 14 67 104WEST VIRGINIA 26 29 55 36 5 19 52EAST NORTH CENTRAL 225 379 189 275 167 188 128ILLINOIS 46 106 29 54 24 51 15INDIANA 24 47 17 29 10 22 15MICHIGAN 71 106 52 84 108 58 50OHIO 57 82 70 88 10 37 37WISCONSIN 27 37 21 20 15 21 10WEST NORTH CENTRAL 245 234 146 176 351 167 108IOWA 19 26 9 19 12 15 9KANSAS 6 8 2 6 6 6 4MINNESOTA 65 59 65 57 221 60 41MISSOURI 22 30 14 35 18 17 16NEBRASKA 13 13 5 6 7 11 8NORTH DAKOTA 52 42 28 31 53 31 19SOUTH DAKOTA 67 54 23 22 33 27 10EAST SOUTH CENTRAL 134 168 202 136 46 92 109ALABAMA (3)
KENTUCKY 52 67 89 47 9 38 48MISSISSIPPI (3)
TENNESSEE 58 72 98 67 13 40 48WEST SOUTH CENTRAL 107 133 43 92 71 81 62ARKANSAS (3)
LOUISIANA 27 38 12 32 37 25 8OKLAHOMA (3)
TEXAS 56 67 20 41 20 44 37MOUNTAIN 770 621 247 511 1,024 318 343ARIZONA 177 127 35 75 118 72 105COLORADO 36 32 5 14 11 13 8IDAHO 72 55 27 25 82 20 35MONTANA 141 99 37 49 115 32 70NEVADA 182 175 113 296 621 133 83NEW MEXICO 33 38 3 18 13 13 10UTAH 73 51 17 21 48 17 23WYOMING 56 44 10 13 18 17 8PACIFIC 795 647 411 430 346 465 323CALIFORNIA 266 263 257 151 166 237 139OREGON 100 73 42 27 51 40 36WASHINGTON 232 189 86 130 116 77 108ALASKA 38 33 10 19 11 13 7HAWAII 159 88 16 103 2 98 34Source: U.S. Department of Commerce, International Trade Administration, Office of Travel & Tourism Industries(1) Total U.S. (NET) reflects non-duplicated parties. These totals are not revised when Statistics Canada revises total visitor estimates.(2) Total U.S. (SUM) and regional totals sum the visits across U.S. regions and states. Thus, the sum totals include possible double-counting of travelers who visit more than one state. State details may not sum to totals due to rounding.(3) Based on industry recommendation, OTTI policy is to suppress state data for which sample size is fewer than 100.Note: Totals for Canada may differ across tables due to differences in response rates for questions.* Cells containing an asterisk represent visitor volume estimates of fewer than 500.

Appendix G3Canadian Visitors to the U.S. by Activity
One or More Nights - 2004
2004 ACTIVITY ON TRIP (1+ NIGHTS)
Census Region / State
Attend aFestivalor Fair(000s)
AttendSportsEvent(000s)
Boating:Motor, SailBoat, Other
(000s)Fishing(000s)
DownhillSkiing or
Snow Boarding(000s)
Hunting(000s)
NoActivityStated(000s)
TOTAL U.S. (NET) (1) 1,136 1,099 853 419 217 24 774TOTAL U.S. (SUM) (2) 1,935 1,800 1,218 675 246 52 861NEW ENGLAND 160 120 162 81 78 3 122CONNECTICUT 3 7 2 * * * 7MAINE 41 25 44 27 13 * 47MASSACHUSETTS 32 37 17 10 2 * 22NEW HAMPSHIRE 29 27 14 13 15 * 10RHODE ISLAND (3) 2VERMONT 51 20 82 29 48 2 34MID ATLANTIC 265 200 200 79 78 10 163NEW JERSEY 19 14 7 13 * * 23NEW YORK 174 130 164 45 74 8 107PENNSYLVANIA 73 56 29 21 3 2 33SOUTH ATLANTIC 438 381 320 198 2 18 90DELAWARE (3) 1DISTRICT OF COLUMBIA 8 6 3 * * * 9FLORIDA 215 194 189 115 1 7 34GEORGIA 63 54 22 28 * * 13MARYLAND 13 17 12 1 1 * 8NORTH CAROLINA 33 29 30 18 1 3 10SOUTH CAROLINA 40 31 22 9 * 1 5VIRGINIA 43 33 31 21 * 6 10WEST VIRGINIA 23 13 9 4 * * 1EAST NORTH CENTRAL 226 234 81 47 9 7 191ILLINOIS 44 43 15 6 1 * 41INDIANA 26 27 4 2 1 1 10MICHIGAN 70 95 30 20 5 4 95OHIO 72 52 23 16 1 2 29WISCONSIN 14 17 9 3 1 * 17WEST NORTH CENTRAL 112 155 43 39 15 5 68IOWA 11 10 1 4 1 * 2KANSAS 5 7 1 1 1 1 3MINNESOTA 30 62 21 20 12 1 35MISSOURI 13 19 8 5 1 1 7NEBRASKA 8 6 * 1 * * 3NORTH DAKOTA 29 38 9 5 * * 15SOUTH DAKOTA 17 14 3 3 1 * 3EAST SOUTH CENTRAL 121 113 36 41 2 13ALABAMA (3) 3KENTUCKY 49 45 17 15 * 2 2MISSISSIPPI (3) 1TENNESSEE 56 54 17 21 * * 7WEST SOUTH CENTRAL 58 56 32 10 2 0 26ARKANSAS (3) 3LOUISIANA 12 14 7 * * * 3OKLAHOMA (3) 1TEXAS 29 31 18 7 2 * 19MOUNTAIN 220 242 91 77 47 3 40ARIZONA 43 57 13 15 1 1 4COLORADO 11 11 5 3 18 * 8IDAHO 18 30 22 13 1 * 8MONTANA 49 45 28 18 16 2 9NEVADA 60 56 15 15 2 * 5NEW MEXICO 11 11 * 2 * * 1UTAH 12 18 7 6 6 * 4WYOMING 17 15 1 4 4 * 2PACIFIC 334 297 253 102 16 4 149CALIFORNIA 112 101 53 23 6 * 36OREGON 37 33 18 14 1 1 9WASHINGTON 135 145 91 41 8 2 103ALASKA 7 2 13 9 * * 2HAWAII 42 17 78 15 * * *Source: U.S. Department of Commerce, International Trade Administration, Office of Travel & Tourism Industries(1) Total U.S. (NET) reflects non-duplicated parties. These totals are not revised when Statistics Canada revises total visitor estimates.(2) Total U.S. (SUM) and regional totals sum the visits across U.S. regions and states. Thus, the sum totals include possible double-counting of travelers who visit more than one state. State details may not sum to totals due to rounding.(3) Based on industry recommendation, OTTI policy is to suppress state data for which sample size is fewer than 100.Note: Totals for Canada may differ across tables due to differences in response rates for questions.* Cells containing an asterisk represent visitor volume estimates of fewer than 500.
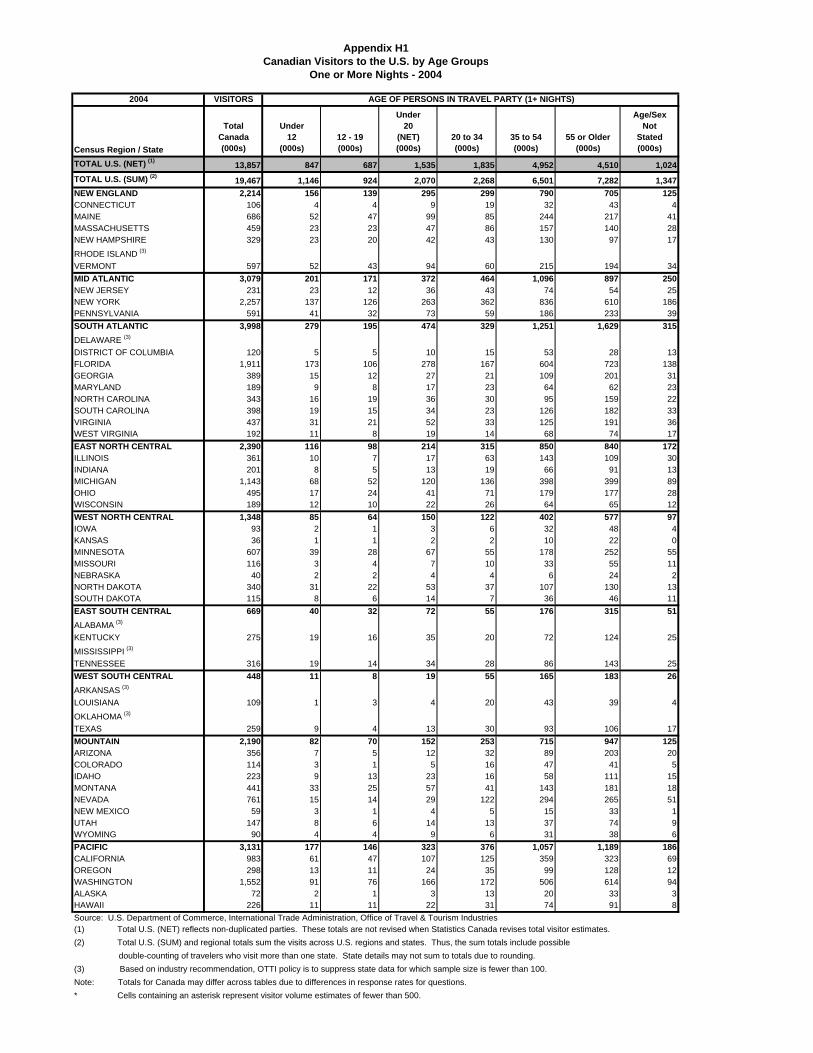
Appendix H1Canadian Visitors to the U.S. by Age Groups
One or More Nights - 2004
2004 VISITORS AGE OF PERSONS IN TRAVEL PARTY (1+ NIGHTS)
Census Region / State
TotalCanada(000s)
Under12
(000s)12 - 19(000s)
Under20
(NET)(000s)
20 to 34 (000s)
35 to 54(000s)
55 or Older(000s)
Age/SexNot
Stated(000s)
TOTAL U.S. (NET) (1) 13,857 847 687 1,535 1,835 4,952 4,510 1,024TOTAL U.S. (SUM) (2) 19,467 1,146 924 2,070 2,268 6,501 7,282 1,347NEW ENGLAND 2,214 156 139 295 299 790 705 125CONNECTICUT 106 4 4 9 19 32 43 4MAINE 686 52 47 99 85 244 217 41MASSACHUSETTS 459 23 23 47 86 157 140 28NEW HAMPSHIRE 329 23 20 42 43 130 97 17RHODE ISLAND (3)
VERMONT 597 52 43 94 60 215 194 34MID ATLANTIC 3,079 201 171 372 464 1,096 897 250NEW JERSEY 231 23 12 36 43 74 54 25NEW YORK 2,257 137 126 263 362 836 610 186PENNSYLVANIA 591 41 32 73 59 186 233 39SOUTH ATLANTIC 3,998 279 195 474 329 1,251 1,629 315DELAWARE (3)
DISTRICT OF COLUMBIA 120 5 5 10 15 53 28 13FLORIDA 1,911 173 106 278 167 604 723 138GEORGIA 389 15 12 27 21 109 201 31MARYLAND 189 9 8 17 23 64 62 23NORTH CAROLINA 343 16 19 36 30 95 159 22SOUTH CAROLINA 398 19 15 34 23 126 182 33VIRGINIA 437 31 21 52 33 125 191 36WEST VIRGINIA 192 11 8 19 14 68 74 17EAST NORTH CENTRAL 2,390 116 98 214 315 850 840 172ILLINOIS 361 10 7 17 63 143 109 30INDIANA 201 8 5 13 19 66 91 13MICHIGAN 1,143 68 52 120 136 398 399 89OHIO 495 17 24 41 71 179 177 28WISCONSIN 189 12 10 22 26 64 65 12WEST NORTH CENTRAL 1,348 85 64 150 122 402 577 97IOWA 93 2 1 3 6 32 48 4KANSAS 36 1 1 2 2 10 22 0MINNESOTA 607 39 28 67 55 178 252 55MISSOURI 116 3 4 7 10 33 55 11NEBRASKA 40 2 2 4 4 6 24 2NORTH DAKOTA 340 31 22 53 37 107 130 13SOUTH DAKOTA 115 8 6 14 7 36 46 11EAST SOUTH CENTRAL 669 40 32 72 55 176 315 51ALABAMA (3)
KENTUCKY 275 19 16 35 20 72 124 25MISSISSIPPI (3)
TENNESSEE 316 19 14 34 28 86 143 25WEST SOUTH CENTRAL 448 11 8 19 55 165 183 26ARKANSAS (3)
LOUISIANA 109 1 3 4 20 43 39 4OKLAHOMA (3)
TEXAS 259 9 4 13 30 93 106 17MOUNTAIN 2,190 82 70 152 253 715 947 125ARIZONA 356 7 5 12 32 89 203 20COLORADO 114 3 1 5 16 47 41 5IDAHO 223 9 13 23 16 58 111 15MONTANA 441 33 25 57 41 143 181 18NEVADA 761 15 14 29 122 294 265 51NEW MEXICO 59 3 1 4 5 15 33 1UTAH 147 8 6 14 13 37 74 9WYOMING 90 4 4 9 6 31 38 6PACIFIC 3,131 177 146 323 376 1,057 1,189 186CALIFORNIA 983 61 47 107 125 359 323 69OREGON 298 13 11 24 35 99 128 12WASHINGTON 1,552 91 76 166 172 506 614 94ALASKA 72 2 1 3 13 20 33 3HAWAII 226 11 11 22 31 74 91 8Source: U.S. Department of Commerce, International Trade Administration, Office of Travel & Tourism Industries(1) Total U.S. (NET) reflects non-duplicated parties. These totals are not revised when Statistics Canada revises total visitor estimates.(2) Total U.S. (SUM) and regional totals sum the visits across U.S. regions and states. Thus, the sum totals include possible double-counting of travelers who visit more than one state. State details may not sum to totals due to rounding.(3) Based on industry recommendation, OTTI policy is to suppress state data for which sample size is fewer than 100.Note: Totals for Canada may differ across tables due to differences in response rates for questions.* Cells containing an asterisk represent visitor volume estimates of fewer than 500.
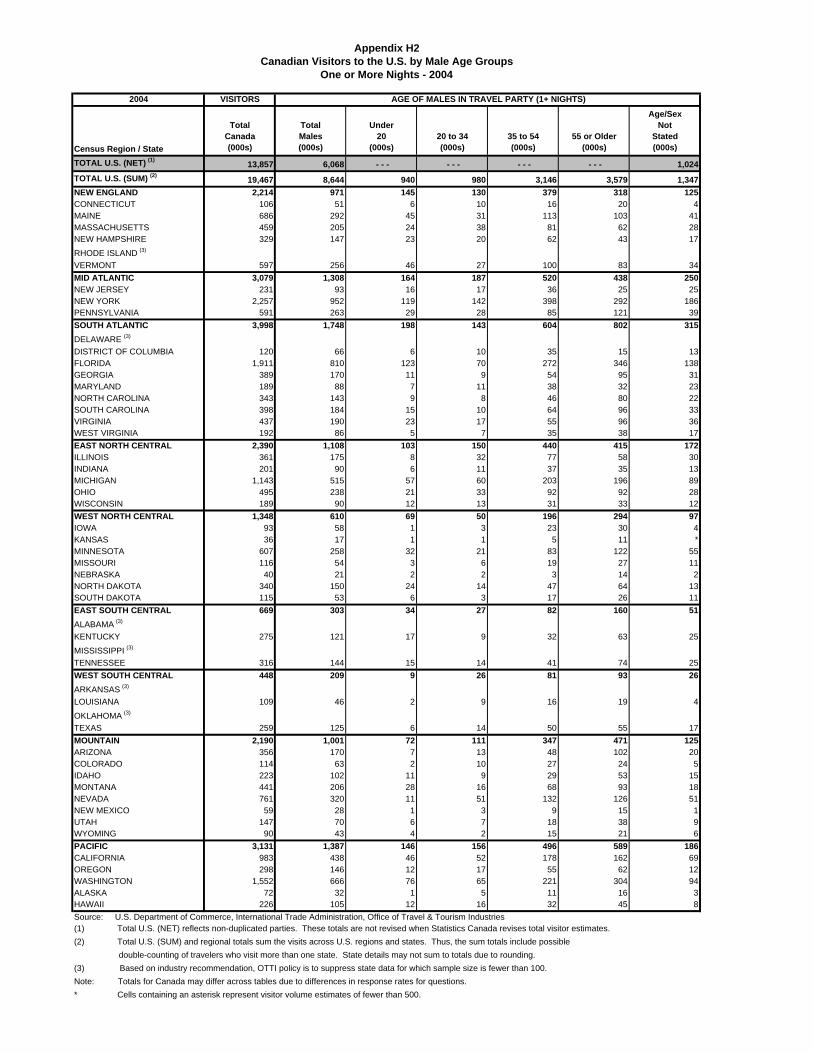
Appendix H2Canadian Visitors to the U.S. by Male Age Groups
One or More Nights - 2004
2004 VISITORS AGE OF MALES IN TRAVEL PARTY (1+ NIGHTS)
Census Region / State
TotalCanada(000s)
TotalMales(000s)
Under20
(000s)20 to 34(000s)
35 to 54(000s)
55 or Older(000s)
Age/SexNot
Stated(000s)
TOTAL U.S. (NET) (1) 13,857 6,068 - - - - - - - - - - - - 1,024TOTAL U.S. (SUM) (2) 19,467 8,644 940 980 3,146 3,579 1,347NEW ENGLAND 2,214 971 145 130 379 318 125CONNECTICUT 106 51 6 10 16 20 4MAINE 686 292 45 31 113 103 41MASSACHUSETTS 459 205 24 38 81 62 28NEW HAMPSHIRE 329 147 23 20 62 43 17RHODE ISLAND (3)
VERMONT 597 256 46 27 100 83 34MID ATLANTIC 3,079 1,308 164 187 520 438 250NEW JERSEY 231 93 16 17 36 25 25NEW YORK 2,257 952 119 142 398 292 186PENNSYLVANIA 591 263 29 28 85 121 39SOUTH ATLANTIC 3,998 1,748 198 143 604 802 315DELAWARE (3)
DISTRICT OF COLUMBIA 120 66 6 10 35 15 13FLORIDA 1,911 810 123 70 272 346 138GEORGIA 389 170 11 9 54 95 31MARYLAND 189 88 7 11 38 32 23NORTH CAROLINA 343 143 9 8 46 80 22SOUTH CAROLINA 398 184 15 10 64 96 33VIRGINIA 437 190 23 17 55 96 36WEST VIRGINIA 192 86 5 7 35 38 17EAST NORTH CENTRAL 2,390 1,108 103 150 440 415 172ILLINOIS 361 175 8 32 77 58 30INDIANA 201 90 6 11 37 35 13MICHIGAN 1,143 515 57 60 203 196 89OHIO 495 238 21 33 92 92 28WISCONSIN 189 90 12 13 31 33 12WEST NORTH CENTRAL 1,348 610 69 50 196 294 97IOWA 93 58 1 3 23 30 4KANSAS 36 17 1 1 5 11 *MINNESOTA 607 258 32 21 83 122 55MISSOURI 116 54 3 6 19 27 11NEBRASKA 40 21 2 2 3 14 2NORTH DAKOTA 340 150 24 14 47 64 13SOUTH DAKOTA 115 53 6 3 17 26 11EAST SOUTH CENTRAL 669 303 34 27 82 160 51ALABAMA (3)
KENTUCKY 275 121 17 9 32 63 25MISSISSIPPI (3)
TENNESSEE 316 144 15 14 41 74 25WEST SOUTH CENTRAL 448 209 9 26 81 93 26ARKANSAS (3)
LOUISIANA 109 46 2 9 16 19 4OKLAHOMA (3)
TEXAS 259 125 6 14 50 55 17MOUNTAIN 2,190 1,001 72 111 347 471 125ARIZONA 356 170 7 13 48 102 20COLORADO 114 63 2 10 27 24 5IDAHO 223 102 11 9 29 53 15MONTANA 441 206 28 16 68 93 18NEVADA 761 320 11 51 132 126 51NEW MEXICO 59 28 1 3 9 15 1UTAH 147 70 6 7 18 38 9WYOMING 90 43 4 2 15 21 6PACIFIC 3,131 1,387 146 156 496 589 186CALIFORNIA 983 438 46 52 178 162 69OREGON 298 146 12 17 55 62 12WASHINGTON 1,552 666 76 65 221 304 94ALASKA 72 32 1 5 11 16 3HAWAII 226 105 12 16 32 45 8Source: U.S. Department of Commerce, International Trade Administration, Office of Travel & Tourism Industries(1) Total U.S. (NET) reflects non-duplicated parties. These totals are not revised when Statistics Canada revises total visitor estimates.(2) Total U.S. (SUM) and regional totals sum the visits across U.S. regions and states. Thus, the sum totals include possible double-counting of travelers who visit more than one state. State details may not sum to totals due to rounding.(3) Based on industry recommendation, OTTI policy is to suppress state data for which sample size is fewer than 100.Note: Totals for Canada may differ across tables due to differences in response rates for questions.* Cells containing an asterisk represent visitor volume estimates of fewer than 500.
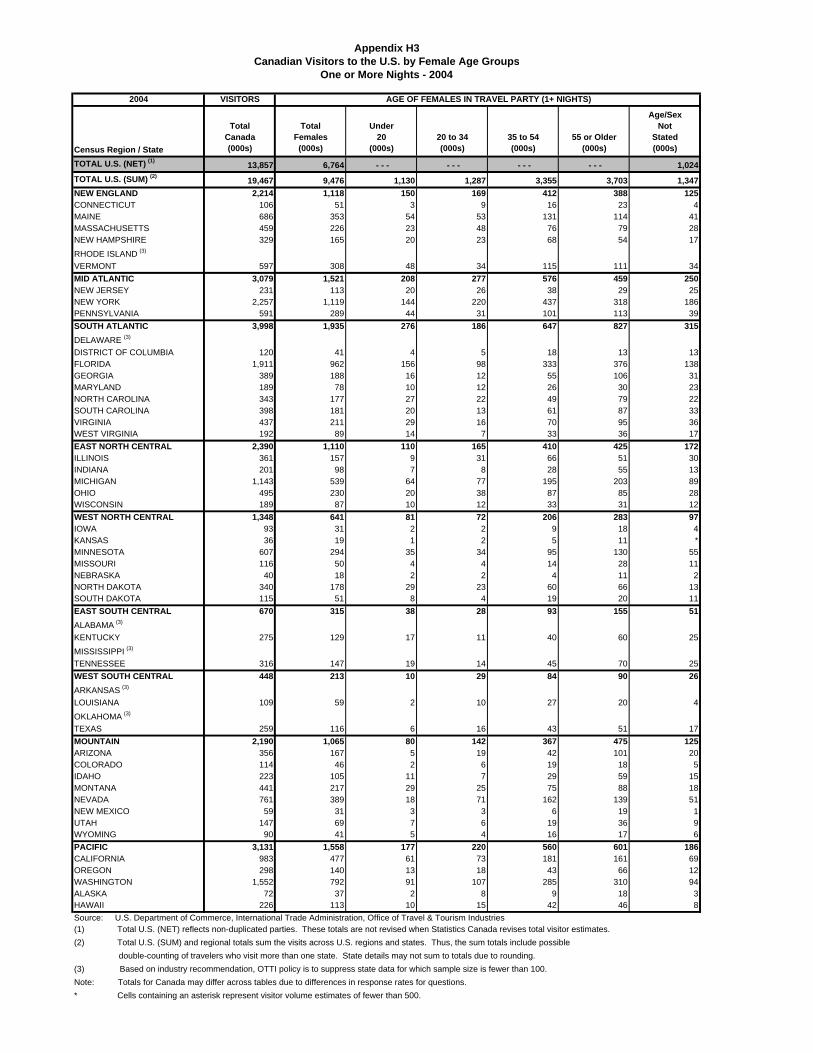
Appendix H3Canadian Visitors to the U.S. by Female Age Groups
One or More Nights - 2004
2004 VISITORS AGE OF FEMALES IN TRAVEL PARTY (1+ NIGHTS)
Census Region / State
TotalCanada(000s)
TotalFemales(000s)
Under20
(000s)20 to 34(000s)
35 to 54(000s)
55 or Older(000s)
Age/SexNot
Stated(000s)
TOTAL U.S. (NET) (1) 13,857 6,764 - - - - - - - - - - - - 1,024TOTAL U.S. (SUM) (2) 19,467 9,476 1,130 1,287 3,355 3,703 1,347NEW ENGLAND 2,214 1,118 150 169 412 388 125CONNECTICUT 106 51 3 9 16 23 4MAINE 686 353 54 53 131 114 41MASSACHUSETTS 459 226 23 48 76 79 28NEW HAMPSHIRE 329 165 20 23 68 54 17RHODE ISLAND (3)
VERMONT 597 308 48 34 115 111 34MID ATLANTIC 3,079 1,521 208 277 576 459 250NEW JERSEY 231 113 20 26 38 29 25NEW YORK 2,257 1,119 144 220 437 318 186PENNSYLVANIA 591 289 44 31 101 113 39SOUTH ATLANTIC 3,998 1,935 276 186 647 827 315DELAWARE (3)
DISTRICT OF COLUMBIA 120 41 4 5 18 13 13FLORIDA 1,911 962 156 98 333 376 138GEORGIA 389 188 16 12 55 106 31MARYLAND 189 78 10 12 26 30 23NORTH CAROLINA 343 177 27 22 49 79 22SOUTH CAROLINA 398 181 20 13 61 87 33VIRGINIA 437 211 29 16 70 95 36WEST VIRGINIA 192 89 14 7 33 36 17EAST NORTH CENTRAL 2,390 1,110 110 165 410 425 172ILLINOIS 361 157 9 31 66 51 30INDIANA 201 98 7 8 28 55 13MICHIGAN 1,143 539 64 77 195 203 89OHIO 495 230 20 38 87 85 28WISCONSIN 189 87 10 12 33 31 12WEST NORTH CENTRAL 1,348 641 81 72 206 283 97IOWA 93 31 2 2 9 18 4KANSAS 36 19 1 2 5 11 *MINNESOTA 607 294 35 34 95 130 55MISSOURI 116 50 4 4 14 28 11NEBRASKA 40 18 2 2 4 11 2NORTH DAKOTA 340 178 29 23 60 66 13SOUTH DAKOTA 115 51 8 4 19 20 11EAST SOUTH CENTRAL 670 315 38 28 93 155 51ALABAMA (3)
KENTUCKY 275 129 17 11 40 60 25MISSISSIPPI (3)
TENNESSEE 316 147 19 14 45 70 25WEST SOUTH CENTRAL 448 213 10 29 84 90 26ARKANSAS (3)
LOUISIANA 109 59 2 10 27 20 4OKLAHOMA (3)
TEXAS 259 116 6 16 43 51 17MOUNTAIN 2,190 1,065 80 142 367 475 125ARIZONA 356 167 5 19 42 101 20COLORADO 114 46 2 6 19 18 5IDAHO 223 105 11 7 29 59 15MONTANA 441 217 29 25 75 88 18NEVADA 761 389 18 71 162 139 51NEW MEXICO 59 31 3 3 6 19 1UTAH 147 69 7 6 19 36 9WYOMING 90 41 5 4 16 17 6PACIFIC 3,131 1,558 177 220 560 601 186CALIFORNIA 983 477 61 73 181 161 69OREGON 298 140 13 18 43 66 12WASHINGTON 1,552 792 91 107 285 310 94ALASKA 72 37 2 8 9 18 3HAWAII 226 113 10 15 42 46 8Source: U.S. Department of Commerce, International Trade Administration, Office of Travel & Tourism Industries(1) Total U.S. (NET) reflects non-duplicated parties. These totals are not revised when Statistics Canada revises total visitor estimates.(2) Total U.S. (SUM) and regional totals sum the visits across U.S. regions and states. Thus, the sum totals include possible double-counting of travelers who visit more than one state. State details may not sum to totals due to rounding.(3) Based on industry recommendation, OTTI policy is to suppress state data for which sample size is fewer than 100.Note: Totals for Canada may differ across tables due to differences in response rates for questions.* Cells containing an asterisk represent visitor volume estimates of fewer than 500.

Appendix ICanadian Visitors to the U.S. by Nights Spent in State
One or More Nights - 2004
2004 VISITORS DAY-TRIPS
Census Region / State
TotalCanadaDay &
Overnight(000s)
SameDay
(000s)
TOTAL1+ Nights (NET)
(000s)
OneNight(000s)
Two to SixNights(000s)
Seven toThirteenNights(000s)
Fourteenor MoreNights(000s)
AverageNights
Per Visit
TOTAL U.S. (NET) (1) - - - - - - 13,857 1,676 7,630 2,989 1,562 7.7TOTAL U.S. (SUM) (2) 31,483 12,016 19,467 5,380 10,139 2,685 1,263 5.4NEW ENGLAND 3,846 1,632 2,214 562 1,408 209 35 3.3CONNECTICUT 162 56 106 40 56 7 2 3.3MAINE 875 189 686 170 432 74 10 3.3MASSACHUSETTS 619 160 459 61 324 59 15 4.2NEW HAMPSHIRE 791 463 329 107 202 17 2 2.7RHODE ISLAND (3)
VERMONT 1,332 735 597 171 375 46 5 2.7MID ATLANTIC 5,992 2,913 3,079 990 1,872 193 24 2.8NEW JERSEY 323 92 231 53 139 36 3 3.9NEW YORK 4,301 2,043 2,257 641 1,477 123 16 2.8PENNSYLVANIA 1,369 778 591 296 256 34 5 2.5SOUTH ATLANTIC 6,542 2,544 3,998 953 1,258 1,111 676 10.6DELAWARE (3)
DISTRICT OF COLUMBIA 188 68 120 27 82 10 1 3.3FLORIDA 2,041 130 1,911 38 422 851 600 18.2GEORGIA 878 489 389 171 185 26 7 3.1MARYLAND 593 404 189 97 77 14 1 2.9NORTH CAROLINA 797 454 343 168 133 25 17 3.4SOUTH CAROLINA 736 337 398 98 121 140 40 7.0VIRGINIA 830 394 437 211 175 43 9 2.9WEST VIRGINIA 440 247 192 136 55 1 * 1.4EAST NORTH CENTRAL 4,570 2,180 2,390 897 1,321 133 39 2.9ILLINOIS 754 392 361 111 218 23 10 3.3INDIANA 514 313 201 78 109 10 4 3.4MICHIGAN 2,128 985 1,143 454 611 63 16 2.6OHIO 869 374 495 185 280 24 6 2.6WISCONSIN 305 116 189 69 103 14 3 3.3WEST NORTH CENTRAL 2,005 657 1,348 471 803 56 18 2.6IOWA 141 49 93 40 46 6 1 2.8KANSAS 66 30 36 18 14 2 2 4.1MINNESOTA 902 295 607 190 388 21 8 2.6MISSOURI 149 33 116 30 74 9 3 3.7NEBRASKA 66 26 40 18 18 2 2 3.1NORTH DAKOTA 527 187 340 135 198 5 2 2.1SOUTH DAKOTA 153 38 115 39 65 11 * 2.8EAST SOUTH CENTRAL 1,164 495 670 362 270 28 9 2.5ALABAMA (3)
KENTUCKY 498 223 275 172 96 5 2 2.1MISSISSIPPI (3)
TENNESSEE 510 194 316 163 137 14 2 2.4WEST SOUTH CENTRAL 591 143 448 78 244 77 48 8.0ARKANSAS (3)
LOUISIANA 125 16 109 9 85 13 2 4.7OKLAHOMA (3)
TEXAS 331 73 259 24 129 61 45 11.0MOUNTAIN 2,910 719 2,190 428 1,306 307 150 6.4ARIZONA 422 65 356 34 124 84 115 19.1COLORADO 158 45 114 19 66 24 5 5.5IDAHO 485 263 223 98 110 11 4 2.9MONTANA 558 117 441 122 271 40 8 3.3NEVADA 850 89 761 46 592 110 13 4.7NEW MEXICO 83 24 59 16 30 10 3 4.1UTAH 217 70 147 44 76 24 3 3.7WYOMING 137 47 90 49 36 4 * 2.1PACIFIC 3,864 733 3,131 639 1,656 570 265 5.7CALIFORNIA 1,167 184 983 52 481 328 123 8.7OREGON 359 61 298 63 197 31 7 3.7WASHINGTON 1,895 343 1,552 509 928 91 24 2.8ALASKA 177 105 72 13 34 19 5 6.1HAWAII 267 41 226 2 17 102 106 15.0Source: U.S. Department of Commerce, International Trade Administration, Office of Travel & Tourism Industries(1) Total U.S. (NET) reflects non-duplicated parties. These totals are not revised when Statistics Canada revises total visitor estimates.(2) Total U.S. (SUM) and regional totals sum the visits across U.S. regions and states. Thus, the sum totals include possible double-counting of travelers who visit more than one state. State details may not sum to totals due to rounding.(3) Based on industry recommendation, OTTI policy is to suppress state data for which sample size is fewer than 100.Note: Totals for Canada may differ across tables due to differences in response rates for questions.* Cells containing an asterisk represent visitor volume estimates of fewer than 500.
NIGHTS SPENT IN U.S. DESTINATION (1+ NIGHTS)
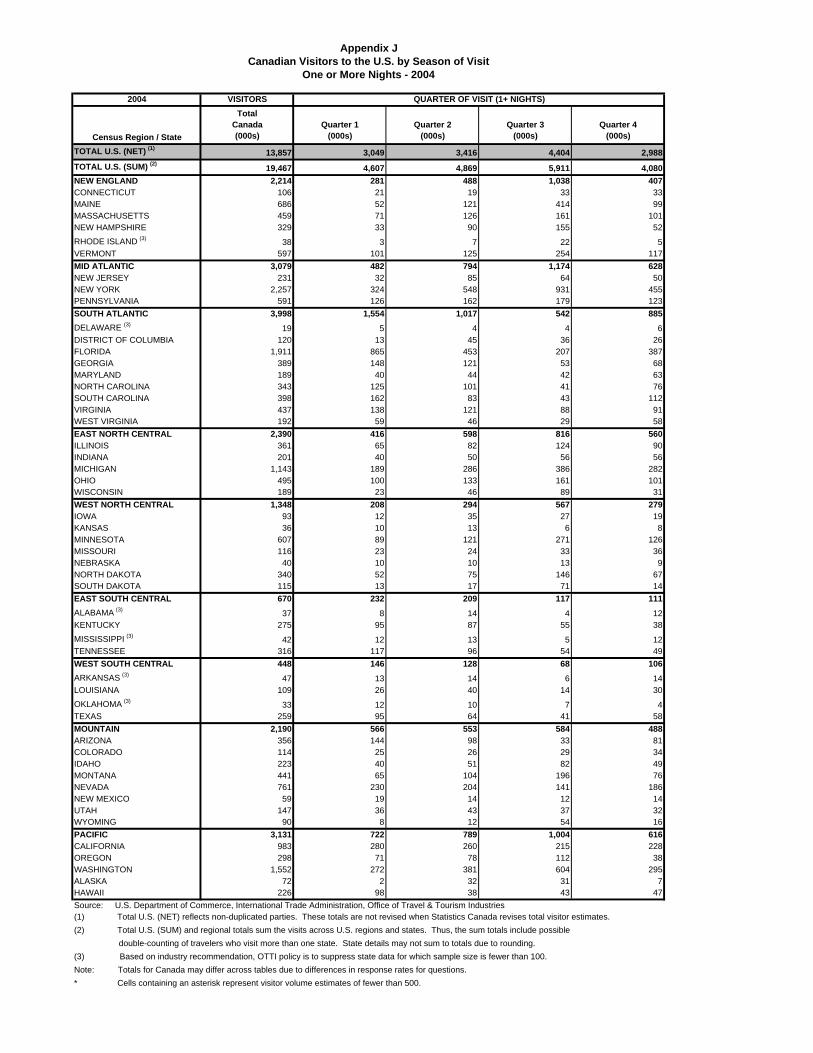
Appendix JCanadian Visitors to the U.S. by Season of Visit
One or More Nights - 2004
2004 VISITORS QUARTER OF VISIT (1+ NIGHTS)
Census Region / State
TotalCanada(000s)
Quarter 1(000s)
Quarter 2(000s)
Quarter 3(000s)
Quarter 4(000s)
TOTAL U.S. (NET) (1) 13,857 3,049 3,416 4,404 2,988TOTAL U.S. (SUM) (2) 19,467 4,607 4,869 5,911 4,080NEW ENGLAND 2,214 281 488 1,038 407CONNECTICUT 106 21 19 33 33MAINE 686 52 121 414 99MASSACHUSETTS 459 71 126 161 101NEW HAMPSHIRE 329 33 90 155 52RHODE ISLAND (3) 38 3 7 22 5VERMONT 597 101 125 254 117MID ATLANTIC 3,079 482 794 1,174 628NEW JERSEY 231 32 85 64 50NEW YORK 2,257 324 548 931 455PENNSYLVANIA 591 126 162 179 123SOUTH ATLANTIC 3,998 1,554 1,017 542 885DELAWARE (3) 19 5 4 4 6DISTRICT OF COLUMBIA 120 13 45 36 26FLORIDA 1,911 865 453 207 387GEORGIA 389 148 121 53 68MARYLAND 189 40 44 42 63NORTH CAROLINA 343 125 101 41 76SOUTH CAROLINA 398 162 83 43 112VIRGINIA 437 138 121 88 91WEST VIRGINIA 192 59 46 29 58EAST NORTH CENTRAL 2,390 416 598 816 560ILLINOIS 361 65 82 124 90INDIANA 201 40 50 56 56MICHIGAN 1,143 189 286 386 282OHIO 495 100 133 161 101WISCONSIN 189 23 46 89 31WEST NORTH CENTRAL 1,348 208 294 567 279IOWA 93 12 35 27 19KANSAS 36 10 13 6 8MINNESOTA 607 89 121 271 126MISSOURI 116 23 24 33 36NEBRASKA 40 10 10 13 9NORTH DAKOTA 340 52 75 146 67SOUTH DAKOTA 115 13 17 71 14EAST SOUTH CENTRAL 670 232 209 117 111ALABAMA (3) 37 8 14 4 12KENTUCKY 275 95 87 55 38MISSISSIPPI (3) 42 12 13 5 12TENNESSEE 316 117 96 54 49WEST SOUTH CENTRAL 448 146 128 68 106ARKANSAS (3) 47 13 14 6 14LOUISIANA 109 26 40 14 30OKLAHOMA (3) 33 12 10 7 4TEXAS 259 95 64 41 58MOUNTAIN 2,190 566 553 584 488ARIZONA 356 144 98 33 81COLORADO 114 25 26 29 34IDAHO 223 40 51 82 49MONTANA 441 65 104 196 76NEVADA 761 230 204 141 186NEW MEXICO 59 19 14 12 14UTAH 147 36 43 37 32WYOMING 90 8 12 54 16PACIFIC 3,131 722 789 1,004 616CALIFORNIA 983 280 260 215 228OREGON 298 71 78 112 38WASHINGTON 1,552 272 381 604 295ALASKA 72 2 32 31 7HAWAII 226 98 38 43 47Source: U.S. Department of Commerce, International Trade Administration, Office of Travel & Tourism Industries(1) Total U.S. (NET) reflects non-duplicated parties. These totals are not revised when Statistics Canada revises total visitor estimates.(2) Total U.S. (SUM) and regional totals sum the visits across U.S. regions and states. Thus, the sum totals include possible double-counting of travelers who visit more than one state. State details may not sum to totals due to rounding.(3) Based on industry recommendation, OTTI policy is to suppress state data for which sample size is fewer than 100.Note: Totals for Canada may differ across tables due to differences in response rates for questions.* Cells containing an asterisk represent visitor volume estimates of fewer than 500.