Embed Size (px)
Citation preview

Joint Economic Committee433 Cannon House Office BuildingWashington, DC 20515Phone: 202-226-3234Fax: 202-226-3950
Internet Address:http://www.house.gov/jec/
AbstractCanada’s oil sands production in the province of Alberta already equals the oil output of Qatar.
The output potential from this unconventional source of oil is enormous, as Alberta’s proven oil sands reserves rival in size the conventional reserves of Saudi Arabia.
On the strength of expected oil sands output growth and despite declining conventional oil output, Canada can be expected to move from 7th to 5th place in ten years among the world’s oil producers.
Oil sands development interacts with OPEC’s output strategy: the restricted output of less costly conventional oil raises the market price and keeps the oil sands on an accelerated expansion path. Just how fast they develop depends largely on how OPEC from now on deals with the increase in global oil demand brought about by China’s and India’s economic growth. If OPEC’s output strategy keeps the price high, it will continue to stimulate oil sands investments.
The rapid increase in the scale of oil sands production is pushing up short-run costs. But eventually input markets and the infrastructure will catch up and together with technical advances stabilize the cost per barrel. At that point, given the huge reserves, the oil sands supply will set an upper limit to the world oil price that OPEC can no longer exceed.
Chairman Jim Saxton (R-NJ)Joint Economic Committee
United States Congress
June 2006
CANADIAN OIL SANDS:A NEW FORCE IN THE WORLD OIL
MARKETA JOINT ECONOMIC COMMITTEE STUDY

A JOINT ECONOMIC COMMITTEE STUDY Page 1
CANADIAN OIL SANDS: A NEW FORCE IN THE WORLD OIL MARKET
Introduction. The petroleum industry is turning to unconventional sources of oil and gas, which hold out promise for vast additions to the energy supply. Canada’s oil sands in Alberta represent a large potential increment to the world’s supply of oil as the recovery technology is proving economical on an increasing scale. Canada’s current unconventional oil production alone would rank it twenty-first among the world’s crude oil producing nations equal with Qatar. With reserves that rival Saudi Arabia’s in size, Canadian oil sands development has the potential to moderate future oil prices in the world market. The main determinants of the oil sands role in the market going forward will be cost and OPEC’s output strategy for the large reserves of conventional oil it holds. Several key conditions bode well for the development of the oil sands reserves:
Privatized oil sector with assured property rights and reasonable royalty payment regime;
Oil sands producers are price takers and subject to laws governing competition similar to those in the U.S.;
Secure and efficient oil export shipping routes;
Transparency in oil reserve estimates, production activity, and development plans.
For the North American crude oil market, the large indigenous reserves under development hold out the prospect of increasing energy security. However, large increases in Canadian oil sands output will take time as they require huge investments and progress in managing costs.
Conventional versus unconventional. “Conventional” production essentially means that well bores tap underground reservoirs of oil in liquid and natural gas in gaseous form and release the resources to the surface without facilitating means, at least initially. In time, secondary recovery methods, such as water injection to restore underground pressure, are applied but in the main these do not fundamentally alter the recovery process or change the resource from its natural state. Unconventional oil and gas production requires an active extraction effort or additional steps to convert the natural resource to usable form. The technologies to do so are still at an early stage of development and their costs are considerably higher than for conventional oil and gas production. In Canada, a transition from conventional to unconventional oil is underway and likely will proceed with respect to natural gas as
Figure 1

Page 2 Canadian Oil Sands: A New Force in the World Oil Market well. Canada’s known conventional oil and gas reserves are in decline. Yet Canada has continued to increase its total output of oil and natural gas as well as its exports of oil.1 The reason for the continued increase in Canadian oil output is oil sands production, which contributes over 40 percent to the total. Since 2003, the Oil & Gas Journal has included Canadian oil sands in its country listing of proven oil reserves, and for 2005 it reports 174.1 billion barrels of reserves from oil sands in addition to 4.7 billion barrels of conventional oil reserves.2 This ranks Canada second only to Saudi Arabia (264.3 billion barrels) and far ahead of all other oil reserve holders in the world. In addition, it is estimated that as yet unproven quantities of oil thought to be recoverable from the Alberta sands would bring potential reserves to 315 billion barrels out of a total resource base of 1.7 to 2.5 trillion barrels.3 315 billion barrels is more than 40 times the current annual U.S. oil consumption. At this time, Alberta oil sands production exceeds 1 million barrels per day (b/d), an amount that would place Canada 21st among the world’s oil producing nations tied with Qatar. Including conventional sources, Canada’s rate of oil supply currently ranks 7th in the world with 3.1 million b/d.4 Canada’s conventional proven reserves of natural gas, which is used in the oil sands production process, were 56.1 trillion cubic feet (tcf) in 2004, representing a decline from 64.7 tcf in 1997. But, according to a report issued jointly by the Alberta Energy Utilities Board and Canada’s National Energy Board, the remaining ultimate potential for recovery of conventional natural gas in Alberta alone was 101 tcf as of December 2004.5 Gas reserves likely will be boosted by supply from remote areas (such as the Beaufort Sea region) and unconventional sources (such as coalbed methane and so-called tight gas trapped in dense layers of rock), but these have not been developed to the point of becoming “proven” reserves and have not entered production on a large scale. Including coalbed methane, Canada’s potential natural gas reserves could exceed 500 tcf.6 Oil sands, bitumen, and SCO. Alberta’s oil sands are located in three distinct areas—Athabasca, the largest, Cold Lake, and Peace River—which together cover an area of 54 thousand square miles, well over twice the size of West Virginia (see Figure 1). Oil sands consist of bitumen, which is soluble organic matter solid at room temperature and host sediment. Raw bitumen within the sands is a tar-like mixture of hydrocarbons often with sulfur compounds. It has an API gravity of around 8°.7 Conventional oil is considered “heavy” if it has an API gravity of less than 22.3°. “Light” crude oil has an
1 Canada also imports oil that is refined in its eastern and Ontario refineries. 2 Oil & Gas Journal, December 19, 2005; 103, 47. 3 “Alberta’s Oil Sands 2004, Updated December 2005,” Alberta Department of Energy, p.2, http://www.energy.gov.ab.ca/docs/oilsands/pdfs/PUB_osgenbrf.pdf; “Annual Energy Outlook 2006,” Energy Information Administration (EIA), pp. 52, 53. Only the estimated amounts of oil that are technically and economically recoverable from the sands are considered “reserves.” 4 Data supplied by EIA. Oil “supply” data include other components in addition to crude oil (see 11n34). 5 Proven natural gas reserve data from “Canada—Country Analysis Brief,” EIA, February 2005, p.5; estimate of ultimate potential from EUB/NEB Report 2005-A: “Alberta’s Ultimate Potential for Conventional Natural Gas,” March 2005, p. vi, www.eub.gov.ab.ca and www.neb-one.gc.ca. 6 “Canada—Country Analysis Brief,” p.7. 7 The API (American Petroleum Institute) gravity scale is the standard method for measuring the relative density of petroleum liquids.
A JOINT ECONOMIC COMMITTEE STUDY Page 3 API gravity higher than 31.1°. Light, low sulfur oil is less costly to ship and refine and commands a price premium relative to heavier crude oils. Producers must decide in what form to bring bitumen to market. Raw bitumen can be used for asphalt but cannot be shipped through pipelines, unless it is blended with lighter commodities to lower its viscosity. The optimal marketable mix of bitumen blends is determined by price differentials for different crude oil grades and supply conditions for blending agents. The premium put on lighter crude oils by refineries, most of which are not designed to process very heavy crude oil, causes almost all bitumen to be blended and more than half to be upgraded to so-called synthetic crude oil (SCO). SCO has an API gravity of 31° to 33° and is comparable to benchmark West Texas Intermediate (WTI). The production process. North of Fort McMurray in the Athabasca area shallow oil sands deposits are recovered in open-pit mine operations and hauled by truck to processing facilities where steam is used to separate the bitumen from the sand. In other areas, bitumen is buried more than 75 meters beneath the surface and is recovered by drilling wells. There are reservoirs in the oil sands where “primary” or “cold” production is possible. The same types of pumps are employed as in conventional heavy oil production, but the bitumen recovered this way contains two to three times more sand than conventional heavy oil. This method is called CHOPS, cold heavy oil production with sand. Most underground bitumen will not flow to a well bore and has to be heated. There are various methods to do this. The two most prominent ones are (1) Cyclic Steam Stimulation (CSS), which uses a single well to inject steam and, after soak time, to pump the fluids to the surface, and (2) Steam Assisted Gravity Drainage (SAGD), which uses two wells drilled vertically and then angled horizontally, one above the other, so that steam can be injected into the upper one and the warmed bitumen collected and pumped out through the lower one. Water and natural gas are used in large quantity for bitumen production and in the upgrading process to produce SCO. The search is underway for substitutes to natural gas in power and steam generation, such as burning bitumen and coke gasification. Extraction technologies that reduce or eliminate the need for steam also are emerging such as pulse technology, vapor recovery extraction (VAPEX), and toe-to-heal air injection (THAI).8 These methods rely on air blasts from pneumatic systems, solvents, and air or oxygen for in-ground combustion to separate the bitumen and cause it to flow to a well bore. All oil sands production methods employing wells are known collectively as “in situ,” referring to the separation of bitumen from the sand “in place.” Two-thirds of bitumen output currently is produced by strip mining oil sands and extracting the bitumen off-site, 10 percent by “cold” production, and 24 percent in situ.9 But, eighty percent of the recoverable bitumen reserves are buried too deep for strip mining and will have to be recovered by drilling wells.
8 “Alberta’s Oil Sands,” p. 3. 9 “Alberta’s Oil Sands,” p. 4.

Page 4 Canadian Oil Sands: A New Force in the World Oil Market Market-driven oil sector. The Canadian oil industry is operated exclusively by private companies. The Canadian government does not control oil output. A government-owned company, Petro-Canada, was formed in 1975 but privatized beginning in 1991. The Canadian government sold its remaining 20 percent ownership share in 2004. The largest integrated operator in Canada is Imperial Oil, majority-owned by ExxonMobil. The four largest oil sands projects are operated by Suncor, Syncrude (a joint venture composed principally of Canadian Oil Sands Ltd., Imperial, Petro-Canada, and ConocoPhillips), Shell Oil and Chevron, and Imperial Oil. The Alberta Department of Energy reports that there were 29 companies representing 61 projects approved under The Mines & Minerals Act and the Oil Sands Royalty Regulation 1997, as amended (OSRR 97).10 Canada’s anti-trust laws are similar to those in the U.S. The Competition Act of 1889 is the oldest anti-trust statute in the western world, enacted one year before the Sherman Act. A Competition Tribunal and a Competition Bureau headed by a Commissioner of Competition have responsibility for enforcement. The Commissioner entered into cooperation agreements with the U.S. in 1995 and subsequently with a number of other foreign administrations, including the European Commission. The Mutual Assistance on Criminal Matters Treaty (MLAT) between Canada and the United States, in force since 1990, has recently been amended to include cooperation in the administration of civil competition law.11 Ninety-seven percent of Alberta’s mineral rights are owned by the provincial Crown and managed by the Alberta Department of Energy.12 The royalty payment regime is set forth in OSRR 97. It was based on a joint industry-government national task force recommendation. During a project’s pay-back period, i.e., until its investment has been recovered, royalty payments are one percent of gross revenue. After the payback period, royalty payments are the greater of one percent of gross revenue or 25% of net revenue, generally amounting to 11 percent of gross revenue. Since 1996 when this royalty regime was first introduced, $27 billion of investment in the oil sands has occurred. Since 1990, more than $3.5 billion has been collected in royalties.13 Exports to the U.S. Canada sends 99 percent of its crude oil exports to the United States. It is the largest foreign supplier of both crude oil and natural gas to the United States. Canada’s share of U.S. crude imports has been increasing steadily over a number of years and since 2004 ranks first, ahead of Saudi Arabia’s. As Figure 2 shows, 16 percent of U.S. crude oil imports came from Canada in 2005.14 10 “Canada—Country Analysis Brief,” p.3; “Alberta’s Oil Sands,” p.4. 11 “Overview of Canadian Anti-trust Law,” Yves Beriault and Oliver Borgers, The Antitrust Review of the Americas, 2004. 12 The remaining three percent are held by the federal Crown within Indian reserves, successors to the Hudson’s Bay Company, national railway companies, and descendants of original homesteaders through rights granted by the federal Crown before 1887, so-called freehold rights. 13 “Alberta’s Oil Sands,” p. 4, and “Economic Impacts of Alberta’s Oil Sands, Volume I,” by Govinda R. Timilsina, Nicole LeBlanc, and Thorn Walden, Canadian Energy Research Institute (CERI), October 2005, Study No. 110, ISBN 1-896091-47-4, p.46. 14 “Canada—Country Analysis Brief,” pp.2, 5; and “U.S Imports by Country of Origin,” EIA, www.eia.doe.gov. A redistribution of U.S. oil imports among OPEC countries, particularly reductions in

A JOINT ECONOMIC COMMITTEE STUDY Page 5
U.S. CRUDE OIL NET IMPORTS 2005
OPECNON-OPEC
CANADA16%
S. ARABIA14.4%
33.2%
36.4%
Fort McMurray in the northern part of the Athabasca oil sands is about 250 miles north of Edmonton, the center of Alberta’s oil industry, which in turn is about 300 miles north of the Montana border. From Edmonton major oil pipeline connections reach into the U.S., as Figure 3 shows.
Crude oil produced in Western Canada is shipped to market via three major pipelines, Kinder Morgan’s Trans-Mountain and Express pipelines (both formerly of Terasen Pipelines, Inc.), and Enbridge. The Enbridge system has the largest capacity of more than 2.1 million b/d; the other two have throughput capacities of 280,000 and 225,000 b/d, respectively. Express and Enbridge interconnect with the U.S. domestic network of pipelines.15 The Trans-Mountain pipeline can supply British Columbia, Washington State, and oil tankers in the port of Vancouver for shipment to California and Asia. The regional distribution of Western Canadian crude oil exports has favored the U.S.
Saudi and increases in Nigerian oil imports, has contributed to the change in the country rankings. U.S. oil imports from Mexico rank second and from Saudi Arabia third. 15 The two countries’ natural gas pipelines (not shown) are interconnected to an even greater extent.
Figure 3
Figure 2
Source: EIA
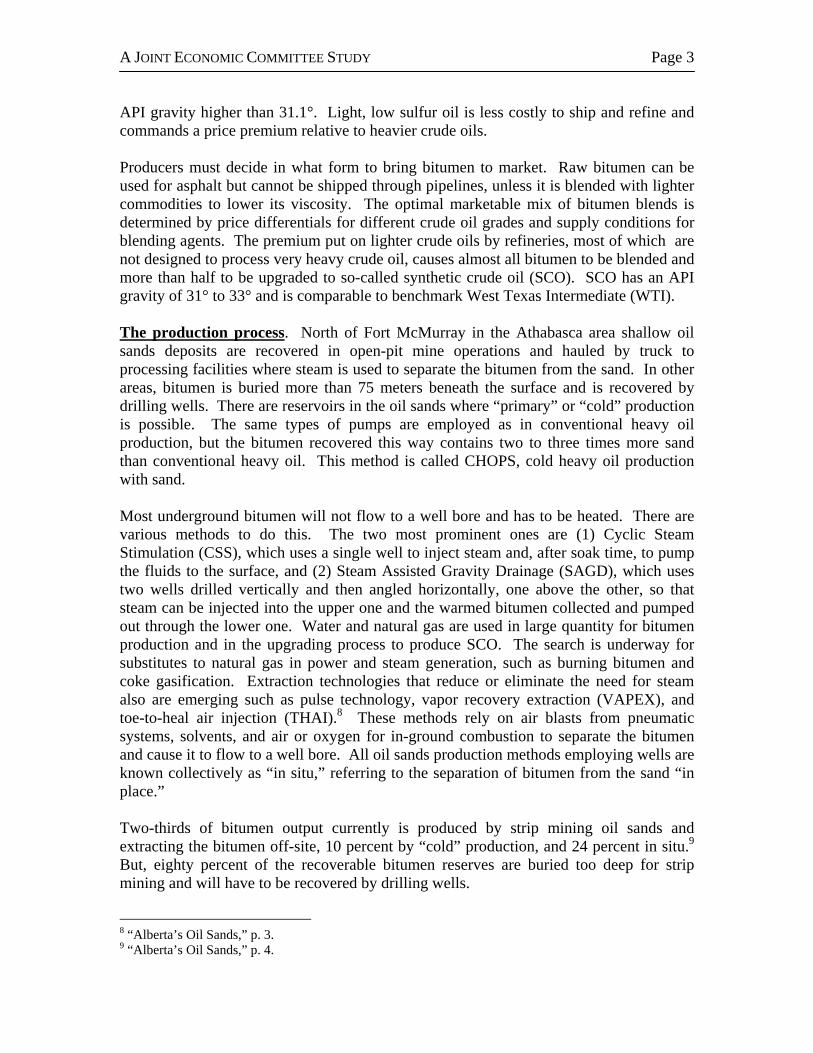
Page 6 Canadian Oil Sands: A New Force in the World Oil Market heartland with 70 percent delivered to PADD (Petroleum Administration for Defense District) II. Figure 4 depicts the volume of 2003 Alberta crude oil exports by route.16
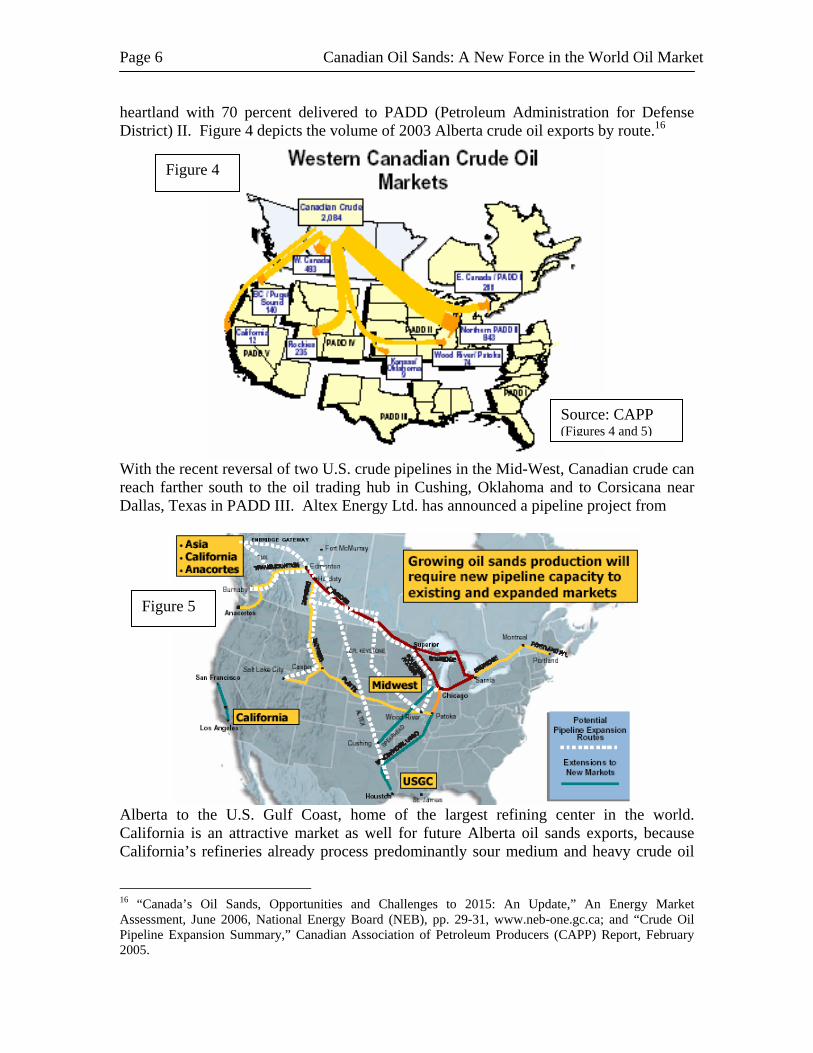
With the recent reversal of two U.S. crude pipelines in the Mid-West, Canadian crude can reach farther south to the oil trading hub in Cushing, Oklahoma and to Corsicana near Dallas, Texas in PADD III. Altex Energy Ltd. has announced a pipeline project from
Alberta to the U.S. Gulf Coast, home of the largest refining center in the world. California is an attractive market as well for future Alberta oil sands exports, because California’s refineries already process predominantly sour medium and heavy crude oil
16 “Canada’s Oil Sands, Opportunities and Challenges to 2015: An Update,” An Energy Market Assessment, June 2006, National Energy Board (NEB), pp. 29-31, www.neb-one.gc.ca; and “Crude Oil Pipeline Expansion Summary,” Canadian Association of Petroleum Producers (CAPP) Report, February 2005.
Figure 4
Source: CAPP (Figures 4 and 5)
Figure 5
A JOINT ECONOMIC COMMITTEE STUDY Page 7 and rely on two sources of supply that are in decline, namely in-state and Alaska production. Shipping costs from Alberta to California are lower than to the U.S. Gulf Coast. Since the late 1990’s, pipeline capacity out of Western Canada has increased by about 550,000 b/d. Planned additions to pipeline capacity, according to the Canadian Association of Petroleum Producers (CAPP), will amount to 740,000 b/d by 2010. Forecasts. The Canadian Energy Research Institute (CERI) has developed an oil sands supply forecast that takes into account market parameters such as the price of crude oil and the cost of natural gas as an input to bitumen/SCO production.17 At a price of $25 per barrel for benchmark WTI crude, CERI projects a doubling of the combined bitumen and SCO supply to 2.2 million b/d by 2017; at a price of $32 per barrel, it projects supply to reach 2.8 million b/d by 2017. In 2004, Canada’s National Energy Board (NEB) had forecasted 2.2 million b/d of oil sands supply by 2015 on a price assumption of $24 per barrel. This year, NEB forecasts 3.0 million b/d by 2015 assuming $50 per barrel.18 Of note is that CERI and NEB both have found that the rate of oil sands supply can profitably double in ten to twelve years at a price of about $25 per barrel (WTI), but further accelerating the pace of expansion pushes the cost up and requires higher market prices. In a recent update to its forecast, assuming a price of $32 per barrel and incorporating various market constraints to expansion, CERI shows expected bitumen and SCO supply of 3.2 million b/d by the year 2020.19 CERI also presents a “potential” forecast that is unconstrained which shows supply could reach 4.2 million b/d by 2020. These are figures for marketable bitumen blends and SCO supply, not for production of raw bitumen. Production of raw bitumen reaches 3.6 million b/d under CERI’s “expected” and 4.7 million b/d under its “potential” forecast by 2020.20 In a new forecast by CAPP raw bitumen production is projected to reach 4 million b/d by 2020.21 Figure 6 shows a comparison of CAPP’s forecast and the two by CERI for bitumen production before blending and upgrading to SCO. The main difference between CERI’s expected forecast and the higher ones is that the latter are based on
17 “Oil Sands Supply Outlook, Potential Supply and Costs of Crude Bitumen and Synthetic Crude Oil in Canada, 2003-2017,” CERI Media Briefing, March 3, 2004, page 14. CERI is a cooperative organization established through an initiative of government, academia, and industry in 1975 to provide independent economic research. 18 May 2004 and June 2006 releases of “Canada’s Oil Sands: Opportunities and Challenges to 2015,” An Energy Assessment, NEB. 19 “Central scenario” in “Economic Impacts of Alberta’s Oil Sands,” p.20. 20 The ratio of bitumen blends to SCO varies within and across different supply forecasts. For example, CERI assumes a bitumen-to-SCO ratio around two-thirds in its “expected” case and somewhat higher ratios in its “potential” case. In the following, we compare forecasts on the basis of raw bitumen production as it eliminates the complexity of adjusting for differences in the supply mix. 21 “Canadian Crude Oil Production and Supply Forecast 2006 – 2020,” CAPP, May 2006, Table 1.

Page 8 Canadian Oil Sands: A New Force in the World Oil Market
OIL SANDS PRODUCTION FORECASTS
-
0.5
1.0
1.5
2.0
2.5
3.0
3.5
4.0
4.5
5.0
2006 2007 2008 2009 2010 2011 2012 2013 2014 2015 2016 2017 2018 2019 2020
MIL
LIO
N B
AR
REL
S PE
R D
AY
CERI EXPECTED
CAPP 2006CERI POTENTIAL
cumulative capacity of active and announced oil sands projects with little or no adjustment for delays and constraints to expansion. CAPP concedes that its 2006 forecast may be constrained by lagging implementation of new in situ techniques, scarcity of inputs, such as labor, and capacity limitations of pipelines and refineries. It foresees requirements for incremental pipeline throughput capacity above currently planned additions beginning in 2011 and rising to more than 1 million b/d by 2015. CAPP hopes its 2006 forecast will stimulate pipeline expansion. Short-run and long-run costs. In the short-run, substantially accelerated bitumen production is bidding up the price of inputs. NEB reports higher prices for inputs ranging from steel and cement to electricity and natural gas.22 As a result, oil sands production costs have increased. NEB and EIA refer to costs of more than $30 per barrel; CERI’s expected forecast is based on $32 per barrel. However, this does not necessarily invalidate the $25 per barrel cost used by CERI and NEB in lower forecasts and cited by many other sources.23 Input prices should stabilize and eventually decline again, as markets adapt to higher demand. In addition, oil sands production may be subject to economies of scale, and technical advances also may help to lower future cost. CAPP, NEB, and EIA (Energy Outlook 2006) all refer to cost reductions in important components of oil sands production. For example, CAPP shows a declining trend in the amount of natural gas consumed per barrel of oil produced.24 NEB reports that non-gas operating costs for a representative SAGD project have been reduced by 30 percent since 2004.25 In sum, while costs may rise in the short-run as the scale of bitumen production is rapidly increased, in the long-run costs may well decline again.
22 “Canada’s Oil Sands,” June 2006, p. 3. 23 For example, “Market Focus, Canadian Oil & Gas,” Supplement to Oil & Gas Journal, June 5, 2006, pp. 8, 11; Sam Fletcher, “N. American Unconventional Oil A Potential Energy Bridge,” Oil & Gas Journal, April 11, 2005, 103, 14, p. 25; Tamsin Carlisle, “A Black-Gold Rush in Alberta,” The Wall Street Journal, September 15, 2005; Mark Jaccard, Sustainable Fossil Fuels, The Unusual Suspect in the Quest for Clean and Enduring Energy, (Cambridge University Press, 2005), p.158. 24 “The Canadian Oil Sands, Opportunities and Challenges,” by Greg Stringham, Vice President, CAPP, February 2006, p.11, www.capp.ca. 25 “Canada’s Oil Sands,” June 2006, p.6.
Figure 6
(Assumes WTI at $32 per barrel)

A JOINT ECONOMIC COMMITTEE STUDY Page 9 Oil sands investments. Alberta’s oil sands producers face several challenges to accelerated output expansion: short-run cost increases as the supply chain adapts to higher rates of output; large investments and sunk costs; and added price risk, because their increment to the global oil supply is among the most costly in the world (they are “marginal” producers in this sense).
Input markets. Oil sands operations require a ready supply of labor and natural gas. Labor costs account for more than 40 percent of operating expenses in mining projects, natural gas for 60 to 70 percent of in situ operating expenses.26 The Alberta labor market is 75,000 to 100,000 skilled workers short, according to one industry estimate, pushing up salary levels.27 Until recently, the price of natural gas also had been increasing. In its 2006 oil sands forecast NEB assumes a NYMEX natural gas price of $7.50 per MMBtu, up from $4.00 in 2004. NEB estimates the volume of natural gas required for its Base Case oil sands supply forecasts to reach 2.1 billion cf/d by 2015, three times the level used in 2005.28 For the forecasts to hold, more workers and additional sources of natural gas are needed. Alternatively, more efficient use could be made of the inputs. Environmental restoration. Oil sands production requires large amounts of water to separate bitumen from sand and disturbs the land particularly through strip mining. Under the Environmental Protection and Enhancement Act (EPEA) Alberta requires oil and gas operators to employ effective conservation and reclamation measures. Oil sands operators have been increasing water reuse and forest has been reconstituted, but the faster oil sands development progresses, the more land needs to be reconstituted. Output mix and downstream facilities. Pipeline and SCO processing capacity has to be expanded and refinery facilities adapted to heavy, higher sulfur feedstock. In 2004, prior to the rise in input prices, CERI estimated the cost of producing raw bitumen between $13 and $16 per barrel and the cost of upgrading it to SCO to be about $11.50 per barrel.29 Maintaining overall profitability requires managing the mix of various bitumen blends and SCO according to the availability and cost of blending agents and the market price differentials for different crude oil grades. Bitumen has been diluted mostly with condensates and pentanes (Dil-Bit), which may have to be imported in the future. Bitumen also can be blended with SCO (Syn-Bit), which cuts into sales of the higher priced SCO. Accelerated increases in the rate of output ahead of other adjustments could create a surplus of bitumen in want for blending agents and depress the price for the lower grade feedstock.
26 “Economic Impacts of Alberta’s Oil Sands,” p. 27. 27 Norval Scott, “Alberta Worker Shortage Hampers Plans to Increase Oil-Sands Output,” The Wall Street Journal, April 24, 2006. 28 “Canada’s Oil Sands,” June 2006, p.16. Two major pipelines are under consideration to deliver natural gas from Alaska and the McKenzie Delta/Beaufort Sea region; see Tamsin Carlisle, “Exxon May Find Pipeline Self-Competing,” The Wall Street Journal, June 13, 2006, p. A18. 29 “Oil Sands Supply Outlook,” pp. 10-11. Costs at the plant gate, i.e., not including delivery. The U.S./Canadian dollar exchange rate used here is 0.9; CERI had assumed 0.75.

Page 10 Canadian Oil Sands: A New Force in the World Oil Market
Capital intensity. NEB estimates cumulative capital expenditures for oil sands production of $85 billion by 2015 to achieve supply at a rate of 3 million b/d, its Base Case. CERI estimates that capital expenditures could reach more than $90 billion cumulatively by 2020.30 The return to capital and possibly the return of capital could suffer greatly, if the market price of oil falls. In 2004, CERI estimated that if the oil price were to fall to $22 per barrel, the rate of return for in situ production would go to zero and the return on mining operations would drop to between zero and five percent. Price risk. The recent addition of China and India to the ranks of major oil importers has elevated the demand for oil on the world market. There is uncertainty associated with the pace of their continued economic development and, consequently, with their rate of oil consumption going forward. This creates price risk for oil producers investing billions of dollars in expanding supply. For the “marginal” producers this price risk is magnified by the fact that there still exists a large amount of low cost, conventional oil in the world. OPEC controls the vast majority of it with more than 900 billion barrels of proven oil reserves that cost less than $10 per barrel to produce.31 Canada’s oil sands development thus interacts with the output strategy of the market’s dominant supplier. Until recently, OPEC had targeted a price between $22 and $28 per barrel, close to the $25 level at which oil sands production expands slowly. The unexpected surge in Asian oil demand used up most of OPEC’s excess capacity and caught the cartel unprepared to expand capacity. As a result, the price has shot up, reaching as high as $75 per barrel recently. The cartel’s failure to reveal a new long-term price target and the time it now takes to bring new capacity on line leave the market guessing what future prices and market shares will be. OPEC members are able to increase production faster than most other producers, but their willingness to do so is unclear. Thus Alberta’s oil sands producers heavily discount today’s market price in their investment decisions.32 Accelerating the rate of bitumen output exposes their price sensitive investments to increasing risk, because the price needed to cover higher costs eventually may not be supported by OPEC. Prudent investors therefore chart an expansion path that does not drive the cost up too much and leaves time for input markets to grow, infrastructure to adjust, and technology to advance.33
Energy security versus independence. Canada’s total oil supply in 2005 was 3.1 million b/d. Of that, crude oil output was 2.5 million b/d (not counting other liquids such as natural gas liquids included in total oil supply data), and the oil sands accounted for 1.1 million b/d. The forecasts above show oil sands production increasing by three to four times in ten years, but the increase has to offset declines in conventional Canadian 30 NEB’s “Canada’s Oil Sands,” June 2006, p.12, and CERI’s “Economic Impacts of Alberta’s Oil Sands,” p. ix. 31 “OPEC’s 902 Billion Barrel Oil Reserve,” Research Report #109-28, Joint Economic Committee, January 2006. Costs in the Persian Gulf are less than $5 per barrel. 32 See, for example, CERI’s “Oil Sands Supply Outlook,” p. 10. 33 Oil futures contracts for delivery dates six years hence also are priced very high, but the futures market for those dates is not large enough to let Alberta producers pre-sell their incremental oil output and hedge the billions of dollars in oil sands investment. Control of the oil price in this timeframe rests principally with OPEC, given its large reserves and low production cost. Distant futures prices incorporate only guesses about OPEC’s oil output, which is highly uncertain (see discussion under “Limit price” below).
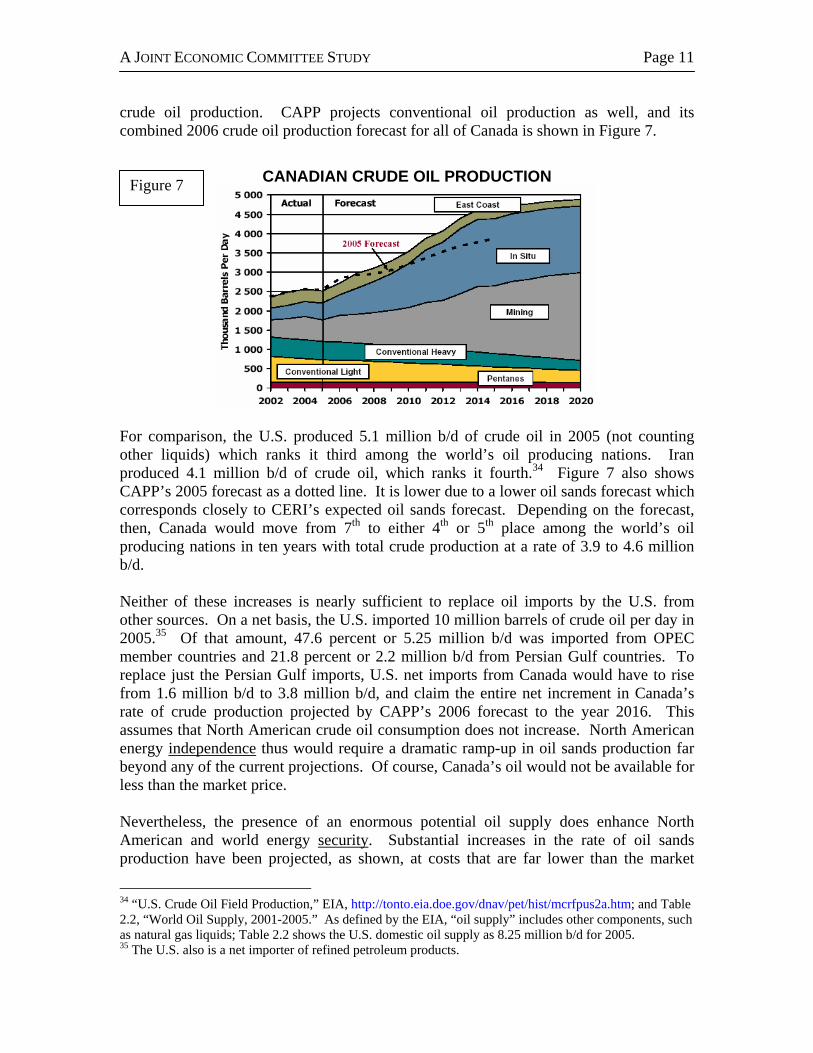
A JOINT ECONOMIC COMMITTEE STUDY Page 11 crude oil production. CAPP projects conventional oil production as well, and its combined 2006 crude oil production forecast for all of Canada is shown in Figure 7.
CANADIAN CRUDE OIL PRODUCTION
For comparison, the U.S. produced 5.1 million b/d of crude oil in 2005 (not counting other liquids) which ranks it third among the world’s oil producing nations. Iran produced 4.1 million b/d of crude oil, which ranks it fourth.34 Figure 7 also shows CAPP’s 2005 forecast as a dotted line. It is lower due to a lower oil sands forecast which corresponds closely to CERI’s expected oil sands forecast. Depending on the forecast, then, Canada would move from 7th to either 4th or 5th place among the world’s oil producing nations in ten years with total crude production at a rate of 3.9 to 4.6 million b/d. Neither of these increases is nearly sufficient to replace oil imports by the U.S. from other sources. On a net basis, the U.S. imported 10 million barrels of crude oil per day in 2005.35 Of that amount, 47.6 percent or 5.25 million b/d was imported from OPEC member countries and 21.8 percent or 2.2 million b/d from Persian Gulf countries. To replace just the Persian Gulf imports, U.S. net imports from Canada would have to rise from 1.6 million b/d to 3.8 million b/d, and claim the entire net increment in Canada’s rate of crude production projected by CAPP’s 2006 forecast to the year 2016. This assumes that North American crude oil consumption does not increase. North American energy independence thus would require a dramatic ramp-up in oil sands production far beyond any of the current projections. Of course, Canada’s oil would not be available for less than the market price. Nevertheless, the presence of an enormous potential oil supply does enhance North American and world energy security. Substantial increases in the rate of oil sands production have been projected, as shown, at costs that are far lower than the market
34 “U.S. Crude Oil Field Production,” EIA, http://tonto.eia.doe.gov/dnav/pet/hist/mcrfpus2a.htm; and Table 2.2, “World Oil Supply, 2001-2005.” As defined by the EIA, “oil supply” includes other components, such as natural gas liquids; Table 2.2 shows the U.S. domestic oil supply as 8.25 million b/d for 2005. 35 The U.S. also is a net importer of refined petroleum products.
Figure 7
Page 12 Canadian Oil Sands: A New Force in the World Oil Market prices of crude oil we have been experiencing (currently $70 per barrel for WTI). The potential for still larger increases in oil sands production that would be sustainable far into the future, even if the costs were to increase, lessens the possibility that the market price of oil could settle at even higher levels in the long-run. The most encouraging possibility, however, is that oil sands production eventually can be accelerated without raising the cost per barrel and perhaps even while lowering the cost per barrel, if economies of scale exist and technological advancements are realized. In that case, the oil output from the sands could grow enough to bring down the market price of oil. The particular sources of U.S. oil imports then will lose significance as a national security concern. Limit price. Relative to its current rate of oil sands production, Canada has a staggering resource base. Canada’s oil sands reserve-to-production ratio is presently well over 400 years. (Annual production at the current rate could continue that long given 174 billion barrels of proven oil sands reserves. Estimates of probable reserves reach 315 billion barrels). The reserve-to-production ratio for the entire world’s conventional oil is just over 40 years, suggesting the potential for manifold increases in Canada’s eventual oil output rate. When Canada’s oil sands industry overcomes the short-run hurdles to expanding supply and is able to accelerate the rate of output at a constant cost per barrel, that cost will set the upper limit for the world oil price. OPEC will be unable to push the market price higher by curtailing its oil output, because oil sands producers will hold sufficiently large reserves from which to make up the difference without increasing their cost (supply will be “elastic”). This state of the industry likely lies at least a decade in the future and the timing beyond that will depend on OPEC’s output decisions in the interim. If the cartel decides to raise its oil output and lower the price, the incentive for oil sands development will be lessened. The forecast by CERI based on $32 per barrel may be representative of the outcome. But at present, OPEC faces no strong competition and may decide to keep the price higher. If the oil price remains high relative to the cost of oil sands production, increased investment will be attracted to push back constraints to development faster. Production rates along the trajectory stipulated by CAPP or even higher then may be realized, albeit at higher cost. Whatever the rate of oil sands development, the progress made is not reversible. The longer OPEC waits to reduce the price, the more oil sands production will grow and the larger the market share it can claim.36 Conclusion. Alberta oil sands production is well on its way to placing Canada among the world’s top five producers of crude oil. The proximity of this growing source of supply is a highly positive development for the U.S. and indeed the world.37 While the
36 The discussion focuses on OPEC and the Canadian oil sands because of the extraordinary size of their respective reserves and their potential for large production increases. Other developments can affect this dynamic, including oil production in the rest of the world, changing rates of economic growth, and input substitution. 37 Oil sands investments also have attendant economic benefits not addressed in this report. See, for example, “Economic Impacts of Alberta’s Oil Sands.”

A JOINT ECONOMIC COMMITTEE STUDY Page 13 amounts of oil produced are not large enough to achieve energy independence for North America, they represent a growing counter weight to OPEC’s market power and as such will gradually increase our energy security. Extracting oil from Alberta’s sand is more costly than conventional oil production and faces challenges in increasing the scale of output, particularly in the presence of low-cost producers with greater output flexibility. But, as long as those who hold market power are opting to reap prices far in excess of the cost to develop the oil sands, they also are feeding the growth of a potential industry giant. High oil prices help to overcome short-run increases in production cost while Alberta’s input markets and infrastructure adjust to a larger scale of oil sands production. In the long-run, the cost is likely to stabilize and may even decline, leading to ever larger rates of oil output. Numerous sources have pegged the cost of oil sands production at about $25 per barrel. What sets the Canadian oil sands apart from most other sources of oil under development is the vastness of the known resource and the secure access to it. It may take the oil sands industry a decade or more to stabilize the cost per barrel while accelerating the rate of output, but once it does, it will cap the power of OPEC.
Theodore W. Boll Senior Economist