Embed Size (px)
Citation preview

Ple
ase
note
that
this
is a
n au
thor
-pro
duce
d P
DF
of a
n ar
ticle
acc
epte
d fo
r pub
licat
ion
follo
win
g pe
er re
view
. The
def
initi
ve p
ublis
her-a
uthe
ntic
ated
ver
sion
is a
vaila
ble
on th
e pu
blis
her W
eb s
ite
1
Canadian Journal of Fisheries and Aquatic Sciences April 2010 ; Volume 67 (4) : Pages 743–753 http://dx.doi.org/10.1139/F10-018 © 2010 National Research Council Canada The original publication is available at http://pubs.nrc-cnrc.gc.ca
Archimerhttp://archimer.ifremer.fr
Patterns in nutrient limitation and chlorophyll a along an anthropogenic eutrophication gradient in French Mediterranean coastal lagoons
Philippe Souchu1, *, Béatrice Bec2, Val H Smith3, Thierry Laugier1, Annie Fiandrino1, Laurent
Benau1, Valérie Orsoni4, Yves Collos2, André Vaquer2 1 Ifremer, Laboratoire Environnement Ressource Languedoc-Roussillon, BP 171,Avenue Jean Monnet 34203 Sète Cedex, France 2 Université Montpellier 2, CNRS, Ifremer, UMR 5119 Ecosystèmes Lagunaires, CC093, 34095 Montpellier Cedex 5, France 3 Department of Ecology and Evolutionary Biology, University of Kansas, Lawrence 66045, USA 4 Ifremer, Laboratoire Environnement Ressource Corse, Immeuble Agostini, Zone industrielle de Furiani, 20600 Bastia, France *: Corresponding author : P. Souchu, Phone: (33) 02- 40-37-41-96, Fax : (33) 02-40-37-40-01, email address : [email protected]
Abstract: A cross-ecosystem comparison of data obtained from 20 French Mediterranean lagoons with contrasting eutrophication status provided the basis for investigating the variables that best predict chlorophyll a (Chl a) concentrations and nutrient limitation of phytoplankton biomass along a strong nutrient enrichment gradient. Summer concentrations of dissolved inorganic nitrogen (DIN) and phosphorus (DIP) comprised only a small fraction of total nitrogen (TN) and total phosphorus (TP). On the basis of inorganic nutrient concentrations, the most oligotrophic lagoons appeared to be phosphorus-limited, with a tendency towards the development of nitrogen limitation as eutrophication increased, as evidenced by decreasing DIN:DIP ratios. A weak but significantly positive relationship was found between dissolved silicate (DSi) and Chl a, reflecting DSi accumulation in the water column along the trophic state gradient and implying a progressive shift away from potential Si limitation of phytoplankton growth. Observed concentrations of Chl a were far better explained by TN and TP than by DIN and DIP concentrations, suggesting that a total nutrient based approach is likely to be the most appropriate for managing eutrophication in Mediterranean lagoons and other coastal waters. These results give credence to the idea that marine and freshwater environments respond in a similar fashion to nutrient enrichment. Résumé : Une comparaison inter-sites des concentrations de nutriments et de chlorophylle a (Chl a) issues de 20 lagunes de Méditerranée française de degrés divers d’eutrophisation a été menée afin de rechercher la meilleure variable expliquant le niveau de Chl a et d’explorer la limitation de la production primaire par les nutriments au long d’un fort gradient d’enrichissement en azote et phosphore. En été, l’azote et le phosphore inorganiques dissous (DIN et PID respectivement) constituaient une faible fraction des concentrations d’azote et de phosphore totaux (TN et TP respectivement). Sur la base des concentrations en nutriments inorganiques, la plupart des lagunes oligotrophes semblaient limitées par le phosphore avec une tendance vers des rapports DIN:DIP décroissants, et donc une limitation par l’azote, lorsque l’eutrophisation augmentait. Une corrélation positive mais faible a aussi été obtenue entre les concentrations de silicates (DSi) et Chl a, indiquant une accumulation de DSi dans la colonne d’eau et donc une diminution de la limitation de la croissance du phytoplancton par la silice au fur et à mesure que l’eutrophisation augmentait. Le fait que Chl a était beaucoup mieux expliquée par TN et TP que par DIN et DIP suggère même que l’approche limnologique basée sur l’ensemble des nutriments est vraisemblablement la meilleure pour gérer l’eutrophisation dans les lagunes méditerranéennes et dans d’autres écosystèmes marins côtiers. Ces constats renforcent l’idée que les écosystèmes marins et d’eau douce répondent de façon similaire à l’enrichissement en nutriments.
4
Introduction 56
The over-enrichment of lakes, inland water courses and coastal waters with nitrogen (N) 57
and phosphorus (P) has been one of the major effects of human activity on aquatic ecosystems 58
during the past fifty years (Nixon 1995; Cloern 2001). Cultural eutrophication presents a 59
major problem for most of Europe’s regional seas, including the Mediterranean (Ignatiades 60
2005). However, most eutrophication-related problems in the Mediterranean region currently 61
are confined to limited areas, rather than being widespread phenomena (European 62
Environment Agency 1999). For example, Mediterranean coastal lagoons exhibit a wide range 63
of trophic states, and reductions in anthropogenic N and P inputs will be necessary in order to 64
attain the desired levels of water quality that have recently been specified by the Water 65
Framework Directive for European water bodies (European Economic Community 2000). 66
Historically, N has been considered to be the primary growth-limiting nutrient in marine 67
ecosystems (Ryther and Dustan 1971), and phosphorus to be the principal limiting nutrient in 68
lakes (Schindler 1977). However, this paradigm has been increasingly called into question in 69
recent years as evidence has accumulated for widespread occurrences of both N and P 70
limitation in lakes and streams (Elser et al. 1990; Elser et al. 2007; Lewis and Wurtsbaugh 71
2008), as well as frequent phosphorus limitation in the oceans (Downing et al. 1999; Elser et 72
al. 2007). Downing et al. (1999) have observed through bioassay experiments that phosphorus 73
limitation was strongest in unpolluted ecosystems, while limitation due to N was more 74
frequent in relatively polluted coastal waters. 75
In marine waters, measurements of dissolved inorganic nitrogen, phosphorus and silicate 76
concentrations (DIN, DIP and DSi respectively) are often used as a measure of eutrophication 77
status, and ratios between dissolved nutrients have long been used to indicate which of these 78
three nutrients is likely to be growth-limiting (Fisher et al. 1995; Justić et al. 1995). In 79
contrast, total nitrogen (TN) and phosphorus (TP) are considered to be the best indicators of 80

5
eutrophication status and nutrient limitation in freshwater lakes and rivers (Dodds 2003). 81
However, this more limnological approach using relationships between phytoplankton 82
biomass and total nutrients has been applied to marine waters with success to predict 83
eutrophication (Downing 1997; Meeuwig et al. 2000; Smith 2003), suggesting a common 84
response of marine and freshwater systems to nutrient enrichment (Guildford and Hecky 85
2000; Smith 2006). A water quality database developed for 20 Mediterranean coastal lagoons 86
exhibiting a wide range of external nutrient loading provided the basis for a comparative 87
assessment of nutrient limitation and the controls of algal biomass along this eutrophication 88
gradient, using both the marine (dissolved inorganic nutrients) and the limnological approach 89
(total forms of N and P). 90
Materials and Methods 91
Studied sites 92
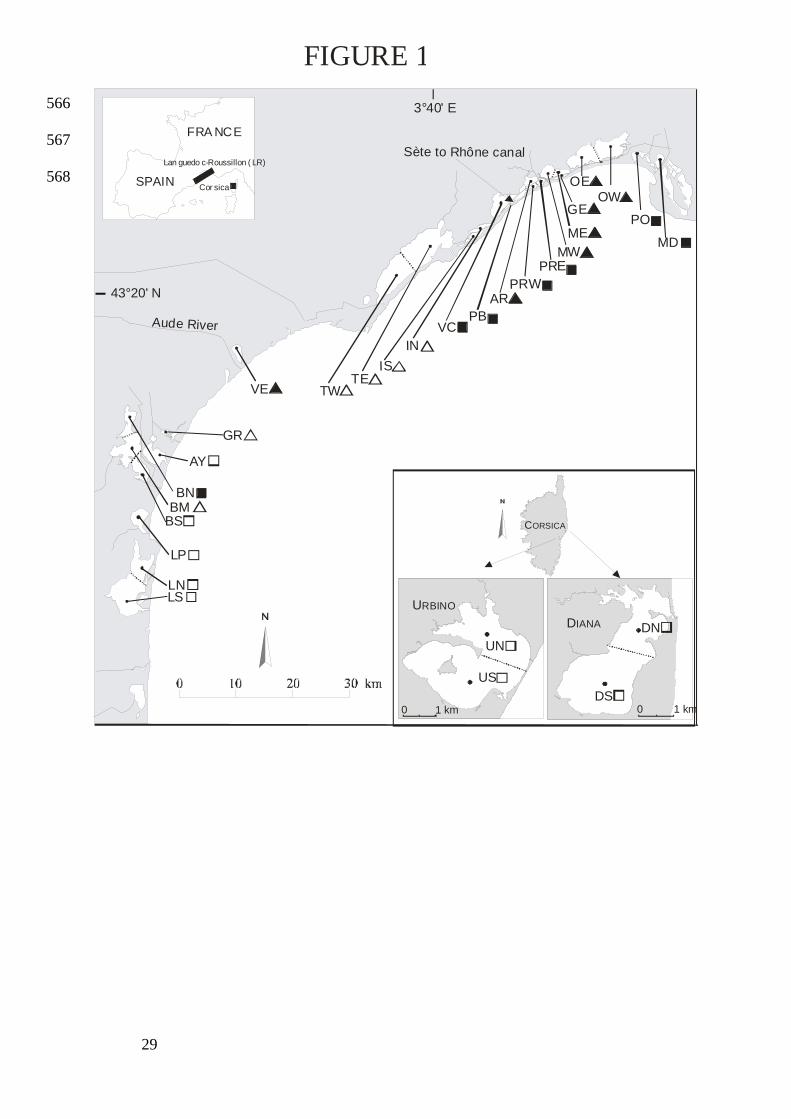
A database was developed during 1998-2002 for 18 lagoons in the Languedoc-Roussillon 93
(LR) Region of France and 2 lagoons in Corsica (Fig. 1). All marine water bodies (median 94
salinity in summer > 20 psu) presenting an annually persistent water volume of ≥ 0.5 x 10⁶ m3 95
were included in the database (Table 1). Some lagoons were divided into sectors 96
corresponding to hydrodynamic boxes empirically defined on the basis of their bottom 97
contours and depth. The aim was to individualize sectors belonging to the same lagoon but 98
displaying significant differences (see BS, BM and BN in Bages lagoon, Fig. 1). Depending 99
on the lagoon size and shape, 1 to 3 stations (Stns) were located in the middle of each sector. 100
Salses-Leucate (L), the second largest LR lagoon after Thau (T), has permanent karstic 101
water inputs (Boutière et al. 1982). La Palme lagoon (LP) also features a karstic watershed but 102
its inputs from karst aquifers are weaker than at L (Wilke and Boutière 2000). The Bages-103
Sigean (B) lagoon is made up of several smaller basins and has only one opening to the sea at 104
the southernmost end (Jacques et al. 1975). Ayrolle (AY) is directly connected to the sea 105
6
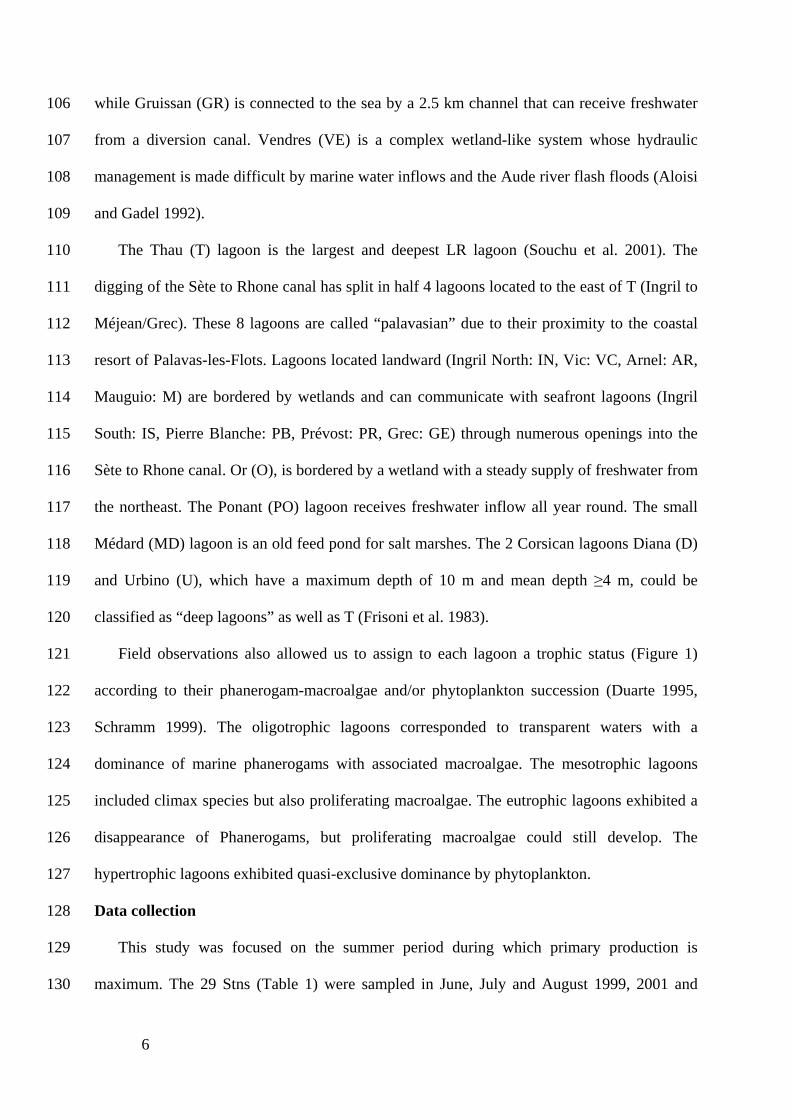
while Gruissan (GR) is connected to the sea by a 2.5 km channel that can receive freshwater 106
from a diversion canal. Vendres (VE) is a complex wetland-like system whose hydraulic 107
management is made difficult by marine water inflows and the Aude river flash floods (Aloisi 108
and Gadel 1992). 109
The Thau (T) lagoon is the largest and deepest LR lagoon (Souchu et al. 2001). The 110
digging of the Sète to Rhone canal has split in half 4 lagoons located to the east of T (Ingril to 111
Méjean/Grec). These 8 lagoons are called “palavasian” due to their proximity to the coastal 112
resort of Palavas-les-Flots. Lagoons located landward (Ingril North: IN, Vic: VC, Arnel: AR, 113
Mauguio: M) are bordered by wetlands and can communicate with seafront lagoons (Ingril 114
South: IS, Pierre Blanche: PB, Prévost: PR, Grec: GE) through numerous openings into the 115
Sète to Rhone canal. Or (O), is bordered by a wetland with a steady supply of freshwater from 116
the northeast. The Ponant (PO) lagoon receives freshwater inflow all year round. The small 117
Médard (MD) lagoon is an old feed pond for salt marshes. The 2 Corsican lagoons Diana (D) 118
and Urbino (U), which have a maximum depth of 10 m and mean depth ≥4 m, could be 119
classified as “deep lagoons” as well as T (Frisoni et al. 1983). 120
Field observations also allowed us to assign to each lagoon a trophic status (Figure 1) 121
according to their phanerogam-macroalgae and/or phytoplankton succession (Duarte 1995, 122
Schramm 1999). The oligotrophic lagoons corresponded to transparent waters with a 123
dominance of marine phanerogams with associated macroalgae. The mesotrophic lagoons 124
included climax species but also proliferating macroalgae. The eutrophic lagoons exhibited a 125
disappearance of Phanerogams, but proliferating macroalgae could still develop. The 126
hypertrophic lagoons exhibited quasi-exclusive dominance by phytoplankton. 127
Data collection 128
This study was focused on the summer period during which primary production is 129
maximum. The 29 Stns (Table 1) were sampled in June, July and August 1999, 2001 and 130

7
2002 except for 10 Stns in 1999 and 4 Stns in 2001. Periods of temporary sediment 131
resuspension were avoided by not sampling for three days following any period of wind speed 132
exceeding 25 m•s-1. Temperature and salinity were measured with a WTW LF 197 field 133
sensor (precision ± 0.5%) calibrated monthly with salinity standards (IAPSO 38H5 Ocean 134
Scientific). Subsurface water samples were taken by boat between 10 AM and 4 PM with 2 135
liter polypropylene bottles pre-washed with 1 N acid and then copiously rinsed with deionized 136
water. 137
In the laboratory, water was pre-filtered less than 3 hours after sampling through 200 µm 138
mesh to remove most zooplankton. The pre-filtered water was transferred to ashed (450 °C 139
for 6 h) Pyrex bottles and stored at –20 °C for further analyses of total nitrogen (TN) and total 140
phosphorus (TP, see below). For analyses of dissolved inorganic nutrients, the pre-filtered 141
water was filtered through Whatman GF/F membranes with an all-glass filtering system and a 142
vacuum of less than 10 cm Hg. The whole apparatus and the membrane were pre-rinsed twice 143
before filtration. Ammonium concentrations (NH4+) were measured according to the manual 144
method of indophenol blue (Aminot and Kérouel 2004). Nitrate (NO3-), nitrite (NO2
-) and 145
dissolved inorganic phosphorus (DIP) samples were frozen at –20 °C in Pyrex bottles before 146
their analyses on a segmented flow analyzer (Tréguer and Le Corre 1975). Dissolved 147
inorganic nitrogen concentration was expressed as DIN = NH4+ + NO3
- + NO2-. Samples for 148
dissolved silicate analysis (DSi) were stored at 4 °C in polycarbonate bottles and analysed on 149
a segmented flow analyzer according to Tréguer and Le Corre (1975) in the following weeks. 150
DSi was analyzed only during annual cycles. Although the filtration of water through 151
Whatman GF/F membranes and with an all-glass filtering system potentially could lead to 152
overestimates of DSi, the similarity of these results to those obtained from 2003 to 2006 using 153
nitrate cellulose filter filtration and an all-polycarbonate filtering system leads us to believe 154
that our glass-filtered DSi data are valid. 155
8
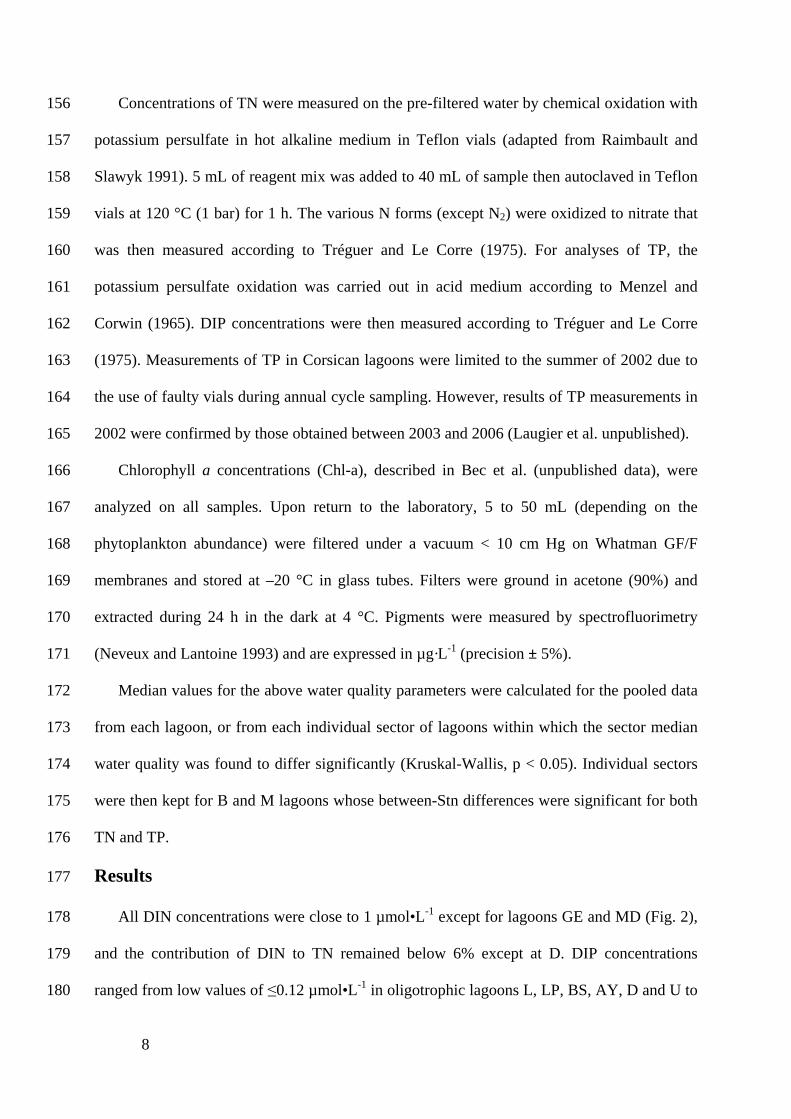
Concentrations of TN were measured on the pre-filtered water by chemical oxidation with 156
potassium persulfate in hot alkaline medium in Teflon vials (adapted from Raimbault and 157
Slawyk 1991). 5 mL of reagent mix was added to 40 mL of sample then autoclaved in Teflon 158
vials at 120 °C (1 bar) for 1 h. The various N forms (except N2) were oxidized to nitrate that 159
was then measured according to Tréguer and Le Corre (1975). For analyses of TP, the 160
potassium persulfate oxidation was carried out in acid medium according to Menzel and 161
Corwin (1965). DIP concentrations were then measured according to Tréguer and Le Corre 162
(1975). Measurements of TP in Corsican lagoons were limited to the summer of 2002 due to 163
the use of faulty vials during annual cycle sampling. However, results of TP measurements in 164
2002 were confirmed by those obtained between 2003 and 2006 (Laugier et al. unpublished). 165
Chlorophyll a concentrations (Chl-a), described in Bec et al. (unpublished data), were 166
analyzed on all samples. Upon return to the laboratory, 5 to 50 mL (depending on the 167
phytoplankton abundance) were filtered under a vacuum < 10 cm Hg on Whatman GF/F 168
membranes and stored at –20 °C in glass tubes. Filters were ground in acetone (90%) and 169
extracted during 24 h in the dark at 4 °C. Pigments were measured by spectrofluorimetry 170
(Neveux and Lantoine 1993) and are expressed in µg·L-1 (precision ± 5%). 171
Median values for the above water quality parameters were calculated for the pooled data 172
from each lagoon, or from each individual sector of lagoons within which the sector median 173
water quality was found to differ significantly (Kruskal-Wallis, p < 0.05). Individual sectors 174
were then kept for B and M lagoons whose between-Stn differences were significant for both 175
TN and TP. 176
Results 177
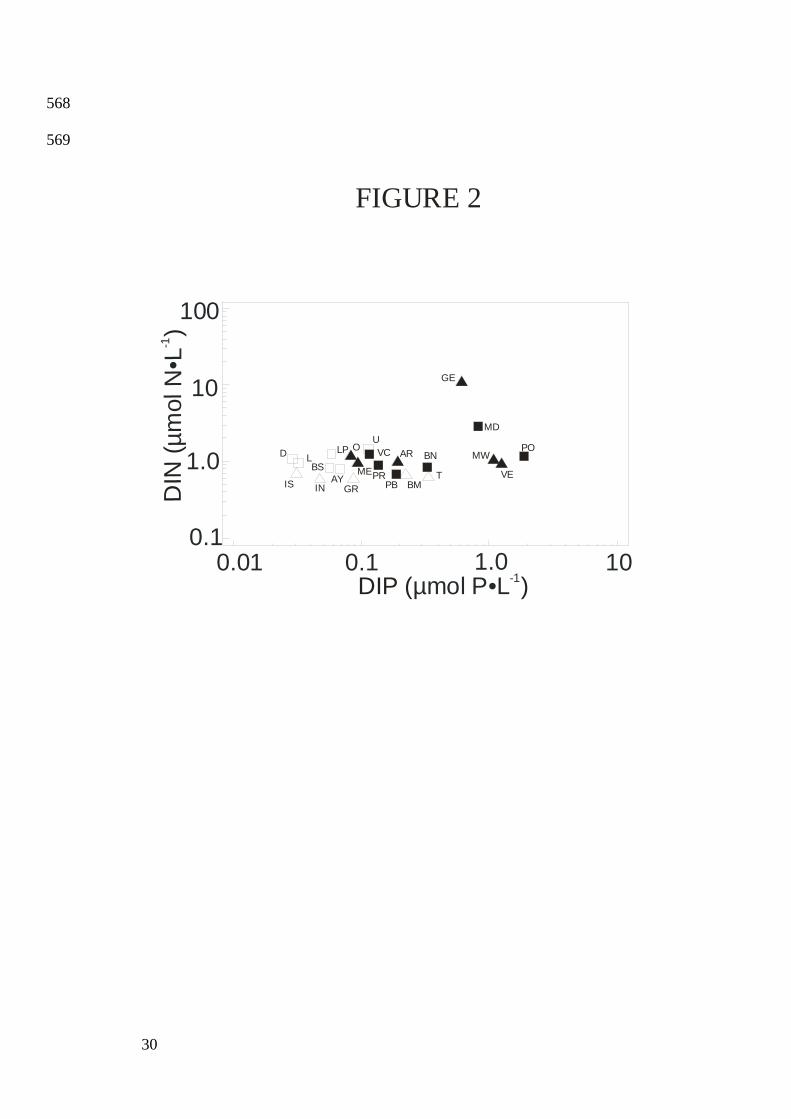
All DIN concentrations were close to 1 µmol•L-1 except for lagoons GE and MD (Fig. 2), 178
and the contribution of DIN to TN remained below 6% except at D. DIP concentrations 179
ranged from low values of ≤0.12 µmol•L-1 in oligotrophic lagoons L, LP, BS, AY, D and U to 180

9
much higher values of >1 µmol•L-1 in hypertrophic lagoons VE and MW (Figure 2). The 181
contribution of DIP to TP remained below 15% except at BM, BN, T and PO. DSi ranged 182
between 0.5 µmol•L-1 at D and 204 µmol•L-1 at VE. DSi individual concentrations remained 183
<2 µmol•L-1 in 11% of samples (16 out of 144 samples). Reflecting the strong eutrophication 184
gradient in these lagoons, TN varied from 16 µmol•L-1 at D to 452 µmol•L-1 at VE, whereas 185
TP varied from 0.14 µmol•L-1 at D to 28 µmol•L-1 at VE. Salinity ranged from 21.3 psu at O 186
to a maximum value of 40.1 psu at PB. DIP, TN and TP were inversely correlated with 187
salinity (Table 2: Eq. 1 to 5). 188
DIN:DIP ratios varied from 1.1 by moles at VE and PO, to 40 at D. No significant 189
correlation was found between the DIN:DIP ratio and DIN; the observed variability in 190
DIN:DIP instead was largely explained by variations in DIP (Table 2: Eq. 9 and 10; Fig. 2). 191
DIN:DIP was inversely correlated with both TN and TP (Table 2: Eq. 12 and 13). Similarly, 192
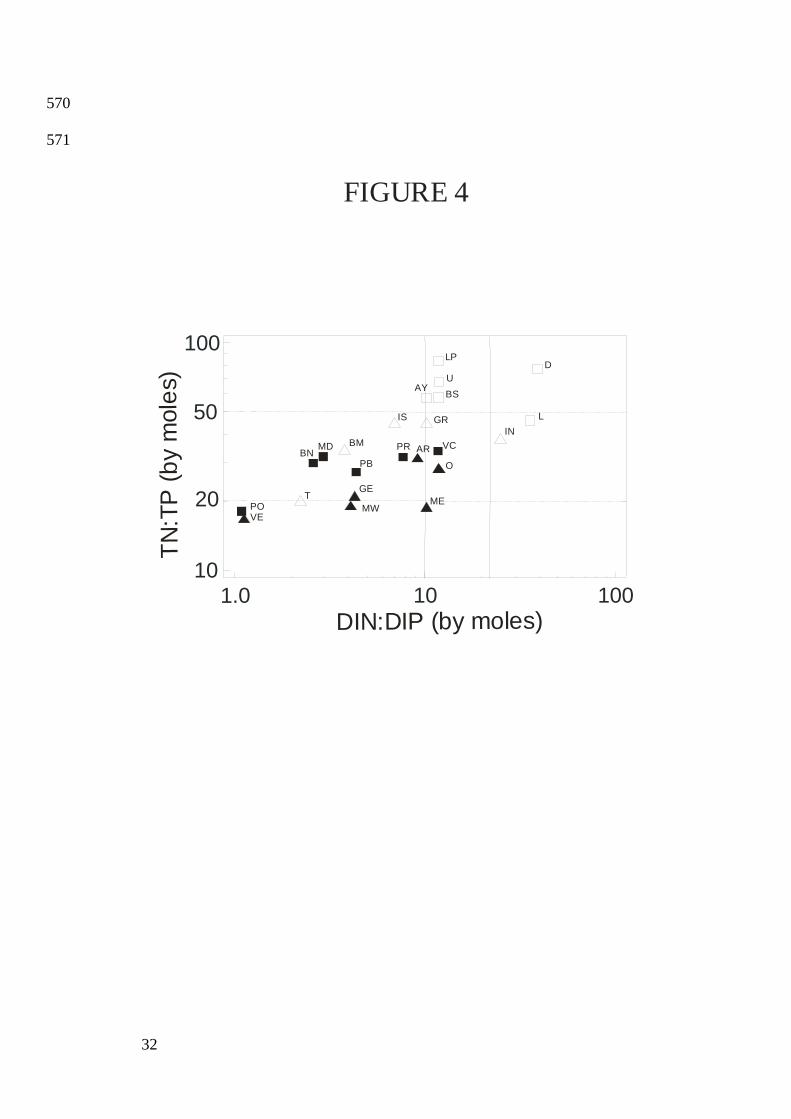
DIN:DIP was inversely correlated with DSi (Table 2: Eq. 11), reflecting the almost significant 193
correlation between DIP and DSi (Table 2: Eq. 7). DSi:DIN ratios ranged from 0.5 at D to 194
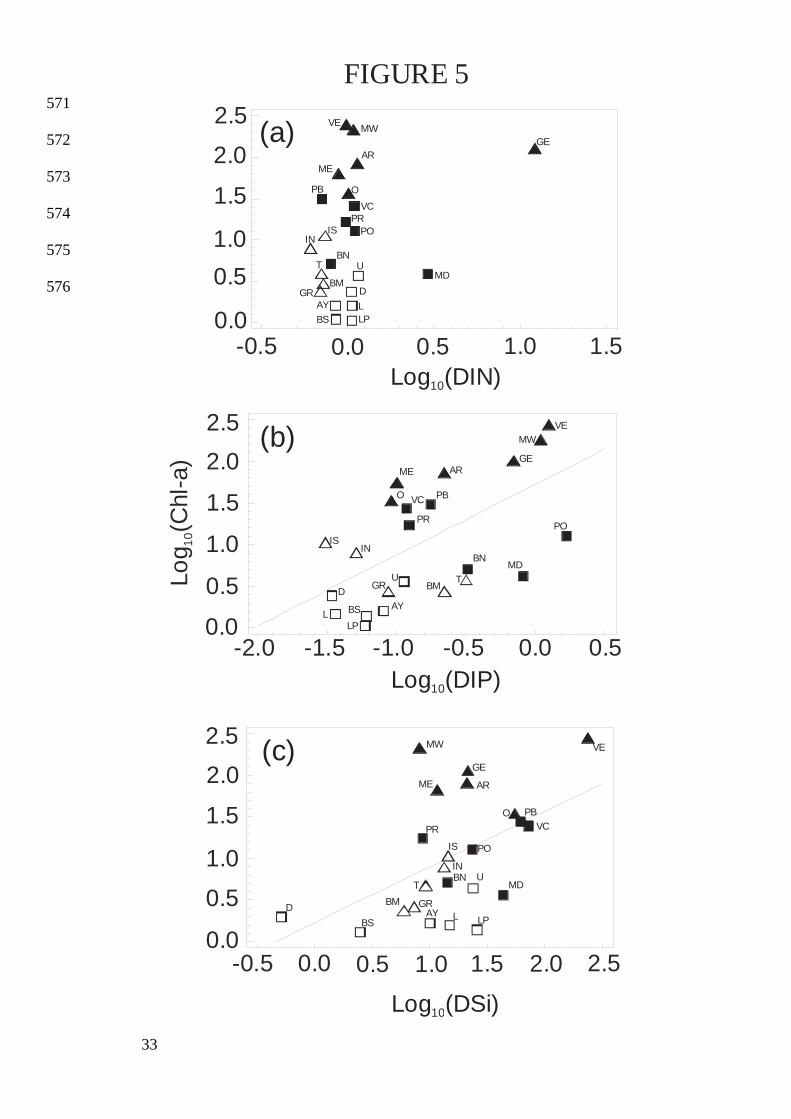
267 at VC, but D was the only lagoon with a DSi:DIN ratio <1. DSi:DIP ratios ranged from 195
17 at BM to 1640 at L. 196
A strong positive relationship was found between TN and TP (Table 2, Eq. 14). TN:TP 197
ratios decreased from about 75 in the less eutrophic lagoons (TP < 0.80 µmol•L-1) to the 198
Redfield ratio (16:1 by moles) in the most eutrophic systems (Fig. 3; Table 2, Eq. 15 and 16). 199
There was also a significant and positive covariance between TN:TP and DIN:DIP (Table 2: 200
Eq. 17; Fig. 4). 201
Chl-a varied along the eutrophication gradient from <2 µg•L-1 at L, LP, BS and AY, to 202
>270 µg•L-1 at VE. There was no significant correlation between DIN and Chl-a (Table 2: Eq. 203
18; Fig. 5). However, both DIP and DSi exhibited weak but significant correlations with Chl-a 204
(Table 2: Eq. 19 and 20; Fig. 5). In contrast, both TN and TP were very strongly correlated 205
10
with Chl-a, with much higher coefficients of determination than for dissolved nutrients (Table 206
2: Eq. 21 and 22; Fig. 6). 207
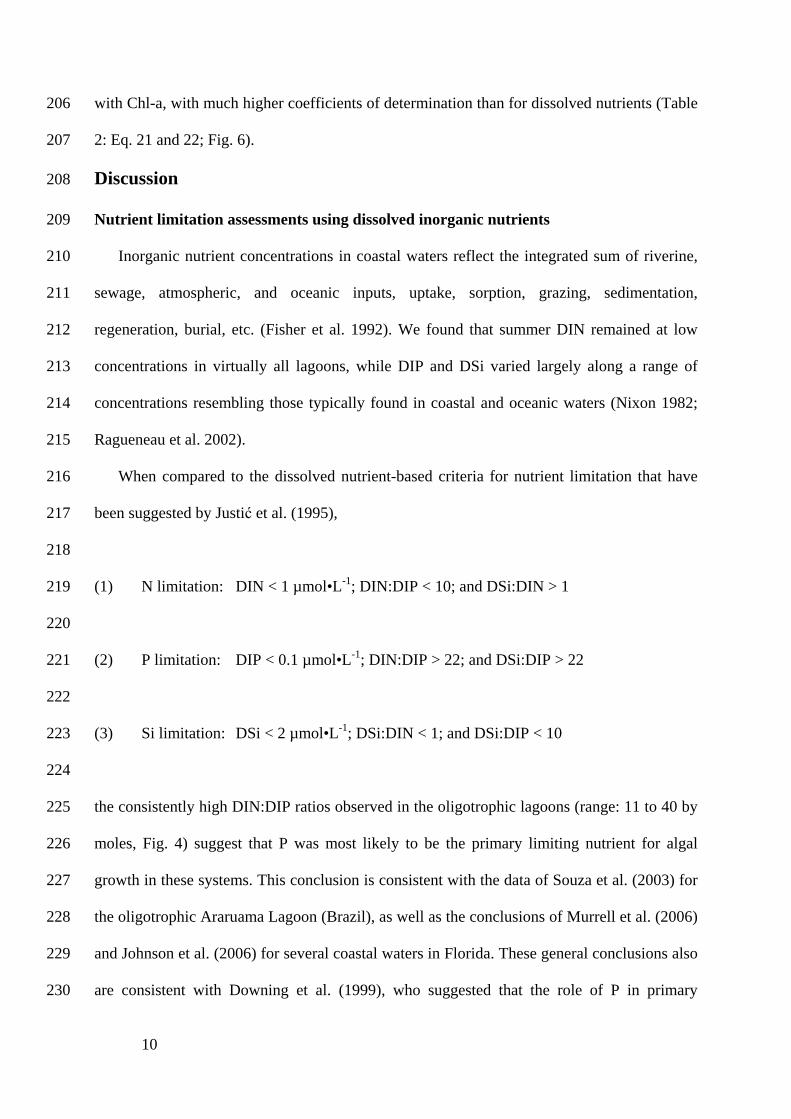
Discussion 208
Nutrient limitation assessments using dissolved inorganic nutrients 209
Inorganic nutrient concentrations in coastal waters reflect the integrated sum of riverine, 210
sewage, atmospheric, and oceanic inputs, uptake, sorption, grazing, sedimentation, 211
regeneration, burial, etc. (Fisher et al. 1992). We found that summer DIN remained at low 212
concentrations in virtually all lagoons, while DIP and DSi varied largely along a range of 213
concentrations resembling those typically found in coastal and oceanic waters (Nixon 1982; 214
Ragueneau et al. 2002). 215
When compared to the dissolved nutrient-based criteria for nutrient limitation that have 216
been suggested by Justić et al. (1995), 217
218
(1) N limitation: DIN < 1 µmol•L-1; DIN:DIP < 10; and DSi:DIN > 1 219
220
(2) P limitation: DIP < 0.1 µmol•L-1; DIN:DIP > 22; and DSi:DIP > 22 221
222
(3) Si limitation: DSi < 2 µmol•L-1; DSi:DIN < 1; and DSi:DIP < 10 223
224
the consistently high DIN:DIP ratios observed in the oligotrophic lagoons (range: 11 to 40 by 225
moles, Fig. 4) suggest that P was most likely to be the primary limiting nutrient for algal 226
growth in these systems. This conclusion is consistent with the data of Souza et al. (2003) for 227
the oligotrophic Araruama Lagoon (Brazil), as well as the conclusions of Murrell et al. (2006) 228
and Johnson et al. (2006) for several coastal waters in Florida. These general conclusions also 229
are consistent with Downing et al. (1999), who suggested that the role of P in primary 230

11
production limitation in non-polluted coastal waters may have been underestimated. Summer 231
limitation by nitrogen alone seemed to become apparent above a certain level of 232
eutrophication in the studied lagoons (Fig. 4). Experimental nutrient enrichment bioassays 233
carried out in parallel with this study confirmed that both nitrogen and phosphorus limit 234
summer pelagic primary production in the oligotrophic lagoon L (Bec et al. unpublished data), 235
and that nitrogen alone was limiting in the mesotrophic lagoon T (Fouilland et al. 2002). 236
The observed accumulation of DIP along the eutrophication gradient and the inverse 237
correlation between DIP and salinity could be explained by invoking progressively lower N:P 238
supply ratios that reflect an increasing influence of sewage inputs on the total nutrient load 239
(Downing and McCauley 1992). However, nowadays, sewage can be richer in N than in P 240
because of a more effective removal of P as it is the case for the 8 Palavasian and O lagoons 241
(Table 3). Moreover, the range of N:P loading ratios to the 13 lagoons for which N and P 242
loading data are available is narrower than the ranges of DIN:DIP and TN:TP in the water 243
column. We tentatively conclude that the observed increase of DIP along the eutrophication 244
gradient is better explained by the P content of lagoon sediments than by salinity, and that 245
recycling processes strongly affect inorganic nutrient concentrations in the water column 246
(Souchu et al. unpublished data). 247
Egge and Aksnes (1992) have shown that diatoms often dominate the phytoplankton 248
community when DSi concentrations exceeded 2 µmol•L-1. However, few samples in the 249
pooled database exhibited DSi concentrations <2 µmol•L-1 (13%). Moreover, based the 250
empirical criteria in Eq. 1-3 above, the relatively high observed ratios of DSi:DIN (range: 0.5 251
to 267 by moles) and DSi:DIP (range: 17 to 1640 by moles) together suggest that DSi was 252
very unlikely to limit algal growth in the studied lagoons, even at extreme levels of nutrient 253
enrichment. The trend for DSi to accumulate along the eutrophication gradient was 254
unexpected because DSi typically is not increased by any significant extent during 255
12
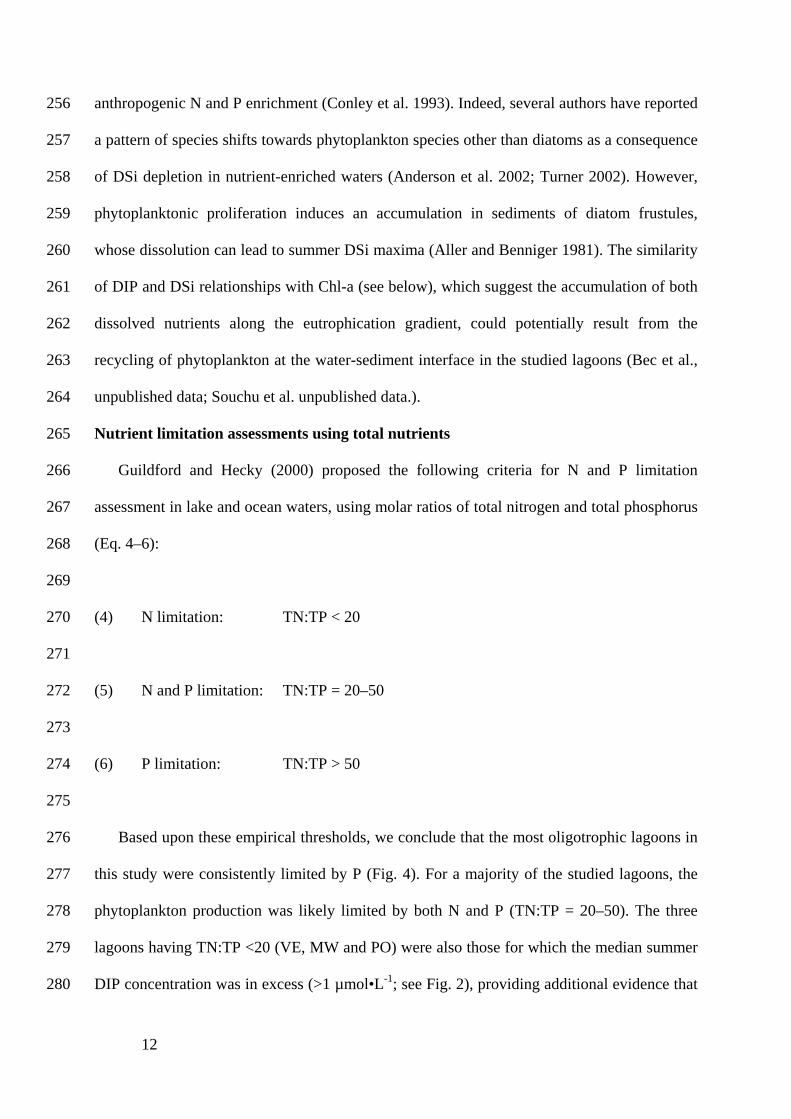
anthropogenic N and P enrichment (Conley et al. 1993). Indeed, several authors have reported 256
a pattern of species shifts towards phytoplankton species other than diatoms as a consequence 257
of DSi depletion in nutrient-enriched waters (Anderson et al. 2002; Turner 2002). However, 258
phytoplanktonic proliferation induces an accumulation in sediments of diatom frustules, 259
whose dissolution can lead to summer DSi maxima (Aller and Benniger 1981). The similarity 260
of DIP and DSi relationships with Chl-a (see below), which suggest the accumulation of both 261
dissolved nutrients along the eutrophication gradient, could potentially result from the 262
recycling of phytoplankton at the water-sediment interface in the studied lagoons (Bec et al., 263
unpublished data; Souchu et al. unpublished data.). 264
Nutrient limitation assessments using total nutrients 265
Guildford and Hecky (2000) proposed the following criteria for N and P limitation 266
assessment in lake and ocean waters, using molar ratios of total nitrogen and total phosphorus 267
(Eq. 4–6): 268
269
(4) N limitation: TN:TP < 20 270
271
(5) N and P limitation: TN:TP = 20–50 272
273
(6) P limitation: TN:TP > 50 274
275
Based upon these empirical thresholds, we conclude that the most oligotrophic lagoons in 276
this study were consistently limited by P (Fig. 4). For a majority of the studied lagoons, the 277
phytoplankton production was likely limited by both N and P (TN:TP = 20–50). The three 278
lagoons having TN:TP <20 (VE, MW and PO) were also those for which the median summer 279
DIP concentration was in excess (>1 µmol•L-1; see Fig. 2), providing additional evidence that 280
13
P was unlikely to limit net primary production in these low N:P ratio systems. Summer 281
limitation of algal growth by N thus may only occur in more mesotrophic Mediterranean 282
coastal lagoons, with a tendency towards increasingly likelihood of N-limitation as 283
eutrophication increases; consequently, transitions from limitation by P to limitation by N 284
may be considered as an indication of anthropogenic eutrophication in these systems. 285
The convergence of the limnological and marine approaches in lagoons is evident from 286
the positive and high correlation between DIN:DIP and TN:TP (Table 2, Eq. 17). The 287
relationship suggests that TN:TP = 45 when DIP:DIN is 16, a value that is close to the 288
empirical TN:TP threshold proposed by Guilford and Hecky (2000). However, if the decrease 289
of DIN:DIP along the eutrophication gradient (Table 2, Eq. 13) is clearly due to DIP 290
accumulation, the TN:TP ratio decrease (Table 2, Eq. 16) is more difficult to explain since TN 291
and TP are a mixture of inorganic nutrients, dissolved organic matter (DOM) and seston. In 292
the study lagoons, regarding to the low contribution of inorganic nutrients to TN and TP (ca. 293
10%), TN and TP can be considered as essentially made of seston and DOM. The N:P ratios 294
in DOM are largely higher than Redfield ratio (Hopkinson and Vallino 2005) while TN:TP 295
ratios in sestonic organic matter would display values closer to the Redfield ratio (Hall et al. 296
2005). As Chl-a concentrations increase, TN and TP are increasingly determined by the N and 297
P content of the phytoplankton cells (see Wetzel 2001 for DON and PON in lakes). This trend 298
may help to explain why TN:TP ratios move closer to the Redfield ratio as eutrophication 299
increases (Fig. 3). In hypertrophic lagoons (VE in Fig. 3), the planktonic biomass is high 300
enough that TN:TP ratios are close to 16. 301
Nutrient controls of algal biomass 302
The predictive power of using a total nutrient-based approach for the prediction of 303
summer median algal biomass is strongly evident in the lagoons studied here: total N and total 304
P-based regression models for summer median Chl-a were consistently much superior to 305
14
comparable DIN- and DIP-based models (compare Figs. 5 and 6). There was in fact no 306
correlation between concentrations of DIN and Chl-a (Table 2: Eq. 18), and both DIP and DSi 307
exhibited only weak correlations with Chl-a (Table 2: Eq. 19 and 20). It is also very important 308
to note that the simple regression model reported here for summer median TP and Chl-a in 309
coastal Mediterranean lagoons 310
311
(7) log Chl-a = 0.690 + 1.08 log TP, r2 = 0.78 312
313
confirms the strongly positive relationship observed by Knoppers et al. (1991; data not 314
shown) for annual average TP and Chl-a in six coastal lagoons in Brazil: 315
316
(8) log Chl-a = 0.017 + 2.02 log TP, r2 = 0.92, 317
318
as well as that observed between annual median TP and summer median Chl-a in 15 coastal 319
embayments in Germany (Sagert et al. 2008, data not shown): 320
321
(9) log Chl-a = 0.601 + 1.24 log TP, r2 = 0.83. 322
323
A similarly strong relationship has been found between summer mean concentrations of TP 324
and Chl-a in the hypertrophic Vistonis Lagoon, Greece (Gikas et al. 2006; data not shown): 325
326
(10) log Chl-a = 0.300 + 2.367 log TP, r2 = 0.92, 327
328
as well as in numerous other comparative analyses of freshwater and marine ecosystems 329
(Prairie et al. 1989; Champion and Currie 2000; Smith 2006). 330
15
Moreover, Boynton et al. (1996) found significant relationships between annual TN 331
loading rates and average TN and Chl-a concentrations for Maryland coastal bays, even 332
without making any adjustments for hydraulic residence time. We found very significant 333
relationships between annual total N and P loading rates and median TN and TP 334
concentrations for the 13 lagoons with well-defined watersheds (Table 3), without making any 335
adjustments for their hydraulic residence time (r² = 0.85 and 0.94 for N and P respectively, 336
ANOVA p < 0.05; Dupré unpublished data). Søballe and Kimmel (1987) have suggested that 337
algal production per unit P in water increases in the sequence: rivers<impoundments<natural 338
lakes, and suggested that we view aquatic systems as occupying positions along a continuum 339
ordered by water residence time. The Mediterranean lagoons studied here appear to behave 340
very similarly to lakes because they have relatively long hydraulic residence times due to their 341
low tidal amplitudes (Bacher et al. 1995). 342
Implications for eutrophication management 343
As noted by Rabalais et al. (2009), coastal water quality is currently on the decline, and 344
excessive exports of nutrients from the land to the world’s coastal oceans will almost certainly 345
continue to occur unless societal intervention or changes in human culture are successfully 346
pursued. Our cross-system comparison of Chl-a and nutrients from 20 coastal Mediterranean 347
lagoons suggests that the identity of the primary limiting growth-limiting nutrient in these 348
systems may shift from P alone in oligotrophic lagoons, to N alone as eutrophication 349
proceeds. We tentatively conclude that, like most unenriched freshwater systems, pristine 350
coastal French Mediterranean lagoons may typically be P-limited. 351
A critical need remains for water resource managers to reduce nutrient loads, in order to 352
reduce the negative effects of global eutrophication and to prevent further degradation 353
(Rabalais et al. 2009). The management of eutrophication will require careful assessments of 354
whether N, P, or both N and P should be controlled in order to develop successful and cost-355

16
effective strategies for the control of coastal zone eutrophication. We note, however, that 356
Elser et al. (2007) found that while enrichment by either N or P can increase autotroph 357
production, a simultaneous increase in both nutrients leads to dramatically higher levels of 358
production in nearly all situations. We surmise that the converse response also can be 359
expected to occur (i.e., simultaneous reductions in both N and P will minimize algal 360
production), and we thus favor joint N and P loading control to protect estuarine and coastal 361
marine environments. However, such management decisions will need to be based upon 362
careful syntheses of current and historical data (e.g., Conley et al. 2009; Paerl 2009), as well 363
as quantitative and objective frameworks for the assessment of coastal zone water quality. 364
Strong relationships between Chl-a and total nutrient, and empirical models predicting in-365
lake P concentrations as a function of annual P load have been essential tools for management 366
of eutrophication in lakes for more than three decades (Vollenweider 1976; OECD 1982). We 367
concur with Hoyer et al. (2002) that an approach using total nutrients is similarly valid for 368
eutrophication modeling in marine systems, and as shown by the data presented here, it is in 369
fact superior to approaches that rely upon concentrations and ratios of dissolved inorganic 370
nutrients. However, Cloern (2001) has suggested that differences between the eutrophication 371
response of lakes and coastal waters to eutrophication potentially may result from system-372
specific attributes that act as filters that may modulate their respective responses to 373
enrichment. We thus urge other researchers worldwide to test the utility of this empirical 374
approach in coastal waters that exhibit a wide range of physicochemical, biological, and 375
hydrological characteristics in order to confirm if the tools and methods that have been so 376
very successful in the management of freshwater eutrophication, are also broadly applicable 377
to coastal marine ecosystems. 378
Acknowledgments 379

17
This paper uses unpublished raw data from the Lagoon Monitoring Network (Réseau de 380
Suivi Lagunaire) financed by Agence de l’Eau, Région Languedoc-Roussillon and Ifremer. 381
This paper also was supported in part by NSF DMS–0342239 to Val H. Smith. We thank the 382
staff of the Ifremer laboratories in Corsica and Languedoc-Roussillon, the Parc Naturel 383
Régional de la Narbonnaise. The authors are grateful to anonymous reviewers for their 384
comments on the paper. This paper is dedicated to Nicolas Dupré (1978-2008). 385
386
18
References 386
Aller, R.C., and Benninger, L.K. 1981. Spatial and temporal patterns of dissolved ammonium, 387
manganese and silica fluxes from bottom sediments in Long Island Sound U.S.A. J. Mar. 388
Res. 39: 295–314. 389
Aloisi, J.C., and Gadel, F. 1992. Mécanismes sédimento-génétiques et évolution d’un 390
écosystème lagunaire Méditerranéen: L’étang de Vendres (Hérault). Vie Milieu, 42: 165–391
183. 392
Aminot, A., and Kérouel, R. 2004. Hydrologie des écosystèmes marins. Paramètres et 393
analyses. Ifremer, Brest, France. 394
Anderson, D.M., Glibert, P.M., and Burkholder, J.M. 2002. Harmful algal blooms and 395
eutrophication: nutrient sources, composition, and consequences. Estuaries, 25: 704–726. 396
Bacher, C., Bioteau, H., and Chapelle, A. 1995. Modelling the impact of a cultivated oyster 397
population on the nitrogen dynamics: the Thau lagoon case (France). Ophelia, 42: 29–54. 398
Boutière, H., de Bovée, F., Delille, D., Fiala, M., Gros, C., Jacques, G., Knoepffler, M., Labat, 399
J.P., Panouse, M., and Soyer, J. 1982. Effet d’une crise dystrophique dans l’étang de 400
Salses-Leucate. Proceedings International Symposium on coastal lagoons. 401
SCOR/IABO/UNESCO, Bordeaux, 8-14 September, Oceanol. Acta, pp. 231–242. 402
Boynton, W.R., Murray, L., Hagy, J.D., Stokes, C., and Kemp, W.M. 1996. A comparative 403
analysis of eutrophication patterns in a temperate coastal lagoon. Estuaries, 19: 408–421. 404
Champion, M., and Currie, D.J. 2000. Phosphorus-chlorophyll relationships in lakes, rivers, 405
and estuaries. Verh. Int. Ver. Theor. Angew. Limnol. 27: 1986–1989. 406
Cloern, J.E. 2001. Our evolving conceptual model of the coastal eutrophication problem. Mar. 407
Ecol. Prog. Ser. 210: 223–253. 408
19
Conley, D.J., Paerl, H.W., Howarth, R.W., Boesch, D.F., Seitzinger, S.P., Havens, K.E. 409
Lancelot, C., and Likens, G.E. 2009. Controlling eutrophication: nitrogen and phosphorus. 410
Science, 323: 1014–1015. 411
Conley, D.J., Schelske, C.L., and Stoermer, E.F. 1993. Modification of the biogeochemical 412
cycle of silica with eutrophication. Mar. Ecol. Prog. Ser. 101: 179–192. 413
Dodds, W.K. 2003. Misuse of inorganic N and soluble reactive P concentrations to indicate 414
nutrient status of surface waters. J. N. Am. Benthol. Soc. 22: 171–181. 415
Downing, J.A. 1997. Marine nitrogen:phosphorus stoichiometry and the global N:P cycle. 416
Biogeochemistry, 37: 237–252. 417
Downing, J.A., and McCauley, E. 1992. The nitrogen:phosphorus relationship in lakes. 418
Limnol. Oceanogr. 37: 936–945. 419
Downing, J.A., Osenberg, C.W., and Sarnelle, O. 1999. Meta-analysis of marine nutrient-420
enrichments: Variations in the magnitude of nutrient limitation. Ecology, 80: 1157–1167. 421
Duarte, C.M. 1995. Submerged aquatic vegetation in relation to different nutrient regimes. 422
Ophelia, 41: 87–112. 423
EAA. 1999. State and pressures of the marine and coastal Mediterranean environment. 424
European Environment Agency, Copenhagen. 425
EEC. 2000. Council Directive for a legislative frame and actions for the water policy, 426
2000/60/EC. Official Journal of the European Community, 22/12/2000. 427
Egge, J.K., and Aksnes, D.L. 1992. Silicate as regulating nutrient in phytoplankton 428
competition. Mar. Ecol. Prog. Ser. 83: 281–289. 429
Elser, J.J., Bracken, M.E.S., Cleland, E.E., Gruner, D.S., Harpole, W.S., Hillebrand, H., Ngai 430
J.T., Seabloom, E.W., Shurin, J.B., and Smith, J.E. 2007. Global analysis of nitrogen and 431
phosphorus limitation of primary producers in freshwater, marine and terrestrial 432
ecosystems. Ecol. Lett. 10: 1135–1142. 433
20
Elser, J.J., Marzolf, E.R. and Goldman, C.R. 1990. Phosphorus and nitrogen limitation of 434
phytoplankton growth in the freshwaters of North America: a review and critique of 435
experimental enrichments. Can. J. Fish. Aquat. Sci. 47: 1468–1477 436
Fisher, T.R., Melack, J.M., Grobbelaar, J.U., and Howarth, R.W. 1995. Nutrient limitation of 437
phytoplankton and eutrophication of inland, estuarine, and marine waters. In Phosphorus in 438
the global environment: Transfers, cycles and management. Edited by H. Tiessen. Wiley 439
and Sons, New York, NY, pp. 301–322. 440
Fisher, T.R., Peele, E.R., Ammerman, J.W. and Harding, L.W. Jr. 1992. Nutrient limitation of 441
phytoplankton in Chesapeake Bay. Mar. Ecol. Prog. Ser. 82: 51–63. 442
Fouilland, E., Descolas-Gros, C., Collos, Y., Vaquer, A., Souchu, P., Gasc, A., Bibent, B., and 443
Pons, V. 2002. Influence of nitrogen enrichment on size-fractionated in vitro carboxylase 444
activities of phytoplankton from Thau lagoon (Coastal Mediterranean Lagoon, France). J. 445
Exp. Mar. Biol. Ecol. 275: 147-171. 446
Frisoni, G.F., Guelorget, O., Ximenes, M.C., and Perthuisot, J.P. 1983. Etude écologique de 447
trois lagunes de la plaine orientale Corse (Biguglia, Diana, Urbino): Expressions 448
biologiques qualitatives et quantitatives du confinement. J. Rech. Oceanogr. 8: 57–80. 449
Gikas, G.D., Yiannakopoulou, T., and Tsihrintzis, V.A. 2006. Water quality trends in a 450
coastal lagoon impacted by non-point source pollution after implementation of protective 451
measures. Hydrobiologia, 563: 385–406. 452
Guildford, S.J., and Hecky, R.E. 2000. Total nitrogen, total phosphorus, and nutrient 453
limitation in lakes and oceans: Is there a common relationship? Limnol. Oceanogr. 45: 454
1213–1223. 455
Hall, S.R., Smith, V.H., Lytle, D.A., and Leibold, M.A. 2005. Constraints on primary 456
producer N:P stoichiometry along N:P supply ratio gradients. Ecology, 86: 1894–1904. 457
Hopkinson, C.S., and Vallino, J.J. 2005. Efficient export of carbon to the deep ocean through 458
dissolved organic matter. Nature, 433: 142–145. 459

21
Hoyer, M.V., Frazer, T.K., Notestein, S.K., and Canfield, D.E., Jr. 2002. Nutrient, 460
chlorophyll, and water clarity relationships in Florida’s nearshore coastal waters with 461
comparisons to freshwater lakes. Can. J. Fish. Aquat. Sci. 59: 1024–1031. 462
Ignatiades, L. 2005. Scaling the trophic status of the Aegean Sea, eastern Mediterranean. J. 463
Sea Res. 54: 51–57. 464
Jacques, G., Cahet, G., Fiala, M., Neveux, J., and Panouse, M. 1975. Caractéristiques du 465
milieu pélagique des étangs de Bages-Sigean et de Salses-Leucate pendant l’été 1974. Vie 466
Milieu, 25: 1–18. 467
Johnson, M.W., Heck, K.L., and Fourqurean, J.W. 2006. Nutrient content of seagrasses and 468
epiphytes in the northern Gulf of Mexico: Evidence of phosphorus and nitrogen limitation. 469
Aquat. Bot. 85: 103–111. 470
Justić, D., Rabalais, N.N., Turner, E., and Dortch, Q. 1995. Changes in nutrient structure of 471
river-dominated coastal waters: stoichiometric nutrient balance and its consequences. Est. 472
Coast. Shelf Sci. 40: 339–356. 473
Knoppers, B., Kjerfve B., and Carmouze J.-P. 1991. Trophic state and water turn-over time in 474
six choked coastal lagoons in Brazil. Biogeochemistry, 14: 149–166. 475
Lewis, W.M. Jr., and Wurtsbaugh, W.A. 2008. Control of lacustrine phytoplankton by 476
nutrients: Erosion of the phosphorus paradigm. Internat. Rev. Hydrobiol. 93: 446–465. 477
Meeuwing, J.J., Kauppila, P., and Pitkänen, H. 2000. predicting coastal eutrophication in the 478
Baltic: a limnological approach. Can. J. Fish. Aquat. Sci. 57: 844–855. 479
Menzel D.W., and Corwin N. 1965. The measurement of total phosphorus in seawater based 480
on the liberation of organically bound fractions by persulfate oxidation. Limnol. Oceanogr. 481
10: 280–282. 482

22
Murrell, M.C., Stanley, R.S., Lores, E.M., DiDonato, G.T., Smith, L.M., and Flemer, D.A. 483
2006. Evidence that phosphorus limits phytoplankton growth in a Gulf of Mexico estuary: 484
Pensacola Bay, Florida, USA. Bull. Mar. Sci. 70: 155–167. 485
Neveux, J., and Lantoine, F. 1993. Spectrofluorimetric assay of chlorophylls and 486
phaepigments using the least squares approximation technique. Deep-Sea Res. 40: 1747–487
1765. 488
Nixon, S.W. 1982. Nutrient dynamics, primary production and fisheries yields of lagoons. 489
Proceedings International Symposium on coastal lagoons SCOR/IABO/UNESCO, 490
Bordeaux, 8-14 September, Oceanol Acta, pp. 357–371. 491
Nixon, S.W. 1995. Coastal marine eutrophication: A definition, social causes, and future 492
concerns. Ophelia, 41: 199–219. 493
Organisation for Economic Cooperation and Development (OECD). 1982. Eutrophication of 494
waters: monitoring, assessment and control. Organisation for Economic Cooperation and 495
Development OECD, Paris. 496
Paerl, H.W. 2009. Controlling eutrophication along the freshwater–marine continuum: Dual 497
nutrient (N and P) reductions are essential. Estuar. Coasts, 32: 593–601. 498
Prairie, Y.T., Duarte, C.M., and Kalff, J. 1989. Unifying nutrient-chlorophyll relationships in 499
lakes. Can. J. Fish. Aquat. Sci. 46: 1176–1182. 500
Rabalais, N.N., Turner, R.E., Díaz, R.J., and Justić, D. 2009. Global change and 501
eutrophication of coastal waters. ICES J. Mar. Sci. 66: 1528–1537. 502
Ragueneau, O., Lancelot, C., Egorov, V., Vervlimmeren, J., Cociasu, A., Déliat, G., Krastev, 503
A., Daoud, N., Rousseau, V., Popovitchev, V., Brion, N., Popa, L., and Cauwet, G. 2002. 504
Biogeochemical transformations in inorganic nutrients in the mixing zone between the 505
Danube River and the North-western Black Sea. Estuar. Coast Shelf Sci. 54: 321–336. 506
23
Raimbault, P., and Slawik, G. 1991. A semiautomatic, wet-oxidation method for the 507
determination of particulate organic nitrogen collected on filters. Limnol. Oceanogr. 36: 508
405–408. 509
Ryther J.H., Dunstan W.H. 1971. Nitrogen, phosphorus, and eutrophication in the coastal 510
marine environment. Science, 171: 1008–1013. 511
Sagert, S., Rieling, T., Eggert, A., and Schubert H. 2008. Development of a phytoplankton 512
indicator system for the ecological assessment of brackish coastal waters (German Baltic 513
Sea coast). Hydrobiologia, 611: 91–103. 514
Schindler, D.W. 1977. Evolution of phosphorus limitation in lakes. Science, 195: 260–262. 515
Schramm, W. 1999. Factors influencing seaweed responses to eutrophication: some results 516
from EU-project EUMAC. J. Appl. Phycol. 11: 69–78. 517
Smith, V.H. 2003. Eutrophication of freshwater and marine ecosystems: A global problem. 518
Environ. Sci. Pollut. Res. 10: 126–139. 519
Smith, V.H. 2006. Responses of estuarine and coastal marine phytoplankton to nitrogen and 520
phosphorus enrichment. Limnol. Oceanogr. 51: 377–384. 521
Søballe, D.M., and Kimmel, B.L. 1987. A large-scale comparison of factors influencing 522
phytoplankton abundance in rivers, lakes and impoundments. Ecology, 68: 1943–1954. 523
Souchu, P., Vaquer, A., Collos, Y., Landrein, S., Deslous-Paoli, J.-M., and Bibent, B. 2001. 524
Influence of shellfish farming activities on the biogeochemical composition of the water 525
column in Thau lagoon. Mar. Ecol. Prog. Ser. 218: 141–152. 526
Souza, M.F.L., Kjerfve, B., Knoppers, B., Landim de Souza, W.F., and Damasceno, R.N. 527
2003. Nutrient budgets and trophic states in a hypersaline coastal lagoon: Lagoa de 528
Araruama, Brazil. Est. Coast. Shelf Sci. 57: 843–858. 529
Tréguer, P., and Le Corre, P. 1975. Manuel d'analyse des sels nutritifs dans l'eau de mer. 530
Utilisation de l'auto analyseur II, Technicon. L.O.C. Univ. Bretagne Occidentale, Brest, Fr. 531
24
Turner, R.E. 2002. Element ratios and aquatic food webs. Estuaries, 25: 694–703. 532
Vollenweider, R.A. 1976. Advances in defining critical loading levels of phosphorus in lake 533
eutrophication. Mem. Ist. Ital. Idrobiol. 33: 53–83. 534
Wetzel, R.G. 2001. Limnology: lake and river ecosystems. Academic Press, San Diego, Ca. 535
Wilke, M., and Boutière, H. 2000. Hydrobiological, physical and chemical characteristics and 536
spatio-temporal dynamics of an oligotrophic mediterranean lagoon: The étang de La Palme 537
(France). Vie Milieu, 50: 101–115. 538
539
25
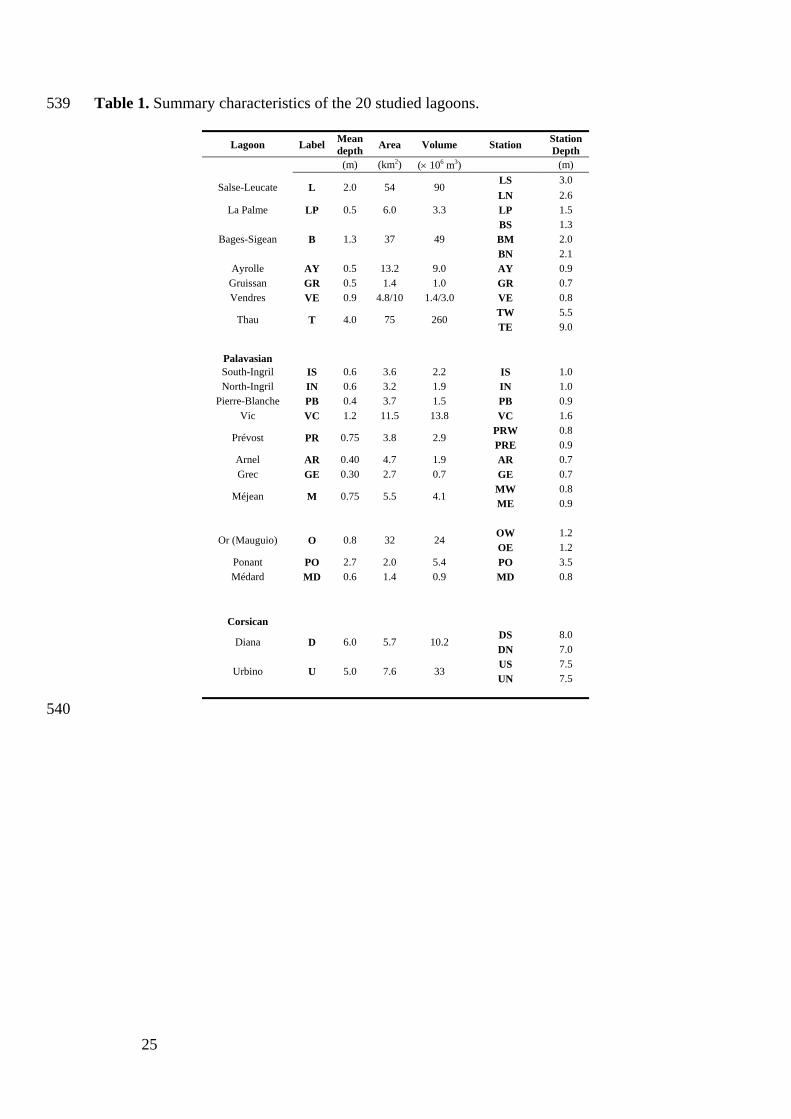
Table 1. Summary characteristics of the 20 studied lagoons. 539
Lagoon Label Meandepth Area Volume Station Station
Depth (m) (km2) (× 106 m3) (m)
LS 3.0 Salse-Leucate L 2.0 54 90
LN 2.6 La Palme LP 0.5 6.0 3.3 LP 1.5
BS 1.3 BM 2.0 Bages-Sigean B 1.3 37 49 BN 2.1
Ayrolle AY 0.5 13.2 9.0 AY 0.9 Gruissan GR 0.5 1.4 1.0 GR 0.7 Vendres VE 0.9 4.8/10 1.4/3.0 VE 0.8
TW 5.5 Thau T 4.0 75 260
TE 9.0
Palavasian
South-Ingril IS 0.6 3.6 2.2 IS 1.0 North-Ingril IN 0.6 3.2 1.9 IN 1.0
Pierre-Blanche PB 0.4 3.7 1.5 PB 0.9 Vic VC 1.2 11.5 13.8 VC 1.6
PRW 0.8 Prévost PR 0.75 3.8 2.9
PRE 0.9 Arnel AR 0.40 4.7 1.9 AR 0.7 Grec GE 0.30 2.7 0.7 GE 0.7
MW 0.8 Méjean M 0.75 5.5 4.1
ME 0.9
OW 1.2 Or (Mauguio) O 0.8 32 24
OE 1.2 Ponant PO 2.7 2.0 5.4 PO 3.5 Médard MD 0.6 1.4 0.9 MD 0.8
Corsican
DS 8.0 Diana D 6.0 5.7 10.2
DN 7.0 US 7.5
Urbino U 5.0 7.6 33 UN 7.5
540
26
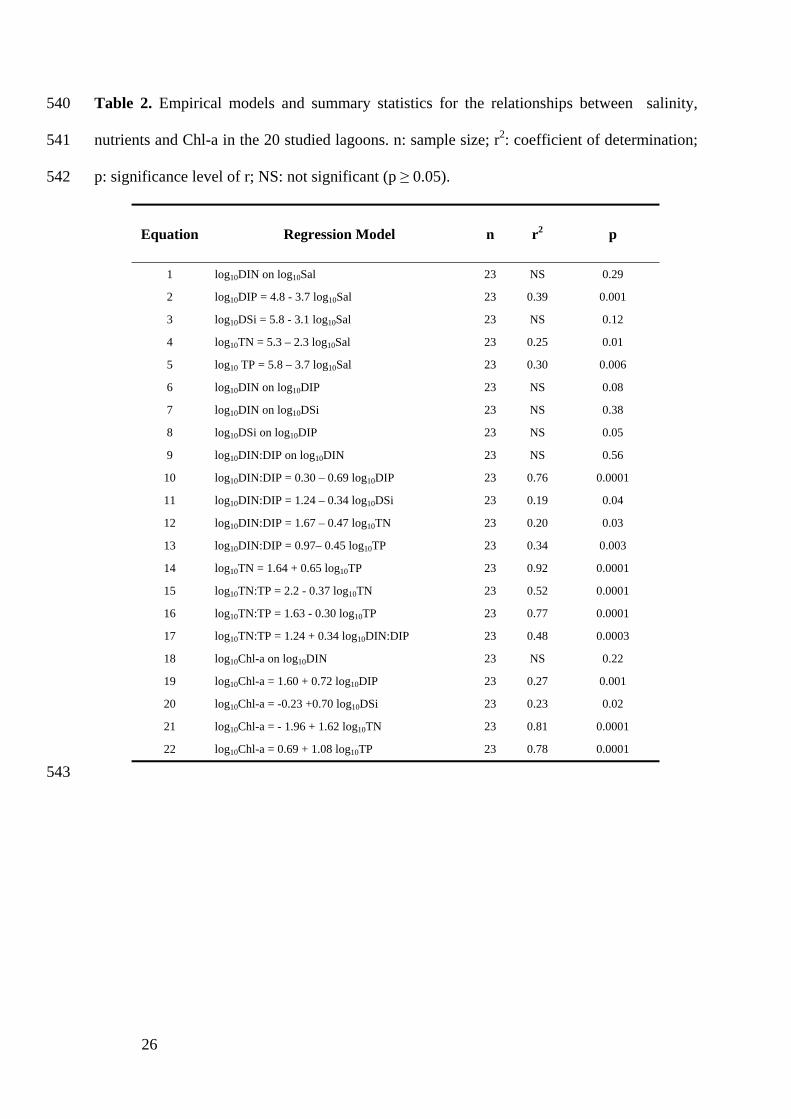
Table 2. Empirical models and summary statistics for the relationships between salinity, 540
nutrients and Chl-a in the 20 studied lagoons. n: sample size; r2: coefficient of determination; 541
p: significance level of r; NS: not significant (p ≥ 0.05). 542
Equation Regression Model n r2 p
1 log10DIN on log10Sal 23 NS 0.29
2 log10DIP = 4.8 - 3.7 log10Sal 23 0.39 0.001
3 log10DSi = 5.8 - 3.1 log10Sal 23 NS 0.12
4 log10TN = 5.3 – 2.3 log10Sal 23 0.25 0.01
5 log10 TP = 5.8 – 3.7 log10Sal 23 0.30 0.006
6 log10DIN on log10DIP 23 NS 0.08
7 log10DIN on log10DSi 23 NS 0.38
8 log10DSi on log10DIP 23 NS 0.05
9 log10DIN:DIP on log10DIN 23 NS 0.56
10 log10DIN:DIP = 0.30 – 0.69 log10DIP 23 0.76 0.0001
11 log10DIN:DIP = 1.24 – 0.34 log10DSi 23 0.19 0.04
12 log10DIN:DIP = 1.67 – 0.47 log10TN 23 0.20 0.03
13 log10DIN:DIP = 0.97– 0.45 log10TP 23 0.34 0.003
14 log10TN = 1.64 + 0.65 log10TP 23 0.92 0.0001
15 log10TN:TP = 2.2 - 0.37 log10TN 23 0.52 0.0001
16 log10TN:TP = 1.63 - 0.30 log10TP 23 0.77 0.0001
17 log10TN:TP = 1.24 + 0.34 log10DIN:DIP 23 0.48 0.0003
18 log10Chl-a on log10DIN 23 NS 0.22
19 log10Chl-a = 1.60 + 0.72 log10DIP 23 0.27 0.001
20 log10Chl-a = -0.23 +0.70 log10DSi 23 0.23 0.02
21 log10Chl-a = - 1.96 + 1.62 log10TN 23 0.81 0.0001
22 log10Chl-a = 0.69 + 1.08 log10TP 23 0.78 0.0001
543

27
Table 3. Contribution of sewage to total inputs of N and P in 13 lagoons for which the 543
watershed is well defined (Dupré et al., unpublished data). N:P ratios (by moles) in sewage 544
and inputs are compared with ratios in lagoon waters. For Bages (B) and the 8 Palavasian 545
lagoons, N:P ratios in the water correspond to pooled data from all stations. 546
Lagoons % contribution of sewage to total inputs
TN:TP in sewage
TN:TP in total inputs
DIN:DIP in water
TN:TP in water
N P Bages 39 12 26.5 33.1 4.9 41 La Palme 37 14 3.4 16.0 11.4 85 Leucate 39 21 8.9 16.5 36.5 46 Or 49 55 24.0 27.4 11.5 29 Palavasian (8) 87 77 26.2 23.0 7.7 29 Thau 34 46 10.7 14.7 2.2 21
547
28
Figure captions 547
Fig. 1. Location of sampling Stns and limits of sectors (dotted line) in oligotrophic ( ), 548
mesotrophic ( ), eutrophic ( ) and hypertrophic ( ) LR and Corsica lagoons. 549
Fig. 2. Log scaled plot of DIN on DIP in oligotrophic ( ), mesotrophic ( ), eutrophic ( ) 550
and hypertrophic ( ) LR and Corsica lagoons. 551
Fig. 3. Relationship between TN and TP in oligotrophic ( ), mesotrophic ( ), eutrophic 552
( ) and hypertrophic ( ) LR and Corsica lagoons. The dotted line corresponds to the 553
Redfield ratio (16:1 by moles). See Table 2 for regression parameters. 554
Fig. 4. Relationship between TN:TP and DIN:DIP in oligotrophic ( ), mesotrophic ( ), 555
eutrophic ( ) and hypertrophic ( ) LR and Corsica lagoons. The solid and the dotted lines 556
correspond respectively to the ratios used by Justić et al. (1995) for dissolved inorganic 557
nutrients, and by Guildford and Hecky (2000) for total nutrients, to discriminate phosphorus 558
limitation from nitrogen limitation. See Table 2 for regression equations. 559
Fig. 5. Relationships between Chl-a and DIN, DIP and DSi in oligotrophic ( ), mesotrophic 560
( ), eutrophic ( ) and hypertrophic ( ) LR and Corsica lagoons. See Table 2 for 561
regression equations. 562
Fig. 6. Relationships between Chl-a, and TN and TP in oligotrophic ( ), mesotrophic ( ), 563
eutrophic ( ) and hypertrophic ( ) LR and Corsica lagoons. See Table 2 for regression 564
equations. 565
566
29
566
567
568
FIGURE 1
AY
GR
BS
LP
LS
3°40' E
43°20' N
VE
IN
GE
OW
VCPB
PREMW
AR
PO
MD
LN
BNBM
IS
PRW
ME
OE
TWTE
Lan guedo c-Roussillon ( LR)
Cor sica
FRA NCE
SPAIN
Aude River
Sète to Rhône canal
ORSICAC
1 km0 1 km0
UN
DS
DN
US
IANADRBINOU
30
568
569
0.01 0.1 1.0 100.1
1.0
10
100
DIP ( ) µmol P L• -1
DU
LLP
BSAYIS GR BMIN
T
BN
PR
MD
POVC
PB
ARO
MEMW
GE
VE
DIN
()
µm
o l N
• L-1
FIGURE 2

31
569
570
FIGURE 3
T P ( )µmol P L• -11.00.1 10 100
D
U L
LP
BS
AY
IS
GR BMIN
T
BN
PR
MD
PO
VCPB
ARO ME
MW
GE
VE
T
N(
)µm
ol N
•L-1
10
100
1000
Tn = 16T
p
32
570
571
FIGURE 4
AY BS
LP
UD
LIS GRIN
BM
T
BNPRMD
PO
PB
VCAR
O
MEGE
MWVE
1.0 10 10010
50
20
100
TNTP
):
(by
mol
es
D :D (by moles IN IP )
33
571
572
573
574
575
576
FIGURE 5
-2.0 -1.5 -1.0 -0.5 0.0 0.5
(b)
(a)
VE
PO
MW
GEAR
PB
PR
VC
ME
O
INIS
MDT
BN
BMU
GR
AYBSLP
D
L
-0.5 0.0 0.5 1.0 1.50.0
0.51.0
1.5
2.0
2.5
D
UMD
GE
LPL
BSAY
GRBM
TBN
INIS
PRVC
PB O
MEAR
PO
MWVE
Log (DSi10 )
Log (DIP10 )
Log (DIN10 )
BSD AY L LP
MDUBN
T
GRBM
IN
IS
PR
PO
VCPBO
VE
ARME
GE
MW
-0.5 0.0 0.5 1.0 1.5 2.0 2.5
(c)
0.0
0.5
1.0
1.5
2.02.5
0.0
0.5
1.0
1.5
2.02.5
Log
(Chl
-a)
10

34
576
577
578
579
FIGURE 6
1.0 1.5 2.0 2.5 3.0Log (TN10 )
GEMW VE
AR
OME
PO
PB
VCPR
MDBN
T
INIS
BM
GRAYBSLP
LU
D
-1.0 -0.5 0.0 0.5 1.0 1.5Log (TP10 )
VE
MWGE
ME
AR
PO
O
VC
PB
PR
BN MDT
INIS
GRBM
D
UL
LP
AY
BS
0.0
0.5
1.0
1.5
2.0
2.5
0.0
0.51.0
1.5
2.0
2.5Log
(Chl
-a)
10
(a)
(b)