Embed Size (px)
Citation preview
Canadian Hereford Association – Fall 2017 EPD Statistics
1
Canadian Hereford Association
Pan American Hereford Cattle Evaluation
Fall 2017
EPD Averages, Tools and Trends
Includes:
Introduction to Genomically Enhanced EPD
Post-Weaning Gain EPD
Residual Feed Intake EPD
Revised Maternal Productivity Index
Feedlot Merit Index
Heritabilities and Correlations
Averages and Percentile Breakdowns: Active Sires, Active Dams, Calves
Information on the usage of EPD Graphs
Information on Accuracy and Possible Change of EPDs
Genetic Trend: EPD Means by Birth Year

Canadian Hereford Association – Fall 2017 EPD Statistics
2
Introduction The following information is for use in analysing the Expected Progeny Differences (EPDs)
from the Fall 2017 Pan American Cattle Evaluation (PACE). The EPDs are calculated by the
Agricultural Business Research Institute (ABRI) in Australia, and use the combined datasets of
the Canadian, American, Uruguay, and Argentina Hereford Associations. The resulting EPD
values are directly comparable across the Hereford breed within North America, Uruguay, and
Argentina. The EPDs are not directly comparable between different breeds of cattle.
The multiple trait analysis for calving ease includes both birth weight and calving ease scores.
While birth weight is highly correlated with calving difficulty, the trait we are truly interested in
is calving ease. Because of the inclusion of birth weight in the CE EPD evaluation, selection for
CE alone will tend to reduce birth weights as well. CE EPD is reported as the probability of
calves being born unassisted to first calf heifers. MCE EPD is reported as the probability that
daughters of an animal will have their first calf without assistance. A larger value represents
easier calving, or less calving assistance being required.
Scrotal size is correlated with fertility traits, and age at puberty. The SC EPD is reported in
centimetres. It is recommended that all sires used meet the recommended minimum scrotal
requirements, and pass a semen test prior to breeding, regardless of the SC EPD.
Cow Weight is a evaluated as a fully correlated trait in the multi-trait evaluation, which means
that its relationship with all other traits in the evaluation is taken into account during the
calculations.
The Fall 2017 EPD includes the presentation of Genomically Enhanced (GE) EPD. These
EPD are based on pedigree and performance data, but also include information obtained from
SNP DNA testing. SNP stands for Single Nucleotide Polymorphism and the tests basically
examine strings of an animal’s DNA for single point changes in DNA base pairs that are related
to differences in performance.
This SNP testing serves to improve the accuracy of the evaluation for these tested animals and
their direct descendents by providing direct measurement of the DNA that the animal possesses
and passes on to their progeny. As animals add progeny records, the relative influence of the
DNA test is reduced in the calculation of the EPD.
While EPD on individual animals may be affected, inclusion of genomic testing results does not
change the overall averages of the EPD in the population. The additional genomic data enhances
the accuracy values associated with the EPD. The impact on accuracy is shown in the table on
page 3. The DNA SNP test information provides significant levels of new information in less
proven animals.
The CHA and AHA have moved to multiple evaluations per year, however the PACE statistics
are only updated semi-annually upon completion of PACE runs including all participating
countries. While data on individual animals may change their EPD significantly, overall
population averages and percentiles will not change dramatically between these interim
evaluations.
It is important to note individual traits, such as milk or growth are affected by many genes, and
that DNA tests are “associated” with various traits and may not explain all of the observed

Canadian Hereford Association – Fall 2017 EPD Statistics
3
differences or variance in a trait. The current DNA panel and the resulting prediction equations
are associated with the published EPD traits (Genetic Correlation) and explain a portion of the
variation within the trait (Percent of Variance Explained). This is shown in the following table.
Genetic Correlation and Percent of Variance explained for each trait, by the current training panel and prediction equations.
Trait Genetic
Correlation
Percent of Variance Explained
CE 0.68 0.46
BW 0.68 0.46
WW 0.52 0.27
YW 0.60 0.36
Milk 0.37 0.14
MCE 0.51 0.26
SC 0.43 0.18
MCW 0.64 0.41
Fat 0.48 0.23
REA 0.49 0.24
Marb 0.43 0.18
Avg 0.53 0.28
Resulting blended accuracy values provided by DNA tests based on initial accuracy of the animal’s EPD and increasing explanation of variance by the test.
Pre-Test Acc
Genetic Correlation of Test 0.00 0.10 0.20 0.30 0.40 0.50 0.60 0.70 0.80 0.90 1.00
0.00 0.00 0.01 0.02 0.05 0.08 0.13 0.20 0.29 0.40 0.56 1.00 0.10 0.10 0.10 0.11 0.13 0.16 0.20 0.25 0.33 0.42 0.57 1.00 0.20 0.20 0.20 0.21 0.22 0.24 0.27 0.31 0.37 0.45 0.59 1.00 0.30 0.30 0.30 0.31 0.32 0.33 0.35 0.38 0.42 0.49 0.60 1.00 0.40 0.40 0.40 0.40 0.41 0.42 0.43 0.45 0.48 0.53 0.62 1.00 0.50 0.50 0.50 0.50 0.51 0.51 0.52 0.53 0.55 0.58 0.65 1.00 0.60 0.60 0.60 0.60 0.60 0.61 0.61 0.62 0.63 0.65 0.69 1.00 0.70 0.70 0.70 0.70 0.70 0.70 0.70 0.71 0.71 0.72 0.74 1.00 0.80 0.80 0.80 0.80 0.80 0.80 0.80 0.80 0.80 0.81 0.82 1.00 0.90 0.90 0.90 0.90 0.90 0.90 0.90 0.90 0.90 0.90 0.90 1.00 1.00 1.00 1.00 1.00 1.00 1.00 1.00 1.00 1.00 1.00 1.00 1.00
Lower accuracy EPD are more likely to experience changes due to the inclusion of genomic data
than higher accuracy EPD. The EPD will also have a larger boost in accuracy for those animals
with less phenotypic data and thus lower initial accuracies.
It is also important to note that genomic information may affect MPI and FMI values for animals
due to the impact on the component traits in each of these indexes.
Animals with EPD that are “Genomically Enhanced” are noted on the CHA website with the
GE-EPD logo.
Canadian Hereford Association – Fall 2017 EPD Statistics
4
How to get the most out of the cow weight EPD:
The cow weight model allows us to weigh cows during a 60 day window either side of the calf
weaning date, providing breeders with more flexibility, although it is recommended to weigh
cows at the same time you weigh calves at weaning. Cow Weight records are adjusted to 5 years
of age. Management groups are determined by the calf management group, unless the cow has
experienced special treatment.
1) Weigh every cow every year – the analysis will sort out which weights to use
2) Weigh cows when calves are weighed at weaning
3) Management groups are not required, unless a cow has experienced different management
than her calf
4) If also recording body conditions scores, please do so at the same time as weighing
Table 1. Expected Progeny Difference Abbreviations Abbreviation Meaning Unit
EPD Expected Progeny Difference
CE Calving Ease % Unassisted Calving
BW Birth Weight Pounds
WW Weaning Weight Pounds
YW Yearling Weight Pounds
PWG Post Weaning Gain Pounds
RFI Residual Feed Intake
Milk Milk Pounds
TM Total Maternal Pounds
MCE Maternal Calving Ease % Unassisted Calving
SC Scrotal Centimetres
CW Cow Weight Pounds
Stay Stayability % Probability
MPI Maternal Productivity Index Standard units
FMI Feedlot Merit Index Standard units
REA Rib-Eye Area Square Inches
MARB Intramuscular Fat Score
FAT Back Fat Inches
The updated Maternal Productivity Index (MPI) is printed, together with its component traits as
computed by ABRI.
Canadian Hereford Association – Fall 2017 EPD Statistics
5
Post-Weaning Gain and Residual Feed Intake Post-weaning gain (PWG) and Residual Feed Intake (RFI) which were
added in the last evaluation. Cattle that have undergone RFI testing will
be shown with the RFI Logo.
Residual Feed Intake (RFI)
RFI is a measure of feed efficiency, and is defined as the difference between an animal's actual
feed intake and its expected feed intake based on its size and growth. The EPD is expressed as
an RFI score, with a larger values equating to greater efficiency.
Interpreting the RFI score
The AVERAGE animal in the CHA dataset has an RFI score of 100. The current population
average (calves born in the last 2 years) is 101.4. The average values for the EPD will change as
data is collected and EPDs are updated, so remain aware of the EPD average for Hereford cattle.
A one-point change in RFI score represents 10 pounds of feed per year, and a larger number on
the scale indicates the animal is more efficient. For more efficient bulls whose progeny eat less
than expected, their index values are larger. For example: a bull whose progeny will eat 10 lbs
less over the year than we would expect would score 101, where the expected intake is based on
growth and weight of the animal. A bull whose progeny will eat 200 lbs less over the year than
expected will have a score of 120. For less efficient bulls whose progeny eat more than
expected, their index values are lower. Where a bull’s progeny that eats 10 pounds more than
expected over a year will have an index of 99 and a bull’s progeny that eats 200 lbs more a year
will score 80.
Post Weaning Gain (PWG)
As RFI is strictly a measure of efficiency it is important to balance this trait with gain. To ensure
producers are able to select efficient cattle that still have the ability to gain, the CHA is
introducing a Post Weaning Gain (PWG) EPD that is simply WW EPD subtracted from YW
EPD. This value is expressed in expected post weaning pounds of gain; the difference between
yearling and weaning. The current population (animals born in the last 2 years) average for
PWG is 30.7.

Canadian Hereford Association – Fall 2017 EPD Statistics
6
Maternal Productivity Index The MPI is a selection index and is unique relative to other published values because it considers
both raw production (income) and costs (cow replacement rate and maintenance). The MPI is
based on profitability at a cow/calf level with a cowherd that retains its own replacements and
markets calves at weaning. In many respects this reflects the bull customers of Hereford
breeders. Through a biological simulation model each trait can be adjusted by a single unit and
the effect on overall herd profitability can be mapped. This approach defines the relative
economic importance of the traits involved and then combines them on this basis.
The MPI objectively assesses multiple traits that drive profit and combines them in an easy-to-
use format so that producers can make effective selection decisions. It is important to note that
the MPI is a robust index. This means that there can be significant market changes without
changing the ranking of the animals in the index. For example, the price of weaned calves can
change significantly, without affecting the ranking of animals included in the index calculation.
Relative Trait Weighting used in calculating the MPI Calving Ease 0.22
Maternal Calving Ease 0.22
Weaning Weight 39.16
Milk 15.23
Cow Weight 34.41
Stayability 10.75
Total 100.0
Pan American EPDs as calculated by ABRI in the PACE, as well as the trait of Stayability
calculated by ABRI using Canadian data are included. The MPI value also includes a price
premium for “reputation” calves that uses a regression approach to incorporate the Feedlot Merit
Index (FMI) into the calculation.
MATERNAL PRODUCTIVITY INDEX
Calving Ease (CE) – the Pan American Calving Ease EPD in % Unassisted. A larger EPD
value represents fewer assisted births to first calf heifers.
Maternal Calving Ease (MCE) – the Pan American Maternal Calving Ease EPD in %
Unassisted Births. A larger EPD represents fewer assisted births to a sire’s daughters as first calf
heifers.
Weaning Weight (WW) – the Pan American weaning weight EPD in pounds. A larger EPD
value indicates a heavier offspring due to genes for pre-weaning growth.
Milk – the Pan American milk EPD in pounds. A larger EPD value indicates more ability of
daughters to provide a good pre-weaning environment for their calves.
Cow Weight (CW) – the Pan American mature cow weight EPD in pounds at weaning. A larger
EPD value indicates a larger mature weight of an animal’s daughters as weighed at weaning.
Stayability (Stay) – the stayability EPD and accuracy. Stayability is a probability value and a
higher EPD value indicates that an animal’s daughters are more likely to survive in the herd to
produce 3 consecutive calves. It is calculated as the number of calves produced given that a
female becomes a dam divided by the number of possible calves and is expressed as a percentage
value. Stayability is calculated by ABRI on a Canadian dataset only.
Maternal Productivity Index (MPI) – this is the maternal productivity value calculated from
the combination of traits and their relative weightings and then standardised to a mean of 100
and a standard deviation of 25. This allows for rapid comparison of animals and an
understanding of where the animal fits within the Hereford population.

Canadian Hereford Association – Fall 2017 EPD Statistics
7
MPI is calculated in two steps:
1. The economic weighting is applied to the EPD from the genetic evaluations. Step 1 is
calculated as follows:
=(11.43*(CE+MCE)) + ((1.476+0.0018*FMI)*Wng WT) +
((0.869+0.00053*FMI)*Milk) + ((-0.192-0.00019*FMI)*Cow Wt) + ((37.807-
0.000732*FMI)*Stay)
2. The MPI is expressed as a ratio and standardized to a mean of 100 and a standard
deviation of 25 units. MPI is calculated as follows:
MPI = 25 x (Step 1 Result – 44.4) ÷ 80.4 + 100.
The mean or average from Step 1 (multiplying the economic values over the whole dataset) is
44.4 and the standard deviation of the entire dataset is 80.4.
Further explanation of Standardized Curves is located after the information on Feedlot Merit
Index. MPI was calculated on a dataset of 850,780 animals. If selection were done strictly on
the basis of MPI then selection emphasis on the component traits would occur as follows: 0.2%
CE, 0.2% MCE, 39.2% Wng WT, 15.2% Milk, 34.4% Cow WT, 10.8% Stayability.
Feedlot Merit Index
To compliment the Maternal Productivity Index (MPI), the CHA publishes a Feedlot Merit Index
(FMI). Indices like our MPI and the FMI enable producers and commercial customers to use one
number, which encompasses many traits, to aid in their selection decisions. This selection
strategy also avoids the danger of single-trait selection. Like MPI, differences in FMI are
standardized to a mean of 100, and a standard deviation of 25. A difference in FMI between
bulls represents a difference between the progeny of those bulls to be more profitable feeder
cattle.
The goals of the FMI are to monitor and keep costs reasonable for the cow/calf and feedlot
producer, while still deriving the best returns from carcasses, keeping in mind the price
discrimination that occurs based upon carcass merit and the predominant breed composition of
the Canadian commercial cow herd. This index is designed for use in terminal situations only
(i.e. no replacements retained in a herd).
Economically relevant traits affecting profitability in the FMI are as follows: calving ease,
weaning weight, average daily gain, feed intake, yield grade, and marbling score. A number of
simulations were run to arrive at the proper economic weightings which would place positive
pressure on the traits that provide profitable carcasses. Weaning, growing, and finishing phases,
along with calf survival and related costs were all incorporated into the model. The genetic co-
variances between the economically relevant traits listed above and the EPDs we currently
publish were determined as well, to allow the weightings to be correctly applied to our published
EPDs.
The FMI is an excellent tool to increase the carcass potential of the progeny of bulls that are sold
into terminal sire programs. Moderate and balanced selection for both MPI & FMI will produce
progeny with traits that are desirable for maternal and feeder cattle.

Canadian Hereford Association – Fall 2017 EPD Statistics
8
MPI = 100 MPI = 125 MPI = 75 MPI = 50 MPI = 150 MPI = 175 MPI = 25
For more specific information on the calculation and standardization of FMI, please refer to the
section on Standard Curves. FMI was calculated on a dataset of 847,923 animals.
AN IMPORTANT NOTE ON STANDARD CURVES
Figure 1. A Standard Curve Representing Various MPI Values Across the Hereford Population
CHA Indexes (MPI and FMI) are expressed as standardised values. This means that the average
MPI or FMI for all animals in the evaluation is 100. Using MPI as an example, a cow with an
MPI of 125 would be 1 standard deviation above the mean and a cow with an MPI of 150 would
be 2 standard deviations above the mean.
Figure 1 shown above represents a standard curve. 0 or the mean median represents an MPI of
100. +1 S.D. represents an MPI of 125, and so on. An animal with an MPI of 125 would rank in
the 84th percentile.
The figure shows that 34.1% of the Hereford animals will have an MPI between 100 and 125,
13.6% will have a value from 125 to 150 and 2.1% will be over 150. The same applies to the
FMI values as well.

Canadian Hereford Association – Fall 2017 EPD Statistics
9
Heritabilities and Correlations Heritability is the term used to describe the observed variation in a trait that can be explained by genetic factors. The most up to date heritability
estimates have been incorporated based on work done at AGBU, and represent variation in the Canadian and U.S. Hereford populations. These
heritability estimates are the most accurate tool to represent genetic variation in the Hereford breed. Heritabilities used in the current evaluation are
shown below.
Correlations are used to describe the relationships between traits. Correlations may range from minus 1.0 to plus 1.0. Correlations occur for a couple
of reasons. Some genes may influence more than one trait, for example some of the genes that increase weaning weight may also result in higher
yearling weights. This means that we can use weaning weight information to better predict the yearling weight EPD of an animal. A positive
correlation means that as one trait increases the other does as well. A negative correlation means that when one trait increases the other decreases.
Correlations of 0 mean that the traits have no relationship to each other. Some of the correlations used in the evaluation are shown below.
Table 2. Heritabilities and Correlations used in the Joint Hereford PACE
(Heritabilities are on the Diagonal / Genetic Correlations are above the Diagonal) CE BW WW YW MILK MCE SC Cow Wt Stay Scan REA Scan FAT Scan % IMF REA FAT MARB
CE 0.10 -0.40 0.00 0.00 0.00 -0.50 0.00 0.00 0.00 0.00 0.00 0.00 0.00 0.00 0.00
BW 0.43 0.53 0.54 0.00 0.00 0.03 0.35 -0.23 0.18 -0.15 -0.07 0.10 -0.10 -0.10
WW 0.20 0.80 0.00 0.00 0.19 0.40 -0.22 0.59 0.28 0.02 0.40 0.10 0.00
YW 0.36 0.00 0.00 0.24 0.50 0.00 0.55 0.23 -0.09 0.40 0.05 0.05
MILK 0.10 0.00 0.00 0.00 0.00 0.00 0.00 0.00 0.00 0.00 0.00
MCE 0.10 0.00 0.00 0.00 0.00 0.00 0.00 0.00 0.00 0.00
SC 0.37 0.10 0.00 0.05 0.05 0.05 0.05 0.05 0.05
Cow Wt 0.38 -0.22 0.00 0.00 0.00 0.34 0.00 0.00
Stay 0.11 0.00 0.00 0.00 0.00 0.00 0.00
Scan REA 0.26 0.18 0.00 0.75 -0.05 0.02
Scan FAT 0.30 0.39 -0.09 0.85 0.30
Scan% IMF 0.26 -0.16 0.25 0.70
REA 0.36 -0.20 -0.10
FAT 0.30 0.30
Marb 0.53
Correlations have the largest impact on those animals with no data on a specific trait, which are only being evaluated based on the correlation or
association between traits. For example, animals that do not have a scrotal measurement reported may have a scrotal EPD that is largely based on
relative yearling weight performance. These animals may see significant changes in their EPD for scrotal size if a scrotal record is reported. The
best way to ensure that evaluation reflects relative genetic merit is to collect data on the trait of interest.

Canadian Hereford Association – Fall 2017 EPD Statistics
10
Averages and Percentile Breakdowns A Percentile table is used to show the relative ranking of an animal within the Hereford breed. Active Sires are those bulls that have
sired at least 1 calf recorded over the last 2 ½ years (for comparison of active bulls/herdsires). Active Dams are those cows with
calves recorded in the last 2 ½ years (for comparison of females in use in your cow herd). Calves are those animals born within the
last 2 ½ years (2015/2017) (for comparison of yearling and two year old animals in the population).
Table 3. Active Sires – Averages & Percentile Breakdown
CE (%)
BW (lbs)
WW (lbs)
YW (lbs)
PWG (lbs)
RFI Milk (lbs)
TM (lbs)
MCE (%)
SC (cm)
CW (lbs)
Stay (%)
MPI FMI REA (in2)
FAT (in)
MARB (units)
Avg 1.2 3.1 50.0 82.0 31.7 100.3 22.0 47.0 1.5 0.9 89.0 -0.3 112.3 126.1 0.36 0.005 0.08 Avg
Min -17.4 -6.9 -10.0 -18.0 -7.3 83.0 -13.0 -10.0 -8.0 -1.0 -10.0 -7.8 9.5 13.3 -0.63 -0.107 -0.46 Min
Max 13.8 15.4 91.0 148.0 64.5 120.0 52.0 84.0 8.5 2.7 184.0 5.8 211.0 217.4 1.57 0.169 1.00 Max
Percentile Breakdown
1% 8.3 -2.2 73.0 120.0 52.1 115.0 40.0 70.0 6.3 1.9 35.0 3.3 174.8 190.4 1.02 -0.058 0.54 1%
2% 7.6 -1.5 71.0 116.0 49.7 112.0 38.0 67.0 5.8 1.8 43.0 2.8 167.8 182.0 0.94 -0.051 0.46 2%
3% 7.0 -1.0 69.0 112.0 48.3 111.0 37.0 65.0 5.4 1.7 47.0 2.3 162.4 176.0 0.89 -0.046 0.41 3%
4% 6.6 -0.7 68.0 110.0 46.9 110.1 36.0 65.0 5.2 1.6 51.0 2.1 158.9 172.1 0.85 -0.042 0.38 4%
5% 6.2 -0.5 66.0 108.0 46.3 109.0 35.0 64.0 5.0 1.6 54.0 2.0 155.3 169.1 0.82 -0.039 0.36 5%
10% 5.1 0.4 63.0 103.0 43.2 107.0 32.0 60.0 4.2 1.4 62.0 1.5 145.3 159.1 0.70 -0.029 0.27 10%
15% 4.4 1.0 61.0 99.0 40.7 105.0 30.0 58.0 3.7 1.3 67.0 1.1 138.7 152.1 0.63 -0.023 0.23 15%
20% 3.8 1.4 59.0 96.0 38.8 104.0 28.0 56.0 3.3 1.2 71.0 0.8 133.4 146.4 0.58 -0.018 0.19 20%
25% 3.3 1.8 57.0 93.0 37.3 103.0 27.0 54.0 2.9 1.1 75.0 0.6 129.6 141.8 0.53 -0.013 0.16 25%
30% 2.9 2.1 56.0 91.0 36.2 102.0 26.0 53.0 2.6 1.0 78.0 0.4 125.3 138.0 0.49 -0.010 0.14 30%
35% 2.4 2.4 55.0 89.0 35.1 101.0 25.0 51.0 2.3 1.0 81.0 0.2 121.9 134.8 0.45 -0.007 0.12 35%
40% 2.0 2.6 53.0 87.0 34.0 101.0 24.0 50.0 2.0 0.9 84.0 0.0 118.8 131.3 0.42 -0.003 0.10 40%
45% 1.7 2.9 52.0 84.0 32.9 100.0 23.0 49.0 1.8 0.9 87.0 -0.1 115.3 128.2 0.39 0.000 0.08 45%
50% 1.3 3.1 51.0 82.0 31.7 100.0 22.0 48.0 1.5 0.8 89.0 -0.3 112.3 125.6 0.35 0.003 0.06 50%
55% 0.9 3.4 50.0 80.0 30.5 100.0 21.0 47.0 1.2 0.8 92.0 -0.5 109.5 122.8 0.32 0.006 0.04 55%
60% 0.6 3.6 49.0 78.0 29.4 99.0 20.0 45.0 0.9 0.7 94.0 -0.6 105.7 119.7 0.29 0.009 0.03 60%
65% 0.2 3.9 47.0 76.0 28.2 99.0 19.0 44.0 0.6 0.7 97.0 -0.9 102.2 116.9 0.26 0.012 0.01 65%
70% -0.2 4.1 46.0 74.0 27.0 98.0 18.0 42.0 0.3 0.6 100.0 -1.1 98.7 113.1 0.22 0.016 0.00 70%
75% -0.7 4.4 44.0 71.0 25.9 98.0 17.0 41.0 0.1 0.6 103.0 -1.3 98.0 109.7 0.18 0.021 -0.02 75%
80% -1.3 4.7 42.0 68.0 24.4 97.0 16.0 39.0 -0.3 0.5 107.0 -1.5 97.0 106.3 0.14 0.026 -0.04 80%
85% -1.9 5.1 40.0 65.0 23.0 96.0 14.0 36.0 -0.7 0.5 111.0 -1.8 86.2 102.3 0.09 0.032 -0.06 85%
90% -2.7 5.6 37.0 60.0 20.7 95.0 12.0 33.0 -1.2 0.4 116.0 -2.1 79.6 95.5 0.03 0.041 -0.08 90%
95% -3.9 6.4 33.0 53.0 16.9 93.0 8.0 28.0 -2.1 0.3 124.0 -2.8 69.1 85.3 -0.06 0.056 -0.12 95%
100% -17.4 15.4 -10.0 -18.0 -7.3 83.0 -13.0 -10.0 -8.0 -1.0 184.0 -7.8 9.5 13.3 -0.63 0.169 -0.46 100%
Num 7588 7652 7652 7652 2133 572 7643 7643 7588 7646 7651 1953 1950 2130 7649 7649 7649 Num
Number (Num) is the number of active sires evaluated for each trait. Keep in mind that many more sires were evaluated; however
active sires are those that have sired at least 1 calf reported in the last 2 ½ years. There were roughly 7,650 active sires in the growth
evaluation, 7,590 in the calving ease evaluation, and 7,650 in the carcass evaluation.

Canadian Hereford Association – Fall 2017 EPD Statistics
11
Table 4. Active Dams – Averages & Percentile Breakdown
CE (%)
BW (lbs)
WW (lbs)
YW (lbs)
PWG (lbs)
RFI Milk (lbs)
TM (lbs)
MCE (%)
SC (cm)
CW (lbs)
Stay (%)
MPI FMI REA (in2)
FAT (in)
MARB (units)
Avg 0.6 3.4 46.0 75.0 29.8 100.9 19.0 42.0 1.0 0.7 85.0 -0.3 106.4 120.6 0.28 0.003 0.06 Avg
Min -15.7 -9.4 -32.0 -53.0 -5.8 85.0 -24.0 -27.0 -11.2 -0.8 -42.0 -8.3 1.8 0.7 -0.76 -0.125 -0.51 Min
Max 12.5 14.3 84.0 140.0 67.9 119.0 52.0 78.0 8.9 2.7 197.0 5.7 197.5 221.6 1.45 0.166 0.89 Max
Percentile Breakdown
1% 6.8 -1.1 66.0 109.0 47.6 111.0 36.0 64.0 5.6 1.6 37.0 3.5 167.3 171.8 0.85 -0.050 0.41 1%
2% 5.9 -0.4 64.0 105.0 45.2 110.0 34.0 62.0 5.0 1.5 44.0 3.0 159.4 164.0 0.78 -0.043 0.35 2%
3% 5.5 -0.1 62.0 102.0 43.8 109.0 33.0 60.0 4.7 1.4 48.0 2.7 154.5 159.2 0.73 -0.038 0.31 3%
4% 5.1 0.2 61.0 101.0 42.8 108.0 32.0 59.0 4.5 1.3 51.0 2.4 150.7 156.0 0.69 -0.035 0.29 4%
5% 4.8 0.4 60.0 99.0 42.0 108.0 31.0 58.0 4.2 1.3 54.0 2.3 148.0 153.6 0.66 -0.032 0.27 5%
10% 3.8 1.2 57.0 94.0 39.3 106.0 28.0 55.0 3.5 1.1 61.0 1.7 138.2 145.1 0.57 -0.024 0.21 10%
15% 3.1 1.6 55.0 90.0 37.5 105.0 27.0 53.0 3.0 1.1 66.0 1.3 132.0 140.0 0.51 -0.018 0.17 15%
20% 2.6 2.0 54.0 87.0 36.1 104.0 25.0 51.0 2.6 1.0 70.0 1.0 127.3 136.0 0.46 -0.015 0.14 20%
25% 2.2 2.3 52.0 85.0 34.9 103.0 24.0 49.0 2.2 0.9 73.0 0.7 123.2 132.7 0.42 -0.011 0.12 25%
30% 1.9 2.6 51.0 83.0 33.8 103.0 23.0 48.0 1.9 0.9 76.0 0.5 119.5 129.7 0.38 -0.009 0.10 30%
35% 1.5 2.8 50.0 81.0 32.8 102.0 22.0 47.0 1.7 0.8 79.0 0.3 116.0 126.9 0.35 -0.006 0.08 35%
40% 1.2 3.1 49.0 79.0 31.9 101.0 21.0 45.0 1.4 0.8 81.0 1.0 112.9 1246.0 0.32 -0.004 0.07 40%
45% 0.9 3.3 48.0 77.0 30.9 101.0 20.0 44.0 1.2 0.8 83.0 -0.1 109.9 122.3 0.29 -0.001 0.06 45%
50% 0.6 3.5 47.0 75.0 29.9 101.0 19.0 43.0 1.0 0.7 86.0 -0.3 106.7 120.1 0.26 0.001 0.04 50%
55% 0.3 3.7 45.0 73.0 29.0 100.0 19.0 41.0 0.7 0.7 88.0 -0.5 103.6 117.9 0.24 0.003 0.03 55%
60% 0.1 3.9 44.0 72.0 28.0 100.0 18.0 40.0 0.5 0.6 90.0 -0.7 100.5 115.6 0.21 0.006 0.02 60%
65% -0.2 4.1 43.0 70.0 27.0 99.0 17.0 39.0 0.3 0.6 92.0 -0.9 97.2 113.4 0.18 0.009 0.00 65%
70% -0.6 4.4 42.0 68.0 25.9 99.0 15.0 37.0 0.1 0.6 95.0 -1.1 93.6 110.9 0.15 0.012 -0.01 70%
75% -0.9 4.6 41.0 65.0 24.8 99.0 14.0 36.0 -0.2 0.5 97.0 -1.3 89.7 108.2 0.12 0.016 -0.02 75%
80% -1.3 4.9 39.0 63.0 23.5 98.0 13.0 34.0 -0.5 0.5 100.0 -1.6 85.3 105.2 0.09 0.020 -0.04 80%
85% -1.8 5.2 38.0 60.0 21.9 97.0 11.0 31.0 -0.9 0.4 104.0 -1.9 80.2 101.9 0.05 0.025 -0.06 85%
90% -2.4 5.7 35.0 57.0 20.0 96.0 9.0 28.0 -1.4 0.4 109.0 -2.4 73.3 97.6 0.00 0.032 -0.08 90%
95% -3.5 6.3 32.0 51.0 17.1 94.0 5.0 24.0 -2.1 0.2 117.0 -3.0 64.1 89.9 -0.07 0.043 -0.11 95%
100% -15.7 14.3 -32.0 -53.0 -5.8 85.0 -24.0 -27.0 -11.2 -0.8 197.0 -8.3 1.8 0.7 -0.76 0.166 -0.51 100%
Num 142864 144851 144955 144973 22808 2566 144809 144807 142864 143048 144853 21075 21068 22784 143282 143282 143282 Num
Number (Num) is the number of active dams that were evaluated for each trait. Many more dams were evaluated; however active
dams are those females that have had a calf reported within the last 2 ½ years. There were roughly 144,955 active females included in
the growth evaluation, 142,860 evaluated for calving ease, and 143,280 for carcass merit.

Canadian Hereford Association – Fall 2017 EPD Statistics
12
Table 5. Current Calves – Averages & Percentile Breakdown
CE (%)
BW (lbs)
WW (lbs)
YW (lbs)
PWG (lbs)
RFI Milk (lbs)
TM (lbs)
MCE (%)
SC (cm)
CW (lbs)
Stay (%)
MPI FMI REA (in2)
FAT (in)
MARB (units)
Avg 1.4 3.1 50.0 80.0 30.6 101.6 22.0 46.0 1.5 0.8 88.0 -0.4 111.8 123.9 0.34 0.005 0.09 Avg
Min -15.1 -9.3 -27.0 -42.0 0.0 81.0 -11.0 -23.0 -7.9 -0.9 -27.0 -6.3 20.3 2.3 -0.70 -0.101 -0.38 Min
Max 12.6 14.4 91.0 146.0 65.9 126.0 50.0 78.0 8.4 2.7 176.0 5.4 205.3 231.8 1.43 0.157 1.03 Max
Percentile Breakdown
1% 7.8 -1.5 69.0 112.0 48.0 114.0 37.0 65.0 5.5 1.6 46.0 2.6 165.0 175.2 0.87 -0.044 0.47 1%
2% 6.8 -0.9 66.0 108.0 45.9 112.0 35.0 63.0 5.0 1.5 52.0 2.2 158.3 168.6 0.80 -0.037 0.41 2%
3% 6.3 -0.5 65.0 106.0 44.5 111.0 34.0 62.0 4.7 1.5 55.0 1.9 154.5 163.9 0.75 -0.033 0.37 3%
4% 5.9 -0.2 64.0 104.0 43.5 110.0 33.0 61.0 4.5 1.4 58.0 1.8 151.1 160.6 0.72 -0.030 0.34 4%
5% 5.6 0.0 63.0 103.0 42.7 109.0 32.0 60.0 4.4 1.4 60.0 1.6 148.3 158.1 0.70 -0.028 0.31 5%
10% 4.6 0.8 60.0 98.0 39.9 108.0 30.0 58.0 3.8 1.2 67.0 1.2 139.4 149.5 0.61 -0.021 0.24 10%
15% 3.9 1.3 58.0 95.0 38.1 107.0 28.0 56.0 3.3 1.2 71.0 0.9 133.9 144.0 0.56 -0.016 0.20 15%
20% 3.4 1.6 57.0 92.0 36.8 105.0 27.0 54.0 3.0 1.1 74.0 0.7 129.5 139.5 0.52 -0.012 0.17 20%
25% 3.0 2.0 55.0 90.0 35.6 105.0 26.0 53.0 2.7 1.0 77.0 0.5 125.9 136.2 0.48 -0.009 0.15 25%
30% 2.6 2.2 54.0 88.0 34.6 104.0 25.0 52.0 2.4 1.0 80.0 0.3 122.8 133.1 0.45 -0.006 0.13 30%
35% 2.3 2.5 53.0 86.0 33.6 103.0 24.0 51.0 2.2 0.9 82.0 0.1 119.7 130.6 0.42 -0.004 0.11 35%
40% 2.0 2.7 52.0 84.0 32.8 103.0 24.0 49.0 2.0 0.9 84.0 0.0 117.0 128.0 0.39 -0.001 0.09 40%
45% 1.6 2.9 51.0 83.0 31.9 102.0 23.0 48.0 1.7 0.9 87.0 -0.2 114.3 125.6 0.36 0.001 0.08 45%
50% 1.3 3.1 50.0 81.0 31.0 101.0 22.0 47.0 1.5 0.8 89.0 -0.3 111.7 123.3 0.34 0.003 0.07 50%
55% 1.0 3.4 49.0 79.0 30.4 101.0 21.0 46.0 1.3 0.8 91.0 -0.5 109.1 121.0 0.31 0.006 0.06 55%
60% 0.7 3.6 48.0 77.0 29.2 100.0 21.0 45.0 1.1 0.8 93.0 -0.6 106.4 118.7 0.29 0.008 0.04 60%
65% 0.4 3.8 47.0 76.0 28.2 100.0 20.0 44.0 0.9 0.7 95.0 -0.8 103.6 116.4 0.26 0.011 0.03 65%
70% 0.1 4.0 46.0 74.0 27.1 99.0 19.0 43.0 0.6 0.7 97.0 -1.0 100.6 114.0 0.23 0.014 0.02 70%
75% -0.2 4.3 45.0 72.0 26.0 99.0 18.0 41.0 0.4 0.6 100.0 -1.1 97.5 111.3 0.20 0.018 0.00 75%
80% -0.6 4.6 43.0 69.0 24.6 98.0 17.0 39.0 0.1 0.6 103.0 -1.3 94.0 108.3 0.17 0.022 -0.01 80%
85% -1.1 4.9 41.0 67.0 22.9 97.0 15.0 37.0 -0.2 0.5 106.0 -1.6 89.8 104.8 0.13 0.027 -0.03 85%
90% -1.7 5.4 39.0 63.0 20.7 96.0 13.0 34.0 -0.6 0.5 110.0 -1.9 84.3 100.1 0.08 0.033 -0.05 90%
95% -2.7 6.1 36.0 57.0 17.2 93.0 9.0 30.0 -1.2 0.4 116.0 -2.4 76.3 92.6 0.01 0.044 -0.08 95%
100% -15.1 14.4 -27.0 -42.0 0.0 81.0 -11.0 -23.0 -7.9 -0.9 176.0 -6.3 20.3 2.3 -0.70 0.157 -0.38 100%
Num 223616 234873 234863 234863 37699 1888 234479 234479 223616 234132 234853 30372 29944 36522 234727 234727 234727 Num
Current calves are those born in the last 2 ½ years. Number (Num) is the number of calves that were evaluated for each trait. There
were roughly 234,870 calves included in the growth evaluation, 223,620 in the calving ease evaluation and 234,730 in the carcass
merit evaluation.

Canadian Hereford Association – Fall 2017 EPD Statistics
13
EPD Graphs on the CHA Website
The screen below appears when you select an animal on the CHA website under the EPD or Animal searches.
What you may not be aware of is that there is a pictorial representation available of every animal’s EPD
ranking within the population.
Once you click on the graphic or the [View] link, this graph appears. It gives you a quick snapshot view of the
animal’s ranking within the population for each EPD. The graph is based upon the calf percentile table, so if
you trying to compare older animals (i.e. animals with progeny), it is better to use the Active Sires and Active
Dams percentile tables presented earlier in this document to determine rankings. If you are looking for
yearling, 2 year old bulls, or replacement females, the graph on website is accurate. Always keep in mind that
EPDs do not represent actual values and EPDs must be used as a comparison between two or more
animals.
Genomically Enhanced EPD
Animals with EPD that contain DNA SNP test information are noted on the CHA animal search site through the
appearance of the Genomically Enhanced EPD (GE EPD) logo on their pedigree page.

Canadian Hereford Association – Fall 2017 EPD Statistics
14
Accuracy and Possible Change of EPDs EPDs change because we are continually collecting more information on Hereford cattle. As well, researchers
continue to find ways to better describe genetic relationships; this results from model improvements, such as the
multi-trait analysis performed by ABRI.
Accuracy is based on the amount of performance information available on the animal and its’ close relatives –
particularly the number of progeny analysed. Accuracy is also based on the heritability of the trait and the
genetic correlations with other recorded traits. Hence accuracy indicates the “confidence level” of the EPD.
The higher the accuracy value the lower the likelihood of change in the animal’s EPD as more information is
analyzed for that animal and its’ relatives. Even though an EPD with a low accuracy may change in the future,
it is still the best estimate of an animal’s genetic merit for that trait. As more information becomes available, an
EPD is just as likely to increase in value as it is to decrease.
While an EPD is still a better measure of an animal’s genetic merit than a rank or an index, it is important to be
aware of the potential risks associated with using low accuracy sires. As EPDs are used for improving accuracy
of selection, it is important to consider the accuracy value associated with the EPD value.
Accuracy values range from .00 to .99. The following table is given for interpreting accuracy. Accuracy Interpretation
< 0.10 - PE Very low accuracy. EPDs should be considered a preliminary estimate. They could change
substantially as more performance information becomes available.
0.10 to 0.25 Low accuracy, usually based on the animal’s own records and pedigree. Useful for screening “best
bet” animals. Still subject to substantial changes with more information, particularly when the
performance of progeny are analysed.
0.25 to 0.40 Medium accuracy and includes some progeny information. Becoming a more reliable indicator of
the animal’s value as a parent.
0.40 to 0.70 High accuracy. Some progeny information included. Unlikely that the EPD will change very
much with the addition of more progeny data.
> 0.70 Very high accuracy estimate of the animal’s true breeding value.
When two animals have similar EPDs the one with the higher accuracy could be the safer choice, assuming
other factors are equal.
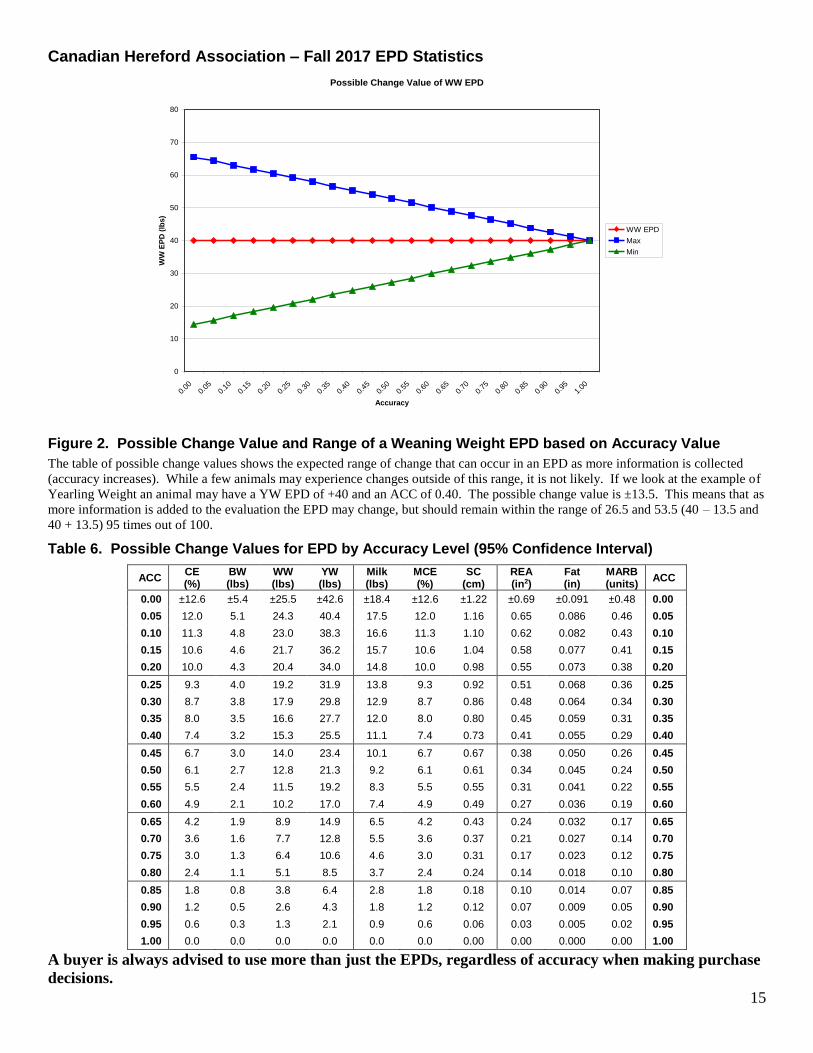
The graph shows the potential range of EPDs for WW for an animal with increasing accuracy. Consider each
point ♦ as a different animal. Every animal has a WW EPD of 40.0 lbs. As more information is added from
progeny and relatives the EPD may change to any point between the maximum ■ and the minimum ▲ values.
As the accuracy increases the potential change in the EPD is reduced. This is what is referred to as risk. A sire
with a low accuracy EPD, faces a higher risk that the EPD may change, because the EPD is based on less
information than an EPD with higher accuracy.
Canadian Hereford Association – Fall 2017 EPD Statistics
15
Figure 2. Possible Change Value and Range of a Weaning Weight EPD based on Accuracy Value
The table of possible change values shows the expected range of change that can occur in an EPD as more information is collected
(accuracy increases). While a few animals may experience changes outside of this range, it is not likely. If we look at the example of
Yearling Weight an animal may have a YW EPD of +40 and an ACC of 0.40. The possible change value is ±13.5. This means that as
more information is added to the evaluation the EPD may change, but should remain within the range of 26.5 and 53.5 (40 – 13.5 and
40 + 13.5) 95 times out of 100.
Table 6. Possible Change Values for EPD by Accuracy Level (95% Confidence Interval)
ACC CE (%)
BW (lbs)
WW (lbs)
YW (lbs)
Milk (lbs)
MCE (%)
SC (cm)
REA (in2)
Fat (in)
MARB (units)
ACC
0.00 ±12.6 ±5.4 ±25.5 ±42.6 ±18.4 ±12.6 ±1.22 ±0.69 ±0.091 ±0.48 0.00
0.05 12.0 5.1 24.3 40.4 17.5 12.0 1.16 0.65 0.086 0.46 0.05
0.10 11.3 4.8 23.0 38.3 16.6 11.3 1.10 0.62 0.082 0.43 0.10
0.15 10.6 4.6 21.7 36.2 15.7 10.6 1.04 0.58 0.077 0.41 0.15
0.20 10.0 4.3 20.4 34.0 14.8 10.0 0.98 0.55 0.073 0.38 0.20
0.25 9.3 4.0 19.2 31.9 13.8 9.3 0.92 0.51 0.068 0.36 0.25
0.30 8.7 3.8 17.9 29.8 12.9 8.7 0.86 0.48 0.064 0.34 0.30
0.35 8.0 3.5 16.6 27.7 12.0 8.0 0.80 0.45 0.059 0.31 0.35
0.40 7.4 3.2 15.3 25.5 11.1 7.4 0.73 0.41 0.055 0.29 0.40
0.45 6.7 3.0 14.0 23.4 10.1 6.7 0.67 0.38 0.050 0.26 0.45
0.50 6.1 2.7 12.8 21.3 9.2 6.1 0.61 0.34 0.045 0.24 0.50
0.55 5.5 2.4 11.5 19.2 8.3 5.5 0.55 0.31 0.041 0.22 0.55
0.60 4.9 2.1 10.2 17.0 7.4 4.9 0.49 0.27 0.036 0.19 0.60
0.65 4.2 1.9 8.9 14.9 6.5 4.2 0.43 0.24 0.032 0.17 0.65
0.70 3.6 1.6 7.7 12.8 5.5 3.6 0.37 0.21 0.027 0.14 0.70
0.75 3.0 1.3 6.4 10.6 4.6 3.0 0.31 0.17 0.023 0.12 0.75
0.80 2.4 1.1 5.1 8.5 3.7 2.4 0.24 0.14 0.018 0.10 0.80
0.85 1.8 0.8 3.8 6.4 2.8 1.8 0.18 0.10 0.014 0.07 0.85
0.90 1.2 0.5 2.6 4.3 1.8 1.2 0.12 0.07 0.009 0.05 0.90
0.95 0.6 0.3 1.3 2.1 0.9 0.6 0.06 0.03 0.005 0.02 0.95
1.00 0.0 0.0 0.0 0.0 0.0 0.0 0.00 0.00 0.000 0.00 1.00
A buyer is always advised to use more than just the EPDs, regardless of accuracy when making purchase
decisions.
Possible Change Value of WW EPD
0
10
20
30
40
50
60
70
80
0.00
0.05
0.10
0.15
0.20
0.25
0.30
0.35
0.40
0.45
0.50
0.55
0.60
0.65
0.70
0.75
0.80
0.85
0.90
0.95
1.00
Accuracy
WW
EP
D (
lbs)
WW EPD
Max
Min
Canadian Hereford Association – Fall 2017 EPD Statistics
16
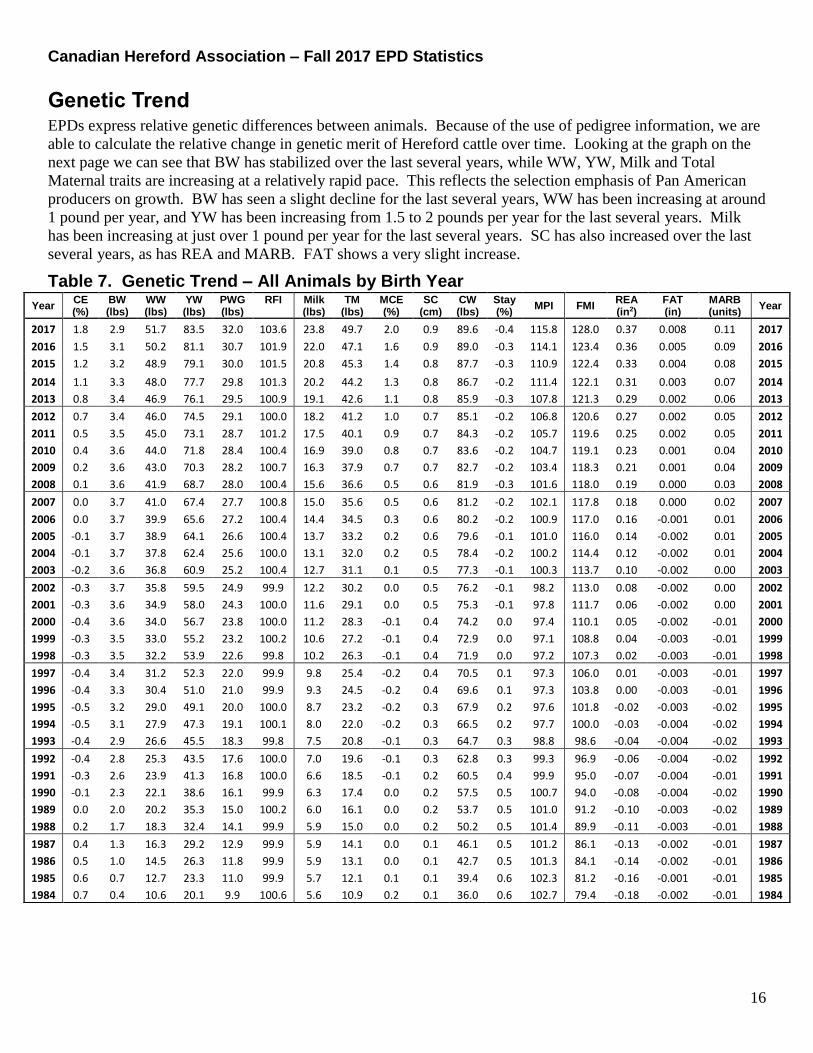
Genetic Trend EPDs express relative genetic differences between animals. Because of the use of pedigree information, we are
able to calculate the relative change in genetic merit of Hereford cattle over time. Looking at the graph on the
next page we can see that BW has stabilized over the last several years, while WW, YW, Milk and Total
Maternal traits are increasing at a relatively rapid pace. This reflects the selection emphasis of Pan American
producers on growth. BW has seen a slight decline for the last several years, WW has been increasing at around
1 pound per year, and YW has been increasing from 1.5 to 2 pounds per year for the last several years. Milk
has been increasing at just over 1 pound per year for the last several years. SC has also increased over the last
several years, as has REA and MARB. FAT shows a very slight increase.
Table 7. Genetic Trend – All Animals by Birth Year
Year CE (%)
BW (lbs)
WW (lbs)
YW (lbs)
PWG (lbs)
RFI Milk (lbs)
TM (lbs)
MCE (%)
SC (cm)
CW (lbs)
Stay (%)
MPI FMI REA (in2)
FAT (in)
MARB (units)
Year
2017 1.8 2.9 51.7 83.5 32.0 103.6 23.8 49.7 2.0 0.9 89.6 -0.4 115.8 128.0 0.37 0.008 0.11 2017
2016 1.5 3.1 50.2 81.1 30.7 101.9 22.0 47.1 1.6 0.9 89.0 -0.3 114.1 123.4 0.36 0.005 0.09 2016
2015 1.2 3.2 48.9 79.1 30.0 101.5 20.8 45.3 1.4 0.8 87.7 -0.3 110.9 122.4 0.33 0.004 0.08 2015
2014 1.1 3.3 48.0 77.7 29.8 101.3 20.2 44.2 1.3 0.8 86.7 -0.2 111.4 122.1 0.31 0.003 0.07 2014
2013 0.8 3.4 46.9 76.1 29.5 100.9 19.1 42.6 1.1 0.8 85.9 -0.3 107.8 121.3 0.29 0.002 0.06 2013
2012 0.7 3.4 46.0 74.5 29.1 100.0 18.2 41.2 1.0 0.7 85.1 -0.2 106.8 120.6 0.27 0.002 0.05 2012
2011 0.5 3.5 45.0 73.1 28.7 101.2 17.5 40.1 0.9 0.7 84.3 -0.2 105.7 119.6 0.25 0.002 0.05 2011
2010 0.4 3.6 44.0 71.8 28.4 100.4 16.9 39.0 0.8 0.7 83.6 -0.2 104.7 119.1 0.23 0.001 0.04 2010
2009 0.2 3.6 43.0 70.3 28.2 100.7 16.3 37.9 0.7 0.7 82.7 -0.2 103.4 118.3 0.21 0.001 0.04 2009
2008 0.1 3.6 41.9 68.7 28.0 100.4 15.6 36.6 0.5 0.6 81.9 -0.3 101.6 118.0 0.19 0.000 0.03 2008
2007 0.0 3.7 41.0 67.4 27.7 100.8 15.0 35.6 0.5 0.6 81.2 -0.2 102.1 117.8 0.18 0.000 0.02 2007
2006 0.0 3.7 39.9 65.6 27.2 100.4 14.4 34.5 0.3 0.6 80.2 -0.2 100.9 117.0 0.16 -0.001 0.01 2006
2005 -0.1 3.7 38.9 64.1 26.6 100.4 13.7 33.2 0.2 0.6 79.6 -0.1 101.0 116.0 0.14 -0.002 0.01 2005
2004 -0.1 3.7 37.8 62.4 25.6 100.0 13.1 32.0 0.2 0.5 78.4 -0.2 100.2 114.4 0.12 -0.002 0.01 2004
2003 -0.2 3.6 36.8 60.9 25.2 100.4 12.7 31.1 0.1 0.5 77.3 -0.1 100.3 113.7 0.10 -0.002 0.00 2003
2002 -0.3 3.7 35.8 59.5 24.9 99.9 12.2 30.2 0.0 0.5 76.2 -0.1 98.2 113.0 0.08 -0.002 0.00 2002
2001 -0.3 3.6 34.9 58.0 24.3 100.0 11.6 29.1 0.0 0.5 75.3 -0.1 97.8 111.7 0.06 -0.002 0.00 2001
2000 -0.4 3.6 34.0 56.7 23.8 100.0 11.2 28.3 -0.1 0.4 74.2 0.0 97.4 110.1 0.05 -0.002 -0.01 2000
1999 -0.3 3.5 33.0 55.2 23.2 100.2 10.6 27.2 -0.1 0.4 72.9 0.0 97.1 108.8 0.04 -0.003 -0.01 1999
1998 -0.3 3.5 32.2 53.9 22.6 99.8 10.2 26.3 -0.1 0.4 71.9 0.0 97.2 107.3 0.02 -0.003 -0.01 1998
1997 -0.4 3.4 31.2 52.3 22.0 99.9 9.8 25.4 -0.2 0.4 70.5 0.1 97.3 106.0 0.01 -0.003 -0.01 1997
1996 -0.4 3.3 30.4 51.0 21.0 99.9 9.3 24.5 -0.2 0.4 69.6 0.1 97.3 103.8 0.00 -0.003 -0.01 1996
1995 -0.5 3.2 29.0 49.1 20.0 100.0 8.7 23.2 -0.2 0.3 67.9 0.2 97.6 101.8 -0.02 -0.003 -0.02 1995
1994 -0.5 3.1 27.9 47.3 19.1 100.1 8.0 22.0 -0.2 0.3 66.5 0.2 97.7 100.0 -0.03 -0.004 -0.02 1994
1993 -0.4 2.9 26.6 45.5 18.3 99.8 7.5 20.8 -0.1 0.3 64.7 0.3 98.8 98.6 -0.04 -0.004 -0.02 1993
1992 -0.4 2.8 25.3 43.5 17.6 100.0 7.0 19.6 -0.1 0.3 62.8 0.3 99.3 96.9 -0.06 -0.004 -0.02 1992
1991 -0.3 2.6 23.9 41.3 16.8 100.0 6.6 18.5 -0.1 0.2 60.5 0.4 99.9 95.0 -0.07 -0.004 -0.01 1991
1990 -0.1 2.3 22.1 38.6 16.1 99.9 6.3 17.4 0.0 0.2 57.5 0.5 100.7 94.0 -0.08 -0.004 -0.02 1990
1989 0.0 2.0 20.2 35.3 15.0 100.2 6.0 16.1 0.0 0.2 53.7 0.5 101.0 91.2 -0.10 -0.003 -0.02 1989
1988 0.2 1.7 18.3 32.4 14.1 99.9 5.9 15.0 0.0 0.2 50.2 0.5 101.4 89.9 -0.11 -0.003 -0.01 1988
1987 0.4 1.3 16.3 29.2 12.9 99.9 5.9 14.1 0.0 0.1 46.1 0.5 101.2 86.1 -0.13 -0.002 -0.01 1987
1986 0.5 1.0 14.5 26.3 11.8 99.9 5.9 13.1 0.0 0.1 42.7 0.5 101.3 84.1 -0.14 -0.002 -0.01 1986
1985 0.6 0.7 12.7 23.3 11.0 99.9 5.7 12.1 0.1 0.1 39.4 0.6 102.3 81.2 -0.16 -0.001 -0.01 1985
1984 0.7 0.4 10.6 20.1 9.9 100.6 5.6 10.9 0.2 0.1 36.0 0.6 102.7 79.4 -0.18 -0.002 -0.01 1984

Canadian Hereford Association – Fall 2017 EPD Statistics
17
Figure 2. Genetic Trend – All Animals by Birth Year (Fall 2017 Analysis)
-1.0
0.0
1.0
2.0
3.0
4.0
19
84
19
86
19
88
19
90
19
92
19
94
19
96
19
98
20
00
20
02
20
04
20
06
20
08
20
10
20
12
20
14
20
16A
vera
ge E
PD
(C
E, M
CE,
BW
, SC
, ST)
Year
Calving and Maternal Traits
CE BW
MCE SC
Stay
97.0
98.0
99.0
100.0
101.0
102.0
103.0
104.0
0.0
10.0
20.0
30.0
40.0
50.0
60.0
70.0
80.0
90.0
19
84
19
86
19
88
19
90
19
92
19
94
19
96
19
98
20
00
20
02
20
04
20
06
20
08
20
10
20
12
20
14
20
16
Ave
rage
RFI
Ave
rage
EP
D (
WW
, YW
, PW
G, M
ilk,
TMI)
Year
Growth Traits
WW YW PWG
Milk TM RFI
0.0
20.0
40.0
60.0
80.0
100.0
120.0
140.0
-0.30
-0.20
-0.10
0.00
0.10
0.20
0.30
0.40
19
84
19
86
19
88
19
90
19
92
19
94
19
96
19
98
20
00
20
02
20
04
20
06
20
08
20
10
20
12
20
14
20
16
Ave
rage
FM
I
Ave
rage
EP
D (
REA
, Fat
, Mar
b)
Year
Carcass Traits
REAFATMARB
85.0
90.0
95.0
100.0
105.0
110.0
115.0
120.0
-10.0
0.0
10.0
20.0
30.0
40.0
50.0
60.0
70.0
80.0
90.0
100.01
98
4
19
86
19
88
19
90
19
92
19
94
19
96
19
98
20
00
20
02
20
04
20
06
20
08
20
10
20
12
20
14
20
16
Ave
rage
MP
I
Ave
rage
EP
D (
CE,
MC
E, W
W, M
ilk,
MC
W, S
tay)
Year
MPI and Component Traits
CE WW
Milk MCE
MCW Stay
MPI