Embed Size (px)
Citation preview

Canadian FusionFuel TechnologyProject
THE CANADIAN FUSION FUEL TECHNOLOGY PROJECT REPRESENTS PART OFCANADA'S OVERALL EFFORT IN FUSION DEVELOPMENT. THE FOCUS FOR CFFTPIS TRITIUM AND TRITIUM TECHNOLOGY. THE PROJECT IS FUNDED BY THEGOVERNMENTS OF CANADA AND ONTARIO, AND BY THE UTILITY ONTARIOHYDRO; AND IS MANAGED BY ONTARIO HYDRO.
CFFTP WILL SPONSOR RESEARCH, DEVELOPMENT, DESIGN AND ANALYSIS TOEXTEND EXISTING EXPERIENCE AND CAPABILITY GAINED IN HANDLING TRITIUM ASPART OF THE CANDU FISSION PROGRAM. IT IS PLANNED THAT THIS WORK WILL BEIN FULL COLLABORATION AND SERVE THE NEEDS OF INTERNATIONAL FUSIONPROGRAMS.
Application of the|Water Gas Shift
Reaction to Fusion FuelExhaust Streams
Report No. F83017
October 1983

Prepared by:
Reviewed by:
/A.M. McKay, M.A.Sc. P. Eng.Ontario HydroChemical Research Department
D.P. DautovichManager, Technology DevelopmentCanadian Fusion Fuels TechnologyProject
Approved by :
T.S. DroletProgram ManagerCanadian Fusion Fuels TechnologyProject
LIST OF CONTRIBUTORS
This report has been prepared under contract to the Canadian
Fusion Fuel Technology Project by:
A.M. McKay, M.A.Sc. P. Eng. , Ontario Hydro,
Chemical Research Department
C.H. Cheh, PhD. P. Eng., Ontario Hydro
Chemical Research Department
R.W. Glass, PhD. P. Eng., Ontario Hydro
Chemical Research Department

ACKNOWLEDGEMENTS
I would like to acknowledge the contributions made by Drs R.W.
Glass and C.H. Cheh in submitting the proposal, initiating the
study and providing helpful discussions and critical comment
throughout the study. I would also like to thank R.A. Currie
for carrying out the experiments, and CFFTP and Ontario Hydro
for supporting this project.
PREFACE
During the last ten years there has been an acceleration in
international efforts to demonstrate the technical feasibility
of producing energy from fusion reactions. Current efforts are
concentrated in the USA, Europe, USSR and Japan. Emphasis is
being placed on larger scale experiments (JET, TFTR) to refine
designs based on smaller scale experiments and also to include
more of the practical needs of any commercial fusion reactor.
The deuterium-tritium reaction has been selected as the most
promising fuel for first generation fusion reactors. The large
tritium inventory and tritium handling requirements pose a major
safety concern with such systems. Consequently, safety analyses
of fusion reactors and reactor support systems have had a major
impact on designs to attempt to: reduce tritium inventories,
minimize "leaky designs", minimize tritiated waste volumes, and
reduce man-rem exposure by designing for reduced maintenance.
The need for large scale experimental facilities to address the
tritium handling concerns has been expressed by the European
fusion researchers/1/. The USA efforts at TSTA and at TFTR
Princeton are large and well advanced. In particular, the TSTA
facility currently being completed at Los Alamos has been speci-
fically designed to develop and demonstrate tritium handling
technology needed for large scale fusion power reactors. The
facility has been designed to safely handle up to 1.5 x 10⁶ Ci
'tium, and emphasis will be placed on component reliability,
process development, and technology demonstration.
The main purpose of the TSTA Fuel Clean-up System is to first
remove impurities from a stream typical of fusion reactor
exhaust and neutral beam line gases and then to recover and
recycle tritium from this stream back into the simulated fuel
-in -

cycle. The compositions and concentrations of these gases are
not known but have been estimated/2/. The work described in
this report deals with a tritium recovery system typical of the
TSTA Fuel Clean-Up System. The contract was awarded in response
to RFP #FS-0682-1410-0000.
The goal of this contract was to develop an alternative method
of tritium recovery since the existing hot metal beds used at
TSTA result in high tritium inventories, high operating costs,
and significant volumes of tritiated wastes. To achieve that
goal, we chose to develop a full scale catalytic reactor that
will reduce tritiated water to tritium via the "water gas shift
reaction". Catalytic reactors were built and tested under
various conditions and a full scale prototype has been designed
to meet TSTA operating conditions. .
- lv -
TABLE OF CONTENTS
Pacte
1.0 EXECUTIVE SUMMARY 1
2.0 INTRODUCTION 2
3.0 BACKGROUND 4
3.1 TSTA Fuel Clean Up System 4
3.2 Alternative Process Requirements 6
3.3 Water-Gas Shift Reactors 7
4.0 DETAILED PRESENTATION 9
4.1 Experimental Program 9
4.2 Experimental Procedure and Apparatus 10
4.2.1 Reactant Delivery System 12
4.2.2 Catalytic Reactor 14
4.2.3 Catalyst 18
4.2.4 Analytic Instrumentation 18
4.3 Results and Discussion 18
4.3.1 Reactant Delivery System 18
4.3.2 Catalytic Reactor Performance 19
4.3.3 Upset Conditions 24
4.3.4 Isotope Effects 25
4.3.5 Hydrogen Isotope Permeation Through
the Reactor 26
4.3.6 Tritium Inventory in Reactor 27
4.4 Full Scale Prototype Reactor Design
for FCU System Implementation 27
4.4.1 Specifications 28
4.4.2 Fuel Clean Up System Application
Example 32

TABLE OF CONTENTS (cont'd)
Page
5.0 CONCLUSIONS 32
6.0 RECOMMENDATIONS 34
REFERENCES , 35
APPENDICES
A CATALYST COMPOSITION AND ACTIVATION.PROCEDURE 37
B TYPICAL H2O TO H2 CONVERSION AND C0/H2O
CALCULATIONS 4 0
C CALCULATIONS OF ISOTOPE EFFECTS ON EQUILIBRIUM
CONVERSION 42
D H ISOTOPE PERMEATION CALCULATIONS 43
E H ISOTOPE SOLUBILITY AND INVENTORY CALCULATIONS 44
- vi -
LIST OF FIGURES
Page
1. TSTA Fuel Clean-Up System Flow Sheet Using Heavy
Metal Reds 5
2. Catalytic Reactor Test System 11
3. Reactant Delivery Systems 13
4. Preliminary Catalytic Reactor 15
5. Prototype Catalytic Reactor 16
6. Prototype Catalytic Reactor System 17
7. Theoretical and Experimental Conversions of H?.O to
H2 in Preliminary Reactor 20
8. Theoretical and Experimental Conversions of H2O to
H2 in Prototype Reactor 22
9. Catalytic Reactor Design Which Meets TSTA
Specifications 29
10. Fuel Clean Up System Example: TSTA 33
- vii -

LIST OF TABLES
Table Page
1. Water Gas Shift Reaction Equilibria Constants at
Different Temperatures 7
2. Experimental Parameters 10
3. Isotope Effect on Water-Gas Shift Reactionat 195°C 26
- vin -

1.0 EXECUTIVE SUMMARY
In a Fusion Fuel Clean Up (FCU) system, impurities will be
removed from the fusion reactor exhaust and neutral beam line
streams. Tritium in this impurity stream will be recovered and
recycled to the fuel stream. In one flowsheet configuration of
bhe Tritium Systems Test Assembly (TSTA), tritium is recovered
from a simulated impurity stream via uranium hot metal beds and
recycled to an isotope separation system. This study has shown,
however, that the catalyzed water gas shift reaction, by which
(H,D,T)2O and CO are converted to (H,D,T)2 and CO2 is a better
method of (H,D,T)2O reduction than the hot metal beds.
Catalytic reactors were designed, built and tested to provide
data for the design of a prototype reactor to replace the hot
metal beds in the FCU system. The prototype reactor contains
only 10 g of catalyst and is expected to last at least 5 years.
The reactor is small (1.3 cm OD x 13 cm long), operates at low
temperatures (~490 K) and will convert water to hydrogen, at a
CO/H2O ratio of 1.5, with an efficiency of greater than 98%.
Results show that the catalytic reactor is very stable even
during upset conditions. Wide ranges of flow and a CO/H2O
ratio variance from 1.3 upward have little effect on the
conversion efficiency.
Short term high temperature excursions do not affect the cata-
lyst and lower temperatures will simply decrease the reaction
rate resulting in lower conversions. The reactor appears to be
unaffected by NO2, CO2, O2 and N2 in the feed stream at concen-
tration levels expected in a fusion reactor exhaust stream.
- 1 -
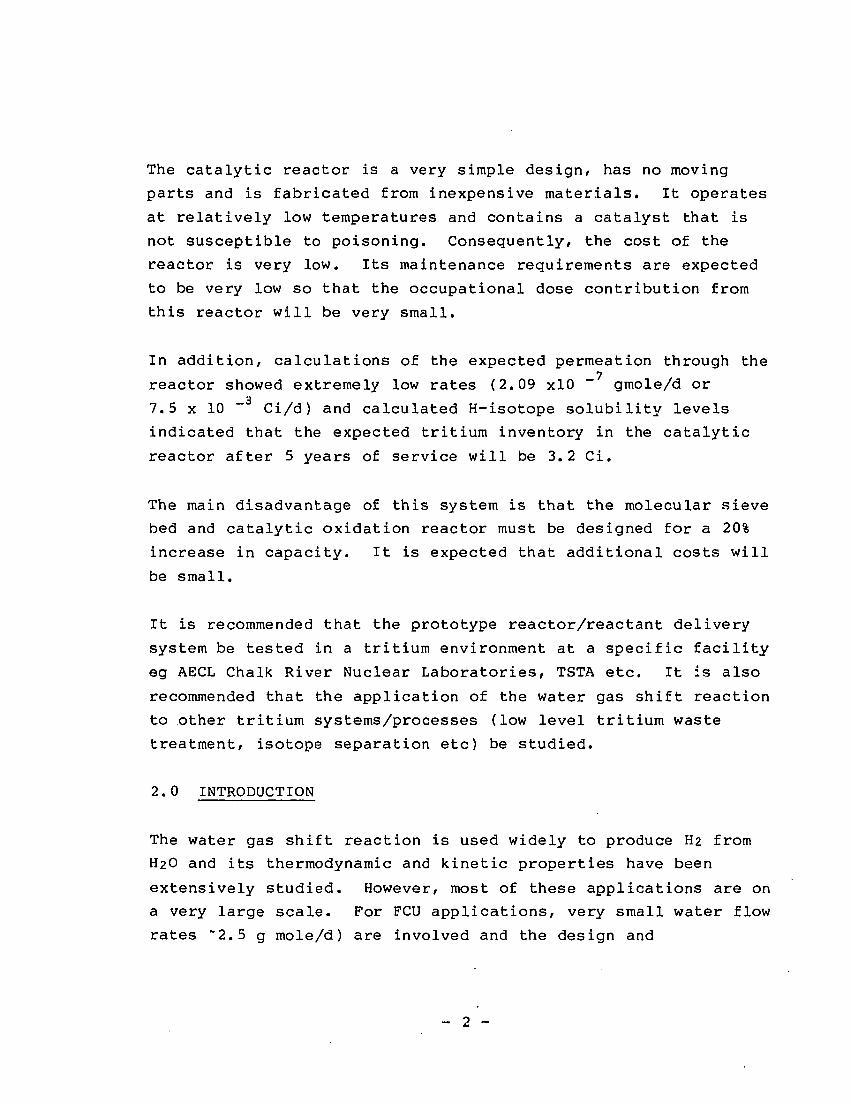
The catalytic reactor is a very simple design, has no moving
parts and is fabricated from inexpensive materials. It operates
at relatively low temperatures and contains a catalyst that is
not susceptible to poisoning. Consequently, the cost of the
reactor is very low. Its maintenance requirements are expected
to be very low so that the occupational dose contribution from
this reactor will be very small.
In addition, calculations of the expected permeation through the
reactor showed extremely low rates (2.09 xlO ~ gmole/d or
7.5 x 10 Ci/d) and calculated H-isotope solubility levels
indicated that the expected tritium inventory in the catalytic
reactor after 5 years of service will be 3.2 Ci.
The main disadvantage of this system is that the molecular sieve
bed and catalytic oxidation reactor must be designed for a 20%
increase in capacity. It is expected that additional costs will
be small.
It is recommended that the prototype reactor/reactant delivery
system be tested in a tritium environment at a specific facility
eg AECL Chalk River Nuclear Laboratories, TSTA etc. It is also
recommended that the application of the water gas shift reaction
to other tritium systems/processes (low level tritium waste
treatment, isotope separation etc) be studied.
2.0 INTRODUCTION
The water gas shift reaction is used widely to produce H2 from
H2O and its thermodynamic and kinetic properties have been
extensively studied. However, most of these applications are on
a very large scale. For FCU applications, very small water flow
rates ~2.5 g mole/d) are involved and the design and

susceptibility of the system to upset conditions at this scale
is critical for the extremely high activity levels involved
(90 000 Ci/d).
In this study, emphasis was placed on experimental studies of
the different reactant delivery systems, optimization of the
reactor design and studies of the influences of upset conditions
on the overall system.
Research on the water gas shift reaction with respect to its
application in FCU systems is also being performed by the
Japanese Atomic Energy Research Institute (JAERI). In their
design, the catalyzed water gas shift reaction is part of a
batch operated closed loop system with (H,D,T)2 removal by
palladium diffusers/3/. The system discussed in this report
uses only pure reactants and recycles the (H,D,T)2 to the
molecular sieve bed operating at 75 K for impurity removal
eliminating the requirement for palladium diffusers. Thé
requirements of the JAERI system and thus their research object-
ives are different from the continuous operation system proposed
in this report.
This report discusses the design and testing of catalytic water
gas shift reactors which may be applicable to the FCU system at
TSTA and to other tritium removal facilities.
Tests were conducted to optimize the catalyst particle size and
bed depth, the operation temperatures, and the optimum ratio of
reactants (CO and H2O) for conversion of H2O to H2. The effects
of isotopes and contaminants, and estimates of tritium perme-
ability and solubility are also discussed. Finally, a design of
a full scale prototype catalytic reactor that can process highly
tritiated water at the same flow rate as at TSTA, is presented.
— 3 —
3.0 BACKGROUND
3.1 TSTA Fuel Clean Up System
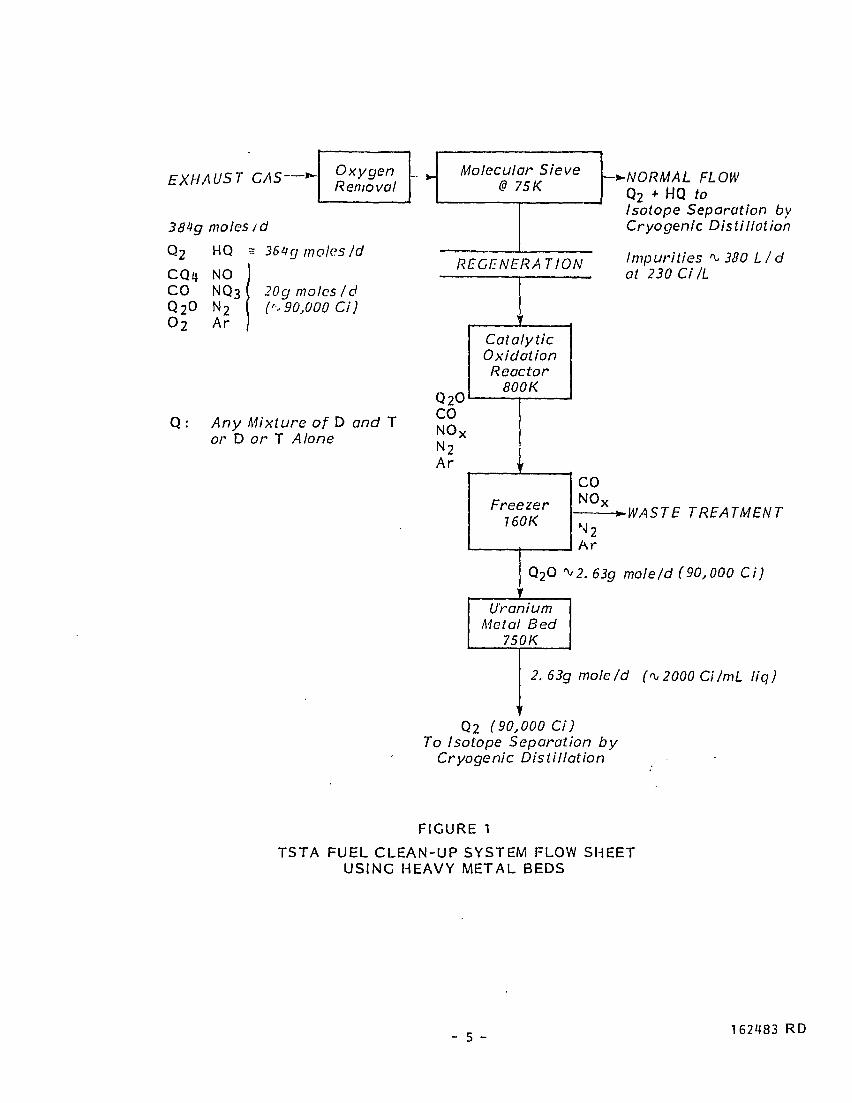
The main purpose of this system is to first remove impurities
from simulated reactor exhaust and neutral beam line gases and
then to recover and recycle tritium from this stream (the tri-
tium would normally be returned to the fuel cycle). The compos-
itions and concentrations of these gases have been estimated/2/
and are summarized in Figure 1. This figure shows only one of
the two clean-up flowsheets to be demonstrated at TSTA but is
the only one to which the water gas shift reaction is applica-
ble.
In this flow sheet, free oxygen in the exhaust gases is first
removed by catalytic reaction with H/D/T over a 'DEOXO' type
catalyst at 450 K. Essentially all impurities are then removed
by a freezer/dryer containing a 5 A molecular sieve bed operated
at 75 K. The product gas is suitable for cryogenic distillation
in the isotope separation unit. Regeneration of the molecular
sieve produces an impurity stream that is passed through a
catalytic oxidizer at 800 K to oxidize to DTO any tritium bound
to carbon or nitrogen. This stream is then passed through a
freezer operated at 160 K to trap the tritiated water and the
non-tritiated gases pass to the Tritium Waste Treatment system
for trace tritium removal before being passed to the stack.
The DTO in the freezer is evaporated periodically (typically
once a day) and decomposed by a uranium hot metal bed (750 K) to
hydrogen isotopes before being recycled to the isotope separa-
tion unit. Oxygen, carbon, nitrogen etc form stable oxides,
carbides and nitrides and are removed when the hot metal beds
are exhausted.
- 4 -
EXHAUST CAS~ OxygenRemoval
Q2
moles id
HQ s 36tg moles/d
NOCO NQ3
Q2O N2
O 2 Ar
20g moles Id("'90,000 Ci)
Q : Any Mixture of D and Tor D or T Alone
Molecular Sieve@ 75K
-NORMAL FLOWQ2 + HQ toIsotope Separation byCryogenic Distillation
REGENERATION Impuritiesat 230 Ci IL
380 Lid
Q2OCONOX
N2Ar
CatalyticOxidationReactor
800K
FreezerT6OK
CONOX
•^WASTE TREATMENTM 2Ar
Q2O *2. 63g mole Id (90,000 Ci)
UraniumMetal Bed
750K
2. 63g mote Id (^2000 Ci imL liq)
Q2 (90,000 Ci)To Isotope Separation by
Cryogenic Distillation
FIGURE 1
TSTA FUEL CLEAN-UP SYSTEM FLOW SHEETUSING HEAVY METAL BEDS
— 5 ~162483 RD

The major concern with this flow sheet is that the uranium metal
beds are contaminated with tritium, are relatively costly, and
have to be replaced frequently resulting in potentially high
radiation doses to operating staff. Moreover/ system upset
conditions will result in a rapid reduction of the useful life-
time of the uranium metal beds as a result of the reaction of
impurities with uranium. A final concern with the beds is the
fact that they operate at relatively high temperatures with a
highly concentrated tritium gas stream. At 750 K, some perme-
ation of the tritium through the getter bed wall will occur.
Although this permeation can be contained by design, it is a
complication.
3.2 Alternative Process Requirements
There is a wide range of homogeneous and heterogeneous solid,
liquid and gas phase reactions that can be used to remove dif-
ferent forms of tritium from liquid and gaseous streams. How-
ever, the criteria described below severely restrict the number
of feasible reactions that possess significant advantages over
the present TSTA flowsheets. It is desirable that any new
system
a) be safe
b) have a low inventory of tritium
c) have low maintenance requirements (primarily to reduce
occupational radiation dose)
d) not be susceptible to system upset condition
e) be a demonstrated technology
- 6 -

f) be a readily controlled process
g) have low volumes of tritiated wastes.
One particular process meets all of these criteria. This pro-
cess is the water-gas shift reaction.
3.3 Water-Gas Shift Reaction
The classic water-gas shift reaction is:
CO + H2O ^ CO2 + H2 AH = -17930 J/gmole at 530 K (1)
The technology of this reaction has been highly developed since
its very early conception. It has been used for many years and
many studies have been made of the kinetics and mechanisms of
the reaction/4,5,6/. It is a simple exothermic reaction that
involves no volume change. Equilibrium is unaffected by
pressure and side reactions are negligible. It is promoted in
the presence of catalysts and in fact was one of the earliest
applications of catalysis.
Values for the equilibrium constant for the reaction at dif-
ferent temperatures are shown in Table 1 and clearly show that
the reaction is favoured by lower temperatures.
TABLE 1WATER-GAS SHIFT REACTION EQUILIBRIUM CONSTANTS
AT DIFFERENT TEMPERATURES
TemperatureK
448458468478493498533548
Kp
4493552842291681527863
P PCO2« H2
P • PCO H2O
.3
.6
.0
.2
- 7 -

However, the reaction rate increases with increasing temperature
although catalyst life is shorter at higher temperatures. Thus,
the CO conversion system must be operated at the minimum temper-
ature to obtain a practical equilibrium constant, but at a
temperature high enough to provide a satisfactory reaction rate
without appreciably decreasing the catalyst activity and thus
life. Three types of catalyst have been developed to promote
the CO shift reaction and all are commercially available. These
catalysts are characterized primarily by the temperature range
in which each operates. The high temperature shift catalyst,
consists of primarily Fe2Û3 promoted with Cr2Û3 and operates in
the range 620 to 820 K. The low temperature shift catalyst
consists of CuO and ZnO on an alumina support. The effective
temperature range is 470 to 520 K. Industrial experience has
shown that an inlet gas temperature of about 670 K with a cata-
lyst bed temperature of about 490 K is optimal. This catalyst
was developed about 1962 and its capabilities have been well
established. The medium temperature shift catalyst requires the
presence of sulphur in the gas stream to maintain satisfactory
operation and consequently is not applicable to the present
system.
Both the low and high temperature catalysts require an initial
activation step by heating in a reducing atmosphere, and there-
after oxygen should be avoided in the inlet stream since its
reaction with the reduced catalyst is strongly exothermic.
Sulphur and chlorine will permanently poison the low temperature
catalyst. In typical commercial applications with sulphur and
chlorine contaminated inlet streams, lifetime of the low
temperature shift catalyst is in the order of two to five
years. In the few applications where the inlet streams are
pure, catalyst lifetime is unknown, but appears to be greater
than ten years.
- 8 -
4.0 DETAILED PRESENTATION
4.1 Experimental Program
The objectives of the experimental program were to determine
design and operational parameters for a prototype catalytic
water gas shift reactor that could be interfaced with an FCU
system such as TSTA, and to outline the operational, mainte-
nance, waste disposal, and radiation exposure characteristics of
the water gas shift reactor.
The experimental program is described below:
1. Design, assemble and test a catalytic water gas shift
reactor.
2. Optimize the performance of the reactor with respect to
a. gas flow rate (space velocity)
b. CO/H2O stoichiometric ratio
c. reactor temperature
d. catalyst (low temperature shift)
i volume
ii bed height
iii particle size
3. From the preliminary results of 1 and 2, build a prototype
reactor and test performance.
4. Determine the effects of temperature excursions, flow
interruptions, and contaminants.
From the results of the above experimental program, the design
of a full scale catalytic water gas shift reactor for a FCU
- 9 -
system was developed. In addition, (H,D,T)2 uptake by the
catalyst and reactor, and (H,DfT)2 permeation rates through the
reactor were estimated.
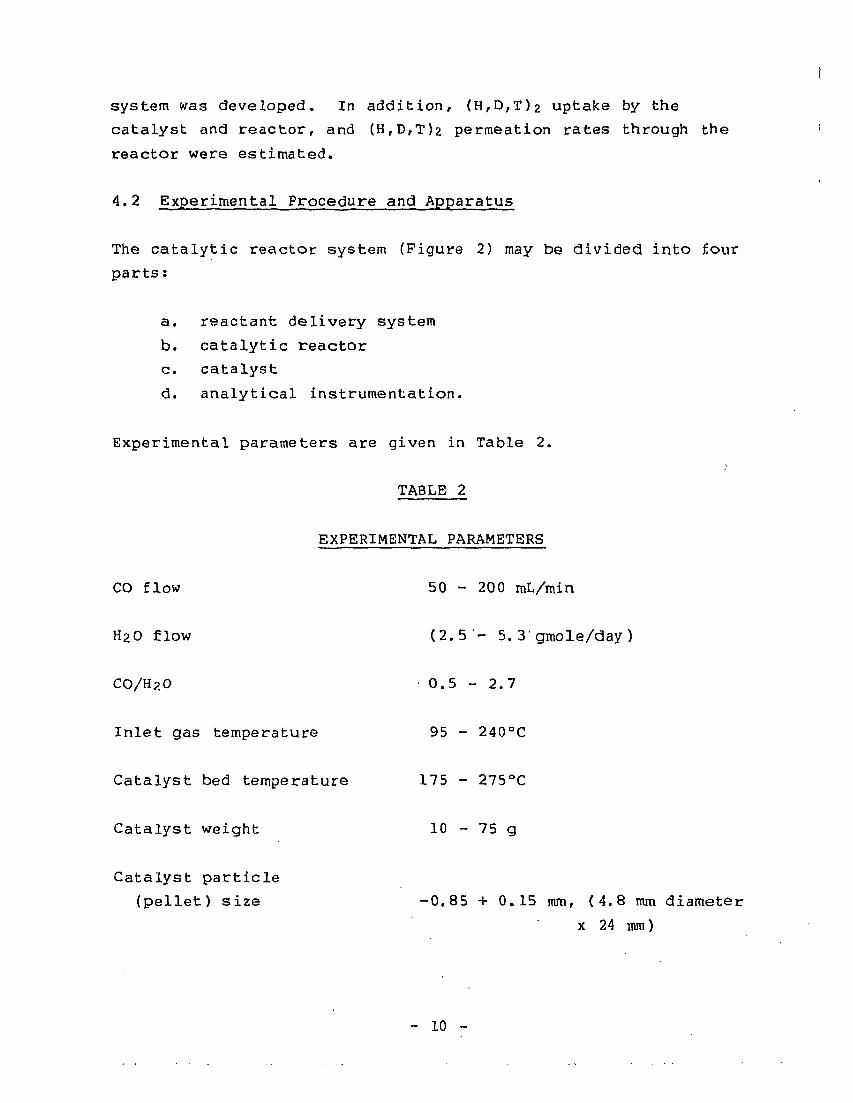
4.2 Experimental Procedure and Apparatus
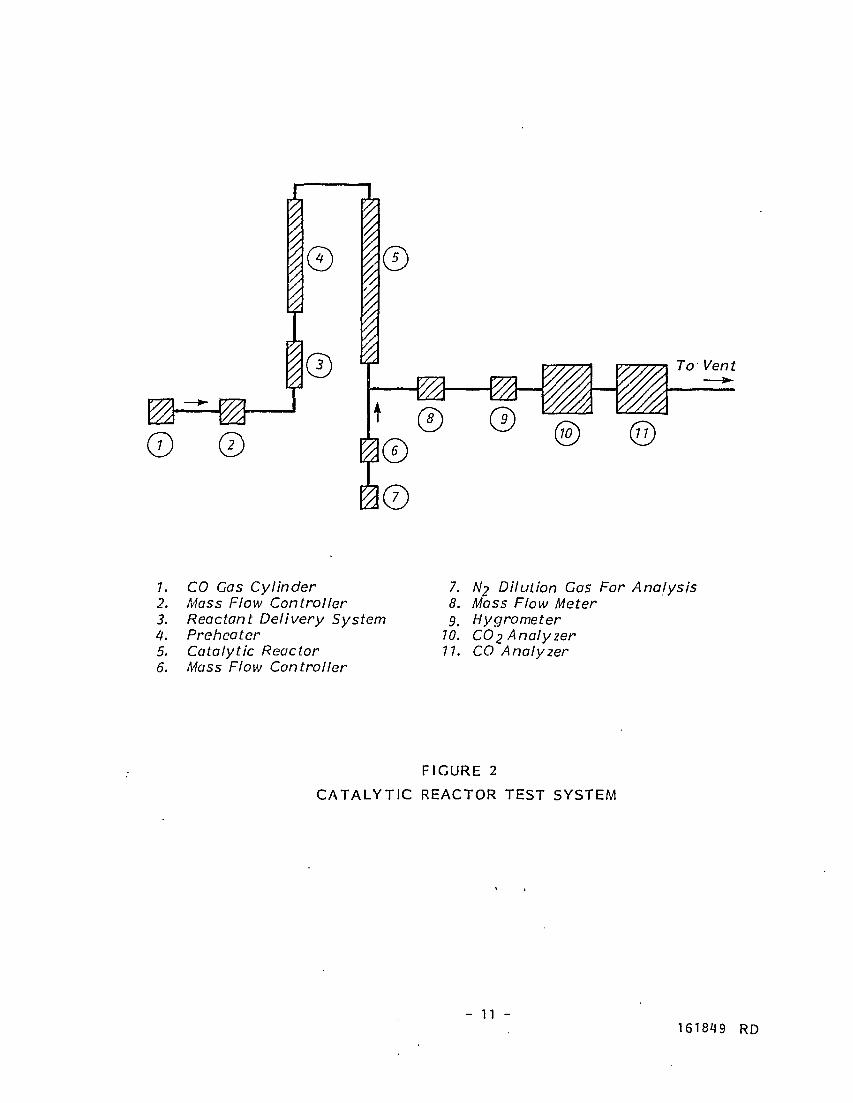
The catalytic reactor system (Figure 2) may be divided into four
parts:
a. reactant delivery system
b. catalytic reactor
c. catalyst
d. analytical instrumentation.
Experimental parameters are given in Table 2.
TABLE 2
EXPERIMENTAL PARAMETERS
CO flow
H20 flow
CO/H?.0
Inlet gas temperature
Catalyst bed temperature
Catalyst weight
Catalyst particle
(pellet) size
50 - 200 mL/min
(2.5 - 5. 3 gmole/day )
0.5 - 2.7
95 - 240°C
175 - 275°C
10 - 75 g
-0.85 + 0.15 mm, (4.8 mm diameter
x 24 mm)
- 10 -
To Vent
7. CO Cas Cylinder 7.2. Mass Flow Controller 8.3. Reactant Delivery System g.4. Preheater 70.5. Catalytic Reactor 7 7.6. Mass Flow Controller
N2 Dilution Cas For AnalysisMass Flow MeterHygrometerCO2 AnalyzerCO Analyzer
FIGURE 2
CATALYTIC REACTOR TEST SYSTEM
- 11 -161849 RD

TABLE 2 cont'd
Contaminants 101 ML/L NO2
4% O2
15% N2
55 ML/L
4.2.1 Reactant Delivery System
Schematics of; both the steam generation and bubbler reactant
delivery systems are illustrated in Figure 3. In each system, a
75 mL 316SS sampling cylinder was used for water storage and the
CO flow rate was controlled by a mass flow controller. In the
steam generation reactant delivery system, water was heated to
slightly below 373 K and the water vapour allowed to diffuse
through a control valve into the CO stream. The CO/H2O ratio
was controlled by the water temperature in the steam generator
and by the metering valve. In the bubbler delivery system CO
was bubbled through water that was heated to 350-355K. The
final H2O vapour concentration or CO/H2O ratio was a function of
the water temperature, CO flow rate and the water level in the
bubbler but was controlled by the water temperature.
It should be noted that the reactant delivery systems tested
were designed primarily for this particular experimental work.
Implementation into an existing FCU experimental setup such as
that at TSTA would require some modification.
Since the dew point of a CO/H2O stream with a CO/H2O ratio of 1
to 1.5 varies between 350 and 357 K, the line connecting the
bubbler to the reactor was heated to between 383 and 393 K to
prevent condensation. A "preheater" was fabricated from
0.3175 cm (1/8") tubing coiled into a 3.81 cm tube which was
filled with alumina. The assembly was heated to the reactor
inlet temperature by a 400 W band heater. Heating tape on all
connecting tubing ensured that the process gas was heated to at
least 30 K above the dew point.
- 12 -

Preheat CO CO/H2O to Reactor
Wrap AroundHeater Tape
Band Heater(500 W)
75 ml SampleCylinder
ControllingThermocouple
H2O Diffuses Into CO Gas Stream
7. Steam Generation
moo
73V
Controlling Thermocouple
•CO/H2O to Reactor
Wrap Around Heater Ta;
•— Band Heater (500W)
Stainless Steel Frit
75 ml Sample Cylinc'?'
CO Bubbles Through Preheated H2OCO /H2O Dependent on H2O Temperature
2. CO Bubbler
FIGURE 3
REACTANT DELIVERY SYSTEMS

4.2.2 Catalytic Reactor
The preliminary (large) catalytic reactor (Figure 4) consisted
of an 80 cm length of copper pipe (2.67 cm OD, 2.09 cm ID) with
threaded end caps. Inlet and outlet tubes were silver soldered
into the end caps. Thermocouples were inserted and cemented in
several places to control and monitor the temperature throughout
the reactor. The top half of the reactor was packed with steel
wool to enhance heat transfer to the process gas and the cata-
lyst was inserted in the lower half of the reactor, held in
place with steel wool and wire mesh. In one series of experi-
ments 75 g (~14 cm bed depth) of the 'as received1 catalyst
was used. In the second set of experiments, 25 g (~5 cm bed
depth) of crushed catalyst (-0.85 mm + 0.15 mm) was used. The
reactor was heated by ten 100 W band heaters, the top five and
bottom five being controlled by separate temperature control-
lers.
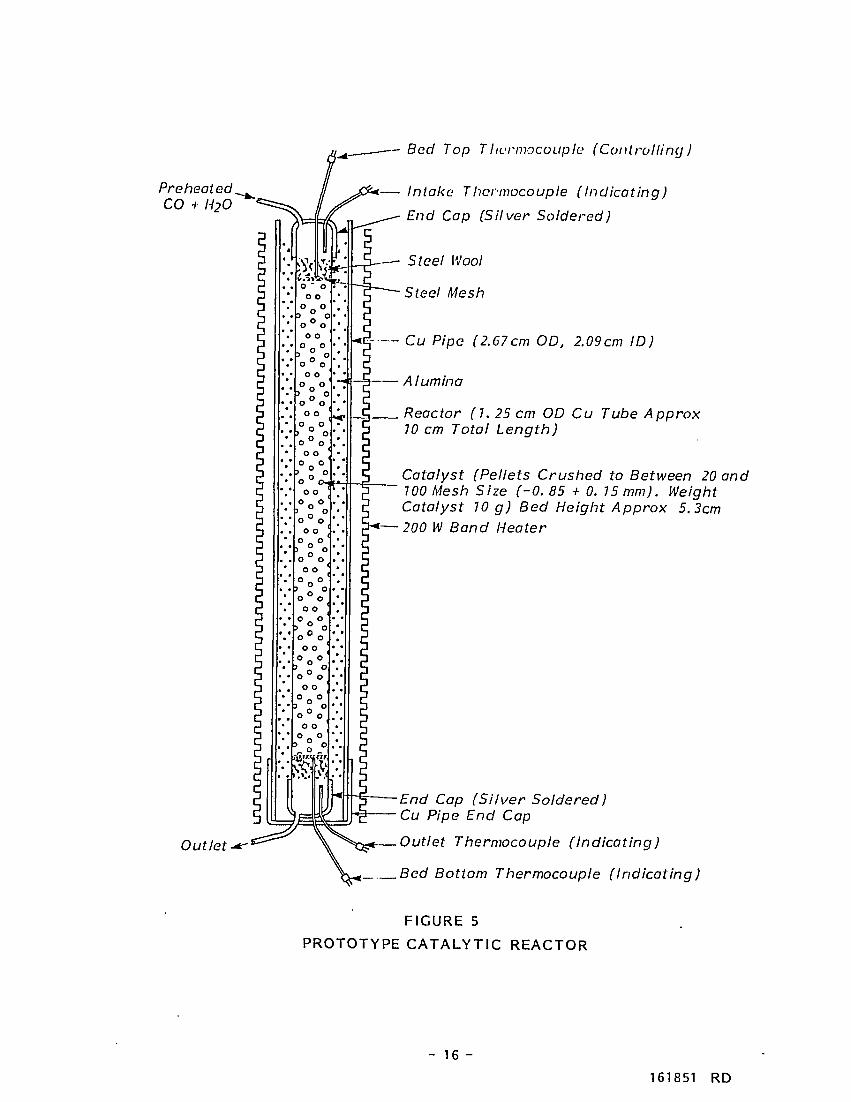
A prototype reactor (Figures 5,6) was built and tested. All
reactor components were made of copper except for stainless
steel thermocouples and stainless steel wire mesh and wool which
supported the 8 cm deep catalyst bed. Ten grams of the crushed
catalyst (-0.85 mm + 0.15 mm size) was used in all runs. All
joints were silver soldered and the reactor was pressure tested
to 170 kPa (10 psig) to check for leaks. Figure 6 shows the
complete system as it was tested. The steam generator was con-
nected to the bottom of the reactor to minimize the possibility
of liquid water carryover into the reactor.
The prototype reactor was inserted in a piece of copper pipe
(2.67 cm OD, 2.09 cm ID) filled with alumina and capped at both
ends to provide a large heat sink to counteract potential
thermal excursions.
- 14

CO, H2° -i
Wrap AroundHeater Tape
Band Healers-<
CatalystBand Heaters-((500W Total)
C02, H2CO, H20~<-
To Hygrometer
Inlet Thermocouple
Reactor Copper Pipe(2.67cm OD, 2.09cm ID)with Threaded End Caps
Steel Wool
Catalyst Bed Thermocouples
Catalyst Bed (2.50 cm Bed Width,15.20 cm Bed Height, 75 g Catalyst)
Outlet Thermocouple
FIGURE 4
PRELIMINARY CATALYTIC REACTOR
- 15 - 161850 RD
Preheated.CO + H2O
Outlet-
oo ° oo o
00
o o
so " oo o
o o
— Bed Top Thcrmocouple (Controlling)
Intake Thcrmocouple (Indicating)
End Cap (Silver Soldered)
Steel Wool
Steel Mesh
S--— Cu Pipe (2.67cm OD, 2.09cm ID)
—5 Alumina
Reactor (1. 25 cm OD Cu Tube ApproxW cm Total Length)
Catalyst (Pellets Crushed to Between 20 andWO Mesh Size (-0. 85 + 0. 15 mm). WeightCatalyst 10 g) Bed Height Approx 5.3cm200 W Band Heater
•End Cap (Silver Soldered)• Cu Pipe End Cap
Outlet Thermocouple (Indicating)
Bed Bottom Thermocouple (Indicating)
FIGURE 5
PROTOTYPE CATALYTIC REACTOR
- 16 -
161851 RD
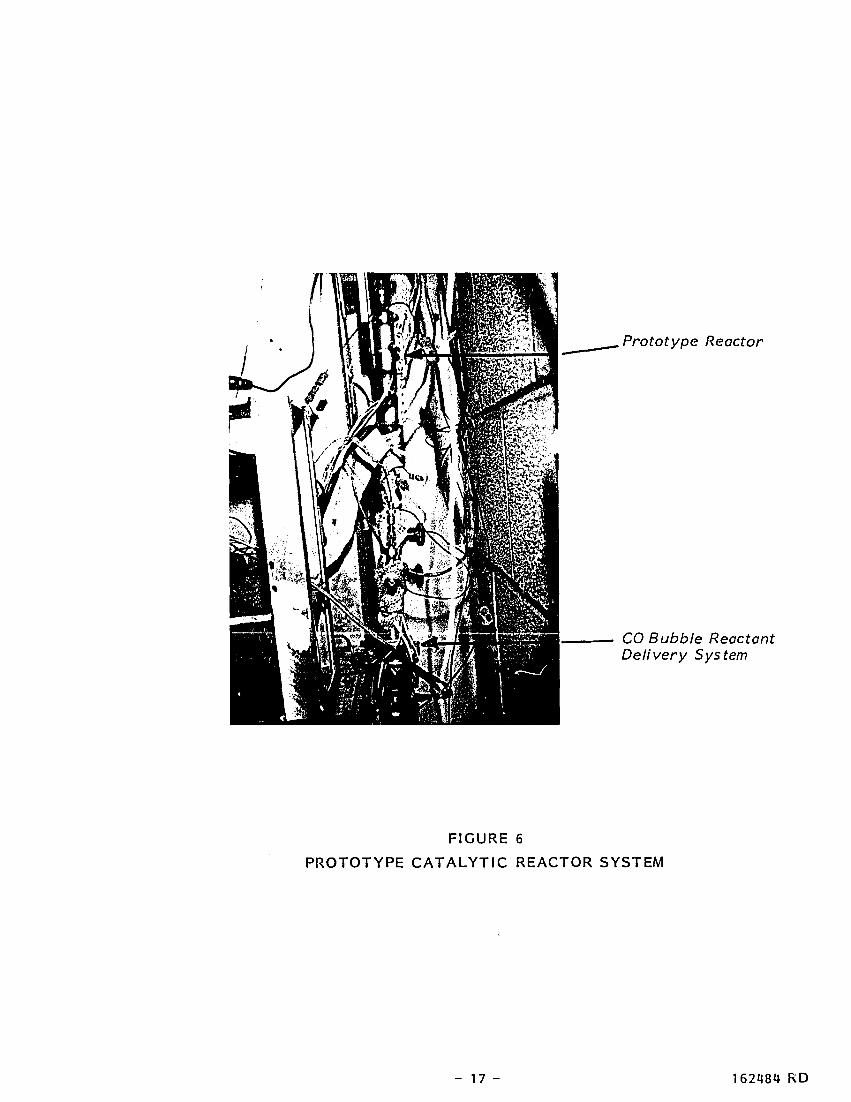
Prototype Reactor
CO Bubble ReactantDelivery System
FIGURE 6
PROTOTYPE CATALYTIC REACTOR SYSTEM
- 17 - 162484 RD
4.2.3 Catalyst
The low temperature CO shift catalyst was chosen to minimize H2
permeation through the reactor wall. This catalyst was composed
of CuO-ZnO on alumina, and was manufactured by United
Catalysts. Pellet size was 4.8 mm diameter x 2.4 mm. Catalyst
composition is given in Appendix A. The catalyst was crushed
and screened to particle size range of -0.85 nun + 0.15 mm. The
catalyst activation procedure suggested by the manufacturer
(Appendix A) was followed closely and involved passing up to 10%
H2 in nitrogen over the catalyst at temperatures up to 470 K for
2 to 12 hours.
4.2.4 Analytic Instrumentation
CO, H2O and CO2 in the exit gas stream were measured after
dilution in a 1 L/min N2 stream to accommodate the analytical
range of the available Beckman (model 864) infrared CO2 moni-
tor. CO was measured by a Miran (model 1A) infrared analyzer
and H2O was measured by a General Eastern (model 1100DP)
condensation dew point hygrometer. Since the inlet H2 and CO2
concentrations were zero, reaction stoichiometry dictated that
the outlet H2 was equal to the outlet CO2 . From these three
measurements, the inlet CO/H2O ratio and the conversion of H2O
to H2 were calculated. Details of these calculations are given
in Appendix B.
4. 3 Results and Discussion
4.3.1 Reactant Delivery System
Both the steam generation and bubbler reactant delivery systems
delivered H2O at about 2.5 gmole/d, close to the design value,
and could be adjusted easily for larger flows.
- 18 -
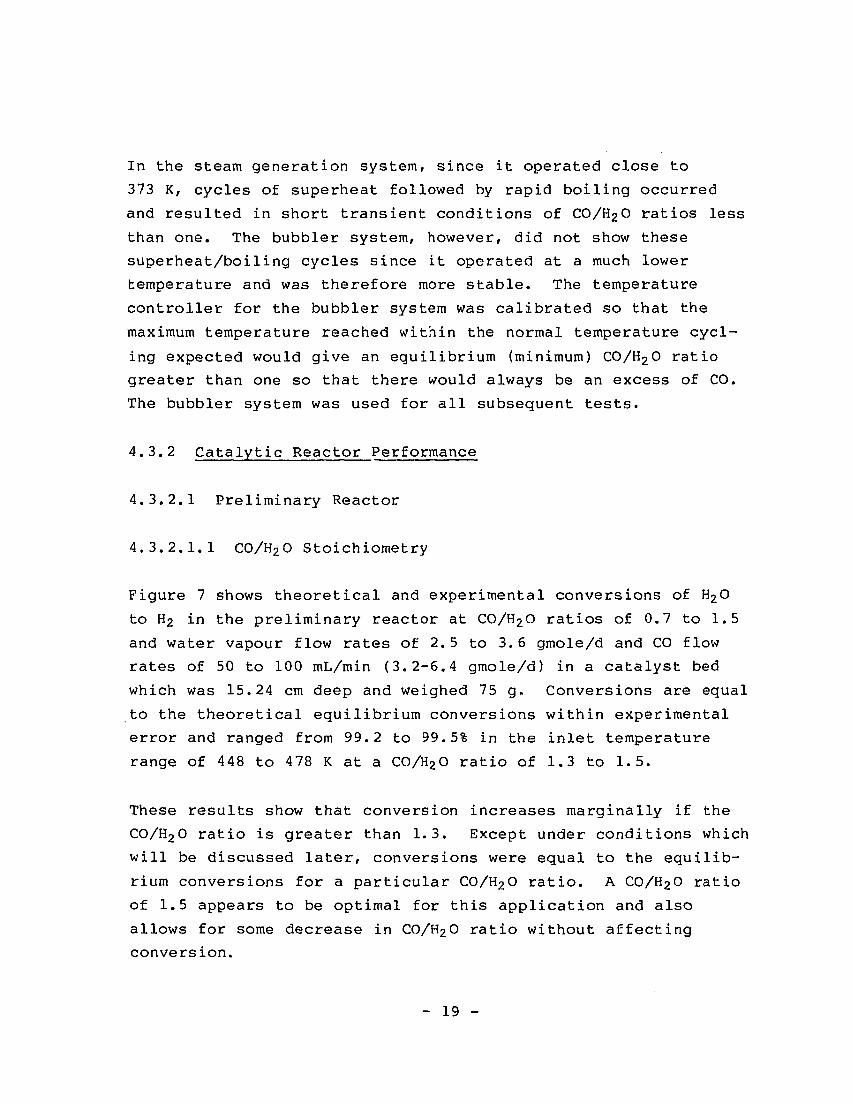
In the steam generation system, since it operated close to
373 K, cycles of superheat followed by rapid boiling occurred
and resulted in short transient conditions of CO/H2O ratios less
than one. The bubbler system, however, did not show these
superheat/boiling cycles since it operated at a much lower
temperature and was therefore more stable. The temperature
controller for the bubbler system was calibrated so that the
maximum temperature reached within the normal temperature cycl-
ing expected would give an equilibrium (minimum) CO/H2O ratio
greater than one so that there would alv/ays be an excess of CO.
The bubbler system was used for all subsequent tests.
4.3.2 Catalytic Reactor Performance
4.3.2.1 Preliminary Reactor
4.3.2.1.1 CO/H2O Stoichiometry
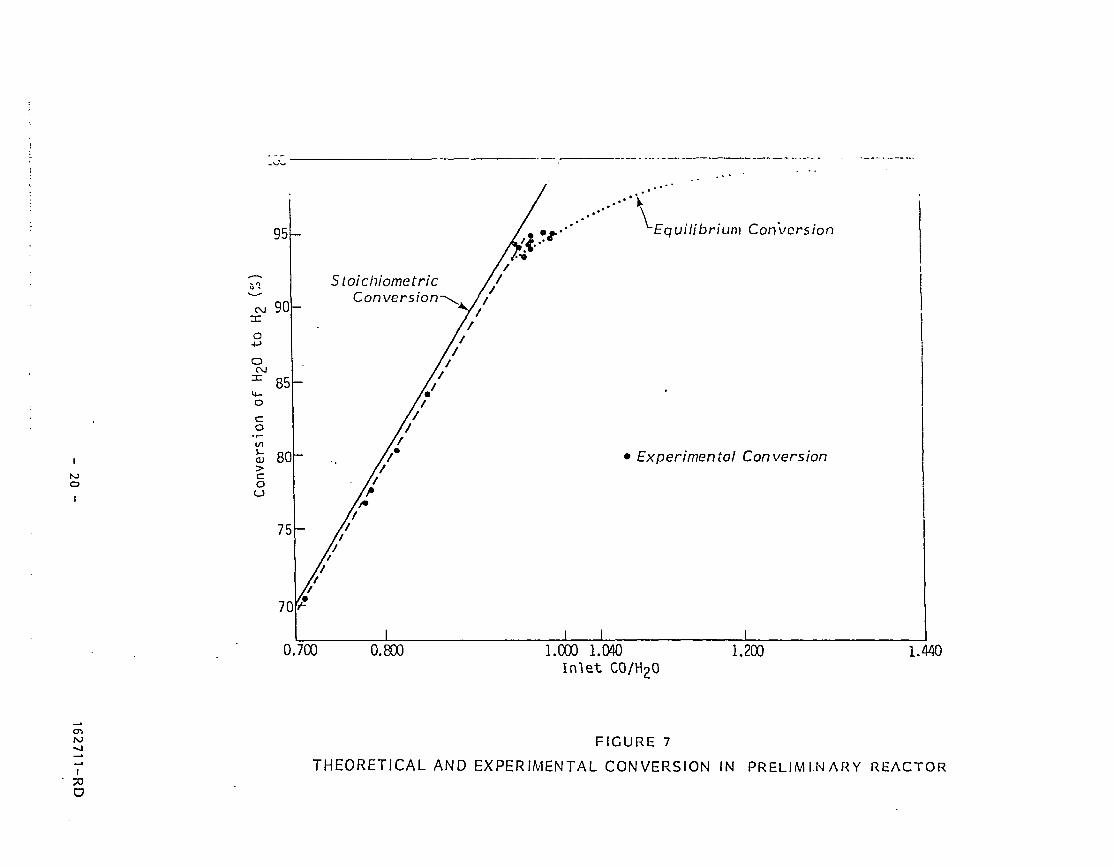
Figure 7 shows theoretical and experimental conversions of H2O
to H2 in the preliminary reactor at CO/H2O ratios of 0.7 to 1.5
and water vapour flow rates of 2.5 to 3.6 gmole/d and CO flow
rates of 50 to 100 mL/min (3.2-6.4 gmole/d) in a catalyst bed
which was 15.24 cm deep and weighed 75 g. Conversions are equal
to the theoretical equilibrium conversions within experimental
error and ranged from 99.2 to 99.5% in the inlet temperature
range of 448 to 478 K at a CO/H2O ratio of 1.3 to 1.5.
These results show that conversion increases marginally if the
CO/H2O ratio is greater than 1.3. Except under conditions which
will be discussed later, conversions were equal to the equilib-
rium conversions for a particular CO/H2O ratio. A CO/H2O ratio
of 1.5 appears to be optimal for this application and also
allows for some decrease in CO/H2O ratio without affecting
conversion.
- 19 -
o
95-
CSJ 90oco
oCVJ
O
C
oIS)
coo
85
80
70
0
Stoichiometric //
. . - - VVEquilibrium Conversion
700 0.800
• Experimental Conversion
I I1.000 1.040
In le t C0/H201.200 1.440
CDto••J
ITO
FIGURE 7
THEORETICAL AND EXPERIMENTAL CONVERSION IN PRELIMINARY REACTOR

4.3.2.1.2 Gas Flow Rate
Space velocities in the preliminary reactor were about 150 h"1,
well below the manufacturer's suggested maximum of 2000 to
5000 h"1, which suggests we could get similar performance using
<6 g of catalyst.
4.3.2.1.3 Reactor Temperature
The reaction rate is expected to decrease with decreasing tempe-
rature. However, the conversion in the preliminary reactor at
inlet temperatures of 448 to 478 K was independent of tempera-
ture. This is indicative of an excess of catalyst. The temper-
ature rise through the catalyst bed in the large reactor was
typically about 15 K as a result of the exothermic conversion.
As expected, this temperature increase was generally confined to
the top of the bed.
4.3.2.1.4 Catalyst
All weights of catalyst tested, both crushed and as received,
gave equilibrium conversions at the appropriate temperature.
4.3.2.2 Prototype Reactor
4.3.2.2.1 CO/H2O Stoichiometry
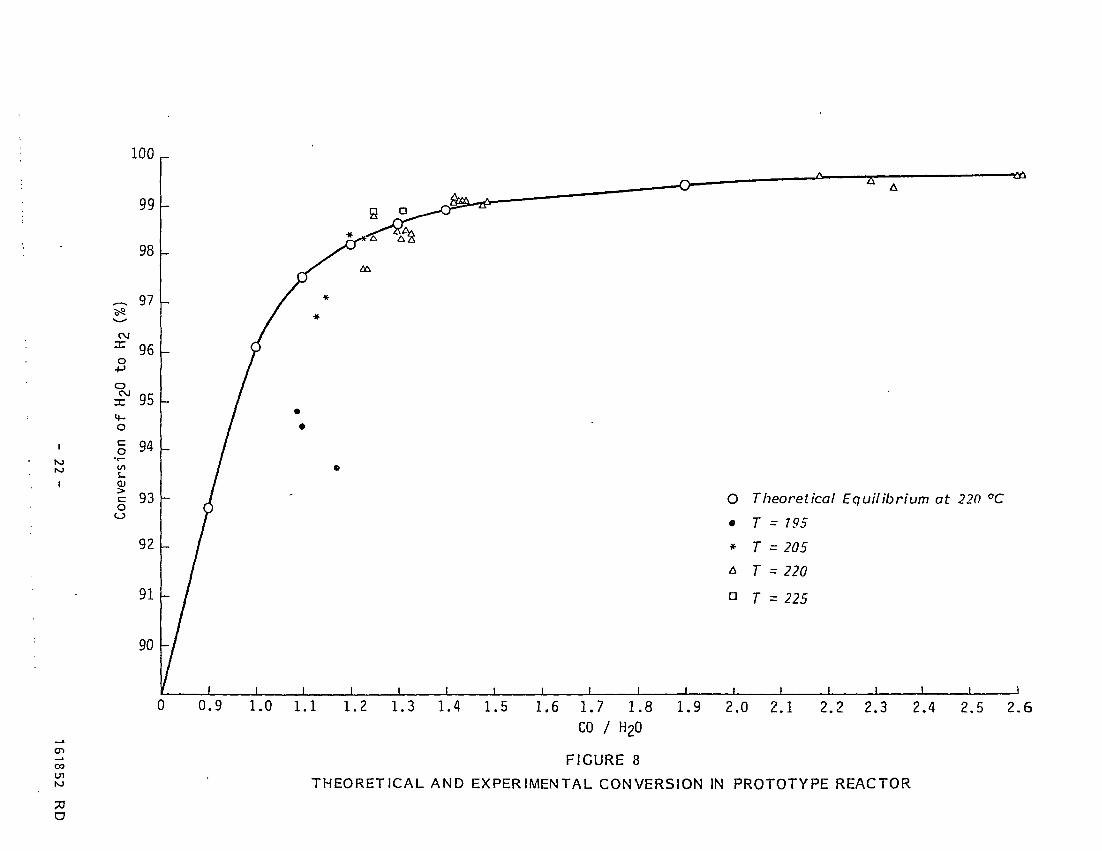
Figure 8 shows conversion versus CO/H2O ratios for different
catalyst temperatures in the first prototype reactor. Equilib-
rium conversions were obtained for CO flow rates of 75 to
200 mL/min, CO/H20 inlet ratios of 1.2 to 2.7 and H2 flow rates
up to 5.3 gmole/d.
- 21 -
1 0 0 , -
N>
00Ul
73o
CM
nro•po
CM
n:4-Oco
>co
99
98
97
96
95
94
93
92
91
90
/ *
j1/ \I
1J1
-j
-! i i i i i i i i
i-, — — — — û — — — A ™-i A
O Theoretical Equilibrium at 220 °C
• T = 195
* T = 205
A T = 220
a r = 225
i i i i i i i i i i
0 0 . 9 1.0 1 .1 1 .2 1 .3 1 .4 1 .5 1 .6 1 .7 1 . 8 1 .9 2 . 0 2 . 1 2 . 2 2 . 3 2 . 4 2 . 5 2 . 6CO / H2O
FIGURE 8
THEORETICAL AND EXPERIMENTAL CONVERSION IN PROTOTYPE REACTOR

4.3.2.2.2 Gas Flow Rate
In the prototype reactor, wet gas space velocities were about
1000 h"1, still well below the manufacturer's suggested space
velocity of 2000 to 5000 h"1 .
The highest H2O flow rate tested in the prototype reactor was
5.3 gmole/d at a CO flow rate of 200 mL/min (C0/H2O = 2.27).
From catalyst manufacturer's specifications, at a CO/H2O ratio
of 1.5, the maximum H2O flow rate would be 12.5 gmole/d with a
corresponding CO flow of 310 mL/min or five times that specified
by TSTA.
It is thus not surprising to find that conversion was indepen-
dent of space velocity in the range tested. However, at the
higher flow rates, the decreased residence time in the bubbler
reactant delivery system resulted in larger CO/H2O ratios since
H2O vapor/liquid equilibrium in the CO gas stream was not
reached.
4.3.2.2.3 Reactor Temperature
In the prototype reactor, the temperature profile was constant
throughout the bed as a result of the large heat sink effect of
the reactor body and alumina. The optimum operating temperature
of the catalyst bed was about 493 K.
4.3.2.2.4 Catalyst
Only the crushed catalyst was used in the prototype reactor
since a larger particle size could have resulted in flow chan-
neling which would have restricted process gas/catalyst con-
tact. Since only 10 g of catalyst was used, pressure drop
increases resulting from the decrease in particle size were
negligible. The catalyst bed size could be reduced further, but
- 23 -

there is little advantage in terms of waste disposal (this will
be discussed later in Section 4.3.6). Also, a bed size of 10 g
allows a much longer time between replacements of the reactor
and thus helps to reduce occupational dose.
4.3.3 Upset Conditions
4.3.3.1 Temeperature Excursions
The catalyst manufacturer suggests that the catalyst should not
be operated above 523 K because thermal sintering which would
reduce catalyst activity may occur. However, a short excursion
up to 563 K appeared to have no irreversible effect on catalyst
activity. A temperature excursion to 573 K which occurred prior
to the catalyst activation in the prototype reactor did not
appear to affect catalyst activity. Long term life may have
been affected, but since the catalyst lifetime in a pure feed
stream is in the order of years, this was impossible to verify
in this project.
A decrease in catalyst temperature to about 428 K resulted in a
decrease in the reaction rate which affected conversion.
Resumption of normal operating conditions resulted in the
expected equilibrium conversions. If the temperature decreases
so that condensation occurs on the catalyst, the catalyst
activity may decrease (according to the manufacturer). However,
upon resumption of normal operating conditions, the catalyst
activity would increase. If the catalyst is wet prior to the
activation, maximum activity may not be reached.
4.3.3.2 Flow Interruptions
Flow interruptions do not affect catalyst performance. Flow to
the reactor was regularly turned off for periods of several
hours or several days with no effect.
- 24 -
4.3.3.3 Contaminants
Contaminants in the form of N0z in air were injected into a
75 mL/min CO flow stream at 18 mL/min. This was injected into
the prototype reactor. C0 2, NO.,, 0± , N2 concentrations in the
CO feed stream were 55, 101, 40 000 and 150 000 pL/L respec-
tively. An increase in catalyst bed temperature was observed.
This was probably the result of the exothermic oxidation of both
H2 and the catalyst. The heat from these reactions was able to
sustain catalyst temperature above the temperature controller
setpoint. The capability of the reactor to handle 4% O2 shows
the value of a small catalyst bed in a large copper/alumina heat
sink for both safety and continued reactor performance.
Conversion of H2O to H2 remained at the equilibrium values of
>98% at a CO/H^O ratio of about 1.5.
According to the manufacturer, chlorine and sulphur irreversibly
poison the catalyst. This is not seen to be a problem at TSTA
or in any other tritium removal facility and was not tested.
From the above experiments, the catalytic reactor operates very
reliably under out-of-specification conditions.
4.3.4 Isotope Effects
Isotope effects of Dz and Tz on the equilibrium conversions were
calculated and are listed in Table 3. Details of the calcula-
tions are given in Appendix D.
- 25 -

I
TABLE 3
ISOTOPE EFFECT ON WATER-GAS SHIFT REACTION AT 195°C
CO/H2O Equilibrium Conversion (%)H D T
1 94.5 88.6 87.31.5* 99.3 96.4 94.33 99.8 99.5 98.95 99.9 99.7 99.5
* Expected CO/H2O Stoichiometry for operation
If the catalytic reactor is operated at a CO/(D,T)2O
stoichiometry of 1.5, the equilibrium conversion is reduced
slightly, to 95% if the ratio of T/D = 1.5 (corresponds to TSTA
design of 90 000 Ci/d). The kinetic effects should be negli-
gible. In the FCU system the isotope effect in the proposed
closed loop system should be minimal at a CO/H2O ratio of 1.5.
As the CO/H2O ratio is increased, the isotope effect decreases.
4.3.5 Hydrogen Isotope Permeation Through the Reactor
The D2 permeation rate through the reactor was calculated from
literature values of D2 permeability and was found to be about
2.1 x 10~7 gmole D2/d. Tritium (T2 ) permeation in the exhaust
gas stream would be similar and would correspond to
7.5 x 10~3 Ci/d assuming that the ratio of tritium permeation to
H2 and D2 permeation is the same as the ratio of T2 to D2 and H2
in the feed stream. This rate is very small and would be
difficult to measure accurately. Details of this calculation
are given in Appendix E.
- 26 -
I

4.3.6 Tritium Inventory in Reactor
D2 solubility limits in the catalyst and reactor were also
calculated from literaéure values {see Appendix E) and were
found to be about 5.3 x 10"* gmole and 3.7 x 10" gmole,
respectively. If a tritium contaminated stream of 90 OOO Ci/d
were assumed (TSTA FCU system) this would correspond to radia-
tion levels of 1.9 and 1.3 Ci, respectively. The inventory of
H-isotope in the gas phase in the prototype reactor is estimated
to be 2.0 x 10~ gmole corresponding to 7.2 Ci. The total
inventory of tritium in the prototype reactor may, therefore, be
10.4 (1.9 + 1.3 + 7.2) Ci. D2 solubility in the catalyst was
calculated assuming a "worst case" in which the catalyst was
100% copper. Even with this assumption, the radioactivity upper
limit in the catalyst is about the same as the radioactivity
upper limit in the reactor wall. Experimental determination of
the extremely small H2 solubilities in Cu is virtually
impossible with existing in-house equipment and would be of
little value since they are extremely small compared with those
of the hot uranium metal bed or liquid phase electrolytic cell.
The inventory of (H,D,T);>0 in the electrolytic cell may be as
high as 20 mL liquid or 40 000 Ci/12/.
4.4 Full Scale Prototype Reactor Designfor FCU System Implementation
From the large reactor experiments, it was apparent that:
a) Optimum CO/H2O ratio is 1.5.
Larger CO/H2O ratios increase the conversion marginally.
CO/H2O ratio of 1.5 is slightly higher than required
(about 1.3) for 98 + % conversion.
- 27 -
b) Catalyst bed size of 25-75 g is much larger than required.
The prototype reactor experiments showed that:
a) Catalyst bed size of 10 g is more than sufficient for
conversions of 98% or greater.
b) Optimum operating bed temperature is about 493 K.
c) Prototype reactor can handle H2O flow rates of at least
5.3 gmole/d (highest flow tested). From catalyst
manufacturer specifications, at a CO/H2O ratio of 1.5,
maximum H2O flow rate would be 12.5 gmole/day, or 5 times
that required by TSTA.
The catalytic reactor design for implementation into a FCU
system that would meet TSTA specifications is similar to the
prototype reactor discussed earlier. A detailed drawing is
shown in Figure 9 and specifications are listed below.
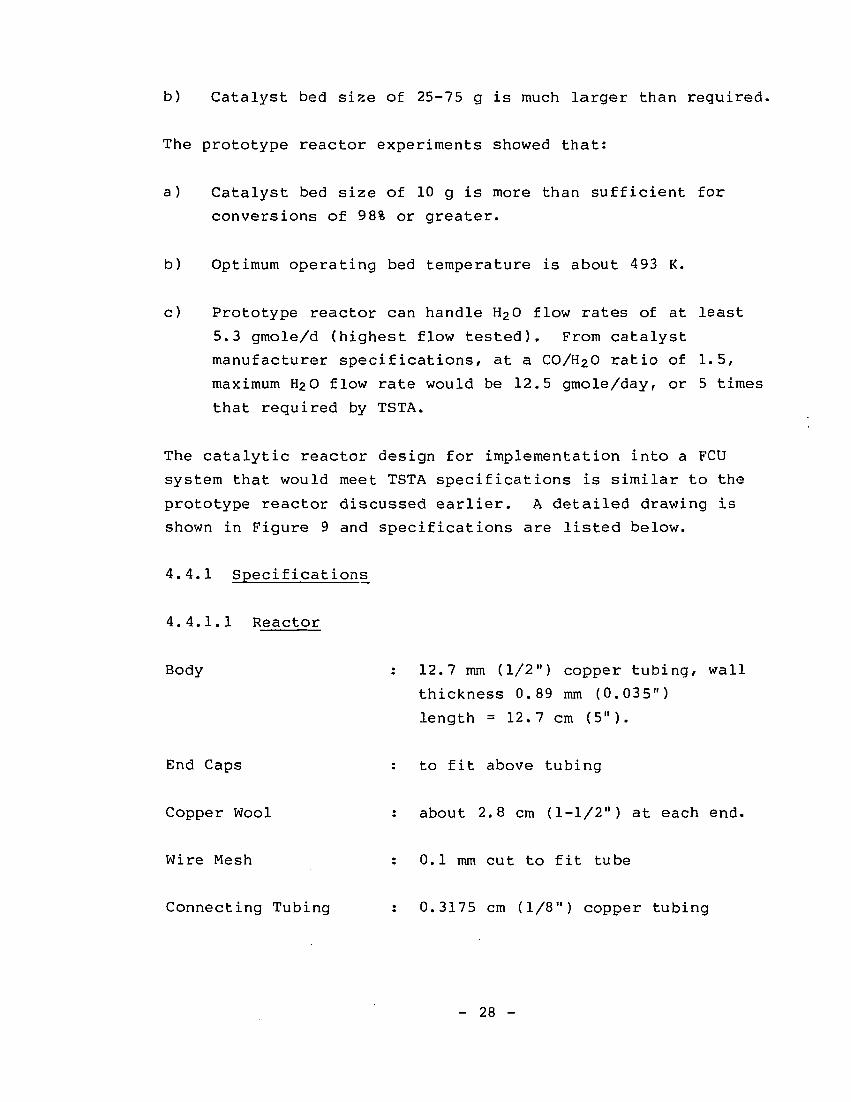
4.4.1 Specifications
4.4.1.1 Reactor
Body
End Caps
Copper Wool
Wire Mesh
12.7 mm (1/2") copper tubing, wall
thickness 0.89 mm (0.035")
length = 12.7 cm (5").
to fit above tubing
about 2.8 cm (1-1/2") at each end.
0.1 mm cut to fit tube
Connecting Tubing 0.3175 cm (1/8") copper tubing
- 28 -

r2.54 cm
12.7 cm5. 33 cm
2.54 cm
'&&
1/16" (0.1588 cm)316SS ControllingThermocouple
§§
1/8" (0.3175 cm) Copper Tubing
1/16" (0.1588 cm) 316SSIndicating Thermocouple
1/2" (1.27 cm) Copper Tubing
Copper Pipe (2.67cm OD, 2.09cm ID)
Alumina
Copper Wool
0. 1 mm Mesh
Catalyst ( + 0.15- 0.85mm)
Band Heater (s) 200 W Total
0. 1 mm MeshCopper Wool
1/16" (0.1588 cm) 316SS IndicatingThermocouple1/8" (0.3175 cm) Copper Tubing
FIGURE 9
CATALYTIC REACTOR DESIGNWHICH MEETS TSTA SPECIFICATION (TO SCALE)
- 29 -161853 RD

Outer Shell 3/4" schedule 40 copper pipe (2.67 cm
OD, 2.09 cm ID) with drilled out caps
to fit reactor. Space between outer
shell and reactor filled with alumina.
4.4.1.2 Catalyst Bed
Catalyst Low temperature CO shift
CuO - ZnO on alumina
suggested manufacturers - United
Catalyst/ Katalco
Particle Size •0.85 mm + 0.15 mm
Weight 10 g
Bed Depth : 5.3 cm (2.1")
4.4.1.3 Temperature Control
Thermocouples 4, 2 in bed, 1 in gas inlet, 1 in gas
outlet. Type K, 316SS sheath, 1/16"
(1.59 mm) thick. Bed thermocouple
controlling
Heaters 2-100 W band heaters, each 6.35 cm
(2.5") long for a total of 200 W.
Temperature Controller : Proportional band with open
thermocouple failsafe option
Temperature Control ±1°C of Set Point
4.4.1.4 Analytical Instrumentation
CO Inlet Gas controlled and measured by mass flow
controller
- 30 -

CO Outlet Gas : IR spectrograph, typically Miran IR
Analyzer calibrated for 1 - 50% CO by
volume
Outlet Gas : Condensation Dew Point Hygrometer
4.4.1.5 Operational Parameters
Inlet CO/H2O : 1.5
CO Flow Rate : 75 mL/min for 24 h operation.
correspondingly higher if operation
not full time
Catalyst Bed Temperature : 493 K
Inlet Gas Temperature : 473 - 493 K
1. All connections are silver soldered. Heat sink should be
clamped to reactor when it contains catalyst and second cap
is soldered. Reactor should be air cooled and not quenched
in water.
2. Reactor should be pressure tested (170 kPa [10 psig]) to
ensure that it is leaktight.
3. The catalytic reactor may be built remote from the testing
facility. Catalyst reduction (activation) and subsequent
testing with CO and H2O to prove catalyst activity may be
performed. The reactor could then be purged and slightly
pressurized with an inert gas, sealed, cooled, and transpor-
ted to the testing facility. It is not recommended that the
reactor be put in environments where thermal shock or wett-
ing may occur.
- 31 -

4.4.2 Fuel Clean Up System Application Example
Using the FCU system at TSTA as an example, the water gas shift
reactor could be inserted into the system as illustrated in
Figure 10. The products stream from the reactor would be
recycled into the molecular sieve bed where the hydrogen iso-
topes would be separated from the stream. Steady-state opera-
tion would entail an increase in molecular sieve bed loading of
about 20%. This closed loop operation, coupled with the extra
capacity in the reactors, provides an extra measure of safety in
the system. In order to use the particular reactor design
described above, at TSTA, the freezer would either be modified
to accept a CO bubbler, or redesigned as a combination freezer/
bubbler.
5.0 CONCLUSIONS
1. The catalytic water gas shift reactor provides a safe,
reliable and continuous method of reducing H2O to H2. The
reaction is easily controlled and resistant to upset condi-
tions including feedstream contaminants.
2. Reactor specifications for a feed stream of 2.5 to
12.5 gmole H2O/d are:
a. Dimensions - 12.7 mm OD x 12.7 cm length
b. Materials - copper, thermocouples are 316SS
c. Connections to System - silver, solder to Cajon vacuum
couplings
d. Catalyst - CuO-ZnO on alumina
Weight: 10 g
Particle Size: -0.85 + O.i5 mm
3. Operating Conditions for the reactor as specified in 2. are:
- 32 -

Exhaust Cas OxygenRemoval
384 g moles Id
Q2 HQ - 36H g moles Id
CQif NOCO NQ3Q20 N 2
Q2 Ar
20 g moles Id(-90,000 Ci)
Q = Any mixture ofD and T or D orT alone
Molecular Sieve@ 75 K
Q2 + HQ To'Isotope Separation
Regeneration
lmpurilies~380 Lidat 230 CilL
CatalyticOxidation
Reactor 800K
Q20COA/OxN2
Ar
Freezer 160K
CO* •
(4.0gmoleld)
CON0x
N2Ar
*~Waste Treatment
Q2O2.7Ag mole Id*
Q2O + CO-*~Q2 +at 650K
96% Conversion*
C0 Water Gas ShiftReactor (Wg Catalyst)
Q2O 0. 11g mole Id*CO h 37g moleldQ2 2.63g mole/d*CO 2 2. 63g mole Id"1
'* Conversion is for a D2QIT2O•stream of 90,000 Ci.
FIGURE 10
FUEL CLEAN UP SYSTEM EXAMPLE: TSTA
- 33 - 162347 RD
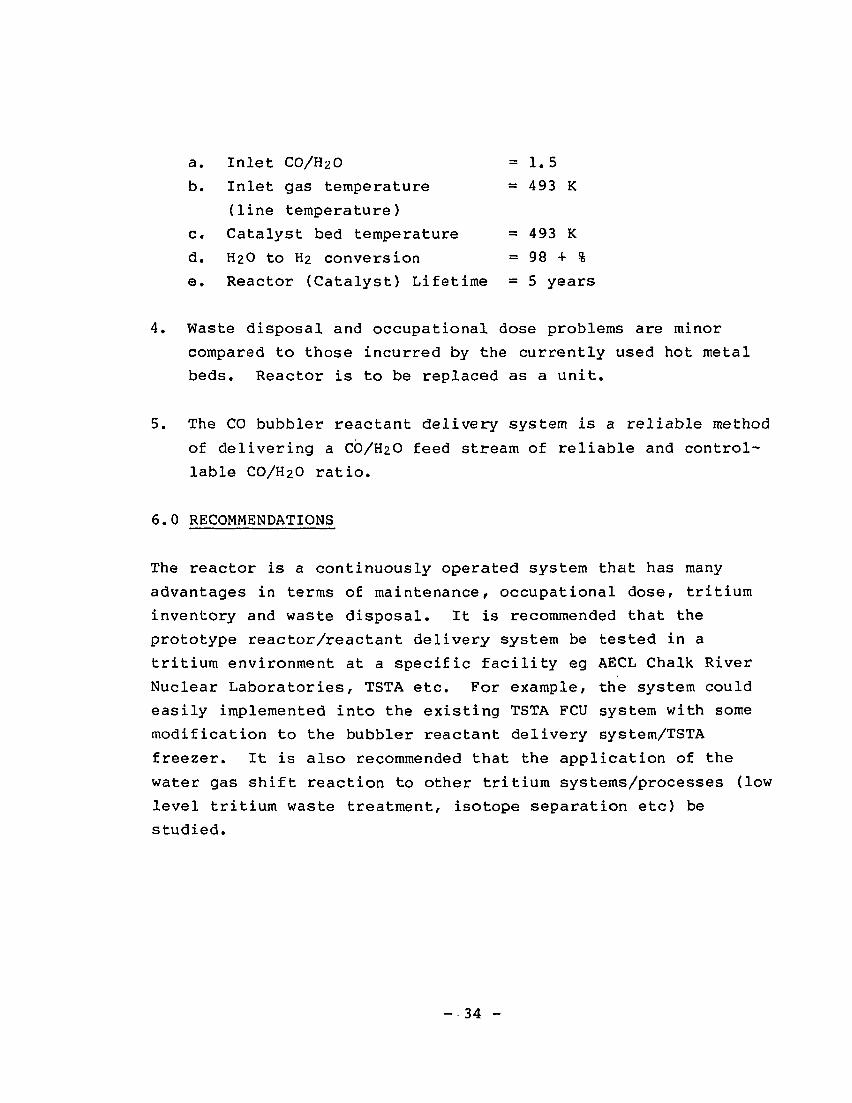
a. Inlet CO/H2O =1.5
b. Inlet gas temperature = 493 K
(line temperature)
c. Catalyst bed temperature = 493 K
d. H2O to H2 conversion = 98 + %
e. Reactor (Catalyst) Lifetime = 5 years
4. Waste disposal and occupational dose problems are minor
compared to those incurred by the currently used hot metal
beds. Reactor is to be replaced as a unit.
5. The CO bubbler reactant delivery system is a reliable method
of delivering a CO/H2O feed stream of reliable and control-
lable CO/H2O ratio.
6.0 RECOMMENDATIONS
The reactor is a continuously operated system that has many
advantages in terms of maintenance, occupational dose, tritium
inventory and waste disposal. It is recommended that the
prototype reactor/reactant delivery system be tested in a
tritium environment at a specific facility eg AECL Chalk River
Nuclear Laboratories, TSTA etc. For example, the system could
easily implemented into the existing TSTA FCU system with some
modification to the bubbler reactant delivery system/TSTA
freezer. It is also recommended that the application of the
water gas shift reaction to other tritium systems/processes (low
level tritium waste treatment, isotope separation etc) be
studied.
- 34 -

REFERENCES
1. Darvas, J., The Euratom Fusion Technology Programme. Paper
presented at the Symposium on Fusion Technology, Oxford,
September 15-19 (1980).
2. Kerr, E.C., Bartlit, J.R., Sherman, R.H., Fuel Clean-Up
System for the Tritium Systems Test Assembly; Design and
Experiments. Proc. Topical Meeting on Tritium Technology in
Fission, Fusion and Isotopic Applications, 115-118, May
(1980).
3. Yoshida, H., Takeshita, H., Kouishi, S., Ohno, H., Kurasawa,
T., Watanabe, H., Narase, Y., A Feasibility Study of the
Catalytic Reduction Method for Tritium Recovery from
Tritiated Water. Paper submitted to J. Nuch, Technology.
4. Podolski, W.F., Kim, G.Y., Modelling the Water-Gas Shift
Reaction. Ind. Eng. Chem., Process Des. Development 13(4)
415 (1974).
5. Shchibrya, G.G., Morozov, N.M., Kemkin, M.I., Kinet, Kotal.
6.(6), 1057(1965).
6. Barkley, L.W., Corrigan, T.E, Wainwright, H.W., Sands, A.E.,
Ind. Eng. Chem., 4_4(5), 1066(1952).
7. Stull, D.R., Prophet, H., JANAF Thermochemical Tables,
Office of Standard Reference Data National Bureau of
Standards, Washington D.C. (1971).
8. Kirshenbaum, I., Physical Properties and Analysis of Heavy
Water, McGraw-Hill, New York, p 32(1951).
- 35 -

9. Kubaschewski, 0., Alcock, C.N., Metallurgical
Thermochemistry, 5th éd., Pergamon Press, Oxford p 22(1979)
10. Bond, W.D., Production of Tritium by Contained Nuclear
Explosions in Salts: 1. Laboratory Studies of Isotopic
Exchange of Tritium in the Hydrogen - Water System.
0RNL3334, Oak Ridge National Lab(1962).
11. Caskey, Jr., G.R. Derrick, R.G., Hydrogen Permeability
through Alpha-Brass, Met. Trans. A J3A March(1977).
12. Spagnola, D., Atomic Energy Canada Ltd, Personal
Communication.
- 36 -

APPENDIX A
CATALYST COMPOSITION AND ACTIVATION PROCEDURE
- 37 -
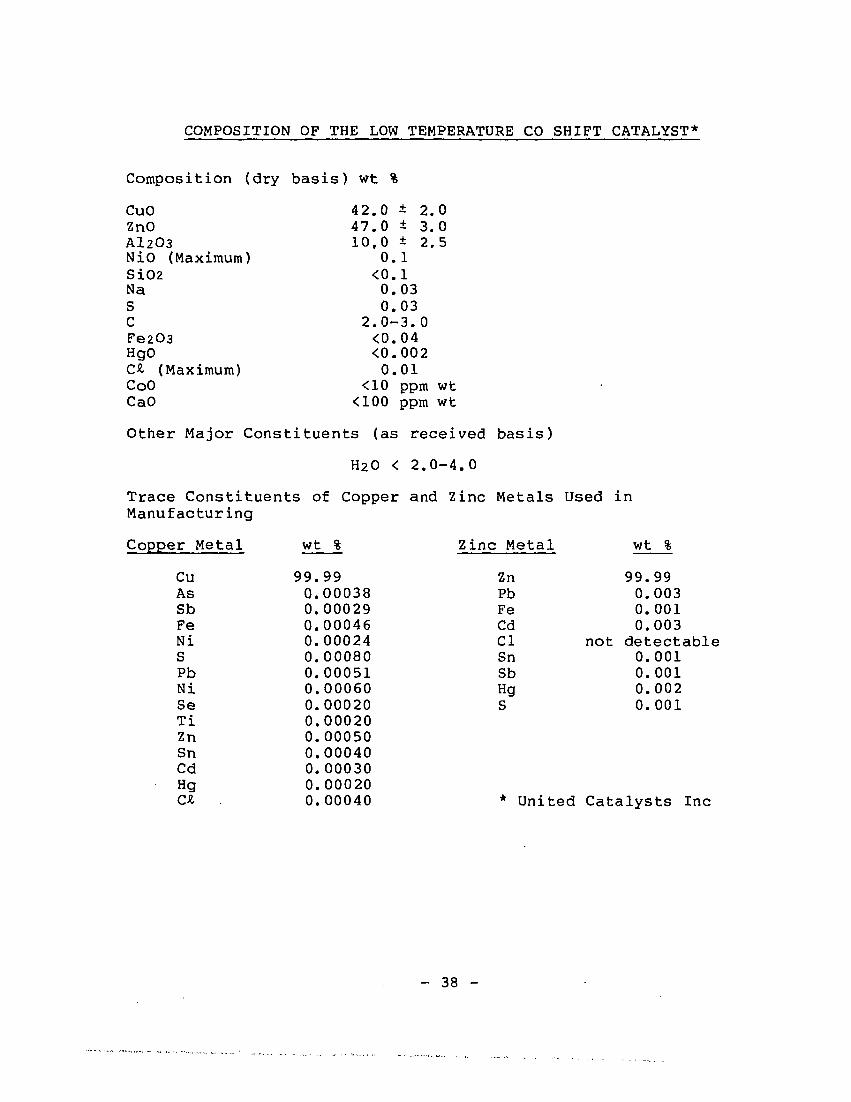
COMPOSITION OF THE LOW TEMPERATURE CO SHIFT CATALYST*
Composition (dry basis) wt %
CuOZnOAI2O3NiO (Maximum)SiO2NaSCFe2O3HgOCX. (Maximum)CoOCaO
42.0 ± 2.047.0 ± 3.010,0 ± 2,5
0.1<0.10.030.03
2.0-3.0<0.04<0.0020.01
<10 ppm wt<100 ppm wt
Other Major Constituents (as received basis)
H2O < 2.0-4.0
Trace Constituents of Copper and Zinc Metals Used inManufacturing
Copper Metal wt %
CuAsSbFeNiSPbNiSeTiZnSnCdHgex. .
99.990.000380.000290.000460.000240.000800.000510.000600.000200.000200.000500.000400.000300.000200.00040
Zinc Metal
ZnPbFeCdClSnSbHgS
wt %
99.990.0030.0010.003
not detectable0.0010.0010.0020.001
United Catalysts Inc
- 38 -

CATALYST ACTIVATION FROCEDURE/Manufacturers Procedure*
Step
1
2
3
4
5
6
7
Inlet GasH2 (mL/nin )
Initial
0
0
1-3
1-3
2-5
15
15
Final
0
1-3
1-3
2-5
15
15
100
Inlet GasTemperature
°C
Initial
21
65
65
175
175
175
195
Final
65
65
175
175
175
195
195
ReactorTemperature
°C
Initial
21
65
>65
175
>175
>175
195
Final
65
>65
175
>175
>175
195
195
Comments
N2 f lowrate = lL/farinT increase £ 80°C/h
Monitor inlet/outlet ^constantly. Withdraw H2 if suddenincrease in bed temperature
T increase _<80°C/h
Catalyst T <245°C. If no H2 consumption, increase inlet Tuntil consumption complete (inlet T <200°C)
Catalyst T <245°C. If no H2 consumption, increase inlet Tuntil consumption complete (inlet T <200°C)
Do not do until T rise through catalyst bed declines
If no T rise in bed, catalyst is reduced.
To shut down temporarily (overnight) purge with N2 and blockin under positive pressure.
To shut down permanently, cool below 38°C and dispose inmetal container. Wet with H2O to control oxidation.
* United Catalyst Inc
APPENDIX B
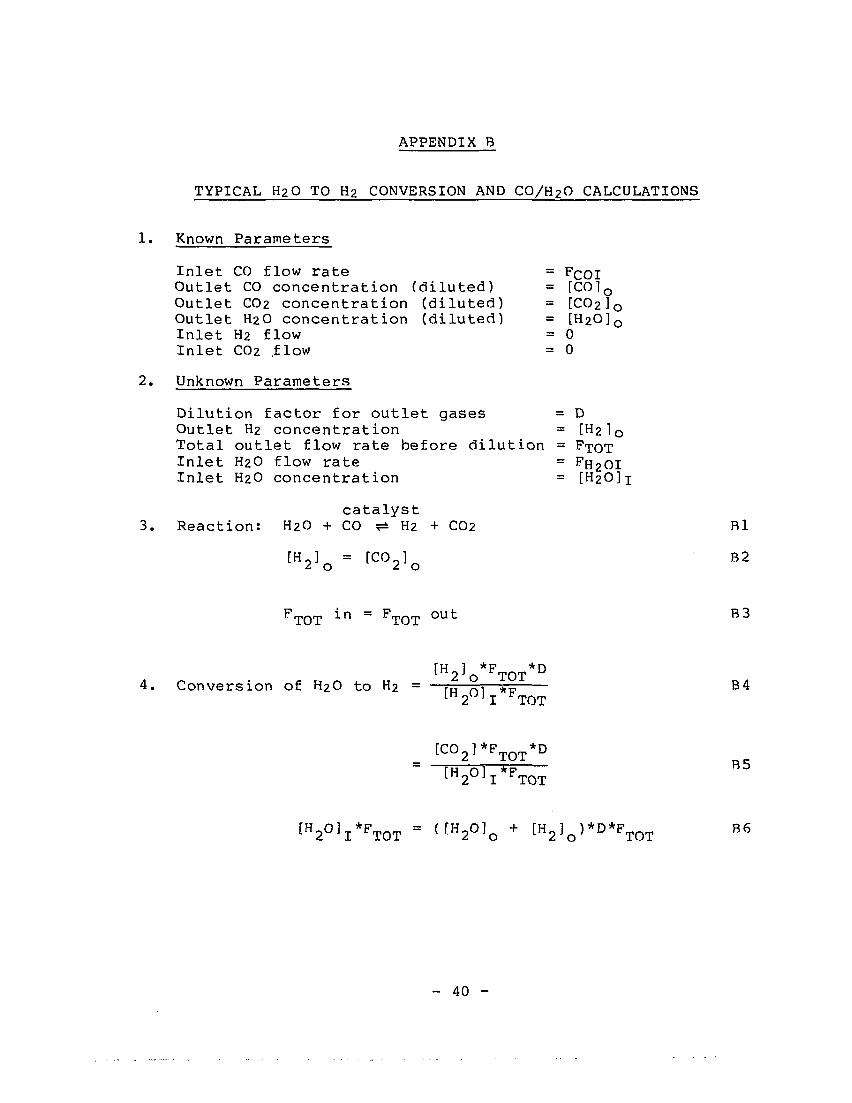
TYPICAL H2O TO H2 CONVERSION AND CO/H2O CALCULATIONS
1. Known Parameters
Inlet CO flow rate = F^QIOutlet CO concentration (diluted) = [C0loOutlet CO2 concentration (diluted) = [C02loOutlet H2O concentration (diluted) = [H20]oInlet H2 flow = 0Inlet CO2 flow = 0
2. Unknown Parameters
Dilution factor for outlet gases = DOutlet H2 concentration = [H2loTotal outlet flow rate before dilution = F-rOTInlet H2O flow rate = F H 2 O IInlet H2O concentration = [H2O]j
catalyst3. Reaction: H2O + CO ^ H2 + CO2 Rl
] B2
FTOT i n = FTOT O U t
f H 2 ] o* F TOT* D
4 . C o n v e r s i o n of H2O t o H2 = —rH n\—*pLH2 ' i TOT
[CO2]*FT O T*D
t H 2 0 ] I FTOT
[ H 2 0 ] I * F T 0 T " ( f H 2 ° ] o + fH21o î*D*PTOT
- 40 -
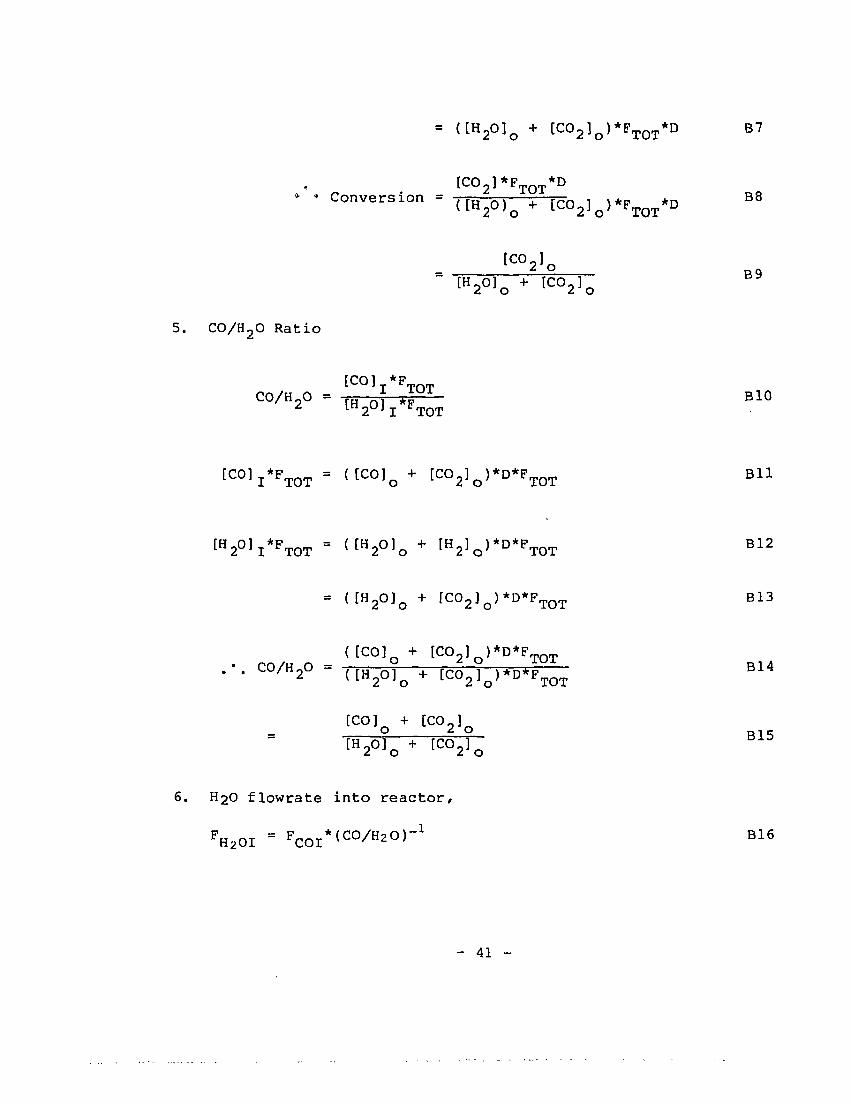
= ( [ H 2 0 ] o + [C0 2 ] o )*F T O T *D B7
[CO2]*FTOT*DConver s ion = ( [ H 2 0 ) Q + [ C O , ] Q ) * F T Q T * D B 8
^ ° B9[ H 2 0 ] o + t C ° 2 ]
5. CO/H2O R a t i o
[CO] *FC ° / H 2° = [H of TOT
[ C O ] I* F TOT = ( t C 0 ] o + [ C ° 2 1 o ) * D * F T 0 T B U
[ H 2 0 ] I* F TOT " { [ H 2 0 l o + [ H 2 ] o ) * D * P T 0 T B l 2
= ( IH 2 O] O + [C0 2] o)*D*F a , o q , B13
([COl +C ° / H 2 ° " ( [ H O ? + [CO Y ) * D * F ^ B l 4
[CO] + [CO_1o 2 ° B15[H20]o + [CO2]Q
6. H2O flowrate in to r e a c t o r ,
FH2OI = PCOI*(CO/H2O)-1 B16
- 41 -
APPENDIX C
CALCULATION OF ISOTOPE EFFECTS ON EQUILIBRIUM CONVERSION
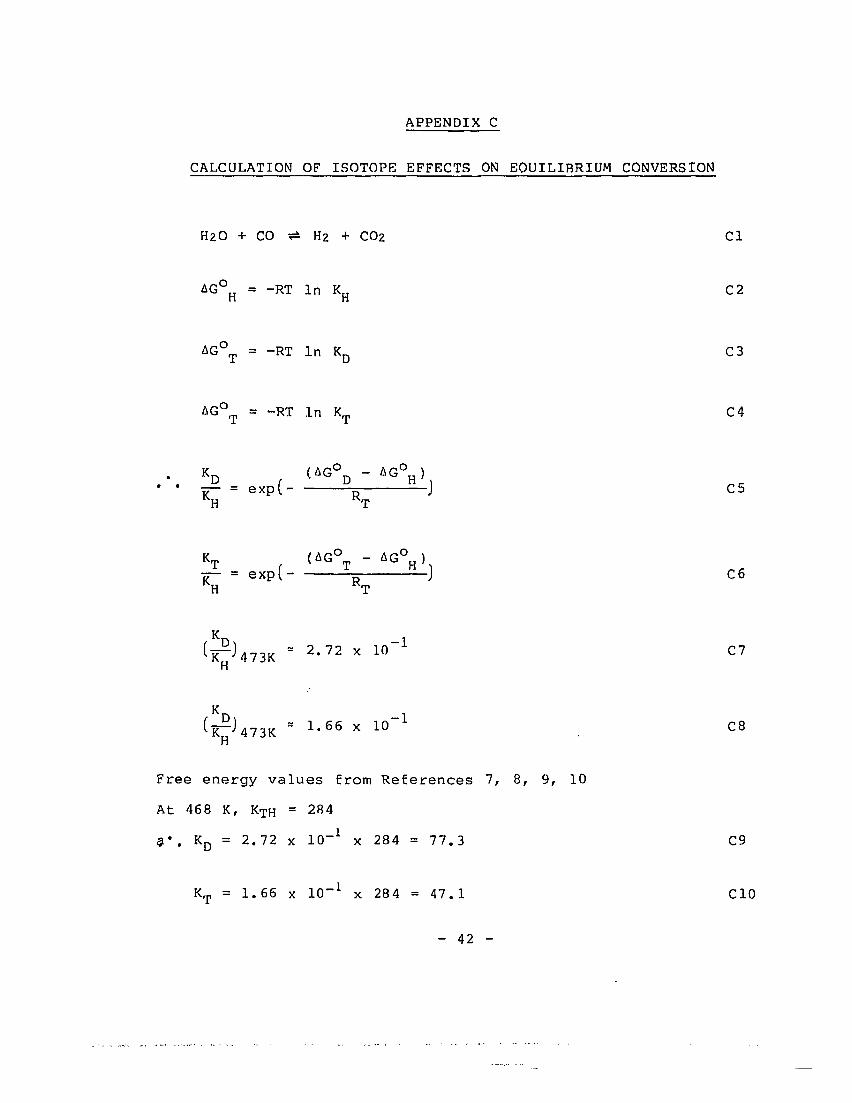
H2O + CO ^ H2 + CO2 Cl
AG°H = -RT In KH C2
AG° T = -RT In KD C3
AG° T = -RT In KT C4
_ = e x p( J c5
KT ( A G T - A G H )is- = expl = J C6KH RT
^ J 4 7 3 K - 2.72 x lO"1 C7
^ J 4 7 3 K - 1.66 x ICT1 C8
Free energy values from References 7, 8, 9, 10
At 468 K, KTH = 284
3*. KD = 2.72 x 10-1 x 284 = 77.3 C9
KT = 1.66 x lu"1 x 284 = 47.1 CIO
- 42 -
APPENDIX D
H-ISOTOPE PERMEATION CALCULATIONS
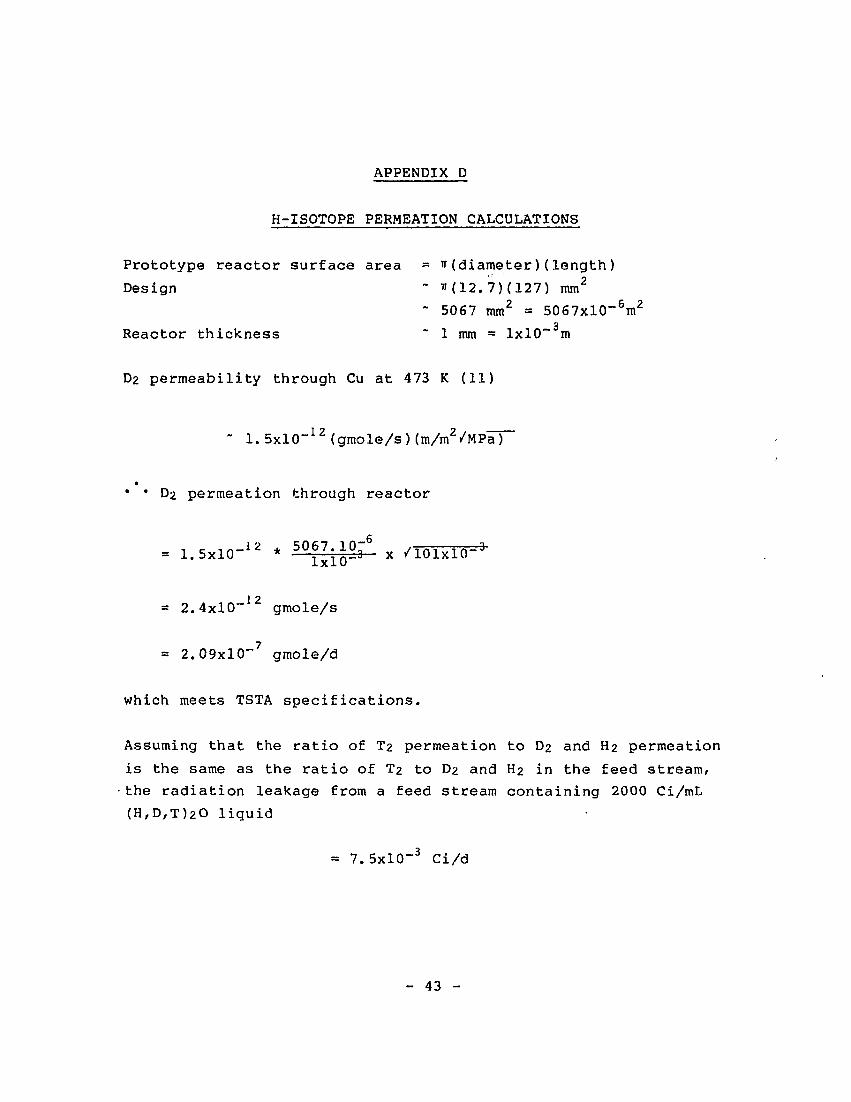
Prototype reactor surface area = n(diameter)(length)
Design ~ »(12.7)(127) mm2
" 5067 mm2 = 5067xl0"6m2
Reactor thickness " 1 mm = 1x10" m
D2 permeability through Cu at 473 K (11)
" 1.5xlO~12(gmole/s)(m/m2/MPâT
* • D2 permeation through reactor
-3x ZlOlxlO
1 2
= 2.4x10" gmole/s
= 2.09x10" gmole/d
which meets TSTA specifications.
Assuming that the ratio of T2 permeation to D2 and H2 permeation
is the same as the ratio of T2 to D2 and H2 in the feed stream,
the radiation leakage from a feed stream containing 2000 Ci/mL
(H,D,T)2O liquid
= 7.5xl0"3 Ci/d
- 43 -

APPENDIX E
H-ISOTOPE SOLUBILITY AND INVENTORY CALCULATIONS
1. D2 solubility in reactor metal
Volume reactor ~(12.7)(127)xl mm3
= 5067 mm3
D2 solubility in Cu at 500 K = 22.85 mole/m3/MPa (11)
D2 solubility in reactor metal
= 22.85*5067xl0~9 m3*/lOlxlO"3
3.68xlO~5 gmole
2. D2 solubility in catalyst
Assume catalyst is composed entirely of CuO
10 g catalyst = 0.126 gmole CuO
Volume catalyst = 10 g /I.369 g/cm3 =7.3 cm3
D2 solubility in catalyst = 22.85*2.3xlO~6 x /lOlxlO"3
= 5.3xlO~5 gmole
- 44 -
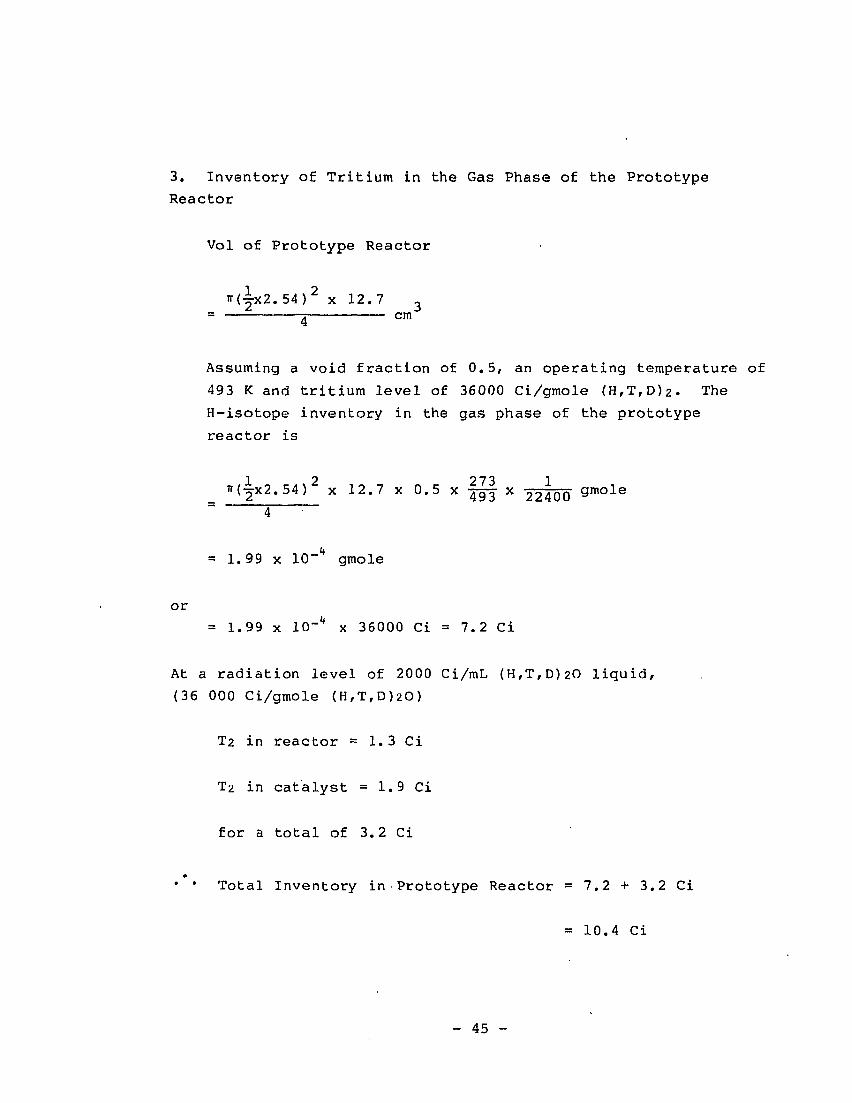
3. Inventory of Tritium in the Gas Phase of the Prototype
Reactor
Vol of Prototype Reactor
ir(-|x2.54)2 x 12.7- c m
Assuming a void fraction of 0.5, an operating temperature of
493 K and tritium level of 36000 Ci/gmole (H,T,D)2. The
H-isotope inventory in the gas phase of the prototype
reactor is
2 273 1x 12.7 x 0.5 x jg-j x 22400 gmole
= 1.99 x 10" gmole
or
= 1.99 x lO"** x 36000 Ci = 7.2 Ci
At a radiation level of 2000 Ci/mL (H,T,D)2O liquid,
(36 000 Ci/gmole (H,T,D)2O)
T2 in reactor = 1.3 Ci
T2 in catalyst = 1.9 Ci
for a total of 3.2 Ci
• • Total Inventory in Prototype Reactor = 7.2 + 3.2 Ci
= 10.4 Ci
- 45 -