Embed Size (px)
Citation preview

CANADIAN ENGINEERS FOR TOMORROW:Trends in Engineering Enrolment and
Degrees Awarded 2007-2011

Canadian Engineers for Tomorrow:
Engineers Canada is the national organization of the 12 provincial and territorial associations that regulate the profession of engineering in Canada and license the country’s more than 250,000 members of the engineering profession.
Established in 1936, Engineers Canada serves the associations, which are its constituent and sole members, through the delivery of national programs that ensure the highest standards of engineering education, professional qualifications and ethical conduct. Engineers Canada is the voice of its constituent members in national and international affairs, and promotes greater understanding of the nature, role and contribution of engineering to society.
First Publication: December 2012 Copyright © Canadian Council of Professional Engineers, 2012 ISBN No: 978-1-894284-41-7
* The terms ENGINEER, ENGINEERING, and P.ENG. are official marks held by the Canadian Council of Professional Engineers.
Engineers Canada is the business name of the Canadian Council of Professional Engineers.
Engineers Canada encourages the dissemination and reproduction of statistics contained in this report under strict authority and acknowledgement of Engineers Canada. Should you wish to reproduce any portion of this document through any media format, you are asked to seek the permission of Engineers Canada at:
Canadian Engineers for Tomorrow: Trends in Engineering Enrolment and Degrees Awarded is produced and published by Engineers Canada.
With the objective of monitoring the availability of engineering resources, Engineers Canada has collected national data on enrolment and degrees awarded since the 1970s, and has published the research findings through various documents, technical reports and research papers.
Canadian Engineers for Tomorrow: Trends in Engineering Enrolment and Degrees Awarded contains data collected from universities on accredited engineering programs across Canada, as well as analysis and interpretation of this data.
Engineers Canada strives to ensure accuracy and consistency of all information presented. However, due to variations in survey methodology, interpretation and student classifications at universities across the country, the volunteers and staff of Engineers Canada cannot guarantee the accuracy of data provided by the universities.
The reader is advised that the information presented herein, including the analyses and assessments of the data, does not represent an endorsement by Engineers Canada of any particular university, or the likelihood of a person obtaining employment in any particular engineering discipline.
Students of engineering are reminded that the accumulation of skills within a particular field of engineering, along with strong communications, organizational, and leadership abilities are essential to a progressive career in engineering.
Engineers Canada 1100-180 Elgin Street, Ottawa, Ontario K2P 2K3 Tel.: 613.232.2474 Fax: 613.230.5759 email: [email protected]
Trends in Engineering Enrolment and Degrees Awarded 2007-2011

Canadian Engineers for Tomorrow:Trends in Engineering Enrolment and Degrees Awarded 2007-2011
Prepared by: Prism Economics and Analysis Dec 2012

ii
Message from the Chief Executive Officer Engineers Canada is pleased to publish its summary of trends in engineering education in Canada. This report includes results for all academic terms from the calendar years 2007 through 2011.
Engineering institutions continue to report strong growth in the number of students pursuing an engineering education. Total undergraduate enrolment in accredited programs rose to 66,057; a 4.6 percent increase from the previous year. Postgraduate enrolment for both master’s and doctoral students also reached a peak of 21,987 in 2011, increasing 4.3 percent from 2010.
Canadian programs are a popular choice for international engineering students. At the undergraduate level, the number of visa students rose 64 percent since 2007, accounting for 13.2 percent of total undergraduate enrolment. The number of visa post-graduate students has also grown by an astounding 54.5 percent since 2007, accounting for over one-third of graduate student enrolment in 2011.
In 2011, female and male undergraduate enrolments grew by 4.4 percent and 4.6 percent respectively. The proportion of women enrolled in undergraduate engineering programs remained at 17.7 percent in 2011.
It is encouraging to report that the number of undergraduate degrees awarded continued to grow with 11,703 degrees awarded in 2011, a moderate increase of 2.2 percent from the previous year.
Finally, this report examines the globalization and internationalization of engineering education in the faculty, undergraduate and graduate student population. The 39 participating institutions revealed that two-thirds of undergraduate faculties and more than half of graduate faculties have formal arrangements with engineering faculties outside of Canada. Countries with the largest cross collaboration connections include France, China, Germany and Mexico. Programs in Quebec are national leaders.
Altogether, the report highlights 2011 as a stable year.
Marie Carter, FEC, P.Eng.
InterIm ChIef exeCutIve OffICer / ChIef OperatIng OffICer engIneers Canada

iii
Table of ContentsMessage from the Chief Executive Officer . . . . . . . . . . . . . . . . . . . . . . . . . . . . . . . . . . . . . . . . . . . . . . . . . iiAcknowledgements . . . . . . . . . . . . . . . . . . . . . . . . . . . . . . . . . . . . . . . . . . . . . . . . . . . . . . . . . . . . . . . . . ivForeword . . . . . . . . . . . . . . . . . . . . . . . . . . . . . . . . . . . . . . . . . . . . . . . . . . . . . . . . . . . . . . . . . . . . . . . . ivHighlights. . . . . . . . . . . . . . . . . . . . . . . . . . . . . . . . . . . . . . . . . . . . . . . . . . . . . . . . . . . . . . . . . . . . . . . . vUndergraduate Student Enrolment and Degrees Awarded . . . . . . . . . . . . . . . . . . . . . . . . . . . . . . . . . . . . . 1
Foreword . . . . . . . . . . . . . . . . . . . . . . . . . . . . . . . . . . . . . . . . . . . . . . . . . . . . . . . . . . . . . . . . . . . . . . . . . . . . . . . . . . . . . . . . . 1Undergraduate Student Enrolment . . . . . . . . . . . . . . . . . . . . . . . . . . . . . . . . . . . . . . . . . . . . . . . . . . . . . . . . . . . . . . . . . . . . . 1Undergraduate Student Enrolment by Program . . . . . . . . . . . . . . . . . . . . . . . . . . . . . . . . . . . . . . . . . . . . . . . . . . . . . . . . . . . 2Trends in Undergraduate Student Enrolment by Province . . . . . . . . . . . . . . . . . . . . . . . . . . . . . . . . . . . . . . . . . . . . . . . . . . . 3Female Undergraduate Enrolment . . . . . . . . . . . . . . . . . . . . . . . . . . . . . . . . . . . . . . . . . . . . . . . . . . . . . . . . . . . . . . . . . . . . . 4Undergraduate Enrolment of International (Visa) Students . . . . . . . . . . . . . . . . . . . . . . . . . . . . . . . . . . . . . . . . . . . . . . . . . . 5Undergraduate Degrees Awarded. . . . . . . . . . . . . . . . . . . . . . . . . . . . . . . . . . . . . . . . . . . . . . . . . . . . . . . . . . . . . . . . . . . . . . 5
Post-Graduate Enrolment and Degrees Awarded . . . . . . . . . . . . . . . . . . . . . . . . . . . . . . . . . . . . . . . . . . . . 8Foreword . . . . . . . . . . . . . . . . . . . . . . . . . . . . . . . . . . . . . . . . . . . . . . . . . . . . . . . . . . . . . . . . . . . . . . . . . . . . . . . . . . . . . . . . . 8Number of Graduate Students. . . . . . . . . . . . . . . . . . . . . . . . . . . . . . . . . . . . . . . . . . . . . . . . . . . . . . . . . . . . . . . . . . . . . . . . . 8
Master’s Students. . . . . . . . . . . . . . . . . . . . . . . . . . . . . . . . . . . . . . . . . . . . . . . . . . . . . . . . . . . . . . . . . . . . . . . . . . . . . . 8Doctoral Students. . . . . . . . . . . . . . . . . . . . . . . . . . . . . . . . . . . . . . . . . . . . . . . . . . . . . . . . . . . . . . . . . . . . . . . . . . . . . . 9
Post-Graduate Enrolment by Discipline . . . . . . . . . . . . . . . . . . . . . . . . . . . . . . . . . . . . . . . . . . . . . . . . . . . . . . . . . . . . . . . . . . 9Post-Graduate Enrolment of International (Visa) Students. . . . . . . . . . . . . . . . . . . . . . . . . . . . . . . . . . . . . . . . . . . . . . . . . . . 10Post-Graduate Enrolment by Gender . . . . . . . . . . . . . . . . . . . . . . . . . . . . . . . . . . . . . . . . . . . . . . . . . . . . . . . . . . . . . . . . . . . 11Post-Graduate Degrees Awarded . . . . . . . . . . . . . . . . . . . . . . . . . . . . . . . . . . . . . . . . . . . . . . . . . . . . . . . . . . . . . . . . . . . . . . 12
Internationalization/Globalization of Engineering Education . . . . . . . . . . . . . . . . . . . . . . . . . . . . . . . . . . . 15Foreword . . . . . . . . . . . . . . . . . . . . . . . . . . . . . . . . . . . . . . . . . . . . . . . . . . . . . . . . . . . . . . . . . . . . . . . . . . . . . . . . . . . . . . . . . 15Overview . . . . . . . . . . . . . . . . . . . . . . . . . . . . . . . . . . . . . . . . . . . . . . . . . . . . . . . . . . . . . . . . . . . . . . . . . . . . . . . . . . . . . . . . . 15Global Arrangements. . . . . . . . . . . . . . . . . . . . . . . . . . . . . . . . . . . . . . . . . . . . . . . . . . . . . . . . . . . . . . . . . . . . . . . . . . . . . . . . 16Co-ops, Internships & Courses . . . . . . . . . . . . . . . . . . . . . . . . . . . . . . . . . . . . . . . . . . . . . . . . . . . . . . . . . . . . . . . . . . 17
Conclusion . . . . . . . . . . . . . . . . . . . . . . . . . . . . . . . . . . . . . . . . . . . . . . . . . . . . . . . . . . . . . . . . . . . . . . . 18Appendix A. . . . . . . . . . . . . . . . . . . . . . . . . . . . . . . . . . . . . . . . . . . . . . . . . . . . . . . . . . . . . . . . . . . . . . . 20
Data Tabulations – Engineering Enrolment and Degrees Awarded . . . . . . . . . . . . . . . . . . . . . . . . . . . . . . . . . . . . . . . . . . . . 20School Name and Acronym . . . . . . . . . . . . . . . . . . . . . . . . . . . . . . . . . . . . . . . . . . . . . . . . . . . . . . . . . . . . . . . . . . . . . . . . . . . 20Province name and Abbreviation . . . . . . . . . . . . . . . . . . . . . . . . . . . . . . . . . . . . . . . . . . . . . . . . . . . . . . . . . . . . . . . . . . . . . . 21
A.1. Undergraduate Enrolment. . . . . . . . . . . . . . . . . . . . . . . . . . . . . . . . . . . . . . . . . . . . . . . . . . . . . . . . . . . . . . . . . . . . . . . . . . . . 21U.1. National. . . . . . . . . . . . . . . . . . . . . . . . . . . . . . . . . . . . . . . . . . . . . . . . . . . . . . . . . . . . . . . . . . . . . . . . . . . . . . . . . . . . . . . 21U.2. Provincial . . . . . . . . . . . . . . . . . . . . . . . . . . . . . . . . . . . . . . . . . . . . . . . . . . . . . . . . . . . . . . . . . . . . . . . . . . . . . . . . . . . . . 23U.3. Institutional. . . . . . . . . . . . . . . . . . . . . . . . . . . . . . . . . . . . . . . . . . . . . . . . . . . . . . . . . . . . . . . . . . . . . . . . . . . . . . . . . . . . 25
A.2. Undergraduate Degrees Awarded. . . . . . . . . . . . . . . . . . . . . . . . . . . . . . . . . . . . . . . . . . . . . . . . . . . . . . . . . . . . . . . . . . . . . . 28UD.1. National. . . . . . . . . . . . . . . . . . . . . . . . . . . . . . . . . . . . . . . . . . . . . . . . . . . . . . . . . . . . . . . . . . . . . . . . . . . . . . . . . . . . . . 28UD.2. Provincial . . . . . . . . . . . . . . . . . . . . . . . . . . . . . . . . . . . . . . . . . . . . . . . . . . . . . . . . . . . . . . . . . . . . . . . . . . . . . . . . . . . . 28UD.3. Institutional. . . . . . . . . . . . . . . . . . . . . . . . . . . . . . . . . . . . . . . . . . . . . . . . . . . . . . . . . . . . . . . . . . . . . . . . . . . . . . . . . . . 30
A.3. Post Graduate Student Enrolment. . . . . . . . . . . . . . . . . . . . . . . . . . . . . . . . . . . . . . . . . . . . . . . . . . . . . . . . . . . . . . . . . . . . . . 33G.1. National. . . . . . . . . . . . . . . . . . . . . . . . . . . . . . . . . . . . . . . . . . . . . . . . . . . . . . . . . . . . . . . . . . . . . . . . . . . . . . . . . . . . . . . 33G.2. Provincial . . . . . . . . . . . . . . . . . . . . . . . . . . . . . . . . . . . . . . . . . . . . . . . . . . . . . . . . . . . . . . . . . . . . . . . . . . . . . . . . . . . . . 35G.3. Institutional. . . . . . . . . . . . . . . . . . . . . . . . . . . . . . . . . . . . . . . . . . . . . . . . . . . . . . . . . . . . . . . . . . . . . . . . . . . . . . . . . . . . 37
A.4. Post Graduate Degrees Awarded . . . . . . . . . . . . . . . . . . . . . . . . . . . . . . . . . . . . . . . . . . . . . . . . . . . . . . . . . . . . . . . . . . . . . . 43GD.1. National. . . . . . . . . . . . . . . . . . . . . . . . . . . . . . . . . . . . . . . . . . . . . . . . . . . . . . . . . . . . . . . . . . . . . . . . . . . . . . . . . . . . . . 43GD.2. Provincial . . . . . . . . . . . . . . . . . . . . . . . . . . . . . . . . . . . . . . . . . . . . . . . . . . . . . . . . . . . . . . . . . . . . . . . . . . . . . . . . . . . . 44GD.3. Institutional. . . . . . . . . . . . . . . . . . . . . . . . . . . . . . . . . . . . . . . . . . . . . . . . . . . . . . . . . . . . . . . . . . . . . . . . . . . . . . . . . . . 47
A.5. Faculty Members by Institution . . . . . . . . . . . . . . . . . . . . . . . . . . . . . . . . . . . . . . . . . . . . . . . . . . . . . . . . . . . . . . . . . . . . . . . . 51F.1. Faculty Composition. . . . . . . . . . . . . . . . . . . . . . . . . . . . . . . . . . . . . . . . . . . . . . . . . . . . . . . . . . . . . . . . . . . . . . . . . . . . . . 51
A.6. Co-op, Internship and Professional Experience Programs . . . . . . . . . . . . . . . . . . . . . . . . . . . . . . . . . . . . . . . . . . . . . . . . . . . 52C.1. Industry Experience Options by Institution. . . . . . . . . . . . . . . . . . . . . . . . . . . . . . . . . . . . . . . . . . . . . . . . . . . . . . . . . . . . 52
Appendix B – Accredited Engineering Programs by Institution . . . . . . . . . . . . . . . . . . . . . . . . . . . . . . . . . . . . . . . . . . . . . . . . . . 53Appendix C – Canadian Discipline Categories As Used In This Report. . . . . . . . . . . . . . . . . . . . . . . . . . . . . . . . . . . . . . . . . . . . . 59Appendix D – Associated Universities Explained . . . . . . . . . . . . . . . . . . . . . . . . . . . . . . . . . . . . . . . . . . . . . . . . . . . . . . . . . . . . . 62Appendix E – Survey Procedures and Data Compilation Methodology . . . . . . . . . . . . . . . . . . . . . . . . . . . . . . . . . . . . . . . . . . . . 63

iv
AcknowledgementsEngineers Canada gratefully acknowledges the contribution of data and information from the deans and associate deans of the engineering and applied science faculties at Canadian universities.
ForewordEach year, Engineers Canada gathers data on student enrolment and graduations from Canada’s universities. This report analyzes trends in engineering student enrolment within accredited engineering programs across the nation.
Understanding these trends enables Engineers Canada and other members of the profession to:
• Compare patterns in the changing number of students who enroll in and graduate from the various engieneering programs offered in the provinces;
• Assess the number of women and visa students who are pursuing engineering education; and
• Exchange pertinent information about similar and distinctly different trends across disciplines and institutions.

v
HighlightsThe 2011 trends in enrolment and degrees awarded capture the following highlights:
• After robust growth in 2010, undergraduate and post graduate enrolment and graduations experienced moderate growth in 2011; master’s degrees awarded rose 9.2 percent from the previous year and have risen 30.8 percent since 2007;
• Important variances in growth by program; civil engineering continues to outpace undergraduate enrolment in electrical engineering. Furthermore, enrolments in computer and industrial and manufacturing engineering increased after consecutive years of decline since 2007. For post-graduate enrolment, computer engineering is making a comeback in master’s enrolment while civil engineering experienced a larger rise in doctoral enrolment in 2011;
• The proportion of women enrolled and graduations is holding steady with minimal growth from the previous year;
• The number of women enrolled in undergraduate engineering programs has reached a new record in 2011; and
• Enrolment of visa students continues to grow faster than for Canadian students; 2011 saw enrolment in Canadian full-time graduate students decline.
A special survey of 39 universities gathered answers to questions about the internationalization and globalization of engineering education. The survey reports that:
• More than two-thirds of undergraduate engineering faculties and more than half of graduate faculties have formal arrangements with engineering faculties outside of Canadian borders. The most popular countries for these arrangements are: France, China, Germany and Mexico. These countries were also the top destinations for the exchange of engineering faculty members;
• Although participation with foreign schools is prevalent, only six out of the 39 universities surveyed indicated they had formally mandated committees that introduce global aspects into engineering education;
• There are more foreign undergraduate engineering students completing their studies in Canada than Canadian students completing engineering studies abroad; and
• Currently, undergraduate faculties house more foreign exchange students (1,300) than graduate engineering faculties (80).

vi
Visions of things to come
ENGINEERING
1
Undergraduate Student Enrolment and Degrees Awarded
FOREWORDIn 2011, 49 universities reported their enrolment, staffing, program and graduation information.
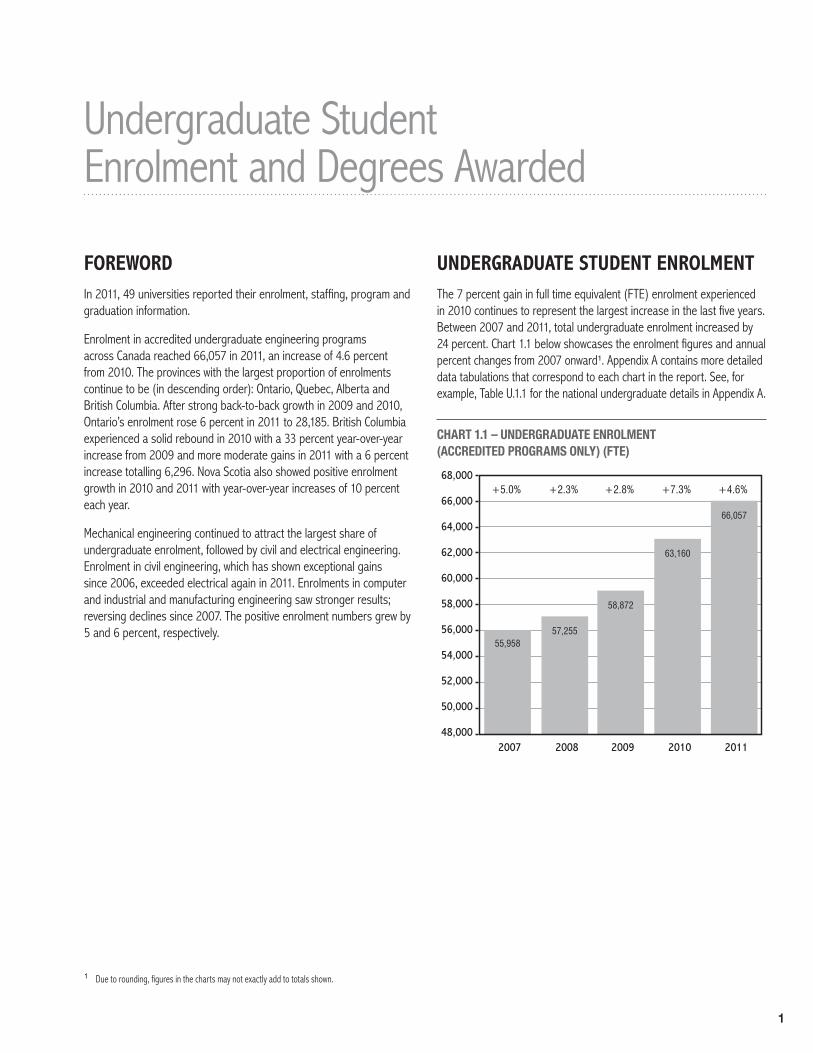
Enrolment in accredited undergraduate engineering programs across Canada reached 66,057 in 2011, an increase of 4.6 percent from 2010. The provinces with the largest proportion of enrolments continue to be (in descending order): Ontario, Quebec, Alberta and British Columbia. After strong back-to-back growth in 2009 and 2010, Ontario’s enrolment rose 6 percent in 2011 to 28,185. British Columbia experienced a solid rebound in 2010 with a 33 percent year-over-year increase from 2009 and more moderate gains in 2011 with a 6 percent increase totalling 6,296. Nova Scotia also showed positive enrolment growth in 2010 and 2011 with year-over-year increases of 10 percent each year.
Mechanical engineering continued to attract the largest share of undergraduate enrolment, followed by civil and electrical engineering. Enrolment in civil engineering, which has shown exceptional gains since 2006, exceeded electrical again in 2011. Enrolments in computer and industrial and manufacturing engineering saw stronger results; reversing declines since 2007. The positive enrolment numbers grew by 5 and 6 percent, respectively.
UNDERGRADUATE STUDENT ENROLMENTThe 7 percent gain in full time equivalent (FTE) enrolment experienced in 2010 continues to represent the largest increase in the last five years. Between 2007 and 2011, total undergraduate enrolment increased by 24 percent. Chart 1.1 below showcases the enrolment figures and annual percent changes from 2007 onward1. Appendix A contains more detailed data tabulations that correspond to each chart in the report. See, for example, Table U.1.1 for the national undergraduate details in Appendix A.
CHART 1.1 – UNDERGRADUATE ENROLMENT (ACCREDITED PROGRAMS ONLY) (FTE)
68,000
66,000
64,000
62,000
60,000
58,000
56,000
54,000
52,000
50,000
48,000
55,95857,255
58,872
63,160
66,057
2007 2008 2009 2010 2011
+5.0% +2.3% +2.8% +7.3% +4.6%
1 Due to rounding, figures in the charts may not exactly add to totals shown.

2
Chart 1.2 adds enrolment in yet-to-be accredited programs to the totals. These unaccredited enrolments fluctuate between 1600 and 2700 each year and do not have a big impact on the totals or trends.
These yet-to-be accredited programs include new engineering faculties, expansion of existing schools into other traditional disciplines, and development of more specialized undergraduate programs at existing schools, such as mechanics, energy systems, and biomedical engineering. As can be seen in Chart 1.2, when enrolment in yet-to-be accredited programs is combined with that of accredited programs, the total number of engineering undergraduate students reported across Canada is 68,846, up 5.4 percent from the previous year.
CHART 1.2 – UNDERGRADUATE ENROLMENT (ALL PROGRAMS) (FTE)
75,000
70,000
65,000
60,000
55,000
50,000
45,000
40,000
35,0002011
UNACCREDITED
2007 2008 2009 2010
+3.6% +2.2% +3.2% +7.6% +5.4%
66,05755,958 57,255 58,872
1,6291,604
1,858
2,171
2,789
63,160
57,587 58,859 60,730 65,331 68,846
ACCREDITED
UNDERGRADUATE STUDENT ENROLMENT BY PROGRAM2
Mechanical engineering continues to lead in undergraduate enrolments, with 13,628 FTEs reported in 2011 (see Table U.1.1), a slight drop (-0.25 percent) from the previous year’s enrolment number of 13,662. The program with the second largest enrolment is civil engineering, which has shown the strongest gains since 2006 relative to the other programs. There were 10,987 FTEs reported for 2011, a 3.6 percent increase from the previous year, and a sizeable 32 percent increase from 2007. Enrolment in electrical engineering has been outpaced by civil engineering since 2008 and electrical remains in third place in terms of enrolment in 2010 and 2011.
Although enrolment growth was positive for electrical it was marginal in contrast to the other programs. In 2011 there were 9,903 FTEs, a 3.3 percent increase from the previous year, and an 8.6 percent increase from 2007. As illustrated in Chart 1.3, enrolment in chemical engineering has been growing steadily throughout the years but dropped slightly in 2011, totalling 5,086 FTEs. Aside from the 2 percent drop in enrolment, chemical engineering experienced a gain of 20 percent since 2007. In contrast, enrolment in computer engineering edged upwards in 2011, growing by 4.5 percent to 3,655 FTEs. Computer engineering enrolment has declined by 7.2 percent since 2007.
CHART 1.3 – UNDERGRADUATE ENROLMENT BY PROGRAM (1) (FTE)
2,000
4,000
6,000
8,000
10,000
12,000
14,000
16,000
2007 2008 2009 2010 2011
Chemical Civil Common Year 1&2
Computer Electrical Engineering Physics
Mechanical
As illustrated in Chart 1.4, enrolment in software engineering continued to grow into 2011. After a period of slower growth from 2006 to 2008, enrolment rose more in 2009, and has been steadily increasing to 2,286 FTEs in 2011, a 4 percent increase from the previous year. Enrolment in industrial and manufacturing engineering experienced a rebound in 2011 with a 6.3 percent increase, or 1,766 FTEs. Since 2007, industrial and manufacturing enrolment shrank by 11.4 percent.
The following programs have lower enrolment but sustained growth rates in 2010 and 2011: environmental engineering (8.5 percent, to 1240 FTEs); materials or metallurgical (7.2 percent, to 994); mining or mineral and geological (6.1 percent, to 630 FTES). Biosystems engineering experienced a small dip in 2011 enrolment, down 3.8 percent to 754 from 784 in 2010.
Environmental engineering and mining or mineral engineering stand-out for their exceptional growth, expanding by 66.2 percent and 54.1 percent, respectively, from 2007-2011.
2 This and all following sections refer to enrolment in currently accredited programs only.
3
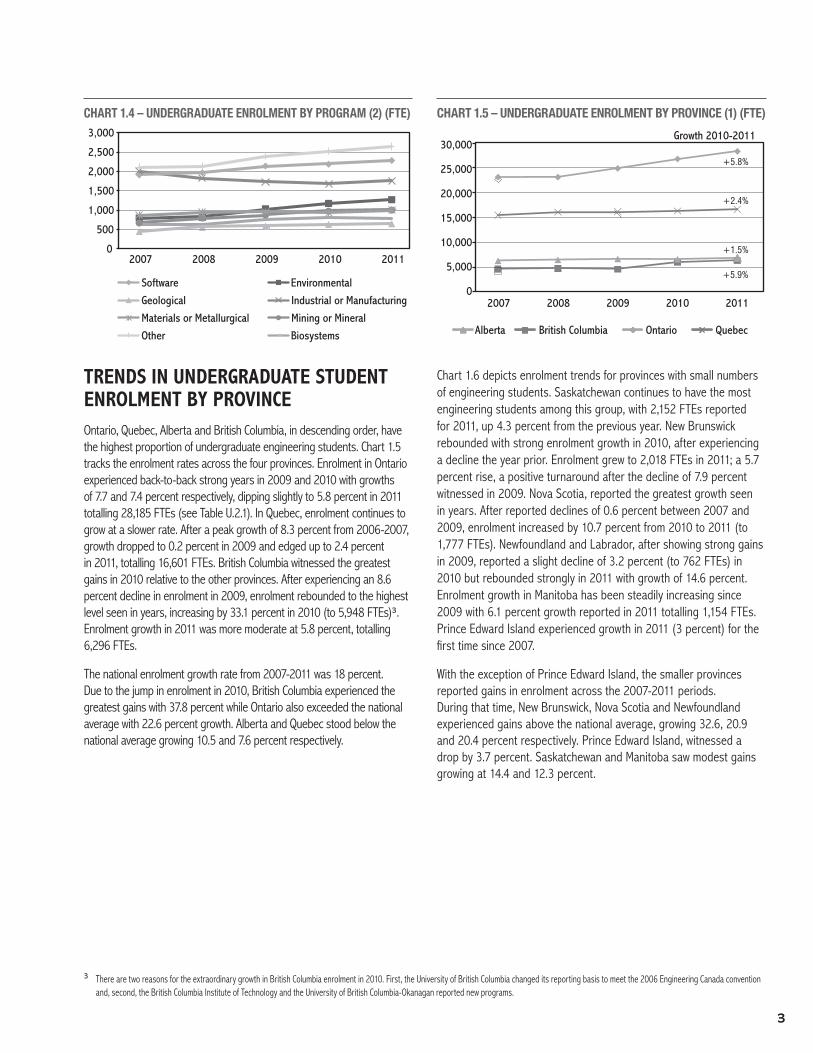
CHART 1.4 – UNDERGRADUATE ENROLMENT BY PROGRAM (2) (FTE)
0
500
1,000
1,500
2,000
2,500
3,000
2007 2008 2009 2010 2011
Software Environmental
Geological Industrial or Manufacturing
Materials or Metallurgical Mining or Mineral
Other Biosystems
TRENDS IN UNDERGRADUATE STUDENT ENROLMENT BY PROVINCEOntario, Quebec, Alberta and British Columbia, in descending order, have the highest proportion of undergraduate engineering students. Chart 1.5 tracks the enrolment rates across the four provinces. Enrolment in Ontario experienced back-to-back strong years in 2009 and 2010 with growths of 7.7 and 7.4 percent respectively, dipping slightly to 5.8 percent in 2011 totalling 28,185 FTEs (see Table U.2.1). In Quebec, enrolment continues to grow at a slower rate. After a peak growth of 8.3 percent from 2006-2007, growth dropped to 0.2 percent in 2009 and edged up to 2.4 percent in 2011, totalling 16,601 FTEs. British Columbia witnessed the greatest gains in 2010 relative to the other provinces. After experiencing an 8.6 percent decline in enrolment in 2009, enrolment rebounded to the highest level seen in years, increasing by 33.1 percent in 2010 (to 5,948 FTEs)3. Enrolment growth in 2011 was more moderate at 5.8 percent, totalling 6,296 FTEs.
The national enrolment growth rate from 2007-2011 was 18 percent. Due to the jump in enrolment in 2010, British Columbia experienced the greatest gains with 37.8 percent while Ontario also exceeded the national average with 22.6 percent growth. Alberta and Quebec stood below the national average growing 10.5 and 7.6 percent respectively.
CHART 1.5 – UNDERGRADUATE ENROLMENT BY PROVINCE (1) (FTE)
30,000
25,000
20,000
15,000
10,000
5,000
02007
Alberta British Columbia Ontario Quebec
Growth 2010-2011
2008 2009 2010 2011
+5.8%
+2.4%
+1.5%
+5.9%
Chart 1.6 depicts enrolment trends for provinces with small numbers of engineering students. Saskatchewan continues to have the most engineering students among this group, with 2,152 FTEs reported for 2011, up 4.3 percent from the previous year. New Brunswick rebounded with strong enrolment growth in 2010, after experiencing a decline the year prior. Enrolment grew to 2,018 FTEs in 2011; a 5.7 percent rise, a positive turnaround after the decline of 7.9 percent witnessed in 2009. Nova Scotia, reported the greatest growth seen in years. After reported declines of 0.6 percent between 2007 and 2009, enrolment increased by 10.7 percent from 2010 to 2011 (to 1,777 FTEs). Newfoundland and Labrador, after showing strong gains in 2009, reported a slight decline of 3.2 percent (to 762 FTEs) in 2010 but rebounded strongly in 2011 with growth of 14.6 percent. Enrolment growth in Manitoba has been steadily increasing since 2009 with 6.1 percent growth reported in 2011 totalling 1,154 FTEs. Prince Edward Island experienced growth in 2011 (3 percent) for the first time since 2007.
With the exception of Prince Edward Island, the smaller provinces reported gains in enrolment across the 2007-2011 periods. During that time, New Brunswick, Nova Scotia and Newfoundland experienced gains above the national average, growing 32.6, 20.9 and 20.4 percent respectively. Prince Edward Island, witnessed a drop by 3.7 percent. Saskatchewan and Manitoba saw modest gains growing at 14.4 and 12.3 percent.
3 There are two reasons for the extraordinary growth in British Columbia enrolment in 2010. First, the University of British Columbia changed its reporting basis to meet the 2006 Engineering Canada convention and, second, the British Columbia Institute of Technology and the University of British Columbia-Okanagan reported new programs.

4
CHART 1.6 – UNDERGRADUATE ENROLMENT BY PROVINCE (2) (FTE)
Manitoba New Brunswick Prince Edward IslandNewfoundland Nova Scotia Saskatchewan
+3.2%
+5.7%
+10.7%
+6.1%
+14.6%
+3.0%
Growth 2010-2011
2007 2008 2009 2010 2011
2,500
2,000
1,500
1,000
500
0
FEMALE UNDERGRADUATE ENROLMENTIn 2011, 11,690 female undergraduates were studying engineering in accredited Canadian programs; 17.7 percent of total enrolment (see Table U.1.2 in Appendix A). Female enrolment reached a record high level in 2011, passing the 10,456 peak reached in 2002. In 2009 and 2010, enrolment growth among females surpassed the male growth rate – a pattern not seen since 2001. 2010 saw female and male undergraduate enrolments growing by 9.8 percent and 6.8 percent respectively. In 2011 the female growth rate (4.4 percent) edged slightly below the male growth rate (4.6 percent). Female enrolment reached a peak of 20.6 percent of total enrolment in 2001 and has fluctuated between 17 and 19 percent for the greater part of the decade. Chart 1.7 tracks these female enrolment trends.
CHART 1.7 – UNDERGRADUATE ENROLMENT BY GENDER (FTE)*
Male Female % Female
1996 1997 1998 1999 2001 2002 2003 2004 2005 2006 2007 2008 2009 2010 2011
60,00055,00050,00045,00040,00035,00030,00025,00020,00015,00010,0005,000
0
50%
40%
30%
20%
10%
0%
7,73
6
8,09
9
8,49
3
9,21
7
9,56
1
10,1
99
10,4
56
10,4
23
10,0
11
9,53
0
9,35
0
9,68
2
9,79
7
10,1
99
11,2
00
11,6
90
18.9% 19.3% 19.3% 20.6% 20.3% 20.6% 19.9% 19.2%18.2% 17.4% 17.5% 17.3% 17.1% 17.3% 17.7% 17.7%
2000
* FTEs are reported since 2006 and full-time students only prior to 2006.
There are wide variations in female participation across programs. Over the past several years female students have been best represented in: environmental (41.1 percent), biosystems (39 percent), geological (38.1 percent) and chemical engineering (33.7 percent), (see Chart 1.7a and Tables U.1.1 and U.1.3 in Appendix A). A second group of programs report female enrolment above 20 percent: industrial/manufacturing engineering (23.3 percent), civil engineering (21.8 percent) and materials/metallurgical (21.7 percent). The lowest proportion of female enrolment was reported for electrical engineering (12.1 percent), computer engineering (10.2 percent) and mechanical engineering (10.1 percent).
CHART 1.7A – UNDERGRADUATE ENROLMENT OF FEMALES BY PROGRAM, 2011 (FTE)
0% 5%
10%15%20%25%30%35%40%45% 41.1%
39.0% 38.1%33.7%
23.3% 21.8% 21.7%19.4%
16.4% 16.2% 16.2%12.1% 10.2% 10.1%
Envir
onmen
tal
Biosys
tems
Geolo
gical
Chem
ical
Indus
trial o
r Man
ufactu
ring
Civil
Materia
ls or
Metallu
rgical
Year
One/Tw
o Com
mon Ye
ar
Softw
are
Mining
or M
ineral
Engin
eerin
g Phy
sics
Electr
ical
Compu
ter
Mechan
ical
In 2011, the highest proportion of female students was reported in Prince Edward Island (24.3 percent) and Alberta (21.4 percent). Newfoundland slipped to third highest at 20.9 percent (see Chart 1.7b and Table U.2.2 in Appendix A). The percentage of female students in Saskatchewan (20 percent), and Nova Scotia (18.4 percent) were also above the Canadian average of 17.7. Female representation in Ontario dropped slightly below the national average in 2011 to 17.5 percent. Alongside Ontario, Manitoba (16.8 percent), New Brunswick (16.7 percent) and Quebec (16.6 percent) reported female enrolment below the Canadian average with British Columbia having the lowest at 16.3 percent.

5
CHART 1.7B – UNDERGRADUATE ENROLMENT OF FEMALES BY PROVINCE, 2011 (FTE)
30%
25%
20%
15%
10%
5%
0%
Albert
a
Britis
h Colu
mbia
Manito
ba
New Br
unsw
ick
Newfou
ndlan
d
Nova S
cotia
Ontario
Prince
Edward
Islan
d
Quebe
c
Saska
tchew
an
21.4%
AVG. CANADA
16.8%16.3% 16.7%
20.9% 18.4% 17.5% 24.3%
16.6%
20.0%
UNDERGRADUATE ENROLMENT OF INTERNATIONAL (VISA) STUDENTSThe proportion of international students attending accredited engineering programs continues to rise. Chart 1.8 tracks the proportion of visa students in 2011: 13.2 percent of total undergraduate enrolment (8,688 visa students). Since 2007, the number of visa students has risen an impressive 64 percent, three times faster than for Canadian students (see Table U.2.3).
CHART 1.8 – UNDERGRADUATE ENROLMENT OF VISA STUDENTS (FTE)
6,014 6,468 6,955 7,744 8,688
10.7% 11.3% 11.8% 12.3% 13.2%
0%
10%
20%
30%
40%
50%
10,000
0
20,000
30,000
40,000
50,000
70,000
60,000
2007 2008 2009 2010 2011
CDN. STUDENTS VISA STUDENTS % VISA STUDENTS
49,944 50,787 51,91755,416 57,369
Ontario, Quebec, British Columbia and Alberta absorbed the majority of visa student enrolment in 2011. Of these four provinces, Quebec reported the largest proportion of visa student enrolment (13.8 percent), followed by Ontario and British Columbia both at 12.1 percent and Alberta at 9.5 percent.
Among the other provinces, New Brunswick continues to report the highest proportion of visa students; the proportion shot up 12.3 percentage points from the previous year to 30.3 percent in 2011. Nova Scotia and Saskatchewan followed with 17.9 percent each and Manitoba reported 12.9 percent. Since 2010, Prince Edward Island continues to experience visa students in double-digit proportions; 2010 saw 14 percent while 2011 experienced a slight decrease to 11.7 percent.
UNDERGRADUATE DEGREES AWARDED A total of 11,703 undergraduate degrees in engineering were awarded in 2011, an increase of 2.2 percent from the year before (see Chart 1.9 and Table UD.1.1 in Appendix A). Since 2009, growth in degrees awarded has been rising4.
CHART 1.9 – UNDERGRADUATE ENROLMENT (FTE) AND DEGREES AWARDED (ACCREDITED PROGRAMS ONLY)
UNDERGRAD. ENROLMENT UNDERGRAD. DEGREES % CHANGE IN DEGREES AWARDED
-8%
-6%
-4%
-2%
0%
2%
4%
6%
8%
0
10,000
20,000
30,000
40,000
50,000
60,000
70,000
2007 2008 2009 2010 2011
4.6%
1.5%
-7.2%
6.2%
2.2%
55,958 57,255 58,87263,160
66,057
11,451 11,619 10,781 11,450 11,703
4 The decline in 2009 may have been a result of the ‘double cohort’ of Ontario high school students who began to enter university in the fall of 2003. The double cohort comprised graduating students from both the last of the discontinued Ontario Academic Credit (OAC) programs and the first of the “Grade 12” university-preparation programs across Ontario.

6
In 2011, mechanical engineering remained the program in which the most undergraduate degrees were awarded, with 2,976. Civil engineering (2,191) surpassed electrical engineering (2,050), while chemical (1,158) took fourth place. Of these top four, civil and chemical engineering reported an increase in degrees awarded with 13.9 percent and 1.1 percent respectively. Mechanical and electrical posted small declines of 0.2 percent and 2.3 percent. The program with the largest increase in undergraduate degrees awarded in 2011 was environmental with a 30.2 percent increase, followed by civil engineering with an increase of 13.9 percent. The three disciples that experienced the worst year-over-year declines were industrial or manufacturing (-10.5 percent), computer engineering (-13.8 percent) and engineering physics (-15.3 percent).
The number of undergraduate engineering degrees awarded to females increased by 8.1 percent in 2011 from the previous year, totalling 2,110 (see Table UD.1.2). Males saw a much smaller increase of one percent, totalling 9,594 degrees awarded in 2011. Since 2007, the number of degrees awarded to women declined by 2.5 percent, however 2010 marked the first rise in absolute numbers witnessed in the past few years with continued growth in 2011. In direct contrast, the number awarded to men, since 2007, grew by 3.3 percent. As seen in Chart 1.9a, females were awarded 18 percent of all undergraduate engineering degrees in 2011, compared to the high of 19.4 percent in 2006.
CHART 1.9A– UNDERGRADUATE ENROLMENT AND DEGREES AWARDED BY GENDER (ACCREDITED PROGRAMS ONLY)
0%
10%
20%
30%
40%
50%
0
2,000
4,000
6,000
8,000
10,000
12,000
2007 2008 2009 2010 2011
MALE, UNDERGRAD. DEGREES FEMALE, UNDERGRAD. DEGREES
% FEMALE, UNDERGRAD. DEGREES
18.9% 18.0% 17.6% 17.0% 18.0%
9,288
2,163
9,525
2,094
8,883
1,898
9,498
1,952
9,594
2,110
The number of undergraduate degrees awarded to international students in 2011 was 1,033, an increase of 5.1 percent over 2010, and a substantial increase of 33.5 percent since 2007 (see Table UD.2.3 in Appendix A). As illustrated in Chart 1.9b, degrees awarded to international students comprised 8.8 percent of the total in 2011, compared to 6.8 percent in 2007.
CHART 1.9B– UNDERGRADUATE ENROLMENT (FTE) AND DEGREES AWARDED BY VISA STUDENTS (ACCREDITED PROGRAMS ONLY)
0%
5%
10%
15%
20%
0
2,000
4,000
6,000
8,000
10,000
12,000
2007 2008 2009 2010 2011
CDN. UNDERGRAD. DEGREES VISA UNDERGRAD. DEGREES
% VISA UNDERGRAD. DEGREES
6.8%7.4%
8.7% 8.6% 8.8%
10,677
774
10,754
865
9,844
937
10,467
983
10,670
1033

7
Promoting high standards and mobility for the Canadian
ENGINEER

8
Post-Graduate Enrolment and Degrees Awarded
FOREWORDTotal post-graduate enrolment of both full-and-part-time students grew by 4.3 percent in 2011, to a total of 21,987 master’s and doctoral students across Canada. Growth in master’s students in 2011 was slightly higher compared to doctoral students, with a growth rate of 5.1 percent versus three percent.
The proportion of engineering graduate students who are female has risen slowly from 2006, accounting for 21.7 percent of enrolments by 2011, a total of 4,327.
The overall growth in post-graduate enrolment in Canadian engineering programs continues to be linked to the rise of international students. The number of visa graduate students increased by 54.5 percent since 2007, totalling 8,311 FTEs. This far outpaces the growth of Canadian citizens or landed immigrants, which increased by 4.5 percent to 11,658 FTEs during the same period. International students accounted for 41.6 percent of graduate student enrolment in engineering in 2011, a proportion that has been increasing steadily.
NUMBER OF GRADUATE STUDENTSThere were 21,987 graduate students enrolled in master’s or doctoral programs in engineering across Canada in 20115. As shown in Chart 2.16, 2010 experienced sizeable growth at 9.8 percent while 2011 encountered a more moderate rate of 4.3 percent. Graduate enrolment declined in 2007, but master’s and doctoral enrolments have been growing since that time. 2011 saw increases of 5.1 percent and three percent respectively. In 2010, master’s and doctoral enrolments grew by 9.8 percent and 9.7 percent respectively (see Tables G1.1 through G.1.4 in Appendix A).
CHART 2.1 – NUMBER OF GRADUATE STUDENTS BY LEVEL
6,810 6,872 7,232 7,937
11,279 11,686 11,978 13,146
0
5,000
10,000
15,000
20,000
25,000
2007 2008 2009 2010 2011
DOCTORAL MASTERS
13,814
8,173
-1.3%
18,089
+2.6%
18,558
+3.5%
19,210
+9.8%
21,083
+4.3%
21,987
MASTER’S STUDENTSAlthough the proportion of part-time master’s students is relatively small (Chart 2.2), enrolment has been increasing since 2007 reaching 2,662 in 2011 (see Table G.1.3 in Appendix A). Full-time master’s enrolment grew at a faster rate in comparison to past years, increasing by 5.4 percent in 2011 and 11.7 percent in 2010; whereas in 2009 and 2008, the increase was only 0.8 percent and 2 percent respectively (see Table G.1.1 in Appendix A).
5 These figures represent counts of the actual number of students, whether studying full or part-time, and are substantially larger than enrolment levels reported as full-time equivalents.
6 Due to rounding, figures in this section may not exactly add to totals shown.

9
CHART 2.2 – NUMBER OF MASTER’S STUDENTS BY COURSE LOAD
2,063 2,285 2,505 2,565
2,662
02,000
4,000
6,000
8,000
10,000
12,000
14,000
16,000
18,000
2007 2008 2009 2010 2011
FT MASTERS
9,216 9,401 9,473 10,581 11,152
-1.8%
13,814
+3.6%
11,279
+2.5%
11,686
+9.8%
11,978
+5.1%
13,146
PT MASTERS
In absolute terms the number of part-time master’s students has increased, however the proportion of part-time students has decreased to 19.3 percent, a very slight dip from the 19.5 percent reported in 2010, and lower still than the peak of 22.5 percent achieved in 2006.
DOCTORAL STUDENTSAs shown in Chart 2.3, total doctoral enrolment continues to grow with reported increases of 9.7 percent and three percent for 2010 and 2011 respectively. Enrolment of part-time doctoral students declined by 2.9 percent in 2010; however growth in 2011 more than over-compensated for the decline by sharply rising 26.5 percent. After several years of hovering around the five percent mark, the proportion of part-time doctoral students is beginning to edge back towards its 2006 peak of 7.4 percent; it is currently at 6.3 percent.
CHART 2.3 – NUMBER OF DOCTORAL STUDENTS BY COURSE LOAD
346 339 419 407
0
2,000
4,000
6,000
8,000
10,000
2007 2008 2009 2010 2011
FT DOCTORAL
6,464 6,533 6,813 7,530 7,658
-0.5%
8,173
+0.9%
6,810
+5.2%
6,872
+9.7%
7,232
+3.0%
7,937
515
PT DOCTORAL
POST-GRADUATE ENROLMENT BY DISCIPLINEIn 2011, master’s enrolment was greatest in computer, electrical and mechanical engineering programs (see Chart 2.4). After a reported decline in 2009, enrolment in computer engineering jumped by 8.6 percent in 2010 and climbed a further 2.1 percent in 2011 to 3,020 FTEs (see Table G.1.5 in Appendix A). Electrical engineering experienced large gains in 2011 with a 10.6 percent rise totalling 2,048 FTEs. After posting strong gains in 2010, mechanical engineering fell by 2.2 percent to 1,933 FTEs.
CHART 2.4 – MASTER’S ENROLMENT BY DISCIPLINE (1) (FTE)
0
500
1,000
1,500
2,000
2,500
3,000
3,500
2007 2008 2009 2010 2011
Civil Mechanical
Chemical Other Computer Electrical
Among those master’s programs with smaller enrolment (see Chart 2.5), biosystems engineering grew by 14.1 percent in 2011 (452 FTEs) after reporting a drop of 3.2 percent in 2010, after years of strong growth. Enrolment in industrial or manufacturing engineering rebounded in the last few years, increasing by 18.9 percent in 2011 (403 FTEs) and by 21.9 percent in 2010 (339 FTEs), which is a sizeable turnaround after declines of 27.6 percent and 2.1 percent in 2008 and 2009. Materials/metallurgical engineering experienced strong growth (23 percent) in 2009 followed by 3 percent growth in 2010 and a decline of 7.6 percent in 2011 totalling 219 FTEs (see Table G.1.5 in Appendix A).

10
CHART 2.5 – MASTER’S ENROLMENT BY DISCIPLINE (2) (FTE)
0 50
100 150 200 250 300 350 400 450 500
2007 2008 2009 2010 2011
Biosystems Industrial, Manufacturing Materials, Metallurgical Environmental Engineering Physics Mining, Mineral Software
Geological
As seen in Chart 2.6, the largest doctoral programs saw a surge in enrolment in 2010 while 2011 saw slight declines for two of the top three disciplines, electrical and mechanical. Doctoral enrolment in electrical engineering consistently attracted the largest portion of students with 2,215 FTEs in 2011, a 0.6 percent drop from the previous year. Mechanical engineering attracted the second largest pool of doctoral students, and similar to electrical engineering, encountered a slight drop (0.3 percent) in 2011 totalling 1,323 FTEs. Civil engineering saw a larger rise in 2011 (6.7 percent to 1,185 FTES). Strong growth was reported among the other doctoral programs as well, with biosystems reporting consecutive double-digit gains since 2008. Enrolment in industrial or manufacturing engineering experienced a sharp gain in 2011, rising 55.6 percent (224 FTEs) after posting gains of 18 percent in the previous year. Materials or metallurgical, engineering physics, environmental and geological engineering all reported declines in doctoral enrolment in 2011 (see Table G.1.6 in Appendix A).
CHART 2.6 – DOCTORAL ENROLMENT: MAJOR DISCIPLINES (FTE)
0
500
1,000
1,500
2,000
2,500
2007 2008 2009 2010 2011
Biosystems Chemical Materials or Metallurgical Electrical Mechanical Civil
POST-GRADUATE ENROLMENT OF INTERNATIONAL (VISA) STUDENTSInternational students accounted for two-fifths (41.6 percent) of graduate student enrolment in engineering in 2011, a proportion that has been steadily increasing over the years. As shown in Chart 2.7, the growth of international graduate students has increased by 54.5 percent since 2007 (to 8,311 FTEs by 2011), far outpacing the growth of Canadian graduate students7, which posted a decline of 1.2 percent in 2011 to 11,658 FTEs8. Based on the findings, the growth in post-graduate enrolment in Canadian engineering programs reported over recent years is directly linked to the sizeable influx of international students.
CHART 2.7 – POST GRADUATE ENROLMENT OF CANADIAN AND VISA STUDENTS (FTE)
0%
10%
20%
30%
40%
50%
0
2,000
4,000
6,000
8,000
10,000
12,000
14,000
2007 2008 2009 2010 2011
CDN. STUDENTS VISA STUDENTS % VISA STUDENTS
5,379 5,6836,331
7,3838,31132.5%
11,658
33.8%
11,160
36.6%
11,108
38.5%
10,98041.6%
11,803
Considering master’s enrolment only, the number of Canadian FTE students decreased slightly in 2011 by 0.2 percent totalling 7,269; however an overall increase of four percent has been realized between 2007 and 2011. In contrast, visa student enrolment continues to rise, recording a 39.7 percent gain in 2011 and an impressive 61 percent increase between 2007 and 2011 (see Chart 2.7a)9.
7 Includes both Canadian citizens and landed immigrants.
8 Totals are derived from tables, G.1.5, G.1.6, G.1.9, and G.1.10. The numbers depicted in the chart are derived from calculations performed across the latter tables, taking into account all students (master’s and doctoral) versus visa students (master’s and doctoral).
9 Totals are derived from tables G.1.5 and G.1.9. The numbers depicted in the chart are derived from calculations performed across the latter tables, taking into account all master’s students versus visa master’s students only.

11
CHART 2.7A – MASTER’S ENROLMENT OF CANADIAN AND VISA STUDENTS (FTE)
0%
10%
20%
30%
40%
50%
0
1,000
2,000
3,000
4,000
5,000
6,000
7,000
8,000
2007 2008 2009 2010 2011
CDN. MASTERS VISA MASTERS % VISA MASTERS
2,970 3,1813,481
4,2334,78729.9%
7,269
31.4%
6,967
33.7%
6,963
36.8%
6,84439.7%
7,280
The growth in visa student doctoral enrolment over this period is also striking. As can be seen in Chart 2.7b, there were 3,524 visa doctoral students in 2011, a 46 percent increase since 2007. After previous years of decline, Canadian student doctoral enrolment increased by 9.4 percent in 2010 to 4,523 FTEs but decreased by three percent in 2011 to 4,839 FTEs, achieving an overall growth rate of five percent since 200710. In line with past years, proportionately more doctoral students versus master’s students were visa holders in 2011 (44.5 percent and 39.7 percent, respectively).
CHART 2.7B – DOCTORAL ENROLMENT OF CANADIAN AND VISA STUDENTS (FTE)
0%
10%
20%
30%
40%
50%
0 500
1,000 1,500 2,000 2,500 3,000 3,500 4,000 4,500 5,000
2007 2008 2009 2010 2011
CDN. DOCTORAL VISA DOCTORAL % VISA DOCTORAL
2,409 2,5022,850
3,1503,524
36.5%
4,389
37.6%
4,193
40.8%
4,14541.1%
4,136 44.5%4,523
POST-GRADUATE ENROLMENT BY GENDERThe proportion of female engineering graduate students has hovered at around 21 percent since 200711, specifically 21.7 percent in 2011. As depicted in Chart 2.8 however, the rate of growth in 2010 for both female and male enrolments was the highest seen in years: 9.9 percent (to 4,058 FTEs) and 11.1 percent (to 15,128 FTEs) respectively. Growth was more moderate in 2011 with 6.6 percent (4,327 FTEs) for females and 3.4 percent (15,642 FTEs) for males.
CHART 2.8 – POST GRADUATE ENROLMENT BY GENDER (FTE)
2007 2008 2009 2010 2011
0%
10%
20%
30%
40%
50%
0
5,000
10,000
15,000
20,000
MALE FEMALE % FEMALE
3,511 3,671 3,693 4,058 4,327
21.2%
15,642
21.9%
13,028
21.3%
13,120
21.2%
13,618
21.7%
15,128
With respect to master’s enrolment, the proportion of female students remained fairly constant over the years, as seen in Chart 2.8a. In 2011, there were 2,669 female master’s FTEs reported, comprising 22.1 percent of total enrolment12.
The representation of women in master’s programs varies by discipline but remains unchanged over time. In 2011, biosystems engineering included 42.9 percent females, followed by chemical (40 percent), civil (33.2 percent), computer (31.1 percent) and electrical (30.8 percent). Mechanical engineering used to be the master’s program with the lowest proportion of female FTEs (19.3 percent), however in 2011 mining or mineral (18.4 percent) and software engineering (17.9 percent) took the bottom spots.
10 Totals are derived from tables G.1.6 and G.1.10. The numbers depicted in the chart are derived from calculations performed across the latter tables, taking into account all doctoral students versus visa doctoral students only.
11 Totals are derived from tables G.1.5, G.1.6, G.1.7, and G.1.8. The numbers depicted in the chart are derived from calculations performed across the latter tables, taking into account all students (master’s and doctoral) versus female students (master’s and doctoral).
12 Totals are derived from tables G1.5 and G.17. The numbers depicted in the chart are derived from calculations performed across the latter two tables, the first taking into account all master’s students and the second taking into account female master’s students only.

12
CHART 2.8A – MASTER’S ENROLMENT BY GENDER (FTE)
2007 2008 2009 2010 2011
0%
10%
20%
30%
40%
50%
0
5,000
10,000
MALE FEMALE % FEMALE
2,220 2,351 2,305 2,521 2,669
22.3%
9,387
23.2%
7,717
22.3%
7,793
21.9%
8,020
22.1%
8,992
In 2011, the proportion of women enrolled in master’s programs was greatest in Saskatchewan (32.1 percent), followed closely by British Columbia (24.7 percent). Alberta (21.8 percent), Ontario (21.4 percent) and Quebec (20.4 percent) clustered around the national average of 22.1 percent. Newfoundland (21.6 percent), Manitoba (21.4 percent), New Brunswick (18.7 percent) and Nova Scotia (12.6 percent) scored in the bottom four.
CHART 2.8B – DOCTORAL ENROLMENT BY GENDER (FTE)
2007 2008 2009 2010 2011
MALE FEMALE % FEMALE
0%
10%
20%
30%
40%
50%
0
2,000
4,000
6,000
1,291 1,320 1,388 1,537 1,658
19.6%
6,255
19.9%
5,311
19.9%
5,327
20.0%
5,598
21.0%
6,136
As can be seen in Chart 2.8b, the proportion of female doctoral students increased marginally between 2007 and 2011, from 19.6 percent to 21 percent. During that period, female doctoral enrolment increased by 7.9 percent to 1,658 FTEs, outpacing the 1.9 percent growth in male doctoral students13.
Female doctoral students are well represented in biosystems (38.3 percent), chemical (31.4 percent) and geological engineering (28.6 percent). Women were least strongly represented in electrical (16.5 percent) and mechanical engineering (16 percent) and engineering physics (14.4 percent). Civil engineering, which absorbs a large portion of overall doctoral enrolment, has seen a slow upward gain in female participation, from 18.4 to 22.4 percent from 2007 to 2011.
In 2011 the highest proportion of female doctoral students were reported in New Brunswick (25.5 percent), followed by Quebec (21.7 percent) and Saskatchewan (21.3 percent). Ontario and Alberta both had 21 percent, above the national average of 20 percent. British Columbia and Nova Scotia reported 20.2 percent and 19.4 percent respectively, while Manitoba (16.6 percent) and Newfoundland (16.3 percent) experienced the lowest female doctoral enrolment. Limited enrolment in some doctoral programs can result in large year-to-year fluctuations (see Table G.2.4 in Appendix A).
POST-GRADUATE DEGREES AWARDEDIn 2011, 4,429 master’s degrees were awarded, a significant rise of 9.2 percent from the previous year. Awards have risen 30.8 percent since 2007 (see Table GD.1.1 in Appendix A).
CHART 2.9 – MASTER’S ENROLMENT AND DEGREES AWARDED (FTE)
0
2,000
4,000
6,000
8,000
10,000
14,000
12,000
2007 2008 2009 2010 2011
MASTERS ENROLMENT MSc's GRANTED
3,386 3,662 3,776 4,055 4,429
-7.3% +8.2% +3.1% +7.4% +9.2%
12,056
9,937 10,144 10,325
11,513
In 2011, the proportion of all master’s degrees awarded to women slightly increased from the previous year to 22.4 percent, a drop of 8.8 percent from 2009 after years of slow yet steady growth. As can be seen in Chart 2.9a, degrees awarded to women rose 22.7 percent from 2007 to 2011.
13 Totals derived from tables G.1.6 and G.1.8. The numbers depicted in the chart are derived from calculations performed across these two tables, the first taking account all doctoral students and the second taking account female doctoral students only.

13
CHART 2.9A – MASTER’S ENROLMENT AND DEGREES AWARDED BY GENDER (FTE)
0%
10%
20%
30%
40%
50%
0
500
1,000
1,500
2,000
2,500
3,000
4,000
3,500
2007 2008 2009 2010 2011
MALE, MSc's GRANTED FEMALE, MSc's GRANTED % FEMALE
808 864 911 862992
23.9%
3,438
23.6%
2,578
24.1%
2,798
21.3%
2,865
22.4%
3,193
The number of doctoral degrees awarded dropped a further 0.8 percent in 2011 (to 1,017) while in 2010 degrees awarded dropped by 0.2 percent. However, as seen in Chart 2.10, growth has been strong over the years, with degrees awarded rising by 19.9 percent since 2007.
CHART 2.10 – DOCTORAL ENROLMENT AND DEGREES AWARDED (FTE)
0
1,000
2,000
3,000
4,000
5,000
6,000
7,000
8,000
2007 2008 2009 2010 2011
DOCTORAL ENROLMENT PhD’s GRANTED
833 958 1,027 1,025 1,017
+8.7% +15.0% +7.2% -0.2% -0.8%
7,913
6,602 6,6476,986
7,673
The proportion of doctoral degrees awarded to women slightly increased from 2010 (Chart 2.10a). Women comprised 20.2 percent of doctoral degrees awarded (205 awarded), a drop of 0.5 percent, but doctorates awarded to women since 2007 are up 55.3 percent (see Table GD.1.4 in Appendix A).
CHART 2.10A – DOCTORAL ENROLMENT AND DEGREES AWARDED BY GENDER (FTE)
0%
10%
20%
30%
40%
50%
0
100
200
300
400
500
600
700
800
900
1,000
2007 2008 2009 2010 2011
MALE, PhD's GRANTED FEMALE, PhD's GRANTED % FEMALE
132198 226 206 205
15.8%
812
20.7%
701
22.0%
760
20.1%
801
20.2%
819

14
Monitoring the pulse of the
ENGINEERINGprofession
15
FOREWORDEngineers Canada requested participating institutions to complete a survey on the internationalization and globalization of engineering education in the faculty, undergraduate and graduate student population. About 80 percent (39 out of 49 institutions) of surveys were returned. The survey sought to determine the level of Canadian academic participation in other countries.
OVERVIEWThe survey revealed that more than two-thirds of undergraduate engineering faculties and more than half of graduate faculties have formal arrangements with engineering faculties outside of Canadian borders. Programs in Quebec are the most prominent, often representing just under half of the reported activity. The most popular countries for these arrangements are: France, China, Germany and Mexico. These countries were also the top destinations for the exchange of engineering faculty members. The survey revealed that there are more foreign undergraduate engineering exchange students completing their studies in Canada than Canadian students completing engineering studies abroad. Currently, undergraduate faculties house more foreign exchange students (1,300) than graduate engineering faculties (80). Although, participation with foreign schools is prevalent, only six out of the 39 universities surveyed indicated they have formally mandated committees that introduce global aspects into engineering education.
Participating institutions were asked the following questions:
1. Does your engineering faculty have any formal arrangements with engineering faculties in other countries to facilitate the exchange of students and/or teaching?
2. Does your engineering faculty offer an international stream or option within any of your engineering programs?
3. Does your engineering faculty offer or promote international work assignments as part of a co-op program or an international internship option?
4. How many exchange students does your engineering faculty currently have:
a. Coming from other countries (i.e. number of foreign exchange students currently in your engineering programs for part of their studies)
b. Going to other countries (i.e. number of engineering students from your institution currently in another country for part of their studies)
5. Does your engineering faculty offer collaborative courses with schools in other countries?
6. Does your engineering faculty offer courses in:
a. The role of technology and engineering in international development
b. Appropriate and sustainable technology for economic development
c. The international economy
d. Internationally recognized quality control standards (e.g., ISO, etc)
e. Other topics relevant to global engineering
7. Does your engineering faculty currently have a formally mandated committee to examine ways to introduce global aspects into engineering education?
Internationalization/Globalization of Engineering Education

16
GLOBAL ARRANGEMENTSBased on 39 institutions that participated in the survey, 67 percent (26 out of 39) indicated they had formal arrangements with engineering faculties in other countries to facilitate the exchange of undergraduate students. Of those institutions, more than half (54 percent) indicated they had formal arrangements with France, followed by China (42 percent) and Germany and Mexico both at 35 percent (see Exhibit T.1a).
EXHIBIT T.1A – FORMAL ARRANGEMENTS WITH COUNTRIES FOR THE EXCHANGE OF ENGINEERING STUDENTS (UNDERGRADUATE)
54%42%
35%35%
27%27%27%
23%23%
19%
0% 10% 20% 30% 40% 50% 60%
FranceChina
MexicoGermany
United KingdomSingapore
IndiaUSA
AustraliaHong Kong
For graduate students, more than half (56 percent) indicated the presence of formal arrangements with other countries. As illustrated in Exhibit T.1b, of the 22 institutions that reported having such arrangements, France was again the top country with 55 percent followed by China (50 percent), India (32 percent) and Mexico (27 percent).
EXHIBIT T.1B – FORMAL ARRANGEMENTS WITH COUNTRIES FOR THE EXCHANGE OF ENGINEERING STUDENTS (GRADUATE)
55%50%
32%27%
23%23%23%
18%
18%18%
0% 10% 20% 30% 40% 50% 60%
FranceChinaIndia
MexicoJapan
GermanyBrazil
SingaporeItaly
Australia
The exchange of faculty members with foreign institutions was less prevalent; a little more than a quarter (28 percent). France, China, and India were the top three destinations for the exchange of engineering faculty and also the top countries for the exchange of engineering students.
About three-quarters (29 out of 39) of universities surveyed have foreign students completing part of their undergraduate studies in Canadian engineering faculties. This totals about 1,300 foreign students. École Polytechnique in Quebec had the highest number of foreign undergraduate students (538) followed by the University of Waterloo (205) and École de technologie supérieure (100). For graduate engineering faculties, a total of 79 foreign students are completing part of their studies across 11 of the universities surveyed. The University of Western Ontario had the highest number of foreign graduate students with 35, followed by the University of Saskatchewan with 20.
In addition to the number of foreign engineering students studying within Canadian borders, 22 out of 39 universities surveyed have undergraduate engineering students currently studying abroad as part of their studies. This totals 413 students. Again, École Polytechnique had the highest number of engineering students attending other countries’ institutions as part of their studies with 100 students, followed by the University of Waterloo (96) and Université de Sherbrooke (46). For graduate engineering students, about 16 are currently studying abroad. Seven out of 39 universities (18 percent) reported having graduate engineering students on exchange.
Aside from foreign exchange students, about 28 percent (11 out of 39) of universities indicated their undergraduate engineering faculties offered an international stream or option within any of their engineering programs compared to 18 percent of graduate engineering faculties. Five universities offered international options for both undergraduate and graduate engineering programs, they are: École Polytechnique, École de technologie supérieure, McMaster University, Université du Québec à Rimouski and the University of Toronto.

17
CO-OPS, INTERNSHIPS & COURSESAbout two-thirds, or 64 percent, of respondents indicated they offered or promoted international work assignments as part of an undergraduate co-op program or international internship. Graduate engineering programs fared much lower with just 23 percent indicating they offered such opportunities. Of the universities that offer international co-ops and internships for undergraduate programs 1,500 students are currently participating; compared to 50 graduate students participating.
With respect to collaborative coursework, 10 universities (25 percent) indicated their engineering faculties offered collaborative courses with schools in other countries. Half of those universities offered foreign collaborations at both the undergraduate and graduate level. Some of the countries involved include: France, Germany, Italy, China and Singapore.
Aside from collaborative coursework in other countries, the survey sought to determine the prevalence of ‘internationally focused’ engineering courses within Canadian borders. Specifically, the survey asked respondents whether their engineering faculties offered courses in the following areas:
• The role of technology and engineering in international development,
• Appropriate and sustainable technology for economic development,
• The international economy,
• Internationally recognized quality control standards (e.g., ISO, etc), and
• Other topics relevant to global engineering.
More than half of universities surveyed indicated their engineering faculties offered undergraduate courses in ‘sustainable technology for economic development’ (64 percent) and ‘internationally recognized quality control standards’ (51 percent). Two-fifths (16 out of 39) of institutions offered courses on the ‘role of technology and engineering in international development’ as well as ‘other topics relevant to global engineering’. Only a quarter of schools surveyed had engineering faculties offering undergraduate courses relating to the international economy.
Similar to undergraduate course offerings, graduate engineering faculties also indicated a prevalence in courses such as ‘sustainable technology for economic development’ and ‘internationally recognized quality control standards’ (33 and 31 percent respectively). More than a quarter (28 percent) of universities that offered the course ‘sustainable technology for economic development’ at the undergraduate level, also offered the course at the graduate level. Again, similar to survey results for undergraduate course offerings, ‘the international economy’ was the least offered course by graduate engineering faculties.
Since the survey’s focus was to uncover information on the internationalization and globalization of engineering education in the faculty, undergraduate and graduate student populations, it sought to determine how many institutions had formally mandated committees to examine ways to introduce global aspects into engineering education. Survey results indicate that currently six universities (13 percent of respondents) have such mandated committees. Five of the six universities have formally mandated committees for both undergraduate and graduate engineering levels, they are:
• University of Western Ontario
• McMaster University
• École Polytechnique
• École de technologie supérieure
• University of Toronto
The University of Saskatchewan is the only university of the six that does not have committees for both undergraduate and graduate faculties; instead the university has a mandated committee for their graduate engineering faculty only.

18
The 49 Canadian universities contributing updated data on enrolments and graduations in the report have added an important new chapter to Engineers Canada’s records. Trends revealed here document continuing growth in enrolments and graduations; confirming the major gains in 2010. Analysis also identifies important shifts across programs, institutions and provinces.
These numbers provide a benchmark for comparison among institutions and are the basis for anticipating the addition of new engineers to the workforce. The time and effort contributed by the institutions is rewarded with a timely, consistent and credible record. Engineers Canada appreciates these efforts and welcomes comments and suggestions.
Conclusion

19
APPENDICES

20
Appendix ADATA TABULATIONS – ENGINEERING ENROLMENT AND DEGREES AWARDEDTo provide added clarity of presentation in the numerous tabulations that comprise this document, the following tree was developed. Each of the main headings and sub-variables analyzed is presented along with the corresponding table number. The main headings under which data tabulations are presented include national, provincial and institutional categories. Other variables such as discipline, gender and foreign students are presented as tables under each of these main headings.
For example, the tabulation of undergraduate enrolment figures (U) at a national level (1) would be designated as Table U.1. The data compiled into different categories, including discipline, gender and information on foreign students appear as subsequent tables under the main headings.
Undergraduate Enrolment (U)U.1. NationalU.2. ProvincialU.3. Institutional
Undergraduate Degrees Awarded (UD)UD.1. NationalUD.2. ProvincialUD.3. Institutional
Postgraduate Student Enrolment (G)G.1. NationalG.2. ProvincialG.3. Institutional
Postgraduate Degrees Awarded (GD)GD.1. NationalGD.2. ProvincialGD.3. Institutional
Faculty Members by Institution (F)F.1. Faculty Composition
Co-op, Internship and Professional Experience Programs (C)
C.1. Industry Experience Options by Institutions
Please note that for 2007 and onwards, the universities provided average numbers of students enrolled over the fall, winter and summer terms. However, for purposes of reporting, those numbers were rounded up or down accordingly.
SCHOOL NAME AND ACRONYM In the Appendix section of this report, all university names, where appropriate, have been abbreviated to allow for ease of reading. The chart shown below lists the complete name of the school and the abbreviated name that is commonly used to refer to the university.
COMPLETE SCHOOL NAME ACRONYM
Acadia University Acadia
Alberta, University of Alberta
British Columbia Institute of Technology BCIT
British Columbia, University of UBC
British Columbia at Okanagan, University of UBCO
Calgary, The University of Calgary
Cape Breton, University College of Cape Breton
Carleton University Carleton
Concordia University Concordia
Conestoga College Conestoga
Dalhousie University Dal
École de technologie supérieure ETS
Guelph, University of Guelph
Lakehead University Lakehead
Laurentian University Laurentian
Laval, Université Laval
Manitoba, The University of Manitoba
McGill University McGill
McMaster University McMaster
Memorial University of Newfoundland MUN
Moncton, Université de Moncton
New Brunswick, University of UNB
Northern British Columbia, University of UNBC
Nova Scotia Agricultural College NSAC
Ottawa, University of Ottawa
Prince Edward Island, University of UPEI
Polytechnique, École Polytechnique
Québec à Chicoutimi, Université du UQAC
Québec à Montréal, Université du UQAM
Québec à Rimouski, Université du UQAR
Québec à Trois-Rivières, Université du UQTR
Québec en Abitibi-Témiscamingue, Université du UQAT
Québec en Outaouais, Université du UQO
Queen’s University Queen's
Regina, University of Regina
Royal Military College of Canada RMC

21
COMPLETE SCHOOL NAME ACRONYM
Ryerson University Ryerson
Saint Mary’s University SMU
Saskatchewan, University of Saskatchewan
Sherbrooke, Université de Sherbrooke
Simon Fraser University SFU
St. Francis Xavier University StFX
Toronto, University of Toronto
University of Ontario, Institute of Technology UOIT
Victoria, University of UVic
Waterloo, University of Waterloo
Western Ontario, University of Western
Windsor, University of Windsor
York University York
PROVINCE NAME AND ABBREVIATIONIn the appendix section of this report, the provincial names have been abbreviated to allow for ease of reading. The chart shown below lists the complete name of the province and the corresponding abbreviation.
PROVINCE NAME ABBREVIATION
Alberta AB
British Columbia BC
Manitoba MB
New Brunswick NB
Newfoundland and Labrador NL
Nova Scotia NS
Ontario ON
Prince Edward Island PE
Quebec QC
Saskatchewan SK
A.1. UNDERGRADUATE ENROLMENT
U.1. National
TABLE U.1.1. Total undergraduate enrolment in accredited engineering programs by discipline: 2007 to 2011.
DISCIPLINE 2007 2008 2009 2010 2011
Biosystems 609 579 739 784 754
Chemical 4228 4379 4618 5189 5086
Civil 8294 8897 9614 10604 10987
Computer 3940 3644 3546 3496 3655
Electrical 9122 8870 9375 9587 9903
Engineering Physics
2660 2715 2519 2845 2882
Environmental 746 785 982 1143 1240
Geological 415 532 556 594 630
Industrial or Manufacturing
1993 1824 1742 1662 1766
Materials or Metallurgical
820 921 930 927 994
Mechanical 11547 12337 12828 13662 13628
Mining or Mineral 638 764 860 939 983
Software 1911 1931 2120 2199 2286
Other 2091 2126 2391 2529 2658
Year One/Two Common Year
6945 6950 6052 7000 8605
TOTAL 55958 57255 58872 63160 66057

22
TABLE U.1.2. Total female undergraduate enrolment in accredited engineering programs: 1991 to 2011.
YEAR TOTAL ENROLMENT WOMEN PERCENT OF
TOTAL
1991 37147 5979 16.1
1992 40307 6689 16.6
1993 41562 7376 17.7
1994 40958 7466 18.2
1995 40068 7541 18.8
1996 40997 7736 18.9
1997 42048 8099 19.3
1998 43898 8493 19.3
1999 44840 9217 20.6
2000 47066 9561 20.3
2001 49422 10199 20.6
2002 52585 10456 19.9
2003 54301 10423 19.2
2004 54991 10011 18.2
2005 54622 9530 17.4
2006 53287 9350 17.5
2007 55958 9682 17.3
2008 57255 9797 17.1
2009 58872 10199 17.3
2010 63160 11200 17.7
2011 66057 11690 17.7
TABLE U.1.3. Total female undergraduate enrolment in accredited engineering programs: 2007 to 2011.
DISCIPLINE 2007 2008 2009 2010 2011
Biosystems 201 200 281 305 294
Chemical 1533 1555 1619 1740 1715
Civil 1852 1900 2064 2265 2400
Computer 381 359 342 361 372
Electrical 1088 1033 1147 1216 1198
Engineering Physics
471 448 415 453 466
Environmental 274 288 380 459 510
DISCIPLINE 2007 2008 2009 2010 2011
Geological 131 176 188 219 240
Industrial or Manufacturing
429 401 377 382 412
Materials or Metallurgical
173 199 214 213 216
Mechanical 1189 1242 1240 1417 1380
Mining or Mineral
95 114 129 138 159
Software 186 195 203 214 225
Other 357 354 389 411 435
Year One/Two Common Year
1323 1334 1210 1406 1667
TOTAL 9682 9797 10199 11200 11690
TABLE U.1.4. Undergraduate enrolment in engineering programs that will be seeking accreditation: 2011.
INSTITUTION PROGRAM 2011
BCIT Mechanical Engineering 208
CarletonArchitectural Conservation and
Sustainability35
Carleton Biomedical and Mechanical 84
Carleton Sustainable & Renewable Energy 150
Guelph Biomedical Engineering 105
Guelph Computer Engineering 24
Guelph Mechanical Engineering 218
Laurentian Mechanical Engineering 184
MUN Process Engineering 63
Polytechnique Génie aérospatial 160
Polytechnique Génie biomédical 126
Ryerson Biomedical Engineering 226
SFU Mechatronic Systems Engineering 291
UBCO Year One - Common 571
UOIT Energy Systems Engineering 46
UQAC Génie civil 96
Waterloo Management Engineering 190
York Software Engineering 12
TOTAL 2789

23
U.2. Provincial
TABLE U.2.1. Total undergraduate enrolment in accredited engineering programs by province: 2007 to 2011.
PROVINCE 2007 2008 2009 2010 2011
AB 6239 6413 6606 6798 6897
BC 4569 4893 4470 5948 6296
MB 1028 1028 1064 1088 1154
NB 1522 1729 1592 1910 2018
NL 725 739 787 762 873
NS 1470 1469 1460 1605 1777
ON 22985 23029 24806 26652 28185
PE 107 102 102 100 103
QC 15431 15947 15985 16212 16601
SK 1881 1906 1999 2085 2152
TOTAL 55958 57255 58872 63160 66057
TABLE U.2.2. Total female undergraduate enrolment in accredited engineering programs by province: 2011.
PROVINCE TOTAL ENROLMENT
FEMALE ENROLMENT
PERCENT FEMALE ENROLMENT
AB 6897 1475 21.40%
BC 6296 1023 16.30%
MB 1154 194 16.80%
NB 2018 338 16.70%
NL 873 183 20.90%
NS 1777 327 18.40%
ON 28185 4946 17.50%
PE 103 25 24.30%
QC 16601 2748 16.60%
SK 2152 430 20.00%
TOTAL 66057 11690 17.70%
TABLE U.2.3. Total undergraduate foreign student enrolment in accredited engineering programs by province: 2007 to 2011.
PROVINCE 2007 2008 2009 2010 2011
AB 384 432 495 584 655
BC 450 524 446 669 763
MB 150 140 132 129 149
NB 214 267 282 344 611
NL 55 52 101 73 89
NS 212 197 180 284 318
ON 2224 2341 2644 3058 3423
PE 0 0 0 14 12
QC 2110 2300 2399 2257 2284
SK 217 217 277 334 385
TOTAL 6014 6468 6955 7744 8688

24
TABLE U.2.4. Total undergraduate enrolment in accredited engineering programs by discipline and province: 2011.
DISCIPLINE AB BC MB NB NL NS ON PE QC SK TOTAL
Biosystems 278 83 14 10 236 104 29 754Chemical 797 319 65 2795 946 164 5086Civil 980 812 246 531 141 121 3816 4162 179 10987Computer 225 404 68 65 57 21 1912 761 142 3655Electrical 924 1195 167 342 88 80 4199 2814 94 9903Engineering Physics 66 891 167 1361 347 50 2882Environmental 116 76 738 91 219 1240Geological 119 32 194 220 66 630Industrial or Manufacturing
2 3 79 558 960 163 1766
Materials or Metallurgical
161 135 37 439 222 994
Mechanical 1327 836 379 512 251 167 5564 4363 230 13628Mining or Mineral 134 132 45 359 312 983Software 121 72 25 880 1139 48 2286Other 464 143 72 77 1570 161 173 2658Year One/Two Common Year
1694 1164 209 107 261 908 3564 103 595 8605
TOTAL 6897 6296 1154 2018 873 1777 28185 103 16601 2152 66057
TABLE U.2.5. Total female undergraduate enrolment in accredited engineering programs by discipline and province: 2011.
DISCIPLINE AB BC MB NB NL NS ON PE QC SK TOTAL
Biosystems 90 44 5 4 94 48 10 294Chemical 252 113 19 883 405 44 1715Civil 284 136 50 111 52 25 768 932 41 2400Computer 25 52 8 9 6 2 197 60 14 372Electrical 160 131 30 31 15 9 514 294 15 1198Engineering Physics 7 121 20 273 41 4 466Environmental 52 33 286 43 97 510Geological 42 8 80 94 17 240Industrial or Manufacturing 1 0 18 167 204 22 412Materials or Metallurgical 50 23 6 99 38 216Mechanical 191 97 31 38 45 19 503 433 24 1380Mining or Mineral 21 19 6 77 35 159Software 22 8 3 88 95 10 225Other 104 23 9 20 227 27 26 435Year One/Two Common Year 359 230 32 13 46 167 689 25 107 1667TOTAL 1475 1023 194 338 183 327 4946 25 2748 430 11690

25
U.3. Institutional
TABLE U.3.1. Total undergraduate enrolment in accredited engineering programs by institution: 2007 to 2011.
INSTITUTION 2007 2008 2009 2010 2011
Acadia 108 104 86 91 101Alberta 3708 3764 3892 3919 3904BCIT 186 465Calgary 2531 2649 2714 2879 2993Cape Breton 55 55 81 84Carleton 2096 2129 2251 2542 2698Concordia 3060 3044 2784 2795 2787Conestoga 55 80Dal 1049 1034 1090 1108 1273ETS 2979 3007 3221 3342 3654Guelph 564 476 496 539 528Lakehead 676 675 747 798 796Laurentian 161 158 161 256 258Laval 2206 2379 2470 2470 2470Manitoba 1028 1028 1064 1088 1154McGill 2636 2699 2540 2443 2257McMaster 2950 2801 2946 3049 3579Moncton 309 293 325 325 338MUN 725 739 787 762 873NSAC 42 42 47 56 59Ottawa 1489 1407 1595 1757 1805Polytechnique 2831 3007 3295 3519 3644Queen's 2296 2355 2531 2575 2687Regina 692 714 751 824 878RMC 342 321 355 395 431Ryerson 2180 2137 2310 2433 2569Saskatchewan 1189 1192 1249 1262 1274SFU 655 712 565 634 654Sherbrooke 1166 1182 1036 1053 1248SMU 134 165 157 189 167StFX 82 68 79 80 93Toronto 4191 4143 4222 4294 4386UBC 2922 3142 2734 3818 3800UBCO 311 313UNB 1213 1436 1267 1585 1680UNBC 47 56 69 73UOIT 126 315 1023 1112 1243UPEI 107 102 102 100 103UQAC 198 259 255 217 208UQAM 74 89 53 20 27UQAR 4 28 83 81 86UQAT 62 52 52 68 54UQO 30 30 32 34 3UQTR 186 173 165 170 163UVic 992 992 1114 930 992Waterloo 3487 3887 3903 4457 4622Western 1206 1120 1111 1115 1324Windsor 1075 965 991 974 985York 146 141 165 181 195TOTAL 55958 57255 58872 63160 66057
TABLE U.3.2. Total female undergraduate enrolment in accredited engineering programs by institution: 2007 to 2011.
INSTITUTION 2007 2008 2009 2010 2011
Acadia 23 15 14 19 23Alberta 765 765 800 806 774BCIT 22 37Calgary 591 659 659 692 701Cape Breton 16 16 15 14Carleton 271 251 271 368 370Concordia 482 483 445 451 471Conestoga 5 9Dal 189 184 207 215 241ETS 226 241 272 306 325Guelph 133 131 137 151 160Lakehead 73 55 63 69 64Laurentian 30 28 28 51 55Laval 350 385 428 428 428Manitoba 143 134 153 174 194McGill 568 539 486 502 510McMaster 490 435 471 539 549Moncton 38 38 44 44 60MUN 150 152 202 160 183NSAC 4 4 3 3 6Ottawa 219 202 273 351 325Polytechnique 573 634 699 734 755Queen's 526 535 597 632 687Regina 135 132 151 170 184RMC 63 44 42 49 46Ryerson 337 324 337 356 377Saskatchewan 201 214 226 242 247SFU 93 94 73 80 98Sherbrooke 162 193 175 163 194SMU 13 16 19 25 20StFX 13 10 25 24 23Toronto 906 892 918 957 1024UBC 535 559 511 725 732UBCO 40 34UNB 199 221 223 259 278UNBC 20 25 31 33UOIT 15 32 87 87 90UPEI 16 20 20 15 25UQAC 23 33 28 25 27UQAM 9 11 1 1 2UQAR 0 2 8 5 7UQAT 5 5 4 10 10UQO 6 6 4 5 1UQTR 21 17 16 18 18UVic 104 104 101 82 90Waterloo 602 625 605 730 777Western 210 210 214 215 250Windsor 130 109 118 120 130York 26 19 22 33 33TOTAL 9682 9797 10199 11200 11690

26
TABLE U.3.3. Total undergraduate enrolment in accredited engineering programs by institution and discipline: 2011.
INSTITUTION
BIOS
YSTE
MS
CHEM
ICAL
CIVI
L
COM
PUTE
R
ELEC
TRIC
AL
ENGI
NEER
ING
PHYS
ICS
ENVI
RONM
ENTA
L
GEOL
OGIC
AL
INDU
STRI
AL O
R M
ANUF
ACTU
RING
MAT
ERIA
LS O
R M
ETAL
LURG
ICAL
MEC
HANI
CAL
MIN
ING
OR
MIN
ERAL
SOFT
WAR
E
OTHE
R
YEAR
ONE
/TW
O CO
MM
ON Y
EAR
Acadia 101Alberta 460 617 182 490 66 161 700 134 171 923BCIT 195 269Calgary 337 363 43 434 2 627 121 293 771Cape Breton 84Carleton 535 200 696 57 179 446 128 457Concordia 959 150 351 230 856 241Conestoga 80Dal 10 65 121 21 80 76 79 37 167 45 571ETS 1035 939 357 930 393Guelph 86 77 326 40Lakehead 69 299 186 218 24Laurentian 118 140Laval 104 94 584 122 195 169 91 93 100 534 128 123 136Manitoba 83 246 68 167 3 379 209McGill 325 363 114 525 113 621 85 111McMaster 334 375 307 471 148 239 464 113 79 1050Moncton 185 74 79MUN 141 57 88 251 77 261NSAC 59Ottawa 150 310 475 104 239 404 125Polytechnique 322 929 246 398 178 95 324 2 779 99 271Queen's 321 381 61 147 342 128 522 138 647Regina 106 176 163 48 173 213RMC 34 87 23 24 51 58 154Ryerson 253 525 204 490 133 507 358 99Saskatchewan 29 164 179 36 94 50 43 66 230 383SFU 654Sherbrooke 194 293 112 227 422SMU 167StFX 93Toronto 452 495 340 760 815 326 200 708 82 209UBC 278 459 328 591 237 43 119 135 417 132 143 919UBCO 158 39 116UNB 14 319 346 65 268 32 433 25 72 107UNBC 73UOIT 233 30 622 94 265UPEI 103UQAC 14 49 32 7 106UQAM 27UQAR 20 41 25UQAT 33 21UQO 3UQTR 11 50 49 52UVic 76 296 303 72 245Waterloo 905 447 495 701 177 66 1114 397 323Western 1324Windsor 199 251 57 69 367 41York 103 62 30TOTAL 754 5086 10987 3655 9903 2882 1240 630 1766 994 13628 983 2286 2658 8605

27
TABLE U.3.4. Total female undergraduate enrolment in accredited engineering programs by institution and discipline: 2011.
INSTITUTIONBI
OSYS
TEM
S
CHEM
ICAL
CIVI
L
COM
PUTE
R
ELEC
TRIC
AL
ENGI
NEER
ING
PHYS
ICS
ENVI
RONM
ENTA
L
GEOL
OGIC
AL
INDU
STRI
AL O
R M
ANUF
ACTU
RING
MAT
ERIA
LS O
R M
ETAL
LURG
ICAL
MEC
HANI
CAL
MIN
ING
OR
MIN
ERAL
SOFT
WAR
E
OTHE
R
YEAR
ONE
/TW
O CO
MM
ON Y
EAR
Acadia 23Alberta 137 173 20 73 7 50 85 21 25 183BCIT 24 14Calgary 115 111 5 87 1 106 22 79 176Cape Breton 14Carleton 76 20 97 8 65 34 8 62Concordia 254 14 39 59 75 30Conestoga 9Dal 4 19 25 2 9 33 18 6 19 6 101ETS 186 66 16 44 14Guelph 36 8 114 4Lakehead 18 31 7 8 1Laurentian 27 28Laval 48 35 110 12 16 15 43 39 12 61 4 11 24Manitoba 44 50 8 30 31 32McGill 142 122 9 82 23 97 15 20McMaster 115 67 25 74 14 37 35 12 2 169Moncton 42 12 6MUN 52 6 15 45 20 46NSAC 6Ottawa 59 85 92 12 25 40 14Polytechnique 151 208 20 57 26 44 122 2 90 16 20Queen's 116 123 9 13 69 61 90 29 176Regina 13 77 22 10 26 37RMC 7 12 2 2 4 3 16Ryerson 73 112 16 56 34 30 42 14Saskatchewan 10 44 41 2 15 4 21 17 24 71SFU 98Sherbrooke 74 52 4 16 48SMU 20StFX 23Toronto 197 125 49 127 182 112 63 100 20 49UBC 90 93 47 87 23 19 42 23 63 19 23 203UBCO 20 4 10UNB 5 113 69 9 19 8 32 3 9 13UNBC 33UOIT 15 2 27 13 33UPEI 25UQAC 1 6 11 1 8UQAM 2UQAR 3 1 3UQAT 4 6UQO 1UQTR 3 4 8 3UVic 6 26 24 8 27Waterloo 247 101 43 72 85 19 93 41 78Western 250Windsor 30 25 23 19 22 10York 14 12 7TOTAL 294 1715 2400 372 1198 466 510 240 412 216 1380 159 225 435 1667

28
A.2. UNDERGRADUATE DEGREES AWARDED
UD.1. National
TABLE UD.1.1. Total undergraduate degrees awarded by discipline: 2007 to 2011.
DISCIPLINE 2007 2008 2009 2010 2011
Biosystems 131 176 159 153 141Chemical 917 1030 987 1145 1158Civil 1691 1727 1853 1923 2191Computer 1089 905 728 660 569Electrical 2318 2280 2099 2099 2050Engineering Physics 572 520 499 535 453Environmental 151 169 135 159 207Geological 89 95 100 110 124Industrial or Manufacturing 521 437 341 391 350
Materials or Metallurgical 229 202 177 223 213
Mechanical 2656 2947 2728 2983 2976Mining or Mineral 125 121 139 200 211Software 457 472 337 356 353Other 505 538 499 457 491Year One/Two Common Year 56 217
TOTAL 11451 11619 10781 11450 11703
TABLE UD.1.2.Total undergraduate degrees awarded to female students by discipline: 2007 to 2011.
DISCIPLINE 2007 2008 2009 2010 2011
Biosystems 53 67 49 48 53Chemical 388 392 375 396 396Civil 376 416 429 421 484Computer 110 87 64 55 58Electrical 337 296 270 279 250Engineering Physics 116 95 96 100 82Environmental 70 73 48 49 86Geological 33 23 32 31 40Industrial or Manufacturing 123 88 63 88 89
Materials or Metallurgical 46 46 35 42 50
Mechanical 336 351 303 307 286Mining or Mineral 24 14 29 26 43Software 50 50 26 30 40Other 101 96 79 71 95Year One/Two Common Year 9 58
TOTAL 2163 2094 1898 1952 2110
UD.2. Provincial
TABLE UD.2.1. Total undergraduate degrees awarded by province: 2007 to 2011.
PROVINCE 2007 2008 2009 2010 2011
AB 1071 1199 1147 1187 1298BC 829 852 884 1121 1126MB 155 218 165 223 197NB 329 336 292 256 240NL 154 153 157 166 151NS 256 277 266 291 500ON 5353 5288 4752 5101 5075QC 2981 2928 2780 2754 2761SK 323 368 338 351 355TOTAL 11451 11619 10781 11450 11703
TABLE UD.2.2. Total undergraduate degrees awarded to female students by province: 2007 to 2011.
PROVINCE 2007 2008 2009 2010 2011
AB 215 238 240 272 302BC 141 140 160 184 208MB 22 41 24 30 27NB 43 50 56 33 45NL 30 27 39 33 33NS 57 60 35 63 112ON 1094 1012 846 858 876QC 495 464 448 427 431SK 66 62 50 52 76TOTAL 2163 2094 1898 1952 2110
TABLE UD.2.3. Total undergraduate degrees awarded to foreign students by province: 2007 to 2011.
PROVINCE 2007 2008 2009 2010 2011
AB 84 51 54 64 90BC 43 57 93 103 91MB 15 23 22 38 28NB 27 61 53 26 38NL 6 14 6 13 14NS 22 21 25 19 69ON 327 366 375 408 411QC 211 232 273 282 252SK 39 40 36 30 40TOTAL 774 865 937 983 1033

29
TABLE UD.2.4. Total undergraduate degrees awarded by province and discipline: 2011.
DISCIPLINE AB BC MB NB NL NS ON QC SK
Biosystems 71 12 2 4 28 9 15
Chemical 212 22 42 657 186 39
Civil 229 201 58 86 33 62 833 624 65
Computer 59 92 13 9 13 3 256 103 21
Electrical 206 203 33 36 24 33 936 560 19
Engineering Physics 26 110 260 45 12
Environmental 38 28 123 18
Geological 38 3 34 33 16
Industrial or Manufacturing 5 2 25 108 168 42
Materials or Metallurgical 45 34 12 83 39
Mechanical 339 264 79 65 69 53 1229 805 73
Mining or Mineral 43 32 21 103 12
Software 11 12 5 154 160 11
Other 123 31 12 12 271 18 24
Year One/Two Common Year 217
TOTAL 1298 1126 197 240 151 500 5075 2761 355
TABLE UD.2.5. Total undergraduate degrees awarded to women by province and discipline: 2011.
DISCIPLINE AB BC MB NB NL NS ON QC SK
Biosystems 26 4 1 1 8 5 8
Chemical 68 8 11 217 86 6
Civil 75 50 9 15 13 11 171 123 17
Computer 5 9 2 2 32 6 2
Electrical 35 34 6 3 2 4 105 61
Engineering Physics 2 20 52 6 2
Environmental 20 10 48 8
Geological 7 19 10 4
Industrial or Manufacturing 3 8 32 33 13
Materials or Metallurgical 18 6 1 18 7
Mechanical 53 22 6 7 15 7 99 73 4
Mining or Mineral 10 6 1 24 2
Software 3 1 15 18 3
Other 30 7 9 3 36 1 9
Year One/Two Common Year 58
TOTAL 302 208 27 45 33 112 876 431 76

30
UD.3. Institutional
TABLE UD.3.1. Total undergraduate degrees awarded by institution: 2007 to 2011.
INSTITUTION 2007 2008 2009 2010 2011
Acadia 31Alberta 607 709 702 739 836BCIT 18 27 36Calgary 464 490 445 448 462Cape Breton 0Carleton 412 461 403 409 395Concordia 354 408 407 421 350Conestoga 10 9Dal 253 277 266 291 469ETS 707 732 680 620 724Guelph 142 185 90 69 95Lakehead 215 202 257 251 223Laurentian 13 27 22 35 118Laval 274 258 258 258 258Manitoba 155 218 165 223 197McGill 480 428 439 500 456McMaster 487 503 504 569 582Moncton 43 49 32 50 30MUN 154 153 157 166 151Ottawa 395 426 317 286 252Polytechnique 631 645 502 576 583Queen's 619 474 500 543 507Regina 100 107 83 99 104RMC 91 87 74 40 77Ryerson 524 477 439 402 409Saskatchewan 223 261 255 252 251SFU 90 91 81 90 94Sherbrooke 331 303 305 264 284SMU 3 Toronto 955 872 836 931 893UBC 603 621 640 726 723UBCO 0 112 103UNB 286 287 260 206 210UNBC 4 6 8 19UOIT 80 132 140 225 158UQAC 48 37 42 37 44UQAM 14 8 10 7 4UQAR 13 8 17 17 15UQAT 11 13 21 27 18UQO 5 5 6 6 1UQTR 113 83 93 21 24UVic 136 136 139 158 151Waterloo 774 908 785 862 950Western 319 296 247 246 208Windsor 289 207 103 203 184York 38 31 35 20 15TOTAL 11451 11619 10781 11450 11703
TABLE UD.3.2. Total undergraduate degrees awarded to female students by institution: 2007 to 2011.
INSTITUTION 2007 2008 2009 2010 2011
Acadia 4Alberta 120 139 142 158 186BCIT 3 2 2Calgary 95 99 98 114 116Cape Breton 0Carleton 84 73 48 58 54Concordia 68 64 76 71 51Conestoga 0 0Dal 56 60 35 63 108ETS 50 60 56 50 68Guelph 37 51 22 17 22Lakehead 28 19 18 20 22Laurentian 9 3 2 7 24Laval 35 36 36 36 36Manitoba 22 41 24 30 27McGill 119 112 102 82 91McMaster 91 116 117 90 98Moncton 10 1 6 2 0MUN 30 27 39 33 33Ottawa 64 78 51 48 44Polytechnique 126 123 99 128 127Queen's 142 118 106 129 120Regina 28 19 10 14 34RMC 12 21 15 8 14Ryerson 74 90 77 59 54Saskatchewan 38 43 40 38 42SFU 13 12 13 15 14Sherbrooke 65 48 55 50 51SMU 1 Toronto 244 197 175 206 175UBC 115 114 128 124 152UBCO 0 18 19UNB 33 49 50 31 45UNBC 1 2 3 10UOIT 16 15 15 25 12UQAC 3 8 7 2 2UQAM 2 1 1 1 0UQAR 0 0 2 3 1UQAT 1 1 3 2 1UQO 1 1 0 1 0UQTR 25 10 11 1 3UVic 13 13 14 22 11Waterloo 182 161 122 134 162Western 53 48 50 36 48Windsor 52 16 25 21 23York 6 6 3 0 4TOTAL 2163 2094 1898 1952 2110

31
TABLE UD.3.3.Total undergraduate degrees awarded by institution and discipline: 2011.
INSTITUTIONBI
OSYS
TEM
S
CHEM
ICAL
CIVI
L
COM
PUTE
R
ELEC
TRIC
AL
ENGI
NEER
ING
PH
YSIC
S
ENVI
RONM
ENTA
L
GEOL
OGIC
AL
INDU
STRI
AL O
R M
ANUF
ACTU
RING
MAT
ERIA
LS O
R M
ETAL
LURG
ICAL
MEC
HANI
CAL
MIN
ING
OR
MIN
ERAL
SOFT
WAR
E
OTHE
R
AcadiaAlberta 138 173 32 129 26 45 200 43 50BCIT 21 4 11Calgary 74 56 27 77 5 139 11 73Cape BretonCarleton 65 22 130 3 21 63 18 73Concordia 114 24 44 26 108 34Conestoga 9Dal 4 42 62 3 33 28 25 12 53 21ETS 185 179 79 209 72Guelph 12 17 66Lakehead 17 98 44 58 6Laurentian 26 44 48Laval 9 11 60 14 30 20 6 10 78 2 5 13Manitoba 12 58 13 33 2 79McGill 76 81 152 22 125McMaster 77 110 39 118 40 39 127 26 6Moncton 17 3 10MUN 33 13 24 69 12Ottawa 16 52 56 18 46 49 15Polytechnique 49 122 32 58 25 22 56 3 157 10 49Queen's 96 115 17 25 60 22 128 44Regina 13 14 42 11 24RMC 3 25 10 5 15 19Ryerson 46 81 22 62 25 99 74Saskatchewan 15 39 65 8 19 12 4 16 73SFU 69 25Sherbrooke 49 62 27 55 91Toronto 99 109 250 157 65 44 158 11UBC 71 127 75 137 41 19 38 34 118 32 31UBCO 53 14 36UNB 2 22 69 9 33 3 55 5 12UNBC 19UOIT 28 6 92 5 27UQAC 5 12 5 4 18UQAM 4UQAR 3 7 5UQAT 14 4UQO 1UQTR 0.9 8.8 6.9 7.8UVic 17 48 74 12Waterloo 193 92 101 154 28 12 236 70 64Western 48 54 3 32 51 14 6Windsor 28 42 8 12 94York 7 6 2TOTAL 141 1158 2191 569 2050 453 207 124 350 213 2976 211 353 491

32
TABLE UD.3.4.Total undergraduate degrees awarded to women by institution and discipline: 2011.
INSTITUTION
BIOS
YSTE
MS
CHEM
ICAL
CIVI
L
COM
PUTE
R
ELEC
TRIC
AL
ENGI
NEER
ING
PH
YSIC
S
ENVI
RONM
ENTA
L
GEOL
OGIC
AL
INDU
STRI
AL O
R M
ANUF
ACTU
RING
MAT
ERIA
LS O
R M
ETAL
LURG
ICAL
MEC
HANI
CAL
MIN
ING
OR
MIN
ERAL
SOFT
WAR
E
OTHE
R
AcadiaAlberta 35 60 1 21 2 18 28 10 11BCIT 1 1Calgary 33 15 4 14 3 25 3 19Cape BretonCarleton 8 3 22 1 10 2 1 7Concordia 27 2 3 5 8 6ConestogaDal 1 11 11 4 10 8 1 7 1ETS 30 17 6 9 6Guelph 2 20Lakehead 5 12 4 1Laurentian 9 5 10Laval 5 5 11 1 5 8 1Manitoba 4 9 2 6 6McGill 31 20 23 5 12McMaster 20 25 5 17 7 9 11 4MonctonMUN 13 2 15 3Ottawa 6 17 10 1 3 6 1Polytechnique 25 22 3 8 6 9 21 2 23 2 6Queen's 32 31 3 11 14 18 11Regina 2 7 13 3 9RMC 1 7 1 1 1 3Ryerson 10 17 3 8 7 2 7Saskatchewan 8 6 17 2 1 4 4SFU 14Sherbrooke 25 13 3 10Toronto 44 20 26 33 22 9 18 3UBC 26 36 7 29 6 10 7 6 12 6 7UBCO 13 2 4UNB 1 8 15 2 3 7 9UNBC 10UOIT 3 5 2 2UQAC 1 1UQAMUQAR 1UQAT 1UQOUQTR 0 1 1 1UVic 2 3 5 1Waterloo 60 21 14 15 15 5 14 4 14Western 19 13 4 8 2 2Windsor 7 6 3 3 4York 2 1 1TOTAL 53 396 484 58 250 82 86 40 89 50 286 43 40 95

33
A.3. POST GRADUATE STUDENT ENROLMENT
G.1. National
TABLE G.1.1.Total full-time master’s students: 2007 to 2011.
YEAR 2007 2008 2009 2010 2011
Cdn Male 4960 4826 4701 4977 5013Cdn Female 1362 1462 1363 1421 1424Visa Male 2190 2380 2643 3283 3639Visa Female 704 733 765 900 1076TOTAL 9216 9401 9473 10581 11152
TABLE G.1.2.Total full-time doctoral students: 2007 to 2011.
YEAR 2007 2008 2009 2010 2011
Cdn Male 3236 3192 3161 3487 3288Cdn Female 851 855 826 907 875Visa Male 1960 2037 2289 2523 2752Visa Female 418 449 537 613 743TOTAL 6464 6533 6813 7530 7658
TABLE G.1.3.Total part-time master’s students: 2007 to 2011.
YEAR 2007 2008 2009 2010 2011
Cdn Male 1524 1667 1827 1921 1983Cdn Female 382 438 477 518 447Visa Male 125 136 154 102 197Visa Female 32 44 47 24 34TOTAL 2063 2285 2505 2565 2662
TABLE G.1.4.Total part-time doctoral students: 2007 to 2011.
YEAR 2007 2008 2009 2010 2011
Cdn Male 240 243 306 315 381Cdn Female 47 44 61 49 69Visa Male 41 40 41 36 56Visa Female 18 11 10 8 9TOTAL 346 339 419 407 515
TABLE G.1.5.Total full-time equivalent master’s students by discipline: 2007 to 2011.
DISCIPLINE 2007 2008 2009 2010 2011
Biosystems 292 349 409 396 452
Chemical 795 708 835 924 1059
Civil 1743 1728 1776 1852 2048
Computer 281 299 285 312 337
Electrical 3030 3089 2723 2958 3020
Engineering Physics 212 159 145 153 167
Environmental 212 223 226 243 265
Geological 28 27 25 44 20
Industrial or Manufacturing 392 284 278 339 403
Materials or Metallurgical 216 187 230 237 219
Mechanical 1595 1680 1748 1976 1933
Mining or Mineral 119 152 121 136 156
Software 123 147 138 164 177
Other 898 1112 1385 1779 1802
TOTAL 9937 10144 10325 11513 12056
TABLE G.1.6.Total full-time equivalent doctoral students by discipline: 2007 to 2011.
DISCIPLINE 2007 2008 2009 2010 2011
Biosystems 210 242 328 359 400
Chemical 689 679 748 805 850
Civil 1002 1017 1094 1111 1185
Computer 122 118 123 142 157
Electrical 2106 2068 2079 2228 2215
Engineering Physics 218 173 169 217 174
Environmental 73 90 88 99 94
Geological 5 6 9 13 7
Industrial or Manufacturing 152 127 122 144 224
Materials or Metallurgical 181 185 261 311 266
Mechanical 1046 1106 1156 1327 1323
Mining or Mineral 127 140 86 91 105
Software 10 9 18 16 18
Other 663 686 705 812 894
TOTAL 6602 6647 6986 7673 7913
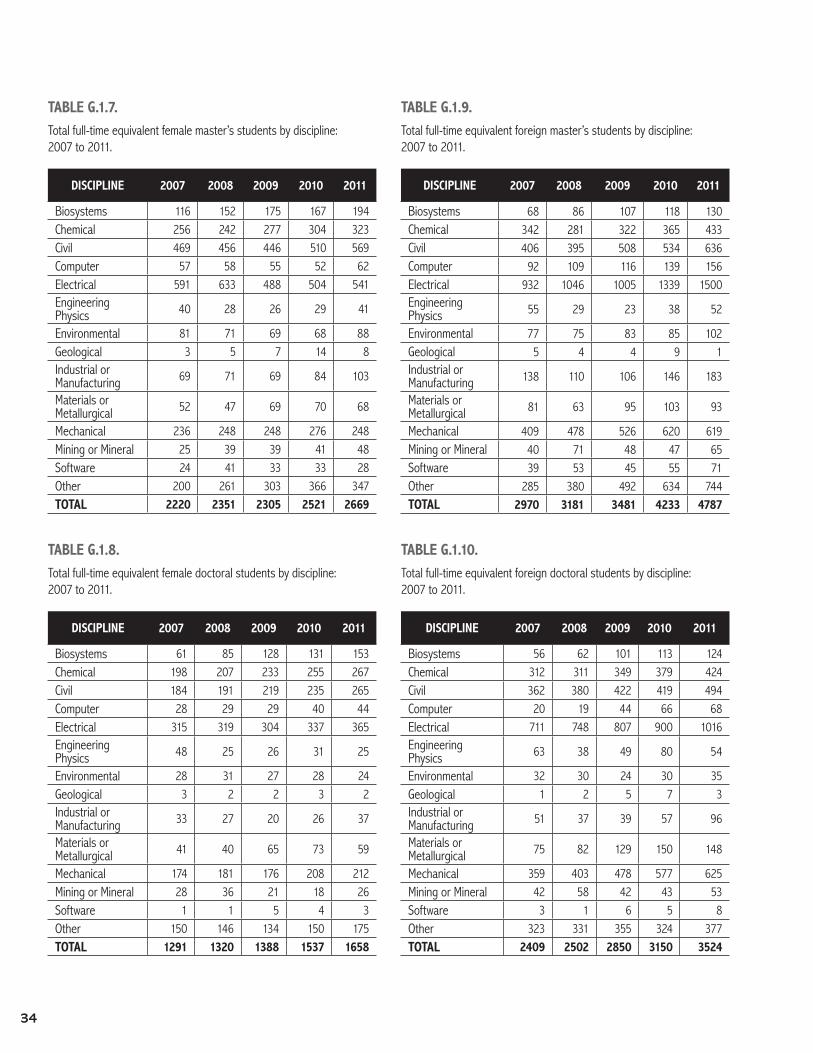
34
TABLE G.1.7.Total full-time equivalent female master’s students by discipline: 2007 to 2011.
DISCIPLINE 2007 2008 2009 2010 2011
Biosystems 116 152 175 167 194Chemical 256 242 277 304 323Civil 469 456 446 510 569Computer 57 58 55 52 62Electrical 591 633 488 504 541Engineering Physics 40 28 26 29 41
Environmental 81 71 69 68 88Geological 3 5 7 14 8Industrial or Manufacturing 69 71 69 84 103
Materials or Metallurgical 52 47 69 70 68
Mechanical 236 248 248 276 248Mining or Mineral 25 39 39 41 48Software 24 41 33 33 28Other 200 261 303 366 347TOTAL 2220 2351 2305 2521 2669
TABLE G.1.8.Total full-time equivalent female doctoral students by discipline: 2007 to 2011.
DISCIPLINE 2007 2008 2009 2010 2011
Biosystems 61 85 128 131 153Chemical 198 207 233 255 267Civil 184 191 219 235 265Computer 28 29 29 40 44Electrical 315 319 304 337 365Engineering Physics 48 25 26 31 25
Environmental 28 31 27 28 24Geological 3 2 2 3 2Industrial or Manufacturing 33 27 20 26 37
Materials or Metallurgical 41 40 65 73 59
Mechanical 174 181 176 208 212Mining or Mineral 28 36 21 18 26Software 1 1 5 4 3Other 150 146 134 150 175TOTAL 1291 1320 1388 1537 1658
TABLE G.1.9.Total full-time equivalent foreign master’s students by discipline: 2007 to 2011.
DISCIPLINE 2007 2008 2009 2010 2011
Biosystems 68 86 107 118 130Chemical 342 281 322 365 433Civil 406 395 508 534 636Computer 92 109 116 139 156Electrical 932 1046 1005 1339 1500Engineering Physics 55 29 23 38 52
Environmental 77 75 83 85 102Geological 5 4 4 9 1Industrial or Manufacturing 138 110 106 146 183
Materials or Metallurgical 81 63 95 103 93
Mechanical 409 478 526 620 619Mining or Mineral 40 71 48 47 65Software 39 53 45 55 71Other 285 380 492 634 744TOTAL 2970 3181 3481 4233 4787
TABLE G.1.10.Total full-time equivalent foreign doctoral students by discipline: 2007 to 2011.
DISCIPLINE 2007 2008 2009 2010 2011
Biosystems 56 62 101 113 124Chemical 312 311 349 379 424Civil 362 380 422 419 494Computer 20 19 44 66 68Electrical 711 748 807 900 1016Engineering Physics 63 38 49 80 54
Environmental 32 30 24 30 35Geological 1 2 5 7 3Industrial or Manufacturing 51 37 39 57 96
Materials or Metallurgical 75 82 129 150 148
Mechanical 359 403 478 577 625Mining or Mineral 42 58 42 43 53Software 3 1 6 5 8Other 323 331 355 324 377TOTAL 2409 2502 2850 3150 3524

35
G.2. Provincial
TABLE G.2.1.Total full-time equivalent master’s students by province: 2007 to 2011.
PROVINCE 2007 2008 2009 2010 2011
AB 1414 1212 1618 1861 2013BC 582 563 689 816 892MB 170 156 155 170 187NB 282 196 264 202 187NL 146 154 157 199 231NS 195 254 197 266 356ON 3476 3702 4063 4273 4490QC 3420 3639 2915 3377 3411SK 253 269 267 348 290TOTAL 9937 10144 10325 11513 12056
TABLE G.2.2.Total full-time equivalent doctoral students by province: 2007 to 2011.
PROVINCE 2007 2008 2009 2010 2011
AB 888 795 1071 1144 1241BC 622 651 660 729 818MB 171 174 169 181 205NB 155 95 171 123 106NL 53 61 73 82 86NS 68 110 82 89 144ON 2406 2534 2694 2908 2957QC 2075 2064 1899 2213 2160SK 165 164 167 206 197TOTAL 6602 6647 6986 7673 7913
TABLE G.2.3.Total full-time equivalent female master’s students by province: 2007 to 2011.
PROVINCE 2007 2008 2009 2010 2011
AB 298 253 368 434 439BC 139 153 187 224 220MB 38 34 35 39 40NB 63 55 62 39 35NL 42 47 41 41 50NS 49 63 43 42 45ON 809 897 884 916 1000QC 710 778 613 689 747SK 71 71 72 97 93TOTAL 2220 2351 2305 2521 2669
TABLE G.2.4.Total full-time equivalent female doctoral students by province: 2007 to 2011.
PROVINCE 2007 2008 2009 2010 2011
AB 160 155 205 223 260BC 138 139 123 140 165MB 25 27 23 25 34NB 27 27 34 27 27NL 7 8 9 13 14NS 11 22 19 21 28ON 485 508 550 594 620QC 399 394 383 448 469SK 40 40 40 48 42TOTAL 1291 1320 1388 1537 1658
TABLE G.2.5.Total full-time equivalent foreign master’s students by province: 2007 to 2011.
PROVINCE 2007 2008 2009 2010 2011
AB 526 476 722 900 906BC 175 200 272 321 399MB 62 61 62 73 88NB 165 115 107 88 93NL 94 105 100 132 163NS 77 135 105 157 225ON 724 768 926 1109 1359QC 1013 1177 1044 1260 1371SK 133 145 141 193 183TOTAL 2970 3181 3481 4233 4787
TABLE G.2.6.Total full-time equivalent foreign doctoral students by province: 2007 to 2011.
PROVINCE 2007 2008 2009 2010 2011
AB 372 383 553 551 620BC 240 272 363 394 477MB 68 70 72 84 100NB 86 57 81 64 65NL 29 35 41 40 45NS 18 36 29 37 57ON 776 800 888 980 1046QC 743 778 739 891 999SK 78 71 84 109 116TOTAL 2409 2502 2850 3150 3524

36
TABLE G.2.7.Total full-time equivalent postgraduate student enrolment by province and discipline: 2011.
DISCIPLINE AB BC MB NB NL NS ON QC SK TOTAL
Biosystems 77 171 42 6 59 291 110 74 831
Chemical 687 70 23 770 326 34 1909
Civil 812 264 82 53 43 64 1040 874 3232
Computer 62 25 68 163 154 22 494
Electrical 559 506 159 47 42 130 2248 1504 39 5235
Engineering Physics 97 4 9 94 138 342
Environmental 29 9 23 207 30 62 359
Geological 15 12 27
Industrial or Manufacturing 109 23 179 279 38 627
Materials or Metallurgical 88 90 25 142 140 485
Mechanical 524 348 52 29 48 1295 884 76 3256
Mining or Mineral 42 93 4 70 53 261
Software 11 47 125 12 195
Other 305 155 66 125 92 868 955 130 2695
TOTAL 3253 1711 392 294 316 500 7426 5572 487 19948
TABLE G.2.8.Total full-time equivalent female postgraduate student enrolment by province and discipline: 2011.
DISCIPLINE AB BC MB NB NL NS ON QC SK Total
Biosystems 34 55 9 4 25 127 50 34 337Chemical 182 27 2 279 91 9 590Civil 203 72 14 9 10 18 265 243 834Computer 12 6 13 32 38 6 106Electrical 100 99 35 4 10 7 370 275 6 906Engineering Physics 17 2 18 30 66Environmental 7 5 7 65 7 22 112Geological 5 5 10Industrial or Manufacturing 17 3 25 89 6 140Materials or Metallurgical 24 24 4 37 38 127Mechanical 65 54 5 3 192 125 16 461Mining or Mineral 7 28 19 20 74Software 1 5 24 2 31Other 56 31 13 23 7 172 186 35 522TOTAL 700 384 75 62 64 73 1611 1216 136 4316

37
G.3. Institutional
TABLE G.3.1.Total full-time postgraduate students by institution: 2007 to 2011.
INSTITUTION 2007 2008 2009 2010 2011
Alberta 1144 1157 1382 1541 1541Calgary 1035 753 1186 1333 1519Carleton 337 299 300 540 572Concordia 1776 2204 1237 1371 1517Dal 242 336 263 342 491ETS 796 494 594 737 804Guelph 90 106 115 117 125Lakehead 70 56 54 51 46Laurentian 21 29 26 43 38Laval 486 373 372 372 372Manitoba 331 318 310 337 378McGill 577 649 608 739 579McMaster 546 534 565 659 643Moncton 17 24 17 17 13MUN 181 199 205 260 290NSAC 6Ottawa 353 332 384 382 466Polytechnique 1001 1125 1049 1142 1259Queen's 397 413 415 438 450Regina 124 133 127 148 173RMC 119 109 112 119 100Ryerson 512 614 580 603 582Saskatchewan 279 290 297 396 300SFU 124 128 138 196 211Sherbrooke 389 356 426 473 482Toronto 1119 1215 1286 1388 1450UBC 798 843 936 1045 1072UBCO 37 28 130UNB 363 243 348 250 226UOIT 21 41 103 151 151UQAC 129 124 118 136 134UQAR 11 14 39 24 16UQAT 18 20 41 52 47UQTR 70 60 65 219 92UVic 222 222 220 231 257Waterloo 905 1039 1151 1213 1244Western 452 475 494 525 566Windsor 395 345 406 451 456TOTAL 15447 15669 16012 18067 18791
TABLE G.3.2.Total part-time postgraduate students by institution: 2007 to 2011.
INSTITUTION 2007 2008 2009 2010 2011
Alberta 0 0 0 0 0Calgary 373 281 309 333 274Carleton 89 86 93 161 171Concordia 112 163 95 97 104Dal 28 38 24 30 26ETS 159 182 222 303 450Guelph 23 25 32 40 37Lakehead 0 0 0 0 0Laurentian 12 19 15 6 8Laval 64 66 66 66 66Manitoba 35 43 49 52 49McGill 31 44 38 32 12McMaster 124 142 493 388 481Moncton 7 9 9 9 2MUN 58 51 51 45 53NSAC 0Ottawa 94 96 94 84 99Polytechnique 83 225 0 74 88Queen's 42 38 46 40 38Regina 30 20 19 21 28RMC 15 13 17 18 5Ryerson 129 125 136 112 107Saskatchewan 0 0 0 0 0SFU 10 12 12 14 9Sherbrooke 190 185 228 202 171Toronto 134 142 145 156 192UBC 78 73 46 41 36UBCO 0 0 0UNB 55 54 124 49 51UOIT 8 15 34 27 32UQAC 0 3 0 0 0UQAR 2 2 0 0 0UQAT 0 0 0 0 0UQTR 30 21 24 27 21UVic 9 9 0 0 0Waterloo 263 286 339 403 397Western 25 33 48 135 151Windsor 31 29 23 5 15TOTAL 2343 2529 2833 2969 3172

38
TABLE G.3.3.Total full-time female postgraduate students by institution: 2007 to 2011.
INSTITUTION 2007 2008 2009 2010 2011
Alberta 218 228 282 327 359Calgary 217 164 266 292 303Carleton 71 56 59 105 110Concordia 325 447 245 284 321Dal 54 80 58 61 72ETS 140 79 92 124 148Guelph 32 28 29 26 29Lakehead 17 8 6 7 5Laurentian 0 5 3 7 7Laval 107 72 72 72 72Manitoba 61 59 56 61 71McGill 123 142 160 152 128McMaster 128 128 143 153 164Moncton 6 6 3 3 3MUN 44 48 48 51 61NSAC 2Ottawa 89 117 70 69 104Polytechnique 240 269 262 290 351Queen's 87 93 83 101 112Regina 38 36 34 30 40RMC 29 24 25 23 19Ryerson 78 102 101 112 99Saskatchewan 69 72 77 112 92SFU 37 29 34 41 41Sherbrooke 72 61 68 86 85Toronto 281 307 328 339 369UBC 166 194 225 264 261UBCO 5 3 28UNB 68 73 86 55 52UOIT 2 5 17 22 22UQAC 40 34 26 33 33UQAR 2 2 2 2 2UQAT 5 3 8 10 5UQTR 13 11 15 19 18UVic 63 63 41 38 43Waterloo 206 219 245 274 284Western 86 103 95 104 116Windsor 78 75 70 73 79TOTAL 3290 3441 3437 3825 4108
TABLE G.3.4.Total part-time female postgraduate students by institution: 2007 to 2011.
INSTITUTION 2007 2008 2009 2010 2011
Alberta 0 0 0 0 0Calgary 73 54 55 99 39Carleton 14 22 21 24 34Concordia 18 22 14 13 22Dal 4 7 4 3 3ETS 32 33 38 54 77Guelph 7 5 6 7 6Lakehead 0 0 0 0 0Laurentian 2 7 5 2 1Laval 15 17 17 17 17Manitoba 7 8 10 12 11McGill 8 14 12 7 2McMaster 20 30 107 68 81Moncton 0 2 2 2 0MUN 5 6 6 6 6NSAC 0 Ottawa 19 19 16 15 19Polytechnique 19 56 0 15 20Queen's 9 10 10 6 8Regina 8 6 5 3 6RMC 3 4 5 4 0Ryerson 22 20 25 14 8Saskatchewan 0 0 0 0 0SFU 3 0 2 3 1Sherbrooke 40 40 46 45 36Toronto 34 37 37 36 37UBC 18 16 14 17 11UBCO 0 0 0UNB 7 3 26 6 7UOIT 1 1 5 3 4UQAC 0 1 0 0 0UQAR 0 1 0 0 0UQAT 0 0 0 0 0UQTR 8 4 6 4 2UVic 3 3 0 0 0Waterloo 52 55 67 80 77Western 4 8 11 29 21Windsor 10 6 6 2 2TOTAL 464 518 577 598 558

39
TABLE G.3.5.Total full-time postgraduate students by institution and discipline: 2011.
INSTITUTIONBI
OSYS
TEM
S
CHEM
ICAL
CIVI
L
COM
PUTE
R
ELEC
TRIC
AL
ENGI
NEER
ING
PHYS
ICS
ENVI
RONM
ENTA
L
GEOL
OGIC
AL
INDU
STRI
AL O
R M
ANUF
ACTU
RING
MAT
ERIA
LS O
R M
ETAL
LURG
ICAL
MEC
HANI
CAL
MIN
ING
OR
MIN
ERAL
SOFT
WAR
E
OTHE
R
Alberta 242 408 62 227 97 88 271 42 104Calgary 65 408 378 305 219 144Carleton 22 91 6 234 40 7 64 3 105Concordia 334 714 46 289 102 32Dal 59 23 63 129 9 22 23 24 48 4 89ETS 60 68 23 67 9 576Guelph 21 32 72Lakehead 34 12Laurentian 38Laval 9 52 84 103 32 84 7 1Manitoba 42 76 153 108McGill 72 82 218 79 128McMaster 48 68 53 23 153 75 39 82 27 74Moncton 13MUN 40 65 38 9 26 113Ottawa 19 54 74 163 24 86 47Polytechnique 101 139 130 152 179 138 161 27 156 46 30Queen's 90 84 112 15 11 107 30Regina 20 49 34 11 59RMC 9 9 11 16 6 12 10 27Ryerson 36 100 73 153 145 75Saskatchewan 74 34 39 9 76 69SFU 59 151Sherbrooke 60 130 141 141 10Toronto 174 188 191 378 63 323 133UBC 167 190 338 4 29 13 90 153 89UBCO 57 36 37UNB 5 64 33 37 45 43UOIT 43 74 34UQAC 30 104UQAR 16UQAT 47UQTR 43 30 19UVic 25 127 94 11Waterloo 178 174 455 199 238Western 126 143 191 106Windsor 36 180 43 59 30 107TOTAL 806 1843 3020 469 5006 337 344 24 589 480 3093 256 173 2351

40
TABLE G.3.6.Total part-time postgraduate students by institution and discipline: 2011.
INSTITUTION
BIOS
YSTE
MS
CHEM
ICAL
CIVI
L
COM
PUTE
R
ELEC
TRIC
AL
ENGI
NEER
ING
PHYS
ICS
ENVI
RONM
ENTA
L
GEOL
OGIC
AL
INDU
STRI
AL O
R M
ANUF
ACTU
RING
MAT
ERIA
LS O
R M
ETAL
LURG
ICAL
MEC
HANI
CAL
MIN
ING
OR
MIN
ERAL
SOFT
WAR
E
OTHE
R
AlbertaCalgary 12 53 46 46 59 58Carleton 11 30 1 93 7 11 2 16Concordia 23 38 2 12 18 11Dal 4 5 1 3 3 1 9ETS 75 79 10 24 28 235Guelph 1 16 19LakeheadLaurentian 8Laval 2 5 15 20 5 14 2 4Manitoba 2 23 21 4McGill 1 1 2 1 7McMaster 6 32 40 59 12 3 3 92 20 214Moncton 2MUN 6 6 9 8 24Ottawa 4 4 14 26 3 9 39Polytechnique 1 2 17 6 7 31 7 1 15Queen's 1 16 7 1 7 6Regina 4 8 7 3 5RMC -8 1 4 1 3 4Ryerson 8 7 26 35 23 8SaskatchewanSFU 9Sherbrooke 171Toronto 17 59 36 3 73 4UBC 4 18 6 2 4 3UBCOUNB 1 6 19 10 7 8UOIT 5 11 16UQACUQARUQATUQTR 9 12 1UVicWaterloo 13 36 165 69 114Western 25 53 36 37Windsor 2 2 2 2 2 6TOTAL 44 159 502 61 719 13 44 4 108 16 442 20 74 967

41
TABLE G.3.7.Total full-time female postgraduate students by institution and discipline: 2011.
INSTITUTIONBI
OSYS
TEM
S
CHEM
ICAL
CIVI
L
COM
PUTE
R
ELEC
TRIC
AL
ENGI
NEER
ING
PHYS
ICS
ENVI
RONM
ENTA
L
GEOL
OGIC
AL
INDU
STRI
AL O
R M
ANUF
ACTU
RING
MAT
ERIA
LS O
R M
ETAL
LURG
ICAL
MEC
HANI
CAL
MIN
ING
OR
MIN
ERAL
SOFT
WAR
E
OTHE
R
Alberta 92 119 12 43 17 24 36 7 9Calgary 29 83 80 53 26 33Carleton 9 20 3 44 17 4 6 7Concordia 78 165 13 40 21 4Dal 25 2 18 7 7 3 4 7ETS 14 7 2 6 2 117Guelph 5 8 17Lakehead 3 2Laurentian 7Laval 3 13 26 11 7 11 1 0Manitoba 9 12 34 17McGill 18 30 34 22 24McMaster 24 26 18 7 35 15 11 7 4 15Moncton 3MUN 9 13 9 5 3 22Ottawa 10 26 12 26 11 15 6Polytechnique 46 41 44 37 34 30 62 9 26 19 3Queen's 30 27 17 1 5 21 11Regina 5 16 6 1 12RMC 2 1 1 2 3 3 7Ryerson 16 23 11 23 16 10Saskatchewan 34 9 6 4 16 23SFU 10 31Sherbrooke 19 34 16 15 1Toronto 77 84 62 55 13 57 21UBC 54 50 69 2 7 4 24 24 28UBCO 15 9 4UNB 3 26 7 2 4 9UOIT 7 7 8UQAC 7 26UQAR 2UQAT 5UQTR 4 9 5UVic 6 21 15 1Waterloo 51 47 81 37 69Western 42 31 27 15Windsor 9 31 12 9 8 11TOTAL 327 579 785 103 874 65 107 9 135 126 441 73 29 454

42
TABLE G.3.8.Total part-time female postgraduate enrolment by institution and discipline: 2011.
INSTITUTION
BIOS
YSTE
MS
CHEM
ICAL
CIVI
L
COM
PUTE
R
ELEC
TRIC
AL
ENGI
NEER
ING
PHYS
ICS
ENVI
RONM
ENTA
L
GEOL
OGIC
AL
INDU
STRI
AL O
R M
ANUF
ACTU
RING
MAT
ERIA
LS O
R M
ETAL
LURG
ICAL
MEC
HANI
CAL
MIN
ING
OR
MIN
ERAL
SOFT
WAR
E
OTHE
R
AlbertaCalgary 6 8 5 4 3 14Carleton 5 6 1 14 4 2 1 1Concordia 8 7 2 3 2Dal 2 1 0ETS 21 1 1 1 5 48Guelph 2 4LakeheadLaurentian 1Laval 1 1 6 1 2 5 0 1Manitoba 6 5McGill 2McMaster 9 5 5 3 13 2 44MonctonMUN 2 1 0 1 2Ottawa 1 2 1 6 1 0 8Polytechnique 1 4 2 1 10 1 1 1Queen's 0 6 0 0 1Regina 1 3 1 1 1RMC -3 1 1Ryerson 1 2 1 2 1 1SaskatchewanSFU 1Sherbrooke 36Toronto 8 11 7 1 10 0UBC 1 7 1 1 1 0UBCOUNB 1 1 2 1 1 1UOIT 1 0 2UQACUQARUQATUQTR 2 1UVicWaterloo 5 7 23 8 35Western 3 10 6 2Windsor 1 1 0 1TOTAL 14 34 109 8 88 3 14 1 17 3 51 4 13 199

43
A.4. POST GRADUATE DEGREES AWARDED
GD.1. National
TABLE GD.1.1.Total master’s degrees awarded by discipline: 2007 to 2011.
DISCIPLINE 2007 2008 2009 2010 2011
Biosystems 58 102 121 119 133Chemical 289 305 286 321 331Civil 643 649 682 707 702Computer 118 127 143 138 140Electrical 949 1094 1061 1086 1136Engineering Physics 80 48 64 76 81
Environmental 88 74 75 86 92Geological 8 5 8 9 11Industrial or Manufacturing 147 138 107 114 152
Materials or Metallurgical 56 45 90 66 70
Mechanical 560 586 601 737 783Mining or Mineral 44 44 43 41 34Software 23 25 43 54 50Other 323 420 452 501 715Year One/Two Common Year 0 0
TOTAL 3386 3662 3776 4055 4429
TABLE GD.1.2.Total doctoral degrees awarded by discipline: 2007 to 2011.
DISCIPLINE 2007 2008 2009 2010 2011
Biosystems 31 26 50 33 44Chemical 95 110 119 132 118Civil 132 121 151 171 143Computer 11 14 30 26 17Electrical 253 339 293 318 304Engineering Physics
20 28 31 27 33
Environmental 8 6 17 15 10Geological 0 1 4 3 2Industrial or Manufacturing
14 10 27 14 15
Materials or Metallurgical
40 26 41 44 43
Mechanical 138 176 166 152 187Mining or Mineral 22 31 6 11 13Software 3 2 2 3 3Other 66 68 90 76 84Year One/Two Common Year
0 0
TOTAL 833 958 1027 1025 1017
TABLE GD.1.3.Total master’s degrees awarded to women by discipline: 2007 to 2011.
DISCIPLINE 2007 2008 2009 2010 2011
Biosystems 22 41 56 48 59Chemical 91 87 88 111 119Civil 178 180 199 158 200Computer 30 30 21 23 27Electrical 191 218 228 211 202Engineering Physics 16 5 16 12 19
Environmental 35 33 28 23 26Geological 4 1 3 3 3Industrial or Manufacturing 33 39 30 23 40
Materials or Metallurgical 22 13 24 20 16
Mechanical 95 98 87 96 112Mining or Mineral 12 7 13 9 15Software 6 2 10 12 14Other 73 110 108 113 140Year One/Two Common Year 0 0
TOTAL 808 864 911 862 992
TABLE GD.1.4.Total doctoral degrees awarded to women by discipline: 2007 to 2011.
DISCIPLINE 2007 2008 2009 2010 2011
Biosystems 4 7 17 16 17Chemical 16 36 40 41 34Civil 20 25 28 32 42Computer 1 2 8 5 6Electrical 42 58 58 41 40Engineering Physics
6 4 5 7 5
Environmental 3 4 6 7 5Geological 0 1 0 2 1Industrial or Manufacturing
6 3 9 4 2
Materials or Metallurgical
3 6 6 9 7
Mechanical 16 26 31 29 23Mining or Mineral 1 8 2 0 6Software 1 0 0 1 2Other 13 18 16 12 15Year One/Two Common Year
0 0
TOTAL 132 198 226 206 205

44
TABLE GD.1.5.Total master’s degrees awarded to foreign students by discipline: 2007 to 2011.
DISCIPLINE 2007 2008 2009 2010 2011
Biosystems 9 36 32 28 33Chemical 103 134 97 106 104Civil 157 155 120 148 195Computer 33 43 38 23 40Electrical 207 294 282 361 481Engineering Physics
13 12 19 20 22
Environmental 36 24 21 32 34Geological 2 1 1 1 2Industrial or Manufacturing
43 42 32 35 70
Materials or Metallurgical
14 14 28 25 31
Mechanical 88 120 141 148 263Mining or Mineral 9 14 16 15 12Software 1 0 13 20 19Other 74 123 112 152 304Year One/Two Common Year
0 0
TOTAL 789 1012 952 1114 1611
TABLE GD.1.6.Total doctoral degrees awarded to foreign students by discipline: 2007 to 2011.
DISCIPLINE 2007 2008 2009 2010 2011
Biosystems 6 4 13 6 3Chemical 20 26 27 29 35Civil 19 17 25 32 20Computer 0 0 9 2 5Electrical 40 57 36 63 48Engineering Physics
3 0 4 2 6
Environmental 2 1 4 3 5Geological 0 0 2 0 0Industrial or Manufacturing
2 0 7 0 2
Materials or Metallurgical
7 3 8 9 11
Mechanical 18 21 31 33 45Mining or Mineral
5 4 2 5 3
Software 0 0 0 2 0Other 13 17 16 15 21Year One/Two Common Year
0 0
TOTAL 135 150 184 201 204
GD.2. Provincial
TABLE GD.2.1.Total master’s degrees awarded by province: 2007 to 2011.
PROVINCE 2007 2008 2009 2010 2011
AB 459 520 418 369 505BC 180 220 220 259 344MB 56 59 30 49 45NB 65 40 52 45 59NL 54 53 50 47 68NS 91 76 86 105 114ON 1369 1556 1769 2106 2173QC 1012 1053 1067 974 1021SK 100 85 84 101 100TOTAL 3386 3662 3776 4055 4429
TABLE GD.2.2.Total doctoral degrees awarded by province: 2007 to 2011.
PROVINCE 2007 2008 2009 2010 2011
AB 108 130 116 120 130BC 84 78 90 95 106MB 23 24 17 21 27NB 15 10 17 11 6NL 15 8 9 12 10NS 14 14 30 12 14ON 365 402 438 471 463QC 187 277 279 249 237SK 22 15 31 34 24TOTAL 833 958 1027 1025 1017
TABLE GD.2.3.Total master’s degrees awarded to women by province: 2007 to 2011.
PROVINCE 2007 2008 2009 2010 2011
AB 108 112 84 63 112BC 40 62 62 62 111MB 11 14 5 13 11NB 6 14 14 11 10NL 12 13 14 17 11NS 15 16 23 21 16ON 377 386 449 450 474QC 206 219 240 211 219SK 33 28 20 14 28TOTAL 808 864 911 862 992

45
TABLE GD.2.4.Total doctoral degrees awarded to women by province: 2007 to 2011.
PROVINCE 2007 2008 2009 2010 2011
AB 16 25 24 13 25BC 11 13 13 16 18MB 2 6 4 2 3NB 0 5 3 3 1NL 4 0 0 1 2NS 3 2 16 4 2ON 55 80 100 108 100QC 37 62 61 47 51SK 4 5 5 12 3TOTAL 132 198 226 206 205
TABLE GD.2.5.Total master’s degrees awarded to foreign students by province: 2007 to 2011.
PROVINCE 2007 2008 2009 2010 2011
AB 177 224 145 144 246BC 56 63 80 83 161MB 13 27 10 20 22NB 2 21 25 31 28NL 35 39 33 29 56NS 37 34 40 46 80ON 258 346 324 429 578QC 155 214 236 270 374SK 56 44 59 62 66TOTAL 789 1012 952 1114 1611
TABLE GD.2.6.Total doctoral degrees awarded to foreign students by province: 2007 to 2011.
PROVINCE 2007 2008 2009 2010 2011
AB 24 21 16 24 26BC 16 13 18 35 32MB 1 7 3 3 3NB 0 4 9 8 2NL 4 2 2 2 4NS 1 1 19 1 3ON 52 57 59 71 73QC 30 40 49 49 53SK 7 5 9 8 8TOTAL 135 150 184 201 204

46
TABLE GD.2.7.Total master’s degrees awarded by province and discipline: 2011.
DISCIPLINE AB BC MB NB NL NS ON QC SK Total
Biosystems 3 22 9 1 70 17 11 133Chemical 89 17 1 178 34 12 331Civil 133 97 9 10 4 4 266 167 12 702Computer 15 1 13 85 19 7 140Electrical 88 76 16 8 5 16 600 313 14 1136Engineering Physics 11 35 2 15 18 81Environmental 19 10 3 49 3 8 92Geological 6 2 3 11Industrial or Manufacturing 11 6 25 98 12 152Materials or Metallurgical 10 10 3 38 9 70Mechanical 120 66 6 5 7 400 167 12 783Mining or Mineral 6 11 5 12 34Software 1 12 35 2 50Other 30 18 31 71 428 127 10 715Year One/Two Common Year 0TOTAL 505 344 45 59 68 114 2173 1021 100 4429
TABLE GD.2.8.Total doctoral degrees awarded by province and discipline: 2011.
DISCIPLINE AB BC MB NB NL NS ON QC SK Total
Biosystems 5 10 2 1 15 8 3 44Chemical 27 1 61 25 4 118Civil 17 18 4 2 3 4 63 31 1 143Computer 2 3 1 5 5 1 17Electrical 37 23 16 1 170 50 7 304Engineering Physics 7 6 1 9 10 33Environmental 6 4 10Geological 1 1 2Industrial or Manufacturing 4 1 4 5 1 15Materials or Metallurgical 9 10 1 15 8 43Mechanical 15 30 1 3 2 5 77 52 2 187Mining or Mineral 1 5 1 2 4 13Software 3 3Other 10 3 33 37 1 84Year One/Two Common Year 0TOTAL 130 106 27 6 10 14 463 237 24 1017

47
GD.3. Institutional
TABLE GD.3.1.Total master’s degrees awarded by institution: 2007 to 2011.
INSTITUTION 2007 2008 2009 2010 2011
Acadia 0Alberta 188 188 206 206 334BCIT 0 0 0Calgary 271 332 212 163 171Cape Breton 0Carleton 66 129 133 148 147Concordia 364 375 370 373 400Conestoga 0 0Dal 91 76 86 105 114ETS 92 125 92 153 178Guelph 27 27 34 34 40Lakehead 17 13 23 21 20Laurentian 5 6 7 6 0Laval 52 44 44 44 44Manitoba 56 59 30 49 45McGill 124 108 150 101 35McMaster 115 142 179 215 250Moncton 5 3 6 7 8MUN 54 53 50 47 68Ottawa 121 121 91 116 128Polytechnique 293 270 268 237 254Queen's 76 87 90 74 92Regina 54 33 27 35 36RMC 24 27 33 32 0Ryerson 135 188 237 269 247Saskatchewan 46 52 57 66 64SFU 21 21 15 29 40Sherbrooke 49 100 118 51 86SMU 0Toronto 308 329 359 391 401UBC 136 176 176 192 237UBCO 6 12 38UNB 60 37 46 38 51UNBC 0 0 0 0UOIT 0 8 21 41 67UQAC 9 9 11 9 11UQAM 0 0 0 0 0UQAR 2 2 3 2 5UQAT 6 4 0 0 5UQO 0 0 0 0 0UQTR 21 16 11 4 3.4UVic 23 23 23 26 29Waterloo 268 275 320 436 452Western 109 97 113 135 132Windsor 98 107 129 188 195York 0 0 0 0 2TOTAL 3386 3662 3776 4055 4429
TABLE GD.3.2.Total doctoral degrees awarded by institution: 2007 to 2011.
INSTITUTION 2007 2008 2009 2010 2011
Acadia 0Alberta 68 75 72 65 71BCIT 0 0 0Calgary 40 55 44 55 59Cape Breton 0Carleton 21 25 37 45 28Concordia 39 53 45 49 49Conestoga 0 0Dal 14 14 30 12 14ETS 14 22 27 28 29Guelph 7 2 6 6 2Lakehead 0 0 0 0 0Laurentian 0 0 0 1 0Laval 12 19 19 19 19Manitoba 23 24 17 21 27McGill 52 54 57 54 26McMaster 48 46 54 64 52Moncton 0 0 0 0 0MUN 15 8 9 12 10Ottawa 24 34 26 22 24Polytechnique 49 78 88 71 80Queen's 25 36 47 43 30Regina 9 3 13 10 7RMC 2 2 3 3 0Ryerson 0 3 13 18 21Saskatchewan 13 12 18 24 17SFU 3 5 7 6 8Sherbrooke 16 39 32 22 25SMU 0Toronto 95 109 94 101 106UBC 65 57 74 69 82UBCO 0 0 2UNB 15 10 17 11 6UNBC 0 0 0 0UOIT 0 0 0 0 2UQAC 4 6 8 4 8UQAM 0 0 0 0 0UQAR 0 0 0 0 0UQAT 0 0 0 0 0UQO 0 0 0 0 0UQTR 1 6 3 2 0.6UVic 16 16 9 20 14Waterloo 87 98 97 94 116Western 41 32 47 55 55Windsor 15 15 14 19 27York 0 0 0 0 0TOTAL 833 958 1027 1025 1017

48
TABLE GD.3.3.Total master’s degrees awarded to women by institution: 2007 to 2011.
INSTITUTION 2007 2008 2009 2010 2011
Acadia 0Alberta 48 40 41 34 66BCIT 0 0 0Calgary 60 72 43 29 46Cape Breton 0Carleton 10 30 25 36 36Concordia 68 70 77 76 88Conestoga 0 0Dal 15 16 23 21 16ETS 13 21 13 28 29Guelph 13 9 10 11 10Lakehead 6 6 6 1 3Laurentian 1 1 1 1 0Laval 0 9 9 9 9Manitoba 11 14 5 13 11McGill 38 24 42 22 5McMaster 30 41 43 50 48Moncton 1 0 4 1 0MUN 12 13 14 17 11Ottawa 27 38 21 31 23Polytechnique 67 66 72 62 68Queen's 15 20 30 14 20Regina 18 9 7 4 6RMC 3 6 4 10 0Ryerson 37 36 40 47 42Saskatchewan 15 19 13 10 22SFU 3 7 5 6 13Sherbrooke 9 21 22 10 14SMU 0Toronto 95 79 98 104 104UBC 33 51 50 49 83UBCO 1 2 6UNB 5 14 10 10 10UNBC 0 0 0 0UOIT 0 0 3 7 11UQAC 3 2 2 2 4UQAM 0 0 0 0 0UQAR 0 0 1 1 1UQAT 1 1 0 0 0UQO 0 0 0 0 0UQTR 7 5 2 1 0.6UVic 4 4 6 5 9Waterloo 88 73 105 95 108Western 24 18 32 17 34Windsor 28 29 31 26 35York 0 0 0 0 0TOTAL 808 864 911 862 992
TABLE GD.3.4.Total doctoral degrees awarded to women by institution: 2007 to 2011.
INSTITUTION 2007 2008 2009 2010 2011
Acadia 0Alberta 11 15 19 7 16BCIT 0 0 0Calgary 5 10 5 6 9Cape Breton 0Carleton 5 6 5 8 7Concordia 7 13 8 8 7Conestoga 0 0Dal 3 2 16 4 2ETS 2 9 1 4 5Guelph 1 1 1 2 1Lakehead 0 0 0 0 0Laurentian 0 0 0 0 0Laval 4 6 6 6 6Manitoba 2 6 4 2 3McGill 11 7 17 9 3McMaster 5 7 7 16 16Moncton 0 0 0 0 0MUN 4 0 0 1 2Ottawa 3 4 6 2 5Polytechnique 9 17 19 16 20Queen's 5 8 9 10 7Regina 3 0 3 4 3RMC 0 0 1 1 0Ryerson 0 0 1 4 3Saskatchewan 1 5 2 8 0SFU 1 0 1 3 1Sherbrooke 3 9 8 3 5SMU 0Toronto 13 21 20 33 19UBC 7 10 10 7 16UBCO 0 0 0UNB 0 5 3 3 1UNBC 0 0 0 0UOIT 0 0 0 0 0UQAC 1 1 2 0 5UQAM 0 0 0 0 0UQAR 0 0 0 0 0UQAT 0 0 0 0 0UQO 0 0 0 0 0UQTR 0 0 0 1 0UVic 3 3 2 6 1Waterloo 12 22 33 14 17Western 7 5 12 13 17Windsor 4 6 5 5 8York 0 0 0 0 0TOTAL 132 198 226 206 205

49
TABLE GD.3.5.Total master’s degrees awarded by institution and discipline: 2011.
INSTITUTIONBI
OSYS
TEM
S
CHEM
ICAL
CIVI
L
COM
PUTE
R
ELEC
TRIC
AL
ENGI
NEER
ING
PHYS
ICS
ENVI
RONM
ENTA
L
GEOL
OGIC
AL
INDU
STRI
AL O
R M
ANUF
ACTU
RING
MAT
ERIA
LS O
R M
ETAL
LURG
ICAL
MEC
HANI
CAL
MIN
ING
OR
MIN
ERAL
SOFT
WAR
E
OTHE
R
AcadiaAlberta 52 84 15 58 11 10 81 6 17BCITCalgary 3 37 49 30 39 13Cape BretonCarleton 15 18 56 9 3 11 1 34Concordia 79 206 14 64 33 4ConestogaDal 1 1 4 16 2 3 6 3 7 71ETS 34 19 16 20 2 87Guelph 11 10 19Lakehead 14 6LaurentianLaval 7 12 9 1 13 1 1Manitoba 9 9 16 11McGill 8 3 14 2 8McMaster 6 10 10 12 70 10 13 17 11 91Moncton 8MUN 4 13 5 10 5 31Ottawa 6 13 14 24 1 16 54Polytechnique 17 12 16 19 40 18 66 6 31 11 18Queen's 20 10 22 5 2 28 5Regina 7 5 12 2 10RMCRyerson 7 43 61 57 51 28Saskatchewan 11 12 12 14 3 12SFU 34 6Sherbrooke 7 23 23 31 2Toronto 32 60 77 101 16 77 38UBC 22 80 55 1 19 6 10 33 11UBCO 17 11 10UNB 17 10 8 6 10UNBCUOIT 26 21 20UQAC 3 3 5UQAMUQAR 5UQAT 5UQOUQTR 1.9 1.5UVic 1 10 17 1Waterloo 34 51 126 78 163Western 34 28 37 33Windsor 15 67 14 25 6 68York 2TOTAL 133 331 702 140 1136 81 92 11 152 70 783 34 50 715

50
TABLE GD.3.6.Total doctoral degrees awarded by institution and discipline: 2011.
INSTITUTION
BIOS
YSTE
MS
CHEM
ICAL
CIVI
L
COM
PUTE
R
ELEC
TRIC
AL
ENGI
NEER
ING
PHYS
ICS
ENVI
RONM
ENTA
L
GEOL
OGIC
AL
INDU
STRI
AL O
R M
ANUF
ACTU
RING
MAT
ERIA
LS O
R M
ETAL
LURG
ICAL
MEC
HANI
CAL
MIN
ING
OR
MIN
ERAL
SOFT
WAR
E
OTHE
R
AcadiaAlberta 15 11 2 18 7 9 6 1 2BCITCalgary 5 12 6 19 9 8Cape BretonCarleton 8 15 1 4Concordia 14 16 19ConestogaDal 1 4 1 1 1 5 1ETS 29Guelph 1 1LakeheadLaurentianLaval 5 2 5 1 6Manitoba 2 4 16 4 1McGill 5 3 7 4 7McMaster 4 7 3 4 9 8 4 10 3MonctonMUN 3 1 1 2 3Ottawa 3 4 13 3 1Polytechnique 8 13 8 5 12 10 5 3 11 4 1Queen's 6 9 7 1 5 2Regina 1 4 1 1RMCRyerson 4 7 7 3Saskatchewan 3 4 1 7 2SFU 6 2Sherbrooke 2 4 10 9Toronto 11 13 7 42 6 19 8UBC 10 17 19 1 10 20 5UBCO 1 1UNB 1 2 3UNBCUOIT 2UQAC 1 7UQAMUQARUQATUQOUQTR 0.3 0.3UVic 3 4 7Waterloo 20 8 50 20 18Western 12 16 18 9Windsor 4 9 2 4 5 3YorkTOTAL 44 118 143 17 304 33 10 2 15 43 187 13 3 84

51
A.5. FACULTY MEMBERS BY INSTITUTION
F.1. Faculty Composition
TABLE F.1.1.Faculty members by institution: 2011.
INSTITUTION
MAL
E PR
OFES
SORS
FEM
ALE
PROF
ESSO
RS
MAL
E AS
SOCI
ATE
PROF
ESSO
RS
FEM
ALE
ASSO
CIAT
E PR
OFES
SORS
MAL
E AS
SIST
ANT
PROF
ESSO
RS
FEM
ALE
ASSI
STAN
T PR
OFES
SORS
MAL
E IN
STRU
CTOR
S/LE
CTUR
ERS
FEM
ALE
INST
RUCT
ORS/
LECT
URER
S
TOTA
L FU
LL T
IME
EQUI
VALE
NT
Acadia 2 0 0 0 1 1 1 0 5Alberta 83 5 32 2 51 11 0 0 184BCIT 37 5 0 0 0 0 0 0 42Calgary 65 3 40 11 15 6 5 1 146Cape Breton 2 0 0 0 0 0 4 0 6Carleton 46 3 55 4 29 6 4 1 147Concordia 68 6 47 9 19 8 8 1 166Conestoga 8 1 0 0 0 0 1 0 10Dal 43 1 16 8 10 1 10 1 90ETS 59 8 74 13 15 0 61 8 238Guelph 9 3 11 4 6 0 0 1 34Lakehead 13 1 12 1 6 1 0 0 34Laurentian 13 0 5 1 6 0 8 0 33Laval 88 11 31 3 16 3 68 12 232Manitoba 38 2 21 6 9 1 6 2 85McGill 38 0 48 10 29 7 0 1 133McMaster 64 5 52 3 13 4 1 0 142Moncton 9 0 9 1 1 2 3 0 25MUN 19 2 25 3 6 2 2 2 61NSAC 2 0 3 0 4 0 0 2 11Ottawa 44 5 31 11 15 6 5 0 117Polytechnique 107 11 54 8 36 10 47 172 445Queen's 61 13 45 5 13 1 9 1 148Regina 12 2 12 4 5 0 8 1 44RMC 16 0 26 1 17 3 12 1 76Ryerson 54 5 38 5 13 1 19 1 136Saskatchewan 35 1 24 3 12 2 2 2 81SFU 18 2 7 1 9 3 5 1 46Sherbrooke 57 2 21 3 10 2 106 17 218SMU StFX 1 0 1 0 1 0 0 0 4Toronto 104 6 50 13 29 14 16 4 236UBC 72 5 45 6 17 5 30 13 193UBCO 2 1 5 1 18 2 3 3 35UNB 31 4 19 4 3 1 9 0 71UNBC 1 0 5 0 0 0 0 0 6UOIT 14 0 12 0 9 6 6 0 47UPEI 1 0 2 0 1 0 0 1 5UQAC 9 1 8 2 3 1 9 2 34UQAM 2 0 3 0 4 0 0 0 9UQAR 9 0 0 0 1 0 6 1 17UQAT 4 0 6 0 1 0 19 3 33UQO 9 1 2 2 1 0 1 0 16UQTR 17 0 9 1 3 0 0 0 30UVic 20 0 17 5 5 5 1 0 53Waterloo 106 15 54 7 54 11 16 2 264Western 34 2 33 5 11 4 7 0 95Windsor 28 2 24 3 5 3 3 1 69York 6 0 10 2 7 2 3 0 30TOTAL 1580 134 1043 171 538 135 523 257 4380

52
A.6. CO-OP, INTERNSHIP AND PROFESSIONAL EXPERIENCE PROGRAMS
C.1. Industry Experience Options by Institution
TABLE C.1.Co-op, Internships and Professional Experience Programs: 2011.
INSTITUTION TYPE OF PROGRAM MANDATORY/OPTIONAL
Alberta Co-op Optional
Calgary Co-op & Internship Optional
Cape Breton Co-op Optional
Carleton Co-op Optional
Concordia Co-op & Internship Optional
Conestoga Co-op Mandatory
Dal Co-op Optional
ETS Co-op Mandatory
Guelph Co-op Optional
Laurentian Co-op Optional
Laval Co-op Mandatory
Manitoba Co-op & Internship Optional
McGill Co-op & Internship Varies
McMaster Co-op Optional
Moncton Co-op Optional
MUN Co-op Mandatory
Ottawa Co-op Optional
Polytechnique Co-op Mandatory
Queen's Internship Optional
Regina Co-op & Internship Optional
Ryerson Co-op & Internship Optional
Saskatchewan Internship Optional
SFU Co-op Mandatory
Sherbrooke Co-op Mandatory
Toronto Internship Optional
UBC Co-op Optional
UBCO Co-op Optional
UNB Co-op & Internship Optional
UQAM Co-op Mandatory
UQAR Co-op Optional
UQO Co-op Mandatory
UQTR Co-op Optional
UVic Co-op Mandatory
Waterloo Co-op Mandatory
Western Co-op & Internship Optional
Windsor Co-op Optional

53
Appendix BACCREDITED ENGINEERING PROGRAMS BY INSTITUTION
a. This listing of accredited programs includes only engineering programs, which lead to a bachelor’s degree.
b. Institutions listed have voluntarily requested that specific engineering programs be evaluated by the Canadian Engineering (Accreditation Board). The terminology requested by the institution is shown.
c. A single date which follows the name of a program indicates the year of the first graduating class for which accreditation applies. It also applies to subsequent years and is still in force.
d. A double date following the name of a program indicates the period (inclusive of both years) for which the program was accredited. This may occur if the institution has discontinued the program under that specific name or has not requested renewal of accreditation or if the Accreditation Board has denied such renewal.
e. The appearance of a third date indicates that accreditation has been renewed from that particular year on, after a time interval.
ALBERTA, UNIVERSITY OFEdmonton, Alberta
Faculty of EngineeringAgricultural Engineering: 1983-1995Chemical Engineering: 1965-Civil Engineering: 1965-Computer Engineering: 1983-Electrical Engineering: 1965-Engineering Physics: 1988-Materials Engineering: 1999-Mechanical Engineering: 1965-Metallurgical Engineering: 1965-2000Mineral Engineering: 1976-1982Mineral Process Engineering: 1983-1991Mining Engineering: 1965-1975, 1983-Petroleum Engineering: 1978-
BRITISH COLUMBIA INSTITUTE OF TECHNOLOGYBurnaby, British Columbia
School of Construction and the EnvironmentCivil Engineering: 2010-
School of EnergyElectrical Engineering: 2011-
BRITISH COLUMBIA, THE UNIVERSITY OFVancouver, British Columbia
Faculty of Applied ScienceAgricultural Engineering: 1965-1978Bio-Resource Engineering: 1979-2001Chemical Engineering: 1965-Chemical and Biological Engineering: 2003-Civil Engineering: 1965-Computer Engineering: 2000-Electrical Engineering: 1965-Engineering Physics: 1965-Environmental Engineering (jointly with Northern British Columbia): 2007-Geological Engineering: 1965-Integrated Engineering: 2003-Materials Engineering: 2006-Mechanical Engineering: 1965-Metallurgical Engineering: 1965-1987Metals and Materials Engineering: 1988-2005Mineral Engineering: 1965-1979Mining and Mineral Process Engineering: 1980-2005Mining Engineering: 2004-
BRITISH COLUMBIA-OKANAGAN, THE UNIVERSITY OFKelowna, British Columbia
Faculty of Applied ScienceCivil Engineering: 2010-Electrical Engineering: 2010-Mechanical Engineering: 2010-
CALGARY, THE UNIVERSITY OFCalgary, Alberta
Schulich School of EngineeringChemical Engineering: 1969-Civil Engineering: 1969-Computer Engineering: 2002-Electrical Engineering: 1969-Geomatics Engineering: 1996-Manufacturing Engineering: 1997-Mechanical Engineering: 1969-Oil and Gas Engineering: 2001-Software Engineering: 2002-Surveying Engineering: 1982-1997

54
CARLETON UNIVERSITYOttawa, Ontario
Faculty of Engineering and DesignAerospace Engineering: 1992-Biomedical and Electrical Engineering: 2010-Civil Engineering: 1965-Communications Engineering: 2002-Computer Systems Engineering: 1984-Electrical Engineering: 1965-Engineering Physics: 2003-Environmental Engineering: 1996-Mechanical Engineering: 1965-Software Engineering: 2003-
CONCORDIA UNIVERSITYMontréal, Québec (formerly Sir George Williams University, 1959-1974)
Faculty of Engineering and Computer ScienceBuilding Engineering: 1982-Civil Engineering: 1969-Computer Engineering: 1983-Electrical Engineering: 1969-Industrial Engineering: 1995-Mechanical Engineering: 1969-Software Engineering: 2002-
CONESTOGA COLLEGEKitchener, Ontario
School of Engineering and Information TechnologyMechanical Systems Engineering: 2010-
DALHOUSIE UNIVERSITYHalifax, Nova Scotia(formerly Dal Tech, 1997-2000 and Technical University of Nova Scotia, 1981-1997 and Nova Scotia Technical College, 1907-1980)
Faculty of EngineeringAgricultural Engineering: 1974-2000Biological Engineering: 1997-Chemical Engineering: 1965-Civil Engineering: 1965-Computer Engineering: 2006-Electrical Engineering: 1965-Engineering Physics: 1987-1991Environmental Engineering: 2006-Industrial Engineering: 1969-Materials Engineering: 2005-Mechanical Engineering: 1965-Metallurgical Engineering: 1965-1977, 1981-2005Mineral Resources Engineering: 2007-Mining Engineering: 1965-2006
ÉCOLE DE TECHNOLOGIE SUPÉRIEUREMontréal, Québec(affiliated with l’Université du Québec)
Génie de la construction: 1993-Génie des opérations et de la logistique: 2008-Génie des technologies de l’information: 2006-Génie et gestion de la construction: 1990-1996Génie électrique: 1990-Génie logiciel: 2004-Génie mécanique: 1990-Génie de la production automatisée: 1990-
GUELPH, UNIVERSITY OFGuelph, Ontario
School of EngineeringAgricultural Engineering: 1973-1995Biological Engineering: 1973-Engineering Systems and Computing: 1994-Environmental Engineering: 1993-Food Engineering: 1993-2000Water Resources Engineering: 1973-
LAKEHEAD UNIVERSITYThunder Bay, Ontario
Faculty of EngineeringChemical Engineering: 1974-Civil Engineering: 1974-Electrical Engineering: 1974-Mechanical Engineering: 1974-Software Engineering: 2002-
LAURENTIAN UNIVERSITYSudbury, Ontario
School of EngineeringChemical Engineering: 2006-Extractive Metallurgical Engineering: 1987-2006Extractive Metallurgy: 1985-1986Mechanical Engineering: 2011-Mining Engineering: 1987-
LAVAL, UNIVERSITÉQuébec, Québec
Faculté de foresterie, de géographie et de géomatiqueGénie du bois: 2002-Génie géomatique: 2007-
Faculté des sciences de l’agriculture et de l’alimentationGénie agroenvironnemental: 2002-Génie alimentaire: 1997-

55
Faculté des sciences et de génieGénie chimique: 1965-Génie civil: 1965-Génie des eaux : 2009- Génie électrique: 1965-Génie géologique: 1965-Génie informatique: 1993-Génie logiciel: 2006-Génie des matériaux et de la métallurgie: 1990-Génie mécanique: 1965-Génie métallurgique: 1965-1990Génie des mines et de la minéralurgie: 1990-Génie minier: 1965-1990Génie physique: 1965-Génie rural: 1973-2002
MANITOBA, THE UNIVERSITY OFWinnipeg, Manitoba
Faculty of EngineeringAgricultural Engineering: 1971-1998Biosystems Engineering: 1996-Civil Engineering: 1965-Computer Engineering: 1987-Electrical Engineering: 1965-Geological Engineering: 1965-2001Industrial Engineering: 1987-2005Manufacturing Engineering: 2003-Mechanical Engineering: 1965-
MCGILL UNIVERSITYMontréal, Québec
Faculty of Agricultural and Environmental SciencesBioresource Engineering: 2005-
Faculty of EngineeringAgricultural Engineering (Macdonald College): 1971-2006Chemical Engineering: 1965-Civil Engineering: 1965-Computer Engineering: 1993-Electrical Engineering: 1965-Materials Engineering: 2005-Mechanical Engineering: 1965-Metallurgical Engineering: 1965-2007Mining Engineering: 1965-Software Engineering: 2007-
MCMASTER UNIVERSITY*Hamilton, Ontario
Faculty of EngineeringCeramic Engineering: 1974-1998Chemical Engineering: 1965-Chemical Engineering & Bioengineering: 2006-Civil Engineering: 1989-Civil Engineering & Computer Systems: 1992-1995Civil Engineering & Engineering Mechanics: 1965-1988Computer Engineering: 1981-Electrical & Biomedical Engineering: 2006-Electrical Engineering: 1965-Engineering Physics: 1974-Manufacturing Engineering: 1982-2005Materials Engineering: 1990-Mechanical Engineering: 1965-Mechatronics Engineering: 2009 - Metallurgical Engineering: 1965-1997Software Engineering: 2001-
*Graduates of programs at this institution may have completed additional non-technical studies, such as a management or society option, that will be listed on their transcripts. These transcripts contain wording such as “(Discipline) Engineering and Society” or “(Discipline) Engineering and Management”. Only the engineering component of these programs is accredited by the Accreditation Board; thus, even though these options meet the accreditation requirements, only the base engineering programs are listed here.
MEMORIAL UNIVERSITY OF NEWFOUNDLANDSt. John’s, Newfoundland
Faculty of Engineering and Applied ScienceCivil Engineering: 1975-Computer Engineering: 2002-Electrical Engineering: 1975-Mechanical Engineering: 1975-Naval Architectural Engineering: 1986-1996Ocean and Naval Architectural Engineering: 1997-Shipbuilding Engineering: 1982-1985
MONCTON, UNIVERSITÉ DEMoncton, Nouveau-Brunswick
Faculté d’ingénierieGénie civil: 1972-Génie électrique: 1998-Génie industriel: 1975-2009Génie mécanique: 1990-

56
NEW BRUNSWICK, UNIVERSITY OFFredericton, New Brunswick
Faculty of EngineeringChemical Engineering: 1965-Civil Engineering: 1965-Computer Engineering: 2001-Electrical Engineering: 1965-Forest Engineering: 1972-Geological Engineering: 1984-Geomatics Engineering: 1999-Mechanical Engineering: 1965-Software Engineering: 2006-Surveying Engineering: 1972-1999
NORTHERN BRITISH COLUMBIA, UNIVERSITY OFPrince George, British Columbia
College of Science and ManagementEnvironmental Engineering (jointly with British Columbia): 2007-
NOVA SCOTIA TECHNICAL COLLEGE(see Dalhousie University)
NSTC offered accredited engineering programs from 1965 to 1980.NSTC a offert des programmes de génie agréés de 1965 à 1980.
NOVA SCOTIA, TECHNICAL UNIVERSITY OF(see Dalhousie University)
TUNS offered accredited engineering programs from 1981 to 1996. However, students who enrolled prior to April 1, 1997, and graduated after that date can request that their degree be in the name of TUNS.
ONTARIO INSTITUTE OF TECHNOLOGY, UNIVERSITY OF*Oshawa, Ontario
Faculty of Engineering and Applied ScienceAutomotive Engineering : 2009- Electrical Engineering: 2009- Manufacturing Engineering: 2007- Mechanical Engineering: 2008- Software Engineering: 2009 -
Faculty of Energy Systems and Nuclear ScienceNuclear Engineering: 2007-
* Graduates of programs at this institution may have completed additional non-technical studies, such as a management option, that will be listed on their degrees and transcripts. These degrees and transcripts contain wording such as “(Discipline) Engineering and Management”. Only the engineering component of these programs is accredited by the Accreditation Board; thus, even though these options meet the accreditation requirements, only the base engineering programs are listed here.
OTTAWA, UNIVERSITY OFOttawa, Ontario
Faculty of EngineeringBiomedical Mechanical Engineering: 2009-Chemical Engineering: 1965-Civil Engineering: 1971-Computer Engineering: 1990-Electrical Engineering: 1965-Mechanical Engineering: 1971-Software Engineering: 2001-
POLYTECHNIQUE, ÉCOLEMontréal, Québec(affiliated with l’Université de Montréal)
Génie chimique: 1965-Génie civil: 1965-Génie électrique: 1965-Génie géologique: 1965-Génie industriel: 1973-Génie informatique: 1989-Génie logiciel: 2005-Génie des matériaux: 1990-Génie mécanique: 1965-Génie métallurgique: 1965-1989Génie des mines: 1991-Génie minier: 1965-1991Génie physique: 1965-
QUÉBEC EN ABITIBI-TÉMISCAMINGUE, UNIVERSITÉ DURouyn-Noranda, Québec
Unité d’enseignement et de recherche en sciences appliquéesGénie électromécanique: 2000-Génie mécanique: 2010-
QUÉBEC À CHICOUTIMI, UNIVERSITÉ DUChicoutimi, Québec
Département des sciences appliquéeGénie électrique: 2004-Génie géologique: 1983-Génie informatique: 1992-Génie mécanique: 2004-Génie unifié: 1981- 2009Ingénierie de l’aluminium : 2008-
QUÉBEC À MONTRÉAL, UNIVERSITÉ DUMontréal, Québec
Faculté des sciencesGénie microélectronique: 2007-

57
QUÉBEC EN OUTAOUAIS, UNIVERSITÉ DUGatineau, Québec(formerly Québec à Hull, Université du)
Module de l’ingénierieGénie informatique: 2002-
QUÉBEC À RIMOUSKI, UNIVERSITÉ DURimouski, Québec
Module de génieGénie des systèmes électromécaniques: 1998-Génie électrique : 2009- Génie mécanique : 2009-
QUÉBEC À TROIS-RIVIÈRES, UNIVERSITÉ DUTrois-Rivières, Québec
École d’ingénierieGénie chimique: 1990-Génie électrique: 1978-Génie industriel: 1980-Génie mécanique manufacturier: 1987-1999Génie mécanique: 2000-
QUEEN’S UNIVERSITYKingston, Ontario
Faculty of Applied ScienceChemical Engineering: 1965-Civil Engineering: 1965-Computer Engineering: 2002-Electrical Engineering: 1965-Engineering Chemistry: 1979-Engineering Physics: 1965-Geological Engineering: 1975-Materials and Metallurgical Engineering: 1992-2002Mathematics and Engineering: 1974-Mechanical Engineering: 1965-Metallurgical Engineering: 1965-1991Mining Engineering: 1965-
REGINA, UNIVERSITY OFRegina, Saskatchewan
Faculty of Engineering and Applied ScienceElectronic Information Systems Engineering: 1986-1994Electronic Systems Engineering: 1995-Environmental Systems Engineering: 1997-Industrial Systems Engineering: 1984-Petroleum Systems Engineering: 2003-Regional Environmental Systems Engineering: 1990-1997Regional Systems Engineering: 1984-1989Software Systems Engineering: 2007-Systems Engineering: 1981-1983
ROYAL MILITARY COLLEGE OF CANADAKingston, Ontario
Faculty of EngineeringAeronautical Engineering: 2009- Chemical Engineering: 1965-1981, 2001-Chemical and Materials Engineering: 1992-2001Civil Engineering: 1965-Computer Engineering: 1983-Electrical Engineering: 1965-Engineering and Management: 1972-1995Engineering Physics: 1975-1995Fuels and Materials Engineering: 1982-1991Mechanical Engineering: 1965-
RYERSON POLYTECHNICAL INSTITUTE(see Ryerson University)
RPI offered accredited engineering programs in 1992.
RYERSON POLYTECHNIC UNIVERSITY (RPU)(see Ryerson University)
RPU offered accredited engineering programs from 1992 to 2002.
RYERSON UNIVERSITYToronto, Ontario(formerly Ryerson Polytechnical Institute, 1964-1992, and Ryerson Polytechnic University, 1992-2002)
Faculty of Engineering, Architecture and Science Aerospace Engineering: 1992-Chemical Engineering: 1992-Civil Engineering: 1992-Computer Engineering: 2006-Electrical Engineering: 1992-Industrial Engineering: 1992-Mechanical Engineering: 1992-
SASKATCHEWAN, UNIVERSITY OFSaskatoon, Saskatchewan
College of EngineeringAgricultural Engineering: 1965-1992Agricultural and Bioresource Engineering: 1992-Chemical Engineering: 1965-Civil Engineering: 1965-Computer Engineering: 2009-Electrical Engineering: 1965-Engineering Physics: 1965-Environmental Engineering: 2011-Geological Engineering: 1965-Geological Engineering (Geophysics): 1975-1999Mechanical Engineering: 1965-Mining Engineering: 1974-1976

58
SHERBROOKE, UNIVERSITÉ DESherbrooke, Québec
Faculté de génieGénie biotechnologique: 2008-Génie chimique: 1973-Génie civil: 1965-Génie électrique: 1965-Génie informatique: 1997-Génie mécanique: 1965-
SIMON FRASER UNIVERSITYBurnaby, British Columbia
School of Engineering ScienceEngineering Science: 1986-Mechatronic Systems Engineering: 2011-
SIR GEORGE WILLIAMS UNIVERSITY (SGW)(see Concordia University)
SGW offered accredited engineering programs from 1969 to 1974.
TORONTO, UNIVERSITY OFToronto, Ontario
Faculty of Applied Science and EngineeringChemical Engineering: 1965-Civil Engineering: 1965-Computer Engineering: 1994-Electrical Engineering: 1965-Engineering Science: 1965-Geo-Engineering: 1983-1990Geological Engineering: 1965-1974Geological Engineering & Applied Earth Science: 1975-1982Geological and Mineral Engineering: 1991-1998Industrial Engineering: 1965-Materials Engineering: 1996-Mechanical Engineering: 1965-Metallurgical Engineering & Materials Science: 1986-1995Metallurgy & Materials Science: 1965-1985Mineral Engineering: 1999-
VICTORIA, UNIVERSITY OFVictoria, British Columbia
Faculty of EngineeringComputer Engineering: 1988-Electrical Engineering: 1988-Mechanical Engineering: 1992-Software Engineering: 2007-
WATERLOO, UNIVERSITY OFWaterloo, Ontario
Faculty of EngineeringChemical Engineering: 1965-Civil Engineering: 1965-Computer Engineering: 1989-Electrical Engineering: 1965-Environmental Engineering: 1999-Geological Engineering: 1986-Mechanical Engineering: 1965-Mechatronics Engineering: 2008-Nanotechnology Engineering: 2010-Software Engineering: 2006-Systems Design Engineering: 1974-
WESTERN ONTARIO, THE UNIVERSITY OFLondon, Ontario
Faculty of EngineeringChemical Engineering: 1965-1971. 2007-Chemical and Biochemical Engineering: 1972-2006Civil Engineering: 1965-Computer Engineering: 2001-Electrical Engineering: 1965-Integrated Engineering: 2001-Materials Engineering: 1968-1999Mechanical Engineering: 1965-Software Engineering: 2001-
WINDSOR, UNIVERSITY OFWindsor, Ontario
Faculty of EngineeringChemical Engineering: 1965-1990Civil Engineering: 1965-Electrical Engineering: 1965-Engineering Materials: 1974-1991Environmental Engineering: 1991-Geological Engineering: 1972-1989Industrial Engineering: 1974-Mechanical Engineering: 1965-
YORK UNIVERSITYToronto, Ontario
Faculty of Science and EngineeringComputer Engineering: 2007-Geomatics Engineering: 2007-Space Engineering: 2007-

59
Appendix CCANADIAN DISCIPLINE CATEGORIES AS USED IN THIS REPORT
This section provides a comprehensive listing of program titles, as provided by the universities, which are currently offered at both the undergraduate (accredited) and postgraduate levels in Canada. The “discipline” listing is the broad category within which a number of similar programs are grouped. While this report does not provide detailed data on individual programs, the information can be obtained by contacting Engineers Canada.
DISCIPLINE PROGRAM
Biosystems Agricultural Engineering
Agricultural and Bioresource Engineering
Agricultural and Biosystems Engineering
Bio-Resource Engineering
Biological Engineering
Biomedical Engineering
Biomedical and Mechanical Engineering
Biomedical Mechanical Engineering
Biomedical: Computer Science
Biosystems Engineering
Chemical and Biological Engineering
Food Engineering
Forest Engineering
Génie agroalimentaire
Génie agroenvironnemental
Génie alimentaire
Génie biomédical
Génie biotechnologique
Chemical Chemical and Biochemical Engineering
Chemical and Materials Engineering
Chemical and Petroleum Engineering
Chemical Engineering
Chemical Engineering & Bioengineering
Fuels and Materials Engineering
Génie biotechnologique
Génie chimique
Nanotechnology Engineering
Civil Architectural Engineering
Building Engineering
Civil Engineering
Civil and Environmental Engineering
Génie civil
Génie de la construction
Génie et gestion de la construction
Infrastructure Protection Engineering
International Security Engineering
Ingénierie/réhabilitation des infrastructures urbaines
Urban Planning
Computer Computational Engineering and Science
Computer Engineering
Computer Networks Engineering
Computer Systems Engineering
Electronic Information Systems Engineering
Electronic Systems Engineering
Engineering Systems and Computing
Génie informatique
Software Engineering and Game Design
Electrical Biomedical and Electrical Engineering
Communications Engineering
Controls Engineering
Electrical Engineering
Electrical and Computer Engineering
Electrical & Biomedical Engineering
Energy Systems Engineering
Electro-mechanical Design
Electronics Engineering
Génie des opérations et de la logistique
Génie des technologies de l’information
Génie électrique
Génie électromécanique
Génie énergétique
Génie microélectronique
Information Systems Security Engineering
Quality Systems Engineering
Sustainable Energy Engineering
Systems and Computer Engineering
Telecommunications Technical Management

60
Engineering Physics
Engineering Chemistry
Engineering Mathematics
Engineering Physics
Engineering Science
Génie mathématiques
Génie physique
Mathematics and Engineering
Environmental Clean Energy Engineering
Energy and Environment Systems
Environmental Engineering
Environmental Systems Engineering
Génie des eaux
Maîtrise en Science de la Terre
Sustainable & Renewable Energy
Sciences de la terre et de l’atmosphère
Génie ressources et systèmes
Regional Environmental Systems Engineering
Water Resources Engineering
Geological Génie géologique
Génie des sciences de la Terre
Geological and Mineral Engineering
Geological Engineering
Geological Engineering (Geophysics)
Industrial or Manufacturing
Advanced Design and Manufacturing Institute
Advanced Manufacturing and Process Systems
Électronique industrielle
Génie de la production automatisée
Génie des opérations et de la logistique
Génie industriel
Génie mécanique manufacturier
Génie sécurité et hygiène industrielles
Industrial Engineering
Industrial Systems Engineering
Mechanical Manufacturing Engineering
Manufacturing Engineering
Materials or Metallurgical
Ceramic Engineering
Engineering Materials
Extractive Metallurgical Engineering
Génie des matériaux et de la métallurgie
Génie des matériaux
Génie métallurgique
Ingénierie de l’aluminium
Materials and Metallurgical Engineering
Materials Engineering
Metallurgical Engineering
Metallurgical Engineering and Materials Science
Metals and Materials Engineering
Mining/Materials Engineering
Mechanical Automotive Engineering
Génie mécanique
Mechanical Engineering
Mechanical/Industrial Engineering
Mechanical & Materials Engineering
Mechanical & Manufacturing Engineering
Mechanical & Mechatronic Engineering
Mechanical Systems Engineering
Mechatronics Engineering
Mechatronic Systems Engineering
Radiation Science Engineering
Space Engineering
Mining or Mineral
Génie des mines
Génie des mines et de la minéralurgie
Génie minier
Génie minéral
Génie ressources minérales
Maîtrise en génie minéral
Mineral Engineering
Mineral Process Engineering
Mineral Resources Engineering
Natural Resources Engineering
Mining and Metallurgy Engineering
Mining and Mineral Process Engineering
Mining Engineering

61
Software Génie logiciel
Information Systems Science Engineering
Software Engineering
Software Engineering & Virtual Systems Design
Software Systems Engineering
Other Aeronautical Engineering
Aerospace Engineering
Civil and Geological Engineering
Engineering Systems and Computing
Fire Protection Engineering
Génie aérospatial
Génie du bois
Génie géomatique
Génie nucléaire
Génie papetier
Génie rural
Génie sciences des pâtes et papiers
Génie des technologies de l’information
Génie unifié
Geodesy and Geomatics
Geo-engineering
Geomatics Engineering
Green Process Engineering
Ingénierie unifiée
Integrated Engineering
Management Engineering
Management Sciences
Naval Architectural & Marine Engineering
Naval Architectural Engineering
Nuclear Engineering
Ocean and Naval Architectural Engineering
Oil and Gas Engineering
Ocean Engineering
Petroleum Engineering
Petroleum Systems Engineering
Process Engineering
Pulp & Paper Engineering
Surveying Engineering
Systems Design Engineering
Technologie des systèmes
TIM (Systems)
Technology Management
Year One/Two Common Year
Common First and Second Year
Engineering Entrance
Year One - Common
The Engineering Science (E.Sci.) discipline involves science-intensive studies in engineering physics, engineering bioscience, engineering chemistry and other specializations offered by universities with accredited engineering science programs.
Several universities in Canada have common first-year and, in some cases, second-year programs. Students in these programs do not declare a discipline of study in their first year or, as applicable, second year. The total number of students in common first, second and qualifying year programs have been separated from the “Other” category, beginning with the 1997 data. This subdivision will be continued in future years.
62
Appendix DASSOCIATED UNIVERSITIES EXPLAINED
Dalhousie University, Royal Military College of Canada (RMC), and Associated Universities
The bachelor of engineering degree awarded by Dalhousie University is normally conferred in association with one of several associated universities. The program of studies is divided into two parts: the associated universities offer courses covering the first part of the degree and the Faculty of Engineering at Dalhousie offers courses covering the second part of the degree.
For accreditation purposes, the Accreditation Board considers the engineering programs at Dalhousie University to be five-year programs and visits the associated universities as part of the accreditation process. Associated universities, which are included with the accreditation of Dalhousie University programs, are the following:
• Acadia University
• University of Cape Breton
• Dalhousie University
• Mount Allison University (no longer offering engineering programs as of 2000)
• Nova Scotia Agricultural College
• St. Francis Xavier University
• Saint Mary’s University
• University of Prince Edward Island
Prior to 1995, the following two associated universities were included with the accreditation of the engineering programs at RMC. Both institutions have stopped offering engineering.
• Royal Roads Military College (prior to 1995)
• Collège militaire royal de Saint-Jean (prior to 1995)

63
Appendix ESURVEY PROCEDURES AND DATA COMPILATION METHODOLOGY
Survey Procedures
Each year, Engineers Canada sends Canadian university faculties of engineering and applied science a questionnaire requesting statistics on full-time and part-time enrolment in their undergraduate and post-graduate programs. The institutions are also asked to provide data on the number of undergraduate and post-graduate degrees that have been awarded for the same calendar year being surveyed. Other information requested includes a gender breakdown for enrolment, as well as the number of foreign (visa) students.
Engineers Canada aims to produce a summary of the data by the spring, in order to support such activities as recruitment and planning for the upcoming academic year. The full report on engineering enrolment and degrees awarded is published and distributed several months later.
Compilation and Interpretation of Data
The enrolment and degrees awarded data is compiled into the Engineers Canada database. Prior to the publication of this report, summarized tables of the data are returned to the engineering faculties for verification.
The tabulations, which are found in Section A, list the enrolment and degrees awarded for undergraduate engineering programs that have been accredited by the Accreditation Board of Engineers Canada. Master’s and doctoral programs that are offered by the universities with accredited undergraduate engineering programs are also included. Further information is provided on faculty composition as well as cooperative, internship and professional experience programs.
The data tabulations are further subdivided to provide national, provincial, and institutional level information on enrolment as well as degrees awarded by engineering discipline, gender, and visa students.
Each year, data is collected on undergraduate enrolment in engineering programs that will be seeking accreditation. These are newer programs that have not produced any graduates as of the year of reporting. The Accreditation Board undertakes accreditation of these programs in the year in which the first students will graduate.
Data Limitations
Because of the variable nature of the titles applied to university engineering programs, the discipline headings are general in nature. Some of the data reporting may represent the “best fit” of a particular program, as defined in Appendix C of this report.
Data Utilization
Information presented in this report can be used for a variety of purposes:
• Enabling engineering students to make informed academic and career choices;
• Allowing employers and governments to determine the availability of qualified professional engineers in traditional and emerging areas of practice;
• Keeping the engineering profession abreast of: current and future trends in engineering supply; the development and impact of technology; the needs of employers to allow the development of appropriate standards for academic programs and entry into the profession; and the maintenance of high practice standards in the interests of public safety and well-being; and,
• Assisting universities in preparing academic curricula and planning engineering programs that reflect advanced academic standards and emerging fields of study.
Further breakdown of the data can be requested by contacting Engineers Canada at:
Engineers Canada 1100-180 Elgin Street, Ottawa, Ontario K2P 2K3 Tel.: 613.232.2474 Fax: 613.230.5759 email: [email protected]