Embed Size (px)
Citation preview
Defence and Peace Economics, 2005,Vol. 16(3), June, pp. 145–169
ISSN 1024-2694 print/ISSN 1476-8267 online © 2005 Taylor & Francis Group LtdDOI: 10.1080/10242690500123414
CANADIAN DEFENCE POLICY AND SPENDING
J. CRAIG STONEa and BINYAM SOLOMONb*†
aCanadian Forces College, 215 Yonge Boulevard, Toronto ON, M5M 3H9, Canada; bDepartment of National Defence, 8NT, NDHQ, Ottawa, K1A OK2, Canada and Department of
Economics, University of York, Heslington, York YO10 5DD, UK
Taylor and Francis LtdGDPE112324.sgm (Received in final form 21 December 2004)
10.1080/10242690500123414Defence and Peace Economics1024-2694 (print)/1476-8267 (online)Original Article2005Taylor & Francis Ltd1630000002005BinyamSolomonStrategic Finance & Economics (DB 5)8 North Tower, NDHQ, Department of National DefenceOttawaK1A [email protected] survey article deals with defence policy, spending and the industrial base in Canada since the Second WorldWar. In particular, the macroeconomic realities underpinning defence expenditure patterns as well as the uniquemicroeconomic conditions affecting the Canadian defence industrial base are highlighted.
Keywords: Canada; Defence industrial base; Defence expenditures; Peacekeeping; Middle power
INTRODUCTION
Canada is the second largest country in the world and stretches from the Atlantic Ocean in theEast to the Pacific Ocean in the West, and North to the Arctic Ocean. Between these oceanslie a variety of climates and a rich natural resource base. With a population of 31.4 millionpeople and a landmass in excess of 9 million square kilometres, Canada is not a very denselypopulated country. Considered an affluent nation with an advanced industrial economy,Canada faces unique challenges because most of its population lives within 100 miles of theUnited States/Canada border.
As a nation, Canada depends heavily on trade for its economic prosperity and most ofthat trade is with the United States. Exports of goods and services as a percentage of GrossDomestic Product (GDP) were 43% in 2001 (Canada. Department of Foreign Affairs andInternational Trade – DFAIT, 2003). More specific to the significance of trade with theUnited States, 87% of Canada’s merchandise exports in 2001 went south to the UnitedStates and 65% of Canada’s merchandise imports came from the United States (DFAIT,2002). Canada’s trade surplus in 2001 was in excess of $60 billion but its trade surpluswith the United States was in excess of $133 billion. No other advanced industrial societyhas such a high level of trade domination and the end result of this dependency is thatCanada’s long-term economic fortunes are tied to the booms and busts of the United Stateseconomy (Norcliffe, 1996).
*The contents do not necessarily reflect the views of the Department of National Defence.†Corresponding author. E-mail: [email protected]
146 J. C. STONE AND B. SOLOMON
Today, Canada’s ten provinces and three territories make a federation that is distinguishedby a distribution of powers between the federal Parliament and the provincial legislatures.Although the Constitution provides that the mandate of a Parliament can last no longer thanfive years, Canada’s Members of Parliament are chosen in federal elections that usually takeplace every three or four years. In 2004 there were four political parties in Canada: the LiberalParty, the Conservative Party, the New Democratic Party and the Bloc Québécois. Constitu-tional impasse at Meech Lake and later at Charlottetown resulted in the formation of the BlocQuébécois, a Quebec separatist party in 1992.
While the importance of trade with the United States to Canada’s economic well beingcannot be disputed, it is how that relationship influences other aspects of Canadian activity thatoften becomes an issue in Canada’s domestic political environment. There are very few areasthat are not affected by Canada’s relationship with the US, both domestic and international.Living beside the world’s only superpower creates some unique challenges for Canada as wellas some unique opportunities.
This article will deal with one particular aspect of that relationship by examining the issueof national defence, one of the few areas of sole federal jurisdiction in Canada. Although theDepartment of National Defence (DND) maintains extensive relationships with the provincesand territories, only the federal government has constitutional authority for defence and theprotection of Canadian sovereignty (Canada. DND, 2002).
The first section of this paper provides a historical background on the role of defence inCanada followed by a discussion on the macroeconomic environment. The discussion on themacroeconomic environment highlights the international factors, national drivers, and conse-quent federal government priorities that constrain the discretionary spending available tofederal departments, including the Canadian Department of National Defence (DND) and theCanadian Forces (CF). Next, the paper will discuss the existing defence policy, the roles andtasks that are given to the Canadian Forces and the structure of Canada’s defence organizationto meet those tasks. The paper will then provide a description of the Canadian defence budgetexperience and a comparison with NATO allies. Finally, the article will conclude with adiscussion on the procurement process utilized by the Department of National Defence andthe Canadian Forces including the defence industrial base that supports Canada’s defencedepartment.
HISTORICAL CONTEXT AND THE BACKGROUND TO DEFENCE POLICY
Whereas 18th-century Americans fought a revolution to free themselves from British rule,their Canadian contemporaries (even those who had once been French) were essentially loyal-ists. Indeed, in the aftermath of America’s War of Independence, Canada was the obvioussanctuary for those Americans in the Thirteen Colonies who had kept faith with Britain.Following the American Revolution, the Constitutional Act of 1791, was passed by the Parlia-ment in London, UK, for the administration of its North American colonies (Morton, 1997).However, conflicts with the United States in 1812, the impact of the American Civil War andthe unsuccessful but repeated Fenian raids of 1866 were clear reminders that Great Britain,despite her imperial power, could not defend her North American colonies from a determinedAmerican invasion (Morton, 1999). For this, as well as many other reasons, Upper Canada,Lower Canada, New Brunswick and Nova Scotia agreed to the Canadian confederation in1867.
Canada became a dominion of the British Empire in 1867 but London continued to havethe final say on over most of Canada’s foreign and defence policy until the passage of theWestminster Act in 1931. This meant that the British government declared war on behalf of
CANADIAN DEFENCE POLICY AND SPENDING 147
Canada in 1914 and the Empire’s war was Canada’s war. However, the extent of theCanadian contribution and manner in which it supported the war effort was Canada’s prerog-ative (Middlemiss and Sokolsky, 1989). Canada sent 500,000 (6% of the population) troopsto fight in the First World War and lost 60,000, an effort and a price out of proportion to itssize. Some felt it was a misguided sentimentality towards the Empire while others claim thatit was a strategic decision to protect Canada’s security (Morton, 1999; Middlemiss andSokolsky, 1989).1
While the significant loss of life and the political cost of draft and conscription led thegovernment quickly to reduce the armed forces and assume an isolationist defence postureimmediately following the First World War, the Second World War brought a new dimensionto Canada’s defence policy. Specifically, the growing anxiety that an attack on North Americamay be feasible brought Canada to the American orbit of influence. The unique bilateraldefence cooperation that exists today between the two nations began in 1940 when PresidentRoosevelt and Prime Minister King agreed to establish the Permanent Joint Board on Defence(PJBD) for the coordination of weapons production.
Although an attack on Canadian soil never materialized, it was thought necessary to main-tain considerable forces for home defence, particularly after Japan entered the conflict inDecember 1941. Once again Canada made a significant contribution to the war effort, andsince it was not attacked, the industrial development to support the war effort boosted itseconomic and political might. Canada actively pursued internationalist policies after theSecond World War, especially promoting Canadian security within multilateral arrangementsthat promoted world peace. In 1949, Canada was one of the founding members of the NorthAtlantic Treaty Organization (NATO) and committed nearly all its navy to the Supreme AlliedCommander, Atlantic (SACLANT).
During the early years of the Cold War, the air forces of both the US and Canada expandedtheir cooperative air defence arrangement, culminating in the establishment of the NorthAmerican Air Defence Command (NORAD) in 1958. Today, in the post 9/11 security envi-ronment, the two nations are working together in planning for continental defence. Thedefence relationship between the two nations continues to be positive and supportive of eachother.
THE MACROECONOMY
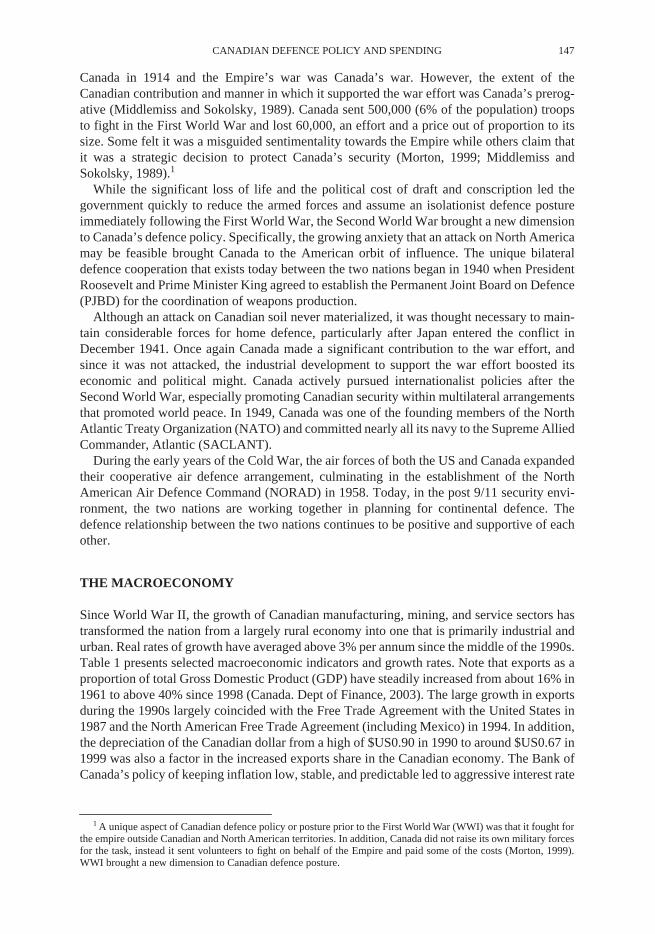
Since World War II, the growth of Canadian manufacturing, mining, and service sectors hastransformed the nation from a largely rural economy into one that is primarily industrial andurban. Real rates of growth have averaged above 3% per annum since the middle of the 1990s.Table 1 presents selected macroeconomic indicators and growth rates. Note that exports as aproportion of total Gross Domestic Product (GDP) have steadily increased from about 16% in1961 to above 40% since 1998 (Canada. Dept of Finance, 2003). The large growth in exportsduring the 1990s largely coincided with the Free Trade Agreement with the United States in1987 and the North American Free Trade Agreement (including Mexico) in 1994. In addition,the depreciation of the Canadian dollar from a high of $US0.90 in 1990 to around $US0.67 in1999 was also a factor in the increased exports share in the Canadian economy. The Bank ofCanada’s policy of keeping inflation low, stable, and predictable led to aggressive interest rate
1 A unique aspect of Canadian defence policy or posture prior to the First World War (WWI) was that it fought forthe empire outside Canadian and North American territories. In addition, Canada did not raise its own military forcesfor the task, instead it sent volunteers to fight on behalf of the Empire and paid some of the costs (Morton, 1999).WWI brought a new dimension to Canadian defence posture.
148 J. C. STONE AND B. SOLOMON
increases in the early 1990s to combat price pressures. Inflation rates since the middle of the1990s have remained within the Bank of Canada’s target range of 1–3% (Table I). In conjunc-tion with the interest rate increases of the early 1990s, the unemployment rate remained fairlyhigh during the early 1990s as structural reforms and tight monetary and fiscal policiesconstrained economic growth.
Although the data in Table I reflect a generally positive economic environment during thelatter part of the 1990s and the early 2000s, these positive trends at the end of the 20th centuryare the result of the significant reductions in government spending that were implemented byall levels of government in the early to mid 1990s. These reductions, combined with other costreduction measures, were designed to reduce what had become a significant annual deficit andthe need to achieve a balanced budget. In the case of the federal government, the most signif-icant period was immediately following the election of Prime Minister Chretien’s Liberalgovernment in 1993.
Like many western nations, Canadian governments had been running deficits for a numberof years and the country’s total debt load was becoming untenable. For example, in 1990 theinterest charges on public debt for all levels of government was $64.3 billion or 20% of totalexpenditures, while interest charges on debt for the federal government was $41.9 billion or27.6% of federal government expenditures (Canada. Department of Finance, 2003).
Despite the improved outlook in the late 1990s, when compared with the United States, theaverage Canadian living within 300 km of the United States is acutely aware of the slippagein the relative standard of living against their American counterpart. Despite the growing
TABLE I Selected Macroeconomic Indicators (Constant 1997 Dollars)
GDP ($M) GDP/PoP PoP G/GDP IN/GDP X/GDP(X-M)/GDP UR Inflation
1961 245,230 13,456 18,224,500 22.5% 13.8% 15.9% 0.2% 6.9% 1.1%1965 312,930 15,939 19,633,500 21.0% 15.1% 16.9% 0.5% 3.9% 2.0%1970 389,809 18,312 21,287,500 24.2% 14.5% 22.5% 3.3% 5.7% 3.4%1975 483,316 20,920 23,102,980 24.6% 16.6% 19.9% −3.2% 6.9% 10.9%1980 579,907 23,698 24,471,129 23.3% 17.3% 21.8% 0.1% 7.5% 10.1%1985 664,059 25,725 25,813,854 22.6% 15.6% 25.1% 2.3% 10.7% 4.0%1990 765,311 27,690 27,638,583 22.5% 17.4% 26.9% −0.5% 8.1% 4.8%1995 833,456 28,482 29,262,649 21.1% 14.8% 36.6% 3.5% 9.4% 2.2%1996 846,952 28,642 29,570,577 20.5% 15.5% 38.0% 3.8% 9.6% 1.6%1997 882,733 29,554 29,868,726 19.5% 17.5% 39.5% 2.0% 9.1% 1.6%1998 918,910 30,503 30,125,715 19.3% 17.3% 41.4% 3.5% 8.3% 0.9%1999 969,750 31,932 30,369,575 18.7% 17.4% 43.4% 4.7% 7.6% 1.7%2000 1,020,488 33,294 30,650,631 18.3% 17.4% 44.9% 5.2% 6.8% 2.7%2001 1,038,845 33,540 30,973,522 18.6% 17.6% 42.9% 5.8% 7.2% 2.6%2002 1,074,621 34,322 31,310,175 18.5% 17.3% 41.9% 5.5% 7.7% 2.2%2003 1,096,359 34,705 31,590,917 18.8% 17.7% 40.1% 3.1% 7.6% 2.8%
Annual Average Growth 1961–1969 1970–1979 1980–1989 1990–1999 1999 2000 2001 2002 2003
GDP 5.6% 4.6% 3.4% 2.7% 5.5% 5.2% 1.8% 3.4% 2.0%Inflation 2.9% 8.2% 7.2% 2.4% 1.7% 2.7% 2.6% 2.2% 2.8%GDP/PoP 3.7% 3.0% 2.0% 1.5% 4.7% 4.3% 0.7% 2.3% 1.1%
Source: Statistics Canada: GDP (Gross Domestic Product); G (Government Expenditures); In (Business Sector investment); PoP (pop-ulation); X (Exports); X-M (net exports); Inflation is consumer inflation; UR (Unemployment Rate).
CANADIAN DEFENCE POLICY AND SPENDING 149
economic linkages, Canada’s productivity and real income performance lagged far behindthe US in the 1990s and the Canada–US productivity and real income level gaps widenedsignificantly.
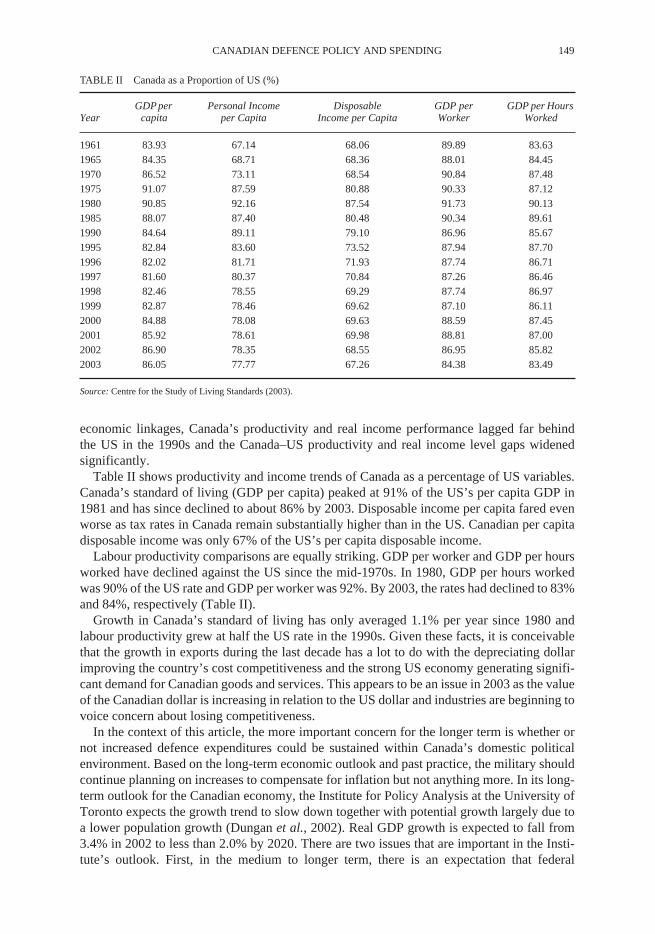
Table II shows productivity and income trends of Canada as a percentage of US variables.Canada’s standard of living (GDP per capita) peaked at 91% of the US’s per capita GDP in1981 and has since declined to about 86% by 2003. Disposable income per capita fared evenworse as tax rates in Canada remain substantially higher than in the US. Canadian per capitadisposable income was only 67% of the US’s per capita disposable income.
Labour productivity comparisons are equally striking. GDP per worker and GDP per hoursworked have declined against the US since the mid-1970s. In 1980, GDP per hours workedwas 90% of the US rate and GDP per worker was 92%. By 2003, the rates had declined to 83%and 84%, respectively (Table II).
Growth in Canada’s standard of living has only averaged 1.1% per year since 1980 andlabour productivity grew at half the US rate in the 1990s. Given these facts, it is conceivablethat the growth in exports during the last decade has a lot to do with the depreciating dollarimproving the country’s cost competitiveness and the strong US economy generating signifi-cant demand for Canadian goods and services. This appears to be an issue in 2003 as the valueof the Canadian dollar is increasing in relation to the US dollar and industries are beginning tovoice concern about losing competitiveness.
In the context of this article, the more important concern for the longer term is whether ornot increased defence expenditures could be sustained within Canada’s domestic politicalenvironment. Based on the long-term economic outlook and past practice, the military shouldcontinue planning on increases to compensate for inflation but not anything more. In its long-term outlook for the Canadian economy, the Institute for Policy Analysis at the University ofToronto expects the growth trend to slow down together with potential growth largely due toa lower population growth (Dungan et al., 2002). Real GDP growth is expected to fall from3.4% in 2002 to less than 2.0% by 2020. There are two issues that are important in the Insti-tute’s outlook. First, in the medium to longer term, there is an expectation that federal
TABLE II Canada as a Proportion of US (%)
YearGDP per
capitaPersonal Income
per CapitaDisposable
Income per CapitaGDP per Worker
GDP per Hours Worked
1961 83.93 67.14 68.06 89.89 83.631965 84.35 68.71 68.36 88.01 84.451970 86.52 73.11 68.54 90.84 87.481975 91.07 87.59 80.88 90.33 87.121980 90.85 92.16 87.54 91.73 90.131985 88.07 87.40 80.48 90.34 89.611990 84.64 89.11 79.10 86.96 85.671995 82.84 83.60 73.52 87.94 87.701996 82.02 81.71 71.93 87.74 86.711997 81.60 80.37 70.84 87.26 86.461998 82.46 78.55 69.29 87.74 86.971999 82.87 78.46 69.62 87.10 86.112000 84.88 78.08 69.63 88.59 87.452001 85.92 78.61 69.98 88.81 87.002002 86.90 78.35 68.55 86.95 85.822003 86.05 77.77 67.26 84.38 83.49
Source: Centre for the Study of Living Standards (2003).
150 J. C. STONE AND B. SOLOMON
government transfers to lower levels of government will increase to relieve the continuedfunding pressures at lower levels for issues such as rising health care costs, education andinfrastructure replacement. Based on past experience, increases in these types of expenditureswill happen before an increase in the defence budget.
Second, relative to the lower levels of government, the federal government will be in goodfiscal health in the longer-term. The budget balance is expected to remain positive over theentire period. This, combined with the decreases in tax revenues, as a result of announced taxpolicy changes, and the expected spending pressures at the lower levels, will provide surplusesthat are quite modest. For example, the Institute expects the federal debt-to-GDP ratio tocontinue falling and the level of surplus to level out at about $5 billion a year (Dungan et al.,2002). This is substantially less than the $18 billion attained in 2000.
This is not say that the defence budget cannot be increased. Clearly, the flexibility is therefor the government to increase the budget should it choose to do so. However, based on pastpractice and the expected pressures at lower levels, it is highly unlikely that any governmentwill make a significant increase in defence expenditure levels above and beyond inflation.Contextually, this is an important issue because during the reduced spending climate of theearly 1990s, defence funding had been reduced by 30% in real terms falling from $12 billionin 1993/94 to $9 38 billion in 1998/99 and the military strength had been reduced by 20%, fall-ing to under 60,000 from over 80,000 (DND, 2002). In contrast, the number of peace supportoperations to which the Government has committed the Canadian Forces has not reflected aproportional reduction. Since the end of the Cold War in 1989, the Canadian Forces have beentasked to provide forces of varying sizes on over 70 occasions (DND, 2002). In 2002, theCanadian Forces had nearly 10,000 personnel deployed on 14 different operations of varyingsize in North America, Europe, the Middle East, the Arabian Gulf and South Asia and Africa(DND, 2003).
Anyone familiar with the history of defence funding in Canada would not be surprised atthese circumstances. Canadian governments have historically been unprepared to spendsignificant amounts of money on defence. There are a variety of reasons for this, but the mostsignificant reason is that the Canadian public does not see a need for increased defence expen-ditures, particularly when that expenditure is placed within the context of choosing betweendefence and health care, education or other social programmes. Regardless of the correctnessof this choice, defence funding in Canada is always based on what the government believes itcan afford and not what a government defence policy might imply. As Defence MinisterMacdonald noted in the 1971 defence policy statement ‘[T]here is no obvious level for defenceexpenditures in Canada a judgement must be made on proposed defence activities in relationto other Government programs’ (DND, 1997, 171).
In many ways, it is this lack of any direct security strategy which demands a specific levelof defence funding, that has historically been the biggest challenge for the Canadian militaryFinan and Flemming (1995), in looking at whether Canadians have a good basic knowledgeof defence and security issues, note that the evidence indicates that most Canadian are not verywell informed about defence issues. Finan and Flemming are not alone in this assessment ofCanadians. Middlemiss and Sokolsky (1989) also note ‘By and large, Canadians have not beengreatly interested in defence policy issues …’. More importantly, this lack of interest andunderstanding by the public is also reflected in Parliament and the Government. Doug Bland’ssurvey of Senators and Members of Parliament in 1998–99 revealed that only a few memberstake an active interest in defence issues and only a few are well versed in defence issues(Bland, 1999).
Adding to this lack of knowledge about defence is the belief by most Canadians that thereis no real external threat to Canada. As James Fergusson (1996: 109) notes ‘there is no clearmilitary threat and most Canadians believe that the United States will defend Canada against
CANADIAN DEFENCE POLICY AND SPENDING 151
any foreign adversary’. Canada’s military is dwarfed by the size of the US military and thisonly reinforces the belief of Canadians that any Canadian effort, regardless of effort, would bemerely symbolic.
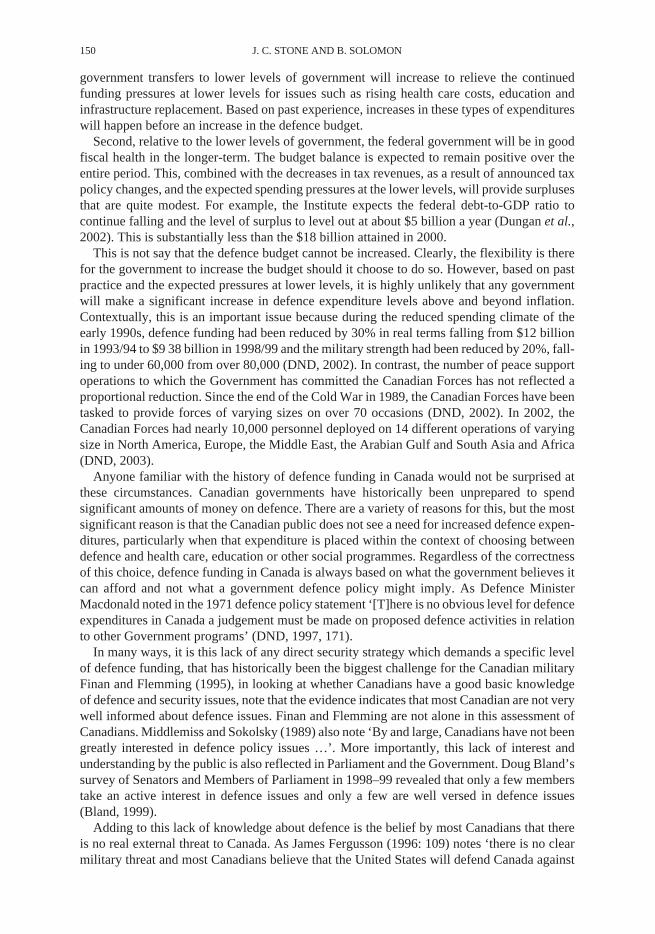
In monetary terms, this lack of interest in defence compared with other areas of policy canbe clearly seen in Figure 1, which shows that by fiscal year 2002–2003 defence was about 8%below its 1993 level, in real terms, while other federal departments are approximately 7%above their respective 1993 levels. It should be pointed out the growth in other Federal depart-ments excludes transfer payments to other levels of government to finance education andhealth spending. As indicated earlier, it was Canada’s level of debt that created the need forexpenditure reductions in the early 1990s and it was in this environment that the newly-electedLiberal Government released the 1994 Defence White Paper, Canada’s current defence policystatement.FIGURE 1 Defence compared with other federal programme 1993–2003.
CANADA’S DEFENCE POLICY
In Canada, governments generally publish defence policy statements to provide an assessmentof where the government believes they are at a particular point in time. They are not intendedto be road maps for the future. However, a historical examination of Canada’s experience withdefence policies will show that our defence policy has been remarkably consistent over timeand, with rare exception, the policy statements are very general in nature. For example, BrookeClaxton’s statement to the House of Commons in 1947 indicated Canada’s defence forces maybe required: to defend Canada against aggression, to assist the civil power in maintaining lawand order within the country, to carry out any undertakings which by our own voluntary actwe may assume in cooperation with friendly nations or under any effective plan of collectiveaction under the United Nations (Claxton, 1997). Not much has changed since that time, norhas it been commonplace for governments in Canada to issue new policy statements on a
115
701993–94
110
105
100
95
90
85
80
75
1996–97 1999–2000 2002–03
Federal Governmentexcluding defence
DND
DND contributed $10.8B of government reductions totaling $38.9Bduring the period 94–95 to 98–99, which represented 28% ofDER PRI and PRII programme reductions.
Index FY 93–94 = 100
FIGURE 1 Defence compared with other federal programmes 1993–2003.
152 J. C. STONE AND B. SOLOMON
regular basis. Since the Canadian Forces were unified under the 1964 White Paper on Defence,there have only been three defence white papers: 1971, 1987 and 1994. Each of these whitepapers was issued after a change in government, as was the 1964 White Paper.
A review of these white papers reveals a number of important aspects regarding the deter-minants of Canada’s defence expenditures. First, Canada defines its national interest andsecurity concerns within the context of bilateral or multilateral arrangements. Canada’scommitment to the security of Europe as shown by the sacrifices and sizeable contributions inboth World Wars is a good indicator of this view. This may be rooted in the nation’s historyas a British colony but it is a realistic approach given the size of the country, its location nextto the United States and its population base.
Second, the seat at the Imperial War Cabinet in the First World War and the relative prom-inence of Canada after the Second World War were positive externalities that arose from itsmilitary contributions during the wars. Whether asserting independence (sovereignty) was theprimary motivation or security is difficult to distinguish, as both are not mutually exclusive.However, from an economic modelling point of view, Canada observed threats indirectlythrough the spending of allies. Therefore, at least from the historical perspective, Canada’sreaction to allied expenditure should be positive.
Third, of the four white papers between 1964 and 1994 (1964, 1971, 1987 and 1994), themost influential determinant of the demand for Canadian defence expenditure was the 1971White Paper. The 1971 White Paper and the initial actions of the Trudeau government were adeparture from Canada’s European strategic parameter. In the first four years of the Trudeaugovernment, real defence expenditures declined by 7.5% and the capital portion of the budgetdeclined to about 8%. Personnel levels declined from approximately 98,500 to 77,900 by1976.
Even though the Trudeau government attempted to reverse its reductions within four yearsof the white paper’s release, budget limitations did not allow for the necessary re-equipping ofthe Canadian Forces. In addition, the successor defence policy of 1987 did not fully executeits stated goals since the end of the Cold War and political and economic issues overshadoweddefence considerations. Similarly, a number of concurrent events, such as the calls for a peacedividend, fiscal crisis and the consequent programme reductions overshadowed the 1994White Paper.
Heading the call for a peace dividend in light of the reduction in commitments in Europe, anew Liberal government, saddled with an inherited $40 billion deficit, attempted to reformulatea new defence policy to reflect the post-Cold War realities. The 1994 White Paper articulatedthree basic missions for the Canadian Forces: Defend Canada; Defend North America inpartnership with the United States; and Contribute to global stability, essentially the same asthose articulated by Brooke Claxton in 1947. In the government’s opinion, these post-Cold Warrealities required ‘A Multi-purpose, Combat-capable Maritime, Land and Air Forces Able toDefend Canada and Canadian Interests While Providing the Government With the Flexibilityto Contribute to International Peace and Security Initiatives’ (DND, 1994).
One of the constraining factors in the development and publication of the 1994 defence policywas that the government had to confront the rising level of public debt, which was 70% of GDPby 1995 (combined public sector debt was close to 100%), and set out to cut governmentspending and increase taxes. By the end of 1997–98, defence absorbed about 28% of the cutsand by 2001–2002 was still 13% below its levels in 1993–94.
One of the more unique aspects of the 1994 policy statement, however, is that unlike previ-ous defence policy statements that provided broad roles for the Canadian Forces, the 1994Defence White Paper does demand that the Canadian Forces provide specific capabilities forspecific circumstances. It was intended to provide the Government’s plan for the CanadianForces after a series of significant budget cuts and provided the government’s assessment of
CANADIAN DEFENCE POLICY AND SPENDING 153
what it wanted the Canadian Forces to be able to provide with a strength of 60,000 and abudget of approximately $9 billion. Naturally, some of the assumptions that were made toaccompany this assessment are important.
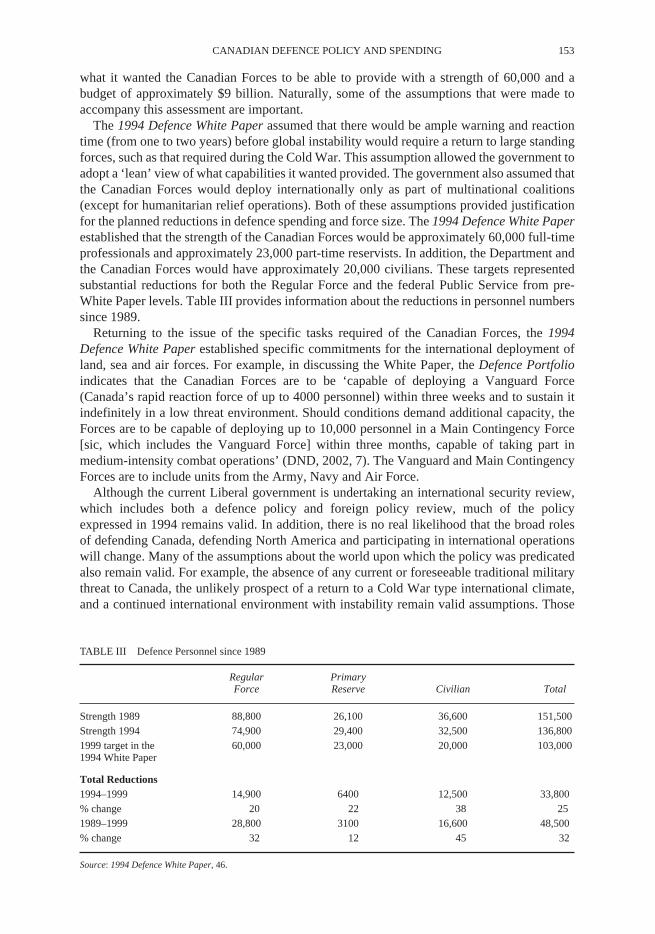
The 1994 Defence White Paper assumed that there would be ample warning and reactiontime (from one to two years) before global instability would require a return to large standingforces, such as that required during the Cold War. This assumption allowed the government toadopt a ‘lean’ view of what capabilities it wanted provided. The government also assumed thatthe Canadian Forces would deploy internationally only as part of multinational coalitions(except for humanitarian relief operations). Both of these assumptions provided justificationfor the planned reductions in defence spending and force size. The 1994 Defence White Paperestablished that the strength of the Canadian Forces would be approximately 60,000 full-timeprofessionals and approximately 23,000 part-time reservists. In addition, the Department andthe Canadian Forces would have approximately 20,000 civilians. These targets representedsubstantial reductions for both the Regular Force and the federal Public Service from pre-White Paper levels. Table III provides information about the reductions in personnel numberssince 1989.
Returning to the issue of the specific tasks required of the Canadian Forces, the 1994Defence White Paper established specific commitments for the international deployment ofland, sea and air forces. For example, in discussing the White Paper, the Defence Portfolioindicates that the Canadian Forces are to be ‘capable of deploying a Vanguard Force(Canada’s rapid reaction force of up to 4000 personnel) within three weeks and to sustain itindefinitely in a low threat environment. Should conditions demand additional capacity, theForces are to be capable of deploying up to 10,000 personnel in a Main Contingency Force[sic, which includes the Vanguard Force] within three months, capable of taking part inmedium-intensity combat operations’ (DND, 2002, 7). The Vanguard and Main ContingencyForces are to include units from the Army, Navy and Air Force.
Although the current Liberal government is undertaking an international security review,which includes both a defence policy and foreign policy review, much of the policyexpressed in 1994 remains valid. In addition, there is no real likelihood that the broad rolesof defending Canada, defending North America and participating in international operationswill change. Many of the assumptions about the world upon which the policy was predicatedalso remain valid. For example, the absence of any current or foreseeable traditional militarythreat to Canada, the unlikely prospect of a return to a Cold War type international climate,and a continued international environment with instability remain valid assumptions. Those
TABLE III Defence Personnel since 1989
Regular Force
Primary Reserve Civilian Total
Strength 1989 88,800 26,100 36,600 151,500Strength 1994 74,900 29,400 32,500 136,8001999 target in the 1994 White Paper
60,000 23,000 20,000 103,000
Total Reductions1994–1999 14,900 6400 12,500 33,800% change 20 22 38 251989–1999 28,800 3100 16,600 48,500% change 32 12 45 32
Source: 1994 Defence White Paper, 46.

154 J. C. STONE AND B. SOLOMON
international and domestic operations that Canada has participated in over the past severalyears have validated the three roles of the Canadian Forces. This includes the requirement tobe able to meet the full spectrum of defence and security challenges – from surveillance andcontrol of Canadian territory and approaches to collective defence and general war (DND,2002).
However, during the late 1990s and the early 2000s, the policies expressed in the 1994Defence White Paper have come under increased criticism for being out of date and no longerrelevant. Contrary to what many of the critics argue, the policy aspects of the document doremain relevant. As indicated, the basics of Canada’s defence policy have not changed sincethe end of World War II – two strategic imperatives and one strategic choice. In today’scontext these imperatives remain valid despite the lack of any stated priorities or defenceobjectives in the 1994 Defence White Paper. The real challenge for the Canadian Forces is nota policy problem but rather a funding problem. As Doug Bland has argued, ‘Canada, however,does have a defence funding problem – a general incompatibility between policy ends and realmeans and a persistent failure of government to fund declared policy’ (Bland, 2003, 1). As onemight expect, the level of defence funding desired by the military has seldom been what thegovernment actually provides.
CANADIAN DEFENCE FUNDING
The evolution of the Canadian defence budget since the 1960s is summarized in Table 4. Forthe purposes of international comparisons, the NATO definition of defence spending (ME1)is used. The NATO definition normally includes the activities of the coast guard (under theDepartment of Fisheries and Oceans) and selected activities of the Transport Canada and theCanadian Customs and Revenue Agency (CCRA). For illustrative purposes, the official Cana-dian government narrower definition (ME2) is also provided. In real terms, the defence budgetdeclined by 26% from its peak in 1990–91 (using the ME2 definition) to 1997–98, and thegovernment’s decision to combat rising federal budgetary deficits explains the steep decline(as shown in Figure 1). Real per capita defence expenditures steadily declined since the 1960sas population growth (71%) outstripped real defence expenditures growth (26%). Similarly,
TABLE IV Defence Expenditures Trend
ME1 $Bill. ME2 $Bill. ME2/GB ME2/GDP ME2/PoP Force Size
1960–61 9.9 9.1 25.5 3.7 499.61 120,8481970–71 8.9 7.9 13.8 2.0 369.68 92,5001980–81 10.7 9.4 8.1 1.6 382.79 79,6921985–86 14.1 12.5 8.9 1.9 485.18 83,0371990–91 15.2 13.8 8.9 1.8 499.55 86,7871995–96 12.8 11.7 7.6 1.4 399.88 66,4611996–97 11.7 10.7 7.5 1.3 361.90 63,4571997–98 10.8 10.2 7.4 1.2 341.07 60,9421998–99 11.8 10.3 7.1 1.1 341.83 60,7261999–00 12.2 11.4 7.7 1.2 374.51 59,3602000–01 11.7 10.9 7.2 1.1 354.71 58,8522001–02 12.4 11.5 7.8 1.1 370.47 59,2512002–03 12.4 11.5 7.9 1.1 367.84 61,432
Source: DND, Statistics Canada, NATO. ME1 (Constant 1997 dollars Military Expenditures NATO Definition); ME2 (Constant 1997dollars Military Expenditure Canadian Government Definition); PoP (Population); GB (Government Budget).
CANADIAN DEFENCE POLICY AND SPENDING 155
real Canadian GDP increased 273% since 1960, bringing the defence to GDP ratio from 3.7%in 1961 to 1.1% in 2003 (see Tables I and IV). The number of military personnel has declinedsteadily since Trudeau’s defence reductions in 1968 and the 1994 defence White paper, whichauthorized approximately 60,000 regular forces as the ceiling.
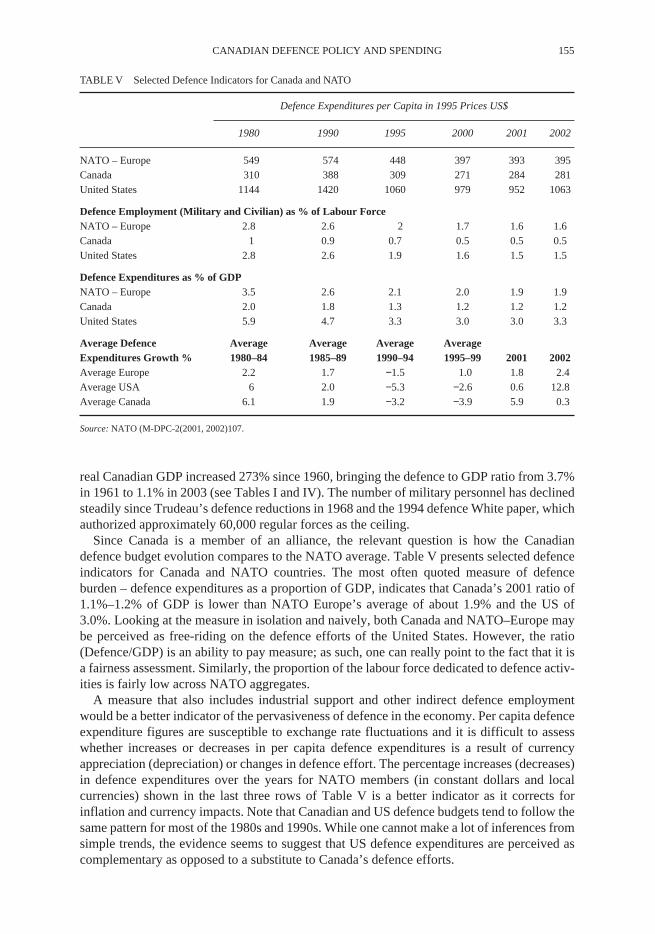
Since Canada is a member of an alliance, the relevant question is how the Canadiandefence budget evolution compares to the NATO average. Table V presents selected defenceindicators for Canada and NATO countries. The most often quoted measure of defenceburden – defence expenditures as a proportion of GDP, indicates that Canada’s 2001 ratio of1.1%–1.2% of GDP is lower than NATO Europe’s average of about 1.9% and the US of3.0%. Looking at the measure in isolation and naively, both Canada and NATO–Europe maybe perceived as free-riding on the defence efforts of the United States. However, the ratio(Defence/GDP) is an ability to pay measure; as such, one can really point to the fact that it isa fairness assessment. Similarly, the proportion of the labour force dedicated to defence activ-ities is fairly low across NATO aggregates.
A measure that also includes industrial support and other indirect defence employmentwould be a better indicator of the pervasiveness of defence in the economy. Per capita defenceexpenditure figures are susceptible to exchange rate fluctuations and it is difficult to assesswhether increases or decreases in per capita defence expenditures is a result of currencyappreciation (depreciation) or changes in defence effort. The percentage increases (decreases)in defence expenditures over the years for NATO members (in constant dollars and localcurrencies) shown in the last three rows of Table V is a better indicator as it corrects forinflation and currency impacts. Note that Canadian and US defence budgets tend to follow thesame pattern for most of the 1980s and 1990s. While one cannot make a lot of inferences fromsimple trends, the evidence seems to suggest that US defence expenditures are perceived ascomplementary as opposed to a substitute to Canada’s defence efforts.
TABLE V Selected Defence Indicators for Canada and NATO
Defence Expenditures per Capita in 1995 Prices US$
1980 1990 1995 2000 2001 2002
NATO – Europe 549 574 448 397 393 395Canada 310 388 309 271 284 281United States 1144 1420 1060 979 952 1063
Defence Employment (Military and Civilian) as % of Labour ForceNATO – Europe 2.8 2.6 2 1.7 1.6 1.6Canada 1 0.9 0.7 0.5 0.5 0.5United States 2.8 2.6 1.9 1.6 1.5 1.5
Defence Expenditures as % of GDPNATO – Europe 3.5 2.6 2.1 2.0 1.9 1.9Canada 2.0 1.8 1.3 1.2 1.2 1.2United States 5.9 4.7 3.3 3.0 3.0 3.3
Average Defence Average Average Average AverageExpenditures Growth % 1980–84 1985–89 1990–94 1995–99 2001 2002Average Europe 2.2 1.7 −1.5 1.0 1.8 2.4Average USA 6 2.0 −5.3 −2.6 0.6 12.8Average Canada 6.1 1.9 −3.2 −3.9 5.9 0.3
Source: NATO (M-DPC-2(2001, 2002)107.

156 J. C. STONE AND B. SOLOMON
ALLOCATING THE DEFENCE BUDGET
How the defence budget is allocated can be viewed as a series of lower level resource allocationproblems. At the Departmental and Canadian Forces level the annual budget allocated by thefederal government to defence is the constraint that DND and CF planners must deal with. Atthe next level down, the budget must be allocated amongst various military capabilities providedby the Canadian Forces. How much for combat capability versus intelligence and informationcapabilities versus sustainment capabilities. These higher level capabilities must then be allo-cated amongst the more specific roles assigned to the Canadian Forces. How much for homelanddefence versus how much for international and coalition operations abroad. The question of howthese capabilities are going to be produced must also be addressed. Will the capability be providedby the Air Force or the Land Force, with military personnel or weapon systems. As John Tred-denick notes ‘Within each capability component, then, decisions have to made on how limitedbudgets are to be used to obtain the mix of manpower, equipment and support services mostappropriate to producing those capabilities’ (Treddenick, 1995, 419). It is these decisions onhow limited budgets are allocated that allow defence policy to become more tangible.
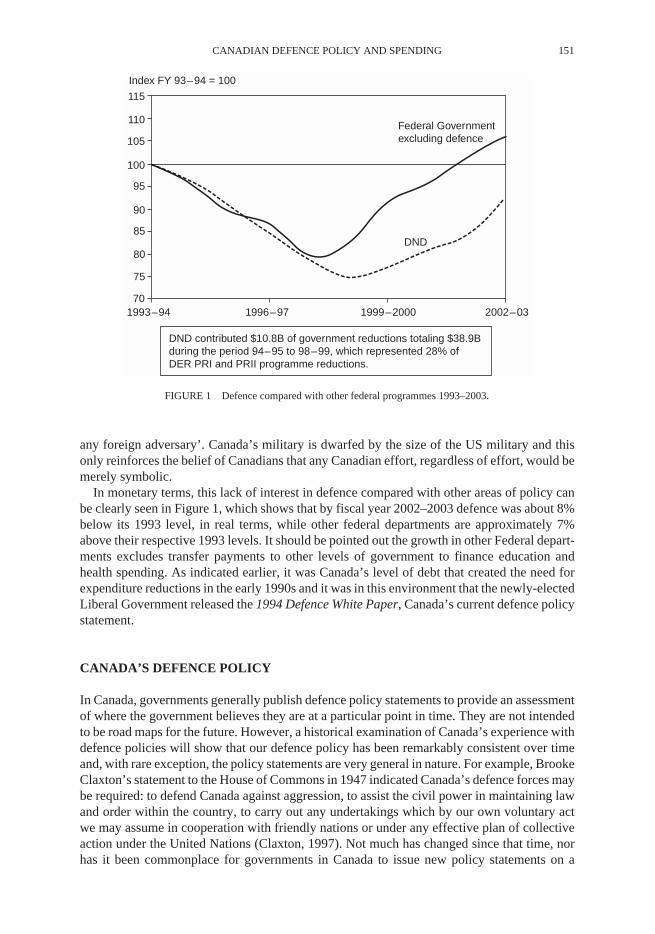
Achieving the correct balance between expenditures on capability today and investment incapability for tomorrow is an important part of the resource allocation problem. Figure 2provides a historical picture of defence budget allocations over the past 40 years. It is clearfrom the information in Figure 2 that DND and the CF have not been consistent in distributingthe budget between the three areas. The amount allocated to capital investment has declinedwhile the amount allocated to O&M has increased and the amount allocated to personnelappears to have stabilized.FIGURE 2 Trend in DND expenditure allocations 1961–2002 (percentage).Achieving the correct balance in the allocation of resources is arguably the most importantchallenge facing the Canadian Forces as it moves into the new millennium. During the pastdecade, operational deployments have increased and there is no indication this will change inthe immediate future. Operations today require capability today.
This must be balanced with the need to make capital investment for capability in thefuture, particularly to purchase the equipment needed to equip and support the force capa-bilities in a future security environment. For example, John Treddenick argues that thefinancial challenges associated with the RMA are basically budgetary choices. RMA tech-nology – information technology, advanced sensors and instantaneous communications – is
01965
100
90
80
70
60
50
40
30
20
10
%
1970 1975 1980 1985 1990 1995 2000
Personnel
O&M
Capital
Fiscal year
FIGURE 2 Trend in DND expenditure allocations 1961–2002 (percentage).
CANADIAN DEFENCE POLICY AND SPENDING 157
technology ‘which demands continuous and significant funding of research and develop-ment expenditures … A decision to opt for the RMA is therefore a decision to embark on amajor recapitalization of the stock of equipment assets … to opt for an increasing share ofdefence expenditures for equipment … for a decreasing share to personnel’ (Treddenick,2001: 101/2).
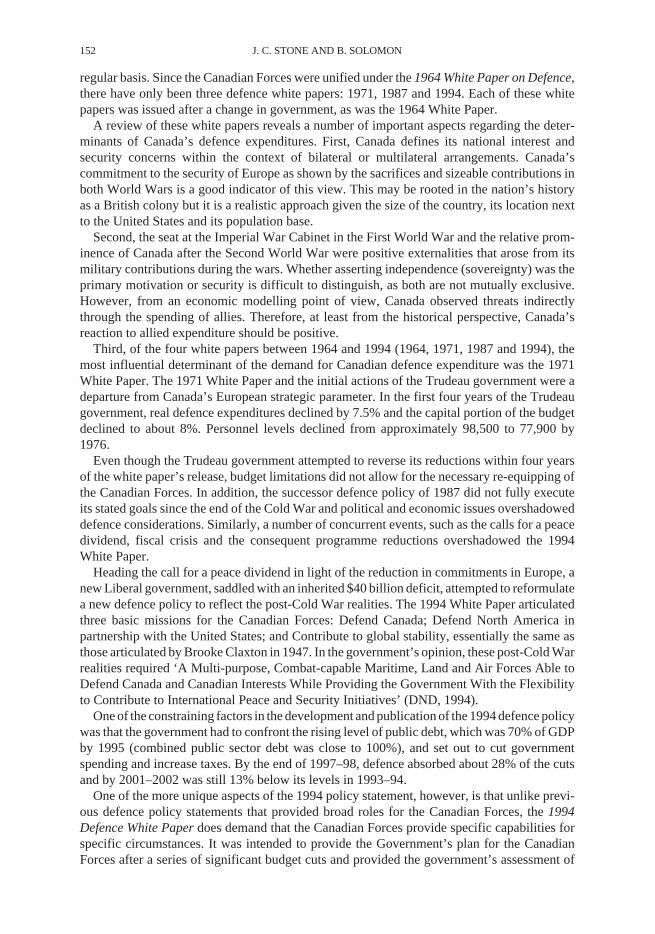
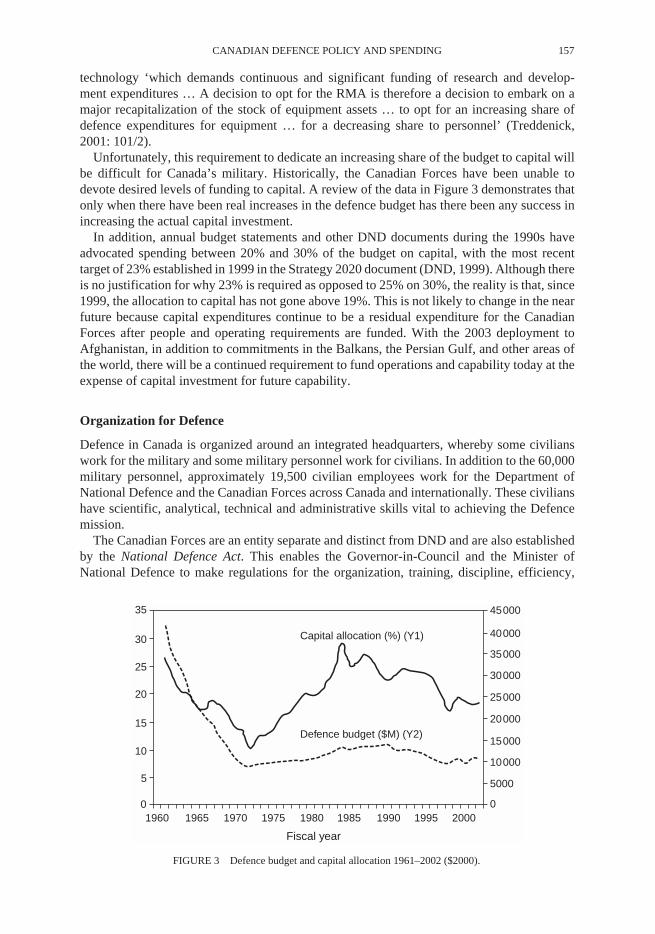
Unfortunately, this requirement to dedicate an increasing share of the budget to capital willbe difficult for Canada’s military. Historically, the Canadian Forces have been unable todevote desired levels of funding to capital. A review of the data in Figure 3 demonstrates thatonly when there have been real increases in the defence budget has there been any success inincreasing the actual capital investment.FIGURE 3 Defence budget and capital allocation 1961–2002 ($2000).In addition, annual budget statements and other DND documents during the 1990s haveadvocated spending between 20% and 30% of the budget on capital, with the most recenttarget of 23% established in 1999 in the Strategy 2020 document (DND, 1999). Although thereis no justification for why 23% is required as opposed to 25% on 30%, the reality is that, since1999, the allocation to capital has not gone above 19%. This is not likely to change in the nearfuture because capital expenditures continue to be a residual expenditure for the CanadianForces after people and operating requirements are funded. With the 2003 deployment toAfghanistan, in addition to commitments in the Balkans, the Persian Gulf, and other areas ofthe world, there will be a continued requirement to fund operations and capability today at theexpense of capital investment for future capability.
Organization for Defence
Defence in Canada is organized around an integrated headquarters, whereby some civilianswork for the military and some military personnel work for civilians. In addition to the 60,000military personnel, approximately 19,500 civilian employees work for the Department ofNational Defence and the Canadian Forces across Canada and internationally. These civilianshave scientific, analytical, technical and administrative skills vital to achieving the Defencemission.
The Canadian Forces are an entity separate and distinct from DND and are also establishedby the National Defence Act. This enables the Governor-in-Council and the Minister ofNational Defence to make regulations for the organization, training, discipline, efficiency,
0
35
30
25
20
15
10
5
2000
Fiscal year
45000
40000
35000
30000
25000
20000
15000
10000
5000
019951990198519801975197019651960
Capital allocation (%) (Y1)
Defence budget ($M) (Y2)
FIGURE 3 Defence budget and capital allocation 1961–2002 ($2000).
158 J. C. STONE AND B. SOLOMON
administration and good governance of the Canadian Forces (DND, 2002). The CanadianForces consist of a Regular Force (who are enrolled for continuing, full-time military service)and a Reserve Force (including the Primary Reserve, Supplementary Reserve, Cadet InstructorCadre, and Canadian Rangers) enrolled for part-time service.
The mission of the Canadian Forces is to ‘defend Canada and Canadian interests and values,while contributing to international peace and security’ (DND, 2003: 2). It is the Chief of theDefence Staff (CDS), the most senior military advisor to the Minister of National Defence andthe Government of Canada as a whole that has primary responsibility for command, control andadministration of the Canadian Forces. All orders and instructions to the Canadian Forces mustbe issued through the CDS. The CDS is assisted in this by eight senior military leaders whoreport to the CDS and are responsible for managing the major branches of the Canadian Forces.
The operational component or the actual organizations of battalions, ships and aircraft arefor the most part, contained within three services – Land, Air and Maritime Forces. ThreeEnvironmental Chiefs of Staff (ECS) who are also the advisors to the CDS for their specificservice command these services.
The Chief of the Maritime Staff (CMS) ‘commands Canada’s naval forces, consisting ofMaritime Forces Atlantic (Halifax), Maritime Forces Pacific (Esquimalt) and the naval reserve(headquartered in Québec City and including 24 units across the country)’ (DND, 2002: 20).The Navy’s strength is divided amongst approximately 9500 Regular Force sailors, 4000Reservists, and 3700 civilian employees. The CMS is operationally responsible for monitoringand controlling activity within Canada’s maritime area of jurisdiction, supporting Canadianinterests abroad and contributing to the national search and rescue capability (DND, 2002).
Similar to CMS, the Chief of the Land Staff (CLS) commands Canada’s Regular and ReserveArmy, which comprises up of four land force areas: West, Central, Québec and Atlantic. Inaddition to a limited number of separate regular forces units, the majority of Canada’s landforces are contained in three Regular Force Brigade Groups, officially named 1 CanadianMechanized Brigade Group, based in Edmonton; 2 Canadian Mechanized Brigade Group, inPetawawa; and 5ième Groupe-brigade mécanisé du Canada, in Valcartier. There are also tenReserve Brigades and more than 100 Reserve units across the country. In total, the Armyconsists of approximately 19,000 Regular Force personnel, more than 14,000 Reserve Forcepersonnel and 4400 civilian employees CLS is operationally responsible for defendingCanadian territory, contributing to the collective defence of North America, and supportingCanadian interests abroad (DND, 2002).
The Chief of the Air Staff (CAS) ‘commands Canada’s air forces, consisting of 1 Cana-dian Air Division (Winnipeg), Canadian NORAD Regional Headquarters (Winnipeg), 13Wings across Canada and 14 Air Force Reserve units. In total, the Air Force consists ofapproximately 13,000 Regular Force personnel, 2,000 Reserve Force personnel and 2,000civilian employees. The CAS is operationally responsible for protecting Canadian sover-eignty and airspace, contributing to Canada’s search and rescue efforts, and supportingCanadian interests abroad’ (DND, 2002: 20).
Resource Challenges
As a large, national institution with a presence in every province and territory, Defence isresponsible for infrastructure valued at approximately $17 billion. Approximately 58% (byvalue) of Defence’s buildings are now more than 40 years old and defence has been unableto devote sufficient funds to adequately maintain this infrastructure for the long term.Consequently, a growing portion is deteriorating beyond its useful economic life and theexpected cost to address this maintenance and re-capitalization backlog exceeds $1 billion(DND, 2002: 37).
CANADIAN DEFENCE POLICY AND SPENDING 159
Maintaining modern infrastructure is one of a number of funding challenges faced by theCanadian Forces. Maintaining an effective, combat-capable military force in a changingworld – particularly in light of the Revolution in Military Affairs – is also a significant chal-lenge with the limited resources available. Many of the Canadian Force’s major weaponsystems are in need of replacement or modernization in order to maintain interoperabilitywith our Allies. Interoperability with Allies really means interoperability with the UnitedStates first and others after DND’s long-term strategic planning document, Shaping theFuture of Canadian Defence: A Strategy for 2020 specifically indicates under the interopera-bility attribute ‘Strengthen our military relationship with the US military to ensure Canadianand US forces are inter-operable and capable of combined operations in key selected areas’(DND, 1999: 6).
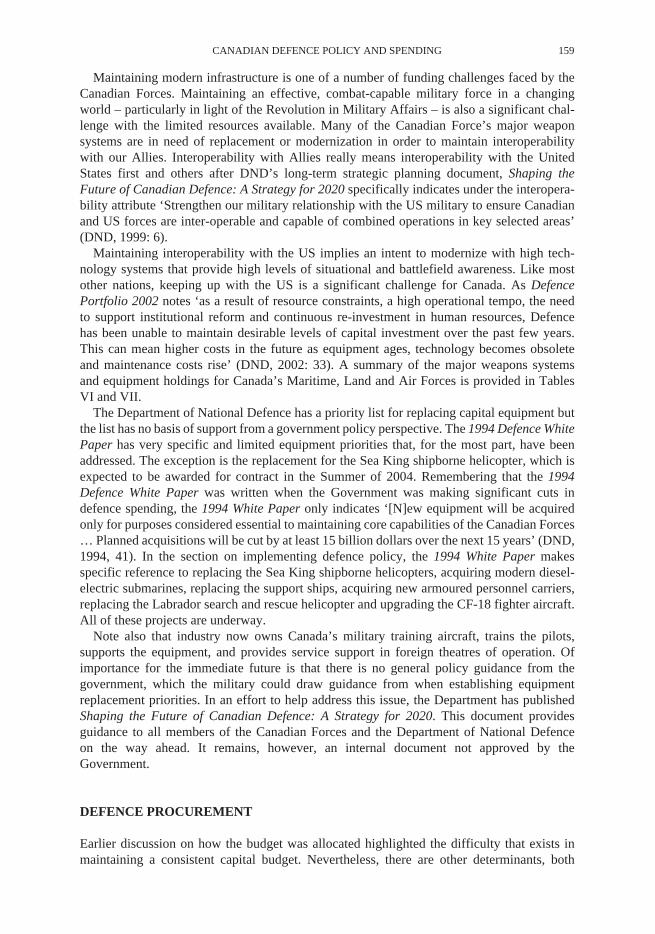
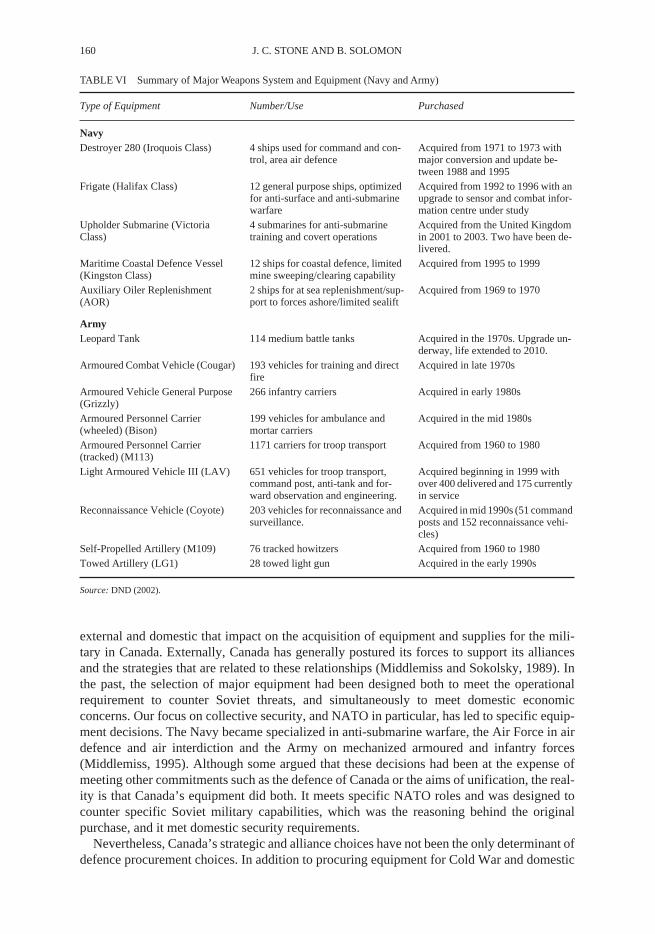
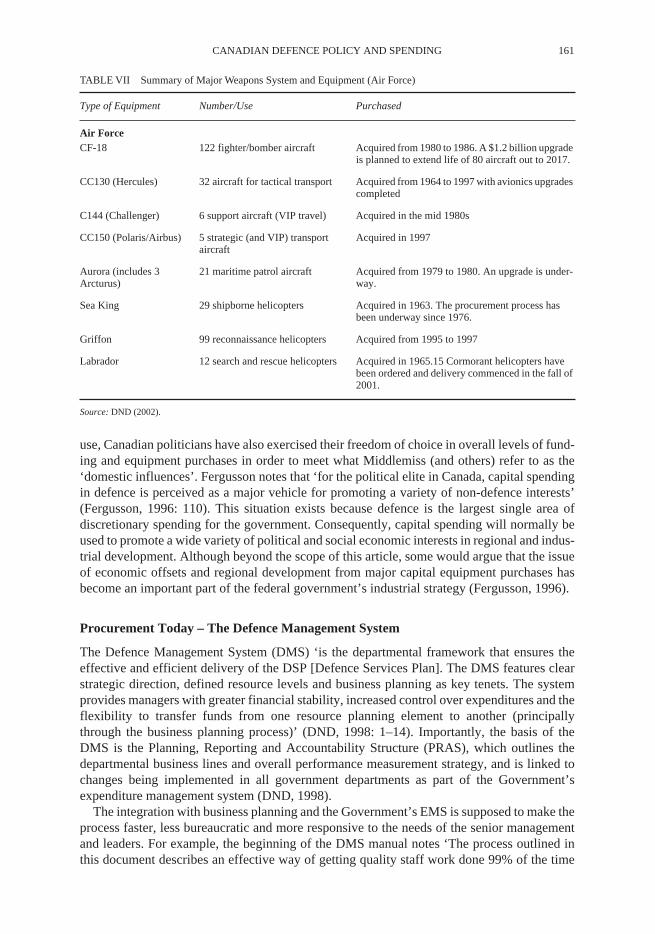
Maintaining interoperability with the US implies an intent to modernize with high tech-nology systems that provide high levels of situational and battlefield awareness. Like mostother nations, keeping up with the US is a significant challenge for Canada. As DefencePortfolio 2002 notes ‘as a result of resource constraints, a high operational tempo, the needto support institutional reform and continuous re-investment in human resources, Defencehas been unable to maintain desirable levels of capital investment over the past few years.This can mean higher costs in the future as equipment ages, technology becomes obsoleteand maintenance costs rise’ (DND, 2002: 33). A summary of the major weapons systemsand equipment holdings for Canada’s Maritime, Land and Air Forces is provided in TablesVI and VII.
The Department of National Defence has a priority list for replacing capital equipment butthe list has no basis of support from a government policy perspective. The 1994 Defence WhitePaper has very specific and limited equipment priorities that, for the most part, have beenaddressed. The exception is the replacement for the Sea King shipborne helicopter, which isexpected to be awarded for contract in the Summer of 2004. Remembering that the 1994Defence White Paper was written when the Government was making significant cuts indefence spending, the 1994 White Paper only indicates ‘[N]ew equipment will be acquiredonly for purposes considered essential to maintaining core capabilities of the Canadian Forces… Planned acquisitions will be cut by at least 15 billion dollars over the next 15 years’ (DND,1994, 41). In the section on implementing defence policy, the 1994 White Paper makesspecific reference to replacing the Sea King shipborne helicopters, acquiring modern diesel-electric submarines, replacing the support ships, acquiring new armoured personnel carriers,replacing the Labrador search and rescue helicopter and upgrading the CF-18 fighter aircraft.All of these projects are underway.
Note also that industry now owns Canada’s military training aircraft, trains the pilots,supports the equipment, and provides service support in foreign theatres of operation. Ofimportance for the immediate future is that there is no general policy guidance from thegovernment, which the military could draw guidance from when establishing equipmentreplacement priorities. In an effort to help address this issue, the Department has publishedShaping the Future of Canadian Defence: A Strategy for 2020. This document providesguidance to all members of the Canadian Forces and the Department of National Defenceon the way ahead. It remains, however, an internal document not approved by theGovernment.
DEFENCE PROCUREMENT
Earlier discussion on how the budget was allocated highlighted the difficulty that exists inmaintaining a consistent capital budget. Nevertheless, there are other determinants, both
160 J. C. STONE AND B. SOLOMON
external and domestic that impact on the acquisition of equipment and supplies for the mili-tary in Canada. Externally, Canada has generally postured its forces to support its alliancesand the strategies that are related to these relationships (Middlemiss and Sokolsky, 1989). Inthe past, the selection of major equipment had been designed both to meet the operationalrequirement to counter Soviet threats, and simultaneously to meet domestic economicconcerns. Our focus on collective security, and NATO in particular, has led to specific equip-ment decisions. The Navy became specialized in anti-submarine warfare, the Air Force in airdefence and air interdiction and the Army on mechanized armoured and infantry forces(Middlemiss, 1995). Although some argued that these decisions had been at the expense ofmeeting other commitments such as the defence of Canada or the aims of unification, the real-ity is that Canada’s equipment did both. It meets specific NATO roles and was designed tocounter specific Soviet military capabilities, which was the reasoning behind the originalpurchase, and it met domestic security requirements.
Nevertheless, Canada’s strategic and alliance choices have not been the only determinant ofdefence procurement choices. In addition to procuring equipment for Cold War and domestic
TABLE VI Summary of Major Weapons System and Equipment (Navy and Army)
Type of Equipment Number/Use Purchased
NavyDestroyer 280 (Iroquois Class) 4 ships used for command and con-
trol, area air defenceAcquired from 1971 to 1973 with major conversion and update be-tween 1988 and 1995
Frigate (Halifax Class) 12 general purpose ships, optimized for anti-surface and anti-submarine warfare
Acquired from 1992 to 1996 with an upgrade to sensor and combat infor-mation centre under study
Upholder Submarine (Victoria Class)
4 submarines for anti-submarine training and covert operations
Acquired from the United Kingdom in 2001 to 2003. Two have been de-livered.
Maritime Coastal Defence Vessel (Kingston Class)
12 ships for coastal defence, limited mine sweeping/clearing capability
Acquired from 1995 to 1999
Auxiliary Oiler Replenishment (AOR)
2 ships for at sea replenishment/sup-port to forces ashore/limited sealift
Acquired from 1969 to 1970
ArmyLeopard Tank 114 medium battle tanks Acquired in the 1970s. Upgrade un-
derway, life extended to 2010.Armoured Combat Vehicle (Cougar) 193 vehicles for training and direct
fireAcquired in late 1970s
Armoured Vehicle General Purpose (Grizzly)
266 infantry carriers Acquired in early 1980s
Armoured Personnel Carrier (wheeled) (Bison)
199 vehicles for ambulance and mortar carriers
Acquired in the mid 1980s
Armoured Personnel Carrier (tracked) (M113)
1171 carriers for troop transport Acquired from 1960 to 1980
Light Armoured Vehicle III (LAV) 651 vehicles for troop transport, command post, anti-tank and for-ward observation and engineering.
Acquired beginning in 1999 with over 400 delivered and 175 currently in service
Reconnaissance Vehicle (Coyote) 203 vehicles for reconnaissance and surveillance.
Acquired in mid 1990s (51 command posts and 152 reconnaissance vehi-cles)
Self-Propelled Artillery (M109) 76 tracked howitzers Acquired from 1960 to 1980Towed Artillery (LG1) 28 towed light gun Acquired in the early 1990s
Source: DND (2002).
CANADIAN DEFENCE POLICY AND SPENDING 161
use, Canadian politicians have also exercised their freedom of choice in overall levels of fund-ing and equipment purchases in order to meet what Middlemiss (and others) refer to as the‘domestic influences’. Fergusson notes that ‘for the political elite in Canada, capital spendingin defence is perceived as a major vehicle for promoting a variety of non-defence interests’(Fergusson, 1996: 110). This situation exists because defence is the largest single area ofdiscretionary spending for the government. Consequently, capital spending will normally beused to promote a wide variety of political and social economic interests in regional and indus-trial development. Although beyond the scope of this article, some would argue that the issueof economic offsets and regional development from major capital equipment purchases hasbecome an important part of the federal government’s industrial strategy (Fergusson, 1996).
Procurement Today – The Defence Management System
The Defence Management System (DMS) ‘is the departmental framework that ensures theeffective and efficient delivery of the DSP [Defence Services Plan]. The DMS features clearstrategic direction, defined resource levels and business planning as key tenets. The systemprovides managers with greater financial stability, increased control over expenditures and theflexibility to transfer funds from one resource planning element to another (principallythrough the business planning process)’ (DND, 1998: 1–14). Importantly, the basis of theDMS is the Planning, Reporting and Accountability Structure (PRAS), which outlines thedepartmental business lines and overall performance measurement strategy, and is linked tochanges being implemented in all government departments as part of the Government’sexpenditure management system (DND, 1998).
The integration with business planning and the Government’s EMS is supposed to make theprocess faster, less bureaucratic and more responsive to the needs of the senior managementand leaders. For example, the beginning of the DMS manual notes ‘The process outlined inthis document describes an effective way of getting quality staff work done 99% of the time
TABLE VII Summary of Major Weapons System and Equipment (Air Force)
Type of Equipment Number/Use Purchased
Air ForceCF-18 122 fighter/bomber aircraft Acquired from 1980 to 1986. A $1.2 billion upgrade
is planned to extend life of 80 aircraft out to 2017.
CC130 (Hercules) 32 aircraft for tactical transport Acquired from 1964 to 1997 with avionics upgrades completed
C144 (Challenger) 6 support aircraft (VIP travel) Acquired in the mid 1980s
CC150 (Polaris/Airbus) 5 strategic (and VIP) transport aircraft
Acquired in 1997
Aurora (includes 3 Arcturus)
21 maritime patrol aircraft Acquired from 1979 to 1980. An upgrade is under-way.
Sea King 29 shipborne helicopters Acquired in 1963. The procurement process has been underway since 1976.
Griffon 99 reconnaissance helicopters Acquired from 1995 to 1997
Labrador 12 search and rescue helicopters Acquired in 1965.15 Cormorant helicopters have been ordered and delivery commenced in the fall of 2001.
Source: DND (2002).
162 J. C. STONE AND B. SOLOMON
… there may be exceptions. The DND/CF must never become a slave to the process’ (DND,1998: 7–2). This appears to be possible, particularly if one considers the Light ArmouredVehicle project as a reasonable example of the new process. The recommendation of goingwith a directed purchase early in the acquisition process supports the notion that there isflexibility in the system both at the departmental and government levels.2
Nevertheless, despite the improvements in the overall process, procurement of major newequipment will likely remain a lengthy activity. It is not likely that the overall political contextfor defence procurement will change regardless of how efficient the actual internal processbecomes. The Maritime Helicopter Replacement Project is a good example of this. The LiberalGovernment cancelled the Conservative Government’s planned purchase of the EH101 heli-copter in 1993. A replacement has not yet been selected despite the passage of 10 years andthere has been considerable political input to the project. For example, the project had beensplit into two parts, one part for the basic air vehicle and a second part for the integratedmission systems. This was done against the advice of the Department of National Defence andwas expected to add an additional $400 million to the cost of the project (Blanchfield, 2001).The amount of this cost was further supported in January 2002 by the Aerospace IndustriesAssociation of Canada, which also argued that splitting the project would add an additional$400 million (McIntosh, 2002). Although this decision was reversed in November 2002, theproject was further complicated by the intention to require a 20 year warranty against majorbreakdowns. This is expected to require the winning competitor to set up engineering andmaintenance facilities on both coasts and will add to the cost of the project (Rubec, 2000).
Although the Maritime Helicopter Project may be more difficult than others because of thepolitical baggage associated with the EH101 cancellation, the process for acquisition stillrequires a lengthy period of time for major projects. The importance of politics and domesticconcerns cannot be underestimated. It will always be part of the process and it will generallyadd additional time to the approval and development process. However, it would be inappro-priate to say that the government will always add time to the process because there are exam-ples when the government circumvents the process and makes it shorter. For example, theMarch 2002 decision to have the Canadian Forces purchase two Challenger jets fromBombardier before the end of the month was done at the Government’s direction and not atthe military’s request. These types of acquisition decisions add little to the rationality of thecapital acquisition process and reduce funding for either higher priority equipment or moremilitarily appropriate equipment.
In addition, the expenditure of taxpayers’ money on major capital equipment will alwaysinvolve the issues of economic offsets, regional development and supporting Canadian indus-tries. Regardless of the economic cost this is the reality of Canadian procurement and the needto sustain a least a minimum level of defence industrial capability.
CANADIAN DEFENCE INDUSTRIAL BASE
The evolution of the Canadian defence industrial base (DIB) over the past half century is anexamination of how a nation goes from having the technical and productive capability ofsupporting and sustaining its military to a nation with a defence industrial base that providessubsystems and components. Alistair Edgar and David Haglund note that the two main trendsin Canada’s DIB since the end of World War II have been a closer cooperation with the United
2 For a more detailed discussion of the Light Armoured Vehicle project see Major J. C. Stone (2001), An Exami-nation of the Armoured Personnel Carrier Replacement Project, Canadian Military Journal 2(2) (Summer) 59–66.
CANADIAN DEFENCE POLICY AND SPENDING 163
States and a move from domestic production of major platforms to the production ofsubsystems and components (Edgar and Haglund, 1995).
The relationship that began with the Ogdensburg Declaration was further enhanced by theHyde Park Agreement in April 1941. The Hyde Park Agreement committed the US andCanada to a coordinated programme for defence requirements, production and procurement.The Hyde Park Declaration was also an important step in the establishment of a North Amer-ican defence market. The relationship has evolved over time to meet the needs of the two coun-tries. For example, trade in defence related products increased in the 1950s to meet thedemands of the Korean War and Canada’s defence industry expanded to meet the demand ofboth nations’ armed forces. After the Korean War, the US demand for defence materialdeclined and both nations returned to a preference for domestic production. Consequently, bythe late 1950s Canada’s DIB had structural problems that demanded attention and resolution.The limited domestic demand combined with the increased cost for advanced technologyweapons platforms created the crisis for Canada that culminated in the cancellation of theArrow fighter aircraft programme.
The cancellation of the Arrow is significant for two reasons. First, it implied that Canadawas getting out of the business of producing major weapons platforms for its armed forces andsecond, it solidified the establishment of the Defence Production Sharing Agreement (DPSA).The DPSA, formally agreed to in 1959, allowed Canadian companies access to US defencecontracts on an equal basis with their US competitors and not as a foreign company. The agree-ment was further enhanced in the 1960s when both nations agreed that there should be ageneral balance in procurement levels on both sides and both nations agreed to the DefenceDevelopment Sharing Arrangement (DDSA). The DDSA added research and development tothe cooperative arrangement of DPSA.
Through the DD/DPSA, Canada could enter US military acquisition in two ways First,contracts issued to Canadian industries by the US Department of Defense (DoD) could befacilitated by the Canadian Commercial Corporation (CCC), which ensures quality control,price and delivery. The CCC also assumed contract liability. Some US firms believe Canadiangovernment involvement imposes an unfair advantage. This issue remains one of the obstaclesin this otherwise stable relationship. Second, commercial sub-contracts could be negotiatedbetween US and Canadian firms. These sub-contracts account for up to 65% of all US–Canadadefence trade.
With DPSA and DDSA in place, the Canadian defence industry has evolved to its presentstate of providing sub-systems and components to the US DOD and US prime contractors, aswell as other world markets. This evolution has had some bumps along the way, primarily dueto the Canadian desire to reduce dependence on US trade, but also from an American desireto address their trade deficit problems.
The Canadian defence industrial base today remains strong in small niche areas of thedefence market. Although concentrated primarily in Ontario and Quebec, there is now a signif-icant presence in Nova Scotia, Alberta and British Columbia. However, it should be pointedout that the domestic procurement by the Canadian Forces is not large enough to sustain a widerange of defence unique firms (Solomon, 2000).
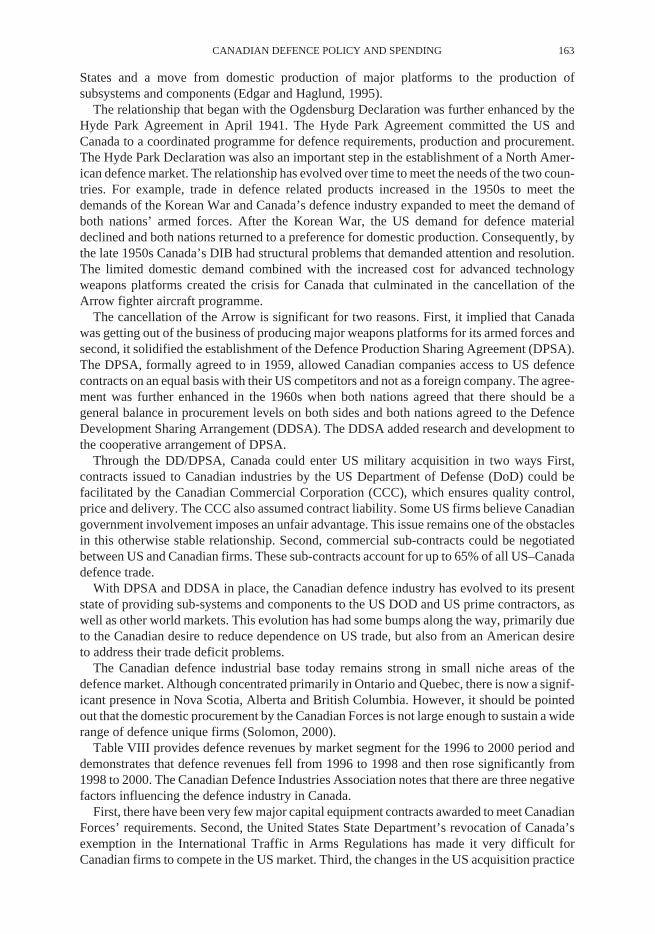
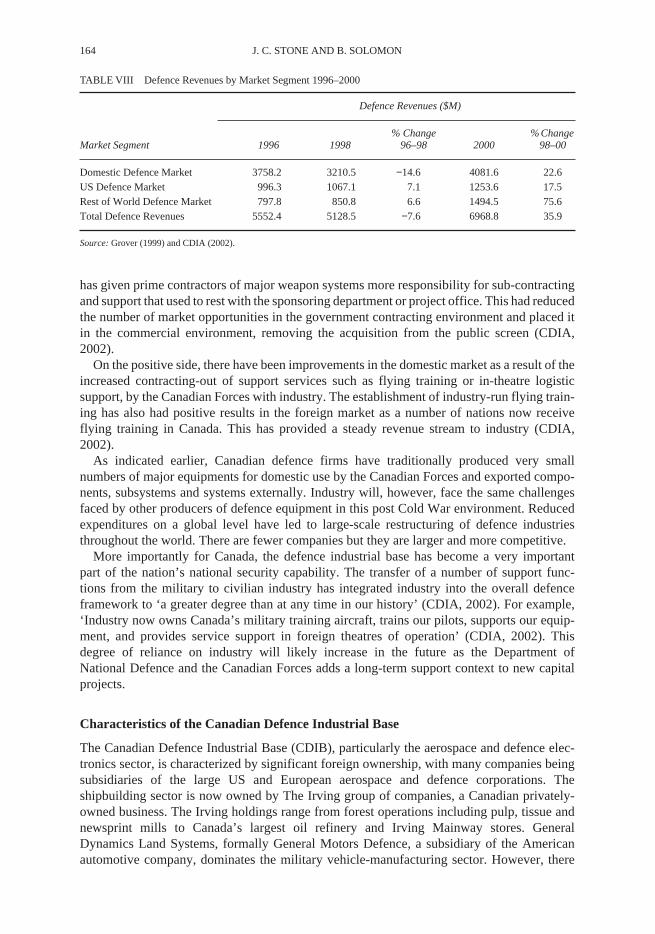
Table VIII provides defence revenues by market segment for the 1996 to 2000 period anddemonstrates that defence revenues fell from 1996 to 1998 and then rose significantly from1998 to 2000. The Canadian Defence Industries Association notes that there are three negativefactors influencing the defence industry in Canada.
First, there have been very few major capital equipment contracts awarded to meet CanadianForces’ requirements. Second, the United States State Department’s revocation of Canada’sexemption in the International Traffic in Arms Regulations has made it very difficult forCanadian firms to compete in the US market. Third, the changes in the US acquisition practice
164 J. C. STONE AND B. SOLOMON
has given prime contractors of major weapon systems more responsibility for sub-contractingand support that used to rest with the sponsoring department or project office. This had reducedthe number of market opportunities in the government contracting environment and placed itin the commercial environment, removing the acquisition from the public screen (CDIA,2002).
On the positive side, there have been improvements in the domestic market as a result of theincreased contracting-out of support services such as flying training or in-theatre logisticsupport, by the Canadian Forces with industry. The establishment of industry-run flying train-ing has also had positive results in the foreign market as a number of nations now receiveflying training in Canada. This has provided a steady revenue stream to industry (CDIA,2002).
As indicated earlier, Canadian defence firms have traditionally produced very smallnumbers of major equipments for domestic use by the Canadian Forces and exported compo-nents, subsystems and systems externally. Industry will, however, face the same challengesfaced by other producers of defence equipment in this post Cold War environment. Reducedexpenditures on a global level have led to large-scale restructuring of defence industriesthroughout the world. There are fewer companies but they are larger and more competitive.
More importantly for Canada, the defence industrial base has become a very importantpart of the nation’s national security capability. The transfer of a number of support func-tions from the military to civilian industry has integrated industry into the overall defenceframework to ‘a greater degree than at any time in our history’ (CDIA, 2002). For example,‘Industry now owns Canada’s military training aircraft, trains our pilots, supports our equip-ment, and provides service support in foreign theatres of operation’ (CDIA, 2002). Thisdegree of reliance on industry will likely increase in the future as the Department ofNational Defence and the Canadian Forces adds a long-term support context to new capitalprojects.
Characteristics of the Canadian Defence Industrial Base
The Canadian Defence Industrial Base (CDIB), particularly the aerospace and defence elec-tronics sector, is characterized by significant foreign ownership, with many companies beingsubsidiaries of the large US and European aerospace and defence corporations. Theshipbuilding sector is now owned by The Irving group of companies, a Canadian privately-owned business. The Irving holdings range from forest operations including pulp, tissue andnewsprint mills to Canada’s largest oil refinery and Irving Mainway stores. GeneralDynamics Land Systems, formally General Motors Defence, a subsidiary of the Americanautomotive company, dominates the military vehicle-manufacturing sector. However, there
TABLE VIII Defence Revenues by Market Segment 1996–2000
Defence Revenues ($M)
Market Segment 1996 1998% Change
96–98 2000% Change
98–00
Domestic Defence Market 3758.2 3210.5 −14.6 4081.6 22.6US Defence Market 996.3 1067.1 7.1 1253.6 17.5Rest of World Defence Market 797.8 850.8 6.6 1494.5 75.6Total Defence Revenues 5552.4 5128.5 −7.6 6968.8 35.9
Source: Grover (1999) and CDIA (2002).

CANADIAN DEFENCE POLICY AND SPENDING 165
are a number of small and medium enterprises that support the automotive and military vehi-cles sector.
The Canadian defence electronics industry includes companies that develop, manufactureand repair radio communications equipment and associated products, acoustic and infraredsensors, and computers for navigation and fire control systems. The sector is also involved insignal processors and display units, special-purpose electronic components, and systems engi-neering and associated software – all for defence related applications. The traditional end-usersof these products have been limited to the military, government agencies and commercialairlines.
The strengths of Canada’s defence industry lie in small, dual-use systems that serve bothcivil and military niche markets. For example, Canada is competitive in markets for flightsimulation, space robotics, satellite communication sub-systems and components, and varioussurveillance and detection products (Grover, 1997). Over half of Canada’s defence electronicsand aerospace industry sales are to civil and export markets. Defence sales are focused onsimulation, surveillance, detection, and communications systems and products. Canadiancompanies do not manufacture large defence and space systems except to meet domesticrequirements, and often serve as sub-contractors for large foreign defence and spaceprogrammes. Thus, inter-and intra-firm investment and trade are important for Canadiancompanies.
International Comparison and R&D Spending
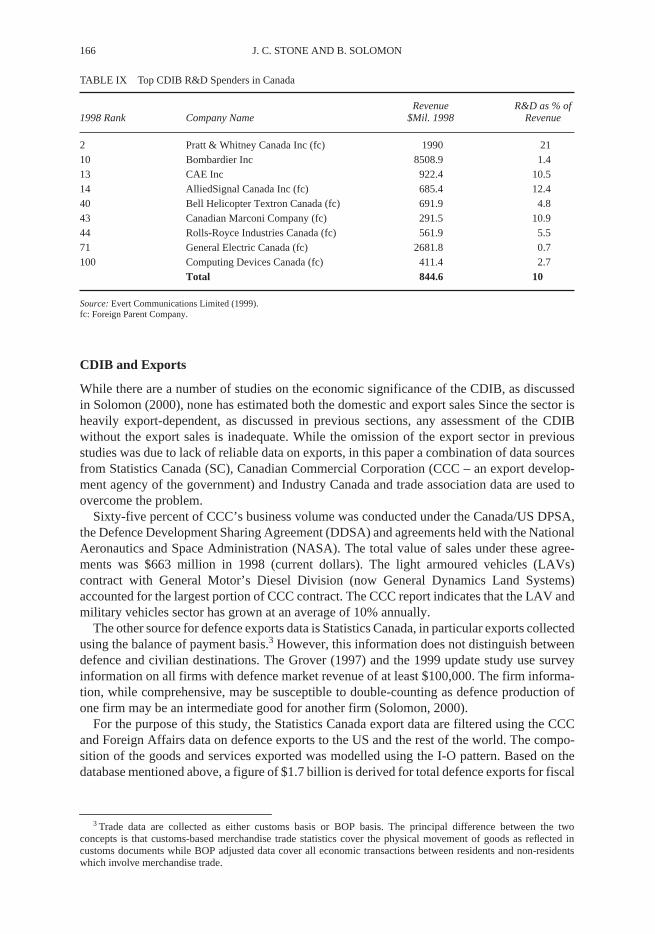
Canadian firms are not among the top defence firms in the world. Since the Stockholm Inter-national Peace Research Institute (SIPRI) began compiling and ranking the top 100 defencefirms in the 1990s, four Canadian companies made the list and none was ranked in the top 50during the period 1990–2000. Bombardier, with regional jets and transportation equipment,such as rail cars etc as its main revenue source, is often listed in the top 100. GM’s Diesel Divi-sion (now General Dynamics Land Systems), which operates from Canada, has increased itsinternational profile by selling its armoured vehicles to NATO allies and the US and wasplaced as high as 57th in the SIPRI ranking (SIPRI, 2001). Aircraft and computer simulatordesigner CAE and communication and computing devices manufacturer CDC are the othermajor Canadian firms on the list. While individual defence firms are not as dominant in theworld market as some of the US and UK firms, total exports of military hardware placesCanada in the top 20 nations. With capital-intensive production and the specialized nature ofits products, the CDIB is an R&D-intensive sector, especially the aerospace industry. Compa-nies such as Pratt & Whitney Canada, CAE Inc, Allied Signal, and Bombardier are always inthe top R&D performers in Canada (Table 9). The aerospace industry’s investment in R&Dtotalled $1.7 billion in 1999. Non-government expenditures on R&D accounted for 1.0% ofGDP in 1998.
Compared with other OECD countries, the level of R&D expenditures puts Canada in themiddle rank. Most industrial R&D in Canada is performed by a small number of firms. Out of6628 companies that reported R&D activities, 25 (0.4%) accounted for more than half theR&D performed. In addition, 51% of all industrial R&D personnel were concentrated in sixmajor industries (about 2000 firms) – telecommunication equipment, aircraft and parts, engi-neering and scientific services, computer and related services, pharmaceutical and medicine,and finance, insurance and real estate (Statistics Canada, 1998).
According to Statistics Canada, 447 out of 6628 firms that carried out R&D in 1995 wereunder foreign control. Foreign firms, which are generally larger than Canadian-owned compa-nies, accounted for $2.5 billion of total intramural R&D expenditures in 1998 (StatisticsCanada, 1998).
166 J. C. STONE AND B. SOLOMON
CDIB and Exports
While there are a number of studies on the economic significance of the CDIB, as discussedin Solomon (2000), none has estimated both the domestic and export sales Since the sector isheavily export-dependent, as discussed in previous sections, any assessment of the CDIBwithout the export sales is inadequate. While the omission of the export sector in previousstudies was due to lack of reliable data on exports, in this paper a combination of data sourcesfrom Statistics Canada (SC), Canadian Commercial Corporation (CCC – an export develop-ment agency of the government) and Industry Canada and trade association data are used toovercome the problem.
Sixty-five percent of CCC’s business volume was conducted under the Canada/US DPSA,the Defence Development Sharing Agreement (DDSA) and agreements held with the NationalAeronautics and Space Administration (NASA). The total value of sales under these agree-ments was $663 million in 1998 (current dollars). The light armoured vehicles (LAVs)contract with General Motor’s Diesel Division (now General Dynamics Land Systems)accounted for the largest portion of CCC contract. The CCC report indicates that the LAV andmilitary vehicles sector has grown at an average of 10% annually.
The other source for defence exports data is Statistics Canada, in particular exports collectedusing the balance of payment basis.3 However, this information does not distinguish betweendefence and civilian destinations. The Grover (1997) and the 1999 update study use surveyinformation on all firms with defence market revenue of at least $100,000. The firm informa-tion, while comprehensive, may be susceptible to double-counting as defence production ofone firm may be an intermediate good for another firm (Solomon, 2000).
For the purpose of this study, the Statistics Canada export data are filtered using the CCCand Foreign Affairs data on defence exports to the US and the rest of the world. The compo-sition of the goods and services exported was modelled using the I-O pattern. Based on thedatabase mentioned above, a figure of $1.7 billion is derived for total defence exports for fiscal
3 Trade data are collected as either customs basis or BOP basis. The principal difference between the twoconcepts is that customs-based merchandise trade statistics cover the physical movement of goods as reflected incustoms documents while BOP adjusted data cover all economic transactions between residents and non-residentswhich involve merchandise trade.
TABLE IX Top CDIB R&D Spenders in Canada
1998 Rank Company NameRevenue
$Mil. 1998R&D as % of
Revenue
2 Pratt & Whitney Canada Inc (fc) 1990 2110 Bombardier Inc 8508.9 1.413 CAE Inc 922.4 10.514 AlliedSignal Canada Inc (fc) 685.4 12.440 Bell Helicopter Textron Canada (fc) 691.9 4.843 Canadian Marconi Company (fc) 291.5 10.944 Rolls-Royce Industries Canada (fc) 561.9 5.571 General Electric Canada (fc) 2681.8 0.7100 Computing Devices Canada (fc) 411.4 2.7
Total 844.6 10
Source: Evert Communications Limited (1999).fc: Foreign Parent Company.

CANADIAN DEFENCE POLICY AND SPENDING 167
1997–98 (constant dollars). This figure is also closely related to both the Industry Canada (IC)and CDIA data on defence exports.
The I-O model is based on the 1997 inter-industry tables and includes the non-businesssector such as the government and non-profit institutions. Past models treated governmentconsumption as leakage. This is an important refinement as some defence services areprovided within the government sector (coast guards, etc).
The total economic production from defence exports amounted to $2.1 billion ($998 millionestimated GDP) and 13,000 person years of employment (Table X). The $1.7 billion defenceexports estimated indirectly from Statistics Canada, CCC and I-O tables was fairly close toboth the IC export figure $2.0 billion and CDIA’s $1.9 billion. In terms of direct jobs relatedto exports, the I-O simulation estimated 7500 jobs while the IC figure was 8700 and the equiv-alent CDIA figure was 9200. The CDIA estimated direct and indirect exports-related jobsamounted to 16,000 using a multiplier of 1.75 (Grover, 1997). Note that the multiplier inGrover’s study was not estimated but taken arbitrarily. The I-O simulation, on the other hand,estimated 12,900 direct and indirect export-related jobs.
While each data source and estimates have their limitations, as discussed earlier, the I-Osimulation provides a reasonable estimate that can be used in the absence of a comprehen-sive and consistent database. This is especially true if the simulation results are used for thebasis of policy formulation, as the differences at a macro or national scale are fairly small.The I-O simulations are also useful in identifying the inter-industry relationships that existin the CDIB. In general, the increased specialization in niche technologies should sustainthe CDIB and increases in defence exports could be maintained or increased as the defenceand security relations between Canada and the US moves to more integration in the post-9/11 environment.
CONCLUSIONS
This paper has discussed the historical and economic context for Canadian defence policyand the associated implications for defence resource allocation. The structure and organiza-tion of Canadian defence were presented along with a review of the Canadian defenceindustrial base (CDIB) that supports that structure. The brief review of the Canadiandefence policy and background reveals important aspects of the determinants of defenceexpenditures.
First, Canada defines its national interest and security concerns within the context of bilat-eral or multilateral arrangements. Canada’s commitment to the security of Europe, as shownby the sacrifices and sizeable contributions in both World Wars, is a good indicator of thisview. The Canadian approach is a realistic approach given the size of the country, location andpopulation base. Second, making a military contribution to a multilateral or bilateral cause
TABLE X Defence Export Estimates Summary
Defence ExportsIndustry Canada CDIA I-O Simulation
1997 Defence Exports $2.0B $1.9B $1.7BDirect Employment 8,700 9,200 7,500Direct and Indirect N/A 16,000 12,900Employment
Source: Grover-CDIA (1997); Industry Canada-IC (1997) and Authors’ I-O simulation.
168 J. C. STONE AND B. SOLOMON
resulted in positive externalities, such as the affirmation of a nationhood and relative promi-nence. Third, whether asserting independence (sovereignty) was the primary motivation, orsecurity, is difficult to distinguish, as both are not mutually exclusive. From an economicmodelling point of view for Canada, threat is indirectly observed through the spending ofallies. At least from the historical perspective, Canada’s reaction to allied expenditure shouldbe positive.
The stylized facts regarding Canadian defence expenditures in relation to its NATO alliestend to show under-contribution. However, measures such as defence expenditures as aproportion of GDP only reveal a nation’s ability to pay as opposed to defence efforts. Theallocation of scarce resources among alternative and competing demands is the central tenantof economics and it is also the case for both the Federal government and the Department ofNational Defence. The examination of the country’s macroeconomic condition revealed thatfiscal prospects have improved substantially since the mid-1990s The tight fiscal restraintsthat brought the balanced budget, however, have hindered the efficient delivery of manypublic services, including health and defence. In addition, the declining standard of livingand the gap in productivity between Canada and its largest trade partner, the United States,are now important policy topics crowding the ever-increasing list of demands for funding.Like most of its allies in NATO, Canada’s defence budget was cut throughout most of the1990s in response to the end of the Cold War. However, Canada’s continued involvement inpeace support operations and other deployments with the reduced force size and aconstrained budget has created a commitment–capability gap. In response, the Departmenthas relied heavily on contracting-out in-house services to redirect the reduced force size tomore operational tasks.
Given constrained defence budgets and competing defence services needs in the post-ColdWar era, a highly specialized and export dependent defence industrial sector is economicallydesirable. In the survey of the CDIB conducted in this paper it was shown that the narrowly-defined CDIB is more export-oriented and less dependent on the domestic market while a largeportion of DND’s annual defence expenditures is satisfied by civilian firms and industries. TheCDIB has comparative advantage in niche areas such as sub-components of weapons platforms,remote sensing, and satellites.
References
Blanchfield, M. (2001) ‘Liberals ignore copter experts’. The Ottawa Citizen Online Thursday 19 July 2001. Availablefrom http://www.OttawaCitizen.com/national/010719/5020050.html, accessed 19 July.
Bland, D. L. (1999) Parliament, Defence Policy and the Canadian Armed Forces, Claxton Paper No 1, Kingston:School of Policy Studies Queen’s University.
Bland, D. (2003) Funding Canada’s Defence Policy. CCS Research Paper. Available at http://www.ccs21.org/ccspapers/papers/bland-funding_defence.htm; Internet; accessed 15 May.
Canada. Department of Finance (2003) Fiscal Reference Tables 2003, Ottawa: PWGSC.Canada. Department of Foreign Affairs and International Trade (2002) Third Annual Report on Canada’s State of
Trade. Trade Update May 2002, Ottawa: Public Works and Government Services Canada.Canada. Department of Foreign Affairs and International Trade (2003) Pocket facts: Canada – economic indicators
Number 64, Ottawa: Public Works and Government Services Canada.Canada. Department of National Defence (1994) 1994 Defence White Paper, Ottawa: Canada Communications Group.Canada. Department of National Defence (1997) Defence in the 70s: White Paper on Defence Ottawa: Information
Canada, 1971. In Canada’s National Defence Volume 1 – Defence Policy, edited by Douglas L. Bland Kingston:Queen’s University School of Policy Studies, 121–182.
Canada. Department of National Defence (1998) Defence Management Systems Manual, A-AD-125-000/FP-001,Ottawa: DND.
Canada. Department of National Defence (1999) Shaping the Future of Canadian Defence: A Strategy for 2020,Ottawa: Department of National Defence.
Canada. Department of National Defence (2002) The Defence Portfolio 2002, Ottawa: DND.Canada. Department of National Defence (2003) A Time for Transformation. Annual Report of the Chief of the
Defence Staff 2002–2003, Ottawa: DND.
CANADIAN DEFENCE POLICY AND SPENDING 169
Canadian Defence Industries Association (2002) Statistical Overview of the Canadian Defence Industry for the Year2000, Ottawa: Unpublished paper CDIA.
Centre for Studies in Living Standards (2003) ‘Aggregate Income and Productivity Trends: Canada vs United States’,Ottawa: CSLS.
Claxton, Brooke (1997) Canada’s Defence: information on Canada’s defence achievements and organization. InCanada’s National Defence Volume 1 Defence Policy, edited by D. L. Bland Kingston: School of Policy Studies,Queen’s University, 9–56.
Edgar, A. D. and Haglund, D. G. (1995) The Canadian Defence Industry in the New Global Environment, Montreal& Kingston: McGill-Queen’s University Press.
Dungan, P. Murphy, S. and Wilson, T. (2002) Long Term Outlook for the Canadian Economy: National ProjectionThrough 2025 Policy and Economic Analysis Program (PEAP) Policy Study 2002–2, Toronto: Institute forPolicy Analysis, University of Toronto.
Fergusson, J. (1996) In search of a strategy: the evolution of Canadian defence industrial and regional benefits policy.In The Economics of Offsets Defence Procurement and Countertrade, edited by S. Martin, York: The Centre forDefence Economics, University of York, UK: Harwood Academic Publishers. 107–137.
Finan, J.S. and Flemming, S.B. (1995) Public attitudes towards defence and security in Canada. In Canada’s Inter-national Security Policy, edited by D. B Dewitt and D. Leyton-Brown, Scarborough: Prentice Hall CanadaInc, 291–312.
Grover, B. (1997) Canadian Defence Industry: A Statistical Overview of the Canadian Defence Industry, Ottawa:CDIA
Grover, B. (1999) Canadian Defence Industry: A Statistical Overview of the Canadian Defence Industry, Ottawa:CDIA
McIntosh, A. (2002) Sea King Plan Cost $13M; No End in Sight. National Post Online, January 31, available fromhttp://www nationalpost com/home/story html?f=/stories/20020131/1294550 html. Accessed on 31 January.
Middlemiss, D. (1995) Defence procurement in Canada. In Canada’s International Security Policy. edited by D. B.Dewitt and D. Leyton-Brown. Scarborough: Prentice Hall Canada Inc, 391–412.
Middlemiss, D.W. and Sokolsky, J.J. (1989) Canadian Defence Decisions and Determinants. Toronto: HarcourtBrace Jovanovich Canada Inc.
Morton, D. (1997) A Short History of Canada. 3rd revised edn, Toronto: McClelland & Stewart Inc.Morton, D. (1999) A Military History of Canada From Champlain to Kosovo, 4th ed, Toronto: McClelland & Stewart
Inc.Norcliffe, G. (1996) Foreign trade in goods and services. In Canada and the Global Economy. The Geography of
Structural and Technological Change, edited by J. N.H. Briton, Montreal and Kingston: McGill-Queen’sUniversity Press, 25–47.
Rubec, S. (2000) Warranty for helicopters: Feds insist on 20-year protection, The Toronto Sunday Sun, 19 May 2000,news, 19.
Solomon, B. (2000) The Canadian defence industrial base. Paper presented at ASSA/ECAAR, January 2000 (http://www.ecaar.org/Articles/Articles.htm).
Statistics Canada (1998) Industrial Research and Development – 1997 Intentions, Catalogue Number 88–202,Ottawa: Statistics Canada.
Stockholm International Peace Research Institute (SIPRI) (2001) SIPRI Yearbook 2001 Armaments, Disarmamentand International Security, Solna: Oxford University Press.
Treddenick, J. M. (1995) The defence budget. In Canada’s International Security Policy edited by D. B. Dewitt andD. Leyton-Brown, Scarborough: Prentice Hall Canada Inc, 413–454.
Ireddenick, J. M. (2001) Financing the RM. In Managing the Revolution in Military Affairs, edited by R. Matthewsand J. Treddenick, New York: Palgrave, 97–115.